OEE Studio MTBF & MTTRoeestudio.com/images/catalog/OEE Studio-MTBF_MTTR-ToolTip.pdf · OEE Studio...
15
OEE Studio MTBF & MTTR This Tool-Tip will guide you through the process of creating the MTBF and MTTR reports in OEE Studio. Deb-Tech Systems, Inc. & Production Improvement Systems Ltd. [email protected] [email protected] 847.854.3148 (o) ~ 815.988.5534 (m) Last Updated: 06/06/2016
Transcript of OEE Studio MTBF & MTTRoeestudio.com/images/catalog/OEE Studio-MTBF_MTTR-ToolTip.pdf · OEE Studio...

OEE StudioMTBF & MTTRThis Tool-Tip will guide you through the process of
creating the MTBF and MTTR reports in OEE Studio.
Deb-Tech Systems, Inc. & Production Improvement Systems Ltd.
847.854.3148 (o) ~ 815.988.5534 (m)Last Updated: 06/06/2016

Tool-Tip - MTBF• The MTBF uses the Availability – Tabular Analysis
sections of OEE Studio.o "Mean Time Between Failures" is literally the average time elapsed from
one failure to the next. Usually people think of it as the average time that
something works until it fails and needs to be repaired (again).
o MTBF = Run Time/# of Breakdowns.
o It is important to be able to specify the TYPE of breakdown to get a better picture of MTBF.
o It is a good idea to code your downtime reasons in the Vorne XL by the
type of breakdown – i.e. BR = breakdown, MS = Minor Stop, QA = Quality
and so on. Then in the BR category, you can add another type such as
BR MECH or BR ELEC and so on. Or you can add the asset that caused
the failure – such as BR Capper, BR Labels, etc.

Tool-Tip - MTTR• The MTTR uses the Availability – Loss Events.
o "Mean Time To Repair" is the average time that it takes to repair something
after a failure.
o MTTR = Downtime/# Breakdown
o Again, It is important to be able to specify the TYPE of breakdown to get a
better picture of MTTR
o With OEE Studio you can calculate MTTR either by Shift or by specific Parts.

Creating the MTBR Report

Creating the Filter

Creating the Report
Drag the Device Column to
the top where it says ‘Drag a
column header here’.
Next drag the Reason Column
header to be next to the
Device.
All of the data will be
collapsed.
You can expand a device to
see all the events with
duration and counts.
You also see the total Running
duration.
You can drill down further by
selecting specific down
events.

Saving the Report
Select the “Click here for
Printing. . .” options.
Click on the Save Layout
button.
Enter a name for the report.
Select ‘All Users’.
Click the OK button.
You can call up the report
by following the same
process and select the
Restore Layout button.
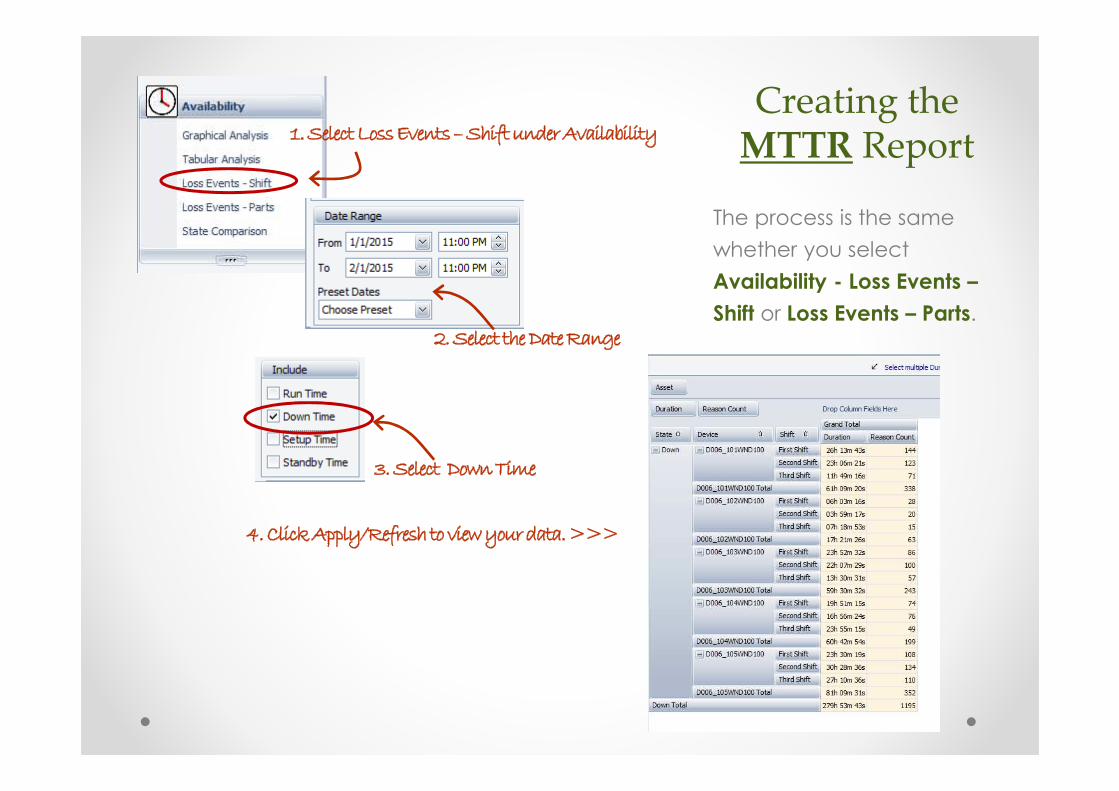
Creating the MTTR Report
The process is the same
whether you select
Availability - Loss Events –
Shift or Loss Events – Parts.

Creating the Filter
First, we need to get our data
elements set up.
Select the “Click here for
Printing . . .”.
Click on the Show and Hide
Fields button.
The PivotGrid Field List on the
left is the default display.
1. Drag the State Item on the
bottom left to the top.
2. Drag the Reason from the
top to the bottom left as
shown on the right display.

Create Filter –(cont’d)
Select the specific reason set.

Creating the MTTR
Calculation
Create the MTTR calculation =
Duration/Reason Count/60
Duration is in seconds so we need to divide by 60 to
get minutes.
Make sure you select Use Summary Values.

Completing the Report
The new field appears in the Data Area.

Graphing the Report
Click on the MTTR column heading to automatically graph
the results.

Graphing the Report
Create a trend graph by adding the start and end time.

Saving the Report
Select the “Click here for
Printing. . .” options.
Click on the Save Layout
button.
Enter a name for the report.
Select ‘All Users’.
Click the OK button.
You can call up the report
by following the same
process and select the
Restore Layout button.