OECD PubliCatiOn “Implementing Good Regulatory … Weekly Bulletin/MITI...“Implementing Good...
17
“Implementing Good Regulatory Practice in Malaysia” OECD PubliCatiOn MITI Weekly Bulletin / www.miti.gov.my “DRIVING Transformation, POWERING Growth” e goal of Malaysia to become a develop nation by 2020 is fast becoming reality. Malaysia has one of the most competitive economies in Asia and is becoming globally recognised as having a business- friendly environment. e country is committed to achieving sustainable development and inclusive growth, while also recognising the challenges and opportunies posed by a global competitive economy as well as the establishment of the ASEAN community and regional economic integration. e government has encouraged private sector-driven and people- centered growth through a variety of initiatives and policies that has been very successful. But maintaining these reforms has led the government to go further, and embark on an agenda for good regulatory practice. Producing regulations through a more robust process of analysis and stakeholder engagement enhances efficiency and accountability, and also promotes greater participation, inclusiveness and ownership of the end solution or government intervention. In 2013, the launch of the National Policy on the Development and Implementation of Regulations reflected the government’s desire to improve the rule-making process. Regulatory impact statements and public consultations were introduced in order to standardize the way that polices, laws and regulations are developed and improve overall regulatory quality. We are grateful to the OECD for its support in introducing and implementing this policy, drawing on the vast experience and expertise of other countries so that Malaysia can learn from best practice and avoid the mistakes of others. In 2015, Malaysia is proud to be the Chair of ASEAN. Malaysia has made good regulatory practices a priority across the ASEAN community, as it considers them a key ingredient for our regional economic integration and institutional connectivity. Having a coherent and convergent regulatory environment within and across borders will facilitate the movement
Transcript of OECD PubliCatiOn “Implementing Good Regulatory … Weekly Bulletin/MITI...“Implementing Good...

“Implementing Good Regulatory Practice in Malaysia”OECD PubliCatiOn
MITI Weekly Bulletin / www.miti.gov.my
“DR
IVIN
G T
ransformation, P
OW
ERIN
G G
rowth”
The goal of Malaysia to become a develop nation by 2020 is fast becoming reality. Malaysia has one of the most competitive economies in Asia and is becoming globally recognised as having a business-friendly environment. The country is committed to achieving sustainable development and inclusive growth, while also recognising the challenges and opportunies posed by a global competitive economy as well as the establishment of the ASEAN community and regional economic integration.
The government has encouraged private sector-driven and people-centered growth through a variety of initiatives and policies that has been very successful. But maintaining these reforms has led the government to go further, and embark on an agenda for good regulatory practice. Producing regulations through a more robust process of analysis and stakeholder engagement enhances efficiency and accountability, and also promotes greater participation, inclusiveness and ownership of the end solution or government intervention.
In 2013, the launch of the National Policy on the Development and Implementation of Regulations reflected the government’s desire to improve the rule-making process. Regulatory impact statements and public consultations were introduced in order to standardize the way that polices, laws and regulations are developed and improve overall regulatory quality. We are grateful to the OECD for its support in introducing and implementing this policy, drawing on the vast experience and expertise of other countries so that Malaysia can learn from best practice and avoid the mistakes of others.
In 2015, Malaysia is proud to be the Chair of ASEAN. Malaysia has made good regulatory practices a priority across the ASEAN community, as it considers them a key ingredient for our regional economic integration and institutional connectivity. Having a coherent and convergent regulatory environment within and across borders will facilitate the movement

of people, trade, investment, culture and ideas that contributes to thriving social, cultural and economic community.
For the reason above, I am delighted that the OECD has supported Malaysia’s efforts in implementing good regulatory practice and produced this publication assessing the progress made. This is important for Malaysia to celebrate its successes and also learn from the recommendations to keep improving. It is also important for our neighbours to see and benefit from Malaysia’s experience. Good regulatory practices are not only important now but should be a permanent area for concerted attention and action.
Preface by,Tan Sri Dr. Ali Hamsa
Chief Secretary to the Government of Malaysia
“DR
IVIN
G T
ransformation, P
OW
ERIN
G G
rowth”
MITI Weekly Bulletin / www.miti.gov.my
In 2013, the Government of Malaysia asked the OECD to review its regulatory management system and provide support for piloting and implementing its regulatory policy. The review was conducted by delegates of the Regulatory Policy Committee and the OECD Secretariat in 2014, using expertise developed over two decades of peer learning under the OECD programme on Regulatory Reform. Peer reviews of good regulatory practices have also been conducted for Viet Nam (2011) and Indonesia (2012). The project drew on a number of OECD publications and instruments, including the 2012 Recommendation of the OECD Council on Regulatory Policy and Governance. This report presents the findings of the project.
The Government of Malaysia is focusing on the importance of an enabling business environment. This is reflected in Malaysia’s status in the 2015 Doing Business rankings on the ease of doing business, where Malaysia ranks 18th out of 189 economics. To create this business-friendly environment, the government has reduced the paperwork required to licence a business by over 50%, saving businesses RM 729 million (EUR 181 million), and conducted sector-specific reforms in construction, logistics and healthcare.In order to fully exploit the potential of high-quality design of policies, laws and regulations, Malaysia has established a National Policy on the Development and Implementation of Regulations. This is a promising step towards institutionalizing good regulatory practices and sets an example for other similar countries in South East Asia and beyond.
OECD member countries are aware of the benefits of a high-quality regulatory environment for achieving inclusive growth and environmental sustainability, and are constantly improving their regulatory practices. In South East Asia, regional connectivity, integration and the establishment of the ASEAN community provide further impetus for having similar institutional frameworks that contribute to a seamless, inclusive and people-centered economy. Moreover, having a similar approach to the rules of the game for society, the environment and the modern economy is critical for positioning the ASEAN community as a destination of choice for investment, trade and job creation.
OECD experience shows that successfully implementing regulatory policies requires investment and sustaining initiatives over the long term. In this respect, Malaysia would benefit from strategically targeting efforts in high-impact areas while supporting compliance with the National Policy. Reporting of ministerial performance vis-à-vis the National Policy will also help drive improvement over time.Good regulatory practice is not a destination, but a journey within a dynamic environment. Malaysia’s recent efforts and progress are to be commended, and are well in line with OECD Recommendations on Regulatory Policy and Governance. These are sound foundations that should be built upon with the same support and industry that initiated these reforms, to achieve the ultimate goal: better policies for better lives.
Foreword by,Rolf Alter
Director of Public Governance and Territorial Development, OECD

MALAYSIA
11.3 12.3 12.7 13.1 13.6 14.2 14.0
6.77.0 7.0 6.9 6.7 6.7 6.9
0
5
10
15
20
25
2009 2010 2011 2012 2013 2014 2015 (Jan)
Mill
ions
Labour force Outside labour force
January 2015
December 2014
Change (%) m-o-m
January 2014
Change (%) y-o-y
Labour force (‘000) 14,043.60 14,180.50 -1.0 13,987.60 0.4
Employed (‘000) 13,601.60 13,748.40 -1.1 13,529.90 0.5
Unemployed (‘000) 442.0 432.1 2.3 457.7 -3.4
Outside labour force (‘000) 6,865.30 6,700.60 2.5 6,644.80 3.3
Labour force participation rate (LFPR) (%) 67.2 67.9 -0.7 67.8 -0.6
Unemployment rate (%) 3.1 3.0 0.1 3.3 -0.2
10.9 11.9 12.3 12.7 13.2 13.7 13.6
0.420.40 0.39 0.40 0.42 0.43 0.44
0
2
4
6
8
10
12
14
16
2009 2010 2011 2012 2013 2014 2015 (Jan)
Mill
ions
Employed Unemployed
Labour Force and Unemployment Rate, Jan 2015
Source : Department of Statistics, Malaysia
Source : Department of Statistics, Malaysia
Source : Department of Statistics, Malaysia
Labour Force, 2009 - Jan 2015
Working Age Population (15 - 64), 2009 - Jan 2015
MITI Weekly Bulletin / www.miti.gov.my
“DR
IVIN
G T
ransformation, P
OW
ERIN
G G
rowth”

4.1
5.3
6.1
3.0
6.8
2.0
0.6
6.3 6.2
4.4
0.0
1.0
2.0
3.0
4.0
5.0
6.0
7.0
8.0
China Germany Indonesia Malaysia Philippines Singapore Thailand UK USA Vietnam
%
050
100150200250300350400450500
2010 2011 2012 2013 2014
339.
8
412.
6
429.
0
444.
8
471.
9
239.
4
264.
7
284.
3
309.
5
343.
7
108.
0
115.
9
123.
1
127.
2
135.
7
RM
bill
ion
Value of Sales, 2010 - 2014
Wholesale Trade Retail Trade Motor Vehicles
0
5
10
15
20
2010 2011 2012 2013 2014
9.9 11
.9 12.6
13.1
14.1
12.0 16
.4 18.0
19.8 20
.7
4.2
4.7
5.1 5.6 5.8
RM b
illio
n
Salaries & Wages, 2010 - 2014
Wholesale Trade Retail Trade Motor Vehicles
Source : Department of Statistics Malaysia; IMF, U.S. Bureau of Labor Statistics, Ministry of Manpower Singapore, Philippines Statistics Authority, National Statistical Office of Thailand
Source : Department of Statistics, Malaysia
Unemployment Rate for Selected Countries, 2014
Distributive Trade Indicators, 2010-2014
MITI Weekly Bulletin / www.miti.gov.my
“DR
IVIN
G T
ransformation, P
OW
ERIN
G G
rowth”

DiD You Know?Exports, Imports and Production of Natural Rubber,
2011 - 2014
Top 10 Natural Rubber Export Destinations, 2014
668,442
872,429
1,004,805
905,039
960,141
771,174
847,090
721,722
996,210
922,798
826,421
668,613
0 200,000 400,000 600,000 800,000 1,000,000 1,200,000
2011
2012
2013
2014
Tonnes D.R.C **
Production
Exports*
Imports*
331.3
100.8
40.5 38.818.5 18.0 14.8 13.0 12.4 9.9
0
50
100
150
200
250
300
350
China Germany Iran USA Brazil ROK Portugal Turkey Finland France
('000
) Ton
nes
D.R.
C*
Source : Department of Statistics, Malaysia
Source : Department of Statistics, Malaysia
*HS Codes : 4001.10 - 4001.29** D.R.C - Dry Rubber Content
* D.R.C - Dry Rubber Content
MITI Weekly Bulletin / www.miti.gov.my
“DR
IVIN
G T
ransformation, P
OW
ERIN
G G
rowth”

“DR
IVIN
G T
ransformation, P
OW
ERIN
G G
rowth”
MITI Weekly Bulletin / www.miti.gov.my
ASEAN Companies
in Malaysia

International Repor t“D
RIV
ING
Transform
ation, PO
WER
ING
Grow
th”
MITI Weekly Bulletin / www.miti.gov.my
2012 2013 2014 2015f 2016fCentral Asia 5.6 6.6 5.1 3.5 4.5East Asia 6.6 6.8 6.6 6.5 6.3South Asia 5.1 6.5 6.9 7.2 7.6Southeast Asia 5.8 5.1 4.4 4.9 5.3The Pacific 6.0 4.1 6.1 10.7 4.5Developing Asia 6.2 6.5 6.3 6.3 6.3Major industrial economies 1.2 1.2 1.6 2.2 2.4
1.0
2.0
3.0
4.0
5.0
6.0
7.0
8.0
9.0
10.0
11.0
%
2012 2013 2014 2015f 2016fIndonesia 6.0 5.6 5.0 5.5 6.0Malaysia 5.6 4.7 6.0 4.7 5.0Philippines 6.8 7.2 6.1 6.4 6.3Singapore 3.4 4.4 2.9 3.0 3.4Thailand 6.5 2.9 0.7 3.6 4.1Viet Nam 5.2 5.4 6.0 6.1 6.2
0.0
1.0
2.0
3.0
4.0
5.0
6.0
7.0
8.0
%
GDP Growth for Selected Regions and Economies, 2012 - 2016f
f - forecastSource : ADB

International Repor t“D
RIV
ING
Transform
ation, PO
WER
ING
Grow
th”
MITI Weekly Bulletin / www.miti.gov.my
Inflation Rate for Selected Region and Economies, 2012 - 2016f
f - forecast
2012 2013 2014 2015f 2016fCentral Asia 5.1 5.8 5.7 6.7 6.6East Asia 2.6 2.4 1.9 1.7 2.2South Asia 10.1 9.0 7.1 5.1 5.6Southeast Asia 3.8 4.2 4.1 3.1 3.1The Pacific 4.3 3.4 5.8 5.5 4.1Developing Asia 4.1 3.8 3.1 2.6 3.0Major industrial economies 2.0 1.3 1.5 0.7 1.9
0.0
1.0
2.0
3.0
4.0
5.0
6.0
7.0
8.0
9.0
10.0
11.0
%
2012 2013 2014 2015f 2016fIndonesia 4.0 6.4 6.4 5.5 4.0Malaysia 1.7 2.1 3.1 3.2 2.9Philippines 3.2 3.0 4.1 2.8 3.3Singapore 4.6 2.4 1.0 0.2 1.5Thailand 3.0 2.2 1.9 0.2 2.0Viet Nam 9.1 6.6 4.1 2.5 4.0
0.0
1.0
2.0
3.0
4.0
5.0
6.0
7.0
8.0
9.0
10.0
%
Source : ADB

0.480.490.500.510.520.530.540.550.560.570.580.59
2.652.702.752.802.852.902.953.003.053.10
Jan Feb Mar Apr May Jun Jul Aug Sep Oct Nov Dec Jan Feb
2014 2015
1 AUD = RM 1 CNY = RM
1 CNY = RM 0.57
1 AUD = RM 2.80
Source : http://www.gold.org/investments/statistics/gold_price_chart/
Source : http://www.hardassetsalliance.com/charts/silver-price/usd/oz
Malaysian Ringgit Exchange Rate with Australian Dollar and Chinese Yuan Renminbi
Gold Prices, 2 January - 27 March 2015
Silver Prices, 2 January - 27 March 2015
Source : Bank Negara, Malaysia
“DR
IVIN
G T
ransformation, P
OW
ERIN
G G
rowth”
MITI Weekly Bulletin / www.miti.gov.my
37.7
38.4
36.0
37.0
38.0
39.0
40.0
41.0
42.0
43.0
2 Ja
n
9 Ja
n
16 Ja
n
23 Ja
n
30 Ja
n
6 Fe
b
13 F
eb
20 F
eb
27 F
eb
6 M
ar
13 M
ar
20 M
ar
27 M
ar
US$/Gram Gold
15.8
16.9
14.5
15.0
15.5
16.0
16.5
17.0
17.5
18.0
18.5
2 Ja
n
9 Ja
n
16 Ja
n
23 Ja
n
30 Ja
n
6 Fe
b
13 F
eb
20 F
eb
27 F
eb
6 M
ar
13 M
ar
20 M
ar
27 M
ar
US$/Oz Silver

Source: Ministry of International Trade and Industry, Malaysia
Notes: The preference giving countries under the GSP scheme are Japan, Switzerland, the Russian Federation, Norway and Cambodia.
AJCEP: ASEAN-Japan Comprehensive Economic Partnership (Implemented since 1 February 2009) ACFTA: ASEAN-China Free Trade Agreement (Implemented since 1 July 2003) AKFTA: ASEAN-Korea Free Trade Agreement (Implemented since 1 July 2006)
AANZFTA: ASEAN-Australia-New Zealand Free Trade Agreement(Implemented since 1 January 2010)
AIFTA: ASEAN-India Free Trade Agreement (Implemented since 1 January 2010)
ATIGA: ASEAN Trade in Goods Agreement (Implemented since 1 May 2010)
MICECA: Malaysia-India Comprehensive Economic Cooperation Agreement (Implemented since 1 July 2011)
MNZFTA: Malaysia-New Zealand Free Trade Agreement (Implemented since 1 August 2010)MCFTA: Malaysia-Chile Free Trade Agreement (Implemented since 25 February 2012)MAFTA: Malaysia-Australia Free Trade Agreement (Implemented since 1 January 2013)
MPCEPA: Malaysia-Pakistan Closer Economic Partnership Agreement (Implemented since 1 January 2008)
MJEPA: Malaysia-Japan Economic Partnership Agreement (Implemented since 13 July 2006)
1 Feb 8 Feb 15 Feb 22 Feb 1 Mar 8 Mar 15 Mar 22 MarAANZFTA 90 87 92 74 89 73 84 319AIFTA 143 120 240 122 126 136 92 175AJCEP 75 104 116 72 55 78 74 101
0
50
100
150
200
250
300
350
RM
mill
ion
1 Feb 8 Feb 15 Feb 22 Feb 1 Mar 8 Mar 15 Mar 22 MarATIGA 773 631 11,127 9,861 4,055 596 950 3,154ACFTA 562 505 533 165 865 780 916 539AKFTA 327 1,064 487 592 1,795 117 127 695
0
2,000
4,000
6,000
8,000
10,000
12,000
14,000
RM
mill
ion
1 Feb 8 Feb 15 Feb 22 Feb 1 Mar 8 Mar 15 Mar 22 MarMICECA 43.02 58.35 47.23 40.80 132.78 49.74 44.86 48.01MNZFTA 0.52 0.25 0.08 0.02 0.13 0.01 0.06 0.08MCFTA 14.72 7.43 8.30 5.61 9.29 6.00 11.37 23.46MAFTA 40.95 27.65 51.15 25.27 36.27 23.40 42.25 36.51
0
20
40
60
80
100
120
140
RM
mill
ion
1 Feb 2015 8 Feb 2015 15 Feb 2015 22 Feb 2015 1 Mar 2015 8 Mar 2015 15 Mar 2015 22 Mar 2015
AANZFTA 883 663 1,001 467 835 658 805 776AIFTA 558 559 521 485 467 561 478 651AJCEP 243 241 254 116 172 154 241 250ATIGA 4,693 4,081 4,287 2,648 3,695 4,107 4,433 4,562ACFTA 1,232 793 920 790 1,659 1,454 1,354 1,566AKFTA 760 665 823 610 643 765 844 889MICECA 311 307 344 236 278 297 360 355MNZFTA 13 7 6 2 5 1 7 4MCFTA 62 56 53 27 56 42 75 57MAFTA 450 341 481 206 360 259 481 409MJEPA 972 817 847 608 775 823 812 775MPCEPA 158 153 130 139 150 173 172 118GSP 196 104 152 73 170 104 114 139
1 Feb 8 Feb 15 Feb 22 Feb 1 Mar 8 Mar 15 Mar 22 MarMJEPA 157 123 133 116 145 131 670 167MPCEPA 18 41 17 72 19 52 113 38GSP 24 414 43 14 22 75 18 26
0
100
200
300
400
500
600
700
800
RM
mill
ion
Value of Preferential Certificates of Origin
Number and Value of Preferential Certificates of Origin (PCOs)Number of Certificates
“DR
IVIN
G T
ransformation, P
OW
ERIN
G G
rowth”
MITI Weekly Bulletin / www.miti.gov.my

CommodityCrude
Petroleum (per bbl)
Crude Palm Oil (per MT)
Raw Sugar
(per MT)
Rubber SMR 20(per MT)
Cocoa SMC 2
(per MT)
Coal(per MT)
Scrap Iron HMS
(per MT)27 Mar 2015
(US$) 48.9 650.5 272.5 1,413.5 2,042.9 58.5 270 (high)250 (low)
% change* 4.9 0.4 4.0 0.6 3.5 0.2 unchangedunchanged
2014i 54.6 - 107.6 823.3 352.3 1,718.3 2,615.8 59.8 370.0
2013i 88.1 - 108.6 805.5 361.6 2,390.8 1,933.1 .. 485.6
“DR
IVIN
G T
ransformation, P
OW
ERIN
G G
rowth”
MITI Weekly Bulletin / www.miti.gov.my
Commodity Prices
Notes: All figures have been rounded to the nearest decimal point * Refer to % change from the previous week’s price i Average price in the year except otherwise indicated n.a Not availble
Source : Ministry of International Trade and Industry Malaysia, Malaysian Palm Oil Board, Malaysian Rubber Board, Malaysian Cocoa Board, Malaysian Iron and Steel Industry Federation, Bloomberg and Czarnikow Group.
Highest and Lowest Prices, 2014/2015
Lowest (US$ per bbl)
Highest(US$ per bbl)
Crude Petroleum (27 March 2015)US$48.9 per bbl
201413 June 2014: 107.6
201426 Dec 2014: 54.6
20152 Jan 2015: 53.8
201513 Mar 2015: 44.8
Lowest (US$ per MT)
Highest(US$ per MT)
Crude Palm Oil (27 March 2015)US$650.5 per MT
201414 Mar 2014: 982.5
201426 Dec 2014: 664.0
201516 Jan 2015: 701.0
20156 Feb 2015: 621.0
Steel Bars(per MT)
RM1,850 - RM1,950
Average Domestic Prices, 27 Mar 2015
Billets(per MT)
RM1,450 - RM1,500

Source : Ministry of International Trade and Industry Malaysia, Malaysian Palm Oil Board, Malaysian Rubber Board, Malaysian Cocoa Board, Malaysian Pepper Board, Malaysian Iron and Steel Industry Federation, Bloomberg and Czarnikow Group, World Bank.
Commodity Price Trends“D
RIV
ING
Transform
ation, PO
WER
ING
Grow
th”
MITI Weekly Bulletin / www.miti.gov.my
696.1
701.0
682.0
645.0
621.0
685.0
690.0
689.0
692.5
673.5
648.0
650.5
600
620
640
660
680
700
720
9 Jan 16 Jan 23 Jan 30 Jan 6 Feb 13 Feb 20 Feb 27 Feb 6 Mar 13 Mar 20 Mar 27 Mar
US$
/mt
Crude Palm Oil
2,117.5
2,187.8
2,065.2
1,958.9
2,003.9
2,060.0
2,113.7
2,124.6
2,110.4
2,107.8
1,974.8
2,042.9
1,900
1,950
2,000
2,050
2,100
2,150
2,200
2,250
9 Jan 16 Jan 23 Jan 30 Jan 6 Feb 13 Feb 20 Feb 27 Feb 6 Mar 13 Mar 20 Mar 27 Mar
US$
/mt
Cocoa
301.8
335.3
345.5
331.3
324.3
330.0
326.8
310.8
300.5
291.0
283.8
272.5
260
270
280
290
300
310
320
330
340
350
360
9 Jan 16 Jan 23 Jan 30 Jan 6 Feb 13 Feb 20 Feb 27 Feb 6 Mar 13 Mar 20 Mar 27 Mar
US$
/mt
Raw Sugar
1,453.0
1,396.5
1,406.0
1,384.5
1,418.5
1,426.5
1,419.5
1,438.0
1,412.0
1,412.5
1,405.5
1,413.5
1,350
1,370
1,390
1,410
1,430
1,450
1,470
9 Jan 16 Jan 23 Jan 30 Jan 6 Feb 13 Feb 20 Feb 27 Feb 6 Mar 13 Mar 20 Mar 27 Mar
US$
/mt
Rubber SMR 20
5,740
5,779 5,843
6,245
6,469
6,515
6,864
7,822
7,707
7,967
7,894 7,806
7,507
7,286
7,267
5,000
5,500
6,000
6,500
7,000
7,500
8,000
8,500
Jan Feb Mar Apr May Jun Jul Aug Sep Oct Nov Dec Jan Feb Mar
2014 2015
USD
/ to
nne
Black Pepper
* until 20 March 2015
48.448.7
45.6
48.2
51.7
52.8
50.849.8 49.6
44.8
46.6
48.9
40
42
44
46
48
50
52
54
9 Jan 16 Jan 23 Jan 30 Jan 6 Feb 13 Feb 20 Feb 27 Feb 6 Mar 13 Mar 20 Mar 27 Mar
US$
/bbl
Crude Petroleum

Source : Ministry of International Trade and Industry Malaysia, Malaysian Palm Oil Board, Malaysian Rubber Board, Malaysian Cocoa Board, Malaysian Pepper Board, Malaysian Iron and Steel Industry Federation, Bloomberg and Czarnikow Group, World Bank.
Commodity Price Trends“D
RIV
ING
Transform
ation, PO
WER
ING
Grow
th”
MITI Weekly Bulletin / www.miti.gov.my
1,727
1,695 1,705
1,811
1,751
1,839
1,948
2,030
1,990
1,946
2,056
1,909
1,815 1,818
1,500
1,600
1,700
1,800
1,900
2,000
2,100
Jan Feb Mar Apr May Jun Jul Aug Sep Oct Nov Dec Jan Feb
2014 2015
US$
/ to
nne
Aluminium
14,101 14,204
15,678
17,374
19,401
18,629
19,118
18,600 18,035
15,812 15,807
15,962
14,849 14,574
12,000
13,000
14,000
15,000
16,000
17,000
18,000
19,000
20,000
Jan Feb Mar Apr May Jun Jul Aug Sep Oct Nov Dec Jan Feb
2014 2015
US$
/ to
nne
Nickel
320.0 320.0 320.0 320.0 320.0
330.0
320.0
280.0 280.0
260.0
270.0 270.0
300.0 300.0 300.0 300.0 300.0
320.0
300.0
250.0250.0
240.0
250.0 250.0
220
240
260
280
300
320
340
360
28 Nov 5 Dec 12 Dec 19 Dec 26 Dec 2 Jan 9 Jan 6 Feb 13 Feb 27 Feb 13 Mar 27 Mar
US$
/mt
Scrap Iron
Scrap Iron/MT (High)
Scrap Iron/MT(Low)
7,291
7,149
6,650 6,674
6,891
6,821
7,113
7,002
6,872
6,737
6,713
6,446
5,831
5,729
5,500
5,700
5,900
6,100
6,300
6,500
6,700
6,900
7,100
7,300
7,500
Jan Feb Mar Apr May Jun Jul Aug Sep Oct Nov Dec Jan Feb
2014 2015
US$
/ to
nne
Copper
53.5
51.6 51.1
49.9
51.1
56.1
56.9
56.8
57.7
58.4 58.6 58.5
48.0
50.0
52.0
54.0
56.0
58.0
60.0
9 Jan 16 Jan 23 Jan 30 Jan 6 Feb 13 Feb 20 Feb 27 Feb 6 Mar 13 Mar 20 Mar 27 Mar
US$
/mt
Coal
128.1
121.4
111.8
114.6
100.6
92.7
96.192.6
82.4
81.0
74.0
68.0
68.0
63.0
50.0
60.0
70.0
80.0
90.0
100.0
110.0
120.0
130.0
140.0
Jan Feb Mar Apr May Jun Jul Aug Sep Oct Nov Dec Jan Feb
2014 2015
US$
/dm
tu
Iron Ore

“DR
IVIN
G T
ransformation, P
OW
ERIN
G G
rowth”
Burj Al-Arab and Burj Khalifa, Eversendai has continued to undertake many key landmark projects in West Asian locations such as Dubai, Abu Dhabi (the United Arab Emirates), Saudi Arabia and Qatar. 1996 marked a key milestone in the business as the Group set up a full-fledged engineering department to enhance their value proposition for clients. Eversendai Construction Pvt Ltd, Chennai handles a majority of the designing and draughting services for their global clients. The Group is relentless when delivering promises to clients well above the expectation levels. Eversendai strives to deliver the best for all of its projects, regardless of the magnitude or size it may be. This consistency in above average quality assured deliverance has been responsible for a large client retainer pool. “We do a good job and everyone is happy. It’s all about branding, positioning, and word of mouth. We do not have to look for projects – clients invite us to bid for jobs after seeing our attention to detail, workmanship and commitment,” Nathan says with a humble smile. Despite setbacks and challenges, Eversendai continued its expansion steadily to include fabrication and power plant installation works. The Group was becoming synonymous with high-quality construction in the industry. In 2000, the Group was involved in the erection of the mechanical and structural works for the Jana Manjung coal-fired power plant in Malaysia. Eversendai invested a significant amount of time and effort in the research and development of specific skills and requirements for this project.
Success Story
Eversendai Corporation Berhad Established in 1984, Eversendai Corporation Berhad needs no introduction, as it has swept the steel industry off its feet with the feats and accomplishments achieved over the years. From its humble beginnings as a small company to a world-class Design and Build Turnkey Contractor, Eversendai Corporation has created a new benchmark for the construction industry.With mega projects such as the iconic Tower 2 of the Petronas Twin Towers, the new Doha International Airport, the Burj-Al-Arab, Republic Plaza in Singapore, Kingdom Centre in Saudi Arabia and many more under its wing, this corporation is now one of the most trusted and reliable names in the global steel industry. With more than 10,000 employees on its payroll with a strong presence in Asia, Eversendai continues to take the construction world by storm with each turning milestones of success. Under the visionary leadership and guidance of its Chairman and Group Managing Director, Dato’ AK Nathan, Eversendai Corporation has placed Malaysia on a high pedestal alongside many other internationally-acclaimed names in the industry.
THE STEEL EMPIRE’S JOURNEY OF UNPARALLELED GROWTH
In 1988, a key decision was made as the company ventured into the Singaporean market. This was an event that opened the first door to many future success stories for Eversendai; the company managed to secure a contract for the fabrication and erection of structural steel work for the Singapore Indoor Stadium. “This was the first of many projects in Singapore. After the successful completion of this, we were contracted the Pulau Seraya Power Station (Stage 2), the amphitheater for Jurong Bird Park, and the 66-storey Republic Plaza, to name a few,” Nathan elaborated. Never a man to shy away from challenges and greater heights, Nathan was quick to learn the trade and focus on expanding the business. His wise decisions and visionary thinking resulted in the incorporation of Shin Eversendai Engineering (M) Sdn Bhd in 1993. Through this company, a strategic focus was placed specifically on engineering, fabrication design and erection of mechanical and structural work as the company’s core services. Hard work and consistency paid off when Eversendai made its entrance into the West Asian market three years later through its subsidiary, Eversendai Engineering LLC (Dubai, the United Arab Emirates). Since building the
As expected, the project was deemed a tremendous success, surpassing all expectations. It was this success that made the Group a specialist in this particular area of expertise.Eversendai did not stop there – in 2009, the group expanded business operations even further to India and took on the daunting project of erecting the North Chennai power plant project, along with Phase 1 of the Chhatrapati Shivaji International Airport – South West Pier in Mumbai. Consistency and perseverance were the two key ingredients for Eversendai’s growth and establishment. Three years later, the Group was finally converted into a public limited company and carries its current name, Eversendai Corporation Berhad. Last year, Eversendai hit its RM1 billion turn over mark. Having achieved such a significant milestone, the Group is now working hard to achieve RM2 billion within the next five years (2017). Understanding the importance of creativity and diversification in business today, Eversendai is now venturing into new components relating to the company’s core business. Some areas that will be explored include fabrication, oil and gas, petrochemicals and execution of composite structures for high-rise towers.To date, Eversendai has completed over 150 projects in 10 countries.
Lot 19956, Jalan Industri 3/6, Rawang Integrated Industrial Park, 48000 Rawang, Selangor Darul Ehsan, Malaysia.
Tel : +603 6091 2575Fax : +603 6091 2577Email : [email protected]
Contact Us

“DR
IVIN
G T
ransformation, P
OW
ERIN
G G
rowth”
Save the Date...
1 May-31 October 2015 . Milano . Italy .
Source : MIDA
ViTrox Technologies, a wholly owned subsidiary of ViTrox Corporation Berhad, is one of the world’s leading automated machine vision inspection solution providers with an extensive customer base in Malaysia, Singapore, Indonesia, Thailand, Vietnam, Philippines, Taiwan, China, Japan, Korea, India, Australia, Europe, Brazil, Mexico, the USA and more.
In 2014, ViTrox Technologies launched its Centre of Excellence (COE) for Machine Vision technology. The COE has two main functions, namely as a Research & Development / Incubator Centre and a Training Centre. As a R&D / Incubator Centre, it provides an avenue for SMEs to gain access to vision technology for their products. Meanwhile, as a Training Centre, it provides training to technopreneurs, professionals, researchers and institutions of higher learning on vision machine technology.
ViTrox: Project Cost & Employment (2020 forecast)
ViTrox Technologies Sdn BhdMALAYSIA INVESTMENT PERFORMANCE 2014
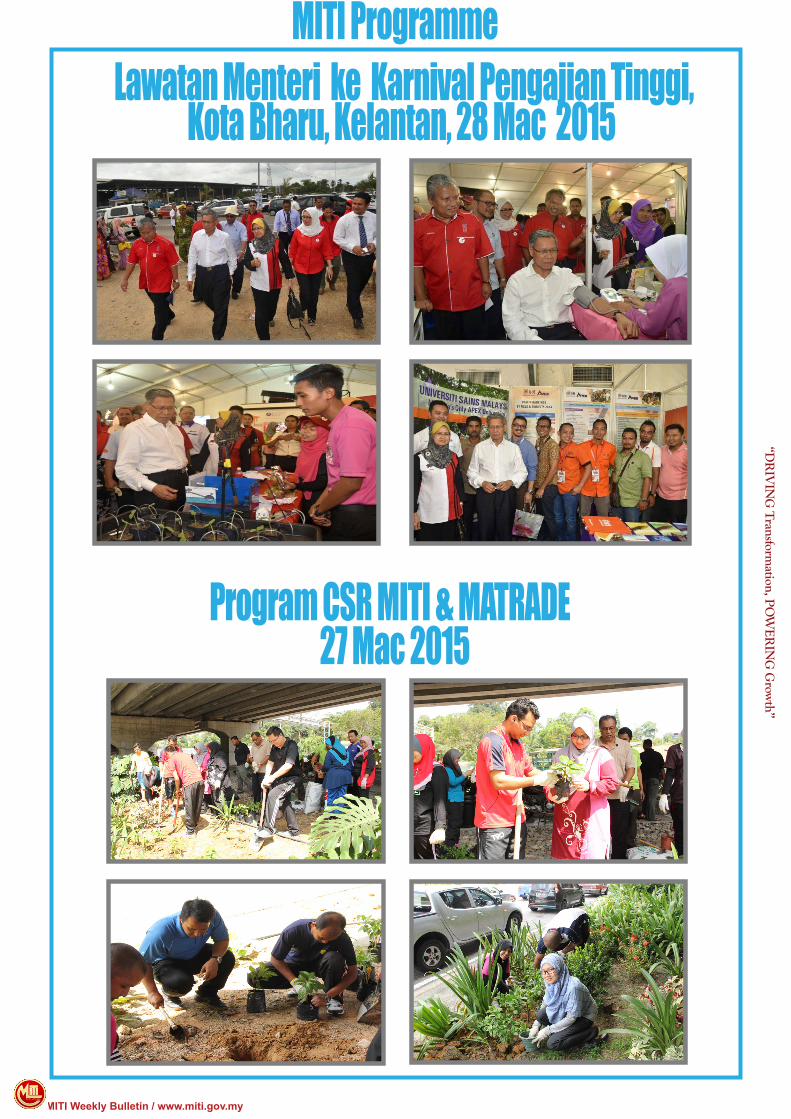
Lawatan Menteri ke Karnival Pengajian Tinggi, Kota Bharu, Kelantan, 28 Mac 2015
Program CSR MITI & MATRADE 27 Mac 2015
MITI Programme
MITI Weekly Bulletin / www.miti.gov.my
“DR
IVIN
G T
ransformation, P
OW
ERIN
G G
rowth”

Name : Nurliyana Hazwani AbdRahman
Designation : Administrative AssistantJob Description : Responsible for
managing online vehiclebooking system
Division : Administrative Unit,Management Services,MITI
Contact No : 03 - 62000069Emel : [email protected]
“DR
IVIN
G T
ransformation, P
OW
ERIN
G G
rowth”
Comments & SuggestionsDear Readers,Kindly click the link below for any comments in this issue. MWB reserves the right to edit and to republish letters as reprints. http://www.miti.gov.my/cms_matrix/form.jsp?formId=c1148fbf-c0a81573-3a2f3a2f-1380042c
MITI Weekly Bulletin / www.miti.gov.my
Name : Syaheed Shaharani DaudShahrani
Designation : Accountant AssistantJob Description : Responsible for
managing the storesection
Division : Account Unit,Management Services,MITI
Contact No : 03 - 62000095Emel : [email protected]
Ext ract from the poem ‘Leisure’by William Henry Davies (1871-1940)
American poet and writ er
“What is t his life if , full of care,We have no t ime t o st and and st are”