OECD – Paris, 13 April 2021 COVID-19 spending helped to ...
12
UNDER EMBARGO UNTIL 13 APRIL 2021, 15:00 HOURS PARIS TIME 1 OECD – Paris, 13 April 2021 COVID-19 spending helped to lift foreign aid to an all-time high in 2020 Detailed Note Preliminary ODA levels in 2020 In 2020, official development assistance (ODA) by member countries of the Development Assistance Committee (DAC) amounted to USD 161.2 billion, representing 0.32% of their combined GNI (see Table 1 and Chart 1). This total included USD 158.0 billion in the form of grants, loans to sovereign entities, debt relief and contributions to multilateral institutions (calculated on a grant-equivalent basis); USD 1.3 billion to development-oriented private sector instrument (PSI) vehicles and USD 1.9 billion in the form of net loans and equities to private companies operating in ODA-eligible countries. Total ODA in 2020 rose by 3.5% in real terms compared to 2019 (see Table 2), reaching its highest level ever recorded 1 . The increase is in part due to DAC members’ support of an inclusive global recovery in light of the pandemic and in part due to an increase in bilateral sovereign lending by some loan-giving members. Most donors had adopted their ODA budgets for 2020 by the time the pandemic hit, and were able to maintain their planned ODA commitments. In addition, some were able to rapidly mobilise additional funding to support developing countries face exceptional circumstances. Initial estimates indicate that within total ODA, DAC countries spent USD 12 billion in 2020 on COVID-19 related activities 2 (see Table 3). EU Institutions disbursed USD 9 billion. In a special survey conducted by the OECD in 2020 3 , in addition to new funds, many providers of development cooperation indicated that they had reoriented funds from existing 2020 development cooperation programmes for COVID-19 related activities, however, most indicated that they had not discontinued ongoing development programmes. Providers indicated that in the short-term, their response was guided in managing the spread and consequences of the virus, thus focussing mostly on health systems, humanitarian aid and food security. Some indicated that they would focus in the medium-term on making diagnostics and vaccines available to countries most in need. Many indicated they would also provide support to address the economic and social repercussions of the pandemic. OECD DAC methodology for counting loans in official aid data In 2014, DAC members decided to modernise the reporting of concessional loans by assessing their concessionality based on discount rates differentiated by income group, and introducing a grant-equivalent system for calculating ODA figures. Instead of recording the actual flows of cash between a donor and recipient country, DAC members agreed that the headline figure for official development assistance would be based on the grant equivalents of aid loans, i.e. the “gift portion” of the loans, expressed as a monetary value 4 . The grant 1 Total ODA reached its highest level ever in 2020, on a grant equivalent basis and on a net flow basis. 2 The figures on COVID-19 related activities are preliminary and partial, as many donors are still in the process of collecting detailed information, especially sector-related data. 3 https://one.oecd.org/document/DCD/DAC/STAT(2020)35/en/pdf. 4 For further information see: www.oecd.org/dac/financing-sustainable-development/development-finance- standards/official-development-assistance.htm.
Transcript of OECD – Paris, 13 April 2021 COVID-19 spending helped to ...

UNDER EMBARGO UNTIL 13 APRIL 2021, 15:00 HOURS PARIS TIME
1
OECD – Paris, 13 April 2021
COVID-19 spending helped to lift foreign aid to an all-time high in 2020 Detailed Note
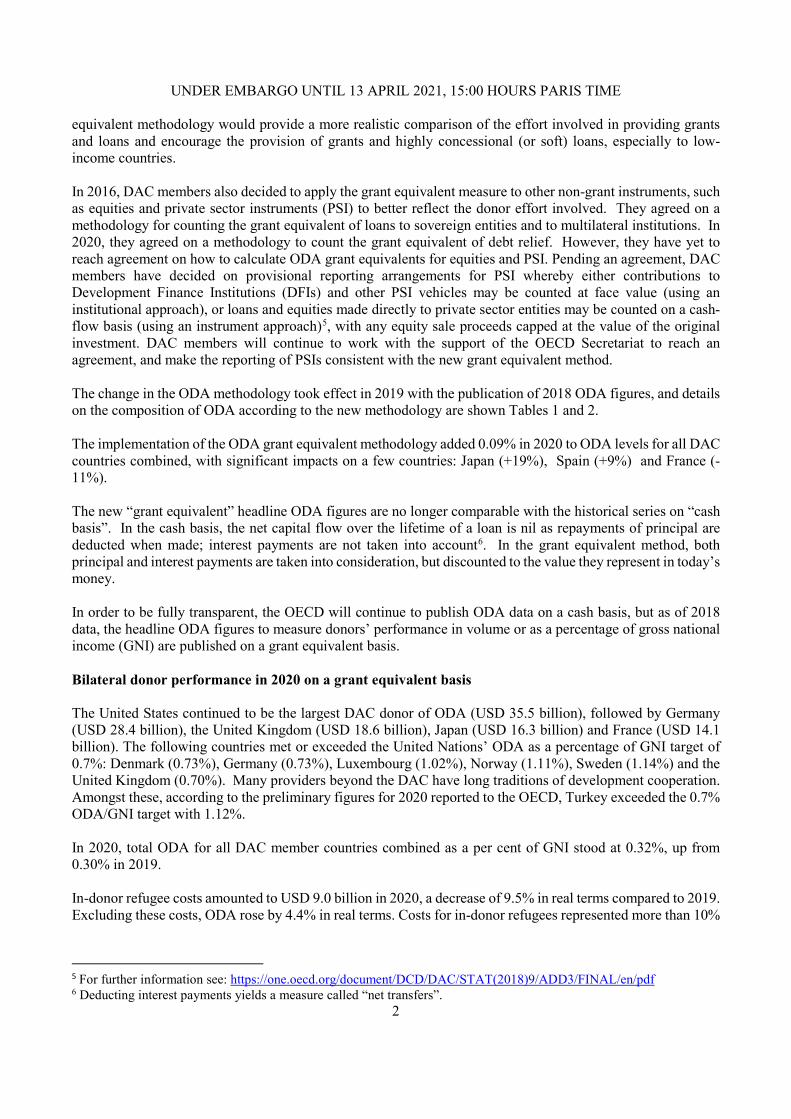
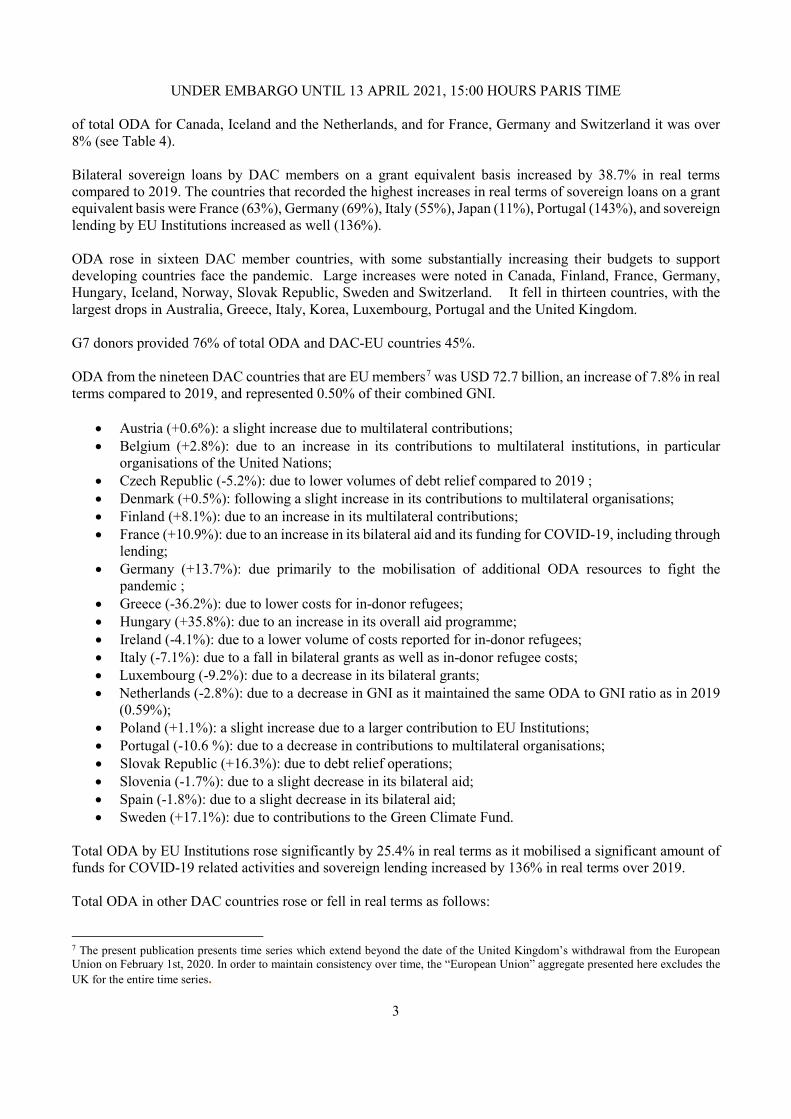
Preliminary ODA levels in 2020 In 2020, official development assistance (ODA) by member countries of the Development Assistance Committee (DAC) amounted to USD 161.2 billion, representing 0.32% of their combined GNI (see Table 1 and Chart 1). This total included USD 158.0 billion in the form of grants, loans to sovereign entities, debt relief and contributions to multilateral institutions (calculated on a grant-equivalent basis); USD 1.3 billion to development-oriented private sector instrument (PSI) vehicles and USD 1.9 billion in the form of net loans and equities to private companies operating in ODA-eligible countries. Total ODA in 2020 rose by 3.5% in real terms compared to 2019 (see Table 2), reaching its highest level ever recorded1. The increase is in part due to DAC members’ support of an inclusive global recovery in light of the pandemic and in part due to an increase in bilateral sovereign lending by some loan-giving members. Most donors had adopted their ODA budgets for 2020 by the time the pandemic hit, and were able to maintain their planned ODA commitments. In addition, some were able to rapidly mobilise additional funding to support developing countries face exceptional circumstances. Initial estimates indicate that within total ODA, DAC countries spent USD 12 billion in 2020 on COVID-19 related activities2 (see Table 3). EU Institutions disbursed USD 9 billion. In a special survey conducted by the OECD in 20203, in addition to new funds, many providers of development cooperation indicated that they had reoriented funds from existing 2020 development cooperation programmes for COVID-19 related activities, however, most indicated that they had not discontinued ongoing development programmes. Providers indicated that in the short-term, their response was guided in managing the spread and consequences of the virus, thus focussing mostly on health systems, humanitarian aid and food security. Some indicated that they would focus in the medium-term on making diagnostics and vaccines available to countries most in need. Many indicated they would also provide support to address the economic and social repercussions of the pandemic. OECD DAC methodology for counting loans in official aid data In 2014, DAC members decided to modernise the reporting of concessional loans by assessing their concessionality based on discount rates differentiated by income group, and introducing a grant-equivalent system for calculating ODA figures. Instead of recording the actual flows of cash between a donor and recipient country, DAC members agreed that the headline figure for official development assistance would be based on the grant equivalents of aid loans, i.e. the “gift portion” of the loans, expressed as a monetary value4. The grant
1 Total ODA reached its highest level ever in 2020, on a grant equivalent basis and on a net flow basis. 2 The figures on COVID-19 related activities are preliminary and partial, as many donors are still in the process of collecting detailed information, especially sector-related data. 3 https://one.oecd.org/document/DCD/DAC/STAT(2020)35/en/pdf. 4 For further information see: www.oecd.org/dac/financing-sustainable-development/development-finance-standards/official-development-assistance.htm.
UNDER EMBARGO UNTIL 13 APRIL 2021, 15:00 HOURS PARIS TIME
2
equivalent methodology would provide a more realistic comparison of the effort involved in providing grants and loans and encourage the provision of grants and highly concessional (or soft) loans, especially to low-income countries. In 2016, DAC members also decided to apply the grant equivalent measure to other non-grant instruments, such as equities and private sector instruments (PSI) to better reflect the donor effort involved. They agreed on a methodology for counting the grant equivalent of loans to sovereign entities and to multilateral institutions. In 2020, they agreed on a methodology to count the grant equivalent of debt relief. However, they have yet to reach agreement on how to calculate ODA grant equivalents for equities and PSI. Pending an agreement, DAC members have decided on provisional reporting arrangements for PSI whereby either contributions to Development Finance Institutions (DFIs) and other PSI vehicles may be counted at face value (using an institutional approach), or loans and equities made directly to private sector entities may be counted on a cash-flow basis (using an instrument approach)5, with any equity sale proceeds capped at the value of the original investment. DAC members will continue to work with the support of the OECD Secretariat to reach an agreement, and make the reporting of PSIs consistent with the new grant equivalent method. The change in the ODA methodology took effect in 2019 with the publication of 2018 ODA figures, and details on the composition of ODA according to the new methodology are shown Tables 1 and 2. The implementation of the ODA grant equivalent methodology added 0.09% in 2020 to ODA levels for all DAC countries combined, with significant impacts on a few countries: Japan (+19%), Spain (+9%) and France (-11%). The new “grant equivalent” headline ODA figures are no longer comparable with the historical series on “cash basis”. In the cash basis, the net capital flow over the lifetime of a loan is nil as repayments of principal are deducted when made; interest payments are not taken into account6. In the grant equivalent method, both principal and interest payments are taken into consideration, but discounted to the value they represent in today’s money. In order to be fully transparent, the OECD will continue to publish ODA data on a cash basis, but as of 2018 data, the headline ODA figures to measure donors’ performance in volume or as a percentage of gross national income (GNI) are published on a grant equivalent basis. Bilateral donor performance in 2020 on a grant equivalent basis The United States continued to be the largest DAC donor of ODA (USD 35.5 billion), followed by Germany (USD 28.4 billion), the United Kingdom (USD 18.6 billion), Japan (USD 16.3 billion) and France (USD 14.1 billion). The following countries met or exceeded the United Nations’ ODA as a percentage of GNI target of 0.7%: Denmark (0.73%), Germany (0.73%), Luxembourg (1.02%), Norway (1.11%), Sweden (1.14%) and the United Kingdom (0.70%). Many providers beyond the DAC have long traditions of development cooperation. Amongst these, according to the preliminary figures for 2020 reported to the OECD, Turkey exceeded the 0.7% ODA/GNI target with 1.12%. In 2020, total ODA for all DAC member countries combined as a per cent of GNI stood at 0.32%, up from 0.30% in 2019. In-donor refugee costs amounted to USD 9.0 billion in 2020, a decrease of 9.5% in real terms compared to 2019. Excluding these costs, ODA rose by 4.4% in real terms. Costs for in-donor refugees represented more than 10%
5 For further information see: https://one.oecd.org/document/DCD/DAC/STAT(2018)9/ADD3/FINAL/en/pdf 6 Deducting interest payments yields a measure called “net transfers”.
UNDER EMBARGO UNTIL 13 APRIL 2021, 15:00 HOURS PARIS TIME
3
of total ODA for Canada, Iceland and the Netherlands, and for France, Germany and Switzerland it was over 8% (see Table 4). Bilateral sovereign loans by DAC members on a grant equivalent basis increased by 38.7% in real terms compared to 2019. The countries that recorded the highest increases in real terms of sovereign loans on a grant equivalent basis were France (63%), Germany (69%), Italy (55%), Japan (11%), Portugal (143%), and sovereign lending by EU Institutions increased as well (136%). ODA rose in sixteen DAC member countries, with some substantially increasing their budgets to support developing countries face the pandemic. Large increases were noted in Canada, Finland, France, Germany, Hungary, Iceland, Norway, Slovak Republic, Sweden and Switzerland. It fell in thirteen countries, with the largest drops in Australia, Greece, Italy, Korea, Luxembourg, Portugal and the United Kingdom. G7 donors provided 76% of total ODA and DAC-EU countries 45%. ODA from the nineteen DAC countries that are EU members7 was USD 72.7 billion, an increase of 7.8% in real terms compared to 2019, and represented 0.50% of their combined GNI.
• Austria (+0.6%): a slight increase due to multilateral contributions; • Belgium (+2.8%): due to an increase in its contributions to multilateral institutions, in particular
organisations of the United Nations; • Czech Republic (-5.2%): due to lower volumes of debt relief compared to 2019 ; • Denmark (+0.5%): following a slight increase in its contributions to multilateral organisations; • Finland (+8.1%): due to an increase in its multilateral contributions; • France (+10.9%): due to an increase in its bilateral aid and its funding for COVID-19, including through
lending; • Germany (+13.7%): due primarily to the mobilisation of additional ODA resources to fight the
pandemic ; • Greece (-36.2%): due to lower costs for in-donor refugees; • Hungary (+35.8%): due to an increase in its overall aid programme; • Ireland (-4.1%): due to a lower volume of costs reported for in-donor refugees; • Italy (-7.1%): due to a fall in bilateral grants as well as in-donor refugee costs; • Luxembourg (-9.2%): due to a decrease in its bilateral grants; • Netherlands (-2.8%): due to a decrease in GNI as it maintained the same ODA to GNI ratio as in 2019
(0.59%); • Poland (+1.1%): a slight increase due to a larger contribution to EU Institutions; • Portugal (-10.6 %): due to a decrease in contributions to multilateral organisations; • Slovak Republic (+16.3%): due to debt relief operations; • Slovenia (-1.7%): due to a slight decrease in its bilateral aid; • Spain (-1.8%): due to a slight decrease in its bilateral aid; • Sweden (+17.1%): due to contributions to the Green Climate Fund.
Total ODA by EU Institutions rose significantly by 25.4% in real terms as it mobilised a significant amount of funds for COVID-19 related activities and sovereign lending increased by 136% in real terms over 2019. Total ODA in other DAC countries rose or fell in real terms as follows: 7 The present publication presents time series which extend beyond the date of the United Kingdom’s withdrawal from the European Union on February 1st, 2020. In order to maintain consistency over time, the “European Union” aggregate presented here excludes the UK for the entire time series.

UNDER EMBARGO UNTIL 13 APRIL 2021, 15:00 HOURS PARIS TIME
4
• Australia (-10.6%): due to slowed spending as a result of the pandemic while maintaining an overall commitment to an AUD 4 billion aid programme;
• Canada (+7.7%): following increases in climate financing and costs for in-donor refugees; • Iceland (+7.8%): due to an increase in contributions to multilateral organisations; • Japan (+1.2%): due to an increase in its bilateral lending; • Korea (-8.6%): due to cuts in its overall aid programme; • New Zealand (-5.2%): due to a decrease in its bilateral aid; • Norway (+8.4%): due to an increase in health-related ODA and contributions to the Green Climate
Fund; • Switzerland (+8.8%): due to an overall increase in its aid budget and additional funding to support
developing countries with the pandemic; • United Kingdom (-10.0%): driven by the decrease in GNI whilst meeting the ODA to GNI ratio of
0.7%; • United States (+4.7%): due to increased contributions to multilateral organisations.
Other provider countries also made considerable contributions to development co-operation efforts in 2020, in line with the comparative advantage of their respective programmes. Amongst those that reported their development finance flows to the OECD, the following changes were noted:
• Bulgaria (+24.7%): due to an increase in contributions to EU Institutions and other multilateral organisations;
• Croatia (+14.2%): as it increased its aid programme overall; • Cyprus8 (-0.1%); • Estonia (+1.2%); • Israel (-1.9%): • Latvia (+14.8%):due to an increase in its contributions to EU Institutions; • Lichtenstein (+7.2%): as it increased its contributions to multilateral organisations; • Lithuania (-3.8%): due to lower contributions to EU Institutions; • Malta (+38.3%): due to an increase in bilateral grants; • Qatar (-8.4%): as it decreased its bilateral aid, especially in the form of budget support; • Romania (+17.1%): due to an increase in its overall aid programme; • Saudi Arabia (-25.2%): as it decreased its bilateral aid programme; • Turkey (+1.2%); • Chinese Taipei (+25.8%): due to an increase in its contributions to multilateral organisations; • United Arab Emirates (-26.3%): due to a decrease in concessional loans.
ODA allocations on a cash basis As noted above, the “grant equivalent” headline figures are not comparable with the historical series on a “cash basis”. For the sake of transparency and analysis of trends over time, the OECD will continue to publish ODA data on a cash basis. The following data refer to net ODA flows on a cash basis unless otherwise specified.
8 Note by Turkey: The information in this document with reference to “Cyprus” relates to the southern part of the Island. There is no single authority representing both Turkish and Greek Cypriot people on the Island. Turkey recognises the Turkish Republic of Northern Cyprus. Note by all the European Union Member States of the OECD and the European Commission: The Republic of Cyprus is recognised by all members of the United Nations with the exception of Turkey. The information in this document relates to the area under the effective control of the Government of the Republic of Cyprus.

UNDER EMBARGO UNTIL 13 APRIL 2021, 15:00 HOURS PARIS TIME
5
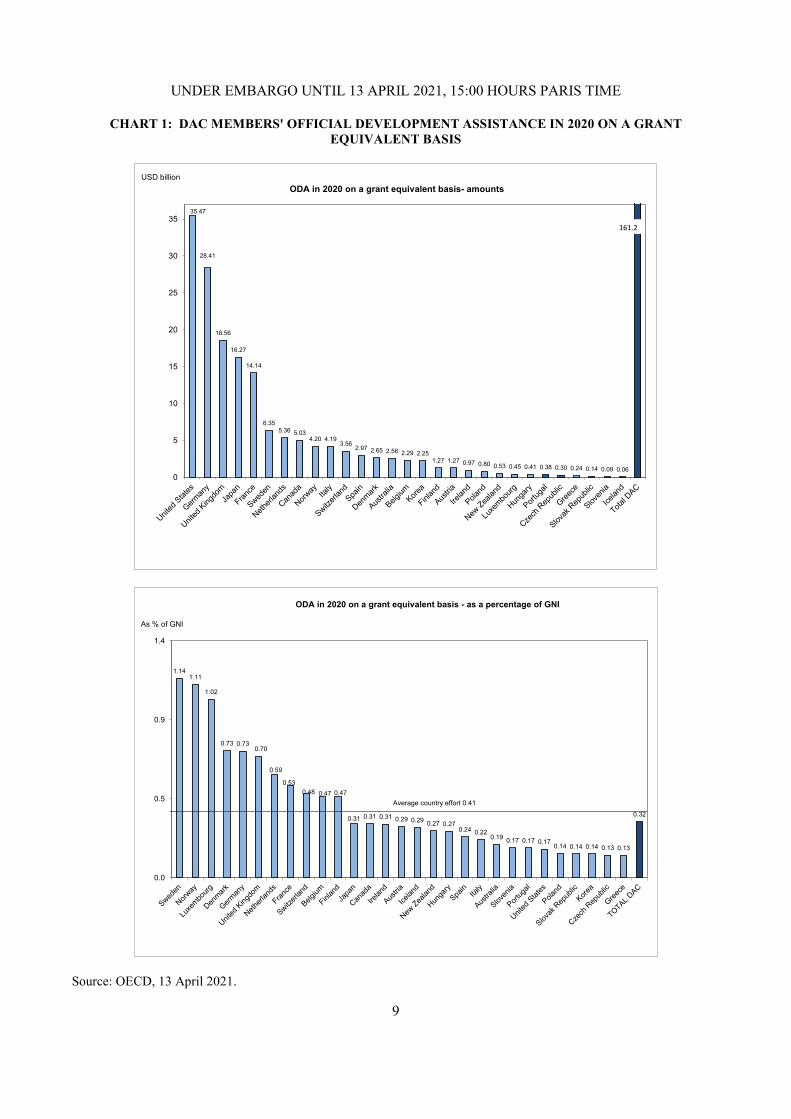
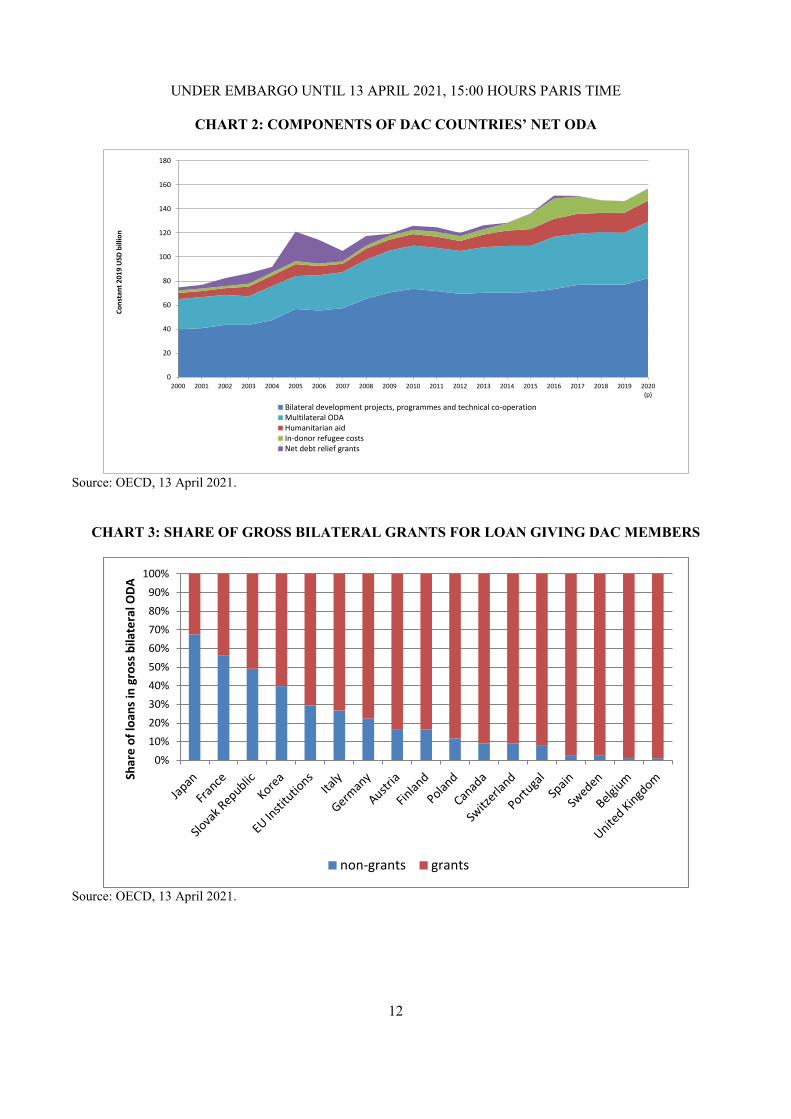
Net ODA flows by DAC member countries were USD 161.0 billion in 2020, an increase of 7% in real terms compared to 2019 (see Table 2). Net ODA flows for bilateral projects, programmes and technical assistance, which represent just over half of total net ODA, rose by 8% in real terms in 2020 compared to 2019. Contributions to multilateral organisations, which represent about a third of total ODA, increased by 9%. Humanitarian aid amounted to USD 18 billion and rose by 6% in real terms compared to 2019. Debt relief grants also rose to USD 554 million (see Chart 2). In 2020, 22% of gross bilateral ODA by DAC members was provided in the form of non-grants (loans and equity investments), up from a level which hovered around 17% in previous years. The remaining bilateral ODA is provided in the form of grants. Preliminary data in 2020 show that net bilateral ODA flows from DAC members to Africa were USD 39 billion, representing an increase of 4.1 % in real terms compared to 2019. By contrast, net ODA to sub-Saharan Africa amounting to USD 31 billion, fell by 1% in real terms. By income group, net bilateral ODA flows from all DAC members to low-income countries were USD 25 billion, a decrease of 3.5% in real terms compared to 2019. By contrast, net bilateral ODA to lower-middle income was USD 33 billion representing an increase of 6.9% in real terms. Net ODA to upper-middle countries also increased by 36.1% to USD 18 billion. Net ODA flows to high-income countries more than tripled and stood at USD 372 million. These trends, along with the increase in the share of loans in ODA would imply that part of the increase in ODA in 2020 is due to loans to middle-income countries. Preliminary data showed that net bilateral aid flows from DAC members to the group of least developed countries were USD 34 billion, and increased by 1.8% in real terms compared to 2019. ODA remains resilient in times of crises Net ODA has more than doubled in real terms since 2000 (increasing by 110%). It rose by 69% in real terms between 2000 and 2010, after the Millennium Development Goals were agreed in 2000 and other commitments were made by donors to increase their ODA, (at the Monterrey Conference on Financing for Development in 2002 and the G8 Gleneagles Summit in 2005). ODA budgets fell afterwards, by 1% in real terms in 2011 and a further 4% in 2012, due to the continuing financial crisis and euro zone turmoil, which led several governments to tighten their budgets and had a direct impact on development aid. ODA rebounded again in 2013 and continued to rise until 2016 when it reached a first peak due especially to the influx in Europe of refugees and associated in-donor refugee costs. It fell in 2017 and 2018 due to the tapering off of in-donor refugee costs and remained stable in 2019. In 2020, ODA reached its highest level ever due in part to support for the COVID-19 crisis. In April 20209, DAC members issued a statement that recognised ODA as “an important means of supporting national responses to the COVID-19 crisis,” and that they would “strive to protect ODA budgets”. ODA has long been a stable source of development financing and has cushioned the immediate impact of previous financial crises (e.g. after the Mexican debt crisis in the early 1980s, the recession of the early 1990s and the financial crisis in 2008). In 2020, ODA rose in a year that saw all other major external resource flows for developing countries – trade, foreign direct investment, tax and remittances – decline due to the pandemic. Total external private finance to developing countries fell by 13% in 2020 and trade declined by 8.5%10. The
9 DAC Statement, published on 9 April 2020, accessible here: http://www.oecd.org/dac/development-assistance-committee/DAC-Joint-Statement-COVID-19.pdf 10 See OECD (2020), Global Outlook on Financing for Sustainable Development 2021: A New Way to Invest for People and Planet, OECD Publishing, Paris, https://doi.org/10.1787/e3c30a9a-en.

UNDER EMBARGO UNTIL 13 APRIL 2021, 15:00 HOURS PARIS TIME
6
dependability and resilience of ODA in responding to the current COVID-19 crisis was foreseen by the OECD11, and is once again demonstrated with the 2020 figures including demonstrating that ODA is above all driven by political will and global solidarity. Trends in ODA flows indicate GDP growth has not been the main driver of ODA generosity. Annual average OECD GDP growth rates since the 1960s fell from over 5% to around 2% in the last two decades. By contrast, ODA growth increased until the 1990s, when it fell, only to rebound to its highest growth levels in the 2000s. In 2020, GDP growth for OECD countries was at -5.48%, yet net ODA flows rose by 7%. Many DAC members indicated that they would protect ODA budgets in 2020 and several have indicated they would continue to maintain or increase them in 2021. The OECD projects global GDP growth at 5.6% in 2021 and 4% in 2022 and world output is expected to reach pre-pandemic levels by mid-2021, although this will depend on the pace at which vaccines are given and further lockdowns12. Some DAC members have mechanisms in place that smooth ODA volumes over several years so that they can honour their commitments in the event of sudden changes to available resources. However, given the global economic impacts of the pandemic, it is uncertain if ODA volumes can continue to grow or remain stable in the coming years. Detailed figures on 2020 data will only be available in December 2021, but concessional finance for the health sector from all donors (bilateral, multilateral and private foundations) averaged USD 27 billion per year (in real prices) between 2017 and 2019. In 2019, two-thirds of aid for the health sector were provided by the United States (USD 6.5 billion), the Global Fund (USD 3.6 billion), the Bill and Melinda Gates Foundation (USD 2.8 billion), the Global Alliance for Vaccines and Immunization (USD 1.9 billion) and the United Kingdom (USD 1.8 billion). Basic health programmes accounted 50% of total ODA, population policies (including family planning) accounted for 34% and other health programmes (health policy and management, medical education, medical research and medical services) accounted for 16%. Total ODA for infectious diseases (including malaria and TB) amounted to USD 7 billion in 2019. Preliminary data for COVID-19 activities in the health sector (e.g. testing, prevention, immunisation, treatment, care, education and communication) show that DAC countries provided a little over USD 3 billion in ODA. These figures are preliminary and partial though and it is likely that the final figures will be much higher. This note is based on OECD members’ responses to the DAC Advance Questionnaire on main ODA aggregates. Final and detailed figures for official and private flows to developing countries will be available in December 2021.
11 OECD (2020), Development Co-operation Report 2020: Learning from Crises, Building Resilience, OECD Publishing, Paris, https://doi.org/10.1787/f6d42aa5-en. 12 https://www.oecd.org/newsroom/the-need-for-speed-faster-vaccine-rollout-critical-to-stronger-recovery.htm

UNDER EMBARGO UNTIL 13 APRIL 2021, 15:00 HOURS PARIS TIME
7
Memo:
Total ODA ODA/GNI Grants
Grant equivalents
of loans Debt relief
Grants and capital
subscriptions
Grant equivalents of loans
Institu-tional
approach
Instru-ment
approach PSI sub-total - flow basis
(1) + (2) % (1) (2)DAC countries:
Australia 2 563 0.19 1 955 - - 607 - 2 563 - - - 2 563Austria 1 268 0.29 443 9 15 754 - 1 220 - 48 48 1 316
Belgium 2 290 0.47 940 10 - 1 233 43 2 225 65 - 65 2 341Canada 5 031 0.31 3 449 304 - 1 204 - 4 956 75 - 75 4 896
Czech Republic 300 0.13 69 - - 229 - 298 2 - 2 300Denmark 2 649 0.73 1 702 - - 947 - 2 649 - - - 2 638
Finland 1 275 0.47 538 - - 630 - 1 169 - 106 106 1 275France 14 139 0.53 5 357 2 753 380 4 770 245 13 505 - 634 634 15 833
Germany 28 405 0.73 19 647 1 913 1 6 439 - 28 001 - 405 405 28 886Greece 238 0.13 4 - - 233 - 238 - - - 238
Hungary 411 0.27 199 - - 212 - 411 - - - 411Iceland 62 0.29 51 0 11 - 63 - - - 62
Ireland 972 0.31 509 - - 463 - 972 - - - 972Italy 4 186 0.22 952 163 - 3 071 - 4 186 - - - 4 348
Japan 16 266 0.31 5 475 7 154 - 2 505 575 15 709 - 557 557 13 666Korea 2 249 0.14 1 166 597 2 485 - 2 249 - - - 2 290
Luxembourg 450 1.02 304 - - 146 - 450 - - - 450Netherlands 5 359 0.59 3 558 - 22 1 779 - 5 359 - - - 5 359
New Zealand 531 0.27 433 - - 98 - 531 - - - 531Norway 4 198 1.11 2 912 - 46 1 040 - 3 998 200 - 200 4 198
Poland 803 0.14 189 17 - 597 - 803 - - - 786Portugal 385 0.17 130 5 1 249 - 385 - - - 364
Slovak Republic 140 0.14 19 - 18 103 - 140 - - - 140Slovenia 90 0.17 30 - - 60 - 90 - - - 90
Spain 2 969 0.24 1 004 2 - 1 971 - 2 978 - - 9 - 9 2 722Sweden 6 348 1.14 3 491 - - 2 770 - 6 261 87 - 87 6 261
Switzerland 3 560 0.48 2 591 50 - 875 - 3 516 43 2 44 3 722United Kingdom 18 560 0.70 11 152 - 57 6 059 327 17 594 851 114 966 19 245United States 35 475 0.17 29 318 4 - 6 153 - 35 475 - - - 35 124
TOTAL DAC 161 172 0.32 97 588 12 982 541 45 693 1 189 157 993 1 322 1 858 3 180 161 027
Average Country Effort 0.41
Memo items:EU Institutions 19 378 - 16 558 2 565 - 251 - 19 374 - 4 4 20 866DAC-EU countries c 72 677 0.50 39 086 4 873 436 26 656 287 71 339 154 1 184 1 338 74 729G7 countries 122 062 0.31 75 350 12 291 438 30 200 1 147 119 426 926 1 710 2 636 121 997Non-G7 countries 39 110 0.37 22 238 690 103 15 493 43 38 567 397 147 544 39 029OECD non-DAC members: d
Estonia 49 0.16 16 - - 33 - 49 - - - 49Israel e 288 0.07 238 - - 50 - 288 - - - 288Latvia 40 0.12 4 - - 37 - 40 - - - 40Lithuania 67 0.12 12 - - 55 - 67 - - - 67Turkey 8 003 1.12 7 916 - - 88 - 8 003 - - - 8 003DAC Participants: f
Bulgaria 84 0.13 9 - - 75 - 84 - - - 84Qatar 534 0.30 459 - - 75 - 534 - - - 534Romania 306 0.13 71 - - 234 - 306 - - - 306Saudi Arabia 1 493 0.19 918 280 - 24 21 1 243 - 250 250 1 626United Arab Emirates 1 695 0.48 1 640 31 - 24 - 1 695 - - - 1 615Other Non-OECD members: g
Croatia 84 0.15 23 - - 61 - 84 - - - 84Cyprus h 20 0.08 4 - - 17 - 20 - - - 20Liechtenstein 28 0.00 19 - - 9 - 28 - - - 28Malta 58 0.44 52 - - 6 - 58 - - - 58Chinese Taipei 403 0.06 187 3 - 168 46 403 - - - 504
b) Net disbursements. Items not yet included in grant equivalent measure as reporting directives have not yet been agreed: the use of private sector instruments.https://one.oecd.org/document/DCD/DAC/STAT(2018)9/ADD3/FINAL/en/pdf
c) The present publication presents time series which extend beyond the date of the United Kingdom’s withdrawal from the European Union on February 1st, 2020. In order to maintain consistency over time, the “European Union” aggregate presented here excludes the UK.d) Chile, Colombia and Mexico do not provide data on their official development finance to the OECD.
g) Countries that have provided preliminary data on their 2020 development finance. h) Note by Turkey: The information in this document with reference to “Cyprus” relates to the southern part of the Island. There is no single authority representing both Turkish and Greek Cypriot people on the Island. Turkey recognises the Turkish Republic of Northern Cyprus.Note by all the European Union Member States of the OECD and the European Commission: The Republic of Cyprus is recognised by all members of the United Nations with the exception of Turkey. The information in this document relates to the area under the effective control of the Government of the Republic of Cyprus.
Source: OECD, 13 April 2021.
TABLE 1: DAC MEMBERS' OFFICIAL DEVELOPMENT ASSISTANCE IN 2020 ON A GRANT EQUIVALENT BASIS a
Data for 2020 are preliminaryUSD million
Notes: The data for 2020 are preliminary pending detailed final data to be published in December 2021. The data are standardised on a calendar year basis for all countries, and so may differ from fiscal year data available in countries' budget documents.
- - - - - - - - - - o f w h i c h : - - - - - - - - - -
Volume of total ODA flows -
net disbursements
GRANT EQUIVALENTS NET FLOWS
Multilateral ODA grant equivalent sub-total
Private sector instruments
a) Total ODA in 2020 includes USD 13.0 billion of loans to ODA-eligible sovereign entities, USD 1.3 billion of assistance provided to and any reflows including profits from development-oriented PSI vehicles and USD 1.9 billion of loans and equities provided to and repayments and reflows from private companies operating in ODA-eligible countries.
f) Azerbaijan and Kuwait are also Participants to the DAC and did not provide preliminary 2020 ODA figures to the OECD.
e) The statistical data for Israel are supplied by and under the responsibility of the relevant Israeli authorities. The use of such data by the OECD is without prejudice to the status of the Golan Heights, East Jerusalem and Israeli settlements in the West Bank under the terms of international law.
Bilateral

UNDER EMBARGO UNTIL 13 APRIL 2021, 15:00 HOURS PARIS TIME
8
2020 2019
Total ODA
Grant equivalents
(a) Flows (b) ODA/GNI Total ODA
Grant equivalents
(a) Flows (b) ODA/GNI
Per cent change 2019 to 2020 (c)
% % DAC countries:Australia 2 582 2 582 - 0.19 2 888 2 888 - 0.21 -10.6 2 582 2 888Austria 1 237 1 190 47 0.29 1 230 1 206 24 0.28 0.6 1 284 1 227Belgium 2 235 2 172 63 0.47 2 175 2 088 86 0.41 2.8 2 285 2 208Canada 5 091 5 015 75 0.31 4 725 4 494 232 0.27 7.7 4 954 4 535Czech Republic 293 291 2 0.13 309 281 28 0.13 -5.2 293 309Denmark 2 567 2 567 - 0.73 2 554 2 510 44 0.72 0.5 2 556 2 541Finland 1 223 1 121 102 0.47 1 131 1 073 58 0.42 8.1 1 223 1 149France 13 545 12 938 607 0.53 12 211 11 560 651 0.44 10.9 15 168 11 984Germany 27 511 27 119 392 0.73 24 198 23 415 782 0.61 13.7 27 976 24 122Greece 235 235 - 0.13 368 368 - 0.18 -36.2 235 368Hungary 424 424 - 0.27 312 312 - 0.21 35.8 424 312Iceland 66 67 - 0.29 61 61 0 0.25 7.8 66 61Ireland 933 933 - 0.31 973 973 - 0.32 -4.1 933 973Italy 4 062 4 062 - 0.22 4 373 4 364 9 0.22 -7.1 4 219 4 260Japan 15 777 15 236 541 0.31 15 588 15 337 251 0.29 1.2 13 255 11 720Korea 2 251 2 251 - 0.14 2 463 2 463 - 0.15 -8.6 2 292 2 517Luxembourg 428 428 - 1.02 472 472 - 1.03 -9.2 428 472Netherlands 5 143 5 143 - 0.59 5 292 5 292 - 0.59 -2.8 5 143 5 292New Zealand 526 526 - 0.27 555 555 - 0.28 -5.2 526 555Norway 4 660 4 438 222 1.11 4 298 4 041 257 1.03 8.4 4 660 4 298Poland 785 785 - 0.14 777 777 - 0.14 1.1 768 761Portugal 367 367 - 0.17 410 410 - 0.17 -10.6 348 382Slovak Republic 135 135 - 0.14 116 116 - 0.11 16.3 135 116Slovenia 86 86 - 0.17 88 88 - 0.17 -1.7 86 88Spain 2 891 2 899 - 8 0.24 2 944 2 961 - 17 0.21 -1.8 2 650 2 709Sweden 6 095 6 012 83 1.14 5 205 5 142 63 0.96 17.1 6 012 5 205Switzerland 3 371 3 329 42 0.48 3 099 3 069 30 0.42 8.8 3 525 3 095United Kingdom 17 434 16 527 907 0.70 19 377 18 024 1 353 0.70 -10.0 18 078 19 354United States 35 071 35 071 - 0.17 33 492 33 488 4 0.15 4.7 34 725 32 981
TOTAL DAC 157 026 153 952 3 075 0.32 151 683 147 827 3 855 0.30 3.5 156 829 146 482
Memo items:EU Institutions 18 730 18 727 4 - 14 937 15 545 - 608 - 25.4 20 169 15 267DAC-EU countries d 70 196 68 908 1 288 0.50 65 136 63 408 1 729 0.43 7.8 72 166 64 477G7-countries 118 492 115 970 2 522 0.31 113 964 110 682 3 282 0.28 4.0 118 376 108 956Non-G7 countries 38 534 37 981 553 0.37 37 719 37 145 573 0.35 2.2 38 454 37 526
OECD non-DAC members: e
Estonia 49 49 - 0.16 48 48 - 0.16 1.2 49 48Israel f 276 276 - 0.07 281 281 - 0.07 -1.9 276 281Latvia 39 39 - 0.12 34 34 - 0.10 14.8 39 34Lithuania 65 65 - 0.12 68 68 - 0.13 -3.8 65 68Turkey 8 773 8 773 - 1.12 8 667 8 667 - 1.15 1.2 8 773 8 667DAC Participants: g
Bulgaria 82 82 - 0.13 65 65 - 0.10 24.7 82 65Qatar 520 520 - 0.30 567 567 - 0.32 -8.4 520 567Romania 298 298 - 0.13 254 254 - 0.10 17.1 298 254Saudi Arabia 1 454 1 211 243 0.19 1 944 1 694 250 0.24 -25.2 1 584 2 069United Arab Emirates 1 651 1 651 - 0.48 2 240 2 240 - 0.55 -26.3 1 573 2 490Other Non-OECD members: h
Croatia 82 82 - 0.15 72 72 - 0.12 14.2 82 73Cyprus i 20 20 - 0.08 20 20 - 0.09 -0.1 20 20Liechtenstein 27 27 - NA 25 25 - NA 7.2 27 25Malta 57 57 - 0.44 41 41 - 0.30 38.3 57 41Chinese Taipei 393 393 - 0.06 312 312 - 0.05 25.8 491 316
a) In 2020, total ODA includes grants, the grant equivalents of loans to sovereign entities, debt relief, grants and capital subscriptions as well as the grant equivalent of loans to multilateral organisations. In 2019 total ODA includes the same items, except for debt relief which was counted on a flow basis. b) Flows includes private sector instruments on a net disbursement basis in 2020 and private sector instruments and debt relief in 2019.c) Taking into account both inflation (using GDP deflators from the OECD's Economic Outlook No. 108, December 2020) and exchange rate movements.d) The present publication presents time series which extend beyond the date of the United Kingdom’s withdrawal from the European Union on February 1st, 2020. In order to maintain consistency over time, the “European Union” aggregate presented here excludes the UK for the entire time series.e) Chile, Colombia and Mexico do not provide data on their official development finance to the OECD.
h) Countries that have provided preliminary data on their 2019 development finance. i) Note by Turkey: The information in this document with reference to “Cyprus” relates to the southern part of the Island. There is no single authority representing both Turkish and Greek Cypriot people on the Island. Turkey recognises the Turkish Republic of Northern Cyprus.Note by all the European Union Member States of the OECD and the European Commission: The Republic of Cyprus is recognised by all members of the United Nations with the exception of Turkey. The information in this document relates to the area under the effective control of the Government of the Republic of Cyprus.
Source: OECD, 13 April 2021.
f) The statistical data for Israel are supplied by and under the responsibility of the relevant Israeli authorities. The use of such data by the OECD is without prejudice to the status of the Golan Heights, East Jerusalem and Israeli settlements in the West Bank under the terms of international law.g) Azerbaijan and Kuwait are also Participants to the DAC and did not provide preliminary 2020 ODA figures to the OECD.
of which:
2019
of which:
TABLE 2: TRENDS IN DAC MEMBERS' OFFICIAL DEVELOPMENT ASSISTANCE IN 2019 AND 2020 ON A GRANT EQUIVALENT BASIS
Volume of total ODA flows - net disbursements
USD million, at 2019 prices and exchange ratesData for 2020 are preliminary
Memo:
2020
UNDER EMBARGO UNTIL 13 APRIL 2021, 15:00 HOURS PARIS TIME
9
CHART 1: DAC MEMBERS' OFFICIAL DEVELOPMENT ASSISTANCE IN 2020 ON A GRANT EQUIVALENT BASIS
Source: OECD, 13 April 2021.
35.47
28.41
18.56
16.27
14.14
6.355.36 5.03
4.20 4.193.56
2.97 2.65 2.56 2.29 2.251.27 1.27 0.97 0.80 0.53 0.45 0.41 0.38 0.30 0.24 0.14 0.09 0.06
0
5
10
15
20
25
30
35
USD billionODA in 2020 on a grant equivalent basis- amounts
161.2
1.141.11
1.02
0.73 0.730.70
0.59
0.530.48 0.47 0.47
0.31 0.31 0.31 0.29 0.29 0.27 0.270.24 0.22
0.19 0.17 0.17 0.170.14 0.14 0.14 0.13 0.13
0.32
0.0
0.5
0.9
1.4
As % of GNI
ODA in 2020 on a grant equivalent basis - as a percentage of GNI
Average country effort 0.41

UNDER EMBARGO UNTIL 13 APRIL 2021, 15:00 HOURS PARIS TIME
10
COVID-19 of which: Memo:related activities health sector Net ODA disbursements
Australia 82 - 2 563Austria 29 1 1 316
Belgium 129 33 2 341Canada 293 125 4 896
Czech Republic 6 2 300Denmark 206 30 2 638
Finland 85 74 1 275France 2 206 208 15 833
Germany 1 422 - 28 886Greece - - 238
Hungary 41 - 411Iceland 7 5 62
Ireland 26 13 972Italy 98 11 4 348
Japan 2 991 769 13 666Korea 586 463 2 290
Luxembourg 79 28 450Netherlands 289 37 5 359
New Zealand 59 21 531Norway 300 151 4 198
Poland 11 2 786Portugal 1 1 364
Slovak Republic 4 3 140Slovenia 1 1 90
Spain 231 49 2 722Sweden 208 79 6 261
Switzerland 298 5 3 722United Kingdom 1 789 723 19 245United States 438 438 35 124
TOTAL DAC 11 914 3 272 161 027
Memo items:EU Institutions 9 062 730 20 866DAC-EU countries b 5 071 571 74 729
(a) The data shown in this table are preliminary and partial, as many donors are still in the process of collecting detailed information on COVID-19 related activities,especially sector related. These data may differ from individual announcements made by countries due to the timing of payments and some may be reported in 2021 data. Detailed final 2020 data will be published in December 2021. b) The present publication presents time series which extend beyond the date of the United Kingdom’s withdrawal from the European Union on February 1st, 2020. In order to maintain consistency over time, the “European Union” aggregate presented here excludes the UK.
Source: OECD, 13 April 2021.
TABLE 3: DAC MEMBERS' NET ODA DISBURSEMENTS IN 2020 FOR COVID-19 RELATED ACTIVITIES (a)USD million
Data for 2020 are preliminary

UNDER EMBARGO UNTIL 13 APRIL 2021, 15:00 HOURS PARIS TIME
11
ODA of which: ODA of which: Percent changeGrant
equivalentIn-donor
refugee costsGrant
equivalentIn-donor
refugee costsODA excluding in-donor refugee costs
USD million USD million USD million USD million 2019 to 2020 a
current current % current current %At 2019 prices and
exchange rates
DAC countries:Australia 2 563 - 0.0 2 888 - 0.0 -10.6Austria 1 268 31 2.4 1 230 31 2.5 0.7Belgium 2 290 134 5.9 2 175 138 6.3 3.3Canada 5 031 631 12.5 4 725 476 10.1 4.8Czech Republic 300 6 1.8 309 6 2.0 -5.1Denmark 2 649 56 2.1 2 554 54 2.1 0.5Finland 1 275 59 4.7 1 131 90 7.9 12.0France 14 139 1 227 8.7 12 211 1 210 9.9 12.4Germany 28 405 2 597 9.1 24 198 3 036 12.5 18.1Greece 238 0.1 368 134 36.6 0.4Hungary 411 2 0.4 312 1 0.3 35.7Iceland 62 7 10.5 61 8 12.9 10.8Ireland 972 25 2.5 973 84 8.6 2.2Italy 4 186 229 5.5 4 373 445 10.2 -2.2Japan 16 266 0 0.0 15 588 0 0.0 1.2Korea 2 249 1 0.1 2 463 1 0.1 -8.6Luxembourg 450 - 0.0 472 0 0.1 -9.2Netherlands 5 359 562 10.5 5 292 494 9.3 -4.0New Zealand 531 4 0.7 555 16 2.9 -3.1Norway 4 198 47 1.1 4 298 60 1.4 8.7Poland 803 7 0.8 777 6 0.8 1.0Portugal 385 10 2.5 410 8 1.9 -11.1Slovak Republic 140 1 0.7 116 1 0.8 16.4Slovenia 90 3 3.0 88 2 2.6 -2.2Spain 2 969 190 6.4 2 944 300 10.2 2.4Sweden 6 348 149 2.4 5 205 263 5.0 20.4Switzerland 3 560 323 9.1 3 099 284 9.2 8.9United Kingdom 18 560 801 4.3 19 377 609 3.1 -11.1United States 35 475 1 880 5.3 33 492 1 880 5.6 5.1
TOTAL DAC 161 172 8 980 5.6 151 683 9 635 6.4 4.4
Memo Item:
DAC-EU countries b 72 677 5 287 7.3 65 136 6 301 9.7 10.6
a) Taking account of both inflation and exchange rate movements.b) The present publication presents time series which extend beyond the date of the United Kingdom’s withdrawal from the European Union on February 1st, 2020. In order to maintain consistency over time, the “European Union” aggregate presented here excludes the UK.
Source: OECD, 13 April 2021.
TABLE 4: SHARE OF IN-DONOR REFUGEE COSTS IN ODA Preliminary data for 2020
2020 2019
In-donor refugee costs as a share of total ODA
In-donor refugee costs as a share of total ODA
UNDER EMBARGO UNTIL 13 APRIL 2021, 15:00 HOURS PARIS TIME
12
CHART 2: COMPONENTS OF DAC COUNTRIES’ NET ODA
Source: OECD, 13 April 2021.
CHART 3: SHARE OF GROSS BILATERAL GRANTS FOR LOAN GIVING DAC MEMBERS
Source: OECD, 13 April 2021.
0
20
40
60
80
100
120
140
160
180
2000 2001 2002 2003 2004 2005 2006 2007 2008 2009 2010 2011 2012 2013 2014 2015 2016 2017 2018 2019 2020(p)
Cons
tant
201
9 U
SD b
illio
n
Bilateral development projects, programmes and technical co-operationMultilateral ODAHumanitarian aidIn-donor refugee costsNet debt relief grants
0%10%20%30%40%50%60%70%80%90%
100%
Shar
e of
loan
s in
gro
ss b
ilate
ral O
DA
non-grants grants