OECD-Eurostat Entrepreneurship Indicators Program · · 2017-02-24OECD-Eurostat Entrepreneurship...
30
Measuring Entrepreneurship A digest of indicators OECD-Eurostat Entrepreneurship Indicators Program Entrepreneurship Entrepreneurship OECD Statistics Directorate
-
Upload
truongcong -
Category
Documents
-
view
228 -
download
2
Transcript of OECD-Eurostat Entrepreneurship Indicators Program · · 2017-02-24OECD-Eurostat Entrepreneurship...

Measuring Entrepreneurship
A digest of indicators
OECD-Eurostat Entrepreneurship Indicators Program
En
tre
pre
ne
urs
hip
En
tre
pre
ne
urs
hip
OECD Statistics Directorate

MEASURING ENTREPRENEURSHIP
A Digest of Indicators
OECD – Eurostat Entrepreneurship Indicators Programme

ORGANISATION FOR ECONOMIC CO-OPERATION
AND DEVELOPMENT
The OECD is a unique forum where the governments of 30 democrac ies work together to address
the economic, social and environmental challenges of globalisation. The OECD is also at the forefront of
efforts to understand and to help governments respond to new developments and concerns, such as corporate
governance, the information economy and the challenges of an ageing population. The Organisation provides a
setting where governments can compare policy experiences, seek answers to common problems, identify
good practice and work to co-ordinate domestic and international policies.
The OECD member countries are: Australia, Austria, Belgium, Canada, the Czech Republic, Denmark, Finland,
France, Germany, Greece, Hungary, Iceland, Ireland, Italy, Japan, Korea, Luxembourg, Mexico, the
Netherlands, New Zealand, Norway, Poland, Portugal, the Slovak Republic, Spain, Sweden,
Switzerland, Turkey, the United Kingdom and the United States. The Commission of the European
Communities takes part in the work of the OECD.
This work is published on the responsibility of the Secretary-General of the OECD. The opinions expressed and
arguments employed herein do not necessarily reflect the official views of the Organisation or of the governments of its
member countries.
© OECD 2008

MEASURING ENTREPRENEURSHIP: A DIGEST OF INDICATORS – 3
© OECD 2008
Foreword
More attention is being paid to “entrepreneurship” today than ever before. Entrepreneurship has become a buzzword both in the media and in political debate. It is almost impossible to imagine a discussion about any aspect of economic policy without mention of the contribution of, or impact on, entrepreneurs.
Despite the exalted views of entrepreneurship, measurement of the phenomenon, particularly at international level, has long been an issue. While the OECD has addressed entrepreneurship through various analytical studies and reports, no systematic effort was made to establish an ongoing database specifically devoted to comparing entrepreneurship across OECD countries. There have been numerous initiatives at a local, regional or national level, and even a few at the international level, but internationally comparable data are scarce. Moreover, National Statistics Offices have seldom been directly involved in developing data on entrepreneurship.
The joint OECD-Eurostat Entrepreneurship Indicators Programme (EIP) addresses this gap. It is the result of a strong collaborative effort by Eurostat and the OECD and a willing commitment by many National Statistics Offices to harmonise methods and produce results. A number of other events and actors are also responsible for the success of the EIP and their contributions must be recognised.
In 2004, the 2nd OECD Ministerial Conference on SMEs in Istanbul, Promoting Entrepreneurship and Innovative SMEs in a Global Economy, concluded that the statistical base for entrepreneurship research was weak, especially in terms of international comparability. The Istanbul Ministerial Declaration urged the OECD to develop “a robust and comparable statistical base on which SME policy can be developed”.
While the Ministerial recommendations were a strong incentive, other supporters and sponsors were needed to make the work possible. In 2005, the Kauffman Foundation provided the OECD the financial support for a feasibility study to explore what could be done to improve entrepreneurship data. A Danish-led consortium of seven OECD countries – Canada, Denmark, the Netherlands, Finland, Norway, Sweden and the United States – known as ICE, added financial and intellectual support for the work.
Encouraged by the feasibility study, the OECD launched the Entrepreneurship Indicators Programme (EIP) in late 2006. Twelve OECD countries plus the World Bank and Eurostat joined the Entrepreneurship Indicators Steering Group to develop definitions, methods and a list of core indicators. In 2007, Eurostat formally joined forces with the OECD to create the joint OECD-Eurostat Entrepreneurship Indicators Programme whose aim is to create a durable long-term programme of policy-relevant entrepreneurship statistics.

4 – MEASURING ENTREPRENEURSHIP: A DIGEST OF INDICATORS
©OECD 2008
This report presents the first fruits of the efforts of the last three years. It was prepared by Nadim Ahmad, Benoit Arnaud, Tim Davis and Koen De Backer of the Structural Economic Statistics Division of the OECD Statistics Directorate. They benefited from comments by Joaquim Oliveira Martins. The contributions of many others were also instrumental, notably those who served on the steering group. Their names and affiliations can be found at the end of this report. Last, but not least, co-operation with the National Statistics Offices in the different countries was crucial.
In the first round, the results of which are found here, 18 countries contributed data corresponding to the new “entrepreneurship” concepts. This is a promising start and we look forward to engaging more countries, and to producing more indicators, in the years to come. We will release new data and update indicators on a regular basis through www.oecd.org/statistics/entrepreneurshipindicators. The OECD will continue its work on measuring entrepreneurship; entrepreneurship indicators have become an integral part of the activities of the Structural Economic Statistics Division of the OECD Statistics Directorate.
Enrico Giovannini Chief Statistician
and Director of the Statistics Directorate

MEASURING ENTREPRENEURSHIP: A DIGEST OF INDICATORS – 5
© OECD 2008
The Importance of Entrepreneurship
Entrepreneurship is increasingly recognised as an important driver of economic growth, productivity, innovation and employment, and it is widely accepted as a key aspect of economic dynamism: the birth and death of firms and their growth and downsizing. As firms enter and exit the market, theory suggests that the new arrivals will be more efficient than those they displace. Existing firms that are not driven out are forced to innovate and become more productive in order to compete. Many studies have given empirical support to this process of “creative destruction” first described by Joseph Schumpeter.
However, while academic studies have long recognised the importance of entrepreneurship, policy makers have only recently explicitly discovered it. Indeed, entrepreneurship was long considered an exogenous factor in government policies, and policy efforts were often directed simply towards the large population of very small firms rather than aimed at stimulating entrepreneurs able to introduce new products, processes or organisational forms in order to exploit new markets and grow.
However, many OECD countries have made entrepreneurship an explicit policy priority in recent years, and governments’ policies now seek to affect the rate and type of entrepreneurship. As globalisation reshapes the international economic landscape and technological change creates greater uncertainty in the world economy, the dynamism of entrepreneurship is believed to be able to help to meet the new economic, social and environmental challenges.
Governments increasingly consider entrepreneurship and innovation to be the cornerstones of a competitive national economy, and in most countries entrepreneurship policies are in fact closely connected to innovation policies, with which they share many characteristics and challenges. Both are associated with “doing something new” and, designed correctly, they can be mutually reinforcing. The dynamic process of new firm creation introduces and disperses innovative products, processes and organisational structures throughout the economy.
Entrepreneurship objectives and policies nevertheless differ considerably among countries, owing to different policy needs and diverse perspectives on what is meant by entrepreneurship. In some countries, entrepreneurship is linked to regional development programmes and the creation of new firms is stimulated to boost employment and output in depressed regions. In others, entrepreneurship is a key element of strategies designed to facilitate the participation of certain target groups, such as women or minorities, in the economy. Some countries simply seek to increase firm creation as such, while others set out to support high-growth firms.
While many countries are making serious efforts to support entrepreneurship, results appear to vary. Countries want to understand the determinants of and obstacles to entrepreneurship, and they need to analyse the effectiveness of different policy approaches. The lack of internationally comparable empirical evidence has however constrained our understanding of entrepreneurship and many questions remain unanswered. Ultimately, policy making must be guided, as far as possible, by evidence and facts. To tackle these issues, the OECD, in association with Eurostat and many others, has undertaken to build a new, and more robust, international knowledge base.

6 – MEASURING ENTREPRENEURSHIP: A DIGEST OF INDICATORS
©OECD 2008
The OECD-Eurostat Entrepreneurship Indicator Programme (EIP)
Over the past ten years, the OECD has addressed entrepreneurship issues in various analyses and reports. While these studies compiled relevant data to support specific research or policy tasks, no effort was made to establish an ongoing database of entrepreneurship across OECD countries. In 2004, the 2nd OECD Ministerial Conference on SMEs in Istanbul, “Promoting Entrepreneurship and Innovative SMEs in a Global Economy”, concluded that the statistical base for entrepreneurship research was weak and urged the OECD to develop “a robust and comparable statistical base on which SME policy can be developed”.
The OECD launched the Entrepreneurship Indicators Programme (EIP) in 2006 in order to build internationally comparable statistics on entrepreneurship and its determinants. In 2007, Eurostat joined forces with the OECD to create a joint OECD-Eurostat EIP, and work began with the development of standard definitions and concepts as a basis for the collection of empirical data.
Entrepreneurship is a multifaceted concept that manifests itself in many different ways, with the result that various definitions have emerged and no single definition has been generally agreed upon. Several definitions have an essentially theoretical basis and are not concerned with measurement. Another strand of research has largely bypassed the question of definition by “defining” entrepreneurship in terms of a specific empirical measure, such as self-employment or the number of small firms. Not surprisingly, these are measures that are readily available.
The OECD-Eurostat approach has tried to combine the more conceptual definitions of entrepreneurship with (available) empirical indicators. Building on the theoretical contributions of Richard Cantillon, Adam Smith, Jean Baptiste Say, Alfred Marshall, Joseph Schumpeter, Israel Kirzner and Frank Knight, among others,1 the following definitions were established:
Entrepreneurs are those persons (business owners) who seek to generate value through the creation or expansion of economic activity, by identifying and exploiting new products, processes or markets.
Entrepreneurial activity is enterprising human action in pursuit of the generation of value through the creation or expansion of economic activity, by identifying and exploiting new products, processes or markets.
Entrepreneurship is the phenomenon associated with entrepreneurial activity.
Given the multifaceted nature of entrepreneurship and the myriad factors that may affect it, establishing a realistic yet relevant set of measures to be produced as core entrepreneurship indicators was a major challenge. Inspired by a number of previous scholarly and policy-oriented studies, a simple entrepreneurship model was
1. For an overview, see N. Ahmad and R. Seymour (2008), “Defining Entrepreneurial Activity: Defining
Supporting Frameworks for Data Collection”, OECD Statistics Working Paper.

MEASURING ENTREPRENEURSHIP: A DIGEST OF INDICATORS – 7
© OECD 2008
proposed as a first step towards establishing a framework for the development of empirical indicators that are both relevant and available.2
The first stage of this model (Figure 1) comprises various determinants which policy can affect and which in turn influence entrepreneurial performance, or the amount and type of entrepreneurship that takes place. The final stage is the impact of entrepreneurship on higher-level goals such as economic growth, job creation or poverty reduction. Within each of the three main stages of this model, several sub-categories are identified to flesh out the overall framework and guide the selection of indicators. While the entrepreneurship framework is presented here in a linear fashion, it was explicitly recognised that there are complex relationships among the different main components and subcomponents.
Figure 1.Topic categories for entrepreneurship indicators
Culture
Other indicators of
entrepreneurial performancePoverty reduction
Economic growth
DeterminantsEntrepreneurial
performanceImpact
Regulatory
framework
R&D and
technology
Entrepreneurial
capabilitiesFirm-based indicators Job creation
Access to
financeMarket conditions Employment-based indicators
The goal of the Entrepreneurship Indicators Programme was to establish a framework of relevant indicators for the study of entrepreneurship and to encourage countries to use the definitions, methodologies and classifications of the framework as much as possible when producing the data. Because the 2005 Feasibility Study on Entrepreneurship Indicators revealed that no OECD country National Statistics Office (NSO) explicitly included “entrepreneurship statistics” within it programme, the EIP sought to change that by involving the NSOs in designing the specifications for the relevant variables and by engaging them in the production of data. As a result, National Statistics Offices from several countries have engaged in the collection of data.
Given the multi-faceted nature of entrepreneurship, the EIP does not propose any single measure as a key to understanding and comparing the amount and type of entrepreneurship that takes place across countries. Since entrepreneurship is a very broad phenomenon which encompasses, for example, virtually all new firm creation, it is very important for policy analysts to be able to understand and distinguish different types of entrepreneurial performance.
The rationale for developing entrepreneurship indicators is to help policy makers to understand how the policies they put in place or adjust will affect entrepreneurship and, eventually, higher-level objectives for the economy and society. In order for countries to benefit from the experience of others, it is also essential that the entrepreneurship indicators allow for comparisons across countries by type of entrepreneurship.
2. N. Ahmad and A. Hoffmann (2008), “A Framework for Addressing and Measuring Entrepreneurship”, OECD
Statistics Working Paper.

8 – MEASURING ENTREPRENEURSHIP: A DIGEST OF INDICATORS
©OECD 2008
Results of the First Round of Empirical Data Collected under the EIP
In the first stage, data collection focused mainly on indicators of entrepreneurial performance in terms of firms, employment, turnover, value added and exports. The list of entrepreneurial performance indicators (Figure 2) includes a number of measures, each of which targets, to varying degrees, different aspects of entrepreneurship and different types of entrepreneurs. For example, while the list includes the rate of business ownership in an economy, including the self-employed, high priority is also placed on measuring the creation of firms with employees, the number of high-growth firms, and the number of young, high-growth firms (gazelles). One might view these indicators as reflecting the evolution of entrepreneurship on a scale of economic importance: high-growth firms require the creation of a firm, typically with employees, and many firms with employees started out initially as individual traders.
Figure 2. Core indicators of entrepreneurial performance
Employer firm birth rateHigh-growth firm rate by
employmentHigh-growth firm rate by turnover
Employer firm death rate Gazelle rate by employment Gazelle rate by turnover
Business churn Ownership rate start-ups Value added by young firms
Net business population growth Ownership rate business population Productivity contribution, young firms
Survival rate at 3 and 5 years Employment in 3 and 5 year old firmsInnovation performance, young or small
firms
Proportion 3 and 5 year survival Average firm size after 3 and 5 years Export performance, small firms
Entrepreneurial performance
Firm-based Employment-based Other
Table 1 (page 26) gives an overview of the availability of the different indicators in different countries. In what follows, the definition and the comparability of the most important indicators are discussed together with the main observations. Indicators have been grouped into sections in order to facilitate the discussion.
Section A, “Structural indicators on enterprise population”, sketches the importance of different size classes in terms of enterprises, employment, value added and exports. These indicators can be considered the result of past entrepreneurship, but they also determine the opportunities and boundaries of present and future entrepreneurship.
A.1. Number of enterprises by size class
A.2. Employment by size class
A.3. Value added by size classes
A.4. Export by size class

MEASURING ENTREPRENEURSHIP: A DIGEST OF INDICATORS – 9
© OECD 2008
Section B, “Entrepreneurial performance”, presents many of the core indicators listed in Figure 2. It shows the entrepreneurial performance of various countries as reflected in different measures of entrepreneurship, notably those relating to high-growth firms and gazelles. Other manifestations of performance are also displayed, such as birth, death and survival rates of employer firms.3 As these are the EIP’s first round results, the information only concerns one year; in future years, it will be possible to include longitudinal analyses of entrepreneurial performance.
B.5. Birth rates of employer firms
B.6. Death rates of employer firms
B.7. Survival rates of employer firms – one year
B.8. Share of 1 year old employer firms in population
B.9. Importance of high growth firms – employment
B.10. Importance of high growth firms – turnover
B.11. Importance of gazelles – employment
B.12. Importance of gazelles – turnover
Section C, “Determinants and impacts of entrepreneurship”, is a first attempt to show the interdependencies of the different stages of the proposed entrepreneurship framework (Figure 1). Entrepreneurial performance is linked to individual entrepreneurial determinants and impacts as a way to seek possible statistical regularities across countries. However, it should be stressed that more refined analysis is necessary to disentangle the precise relationships between entrepreneurial determinants, performance and impacts.
C.13. Determinants of enterprise birth
C.14. Determinants of high-growth enterprises
C.15. Employment creation and destruction – firm births and deaths
C.16. Business churn rate and productivity growth
The graphs in the following pages present these indicators of entrepreneurship across countries. They give interesting information but should not be understood to rank individual countries in terms of their level of entrepreneurship. Indeed, one of the main observations arising from the empirical evidence is the difference in countries’ entrepreneurial regimes and thus the need for a differentiated analysis controlling for differences between countries, industries and enterprises.
3. As Table 1 shows, indicators are also available for the total number of enterprises (including enterprises
with 0 employees), but for reasons of clarity and because of the assumed importance of employer firms for future growth performance, the discussion here focuses solely on employer firms.

10 – MEASURING ENTREPRENEURSHIP: A DIGEST OF INDICATORS
©OECD 2008
A. STRUCTURAL INDICATORS ON ENTERPRISE POPULATION
Definitions An enterprise is a legal entity possessing the right to conduct business on its own, for example to enter into contracts, own property, incur liabilities for debts and establish bank accounts. It may consist of one or more local units or establishments corresponding to production units situated in a geographically separate place and in which one or more persons work for the enterprise to which they belong.
The total number of persons engaged is defined as the total number of persons who worked in or for the concerned unit during the reference year.
Total employment excludes directors of incorporated enterprises and members of shareholders’ committees who are paid solely for their attendance at meetings, labour force made available to the concerned unit by other units and charged for, persons carrying out repair and maintenance work in the unit on the behalf of other units, and home workers. It also excludes persons on indefinite leave, military leave or those whose only remuneration from the enterprise is by way of a pension.
Comparability
All countries present information using the enterprise as the statistical unit except Japan, Korea and the United States, which use establishments. This may create some lack of comparability but, because most enterprises are also establishments, this is not expected to be significant. An area in which considerable differences can and do arise, however, is the coverage of data on enterprises/ establishments. In many countries, this information is based on business registers, economic censuses or surveys that may have a size-class cut-off. Indeed, all countries have thresholds of one sort or another, depending, often, on the tax legislation and permissible business burdens in place across countries. For Ireland, only enterprises with three or more persons engaged are covered, while the data for Japan and Korea do not include establishments with fewer than four and five persons engaged, respectively (for information, see OECD SDBS database).
Enterprises that operate purely in the underground economy will naturally be very difficult, if not impossible, to capture, and these are most likely to be small. However, despite these differences, it is possible to make sensible comparisons across countries.
The size class breakdown used provides for the best comparability across countries given the varying data collection practices across countries. Some countries use slightly different conventions. Data shown for “20-49” actually refer to “20-99” for the United States; data shown for “50-249” actually refer to “50-199” for Australia and Korea, “50-99” for New Zealand and “100-499” for the United States; data shown for “250+” actually refer to “200+” for Australia and Korea, “100+” for New Zealand and “500+” for the United States.
Data typically refer to the total market economy excluding financial intermediation (ISIC 65-67), but for the “Number of enterprises” it also excludes Mining, Electricity, gas and water supply for Belgium, Finland, Greece, Hungary, Ireland and Norway, while for “Employment”, it also excludes Mining, Electricity, gas and water supply for Austria, Belgium, Denmark, Finland, Ireland, Japan, Korea, Luxembourg, Portugal and Slovenia. The “Number of establishments” for Korea and Japan refers to Manufacturing only.
Overview
The number of enterprises by size class demonstrates the importance of so-called micro firms: in most countries firms with fewer than ten employees represent three-quarters or more of the employer firm population. In Korea, Japan and the United States their importance seems to be somewhat lower, but this may be due to differences in data collection and coverage. The United States has a very large number of firms with more than 250 employees.
The importance of micro firms is much smaller in terms of employment with a share below 40% in almost all countries. Large firms are responsible for an important share of employment (especially in manufacturing). The employment share of large firms averages between 30 and 40% across countries. The employment share of the middle size classes of firms, especially firms with 10-50 employees, is significantly lower in all countries. This seems in line with the observation in many countries that young entrepreneurial firms face difficulties for attaining higher growth after their first years of existence.
Source
OECD, Structural and Demographic Business Statistics (SDBS), OECD Database.
For further reading
Statistical publication
OECD (2006), Structural and Demographic Business Statistics 1996-2003, 2006 Edition, OECD, Paris.

MEASURING ENTREPRENEURSHIP: A DIGEST OF INDICATORS – 11
© OECD 2008
A.1-A.2 Number of enterprises and employment by size class
Number of enterprises1,2
By size class, 20053
0%
20%
40%
60%
80%
100%
Korea
(4)
Japan
(5)
United St
ates
Slova
k Republic
New Ze
alan
d
Estonia
German
y
Irela
nd (6)
United K
ingd
om
Denmar
k
Austria
Netherla
nds
Icela
nd
Luxe
mbourg
Norway
Spain
Finla
nd
France
Belgium
Slove
nia
Sweden
Portuga
lIta
ly
Hungary
Austra
lia
Czech
Republic
Poland
Greece
1-9 10-19 20-49 50-249 250+
1. Market economy, excluding financial intermediation. Manufacturing sectors only for Japan and Korea. 2. Number of establishments for Japan, Korea and the United States. 3. 2004 for Czech Republic, Greece, Norway, the United Kingdom and the United States. 4. Establishments with 5 or more persons engaged, for manufacturing sectors. 5. Establishments with 4 or more persons engaged. 6. Enterprises with 3 or more persons engaged, for manufacturing sectors.
Employment1
Number of persons engaged, by size class,2 20053
0%
20%
40%
60%
80%
100%
Estonia
Japan
(4)
Slova
k Republic
Korea
(5)
German
y
Denmar
k
Finla
nd
New Ze
alan
d
United K
ingd
om
Irela
nd (6)
Luxe
mbourg
France
Sweden
Austria
Slove
nia
Norway
Netherla
nds
Belgium
Czech
Republic
Hungary
Austra
liaSp
ain
Poland
Portuga
lIta
ly
1-9 10-19 20-49 50-249 250+
1. Market economy, excluding financial intermediation. Manufacturing only for Estonia, Japan and Korea. 2. Number of employees for New Zealand. 3. 2004 for Czech Republic, Norway and the United Kingdom. 4. Establishments with 4 or more persons engaged. 5. Establishments with 5 or more persons engaged, for manufacturing sectors. 6. Enterprises with 3 or more persons engaged, for manufacturing sectors.

12 – MEASURING ENTREPRENEURSHIP: A DIGEST OF INDICATORS
©OECD 2008
A. STRUCTURAL INDICATORS ON ENTERPRISE POPULATION
Definitions
Value added
In very simple terms value added corresponds to the difference between production and any intermediate consumption; the definition used here for intermediate consumption varies, depending on the valuation used for value added.
The valuation of value added can be made according to any of the following: factor costs, basic prices, market prices and producers’ prices, depending on the treatment applied to indirect taxes and subsidies.
Trade
Export data are compiled according to the EU harmonised concept (special trade), including processing. Exports by size classes describes the contribution of enterprises of different sizes to total exports. This allows for analysing the impact of trade on employment.
Comparability
Value added
For the United States, the percentages presented in the charts refer to turnover and not value added, as they are for all other countries (value added at factor costs in the EU countries and value added at basic prices for Australia, Japan and Korea).
All countries present information using the enterprise as the statistical unit except Japan, Korea and the United States, which use establishments.
For Ireland, only enterprises with three or more persons engaged are covered, while the data for Japan and Korea do not include establishments with fewer than four and five persons engaged, respectively.
The size class breakdown used provides for the best comparability across countries given the varying data collection practices across countries. Some countries use slightly different conventions. Data shown for “20-49” actually refer to “20-99” for the United States; data shown for “50-249” actually refer to “50-199” for Australia, and Korea, and to “100-499” for the United States; data shown for “250+” actually refer to “200+” for Australia and Korea, and “500+” for the United States.
Data typically refer to the total market economy excluding financial intermediation (ISIC 65-67), but for a certain number of countries, they also exclude Mining and Electricity, gas and water supply. Data for Luxembourg, Japan and Korea refer to Manufacturing only.
Trade
Data on intra-EU and extra-EU exports are treated separately, owing to different data collection systems and thresholds. Total exports are compiled by adding intra-EU and extra-EU exports. Since the data refer to years before the recent EU enlargement, exports between the pre-enlargement EU countries and the new EU countries are treated as extra-EU exports.
Overview
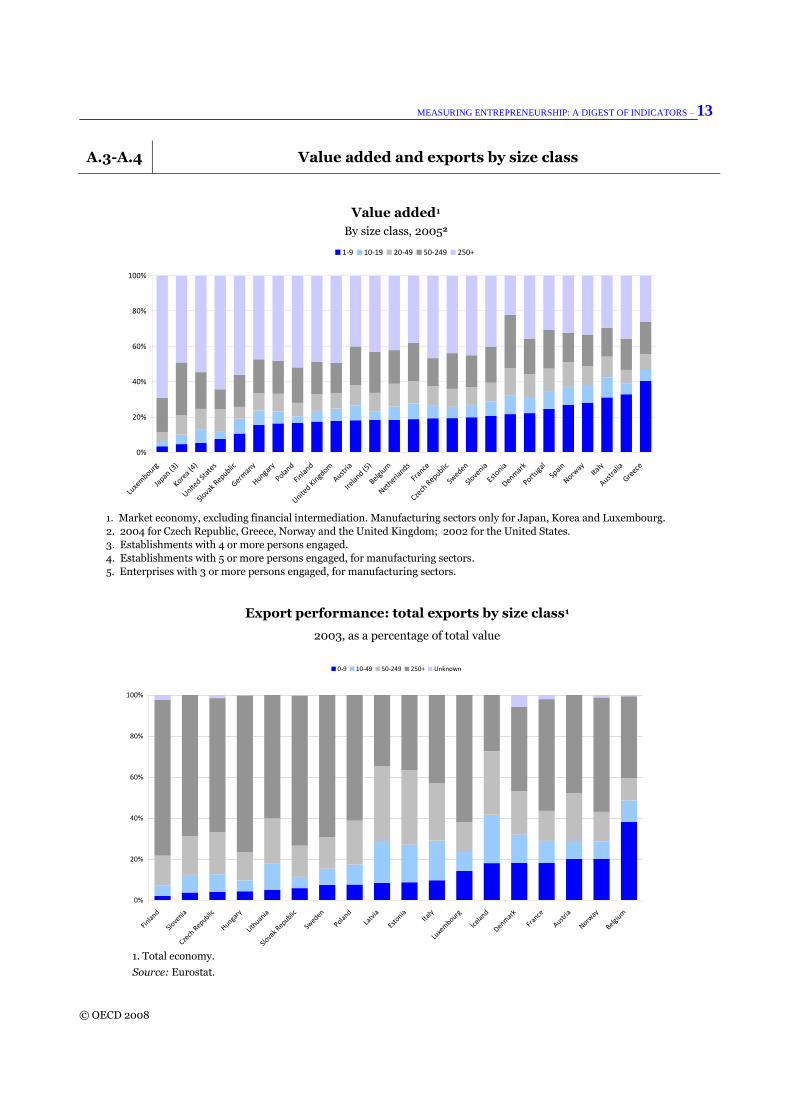
The importance of large firms, i.e. firms with more than 250 employees, is most pronounced in terms of value added and exports. In the majority of countries large firms account for close to 50% of value added; however, in Italy, Spain, Portugal, Greece and Denmark, firms in smaller size classes are responsible for more than half of the value added created in the country, and the group of smallest firms accounts for a major share of the creation of value added in these countries.
Because of the role of scale economies and fixed costs in exporting, micro (1-9 employees) and small (10-49 employees) firms represent only a small share of total exports. Large firms are responsible for the majority of exports in most countries. Previous research has shown that multinational enterprises play a major role, as they often localise production and exporting facilities in one country to service not only that country’s market but also markets in neighbouring countries.
Sources
OECD, Structural and Demographic Business Statistics (SDBS), OECD Database (value added data).
Eurostat (2006), External Trade by Enterprise Characteristics, Methodologies and Working Papers (trade data).
For further reading
Statistical publications
OECD (2006), Structural and Demographic Business Statistics 1996-2003, 2006 Edition, OECD, Paris
Eurostat (2006), External Trade by Enterprise Characteristics, Methodologies and Working Papers (trade data).
OECD (2008), “Linking Trade with Structural Business Statistics: OECD Progress Report”, paper prepared for the Working Party on International Trade in Goods and Trade in Services Statistics, OECD, Paris
MEASURING ENTREPRENEURSHIP: A DIGEST OF INDICATORS – 13
© OECD 2008
A.3-A.4 Value added and exports by size class
Value added1
By size class, 20052
0%
20%
40%
60%
80%
100%
Luxe
mbourg
Japan
(3)
Korea
(4)
United St
ates
Slova
k Republic
German
y
Hungary
Poland
Finla
nd
United K
ingd
om
Austria
Irela
nd (5)
Belgium
Netherla
nds
France
Czech
Republic
Sweden
Slove
nia
Estonia
Denmar
k
Portuga
l
Spain
Norway
Italy
Austra
lia
Greece
1-9 10-19 20-49 50-249 250+
1. Market economy, excluding financial intermediation. Manufacturing sectors only for Japan, Korea and Luxembourg.
2. 2004 for Czech Republic, Greece, Norway and the United Kingdom; 2002 for the United States.
3. Establishments with 4 or more persons engaged.
4. Establishments with 5 or more persons engaged, for manufacturing sectors.
5. Enterprises with 3 or more persons engaged, for manufacturing sectors.
Export performance: total exports by size class1
2003, as a percentage of total value
0%
20%
40%
60%
80%
100%
Finla
nd
Slove
nia
Czech
Republic
Hungary
Lithuan
ia
Slova
k Republic
Sweden
Poland
Latv
ia
Estonia
Italy
Luxe
mbourg
Icela
nd
Denmar
k
France
Austria
Norway
Belgium
0-9 10-49 50-249 250+ Unknown
1. Total economy.
Source: Eurostat.

14 – MEASURING ENTREPRENEURSHIP: A DIGEST OF INDICATORS
©OECD 2008
B. ENTREPRENEURIAL PERFORMANCE
Definition
An employer enterprise birth refers to the birth of an enterprise with at least one employee. This population consists of enterprise births with at least one employee in the birth year and of enterprises that existed before the year under consideration but were below the threshold of one employee.
Symmetrically, an employer enterprise death occurs either as the death of an enterprise with at least one employee in the year of death or as an exit by moving below the threshold of one employee.
The employer enterprise birth and death rates are compiled as the number of births and deaths of employer enterprises, respectively, as a percentage of the population of active enterprises with at least one employee.
These indicators are an essential measurement of entrepreneurial activity.
Comparability
“Employer” indicators are found to be more relevant for international comparisons than indicators covering all enterprises, as these are sensitive to the coverage of business registers.
In the EU, in theory, all enterprises should be included on the register and so, again in theory, enterprise births should be comparable. However, this is not the case for non-EU countries. Indeed, even in EU countries, in practice, not all enterprises are included, as all countries operationalise some size threshold or another when a business appears on the business register, meaning that there will be international differences, typically in the coverage of smaller enterprises.
Even employer enterprise birth is not without problems. Many countries have sizeable populations of self-employed. If a particular country creates incentives for the self-employed to become employees of their own company the total numbers of employer enterprise births will increase. While it is arguable that, from an economic and entrepreneurial perspective, little has changed, this can distort comparisons over time and of course across countries.
Overview
Overall birth rates are fairly similar across countries; a surprising observation may be the lower birth rate in the United States than in Europe, as it is generally thought that firm creation is especially high in the United States. High birth rates are observed in Eastern European countries (Romania, Estonia, Lithuania and the Slovak Republic). This may be related to the strong growth of these economies and the corresponding economic restructuring in recent years after accession to the EU.
A second observation is that birth rates in the services sector are higher than in manufacturing industry. This observation is valid for all countries. Birth rates in the services sector are on average 4 to 5% higher than in manufacturing.
The more dynamic character of services is also demonstrated in its higher death rates relative to manufacturing. In contrast with birth rates, there seem to be larger differences in death rates across countries.
On average, birth rates in the services sector are higher than death rates, resulting in a net creation of employer firms. For manufacturing industry, the picture is more mixed; in some countries death rates are higher than birth rates. In Eastern Europe countries birth rates are much higher than death rates, suggesting an important Schumpeterian process of structural change.
Source
OECD, Structural and Demographic Business Statistics (SDBS), OECD Database.
For further reading
Statistical publication
OECD (2006), Structural and Demographic Business Statistics 1996-2003, 2006 Edition, OECD, Paris.
Methodological publications
Eurostat/OECD (2007), Eurostat-OECD Manual on Business Demography Statistics, OECD, Paris.
Ahmad, N. (2006), A Proposed Framework for Business Demography Statistics, OECD, Paris

MEASURING ENTREPRENEURSHIP: A DIGEST OF INDICATORS – 15
© OECD 2008
B.5-B.6. Employer enterprise births and deaths
Employer enterprise birth and death rates in manufacturing1
As a percentage of the population of active enterprises with at least one employee
0
2
4
6
8
10
12
14
16
18
Austria
Italy
Spain
Netherla
nds
Denmark
Luxe
mbourg
Canada (2)
Finland
Hungary
United St
ates (
3)
Latv
ia
New Zeala
nd
Estonia
Bulgaria
Czech
Republic
Lithuania
Slova
k Republic
Romania
Employer birth rate (2005) Employer death rate (2004)
1.Mining and quarriyng; Manufacturing; Electricity, gas and water.
2. Employer enterprises with fewer than 250 employees.
3. 2004 for birth rate.
Employer enterprise birth and death rates in services1
As a percentage of the population of active enterprises with at least one employee
0
2
4
6
8
10
12
14
16
18
Italy
Austria
United St
ates (
2)
Canad
a (3)
Netherla
nds
Finlan
d
Latv
ia
Bulgaria
Hungary
Luxe
mbourg
Czech
Republic
Spai
n
Lithuan
ia
Denmar
k
New Zeal
and
Estonia
Slova
k Republic
Roman
ia
Employer birth rate (2005) Employer death rate (2004)
1. Wholesale and retail trade; Hotels and restaurants; Transport, storage and communications; Financial intermediation;
Real estate, renting and business activities.
2. 2004 for birth rate.
3. Employer enterprises with fewer than 250 employees.

16 – MEASURING ENTREPRENEURSHIP: A DIGEST OF INDICATORS
©OECD 2008
B. ENTREPRENEURIAL PERFORMANCE
Definition
The number of n-year survival enterprises for a particular year (t) refers to the number of enterprises with at least one employee for the first time in year (t-n) which had not died in year (t).
An enterprise is also considered to have survived if the linked legal unit(s) has(ve) ceased to be active, but their activity has been taken over by a new legal unit set up specifically to take over the factors of production of that enterprise (survival by take-over).
This definition of survival excludes cases in which enterprises merge or are taken over by an existing enterprise in year (t-n).
The survival of an enterprise is an event that should always be observed between two consecutive years. For instance, an enterprise born in year (t-2) should be considered as having survived to (t) only if it was active also in year (t-1), and so forth.
The n-year survival rate for a particular year (t) refers to the number of n-year survival enterprises as a percentage of all enterprises with at least one employee for the first time in year (t-n).
The share of n-year-old employer firms for a particular year (t) refers to the number of n-year survival enterprises as a percentage of the total enterprise population in year (t).
Comparability
“Employer” indicators are found to be more relevant for international comparisons than indicators covering all enterprises, as these are sensitive to the coverage of business registers.
Owing to the recent start of the collection of entrepreneurship indicators, only one-year survival rates are presented, i.e. survival rates for the cohort of employer firms started in 2004. Further rounds of data collection will allow for further survival rates (one-year, two-year, etc.).
Overview
Survival indicators are important as they give a first indication of the performance of newly born firms. The one-year survival rate shows that a significant number of the new employer firms already exited in the following year: in the Netherlands for example 40% of new firms disappear during the first year after their birth. In other countries, the death rate seems smaller: the one-year survival rate varies between 75 and 90%.
Survival rates seem to be slightly higher in manufacturing, which may be due to the typically higher entry (and exit) costs; the smaller entry and exit costs in the services sector allow more readily for trial and error (e.g. active and passive learning, experimentation).
The importance (in terms of number of firms) of the group of one-year old firms is especially significant in the services sector. In Italy, the Czech Republic, Luxembourg, Hungary and Romania, one-year-old firms represent 10% or more of all employer firms active in services industries.
The lesser importance of one-year old firms in manufacturing industry may be related to lower birth rates in these industries and higher survival rates (resulting in more active firms).
Source
OECD, Structural and Demographic Business Statistics (SDBS), OECD Database.
For further reading
Statistical publication
OECD (2006), Structural and Demographic Business Statistics 1996-2003, 2006 Edition, OECD, Paris.
Methodological publications
Eurostat, OECD (2007), Eurostat-OECD Manual on Business Demography Statistics, OECD, Paris.
Ahmad, N. (2006), A Proposed Framework for Business Demography Statistics, OECD, Paris.

MEASURING ENTREPRENEURSHIP: A DIGEST OF INDICATORS – 17
© OECD 2008
B.7-B.8 Survival rates and share of enterprises by age (one year)
One-year survival rate, 2005
As a percentage of the 2004 population of employer enterprise births
0
10
20
30
40
50
60
70
80
90
100
Netherla
nds
Bulgaria
Hungary
New Ze
aland
Finla
nd
Denmar
k
United St
ates (
3)
Austria
Spai
n
Estonia
Czech
Republic
Italy
Canad
a (4
)
Roman
ia
Luxe
mbourg
Lithuan
ia
Slova
k Republic
Latv
ia
Manufacturing (1) Services (2)
1. Mining and quarrying; Manufacturing; Electricity, gas and water (ISIC Rev.3 10-41).
2. Wholesale and retail trade; Hotels and restaurants; Transport, storage and communications; Financial intermediation; Real estate, renting and business activities (ISIC Rev.3 50-74).
3. Two-year survival rate.
4. Employer enterprises with fewer than 250 employees.
Share of one-year-old employer enterprises, 2005
As a percentage of the total population of employer enterprises
0
2
4
6
8
10
12
14
16
18
20
Netherla
nds
Slova
k Republic
Bulgaria
Finlan
d
Austria
United St
ates (
3)
Latv
ia
Canad
a (4)
Denmar
k
Lithuan
ia
Estonia
Spai
n
New Zeal
and
Italy
Luxe
mbourg
Czech
Republic
Hungary
Roman
ia
Manufacturing (1) Services (2)
1. Mining and quarrying; Manufacturing; Electricity, gas and water (ISIC Rev.3 10-41).
2. Wholesale and retail trade; Hotels and restaurants; Transport, storage and communications; Financial intermediation; Real estate, renting and business activities (ISIC Rev.3 50-74).
3. Share of two-year-old employer enterprises.
4. Employer enterprises with fewer than 250 employees.

18 – MEASURING ENTREPRENEURSHIP: A DIGEST OF INDICATORS
©OECD 2008
B. ENTREPRENEURIAL PERFORMANCE
Definition
High-growth enterprises as measured by employment (or by turnover) are all enterprises with average annualised growth in employees (or in turnover) greater than 20% a year, over a three-year period, and with ten or more employees at the beginning of the observation period.
The share of high-growth enterprises is compiled as the number of high-growth enterprises as a percentage of the population of enterprises with ten or more employees.
Comparability
A size threshold (ten employees) was set to avoid having the growth of small enterprises distort the picture. On the other hand, the size threshold had to be low enough to avoid excluding too many enterprises.
The size threshold of ten or more employees holds for both the turnover and employment measures. The advantage is that the initial population is the same, regardless of whether growth is measured in employment or turnover. Moreover, it would be difficult to apply a consistent turnover threshold across all countries.
Overview
High-growth enterprises have recently received a lot of attention in some countries (e.g. Denmark), since high birth rates do not always result in higher growth at the aggregate level. Previous research has shown that a large share of newly born enterprises experience major difficulties for attaining higher levels of growth after their first years of establishment.
Enterprises appear to grow faster in terms of turnover than of employment, as witnessed by the significantly higher shares of high-growth enterprises for which high growth is defined in terms of turnover. The share of high-growth enterprises whose high growth is defined in terms of turnover averages around 10% across countries, while the share of high-growth enterprises defined in terms of employment is below 5% except in Latvia, Bulgaria and the Czech Republic.
Another observation is that high growth in manufacturing industries is due more to turnover than to employment. In the services sector also, high growth is more prominent in turnover than in employment but the difference is much smaller.
High-growth enterprises seem to be somewhat more important in Eastern Europe; this again is probably related to these countries’ rapid economic growth and suggests the existence of different entrepreneurial regimes across countries. In Romania, however, the very low shares of high-growth enterprises contrast with the country’s very high birth rates. This suggests that many new enterprises are created but do not necessarily grow strongly afterwards (or stay below the ten employees threshold).
Source
OECD, Structural and Demographic Business Statistics (SDBS), OECD Database.
For further reading
Analytical publications
Ahmad, N. and D. Rude Petersen (2007), High-Growth Enterprises and Gazelles – Preliminary and Summary Sensitivity Analysis, OECD-FORA, Paris.
Hoffmann, A. and M. Junge (2006), “Comparing the Number of High-growth Entrepreneurs across 17 Countries”, FORA Working Paper.
Statistical publication
OECD (2006), Structural and Demographic Business Statistics 1996-2003, 2006 Edition, OECD, Paris.
Methodological publications
Ahmad, N. and E. Gonnard, (2007), “High-growth Enterprises and Gazelles”, paper prepared for the International Consortium on Entrepreneurship (ICE), Copenhagen, Denmark.
Eurostat, OECD (2007), Eurostat-OECD Manual on Business Demography Statistics, OECD, Paris.
Ahmad, N. (2006), A Proposed Framework for Business Demography Statistics, OECD, Paris.
Web site
The OECD Entrepreneurship Indicators Programme: Workshop on the Measurement of High-growth Enterprises, 19 November 2007, Paris, www.oecd.org/document/31/0,3343,en_2649_34233_39151327_1_1_1_100.html.

MEASURING ENTREPRENEURSHIP: A DIGEST OF INDICATORS – 19
© OECD 2008
B.9-B.10 High-growth enterprises
Share of high-growth enterprises (employment definition), 2005
As a percentage of all enterprises with ten employees or more
0
1
2
3
4
5
6
7
8
9
10
Roman
ia
Slova
k Republic
Canad
a (3)
Denmar
k
Finlan
d
New Ze
alan
dIta
ly
Luxe
mbourg
Spai
n
Netherla
nds
Hungary
United St
ates
Czech
Republic
Latv
ia
Estonia
Bulgaria
Lithuan
ia
Manufacturing (1) Services (2)
1. Mining and quarrying; Manufacturing; Electricity, gas and water (ISIC Rev.3 10-41).
2. Wholesale and retail trade; Hotels and restaurants; Transport, storage and communications; Financial intermediation; Real estate, renting and business activities (ISIC Rev.3 50-74).
3. Employer enterprises with fewer than 250 employees.
Share of high-growth enterprises (turnover definition), 2005
As a percentage of all enterprises with ten employees or more
0
5
10
15
20
25
Slova
k Republic
Roman
ia
Canad
a (3)
Italy
Luxe
mbourg
Czech
Republic
Denmar
k
Netherla
nds
Hungary
Finlan
d
Bulgaria
Estonia
Lithuan
ia
Latv
ia
Manufacturing (1) Services (2)
1. Mining and quarrying; Manufacturing; Electricity, gas and water (ISIC Rev.3 10-41).
2. Wholesale and retail trade; Hotels and restaurants; Transport, storage and communications; Financial intermediation; Real estate, renting and business activities (ISIC Rev.3 50-74).
3. Employer enterprises with fewer than 250 employees.

20 – MEASURING ENTREPRENEURSHIP: A DIGEST OF INDICATORS
©OECD 2008
B. ENTREPRENEURIAL PERFORMANCE
Definition
Gazelle enterprises are a subset of high-growth enterprises; they are the high-growth enterprises born five years or less before the end of the three-year observation period.
In other words, measured in terms of employment (or of turnover) gazelles are enterprises which have been employers for a period of up to five years, with average annualised growth in employees (or in turnover) greater than 20% a year over a three-year period and with ten or more employees at the beginning of the observation period.
As in the case of high-growth enterprises generally, the share of gazelles is compiled as the number of gazelles as a percentage of the population of enterprises with ten or more employees.
Comparability
A size threshold (ten employees) was set to avoid having the growth of small enterprises distort the picture. On the other hand, the size threshold had to be low enough to avoid excluding too many enterprises.
The size threshold of ten or more employees holds for both the turnover and employment measures. The advantage is that the initial population is the same, regardless of whether growth is measured in employment or turnover. Moreover, it would be difficult to apply a consistent turnover threshold across all countries.
Overview
The number of young high-growth firms (gazelles) is quite small, an observation that is valid for all countries. Except for Latvia, Lithuania and Bulgaria, the share of gazelles is less than 1% in manufacturing and services when high growth is measured in terms of employment and less than 2% when measured in terms of turnover.
On average, the group of gazelles represents some 15 to 20% of the larger group of high-growth enterprises. The lesser importance of gazelles (especially in terms of employment) may cast some doubt on assertions that gazelles are responsible for the majority of job creation in various countries.
More detailed analysis is however needed to identify the contributions of high-growth enterprises in general and gazelles in particular to aggregate employment growth in national economies. It should be noted that the indicators presented show only the importance of gazelles in the number of enterprises.
Compared to high-growth enterprises, the importance of gazelles appears more heterogeneous across countries. Nevertheless, several observations about high-growth enterprises also hold for gazelles.
First, gazelles are more important when high growth is defined in terms of turnover rather than employment.
Second, high growth in young manufacturing firms is more likely to occur in terms of turnover, while in services high growth in gazelles occurs in terms both of employment and turnover.
Third, gazelles are more prominent in Eastern European countries characterised by strong economic growth. Romania again seems to be an exception.
Source
OECD, Structural and Demographic Business Statistics (SDBS), OECD Database.
For further reading
Analytical publications
Ahmad, N. and D. Rude Petersen (2007), High-growth Enterprises and Gazelles – Preliminary and Summary Sensitivity Analysis, OECD-FORA, Paris.
Hoffmann, A. and M. Junge (2006), “Comparing the Number of High-growth Entrepreneurs across 17 Countries”, FORA Working Paper.
Statistical publications
OECD (2006), Structural and Demographic Business Statistics 1996-2003, 2006 Edition, OECD, Paris.
Methodological publications
Ahmad, N. and E. Gonnard, (2007), “High-growth Enterprises and Gazelles”, paper prepared for the International Consortium on Entrepreneurship (ICE), Copenhagen, Denmark.
Eurostat, OECD (2007), Eurostat-OECD Manual on Business Demography Statistics, OECD, Paris.
Ahmad, N. (2006), A Proposed Framework for Business Demography Statistics, OECD, Paris.
Web site
The OECD Entrepreneurship Indicators Programme: Workshop on the Measurement of High-growth Enterprises, 19 November 2007, Paris, www.oecd.org/document/31/0,3343,en_2649_34233_39151327_1_1_1_1,00.html.

MEASURING ENTREPRENEURSHIP: A DIGEST OF INDICATORS – 21
© OECD 2008
B.11-B.12 Gazelles
Share of gazelles (employment definition), 2005
As a percentage of all enterprises with ten employees or more
0
0.2
0.4
0.6
0.8
1
1.2
1.4
1.6
1.8
2
Roman
ia
Netherla
nds
Czech
Republic
Canad
a (3
)
Slova
k Republic
United St
ates
New Ze
aland (4
)Ita
ly
Spai
n
Denmar
k
Finla
nd
Hungary
Luxe
mbourg
Latv
ia
Estonia
Lithuan
ia
Bulgaria
Manufacturing (1) Services (2)
1. Mining and quarrying; Manufacturing; Electricity, gas and water (ISIC Rev.3 10-41).
2. Wholesale and retail trade; Hotels and restaurants; Transport, storage and communications; Financial intermediation; Real estate, renting and business activities (ISIC Rev.3 50-74).
3. 2006. Employer enterprises with fewer than 250 employees.
4. 2007.
Share of gazelles (turnover definition), 2005
As a percentage of all enterprises with ten employees or more
0
0.5
1
1.5
2
2.5
3
3.5
4
Slova
k Republic
Czech
Republic
Roman
ia
Netherla
ndsIta
ly
Canad
a (3
)
Luxe
mbourg
Hungary
Denmar
k
Estonia
Finla
nd
Lithuan
ia
Latv
ia
Bulgaria
Manufacturing (1) Services (2)
1. Mining and quarrying; Manufacturing; Electricity, gas and water (ISIC Rev.3 10-41).
2. Wholesale and retail trade; Hotels and restaurants; Transport, storage and communications; Financial intermediation; Real estate, renting
and business activities (ISIC Rev.3 50-74).
3. 2006. Employer enterprises with fewer than 250 employees.

22 – MEASURING ENTREPRENEURSHIP: A DIGEST OF INDICATORS
©OECD 2008
C. DETERMINANTS AND IMPACTS OF ENTREPRENEURSHIP
Definition
Product market regulation (PMR) measures the degree to which policies promote or inhibit competition in areas of the product market in which competition is viable. The administrative burden for start-ups measures the number of formalities and corresponding delays for starting up a company.
Business enterprise expenditure on R&D (BERD) covers R&D activities carried out in the business sector by performing firms and institutes, regardless of the origin of funding.
Tertiary educational attainment shows the percentage of the population aged 25-64 having obtained a tertiary degree.
Venture capital is equity capital provided through formal, professionally organised and managed funds to co-finance, with the founder or entrepreneur, an early stage or expansion stage venture.
Comparability
Indicators on product market regulation, R&D and tertiary educational attainment are comprehensive and internationally comparable sets of indicators published by the OECD.
Venture capital data presented here are provided by various sources, which use different classifications of the “stage of development”.
Overview Correlating indicators of entrepreneurial determinants and performance across countries offers initial confirmation of the theoretical insights developed in the proposed framework. However, identifying the empirical relationships between determinants and performance calls for detailed analysis. A scatter plot of enterprise births tends to suggest that high administrative burdens discourage enterprise birth, although the relationship is not explicit. This confirms previous findings that administrative burdens are only one determining factor. Business R&D investment in smaller firms appears, perhaps surprisingly, more closely related to birth rates. The positive relation indicates some interaction between the different indicators, but more analysis is needed to show a possible causal relation and its direction. A look at entrepreneurial determinants specifically for high-growth enterprises shows that a positive relation seems to exist between investments in venture capital and high-growth enterprises. However, in countries such as the Czech Republic and Hungary, venture capital is not really related to high growth, again suggesting the existence of different entrepreneurial
regimes between countries. The link with entrepreneurial capabilities (measured in terms of attainment of tertiary education) is less clear, even though the supply of human skills is assumed to be an important determinant of high growth. The relationships between entrepreneurial determinants and performance may be clouded for several reasons: empirical indicators only measure part of the theoretical determinants, it takes time for the effects to materialise; determinants may only have an indirect effect on entrepreneurial performance; the effects may depend on enterprises reaching a certain threshold and/or differ between industries; other mechanisms may play a more important role (e.g. the strong economic expansion in Eastern European countries), etc.
Sources
OECD, Market Regulation database, October 2007.
OECD, R&D database, May 2007.
OECD, Education at a Glance, 2007
OECD, Entrepreneurship Finance Database (EFD), based on data from Thomson Financial, PwC, EVCA, LVCA and national Venture Capital Associations.
Structural and Demographic Business Statistics (SDBS), OECD database.
For further reading
Analytical publication
OECD (2007), OECD Science, Technology and Industry: Scoreboard 2007, OECD, Paris.
Statistical publications
Davis, T., E. Gonnard and P. Sicari (2008), “Report on the Data Track of the ICE Risk Capital Project”, OECD, Paris.
OECD (2006), Structural and Demographic Business Statistics 1996-2003, 2006 Edition, OECD, Paris.
Methodological publications
OECD (2002), Frascati Manual: Proposed Standard Practice for Surveys on Research and Experimental Development, OECD, Paris, available at: www.oecd.org/document/6/0,3343,en_2649_34451_33828550_1_1_1_1,00.html.
Ahmad, N. and E. Gonnard, (2007), “High-growth Enterprises and Gazelles”, paper prepared for the International Consortium on Entrepreneurship (ICE), Copenhagen, Denmark.
Eurostat/OECD (2007), Eurostat-OECD Manual on Business Demography Statistics, OECD, Paris.

MEASURING ENTREPRENEURSHIP: A DIGEST OF INDICATORS – 23
© OECD 2008
C.13-C.14 Determinants of enterprise birth and high growth
Regulatory framework R&D and technology
Hungary
FinlandNetherlands
Czech Republic
Spain
New Zealand
Austria
Denmark
United States
Italy
Canada
Slovak Republic
Luxembourg
8
9
10
11
12
13
14
15
0 0.5 1 1.5 2 2.5 3
Administrative burden for start-ups 2003 (2)
Employer enterprise birth rate , 2005 (1), %
United States
Italy
Hungary
FinlandNetherlands
Canada
Spain
New Zealand
Austria
Czech Republic
Slovak Republic
Denmark
8
9
10
11
12
13
14
15
0 20 40 60 80
SME share of business R&D, 2005 (2), %
Employer enterprise birth rate, 2005 (1) , %
1. 2004 for the United States 2. Source: OECD Indicators of Product Market Regulation (PMR)
1. 2004 for the United States 2. 2004 for Austria and Canada; 2003 for Denmark, Italy and Netherlands.
Entrepreneurial capability Access to finance
CanadaNetherlands
Czech Republic
Italy
Hungary
United States
New Zealand
Luxembourg
Finland
Slovak Republic
Spain
Denmark
2
2.5
3
3.5
4
4.5
5
5.5
6
10 20 30 40 50
Tertiary educational attainment (1), 2005, %
Share of high-growth enterprises, 2005, %
New Zealand
Canada
Finland
United States
Slovak Republic
Czech Republic
Hungary
Italy
Netherlands
Spain
Denmark
2
2.5
3
3.5
4
4.5
5
5.5
6
0 0.05 0.1 0.15 0.2
Venture capital, 2003 (1), % of GDP
Share of high-growth enterprises, 2005, %
1. Source: OECD Education at a Glance 2007.
1. 2006 for New Zealand

24 – MEASURING ENTREPRENEURSHIP: A DIGEST OF INDICATORS
©OECD 2008
C. DETERMINANTS AND IMPACTS OF ENTREPRENEURSHIP
Definitions
Employment creation and destruction
Creation of employment is measured as the number of persons employed in the reference period (t) in enterprises newly born in (t) divided by the number of persons employed in (t) in the stock of active enterprises. Symmetrically, the destruction of employment is measured as the number of persons employed in the reference period (t) in exiting enterprises divided by the number of persons employed in (t) in the stock of active enterprises.
Churn rate
The churn rate expresses the sum of employer enterprise births and deaths as a percentage of the population of active enterprises. This is an indicator of the structural dynamics of an economy, which (potentially) gives rise to “creative destruction”.
Labour productivity growth
The output measures used for the calculations are the gross domestic estimates from the OECD Annual National Accounts database, based on the 1993 System of National Accounts. Labour input measures used are estimates of hours actually worked. They reflect regular hours worked by full-time and part-time workers, paid or unpaid overtime, hours worked because of public holidays, annual paid leaves, strikes and labour disputes, bad weather, economic conditions and other reasons.
Comparability
“Employer” indicators are more relevant for international comparisons than indicators covering all enterprises, as these are sensitive to the coverage of business registers.
The OECD and national statisticians work together to ensure that the data on hours worked are as comparable as possible although based on a range of sources of varying reliability. In most countries, data come from household labour force surveys; the others use establishment surveys, administrative sources or a combination of sources (for more specific information see the OECD Compendium of Productivity Indicators).
Although GDP estimates are based on common definitions, the methods used by most countries to estimate value added in government services assume zero labour productivity growth. This means that countries with large government sectors or with government sectors that were growing during the period considered will, by assumption, have lower growth in GDP per hour worked than other countries. In the charts, the OECD aggregate excludes Poland and Turkey.
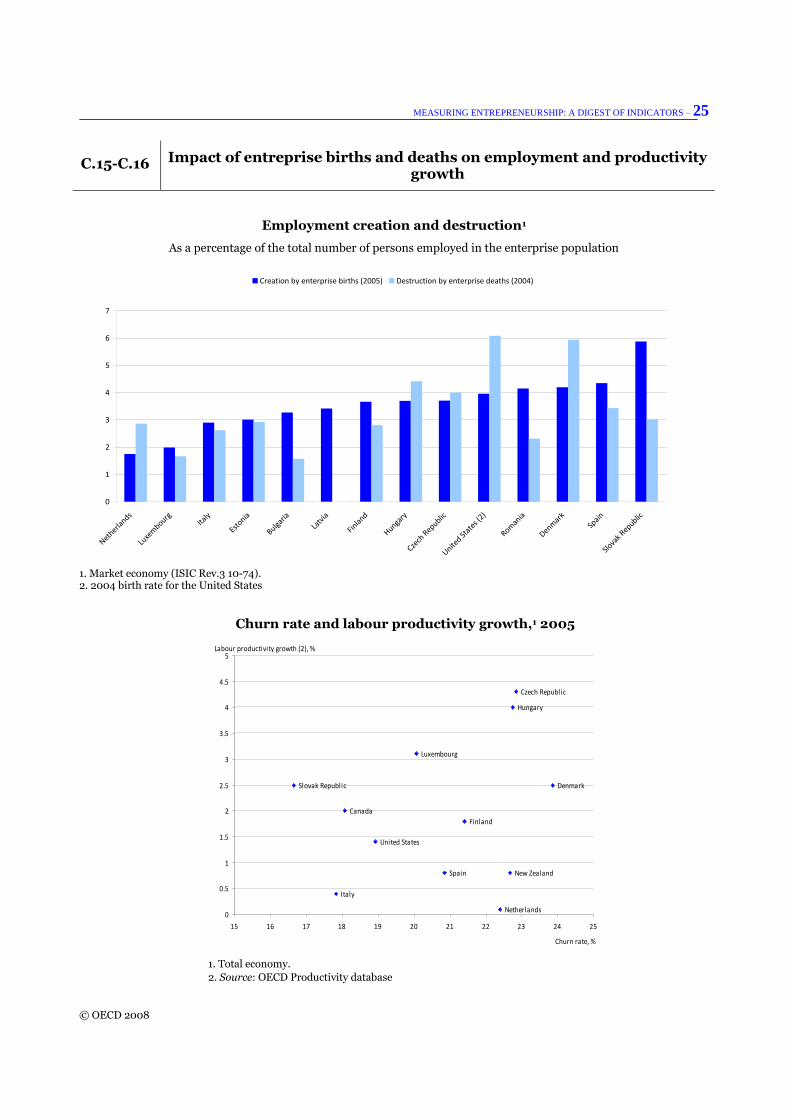
Overview The birth of new enterprises and the death of existing enterprises contribute directly to the aggregate growth of employment and productivity in national economies. Previous research has shown that productivity growth in the United States has been significantly influenced by firm entry and exit.
The contribution of the birth and death of enterprises to employment appears to be equally important on average, i.e. the employment created by new firms is more or less neutralised by the employment destroyed by exiting firms. Nevertheless, important differences exist among countries: in the Slovak Republic, Spain and Romania there is a clear net creation of employment as the result of the birth and death of enterprises, while in the Netherlands. Denmark and the United States there is a net destruction of employment.
The birth and death of enterprises may also affect aggregate productivity growth: correlating the churn rate (i.e. the sum of birth and death rates) with labour productivity growth across countries seems to point to a positive relationship. Theory explains this by the higher productivity of entering firms (relative to the productivity of exiting firms or even to aggregate productivity levels of all firms). Moreover, greater competition owing to more efficient and more productive new firms may stimulate existing firms to increase their productivity through R&D investments, innovation, etc. However, this simple correlation does not show any causality, and more detailed research is needed to disentangle the individual effects of enterprise births and deaths on productivity growth.
Source
OECD, Structural and Demographic Business Statistics (SDBS), OECD Database.
OECD Productivity Database.
For further reading
Analytical publication
OECD (2008), OECD Compendium of Productivity Indicators, 2008 Edition, OECD, Paris
Statistical publication
OECD (2006), Structural and Demographic Business Statistics 1996-2003, 2006 Edition, OECD, Paris.
Methodological publications
Eurostat, OECD (2007), Eurostat-OECD Manual on Business Demography Statistics, OECD, Paris.
OECD (2001), Measuring Productivity – OECD Manual, OECD, Paris.
Ahmad, N. (2006), A Proposed Framework for Business Demography Statistics, OECD, Paris
MEASURING ENTREPRENEURSHIP: A DIGEST OF INDICATORS – 25
© OECD 2008
C.15-C.16 Impact of entreprise births and deaths on employment and productivity growth
Employment creation and destruction1
As a percentage of the total number of persons employed in the enterprise population
0
1
2
3
4
5
6
7
Netherla
nds
Luxe
mbourg
Italy
Estonia
Bulgaria
Latv
ia
Finla
nd
Hungary
Czech
Republic
United St
ates (
2)
Romania
Denmark
Spain
Slova
k Republic
Creation by enterprise births (2005) Destruction by enterprise deaths (2004)
1. Market economy (ISIC Rev.3 10-74). 2. 2004 birth rate for the United States
Churn rate and labour productivity growth,1 2005
Slovak Republic
Italy
Canada
Luxembourg
Hungary
Czech Republic
Denmark
Spain
Finland
Netherlands
New Zealand
United States
0
0.5
1
1.5
2
2.5
3
3.5
4
4.5
5
15 16 17 18 19 20 21 22 23 24 25
Churn rate, %
Labour productivity growth (2), %
1. Total economy.
2. Source: OECD Productivity database

26 – MEASURING ENTREPRENEURSHIP: A DIGEST OF INDICATORS
©OECD 2008
Table 1. Enterprise availability indicators by country
Em
plo
ye
r e
nte
rpri
se p
op
ula
tio
n b
y s
ize
cla
ss
To
tal
firm
po
pu
lati
on
by
siz
e c
lass
Ne
t e
mp
loy
er
en
terp
rise
po
pu
lati
on
gro
wth
ra
tes
Ne
t to
tal
firm
po
pu
lati
on
gro
wth
ra
tes
Em
plo
ye
r e
nte
rpri
se b
irth
ra
tes
Em
plo
ye
r e
nte
rpri
se d
ea
th r
ate
s
Em
plo
ye
r e
nte
rpri
se c
hu
rn r
ate
s
1-y
ea
r su
rviv
al
rate
s (e
mp
loy
er
en
terp
rise
s)
2-y
ea
r su
rviv
al
rate
s (e
mp
loy
er
en
terp
rise
s)
3-y
ea
r su
rviv
al
rate
s (e
mp
loy
er
en
terp
rise
s)
4-y
ea
r su
rviv
al
rate
s (e
mp
loy
er
en
terp
rise
s)
5-y
ea
r su
rviv
al
rate
s (e
mp
loy
er
en
terp
rise
s)
Sh
are
of
1 y
r o
ld e
mp
. e
nte
rpri
ses
in p
op
ula
tio
n
Sh
are
of
2 y
r o
ld e
mp
. e
nte
rpri
ses
in p
op
ula
tio
n
Sh
are
of
3 y
r o
ld e
mp
. e
nte
rpri
ses
in p
op
ula
tio
n
Sh
are
of
4 y
r o
ld e
mp
. e
nte
rpri
ses
in p
op
ula
tio
n
Sh
are
of
5 y
r o
ld e
mp
. e
nte
rpri
ses
in p
op
ula
tio
n
Hig
h-g
row
th f
irm
ra
tes
by
em
plo
ym
en
t
Ga
zell
e r
ate
s b
y e
mp
loy
me
nt
Em
plo
ym
en
t in
po
pu
lati
on
of
en
terp
rise
bir
ths
Em
plo
ym
en
t in
1 y
ea
r o
ld e
nte
rpri
ses
Em
plo
ym
en
t in
2 y
ea
r o
ld e
nte
rpri
ses
Em
plo
ym
en
t in
3 y
ea
r o
ld e
nte
rpri
ses
Em
plo
ym
en
t in
4 y
ea
r o
ld e
nte
rpri
ses
Em
plo
ym
en
t in
5 y
ea
r o
ld e
nte
rpri
ses
Em
plo
ym
en
t in
po
pu
lati
on
of
en
terp
rise
de
ath
s
Av
era
ge
fir
m s
ize
(e
mp
loy
me
nt)
aft
er
1 y
ea
r
Av
era
ge
fir
m s
ize
(e
mp
loy
me
nt)
aft
er
2 y
ea
rs
Av
era
ge
fir
m s
ize
(e
mp
loy
me
nt)
aft
er
3 y
ea
rs
Av
era
ge
fir
m s
ize
(e
mp
loy
me
nt)
aft
er
4 y
ea
rs
Av
era
ge
fir
m s
ize
(e
mp
loy
me
nt)
aft
er
5 y
ea
rs
Hig
h-g
row
th f
irm
ra
tes
by
tu
rno
ve
r
Ga
zell
e r
ate
s b
y t
urn
ov
er
Va
lue
ad
de
d b
y s
ma
ll e
nte
rpri
ses
Sh
are
of
ex
po
rts
ac
co
un
ted
fo
r b
y s
ma
ll e
nte
rpri
ses
OE
CD
co
un
trie
s
Australia x x x
Austria x x x x x x x x x x
Belgium x x x x
Canada x x x x x x x x x x x x x x x x x x x x x x x x x x x
Czech Republic x x x x x x x x x x x x x x x x x x
Denmark x x x x x x x x x x x x x x x x
Finland x x x x x x x x x x x x x x x x x x
France x x x x
Germany x x x
Greece x x x
Hungary x x x x x x x x x x x x x x x x x x
Iceland x x x
Ireland x x x
Italy x x x x x x x x x x x x x x x x x x
Japan x x x
Korea x x x
Luxembourg x x x x x x x x x x x x x x x x x x
Mexico x x x
Netherlands x x x x x x x x x x x x x x x x x
New Zealand x x x x x x x x x x x x x x x x x x x x x x x x x
Norway x x x x
Poland x x x x
Portugal x x x
Slovak Republic x x x x x x x x x x x x x x x x x x
Spain x x x x x x x x x x x x x x x
Switzerland x x
Sweden x x x x
Turkey x x x
United Kingdom x x x
United States x x x x x x x x x x x x x x x
Bulgaria x x x x x x x x x x x x x x x x x
Estonia x x x x x x x x x x x x x x x x x x
Lithuania x x x x x x x x x x x x x x x x x
Latvia x x x x x x x x x x x x x x
Malta x x x
Romania x x x x x x x x x x x x x x x x x
Slovenia x x x x
No
n-O
EC
D c
ou
ntr
ies
OE
CD
co
un
trie
s

MEASURING ENTREPRENEURSHIP: A DIGEST OF INDICATORS – 27
© OECD 2008
Future Work under the Entrepreneurship Indicators Programme
Since its start in 2006, the Entrepreneurship Indicators Programme has focused on the development of common definitions and empirical indicators of entrepreneurship. At the same time, it has sought the involvement of as many countries as possible by establishing links with their National Statistics Offices. So far, it has mainly collected indicators of entrepreneurial performance (Figure 2). This report presents the first results of that effort; it is not an endpoint but the beginning of a thorough collection of international entrepreneurship indicators.
Efforts will continue and it is hoped that more countries will join the EIP so that a maximum of countries will be covered by the entrepreneurship indicators. The collection of data in future rounds will also allow for longitudinal analyses of entrepreneurship by studying, for example, the performance and survival of specific cohorts of newly created firms over time.
Future efforts will target, in addition to entrepreneurial performance, the collection of indicators on entrepreneurial determinants and impacts (Figure 1). The analyses in Section C, “Determinants and impacts of entrepreneurship” are a first attempt to identify (potential) relations between different indicators. The results show the added value of these analyses but also their incompleteness.
In building the knowledge base of indicators for analysing interrelationships, different sources of information could be used and linked with the entrepreneurship indicators collected through the EIP. Linked firm-level data would certainly help to answer questions about the relationships between entrepreneurial determinants and entrepreneurial performance. For example, do more innovative entrepreneurs grow faster or more strongly than non-innovative entrepreneurs in terms of employment or turnover? Do firms that receive venture capital show different growth patterns? Likewise, relations between entrepreneurial performance and entrepreneurial impacts could be assessed; for example, the precise contribution of firm births, firm deaths and gazelles to employment and productivity growth could be measured.
Results of this additional collection and analysis of data will provide inputs to the OECD Entrepreneurship Compendium to be published in 2009. This publication will contain the most recent information on entrepreneurship indicators across the participating countries. It will also present the first results of more detailed analyses to show interdependencies between the different indicators.
In this respect, the publication of the Structural Business Statistics Compendium should also be mentioned, as it contains several indicators closely related to the Entrepreneurship Indicator Programme. For example, the distribution of different economic variables by size classes of firms (see Section A, “Structural indicators on firm population”) will be presented in combination with more thematic analysis.
Another important future output of the programme will be the Entrepreneurship Measurement Manual, also to be published in 2009. It will describe all the target indicators of the Entrepreneurship Indicators Programme along with the specific definitions, methodologies and data requirements that have been identified. This joint manual of the OECD and Eurostat will be directly based on the ongoing work of the Entrepreneurship Indicators Steering Group and all the stakeholders in the EIP.

28 – MEASURING ENTREPRENEURSHIP: A DIGEST OF INDICATORS
©OECD 2008
Acknowledgements
The momentum to create the EIP, harmonise definitions and produce data arose from the combined efforts of many people throughout the world. It is impossible to cite them all. Those who contributed to meetings and reports of the Entrepreneurship Indicators Steering Group, since its inception in late 2006, deserve special mention. They are listed below. In addition, three people outside the OECD and Eurostat played critical roles. Anders Hoffmann, of the Danish Research Organisation FORA, co-authored the OECD working paper on the Entrepreneurship Indicators Framework and chaired the steering group since its inception; Richard Seymour, of the University of Sydney, co-authored the working paper on entrepreneurship definitions; and, Steven Vale, formerly of the Office of National Statistics in the United Kingdom, prepared a early study on the international comparability of business creation data that was instrumental in guiding the initial work on the programme. Finally, the names of all those who undertook the extensive work of producing data to meet the EIP requirements are not known, but their efforts are acknowledged and greatly appreciated.
Entrepreneurship Indicators Steering Group
Australia Richard Seymour University of Sydney
Canada Terry Evers Statistics Canada
Chris Parsley Small Business Policy, Industry Canada
Denmark Anders Hoffmann (Chair) FORA
Peter Bøegh Nielsen Statistics Denmark
EC Andreas Menidiatis DG-ENT
Hannah Aspegren DG-ENT
Axel Behrens (Vice Chair) Eurostat
Manfred Schmiemann Eurostat
Hartmut Schroer Eurostat
Finland Timo Laukkanen Statistics Finland
Satu Nurmi Statistics Finland
Germany Hans-Eduard Hauser Institut für Mittelstandsforschung
Hungary Zoltán Roman National Statistics Office
Italy Giuseppe Garofalo ISTAT
Caterina Viviano ISTAT
Korea Sungwook Choi Korea National Statistical Office
Netherlands Stephan Raes Ministerie van Economische Zaken
Portugal Paula Bordelo Statistics Portugal
Sweden Anita DuRietz Min of Energy, Enterprise & Communication
United Kingdom Karen Grierson Small Business Service, BERR
Ian Kay Small Business Service, BERR
United States Rick Clayton (Vice Chair) Bureau of Labor Statistics
Ron Jarmin Census Bureau
E.J. Reedy Kauffman Foundation
Leora Klapper Development Research Group
OECD Mariarosa Lunati Centre for Entrepreneurship, SMEs and Local Development
Nadim Ahmad Statistics Directorate
Benoit Arnaud Statistics Directorate
Tim Davis Statistics Directorate
Julia Gauch Statistics Directorate
Eric Gonnard Statistics Directorate
Patrizio Sicari Statistics Directorate