Odour Impacts and Odour Emission Control Measures for ... Impacts Final.pdfentitled ‘Odour Impacts...
145
ENVIRONMENTAL RESEARCH R&D REPORT SERIES No. 14 EUROPEAN COMMUNITY European Regional Development Fund Odour Impacts and Odour Emission Control Measures for Intensive Agriculture FINAL REPORT
Transcript of Odour Impacts and Odour Emission Control Measures for ... Impacts Final.pdfentitled ‘Odour Impacts...
E N V I R O N M E N TA L R E S E A R C H
R&D REPORT SERIES No. 14
EUROPEAN COMMUNITY
European RegionalDevelopment Fund
Odour Impacts and Odour Emission ControlMeasures for Intensive Agriculture
F INAL REPORT
© Environmental Protection Agency 2001
All or part of this publication may be reproduced without further permission, provided thesource is acknowledged.
Although every effort has been made to ensure the accuracy of the material contained in thispublication, complete accuracy cannot be guaranteed. Neither the Environmental ProtectionAgency nor the author(s) accept any responsibility whatsoever for loss or damage occasionedor claimed to have been occasioned, in part or in full, as a consequence of any person acting,
or refraining from acting, as a result of a matter contained in this publication.
Project informationThis report was commissioned by:Environmental Protection Agency
Johnstown Castle Estate, Wexford, IrelandContact: Dr. Vera Power / Dr. Tom Stafford
and was issued by:OdourNet UK Ltd
5 St Margaret’s Street, Bradford-on-Avon, Bath BA15 1DAContacts: Mr. Ton van Harreveld, Mr. Nick Jones
Funding and CopyrightThe Environmental Protection Agency took the initiative to carry out an R&D project
entitled ‘Odour Impacts and Odour Emission Control Measures for Intensive Agriculture’.The project was co–funded by the Environmental Monitoring, R&D Sub–programme of the
Environmental Services Operational Programme 1994 – 1999 (50% grant–aid).The partner consultant in the project, OdourNet UK Ltd, a member of the OdourNet group,
prepared the report.
Management and organisation and consultationThe project was managed by the Environmental Protection Agency. A steering group was
formed, with the following members:• Dr. Vera Power, Mr. David Maguire, Ms. Becci Cantrell,
Dr. Tom Stafford, Ms. B Rooney, Mr. Dara LynottTechnical comments were contributed by individuals involved in the
Irish pig production sector.
AcknowledgementsThe authors wish to thank all those who contributed their information, opinion, advice,
criticism, time and wisdom to this report.
11/01/500ISBN 1-84095-075-7
Price Ir£15 / €19.05

Contents
1. EXECUTIVE SUMMARY . . . . . . . . . . . . . . . . . . . . . . . . . . . . . . . . . . . . . . . . . . . . . . . . . . . . . . . . . . . . . 1
2. SCOPE OF THE STUDY . . . . . . . . . . . . . . . . . . . . . . . . . . . . . . . . . . . . . . . . . . . . . . . . . . . . . . . . . . . . . . 7
2.1 SCOPE . . . . . . . . . . . . . . . . . . . . . . . . . . . . . . . . . . . . . . . . . . . . . . . . . . . . . . . . . . . . . . . . . . . . . . . 7
2.1.1 Study objectives . . . . . . . . . . . . . . . . . . . . . . . . . . . . . . . . . . . . . . . . . . . . . . . . . . . . . . . . . . . 7
2.1.2 Structure of Part A of the report. . . . . . . . . . . . . . . . . . . . . . . . . . . . . . . . . . . . . . . . . . . . . . . 8
2.1.3 Conventions . . . . . . . . . . . . . . . . . . . . . . . . . . . . . . . . . . . . . . . . . . . . . . . . . . . . . . . . . . . . . . 8
3. INTRODUCTION TO THE CHARACTERISTICS OF PIG PRODUCTION IN IRELAND . . . . . . . . . . . . 9
3.1 OVERVIEW OF THE PIG PRODUCTION SECTOR AND ITS ECONOMICS . . . . . . . . . . . . . . . . 9
3.1.1 Distribution, size and type of pig production units . . . . . . . . . . . . . . . . . . . . . . . . . . . . . . . . . 9
3.1.2 Strengths of the Irish pig industry. . . . . . . . . . . . . . . . . . . . . . . . . . . . . . . . . . . . . . . . . . . . . . 9
3.1.3 Operational characteristics . . . . . . . . . . . . . . . . . . . . . . . . . . . . . . . . . . . . . . . . . . . . . . . . . . 10
4. INTRODUCTION TO ODOURS AS AN ENVIRONMENTAL STRESSOR . . . . . . . . . . . . . . . . . . . . . . . 13
4.1 ODOUR PERCEPTION . . . . . . . . . . . . . . . . . . . . . . . . . . . . . . . . . . . . . . . . . . . . . . . . . . . . . . . . . 13
4.2 CHARACTERISING ODOURS: PSYCHOPHYSICAL DIMENSIONS OF
ODOUR PERCEPTION . . . . . . . . . . . . . . . . . . . . . . . . . . . . . . . . . . . . . . . . . . . . . . . . . . . . . . . . . 14
4.2.1 The common traits of units used for odour and noise assessment . . . . . . . . . . . . . . . . . . . . . 14
4.3 THE MECHANISM LEADING FROM PIG SMELL TO ODOUR NUISANCE . . . . . . . . . . . . . . 15
5. IMPACT ASSESSMENT METHODOLOGY . . . . . . . . . . . . . . . . . . . . . . . . . . . . . . . . . . . . . . . . . . . . . . 19
5.1 ASSESSMENT OF EFFECTS . . . . . . . . . . . . . . . . . . . . . . . . . . . . . . . . . . . . . . . . . . . . . . . . . . . . 19
5.1.1 Direct measurement of percentage of people annoyed. . . . . . . . . . . . . . . . . . . . . . . . . . . . . . 19
5.1.2 Complaints analysis . . . . . . . . . . . . . . . . . . . . . . . . . . . . . . . . . . . . . . . . . . . . . . . . . . . . . . . 19
5.2 DIRECT ASSESSMENT OF ODOUR EXPOSURE . . . . . . . . . . . . . . . . . . . . . . . . . . . . . . . . . . . . 20
5.2.1 Direct field methods . . . . . . . . . . . . . . . . . . . . . . . . . . . . . . . . . . . . . . . . . . . . . . . . . . . . . . . 20
5.3 ASSESSMENT OF ODOUR IMPACT BY MEASURING EMISSIONS AT SOURCE,
FOLLOWED BY DISPERSION MODELLING . . . . . . . . . . . . . . . . . . . . . . . . . . . . . . . . . . . . . . . 21
5.3.1 Sampling . . . . . . . . . . . . . . . . . . . . . . . . . . . . . . . . . . . . . . . . . . . . . . . . . . . . . . . . . . . . . . . 21
5.3.2 Odour concentration analysis . . . . . . . . . . . . . . . . . . . . . . . . . . . . . . . . . . . . . . . . . . . . . . . . 22
5.3.3 Modelling of atmospheric dispersion . . . . . . . . . . . . . . . . . . . . . . . . . . . . . . . . . . . . . . . . . . 22
5.3.4 On the choice of meteorological data . . . . . . . . . . . . . . . . . . . . . . . . . . . . . . . . . . . . . . . . . . 24
5.3.5 On the choice of percentile values . . . . . . . . . . . . . . . . . . . . . . . . . . . . . . . . . . . . . . . . . . . . 25
6. DOSE–EFFECT RELATIONSHIP. . . . . . . . . . . . . . . . . . . . . . . . . . . . . . . . . . . . . . . . . . . . . . . . . . . . . . . 27
6.1 THE RELATIVE PROPERTIES OF PIG ODOURS COMPARED TO OTHER
ENVIRONMENTAL ODOURS . . . . . . . . . . . . . . . . . . . . . . . . . . . . . . . . . . . . . . . . . . . . . . . . . . . 27
6.2 RELATION BETWEEN ODOUR EXPOSURE AND PERCENTAGE OF
POPULATION ANNOYED . . . . . . . . . . . . . . . . . . . . . . . . . . . . . . . . . . . . . . . . . . . . . . . . . . . . . . 29
7. COMPARISON OF REGULATORY APPROACHES IN DIFFERENT COUNTRIES . . . . . . . . . . . . . . . . 35
7.1 GENERIC APPROACHES TO LIVESTOCK ODOUR MANAGEMENT AND REGULATION . . 35
7.2 BACKGROUND TO THE USE OF QUANTITATIVE ODOUR EXPOSURE CRITERIA . . . . . . . 36
7.2.1 The reasoning underpinning the choice of odour exposure limit values varies. . . . . . . . . . . . 36
7.3 OVERVIEW OF LIVESTOCK ODOUR GUIDELINES IN DIFFERENT COUNTRIES . . . . . . . . 37
7.3.1 Germany . . . . . . . . . . . . . . . . . . . . . . . . . . . . . . . . . . . . . . . . . . . . . . . . . . . . . . . . . . . . . . . 38
7.3.2 The Netherlands . . . . . . . . . . . . . . . . . . . . . . . . . . . . . . . . . . . . . . . . . . . . . . . . . . . . . . . . . . 38
7.3.3 United Kingdom. . . . . . . . . . . . . . . . . . . . . . . . . . . . . . . . . . . . . . . . . . . . . . . . . . . . . . . . . . 39
7.3.4 United States of America . . . . . . . . . . . . . . . . . . . . . . . . . . . . . . . . . . . . . . . . . . . . . . . . . . . 40
7.3.5 New Zealand . . . . . . . . . . . . . . . . . . . . . . . . . . . . . . . . . . . . . . . . . . . . . . . . . . . . . . . . . . . . 40
7.3.6 Comparison of setback distances in different countries for fictitious pig units. . . . . . . . . . . . 40
8. PROPOSED FRAMEWORK FOR IMPACT ASSESSMENT WITH A VIEW TO LICENSING . . . . . . . . 43
8.1.1 Scope of impact assessment framework . . . . . . . . . . . . . . . . . . . . . . . . . . . . . . . . . . . . . . . . 43
8.1.2 Legal framework . . . . . . . . . . . . . . . . . . . . . . . . . . . . . . . . . . . . . . . . . . . . . . . . . . . . . . . . . 43
8.1.3 The proposed assessment framework: general principles and odour exposure criteria . . . . . . 45
8.1.4 Definition of sensitive receptors . . . . . . . . . . . . . . . . . . . . . . . . . . . . . . . . . . . . . . . . . . . . . . 47
8.1.5 Emission factors . . . . . . . . . . . . . . . . . . . . . . . . . . . . . . . . . . . . . . . . . . . . . . . . . . . . . . . . . . 48
8.1.6 Cumulation . . . . . . . . . . . . . . . . . . . . . . . . . . . . . . . . . . . . . . . . . . . . . . . . . . . . . . . . . . . . . 51
8.1.7 Practical application of the assessment framework . . . . . . . . . . . . . . . . . . . . . . . . . . . . . . . . 51
8.1.8 The general, simple case: assessment by screening using standard contour overlays . . . . . . . 53
8.1.9 Full impact assessment using atmospheric modelling . . . . . . . . . . . . . . . . . . . . . . . . . . . . . . 53
8.1.10 Specific terms and definitions. . . . . . . . . . . . . . . . . . . . . . . . . . . . . . . . . . . . . . . . . . . . . . . . 55
9. METHODS FOR REDUCTION OF ODOUR IMPACT. . . . . . . . . . . . . . . . . . . . . . . . . . . . . . . . . . . . . . . 57
9.1 WHAT CAUSES ODOURANTS TO BE PRODUCED? . . . . . . . . . . . . . . . . . . . . . . . . . . . . . . . . . 57
9.2 THEORETICAL OPTIONS FOR REDUCING ODOUR EMISSIONS FROM
PIG PRODUCTION . . . . . . . . . . . . . . . . . . . . . . . . . . . . . . . . . . . . . . . . . . . . . . . . . . . . . . . . . . . . 58
9.3 GOOD OPERATIONAL PRACTICE . . . . . . . . . . . . . . . . . . . . . . . . . . . . . . . . . . . . . . . . . . . . . . . 59
9.3.1 Slurry removal . . . . . . . . . . . . . . . . . . . . . . . . . . . . . . . . . . . . . . . . . . . . . . . . . . . . . . . . . . . 60
9.3.2 Cleanliness . . . . . . . . . . . . . . . . . . . . . . . . . . . . . . . . . . . . . . . . . . . . . . . . . . . . . . . . . . . . . . 60
9.4 HOUSING DESIGN . . . . . . . . . . . . . . . . . . . . . . . . . . . . . . . . . . . . . . . . . . . . . . . . . . . . . . . . . . . . 60
9.4.1 Standard housing systems. . . . . . . . . . . . . . . . . . . . . . . . . . . . . . . . . . . . . . . . . . . . . . . . . . . 60
9.4.2 Low-emission housing systems. . . . . . . . . . . . . . . . . . . . . . . . . . . . . . . . . . . . . . . . . . . . . . . 60
9.5 OPTIMISATION OF VENTILATION AND ATMOSPHERIC DILUTION . . . . . . . . . . . . . . . . . . . 63
9.5.1 Ventilation in livestock housing . . . . . . . . . . . . . . . . . . . . . . . . . . . . . . . . . . . . . . . . . . . . . . 63
9.5.2 Optimisation of atmospheric dilution . . . . . . . . . . . . . . . . . . . . . . . . . . . . . . . . . . . . . . . . . . 63
9.6 FEED . . . . . . . . . . . . . . . . . . . . . . . . . . . . . . . . . . . . . . . . . . . . . . . . . . . . . . . . . . . . . . . . . . . . . . . 64
9.7 ADDITIVES. . . . . . . . . . . . . . . . . . . . . . . . . . . . . . . . . . . . . . . . . . . . . . . . . . . . . . . . . . . . . . . . . . 65
9.7.1 Feed additives . . . . . . . . . . . . . . . . . . . . . . . . . . . . . . . . . . . . . . . . . . . . . . . . . . . . . . . . . . . 65
9.7.2 Slurry additives . . . . . . . . . . . . . . . . . . . . . . . . . . . . . . . . . . . . . . . . . . . . . . . . . . . . . . . . . . 65
9.7.3 Odour counteractants and masking agents . . . . . . . . . . . . . . . . . . . . . . . . . . . . . . . . . . . . . . 65
9.8 EXTRACTION AND TREATMENT OF VENTILATION AIR . . . . . . . . . . . . . . . . . . . . . . . . . . . . 65
9.8.1 Chemical scrubbers . . . . . . . . . . . . . . . . . . . . . . . . . . . . . . . . . . . . . . . . . . . . . . . . . . . . . . . 66
9.8.2 Bioscrubbers . . . . . . . . . . . . . . . . . . . . . . . . . . . . . . . . . . . . . . . . . . . . . . . . . . . . . . . . . . . . 67
9.8.3 Biofilters . . . . . . . . . . . . . . . . . . . . . . . . . . . . . . . . . . . . . . . . . . . . . . . . . . . . . . . . . . . . . . . 68
9.8.4 Ozone treatment of ventilation air. . . . . . . . . . . . . . . . . . . . . . . . . . . . . . . . . . . . . . . . . . . . . 69
9.9 SLURRY STORAGE . . . . . . . . . . . . . . . . . . . . . . . . . . . . . . . . . . . . . . . . . . . . . . . . . . . . . . . . . . . 69
9.9.1 Odour emission reduction in open slurry storage . . . . . . . . . . . . . . . . . . . . . . . . . . . . . . . . . 70
9.9.2 Enclosed slurry storage. . . . . . . . . . . . . . . . . . . . . . . . . . . . . . . . . . . . . . . . . . . . . . . . . . . . . 70
9.9.3 Operational aspects of slurry storage . . . . . . . . . . . . . . . . . . . . . . . . . . . . . . . . . . . . . . . . . . 71
10. TWO CASE STUDIES . . . . . . . . . . . . . . . . . . . . . . . . . . . . . . . . . . . . . . . . . . . . . . . . . . . . . . . . . . . . . . . 73
10.1 EXECUTIVE SUMMARY PART B: CASE STUDIES ASSESSING
THE ODOUR EMISSIONS AND IMPACT OF TWO PIG
PRODUCTION UNITS IN THE IRISH SITUATION . . . . . . . . . . . . . . . . . . . . . . . . . . . . . . . . . . . 73
11. CONCLUSIONS . . . . . . . . . . . . . . . . . . . . . . . . . . . . . . . . . . . . . . . . . . . . . . . . . . . . . . . . . . . . . . . . . . . . 75
ANNEX A. ODOUR REGULATIONS FOR INTENSIVE LIVESTOCK IN OTHER COUNTRIES . . . . . . . . 77
A.1 GERMANY . . . . . . . . . . . . . . . . . . . . . . . . . . . . . . . . . . . . . . . . . . . . . . . . . . . . . . . . . . . . . . . . . . 77
A.1.1 General regulatory framework and relevant guideline documents . . . . . . . . . . . . . . . . . . . . . 77
A.1.2 The distance graph in VDI3471 . . . . . . . . . . . . . . . . . . . . . . . . . . . . . . . . . . . . . . . . . . . . . . 78
A.2 NETHERLANDS . . . . . . . . . . . . . . . . . . . . . . . . . . . . . . . . . . . . . . . . . . . . . . . . . . . . . . . . . . . . . . 78
A.2.1 Guideline documents . . . . . . . . . . . . . . . . . . . . . . . . . . . . . . . . . . . . . . . . . . . . . . . . . . . . . . 78
A.3 UNITED KINGDOM . . . . . . . . . . . . . . . . . . . . . . . . . . . . . . . . . . . . . . . . . . . . . . . . . . . . . . . . . . . 81
A.4 UNITED STATES. . . . . . . . . . . . . . . . . . . . . . . . . . . . . . . . . . . . . . . . . . . . . . . . . . . . . . . . . . . . . . 82
A.4.1 Setback distances: . . . . . . . . . . . . . . . . . . . . . . . . . . . . . . . . . . . . . . . . . . . . . . . . . . . . . . . . 82
A.5 NEW ZEALAND . . . . . . . . . . . . . . . . . . . . . . . . . . . . . . . . . . . . . . . . . . . . . . . . . . . . . . . . . . . . . . 82
ANNEX B. METHODS FOR ODOUR ASSESSMENT AND UNITS OF MEASUREMENT. . . . . . . . . . . . . 87
B.1 DETECTABILITY . . . . . . . . . . . . . . . . . . . . . . . . . . . . . . . . . . . . . . . . . . . . . . . . . . . . . . . . . . . . . 87
B.1.1 Measurement of odour concentration using olfactometry . . . . . . . . . . . . . . . . . . . . . . . . . . . 87
B.1.2 The unit of measurement . . . . . . . . . . . . . . . . . . . . . . . . . . . . . . . . . . . . . . . . . . . . . . . . . . . 87
B.1.3 Odour concentration measurement using quantitative olfactometry . . . . . . . . . . . . . . . . . . . . 88
B.2 INTENSITY . . . . . . . . . . . . . . . . . . . . . . . . . . . . . . . . . . . . . . . . . . . . . . . . . . . . . . . . . . . . . . . . . . 89
B.3 ODOUR QUALITY (DESCRIPTIVE) . . . . . . . . . . . . . . . . . . . . . . . . . . . . . . . . . . . . . . . . . . . . . . 90
B.4 HEDONIC TONE . . . . . . . . . . . . . . . . . . . . . . . . . . . . . . . . . . . . . . . . . . . . . . . . . . . . . . . . . . . . . . 90
B.5 ANNOYANCE POTENTIAL . . . . . . . . . . . . . . . . . . . . . . . . . . . . . . . . . . . . . . . . . . . . . . . . . . . . . 91
B.6 CHARACTERISATION OF ODOURS USING CHEMICAL ANALYSIS . . . . . . . . . . . . . . . . . . . 91
ANNEX C. GLOSSARY. . . . . . . . . . . . . . . . . . . . . . . . . . . . . . . . . . . . . . . . . . . . . . . . . . . . . . . . . . . . . . . . . 93
ANNEX D. REFERENCES . . . . . . . . . . . . . . . . . . . . . . . . . . . . . . . . . . . . . . . . . . . . . . . . . . . . . . . . . . . . . . 97
ANNEX E. CONTOUR PLOTS FOR SCREENING ASSESSMENT . . . . . . . . . . . . . . . . . . . . . . . . . . . . . . 101
E.1 STANDARD CONTOURS OVERLAY, SCALE 1:50,000, FOR THE LIMIT
VALUE FOR NEW PIG PRODUCTION UNITS, . . . . . . . . . . . . . . . . . . . . . . . . . . . . . . . . . . . . . 102
E.2 STANDARD CONTOURS OVERLAY, SCALE 1:50,000, FOR THE TARGET
VALUE FOR ALL PIG PRODUCTION UNITS . . . . . . . . . . . . . . . . . . . . . . . . . . . . . . . . . . . . . . 103
E.3 STANDARD CONTOURS OVERLAY, SCALE 1:10,560, FOR THE LIMIT
VALUE FOR EXISTING PIG PRODUCTION UNITS. . . . . . . . . . . . . . . . . . . . . . . . . . . . . . . . . 104

Man is the measure of all thingsProtagoras, sophist, (c. 485-410 BC)
‘The question whether something is true or false, good or bad, should always beconsidered in relation to the needs of that person’
Close to 200 pig units will be applying for IPC licences
in Ireland in the next few years, as a result of the EPA
Act of 1992 and European IPPC licensing requirements.
The assessment of the odour impact of these pig units
will be an important element of the licensing process,
which will be carried out by the Environmental
Protection Agency. Suitable criteria for ‘acceptable
exposure’ to odours are required, in order to set, limit
and target values for odour impact. Appropriate odour
assessment methods are required to quantify emissions
and, if required, to control and enforce licence
conditions. To allow pig producers to manage the impact
of odours, information is required on the relationship
between production practice, housing types and odour
emissions, as well as on suitable approaches to the
abatement of odour emissions.
This report provides an overview of these issues, based
on literature review, a limited programme of
measurements and experience gained from the
regulatory practices in other countries. This information
will assist the EPA in formulating its approach to
processing licence applications and in achieving
transparent and uniform decision-making on odour
issues for that purpose.
This report was prepared by OdourNet UK Ltd. as part
of the Environmental Monitoring R&D sub programme,
supported by an ERDF grant.
Chapter 3 gives an overview of the characteristics of pig
production in Ireland. While pig production capacity in
Ireland is limited relative to other EU countries, there is
a high proportion of large pig units. Approximately 190
units exceed current licensing thresholds and will
require an IPC licence. The majority of these (143) are
integrated breeding and finishing units. The average size
of a pig unit in Ireland is 316 sows/unit, which again is
relatively large compared to other EU countries. The
density of pigs is relatively low, ranging from 4 to 69
hectares per sow, with an average of 26 hectares per sow.
The Irish pig production sector employs approximately
6000 people in pig production, slaughtering, processing,
feed production and facilities supply. The investment per
sow in an integrated unit ranges between €2,000 and
€3,200 and profitability is variable. After a period of
generally low prices in 1998 and 1999, leading to losses
per pig produced, profitability improved in 2000 due to
relatively strong demand and strong sterling. Sixty five
percent of production is exported to the UK.
Chapter 4 sets out an introduction to odours as an
environmental stressor and provides operational
knowledge for professionals involved in odour
annoyance licensing and management. The evolutionary
origins of our sense of smell, its function and relevance
to our social behaviour are explained. The dimensions
for characterising odours are identified: detectability,
intensity, hedonic tone, odour quality and the recently
proposed dimension of odour annoyance potential. In
assessing environmental odours, detectability is
generally the only dimension used. A European draft
standard is in preparation by CEN/TC264/WG2 Odours
(EN13725) for measuring odour concentration in
European odour units per cubic metre (ouE/m3). An
odour that is just detectable by 50% of selected panel
members is described as having an odour concentration
of 1 ouE/m3. It must be noted that the relation between
perceived intensity and odour concentration is not linear
but logarithmic. A useful similarity is that of noise
where the linear measure of energy of the noise in
Watt/m2 is translated to intensity using the logarithmic
unit dB. Like the odour unit, the dB is based on a
sensory detection threshold: at 0 dB 50% of young
people can detect a sound at a frequency of 1000 Hz.
However, in contrast to common practice for noise,
odour concentration is typically expressed in the linear
unit (ouE/m3) rather than a logarithmic one such as the
dB.
The mechanism that leads from the production of pig
odours via release and dispersion in the atmosphere to
causing odour nuisance in a specific population is
complex and is discussed in some detail. Odour
nuisance is a result of long-term, intermittent exposure
to an environmental stressor, in a complex context of
physical, physiological, social and psychological factors
that determine the behavioural response of the
individual. Odour nuisance is not a linear push-button
response to a particular intensity of exposure at any
Odour Impacts and Odour Emission Control Measures for Intensive Agriculture
1
Executive Summary
moment by a particular smell. The exposure history is a
major factor in the appraisal of the impact of
environmental odours. An epidemiological approach is,
therefore, the most appropriate tool with which to study
the relationship between a source, the dispersion
characteristics of a site and the long-term effects on the
population in terms of annoyance.
Once that relationship is known, odour impact can be
assessed in a more straightforward manner, using source
emission measurements combined with dispersion
modelling. The results can be assessed using the
epidemiological dose-effect relationship, or exposure
criteria derived from such a relationship. Assessment of
odours is typically undertaken by measurement of
emission rates at source, followed by dispersion
modelling. Assessment in the field is more difficult,
because of the large variations in momentary
concentration caused by atmospheric dilution; other
background odours (e.g. soil, vegetation) and the
practical problems associated with measuring very low
odour concentrations (≤ 20 ouE/m3).
In Chapter 6 the dose-effect relationship for odour
annoyance as a result of long-term intermittent exposure
to odours is discussed in detail. For a number of
industries in the Netherlands, specific targets for air
quality have been defined as a certain 1-hour average
odour concentration that should not be surpassed in
more than 2% of all hours in an average meteorological
year. This criterion, commonly expressed as C98, 1-hour =
x ouE/m3, is assessed using a measured source emission
and dispersion modelling, using meteorological data for
3 years or more. The target values range from C98, 1-hour
≤ 0.5 ouE/m3 for rendering plants to C98, 1-hour ≤ 3.5
ouE/m3 for coffee roasters.
Chapter 7 provides an overview of regulatory
approaches taken in a number of countries, including
Canada, Germany, the Netherlands, New Zealand, and
the United States. Typical setback distances for a
relevant number of sows are presented in Table 9 to
allow a comparison of the proposed framework with that
in other countries.
Recently, a large-scale epidemiological study was
conducted in the Netherlands to establish the dose-effect
relationship between percentages of population annoyed
and calculated odour exposure. The study was carried
out for the Ministry of Public Planning and the
Environment and used approximately 2,300
standardised telephone questionnaires collected from
householders living in the vicinity of pig units.
Chapter 8 sets out a proposed framework of target and
limit values based on the results of the Dutch study. This
framework provides a starting point for a licensing
procedure to be used in Ireland. The proposed structure
of target and limit values is:
• Target value: C98, 1-hour ≤ 1.5 ouE/m3
The target value provides a general level of protection
against odour annoyance for the general public,
aiming to limit the percentage of people experiencing
some form of odour-induced annoyance to 10% or
less. The target value is to be used as an
environmental quality target for all situations.
The target value is achieved when the calculated
odour exposure for all locations of odour sensitive
receptors is less than an hourly average odour
concentration of 1.5 ouE/m3 in 98% of all hours in an
average meteorological year.
• Limit value for new pig production units:C98, 1-hour ≤ 3.0 ouE/m3
The limit value for new pig production units provides
a minimum level of protection against odour
annoyance, aiming to limit the percentage of those
experiencing some form of odour-induced annoyance
to 10% or less of the general public, assuming some
degree of acceptance of the rural nature of their living
environment.
The limit value for new pig production units is
complied with when, for all locations of odour
sensitive receptors, the calculated odour exposure is
less than an hourly average odour concentration of
3.0 ouE/m3 in 98% of all hours in an average
meteorological year.
• Limit value for existing pig production units:C98, 1-hour ≤ 6.0 ouE/m3
The limit value for existing pig production units
provides a minimum level of protection against odour
annoyance, aiming to limit the percentage of people
experiencing some form of odour-induced annoyance
to 10% or less, in the most tolerant tolerence section
Odour Impacts and Odour Emission Control Measures for Intensive Agriculture
2
(agricultural/rural) of the population.
The limit value for existing production units is
complied with when for all locations of odour
sensitive receptors the calculated odour exposure is
less than an hourly average odour concentration of
6.0 ouE/m3 in 98% of all hours in an average
meteorological year.
A phased plan must be made to reduce the odour
impact, with time, to the limit value for new pig
production units and, eventually, the target value.
These criteria for odour exposure aim to provide a
framework that can be used to attain a general
environmental quality in Ireland, while recognising that
in some cases existing pig production units may need
some considerable period of time to achieve that target.
In some cases, the time allowed will have to take into
account the cycle of normal replacement of assets such
as livestock housing, to allow implementation of a
structural solution, while avoiding destruction of capital
goods.
The implementation of the proposed framework would
rely on using emission factors per animal. Specific
measurements should not be required, with the possible
exception of very large units or production systems that
are atypical. A limited programme of measurements was
conducted in Ireland for this report, providing indicative
emission factors for winter conditions. The results
statistically fall within the range of the wider set of
annual mean data from the Netherlands. In the absence
of a sufficient dataset for Irish conditions, the presented
data from the Netherlands provide the best basis for
emission estimates for licensing.
A flow diagram for the licensing assessment process for
odour annoyance is provided in Chapter 8. It provides a
method to decide when to apply a straightforward
assessment, using standard contour lines. These standard
contours are provided in Annex E and can be used as
overlays on a map to estimate the area where exposure is
in excess of a limit or target value for odour impact, for
a particular number of animals. In more complicated
cases, where decisions can become borderline, full
modelling is proposed as the preferred assessment
method. Detailed information is provided on how to
conduct assessments of odour impact for licensing
purposes.
Chapter 9 provides an overview of options for reducing
odour emissions from pig production. The following
options have been identified:
1. Reduction of odour production
a. Reduction of the protein content in feed
b. Separation of urine and faeces, followed by
treatment.
c. Lowering of temperature of stored slurry
d. Collection of slurry in closed tanks,
followed by anaerobic digestion.
2. Reduction of transfer rate from the surface of
slurry
a. pH control
b. Covering the surface
i. Natural crusting
ii. Floating biological covers (straw
fibre)
iii. Floating covers
iv. Liquid additives (vegetable oils)
v. Air filled plastic domes (over sludge
storage lagoons)
3. Reduction of exposed area of slurry, including
storage, soiled surfaces, grids etc
a. Different housing types, which include
systems such as:
i. Green Label pig houses, designed for
low ammonia emissions
b. Frequent removal of slurry and storage in
closed tanks
4. Extraction of ventilation air with treatment to
reduce odour concentration
a. Bioscrubbers
b. Chemical scrubbers
c. Biofilters
5. Miscellaneous additives
a. Feed additives
b. Slurry additives
Generally speaking, low-emission housing systems can
achieve a reduction of odour emissions of up to 50%.
This approach is best implemented in the course of the
normal cycle of replacement of assets. End-of-pipe
treatment of ventilation air is generally speaking not an
option that is economically feasible. The volume flow of
ventilation is large in the relevant season (summer)
because it is the main regulating mechanism for
Odour Impacts and Odour Emission Control Measures for Intensive Agriculture
3
temperature and hence is directly related to the welfare
and growth of the animals. The odour concentrations are
relatively low from the perspective of air treatment
systems, with concentrations of a few thousands ouE/m3.
These factors combine to cause significant additional
costs, in the order of €25 per pig produced.
Chapter 9 provides detailed information on odour
abatement methods, both process integrated and end-of-
pipe methods. Indicative cost information has been
included when available in the literature. The economics
of installing the technology to abate odour emissions
must be assessed before the technology is imposed on
existing pig unit operations.
Chapter 10 summarises two case studies that were
conducted at pig units in Ireland for this report. In the
course of these case studies a limited programme of
emission measurements was conducted, with the aim of
checking whether the results would fall within the range
of values for emission factors found in the recent Dutch
study. The measurements in Ireland yielded a geometric
mean value of 13.2 ouE/s per finisher, in winter
conditions, which was approximately one third lower
than the annual mean of 22.6 ouE/s per finisher from the
Dutch study. A Belgian study found a figure of 15.4
ouE/s for fatteners in winter conditions, very similar to
the Irish emission. However, given the variance
observed within and between farms in the Netherlands,
the difference is too small to conclude that Irish
emissions are systematically lower. To draw that
conclusion, a larger programme of odour emission
measurements would be required.
Chapter 11 contains the conclusions, which are repeated
in this summary:
This report is not answering a well-defined question,
with a concise set of conclusions. It aims to provide a
framework that will provide a balance between the
economic interests of the pig producer and the
environmental interests of those using the vicinity in
which to live, work and play.
On the basis of the issues explored in this report, a
number of general conclusions can be made:
1) A significant number of pig production units will
require a licence, based on current National and
European legislation.
2) An assessment framework based on quantitative
emissions is most likely to achieve a transparent
licensing practice that achieves a balance between
the interest of the pig producer and those who use
the surroundings as their living environment.
3) The proposed assessment framework identifies one
environmental target for all situations. To allow for
a degree of flexibility two limit values have been
set, one for new production unit applications and
one for existing facilities. The ‘space’ between the
target and the limit values can be used in the
licensing process to tailor the conditions to the
specific requirements and opportunities that exist
for that licence application.
4) The proposed framework for target and limit values
is, in general terms, compatible with the setback
distances required or advised in other countries,
such as Germany, the Netherlands, New Zealand.
5) The prevailing wind direction in Ireland causes a
distribution of odours that is not symmetrical. The
actual meteorology of the pig unit’s location and the
position of the receptor relative to the source are,
therefore, a greater factor than in most countries,
where the wind rose is more uniform and resultant
contours circular. These particular circumstances
increase the need for specific modelling, in cases
where the outcome is not clear-cut.
6) The geometric mean emission rate of 13.2 ouE/s per
finisher measured in winter conditions in Ireland for
this study is about one third lower than the value of
22.6 ouE/s per finisher found in a larger study in the
Netherlands.
7) Given the relatively small number of samples,
collected in the Irish study, and the statistical
variance as derived from the larger Dutch study, the
difference in the mean outcome is too small to be
statistically significant.
8) It is, therefore, justified to use the emission factors
derived in the Netherlands for emission estimates in
Ireland, as long as emission factors specifically
measured in Irish conditions are not available for a
Odour Impacts and Odour Emission Control Measures for Intensive Agriculture
4
larger sample of study sites.
9) Options for reducing odour emissions from pig
production exist. Reductions to 50% relative to the
most common fully-slatted production unit are quite
feasible. However, the financial viability of many
retrofit methods is an issue of concern, given the
low economic returns on pig production.
10) The economics of installing technology to abate
odour emissions must be assessed before this
technology can be imposed on existing pig unit
operations. The most viable low-emission options
involve modification of pig houses, or replacement
by new low-emission design housing. In most cases,
such structural abatement can only be reasonably
achieved in the normal economic cycle of asset
replacement.
11) Retro-fitting of abatement, using air treatment
systems such as bioscrubbers, chemical scrubbers or
biofilters, can achieve significant emission
reductions of between 70% and over 95%. The main
impediment is the additional cost incurred, which
can increase the cost of a pig produced by roughly
10-20%. Market conditions in recent years,
generally speaking, do not allow such an increased
cost.
12) Good operational practice, including suitable
landscaping, tree screens and pro-active community
relations, remain a main factor in reducing
annoyance and avoiding annoyance developing into
nuisance.
13) A suitable production site for a given production
capacity will become a major asset for any pig
producer and may become a main factor in
determining the sustainability of the activity.
Producers are well advised to use the planning
process to their advantage and be pro-active in
counteracting any encroachment into the existing
setback zone by developments that may be termed
‘odour sensitive receptors’.
14) By making the assessment of the impact in the
vicinity of pig production transparent, the proposed
framework can contribute in practice to the
protection of the interests of both pig producers and
the general public.
Odour Impacts and Odour Emission Control Measures for Intensive Agriculture
5

Odour Impacts and Odour Emission Control Measures for Intensive Agriculture
6
2.1 Scope
Livestock odours, in particular those caused by pigs,
have been a subject of study and of regulation for some
considerable time. Guidelines for planning and
licensing, aimed at maintaining adequate buffer zones
between pig units and residents, have been introduced in
some European countries as early as 1971. The nature of
pig production has changed since then, while the
environmental impacts of pig production have become a
major consideration. Nutrient recycling and disposal,
ammonia emissions, greenhouse gas emissions and
odours are now significant issues determining the
sustainability of the industry. The industry has
developed various technologies in response to these
challenges. New types of pig housing and manure
storage have been developed, feed technology is
evolving and even air treatment to reduce emissions of
ammonia and odour to air is under consideration.
In Ireland, the pig production sector has seen
considerable change over the past 12 years. The
production of pig meat in Ireland has doubled, while the
number of pig producers has been reduced. The trend
towards larger units is expected to continue.
IPC licensing for pig production units above a certain
size is currently being introduced, on the basis of the
EPA Act of 1992 and European requirements.
As a result, close to 200 pig units will be applying for
IPC licences in Ireland in the next few years. The
assessment of the odour impact of these pig units will be
an important element of the licensing process, which
will be carried out by the Environmental Protection
Agency.
To implement licensing, a transparent framework for
assessing the odour impact of livestock production units
is required, providing consistent criteria to avoid
impairment of amenity in the vicinity of production
units. Suitable criteria for ‘acceptable exposure’ to
odours are required, in order to set a framework of
environmental quality criteria: limit and target values.
This report aims to provide the basis for such a
framework. It also reviews the practices, methods and
technologies that are available to reduce the odour
impact of pig production units.
To illustrate the application of concepts outlined in this
report, three pilot studies were conducted to illustrate
practical implementation of the proposed assessment
framework.
This report will assist the Agency in formulating its
approach to processing the licence applications and to
achieve transparent and uniform decision-making on
odour issues for that purpose.
Part A of the report provides the background to the
assessment framework, on the basis of literature study
and direct contacts with experts and industry
representatives.
In Part B two case studies for Irish pig production units
are reported, using the methodology and approach as
suggested in Part A of the main report. Part B includes a
chapter reporting a limited number of measurements
that were made to assess whether emissions from pigs in
Ireland were within the range of values found in a more
extensive survey in the Netherlands. The Dutch data
were used to derive emission factors for application in
Ireland as proposed in this report.
2.1.1 Study objectives
The study reported here aims to achieve the following
objectives:
• Review and evaluate methods for odour impact
assessment and prediction.
• Propose criteria and standards to avoid impairment of
amenities adjacent to the production unit.
• Identify and review options for reducing odour
generation.
• Identify and review odour abatement options suitable
for retro-fitting to existing production units
Odour Impacts and Odour Emission Control Measures for Intensive Agriculture
7
2. Scope of the study
2.1.2 Structure of Part A of the report.
After providing a general overview of the characteristics
of the pig production sector in Ireland in Chapter 3, the
principles of odour assessment are discussed in Chapters
4 and 5. Aspects of formation of odourants, release to
atmosphere, dispersion, exposure and detection,
perception and the factors that determine whether an
odour becomes an annoyance or a nuisance will be
explained. This introduction will provide basic
knowledge of the way our human sense of smell works,
in the context of environmental odour annoyance. The
relationship between perception of odours and health
and well-being and the process that can lead from
perception of environmental odours to odour annoyance
are discussed. The main factors in the process that
determine whether annoyance will be an issue will be
identified. More detailed background information is
provided in annexes.
The dose-effect relationship, between the calculated
exposure to odour and the percentage of people
‘annoyed’ by odours, is discussed in Chapter 6. This
relationship is highly relevant, as it provides the
underlying data for setting targets for environmental
quality, at a level that reflects the needs of a particular
society.
An overview of the regulatory approach to pig odours as
an environmental issue in other countries is provided in
Chapter 7. In Chapter 8 a framework for assessing and
managing odour annoyance issues in the licensing
process in Ireland is proposed, specifically aimed at the
pig production sector. Prevention of odour problems is
the guiding principle. The framework provides a
systematic approach to achieving a defined minimum air
quality target for odour through application of best
practice in operation and design, combined with
adequate setback distances and possibly specific
measures to reduce odour impact to an agreed set of
limit and target values.
Chapter 9 describes the causes of formation of
odourants. Methods to mitigate odour impact by
reducing odourant production are reviewed, including
methods for reducing the release of odourants and
methods for reducing the impact in other ways, such as
using slurry additives or end-of-pipe air treatment, e.g.
chemical scrubbers, bioscrubbers, biofilters etc.
In Chapter 10 the results of three case studies are
presented. In addition to demonstrating the principles of
odour impact assessment as proposed in this report, the
results of a limited measurement programme are
presented. The measurements, performed at two study
sites, were aimed at determining emission factors for
finishers, and to compare the results to emission factors
derived from a larger study in the Netherlands.
Chapter 11 lists the main conclusions of the report.
At the end of this part A of the report, a number of
annexes are included, giving detailed information that is
referred to in the main report, followed by the
References.
• Annex A Odour regulations for intensive livestock in
other countries gives details on national regulations,
summarised in the main report.
• Annex B Methods for odour assessment and units of
measurement provides a detailed description of odour
assessment methodology, and the units and concepts
used to report on odour measurements.
• Annex C Glossary contains an extensive list of terms
and definitions for odour related concepts.
• Annex D References lists the literature references
• Annex E Contour plots for screening assessment
provides standard contour plots for different pig unit
sizes
2.1.3 Conventions
A number between square parentheses indicates a
reference to the literature, e.g. [1]. These numbers refer to
the list of references, in Annex D References. All costs
are expressed in Euros (€).
Odour Impacts and Odour Emission Control Measures for Intensive Agriculture
8
This chapter provides an overview of the main
characteristics of the pig production sector in Ireland.
The information provided by the Teagasc Pig Advisory
Service has been invaluable in preparing this chapter.
3.1 Overview of the pig production sector and its economics
Pigs are produced to be sold at a profit. That implies that
economics determine the dynamics of the pig
production sector. The profitability also determines the
ability of the pig producers to invest to adapt to market
conditions, including environmental requirements, such
as odour abatement.
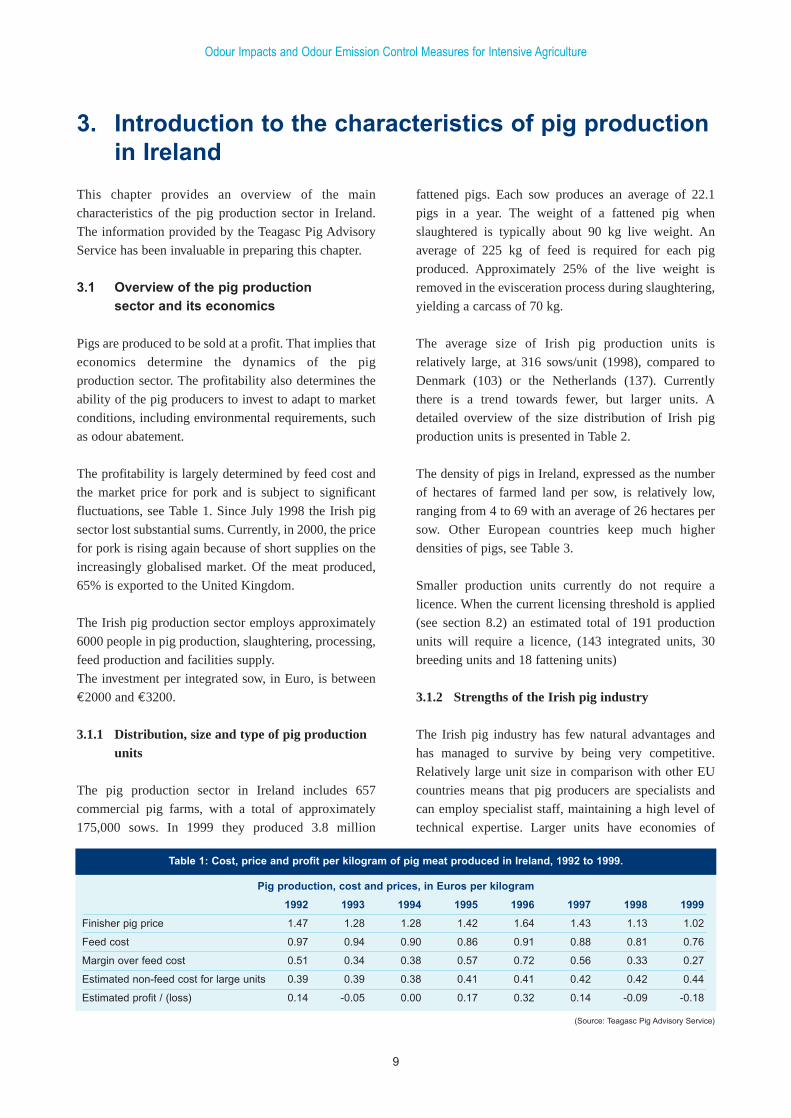
The profitability is largely determined by feed cost and
the market price for pork and is subject to significant
fluctuations, see Table 1. Since July 1998 the Irish pig
sector lost substantial sums. Currently, in 2000, the price
for pork is rising again because of short supplies on the
increasingly globalised market. Of the meat produced,
65% is exported to the United Kingdom.
The Irish pig production sector employs approximately
6000 people in pig production, slaughtering, processing,
feed production and facilities supply.
The investment per integrated sow, in Euro, is between
€2000 and €3200.
3.1.1 Distribution, size and type of pig production units
The pig production sector in Ireland includes 657
commercial pig farms, with a total of approximately
175,000 sows. In 1999 they produced 3.8 million
Odour Impacts and Odour Emission Control Measures for Intensive Agriculture
9
3. Introduction to the characteristics of pig productionin Ireland
fattened pigs. Each sow produces an average of 22.1
pigs in a year. The weight of a fattened pig when
slaughtered is typically about 90 kg live weight. An
average of 225 kg of feed is required for each pig
produced. Approximately 25% of the live weight is
removed in the evisceration process during slaughtering,
yielding a carcass of 70 kg.
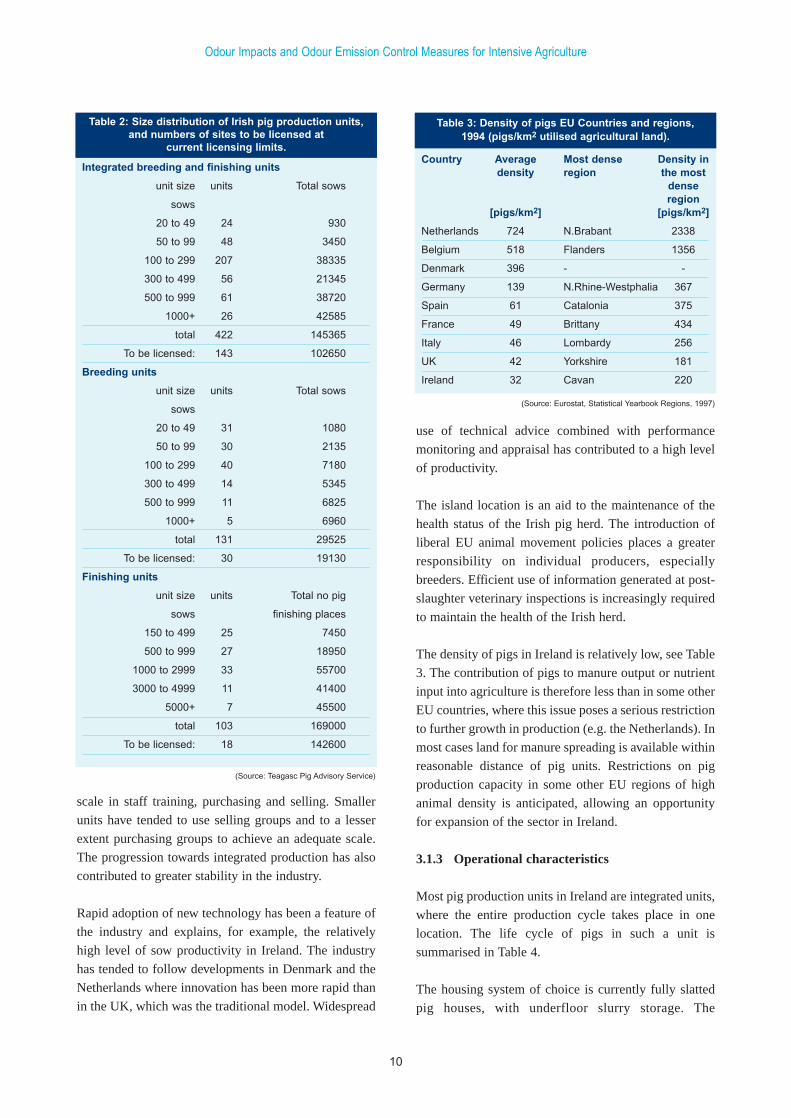
The average size of Irish pig production units is
relatively large, at 316 sows/unit (1998), compared to
Denmark (103) or the Netherlands (137). Currently
there is a trend towards fewer, but larger units. A
detailed overview of the size distribution of Irish pig
production units is presented in Table 2.
The density of pigs in Ireland, expressed as the number
of hectares of farmed land per sow, is relatively low,
ranging from 4 to 69 with an average of 26 hectares per
sow. Other European countries keep much higher
densities of pigs, see Table 3.
Smaller production units currently do not require a
licence. When the current licensing threshold is applied
(see section 8.2) an estimated total of 191 production
units will require a licence, (143 integrated units, 30
breeding units and 18 fattening units)
3.1.2 Strengths of the Irish pig industry
The Irish pig industry has few natural advantages and
has managed to survive by being very competitive.
Relatively large unit size in comparison with other EU
countries means that pig producers are specialists and
can employ specialist staff, maintaining a high level of
technical expertise. Larger units have economies of
Pig production, cost and prices, in Euros per kilogram
1992 1993 1994 1995 1996 1997 1998 1999
Finisher pig price 1.47 1.28 1.28 1.42 1.64 1.43 1.13 1.02
Feed cost 0.97 0.94 0.90 0.86 0.91 0.88 0.81 0.76
Margin over feed cost 0.51 0.34 0.38 0.57 0.72 0.56 0.33 0.27
Estimated non-feed cost for large units 0.39 0.39 0.38 0.41 0.41 0.42 0.42 0.44
Estimated profit / (loss) 0.14 -0.05 0.00 0.17 0.32 0.14 -0.09 -0.18
Table 1: Cost, price and profit per kilogram of pig meat produced in Ireland, 1992 to 1999.
(Source: Teagasc Pig Advisory Service)
scale in staff training, purchasing and selling. Smaller
units have tended to use selling groups and to a lesser
extent purchasing groups to achieve an adequate scale.
The progression towards integrated production has also
contributed to greater stability in the industry.
Rapid adoption of new technology has been a feature of
the industry and explains, for example, the relatively
high level of sow productivity in Ireland. The industry
has tended to follow developments in Denmark and the
Netherlands where innovation has been more rapid than
in the UK, which was the traditional model. Widespread
Odour Impacts and Odour Emission Control Measures for Intensive Agriculture
10
Integrated breeding and finishing units
unit size units Total sows
sows
20 to 49 24 930
50 to 99 48 3450
100 to 299 207 38335
300 to 499 56 21345
500 to 999 61 38720
1000+ 26 42585
total 422 145365
To be licensed: 143 102650
Breeding units
unit size units Total sows
sows
20 to 49 31 1080
50 to 99 30 2135
100 to 299 40 7180
300 to 499 14 5345
500 to 999 11 6825
1000+ 5 6960
total 131 29525
To be licensed: 30 19130
Finishing units
unit size units Total no pig
sows finishing places
150 to 499 25 7450
500 to 999 27 18950
1000 to 2999 33 55700
3000 to 4999 11 41400
5000+ 7 45500
total 103 169000
To be licensed: 18 142600
Table 2: Size distribution of Irish pig production units,and numbers of sites to be licensed at
current licensing limits.
(Source: Teagasc Pig Advisory Service)
Country Average Most dense Density indensity region the most
denseregion
[pigs/km2] [pigs/km2]
Netherlands 724 N.Brabant 2338
Belgium 518 Flanders 1356
Denmark 396 - -
Germany 139 N.Rhine-Westphalia 367
Spain 61 Catalonia 375
France 49 Brittany 434
Italy 46 Lombardy 256
UK 42 Yorkshire 181
Ireland 32 Cavan 220
Table 3: Density of pigs EU Countries and regions,1994 (pigs/km2 utilised agricultural land).
(Source: Eurostat, Statistical Yearbook Regions, 1997)
use of technical advice combined with performance
monitoring and appraisal has contributed to a high level
of productivity.
The island location is an aid to the maintenance of the
health status of the Irish pig herd. The introduction of
liberal EU animal movement policies places a greater
responsibility on individual producers, especially
breeders. Efficient use of information generated at post-
slaughter veterinary inspections is increasingly required
to maintain the health of the Irish herd.
The density of pigs in Ireland is relatively low, see Table
3. The contribution of pigs to manure output or nutrient
input into agriculture is therefore less than in some other
EU countries, where this issue poses a serious restriction
to further growth in production (e.g. the Netherlands). In
most cases land for manure spreading is available within
reasonable distance of pig units. Restrictions on pig
production capacity in some other EU regions of high
animal density is anticipated, allowing an opportunity
for expansion of the sector in Ireland.
3.1.3 Operational characteristics
Most pig production units in Ireland are integrated units,
where the entire production cycle takes place in one
location. The life cycle of pigs in such a unit is
summarised in Table 4.
The housing system of choice is currently fully slatted
pig houses, with underfloor slurry storage. The
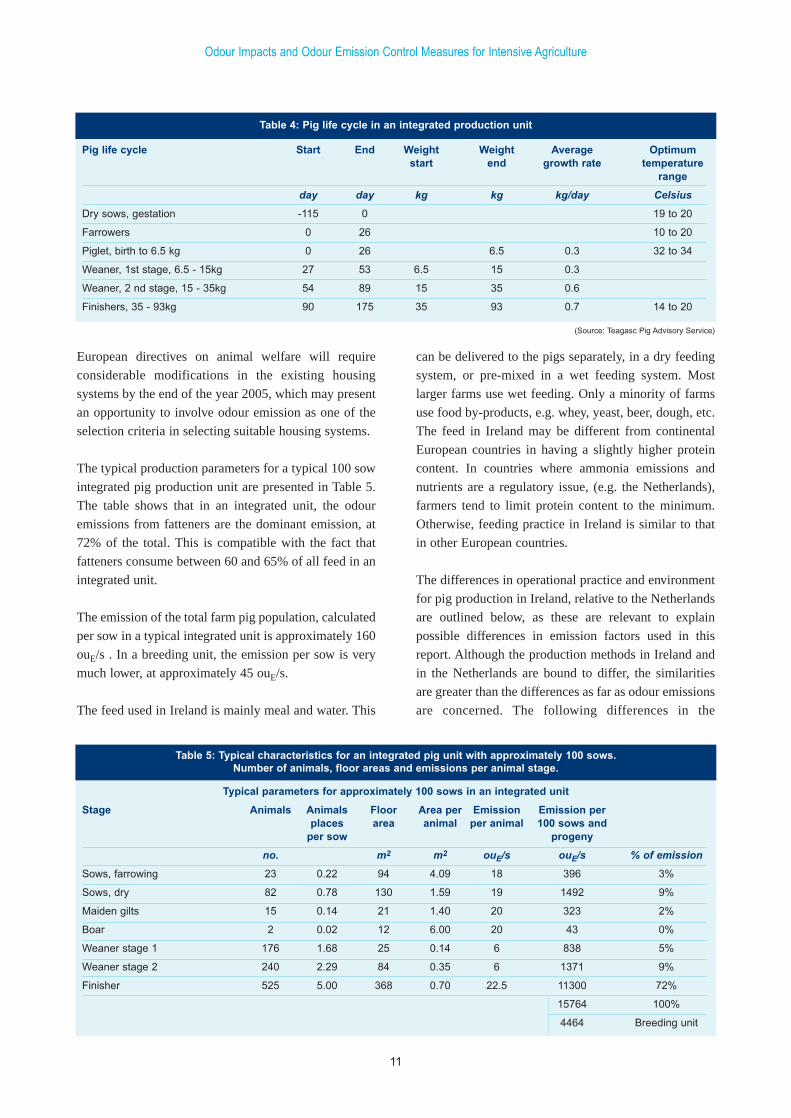
European directives on animal welfare will require
considerable modifications in the existing housing
systems by the end of the year 2005, which may present
an opportunity to involve odour emission as one of the
selection criteria in selecting suitable housing systems.
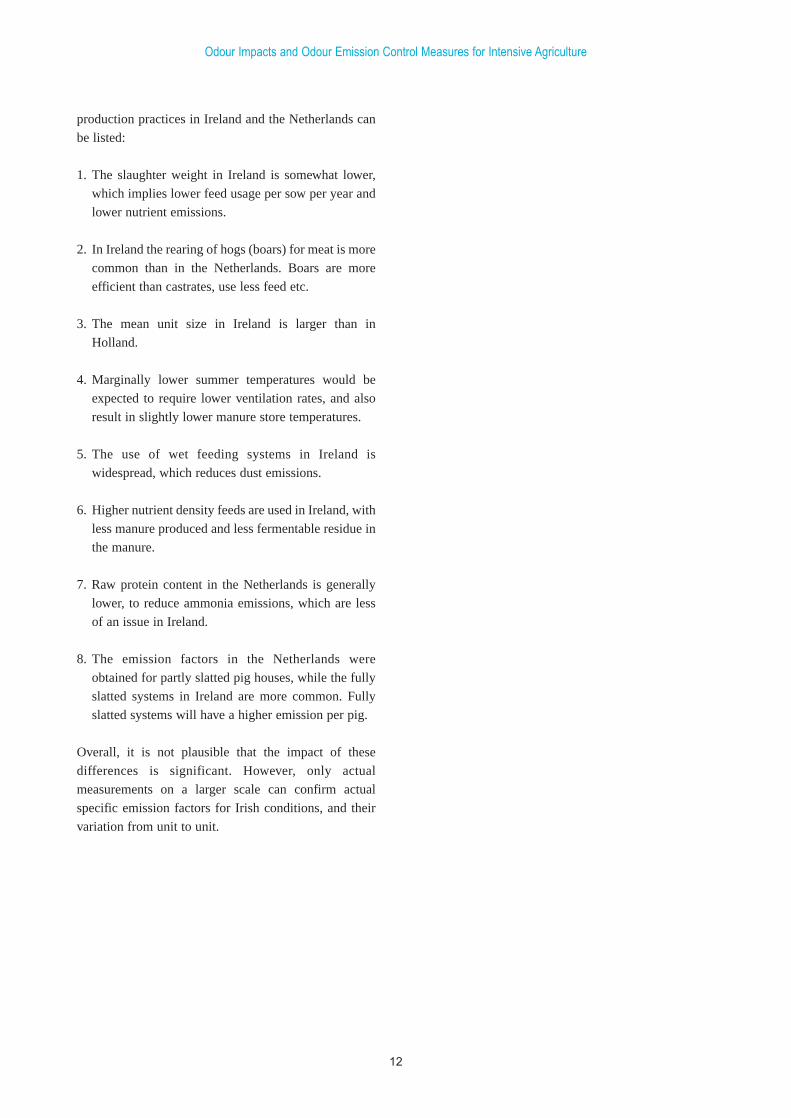
The typical production parameters for a typical 100 sow
integrated pig production unit are presented in Table 5.
The table shows that in an integrated unit, the odour
emissions from fatteners are the dominant emission, at
72% of the total. This is compatible with the fact that
fatteners consume between 60 and 65% of all feed in an
integrated unit.
The emission of the total farm pig population, calculated
per sow in a typical integrated unit is approximately 160
ouE/s . In a breeding unit, the emission per sow is very
much lower, at approximately 45 ouE/s.
The feed used in Ireland is mainly meal and water. This
can be delivered to the pigs separately, in a dry feeding
system, or pre-mixed in a wet feeding system. Most
larger farms use wet feeding. Only a minority of farms
use food by-products, e.g. whey, yeast, beer, dough, etc.
The feed in Ireland may be different from continental
European countries in having a slightly higher protein
content. In countries where ammonia emissions and
nutrients are a regulatory issue, (e.g. the Netherlands),
farmers tend to limit protein content to the minimum.
Otherwise, feeding practice in Ireland is similar to that
in other European countries.
The differences in operational practice and environment
for pig production in Ireland, relative to the Netherlands
are outlined below, as these are relevant to explain
possible differences in emission factors used in this
report. Although the production methods in Ireland and
in the Netherlands are bound to differ, the similarities
are greater than the differences as far as odour emissions
are concerned. The following differences in the
Odour Impacts and Odour Emission Control Measures for Intensive Agriculture
11
Pig life cycle Start End Weight Weight Average Optimumstart end growth rate temperature
range
day day kg kg kg/day Celsius
Dry sows, gestation -115 0 19 to 20
Farrowers 0 26 10 to 20
Piglet, birth to 6.5 kg 0 26 6.5 0.3 32 to 34
Weaner, 1st stage, 6.5 - 15kg 27 53 6.5 15 0.3
Weaner, 2 nd stage, 15 - 35kg 54 89 15 35 0.6
Finishers, 35 - 93kg 90 175 35 93 0.7 14 to 20
Table 4: Pig life cycle in an integrated production unit
(Source: Teagasc Pig Advisory Service)
Typical parameters for approximately 100 sows in an integrated unit
Stage Animals Animals Floor Area per Emission Emission per places area animal per animal 100 sows and
per sow progeny
no. m2 m2 ouE/s ouE/s % of emission
Sows, farrowing 23 0.22 94 4.09 18 396 3%
Sows, dry 82 0.78 130 1.59 19 1492 9%
Maiden gilts 15 0.14 21 1.40 20 323 2%
Boar 2 0.02 12 6.00 20 43 0%
Weaner stage 1 176 1.68 25 0.14 6 838 5%
Weaner stage 2 240 2.29 84 0.35 6 1371 9%
Finisher 525 5.00 368 0.70 22.5 11300 72%
15764 100%
4464 Breeding unit
Table 5: Typical characteristics for an integrated pig unit with approximately 100 sows.Number of animals, floor areas and emissions per animal stage.
production practices in Ireland and the Netherlands can
be listed:
1. The slaughter weight in Ireland is somewhat lower,
which implies lower feed usage per sow per year and
lower nutrient emissions.
2. In Ireland the rearing of hogs (boars) for meat is more
common than in the Netherlands. Boars are more
efficient than castrates, use less feed etc.
3. The mean unit size in Ireland is larger than in
Holland.
4. Marginally lower summer temperatures would be
expected to require lower ventilation rates, and also
result in slightly lower manure store temperatures.
5. The use of wet feeding systems in Ireland is
widespread, which reduces dust emissions.
6. Higher nutrient density feeds are used in Ireland, with
less manure produced and less fermentable residue in
the manure.
7. Raw protein content in the Netherlands is generally
lower, to reduce ammonia emissions, which are less
of an issue in Ireland.
8. The emission factors in the Netherlands were
obtained for partly slatted pig houses, while the fully
slatted systems in Ireland are more common. Fully
slatted systems will have a higher emission per pig.
Overall, it is not plausible that the impact of these
differences is significant. However, only actual
measurements on a larger scale can confirm actual
specific emission factors for Irish conditions, and their
variation from unit to unit.
Odour Impacts and Odour Emission Control Measures for Intensive Agriculture
12
Summary: This chapter aims to provide a level of
operational knowledge that is deemed adequate as
general background information for professionals
involved in odour annoyance management. The
following themes are discussed in this chapter:
• Odour perception: the function of our sense of smell
and its evolutionary development;
• Characterising odours: the various attributes used to
characterise odours, and the method of measurement;
• The mechanism that leads from the production of
odourants from pig production units to odour
nuisance complaints
4.1 Odour perception
The chemical senses, for smell (olfaction) and taste
(gustation), are generally considered to be the oldest
ones in evolutionary development. Although humans are
a relatively recent development in evolutionary terms,
the function of our sense of smell is the same as for other
species: it helps us to evaluate our environment. In
simple terms of behaviour, perception of odours can lead
to two basic behavioural responses: avoidance or
approach. These responses can occur for example in
judging food or water, but also in a social or sexual
context.
The human sense of smell helps us to assess our
environment in a very direct manner. The sensor in the
nose cavity is a direct interface between the brain and
the environment. It is a highly sophisticated sense,
which interacts with our life and behaviour on many
levels. The process of odour detection, perception and
evaluation is therefore understandably complex.
Humans can detect and differentiate up to 3000 odours.
Recent research indicates that as many as 1000 genes
out of the total of 100,000 in our genome are dedicated
to our sense of smell. This significant proportion of 1%
suggests that the sense of smell is of considerable
importance in evolutionary terms.
The sense of smell is closely related to long-term
memory. The nerves that connect the sensor to the brain
lead directly to the hippocampus, which is the part of the
brain that regulates basic functions, such as the
organisation of long-term memory and emotions. It is,
therefore, not surprising that smells are often highly
associative and can elicit vivid memories of experiences
that occurred even in early childhood. This associative
aspect is highly relevant to environmental odours. Once
a negative association is formed, it is very difficult to
change the appreciation of that particular odour stimulus
in an individual. This helps to explain why an odour
problem from the past often seems to haunt site
operators, even after the odour emissions have been
significantly reduced.
When an ambient odour is detected by our senses it
starts a chain of events. During sensory perception, the
detectability, intensity, and character of the odour
stimulus are determined. This information is then
processed in the brain, in the cognitive appraisal
process. At this stage the perception information input is
combined with various sources of reference information,
such as the history of perception, associative
information with previous similar perception events,
information on the current visual, social, etc.,
behavioural status and information about the
environmental context etc. If this appraisal leads to a
negative appreciation of the perceived odour, in the
current behavioural context, the relevance needs to be
determined, and the appropriate behaviour needs to be
displayed in response. This phase of the process is
characterised as ‘coping’. One type of ‘coping’
behaviour involves undertaking actions to remove the
cause of the negative appraisal (remove the source).
Another type of ‘coping’ is aimed at reducing the
emotional impact of the negative appraisal, by
‘reasoning’ that the cause is not so relevant after all and
is better ignored. Repeated ‘annoyance events’ as a
result of ambient stressors, such as odour, over a
considerable period of time, may lead to nuisance,
which in turn may result in complaints.
Most odours can cause odour annoyance when they are
intermittently clearly detectable. Even odours that are
commonly not identified as unpleasant, such as coffee
Odour Impacts and Odour Emission Control Measures for Intensive Agriculture
13
4. Introduction to odours as an environmental stressor
roasting odours, cause odour annoyance in a population
that is exposed to sufficiently high concentrations of
odours intermittently, but regularly, over prolonged
periods.
4.2 Characterising odours: psychophysical dimensions of odour perception
The sensory perception of odourants can be
characterised by four major attributes or dimensions:
• detectability;
• intensity;
• hedonic tone;
• odour quality.
A fifth attribute has been proposed recently[1], to
characterise the propensity of an odour to cause odour
annoyance. However, no operational method for
characterisation and interpretation is available for this
fifth attribute:
• annoyance potential.
In addition to the sensory dimensions used to describe
how odourants act when perceived as odours, efforts are
ongoing to devise a more technical approach to
characterise odourants, using analysis of the chemicals
involved. The approach can be to look at simple key
substances that can be perceived as an odour, such as
H2S or ammonia. It may involve measuring a tracer
component that is non-odorous itself, but occurs with
the odourants, e.g. methane as a tracer for landfill gas.
Finally, an attempt can be made to actually measure a
multitude of odourants in the mixture, using advanced
analytical methods such as GC-MS or ‘electronic nose’
devices. The practical application of such methods is, so
far, limited. The sensitivity of the analytical methods is
usually not nearly sufficient to approach that of the
human nose, and the poor capability to predict or model
the actual odour perception in humans on the basis of
measured parameters is poor.
The different dimensions used for characterising odours,
the methods for assessment of odour samples and the
units used to report measurement results are described in
some detail in chapter Annex B of this report, titled
Methods for odour assessment and units of
measurement.
4.2.1 The common traits of units used for odour and noise assessment
Our senses are equipped to respond to a wide range of
stimuli. Our ears detect faint sounds, but can also cope
with very loud noises: from a whisper to a roar. We can
pick out a specific conversation in a room full of loud
conversation. The response characteristics of our sense
of smell are similar. It is, therefore, helpful to consider
the way in which we describe environmental noise, and
identify the relevant similarities with units used to
characterise odours.
The stimulus for noise is vibration of the air. The energy
of that vibration determines the strength of the stimulus.
This energy is measured in linear units, Watts per square
metre, (W/m2). The energy that is picked up by the
human ear is an even smaller quantity. Our eardrum is
only 1 cm2, or 10-4 m2. Our ear, therefore, can perceive
an energy level of 10-16 W, which is very little.
The loudest noise that we can perceive is close to the
pain limit, where hearing turns to hurting. The stimulus
there is 10 W/m2, or an energy uptake of 10-3 W by our
eardrum.
As powers of ten are not the most intuitive of measures,
we use logarithmic measures to describe these stimuli,
where the number of zeros, or the powers of ten, are
more important than the difference between two
numbers like 3000 and 5000, for example.
The idea to describe a signal, or stimulus, in terms of a
logarithm of the proportion (or ratio) between the actual
value and the detection threshold, is attributed to
Alexander Graham Bell (1847-1922), the inventor of the
telephone. He was interested in describing the strength
of signals, and coined the unit: bel.
Odour Impacts and Odour Emission Control Measures for Intensive Agriculture
14
In mathematical terms:
where I is the strength of the signal, and I0 is the smallest
detectable signal. As this measure is a bit crude, the
decibel is more common:
The decibel is best known for describing noise levels.
In noise levels, the reference value I0 is the detection
threshold for a sound of 1000 Hz frequency, established
experimentally, in sensory experiments using young
people as panel members.
Therefore, I0 = 10-12 W/m2 at 1000 Hz, and a stimulus of
10-12 W/m2 0 dB.
The same model can be applied to odour intensity[2]. In
the European standard EN13725 the threshold value, or
zero odour decibel is defined as equivalent to an odour
of 40 ppb n-butanol. The choice of a particular odour is
not dissimilar to defining a particular frequency for
noise.
So, if 0 dBod 40 ppb n-butanol = 1 ouE/m3, then odours
can be expressed, just like noise, in decibels; dBod.
For the reference odour, the mathematics work very
well. The stimulus of 4000 ppb = 4 ppm n-butanol can
be described as:
For other odours, the reference may be different. For
sound a number of different reference levels are used,
hence the variety in decibels: dB(A), dB(B) and dB(C),
all with a slightly different reference value, each defined
as a spectrum of a defined set of frequencies.
So, the strength, or intensity of both noise and smell can
be defined on the basis of a detection threshold for a
particular stimulus in people.
The anchor for the odour unit is the detection threshold,
which has been defined using 40 ppb of reference
odourant n-butanol, based on tests with human subjects.
This detection threshold is described by 1 ouE/m3 which
is equivalent to 0 dBod.
The anchor for noise is the detection threshold for a
sound of 1000Hz in W/m2, experimentally determined
to be approximately 10-12 W/m2 in young people.
A sound at the upper end of the sensory range of hearing
(extremely loud) is 130 dB. In linear terms, the energy
of that sound is 10,000,000,000,000 times the detection
threshold, in linear units of W/m2.
For odour, the range between detection thresholds and
unbearably strong smells is smaller, but still
considerable. Odours at the high end of the intensity
range (extremely strong) may contain hundreds of
thousands or even millions of ouE/m3. Therefore the
range of odour intensities, in dBod, is open ended, but
relevant in the range of 0 to 60.
Although the dBod has been proposed some time ago[2],
and is also included in the draft standard EN13725, it is
not commonly used. When interpreting odour
measurements it is, however, useful to realise that the
odour concentration, ouE/m3 is a linear unit, just like
W/m2 for noise. The principal similarity between these
units is that their relation to perceived intensity cannot
easily be interpreted intuitively. These linear parameters
tend to reach very large values, making clumsy numbers
in practical use.
By using dB units, similar to noise, odour intensity can
be associated with a more tangible unit, directly
comparable to the decibel used in noise assessment. For
example, a reduction in odour concentration by a filter
with 90% efficiency amounts to a reduction with 10
dBod while a filter performing at 99% abatement
efficiency achieves a 20 dBod reduction in odour
intensity.
4.3 The mechanism leading from pig smell to odour nuisance
Pig producers have a responsibility to minimise the
impact of their activity in the vicinity of their production
site. They have a legal obligation to avoid impairment of
amenities. Odours are probably the predominant
nuisance issue for pig producers, with the potential to
reach well beyond the limits of the production site.
Odour nuisance can develop after long-term intermittent
exposure to odours that cause a negative appraisal in the
individual concerned. It has to do directly with the way
Odour Impacts and Odour Emission Control Measures for Intensive Agriculture
15
L = log(I I0)
L = 10 . log(I I0)
L = 10 . log(400040) = 10 . log(102) = 20 dBOD
we value our environment. It is not a straightforward
process. Our attitudes towards the source, the
inevitability of the exposure and the aesthetic
expectations regarding our residential environment are
some of the less tangible factors that are relevant to the
probability of experiencing nuisance. Once the balance
tips, and an environmental stressor, such as a livestock
odour, becomes a nuisance to an individual, it is very
difficult to reverse the process. What used to be a faint
odour has now become a stimulus associated with
annoyance. Once the first complaint has been made, the
problem becomes much more serious than before for all
those affected.
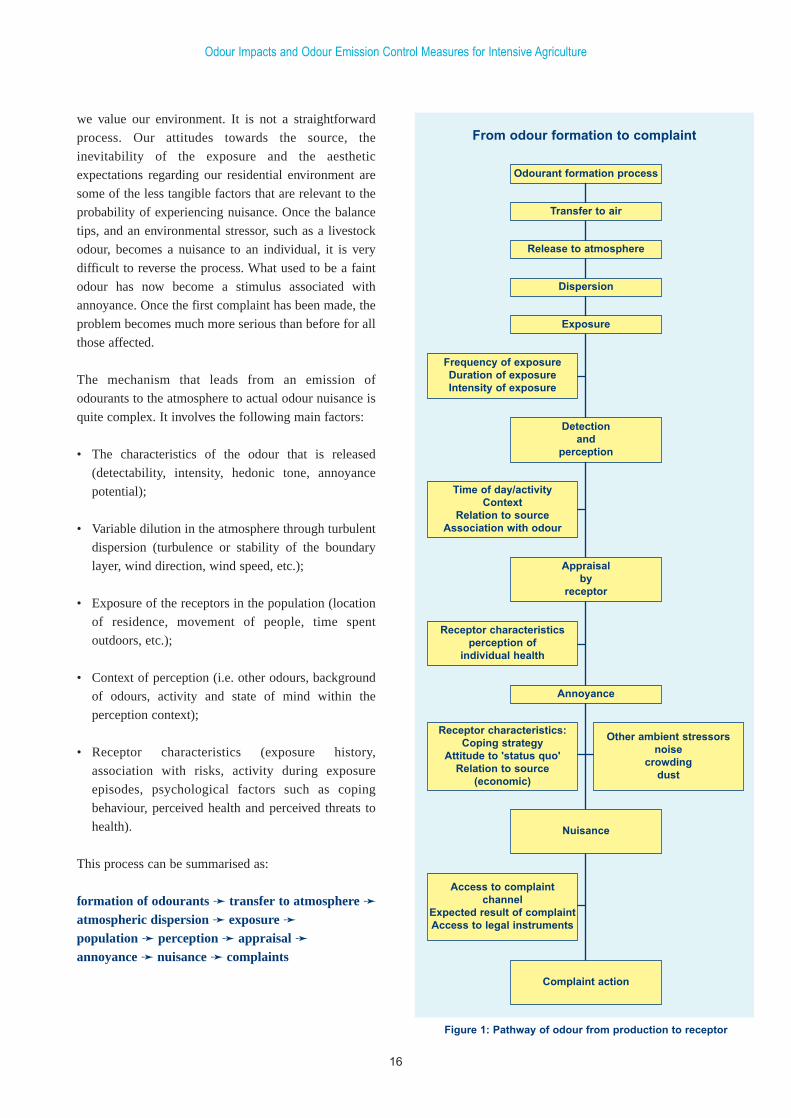
The mechanism that leads from an emission of
odourants to the atmosphere to actual odour nuisance is
quite complex. It involves the following main factors:
• The characteristics of the odour that is released
(detectability, intensity, hedonic tone, annoyance
potential);
• Variable dilution in the atmosphere through turbulent
dispersion (turbulence or stability of the boundary
layer, wind direction, wind speed, etc.);
• Exposure of the receptors in the population (location
of residence, movement of people, time spent
outdoors, etc.);
• Context of perception (i.e. other odours, background
of odours, activity and state of mind within the
perception context);
• Receptor characteristics (exposure history,
association with risks, activity during exposure
episodes, psychological factors such as coping
behaviour, perceived health and perceived threats to
health).
This process can be summarised as:
formation of odourants ➛ transfer to atmosphere ➛atmospheric dispersion ➛ exposure ➛population ➛ perception ➛ appraisal ➛annoyance ➛ nuisance ➛ complaints
Odour Impacts and Odour Emission Control Measures for Intensive Agriculture
16
Odourant formation process
Transfer to air
Release to atmosphere
Dispersion
Exposure
Frequency of exposureDuration of exposureIntensity of exposure
Detection and
perception
Time of day/activityContext
Relation to sourceAssociation with odour
Appraisalby
receptor
Nuisance
Access to complaintchannel
Expected result of complaintAccess to legal instruments
Complaint action
Receptor characteristicsperception of
individual health
Annoyance
Receptor characteristics:Coping strategy
Attitude to 'status quo'Relation to source
(economic)
Other ambient stressorsnoise
crowdingdust
Figure 1: Pathway of odour from production to receptor
From odour formation to complaint
When we look at the underlying mechanisms, the factors
that play a role are more diverse and mutually
interactive, as is illustrated in Figure 1.
For practical purposes, such as regulatory use, the
complex relationship between nuisance (effect) and
exposure to odours (dose) can be described in a
simplified model that does not take into account all these
different factors. The dose-effect model linking
‘exposure to odours’ to ‘nuisance’ is typically described
as the relation between modelled exposure and
annoyance as measured by a standardised telephone
questionnaire or, alternatively, complaint records.
Epidemiological methods are used to describe this
relationship.
The exposure is typically quantified in terms of a
frequency of occurrence of hourly average
concentrations above a certain limit odour
concentration, e.g. 5 odour units per metre cubed
(ouE/m3) as a 98-percentile of hourly averages of odour
concentration for a year with average meteorology. In
short notation: C98, 1-hour = 5 ouE/m3. This measure of
exposure is calculated from an estimated or measured
odour emission from the source, using an atmospheric
dispersion model.
Air quality criteria for odour can be set on the basis of
combining calculated exposure with knowledge of the
dose response relationship to quantify and assess odour
impact. However, this relationship will not be the same
for every community. It is determined by factors such as
crowding, expectations of environmental quality,
economic priorities, etc. Although odour can have direct
effects on well-being, and hence on health, it is to some
degree an aesthetic factor in environmental quality.
To set environmental exposure criteria with a view to
avoiding odour nuisance is, therefore, not only a
scientific, but also a political process. The range of
political discretion is limited, however. Unlike other air
pollutants, every citizen with a functioning nose can
assess odour real-time. The appraisal is immediate and
the outcome is readily communicated to the relevant
authority in the form of complaints.
Odour Impacts and Odour Emission Control Measures for Intensive Agriculture
17

Odour Impacts and Odour Emission Control Measures for Intensive Agriculture
18
This section describes different methods for assessing
odour impact. Some of these methods start with the
effect, by primarily studying the people involved and
their behaviour. This same perspective can be used
experimentally, using trained field panels for conducting
field observations, either for a short period of time or for
a period of many months.
The most common method for impact assessment,
however, is to use knowledge of the dose-effect
relationship between odour exposure and annoyance to
predict annoyance levels on the basis of calculated
exposure. The starting point for calculated exposure is
measurement of odour emissions at the source.
Measuring odour concentrations ‘at the site boundary’ is
not an effective method, even though it would fit well
with the legal approach to nuisance. The variability that
is introduced by weather conditions and the practical
difficulty of measuring odours at very low
concentrations, ≤ 20 ouE/m3, are so far insurmountable
methodological obstacles for measuring an interpreting
‘ambient odour concentrations’.
5.1 Assessment of effects
5.1.1 Direct measurement of percentage of people annoyed
The Standardised Telephone Questionnaire (STQ, also
known by the acronym: TLO) is used to measure the
percentage of people annoyed in a sample of the
population[3]. The main application is to determine dose-
effect relationships, either in general or for a particular
site.
The TLO is typically applied to sufficiently large
samples of the exposed population, in at least four study
areas, with different exposure levels. By collecting at
least 100, preferably 200, TLO results for each exposure
test area, a dose-effect relationship can be established.
There is no standard document with a protocol for this
technique, although a unity of application exists in
practice in the Netherlands, where the method has been
applied relatively widely[3]. A specific large scale dose-
effect study for pig production odours has been carried
out there recently[4], and is an important contribution to
the data underlying this report (see also section 6.2). The
method requires specialised expertise. Specialised odour
survey firms with suitable experience are required to
apply the methodology successfully.
The cost of such a survey is in the order of €15,000, for
one site. Its application in specific licensing cases is
limited, as in most cases the number of people exposed
is insufficient to apply the method successfully. Direct
measurement of annoyance is a valuable method to
determine the underlying dose-effect relationships, in
carefully selected case studies.
5.1.2 Complaints analysis
Complaint analysis is not covered by any standard
method or recognised protocol. Usually complaints are
registered by local, regional or even national authorities
or by companies who have a customer relations system
that can be adapted for complaint registration.
Complaints registration provides an insight into the
prevalence of a symptom of odour annoyance, but not of
the prevalence of the annoyance itself. There are many
factors at play that determine the ease or difficulty of
registering a complaint. Therefore, complaint data must
be interpreted with some caution. Registered complaints
are a very strong indication that odour nuisance is a
reality in a specific situation. However, the absence of
registered complaints does not necessarily indicate the
absence of nuisance. Also, once a conflict situation
develops over odour emissions, the registering of
complaints can become a tool in the fight, when
residents use orchestrated complaints as a political lever
to move the argument in their favour.
The approach in setting up complaints registration and
analysis must be determined and tailored to the purpose
of the registration.
Odour Impacts and Odour Emission Control Measures for Intensive Agriculture
19
5. Impact assessment methodology
The minimum information that needs to be collected for
each complaint is:
• Location where the offensive odour occurred, within
approximately 100m. (i.e. address complete with
house number);
• Date and time when the offensive odour was
observed;
• Characterisation of offensive odour, preferably on the
basis of a choice from standardised descriptors;
• Preferably the identity of the complainant, to assess
repeated nature of complaints;
• Residential address of complainant.
In complaint analysis each complaint should be verified
and collated with additional information:
• Wind direction, wind speed and stability class at the
time of complaint;
• Any process incidents at the time of complaint.
The benefits of a complaints registration system can be
greatly improved by implementing a standard protocol
for complaint data registration and processing.
Professional advice, including co-ordination with
complaint registration units of the local authority or
other organisations, is advisable.
A quick and adequate response to complainants is vital
in those situations where community relations can be
improved. This part of the complaints response process
should be regarded as a fully-fledged method of
annoyance reduction, as it can be very beneficial indeed
to reduce anxiety in the complainant by adequate
response and supply of information.
The results of complaint registration and response
should be fully analysed periodically.
5.2 Direct assessment of odour exposure
5.2.1 Direct field methods
5.2.1.1 Field panels, short-term evaluations
Field panel measurements provide an estimate of total
emissions from a source, including all diffuse sources.
Field panels consist of 4 to 6 trained, qualified panel
members selected using the same criteria as used for the
odour laboratory, according to prEN13725. The field
panel makes observations on locations in the field,
usually to determine the maximum distance of
detectability of the odour from a particular source. This
result, combined with the meteorological conditions
during the field observations, is used for ‘reverse
dispersion modelling’, which gives an estimated source
emission rate as a result. Field panels can also be used to
provide information on odour intensity and/or hedonic
tone in field conditions.
A practical test procedure is described here. At any
given location the panel makes observations every 10
seconds, for a duration of up to ten minutes. By
traversing the ‘plume’ at intersections at varying
distances, the results are gathered in the course of a
number of hours[35]. The technique has been applied for
a number of years, in some countries, in applied odour
research. An unofficial guideline for carrying out these
measurements has been published in the Netherlands[6],
while in Germany a guideline has also been published:
VDI3940:1993[7].
Field panels can not only be used for evaluating
detectability of the source as a whole but also as a more
‘analytical’ instrument by teaching the panel to identify
specific smells on-site and using this perceptive
expertise to identify individual sources downwind.
Using this technique the following information is
recorded: type of smell, intensity and relative annoyance
potential to the overall off-site smell. This provides
useful qualitative data, although they cannot lead to
decisive conclusions as they reflect an assessment by a
limited sample of the population, only briefly exposed to
these odours.
The field panel work requires certain weather conditions
and characterisation of meteorological conditions during
Odour Impacts and Odour Emission Control Measures for Intensive Agriculture
20
measurements (wind speed, wind direction and stability
class)
The inherent uncertainty of the method of measurement
is mainly determined by the inaccuracies involved in
characterising the turbulence in the mixing layer of the
atmosphere, and the relatively poor capabilities of
models to accurately predict short-term downwind
concentrations. Generally speaking, the results of
modelling impact on the basis of source emission data
will give a more reliable result. Field panel data can,
however, be invaluable in providing a field check based
on actual conditions, especially where sources are
complex and include diffuse sources (i.e. natural
ventilation, large area sources etc).
5.2.1.2 Field panels, long-term evaluations
In 1994 an odour regulation for industrial sources on the
basis of long-term field observations was introduced in
the state of Nordrheinland-Westfalen: Geruchs
Immissions Richtlinie (GIRL)[8]. This guideline is based
on measuring the actual frequency at which odours can
be perceived in the vicinity of the source in question,
over a period of 6 to 12 months.
A number of fixed observation points are determined, on
a regular grid, access allowing. A number of observers
are assigned to the task of making observations at these
points, according to a pre-determined schedule. The
assessor makes observations at 10-second intervals, over
a 10-minute period. The number of observations with a
positive detection is divided by the total number of
observations in the 10-minute period, and a percentage
of positive observation is calculated. If the percentage is
above a limit value, typically 10%, the measurement at
that point in that 10-minute interval is considered to be
an ‘odour hour’. The frequency of ‘odour hours’ is used
as the criterion to determine if a ‘relevant nuisance’
exists at that grid point. The limit value that is applied in
Germany for residential areas is 10%, while for trade
and industrial zones a more lenient 15% limit is applied.
The method requires approximately 26 measurements,
on different days, for each point, while allowing no more
than 5 of these measurements to be done by the same
assessor. The requirements for human resources are
therefore considerable.
The methodology is described in the guideline
VDI3940:1993 and in the GIRL[8].
The method has been applied to a pig fattening unit of
1760 fatteners. It was found that the criteria were not
met at distances of up to 1000 m from the pig unit[9].
The long-term field panel method is useful, in that its
methodology and approach are easily envisaged, and
understandable. The considerable resources and cost
involved are limiting factors in its practical application.
Concerns have been raised about the statistical basis of
the experimental design, when the assessment
programme is in any way limited because of practical
and/or cost implications.
5.3 Assessment of odour impact by measuring emissions at source, followed by dispersion modelling
This section describes the practical methods used to
assess odour emissions at source. The need for carrying
out such measurements for actual licensing purposes
will be limited, as reliable emission factors for odour
emissions for pigs at various stages of their life cycle are
available[10]. These emission factors were obtained using
the methods described in this section.
If emission factors are available, sampling can be
avoided, and estimated emissions can then be used as
input for atmospheric dispersion modelling, as described
in section 5.3.3.
5.3.1 Sampling
When sampling odours, appropriate Health & Safety
procedures must be applied. The Source Testing
Association (UK) has drafted specific guidelines for
environmental sampling.
Sampling must be carried out in accordance with the
CEN standard prEN13725 [11]. Samples are collected in
odour sampling bags made from a suitably odour free
material, such as Nalophane. Odour samples must be
analysed as quickly as possible, but no later than 30
hours after sample collection.
Odour Impacts and Odour Emission Control Measures for Intensive Agriculture
21
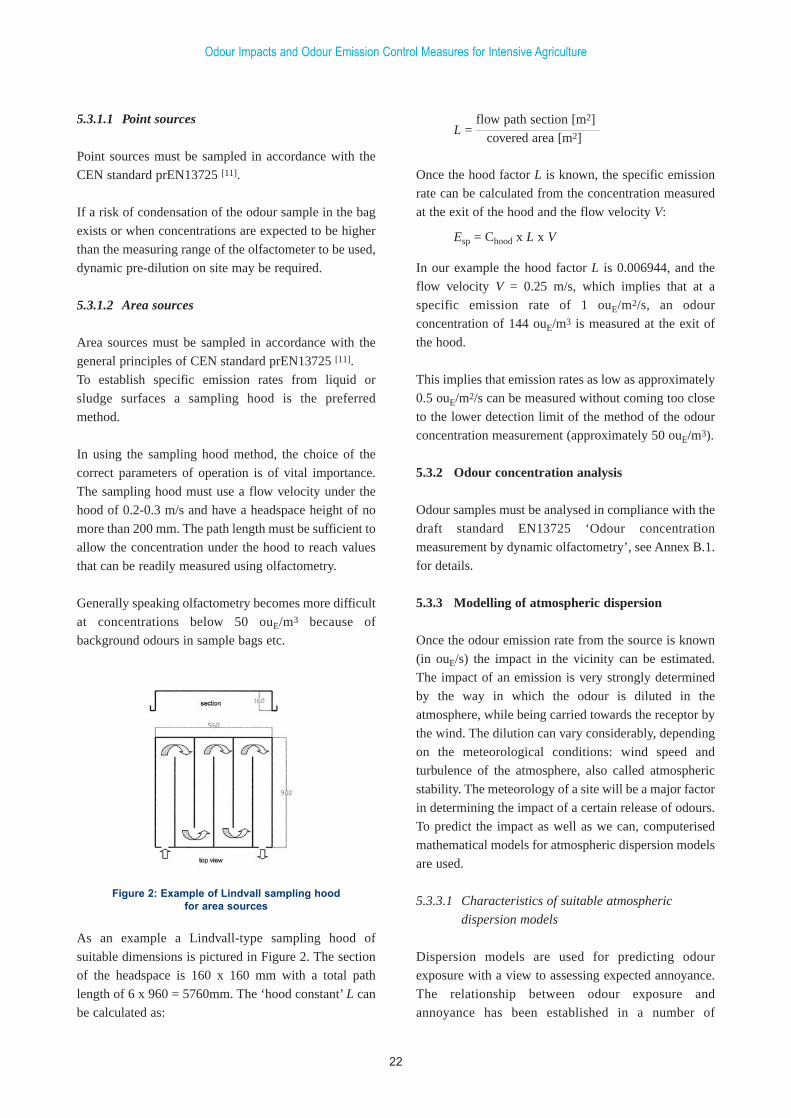
5.3.1.1 Point sources
Point sources must be sampled in accordance with the
CEN standard prEN13725 [11].
If a risk of condensation of the odour sample in the bag
exists or when concentrations are expected to be higher
than the measuring range of the olfactometer to be used,
dynamic pre-dilution on site may be required.
5.3.1.2 Area sources
Area sources must be sampled in accordance with the
general principles of CEN standard prEN13725 [11].
To establish specific emission rates from liquid or
sludge surfaces a sampling hood is the preferred
method.
In using the sampling hood method, the choice of the
correct parameters of operation is of vital importance.
The sampling hood must use a flow velocity under the
hood of 0.2-0.3 m/s and have a headspace height of no
more than 200 mm. The path length must be sufficient to
allow the concentration under the hood to reach values
that can be readily measured using olfactometry.
Generally speaking olfactometry becomes more difficult
at concentrations below 50 ouE/m3 because of
background odours in sample bags etc.
Once the hood factor L is known, the specific emission
rate can be calculated from the concentration measured
at the exit of the hood and the flow velocity V:
In our example the hood factor L is 0.006944, and the
flow velocity V = 0.25 m/s, which implies that at a
specific emission rate of 1 ouE/m2/s, an odour
concentration of 144 ouE/m3 is measured at the exit of
the hood.
This implies that emission rates as low as approximately
0.5 ouE/m2/s can be measured without coming too close
to the lower detection limit of the method of the odour
concentration measurement (approximately 50 ouE/m3).
5.3.2 Odour concentration analysis
Odour samples must be analysed in compliance with the
draft standard EN13725 ‘Odour concentration
measurement by dynamic olfactometry’, see Annex B.1.
for details.
5.3.3 Modelling of atmospheric dispersion
Once the odour emission rate from the source is known
(in ouE/s) the impact in the vicinity can be estimated.
The impact of an emission is very strongly determined
by the way in which the odour is diluted in the
atmosphere, while being carried towards the receptor by
the wind. The dilution can vary considerably, depending
on the meteorological conditions: wind speed and
turbulence of the atmosphere, also called atmospheric
stability. The meteorology of a site will be a major factor
in determining the impact of a certain release of odours.
To predict the impact as well as we can, computerised
mathematical models for atmospheric dispersion models
are used.
5.3.3.1 Characteristics of suitable atmospheric
dispersion models
Dispersion models are used for predicting odour
exposure with a view to assessing expected annoyance.
The relationship between odour exposure and
annoyance has been established in a number of
L =flow path section [m2]
covered area [m2]
Esp = Chood x L x V
As an example a Lindvall-type sampling hood of
suitable dimensions is pictured in Figure 2. The section
of the headspace is 160 x 160 mm with a total path
length of 6 x 960 = 5760mm. The ‘hood constant’ L can
be calculated as:
Odour Impacts and Odour Emission Control Measures for Intensive Agriculture
22
Figure 2: Example of Lindvall sampling hoodfor area sources
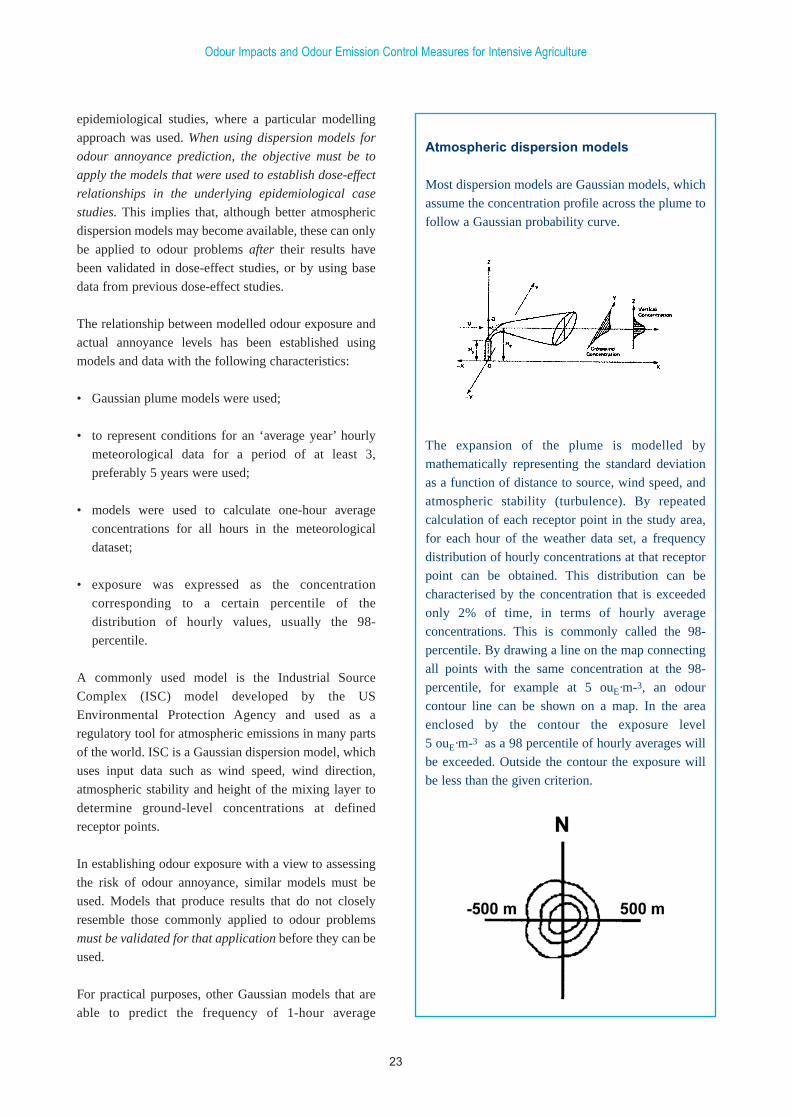
epidemiological studies, where a particular modelling
approach was used. When using dispersion models for
odour annoyance prediction, the objective must be to
apply the models that were used to establish dose-effect
relationships in the underlying epidemiological case
studies. This implies that, although better atmospheric
dispersion models may become available, these can only
be applied to odour problems after their results have
been validated in dose-effect studies, or by using base
data from previous dose-effect studies.
The relationship between modelled odour exposure and
actual annoyance levels has been established using
models and data with the following characteristics:
• Gaussian plume models were used;
• to represent conditions for an ‘average year’ hourly
meteorological data for a period of at least 3,
preferably 5 years were used;
• models were used to calculate one-hour average
concentrations for all hours in the meteorological
dataset;
• exposure was expressed as the concentration
corresponding to a certain percentile of the
distribution of hourly values, usually the 98-
percentile.
A commonly used model is the Industrial Source
Complex (ISC) model developed by the US
Environmental Protection Agency and used as a
regulatory tool for atmospheric emissions in many parts
of the world. ISC is a Gaussian dispersion model, which
uses input data such as wind speed, wind direction,
atmospheric stability and height of the mixing layer to
determine ground-level concentrations at defined
receptor points.
In establishing odour exposure with a view to assessing
the risk of odour annoyance, similar models must be
used. Models that produce results that do not closely
resemble those commonly applied to odour problems
must be validated for that application before they can be
used.
For practical purposes, other Gaussian models that are
able to predict the frequency of 1-hour average
Atmospheric dispersion models
Most dispersion models are Gaussian models, which
assume the concentration profile across the plume to
follow a Gaussian probability curve.
The expansion of the plume is modelled by
mathematically representing the standard deviation
as a function of distance to source, wind speed, and
atmospheric stability (turbulence). By repeated
calculation of each receptor point in the study area,
for each hour of the weather data set, a frequency
distribution of hourly concentrations at that receptor
point can be obtained. This distribution can be
characterised by the concentration that is exceeded
only 2% of time, in terms of hourly average
concentrations. This is commonly called the 98-
percentile. By drawing a line on the map connecting
all points with the same concentration at the 98-
percentile, for example at 5 ouE·m-3, an odour
contour line can be shown on a map. In the area
enclosed by the contour the exposure level
5 ouE·m-3 as a 98 percentile of hourly averages will
be exceeded. Outside the contour the exposure will
be less than the given criterion.
Odour Impacts and Odour Emission Control Measures for Intensive Agriculture
23
concentrations can be used.
The results are presented as contour lines for specific
frequencies of occurrence of odour concentration with
hourly average values above a certain limit value (air
quality criterion).
In this report, the COMPLEX atmospheric dispersion
model[26,27] was used to calculate overlay contours. This
US-EPA model, that is based on the widely used
MPTER and ISC models, has been adapted by
OdourNet to accommodate numerous sources (up to 999
sources) and to provide high percentile values (e.g. 95,
98 or 99.5 percentiles of 1-hour average calculated
concentration) that are used to evaluate odour impacts.
Odours, by the nature of our olfactory sense, which
responds almost immediately to a stimulus, has a very
much shorter time frame to cause effects in receptors
than most other common forms of air pollution.
However, dispersion models are not typically designed
nor validated to be used at averaging periods shorter
than 1 hour (see also section 5.3.5).
For the standard overlay contours, the hourly
meteorological data for Claremorris meteorological
station were used, for the years 1993-1995 (inclusive).
5.3.4 On the choice of meteorological data
For modelling purposes suitable meteorological data are
required, consisting of 8760 hourly observations per
year for the following parameters:
1) Wind speed
2) Wind direction
3) Atmospheric stability, which can be:
a) Pasquill stability class (derived from cloud cover
observation)
b) Monin-Obukov length (derived from
measurement of incoming solar energy)
To avoid error because of year-to-year variations, a
minimum of 3 years continuous hourly data are
required, while a 5-year period is considered preferable.
Data should be obtained for the ‘most representative’
meteorological station. This may not always be the
closest station, especially where the issue of coastal
versus inland locations is concerned. Specialist advice
can be obtained from the Met Office.
Meteorological data from individual stations are
available from a number of suppliers (e.g. the Met
Office or Trinity Consultants in Austin, Texas), at a
budget cost of approximately €1200 for 3-5 years data
from a station. The data has to be formatted so that they
are suitable for use by the software of the dispersion
model.
For Ireland, data are available for the following
meteorological stations, typically for the period 1993-
1998, and in many instances going back to 1990 or
earlier:
• Belmullet Peninsula
• Casement
• Claremorris
• Connaught Airport - 1997 and later only
• Cork Airport/Corcaigh
• Dublin Airport
• Kilkenny
• Malin Head
• Rosslare/Ros Lair
• Shannon Airport
• Valentia Observatory
It must be noted that most of these stations are coastal
stations that are not suitable for characterisation of more
inland locations, even when the distance to the coastal
station may be less than the distance to an inland station.
Also, data from some stations are not continuously
registered and are therefore not suitable for dispersion
modelling for odour impact assessments.
Odour Impacts and Odour Emission Control Measures for Intensive Agriculture
24
A more in-depth comparative analysis of differences
between the dispersion patters of different
meteorological stations with a view to odour impact
assessment would be advisable in the course of
formulating a regulatory odour guideline.
5.3.5 On the choice of percentile values
In setting exposure criteria different percentiles can be
used. However, these percentiles all reflect one
distribution of values, determined by the meteorology at
the location in question. Therefore, there is a
relationship between a certain limit value at the 98-
percentile, at the 99-percentile and at the
99.5-percentile.
In choosing a suitable percentile to reflect a certain
exposure level, both fundamental and practical issues
must be considered. A fundamental issue is that for
characterising the exposure conditions that determine
odour induced annoyance, the relatively rare hours with
high exposure are more determining than the majority of
hours when the exposure is average or below average.
This is a result of the exponential relationship between
concentration and perceived intensity (see section in
Annex B.2) and the psychophysical and psychological
processes involved. A practical issue is that the
uncertainty of the prediction of the model is becoming
greater at very high percentiles. The mean of the
distribution has a smaller margin of error than the ‘tails’
of the distribution. At the high end of the percentiles, the
outcome becomes increasingly vulnerable to the small
fraction of hourly meteorological observations that are
of questionable quality, because of instrument failure,
missing values etc. The 99.5-percentile, after all, is
determined by only 44 hourly observations in a year.
In this report, the 98-percentile is used to set criteria,
because this value can be seen as a compromise: it
reflects the upper ‘tail’ of the distribution, but is based
on the top 175 hourly observations in a year. To make
this value more representative, a minimum of three years
meteorological data is used, or 525 hours in total.
The relationship between the 99-percentile and the 98-
percentile, in the conditions that prevail in Ireland, is
roughly:
In other words, a criterion of C98, 1-hour ≤ 6 ouE/m3 is
approximately equivalent
to C99, 1-hour ≤ 12 ouE/m3.
C99, 1-hour ≈ 2 x C98, 1-hour
Odour Impacts and Odour Emission Control Measures for Intensive Agriculture
25

Odour Impacts and Odour Emission Control Measures for Intensive Agriculture
26
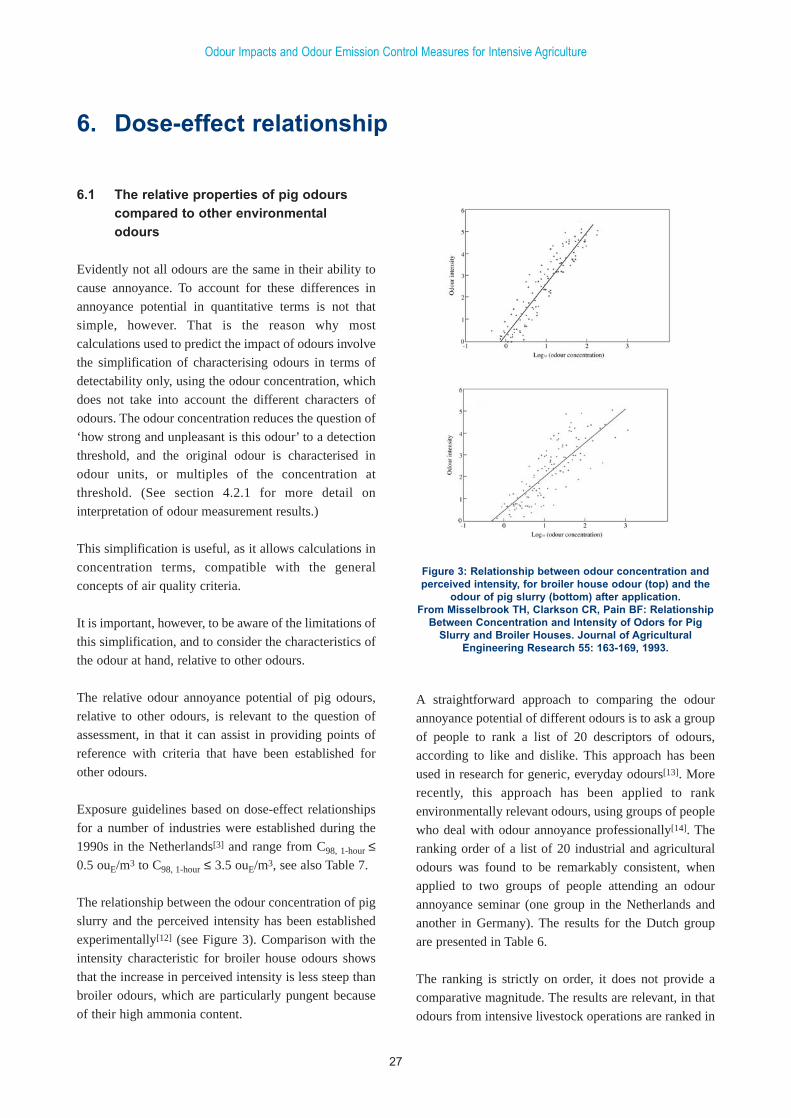
6.1 The relative properties of pig odours compared to other environmental odours
Evidently not all odours are the same in their ability to
cause annoyance. To account for these differences in
annoyance potential in quantitative terms is not that
simple, however. That is the reason why most
calculations used to predict the impact of odours involve
the simplification of characterising odours in terms of
detectability only, using the odour concentration, which
does not take into account the different characters of
odours. The odour concentration reduces the question of
‘how strong and unpleasant is this odour’ to a detection
threshold, and the original odour is characterised in
odour units, or multiples of the concentration at
threshold. (See section 4.2.1 for more detail on
interpretation of odour measurement results.)
This simplification is useful, as it allows calculations in
concentration terms, compatible with the general
concepts of air quality criteria.
It is important, however, to be aware of the limitations of
this simplification, and to consider the characteristics of
the odour at hand, relative to other odours.
The relative odour annoyance potential of pig odours,
relative to other odours, is relevant to the question of
assessment, in that it can assist in providing points of
reference with criteria that have been established for
other odours.
Exposure guidelines based on dose-effect relationships
for a number of industries were established during the
1990s in the Netherlands[3] and range from C98, 1-hour ≤0.5 ouE/m3 to C98, 1-hour ≤ 3.5 ouE/m3, see also Table 7.
The relationship between the odour concentration of pig
slurry and the perceived intensity has been established
experimentally[12] (see Figure 3). Comparison with the
intensity characteristic for broiler house odours shows
that the increase in perceived intensity is less steep than
broiler odours, which are particularly pungent because
of their high ammonia content.
A straightforward approach to comparing the odour
annoyance potential of different odours is to ask a group
of people to rank a list of 20 descriptors of odours,
according to like and dislike. This approach has been
used in research for generic, everyday odours[13]. More
recently, this approach has been applied to rank
environmentally relevant odours, using groups of people
who deal with odour annoyance professionally[14]. The
ranking order of a list of 20 industrial and agricultural
odours was found to be remarkably consistent, when
applied to two groups of people attending an odour
annoyance seminar (one group in the Netherlands and
another in Germany). The results for the Dutch group
are presented in Table 6.
The ranking is strictly on order, it does not provide a
comparative magnitude. The results are relevant, in that
odours from intensive livestock operations are ranked in
Odour Impacts and Odour Emission Control Measures for Intensive Agriculture
27
6. Dose-effect relationship
Figure 3: Relationship between odour concentration andperceived intensity, for broiler house odour (top) and the
odour of pig slurry (bottom) after application.From Misselbrook TH, Clarkson CR, Pain BF: Relationship
Between Concentration and Intensity of Odors for PigSlurry and Broiler Houses. Journal of Agricultural
Engineering Research 55: 163-169, 1993.
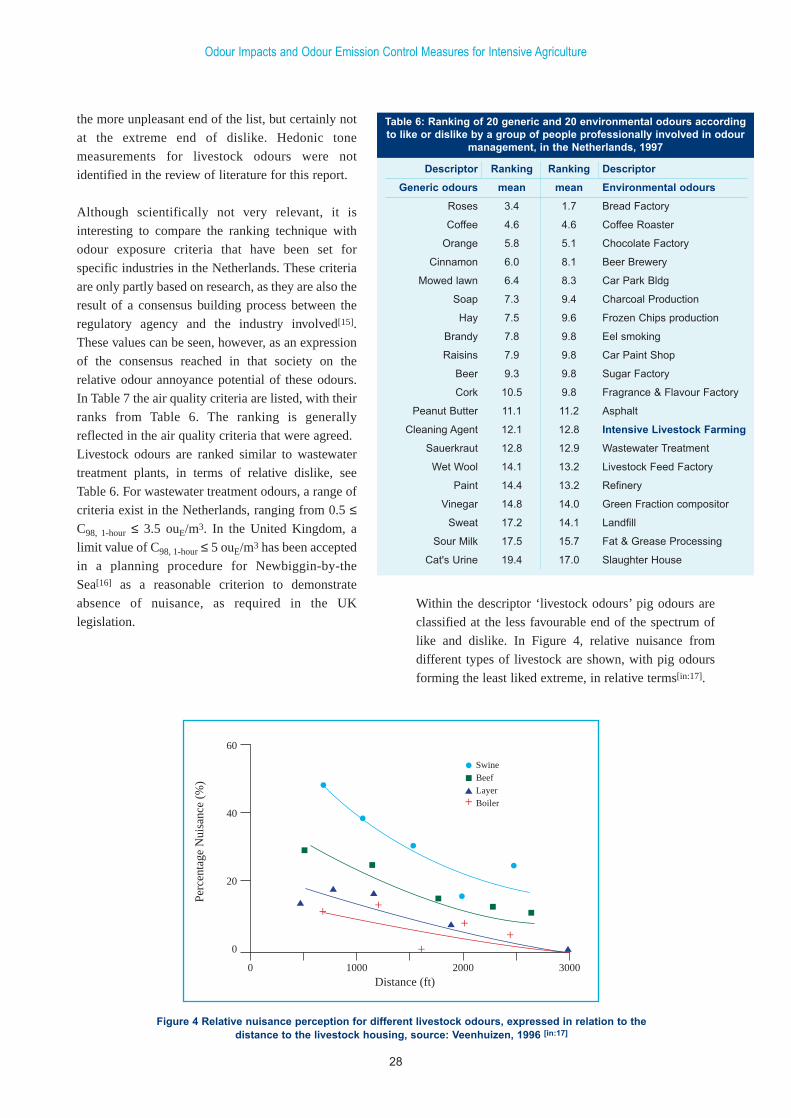
the more unpleasant end of the list, but certainly not
at the extreme end of dislike. Hedonic tone
measurements for livestock odours were not
identified in the review of literature for this report.
Although scientifically not very relevant, it is
interesting to compare the ranking technique with
odour exposure criteria that have been set for
specific industries in the Netherlands. These criteria
are only partly based on research, as they are also the
result of a consensus building process between the
regulatory agency and the industry involved[15].
These values can be seen, however, as an expression
of the consensus reached in that society on the
relative odour annoyance potential of these odours.
In Table 7 the air quality criteria are listed, with their
ranks from Table 6. The ranking is generally
reflected in the air quality criteria that were agreed.
Livestock odours are ranked similar to wastewater
treatment plants, in terms of relative dislike, see
Table 6. For wastewater treatment odours, a range of
criteria exist in the Netherlands, ranging from 0.5 ≤C98, 1-hour ≤ 3.5 ouE/m3. In the United Kingdom, a
limit value of C98, 1-hour ≤ 5 ouE/m3 has been accepted
in a planning procedure for Newbiggin-by-the
Sea[16] as a reasonable criterion to demonstrate
absence of nuisance, as required in the UK
legislation.
Descriptor Ranking Ranking Descriptor
Generic odours mean mean Environmental odours
Roses 3.4 1.7 Bread Factory
Coffee 4.6 4.6 Coffee Roaster
Orange 5.8 5.1 Chocolate Factory
Cinnamon 6.0 8.1 Beer Brewery
Mowed lawn 6.4 8.3 Car Park Bldg
Soap 7.3 9.4 Charcoal Production
Hay 7.5 9.6 Frozen Chips production
Brandy 7.8 9.8 Eel smoking
Raisins 7.9 9.8 Car Paint Shop
Beer 9.3 9.8 Sugar Factory
Cork 10.5 9.8 Fragrance & Flavour Factory
Peanut Butter 11.1 11.2 Asphalt
Cleaning Agent 12.1 12.8 Intensive Livestock Farming
Sauerkraut 12.8 12.9 Wastewater Treatment
Wet Wool 14.1 13.2 Livestock Feed Factory
Paint 14.4 13.2 Refinery
Vinegar 14.8 14.0 Green Fraction compositor
Sweat 17.2 14.1 Landfill
Sour Milk 17.5 15.7 Fat & Grease Processing
Cat's Urine 19.4 17.0 Slaughter House
Odour Impacts and Odour Emission Control Measures for Intensive Agriculture
28
Table 6: Ranking of 20 generic and 20 environmental odours accordingto like or dislike by a group of people professionally involved in odour
management, in the Netherlands, 1997
60
40
20
0
0 1000 2000 3000
++
+
+
+
+
SwineBeefLayerBoiler
Distance (ft)
Perc
enta
ge N
uisa
nce
(%)
Within the descriptor ‘livestock odours’ pig odours are
classified at the less favourable end of the spectrum of
like and dislike. In Figure 4, relative nuisance from
different types of livestock are shown, with pig odours
forming the least liked extreme, in relative terms[in:17].
Figure 4 Relative nuisance perception for different livestock odours, expressed in relation to thedistance to the livestock housing, source: Veenhuizen, 1996 [in:17]

6.2 Relation between odour exposure andpercentage of population annoyed
Note: This section reflects the results of a large-
scale study into the relationship between exposure to
pig odours and annoyance in the exposed
population. The results of the study have been
specifically interpreted to arrive at a framework of
environmental quality criteria for application in
Ireland.
To establish air quality criteria for odours, with a
view to assuring that exposure of odours is limited to
levels that are acceptable from a public health and
well-being perspective, we need to establish a dose-
effect relationship describing the relation between
exposure to odours in the environment and the
resulting degree of annoyance in the exposed
population. This epidemiological basis is
indispensable for setting environmental criteria in a
quantitative framework.
In this section the relation between calculated
exposure to odours (dose) and percentage of the
population experiencing annoyance (effect) will be
discussed on the basis of epidemiological studies for
a number of (bio-)industrial odour sources
conducted in the late 1980’s and 1990’s [3] and a
recent extensive study aimed specifically at pig
odours[4].
In these studies the dose is determined by
atmospheric dispersion modelling, using the odour
emission rate as measured at source, with other data
such as meteorology and topography, to calculate 98-
percentile of hourly average odour concentration
(C98, 1-hour). The percentage of people annoyed is
determined by drawing a sample from the residential
addresses found in an area exposed to a certain level
of exposure to odours (dose) and approaching these
residents, typically by telephone, with a
questionnaire. The residents are not informed that
the questionnaire is aimed at assessing odour
annoyance to reduce the probability of bias in the
response. The responses to defined key questions are
used to establish whether respondents are annoyed
by odours. (see section 5.1.1). In some cases, the
annoyance is classified on a scale, to differentiate
between annoyed and seriously annoyed.
In a recent paper these studies have been reviewed[3].
The raw data of previously reported studies were re-
analysed, this time adding a factor to reflect the relative
‘pleasantness’, or odour annoyance potential for each
odour type. (See also section 4.2). The results were
analysed to establish a relation between dose (odour
exposure) and effect (percentage of population
annoyed). The statistical model applied in these studies
shows a strong correlation for all but one of a dozen
studied cases. For the combined data for all studies, the
correlation coefficient r is 0.889. The review paper
demonstrates that the correlation coefficient improves to
r is 0.935 to 0.945 when an additional variable is
introduced to represent odour annoyance potential.
The odour annoyance potentials for the odours involved
Odour Impacts and Odour Emission Control Measures for Intensive Agriculture
29
Limit value Target value Questionnaire
C98, 1-hour C98, 1-hour ranking
No limit value,
>>5 ouE/m3
≤ 1.5 ouE/m3 ≤ 0.8 ouE/m3
≤ 2.5 ouE/m3
≤ 5 ouE/m3 1.7
≤ 3.5 ouE/m3 4.6
≤ 3.5 ouE/m3 ≤ 2.0 ouE/m3 9.8
≤ 0.5 ouE/m3 12.9
≤ 1.0 ouE/m3 12.9
≤ 1.5 ouE/m3 12.9
≤ 3.5 ouE/m3 12.9
≤ 1 ouE/m3 13.2
≤ 1.5 ouE/m3 ≤ 0.5 ouE/m3 14.0
≤ 3.0 ouE/m3 ≤ 1.5 ouE/m3 14.0
≤ 1.5 ouE/m3 ≤ 0.55 ouE/m3 17.0
Industry
Bakeries
Meat processing
Grass dryers
Bakeries, pastry
Coffee roasters
Flavours & Fragrances
Wastewater treatment
plant, greenfield site,
residential dwellings in
vicinity
Wastewater treatment
plant, greenfield site,
rural area or industrial
estate in vicinity
Wastewater treatment
plant, existing site,
residential dwellings
Wastewater treatment
plant, existing site,
rural area or industrial
estate
Livestock feed
production
Composting, organic
fraction of domestic
waste, greenfield site
Composting, organic
fraction of domestic
waste, existing facility
Slaughterhouses
Table 7: Industry sector specific air quality criteria for odours,the Netherlands, and mean ranking score (see table 2)
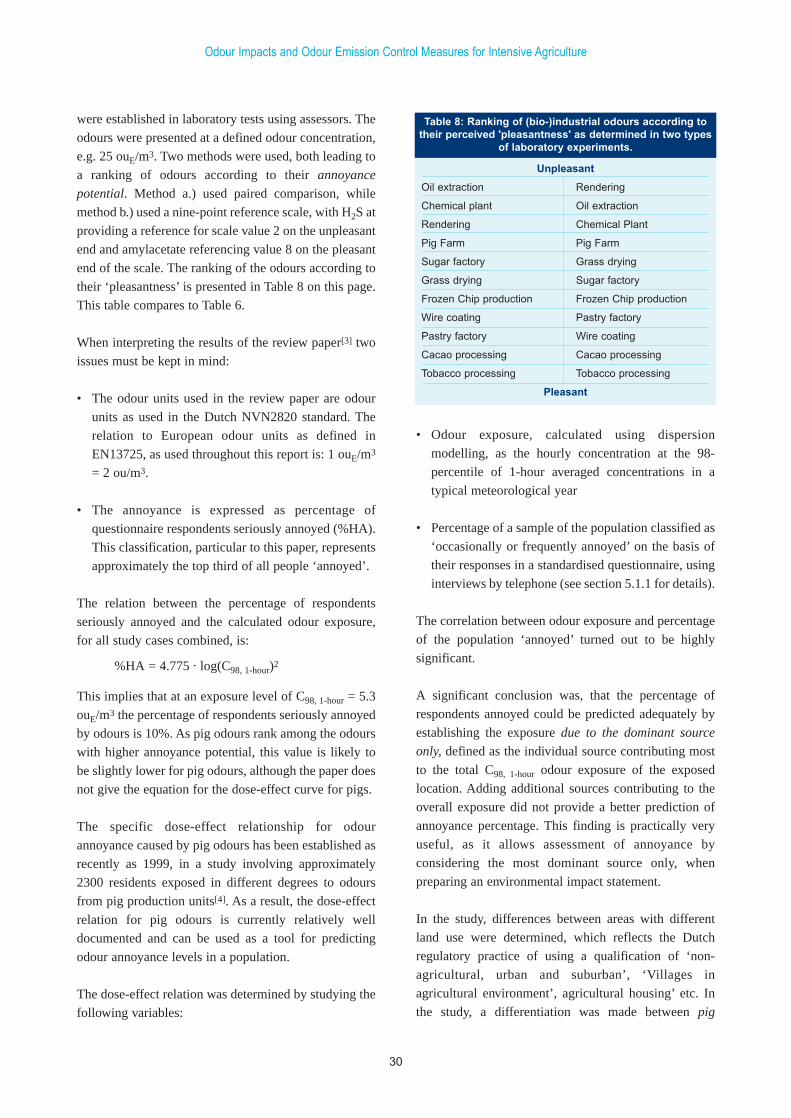
were established in laboratory tests using assessors. The
odours were presented at a defined odour concentration,
e.g. 25 ouE/m3. Two methods were used, both leading to
a ranking of odours according to their annoyance
potential. Method a.) used paired comparison, while
method b.) used a nine-point reference scale, with H2S at
providing a reference for scale value 2 on the unpleasant
end and amylacetate referencing value 8 on the pleasant
end of the scale. The ranking of the odours according to
their ‘pleasantness’ is presented in Table 8 on this page.
This table compares to Table 6.
When interpreting the results of the review paper[3] two
issues must be kept in mind:
• The odour units used in the review paper are odour
units as used in the Dutch NVN2820 standard. The
relation to European odour units as defined in
EN13725, as used throughout this report is: 1 ouE/m3
= 2 ou/m3.
• The annoyance is expressed as percentage of
questionnaire respondents seriously annoyed (%HA).
This classification, particular to this paper, represents
approximately the top third of all people ‘annoyed’.
The relation between the percentage of respondents
seriously annoyed and the calculated odour exposure,
for all study cases combined, is:
This implies that at an exposure level of C98, 1-hour = 5.3
ouE/m3 the percentage of respondents seriously annoyed
by odours is 10%. As pig odours rank among the odours
with higher annoyance potential, this value is likely to
be slightly lower for pig odours, although the paper does
not give the equation for the dose-effect curve for pigs.
The specific dose-effect relationship for odour
annoyance caused by pig odours has been established as
recently as 1999, in a study involving approximately
2300 residents exposed in different degrees to odours
from pig production units[4]. As a result, the dose-effect
relation for pig odours is currently relatively well
documented and can be used as a tool for predicting
odour annoyance levels in a population.
The dose-effect relation was determined by studying the
following variables:
• Odour exposure, calculated using dispersion
modelling, as the hourly concentration at the 98-
percentile of 1-hour averaged concentrations in a
typical meteorological year
• Percentage of a sample of the population classified as
‘occasionally or frequently annoyed’ on the basis of
their responses in a standardised questionnaire, using
interviews by telephone (see section 5.1.1 for details).
The correlation between odour exposure and percentage
of the population ‘annoyed’ turned out to be highly
significant.
A significant conclusion was, that the percentage of
respondents annoyed could be predicted adequately by
establishing the exposure due to the dominant source
only, defined as the individual source contributing most
to the total C98, 1-hour odour exposure of the exposed
location. Adding additional sources contributing to the
overall exposure did not provide a better prediction of
annoyance percentage. This finding is practically very
useful, as it allows assessment of annoyance by
considering the most dominant source only, when
preparing an environmental impact statement.
In the study, differences between areas with different
land use were determined, which reflects the Dutch
regulatory practice of using a qualification of ‘non-
agricultural, urban and suburban’, ‘Villages in
agricultural environment’, agricultural housing’ etc. In
the study, a differentiation was made between pig
Odour Impacts and Odour Emission Control Measures for Intensive Agriculture
30
%HA = 4.775 . log(C98, 1-hour)2
Unpleasant
Oil extraction Rendering
Chemical plant Oil extraction
Rendering Chemical Plant
Pig Farm Pig Farm
Sugar factory Grass drying
Grass drying Sugar factory
Frozen Chip production Frozen Chip production
Wire coating Pastry factory
Pastry factory Wire coating
Cacao processing Cacao processing
Tobacco processing Tobacco processing
Pleasant
Table 8: Ranking of (bio-)industrial odours according totheir perceived 'pleasantness' as determined in two types
of laboratory experiments.
concentration areas, which are effectively set aside to
some degree to allow elevated levels of pig production,
and general usage areas, outside concentration areas.
Respondents in concentration areas who are employed
in the pig production trade form a specific category.
The dose-effect curves for percentage annoyed, as
predicted from calculated exposure (C98, 1-hour) caused
by the dominant source only, are shown in Figure 5.
The figure shows that:
• In the general public, exposed to pig odours from one
piggery, 10% of the respondents are annoyed at an
exposure level of C98, 1-hour ≈ 1.3 ouE/m3 .
• In a selection from general public of those resident in
a pig concentration area, where pig odours form a
feature of the odour context of the area, both those
exposed to pig odours from one piggery and those
exposed to odours from multiple pig units, 10% of the
respondents are annoyed at an exposure level of
C98, 1-hour ≈ 3.2 ouE/m3 .
• The most ‘pig odour tolerant’ selection from the
general public was found in the pig production
concentration areas, where pig odour is a feature of
the odour context in the environment, historically. For
this group, with the lowest annoyance sensitivity, the
10% annoyance level is reached at an exposure of C98,
1-hour ≈ 6.3 ouE/m3.
• Those who are directly involved in agriculture were
found to be the most ‘pig odour tolerant’ selection of
the population. For this group, with the lowest
nuisance sensitivity, the 10% annoyance level is
reached at an exposure
of C98, 1-hour ≈ 13 ouE·m-3.
Statistical analysis of the data yielded some remarkable
conclusions:
1. The ‘annoyance sensitivity’ of people exposed to one
single source was higher than for those exposed to
two or more sources.
2. The annoyance percentage was best predicted by
considering the one dominant source only. When
exposure was calculated in this manner, the
difference between respondents in one-source and
multiple source situations was no longer apparent.
3. The annoyance sensitivity of people who are directly
involved in agriculture was found to be significantly
lower than that of the general population living in a
similar area. This effect is even more pronounced for
those living in ‘pig production concentration areas’
where the agricultural population displays a markedly
more tolerant attitude, leading to lower levels of
annoyance at a given exposure to odours than in all
other groups.
4. Whether people lived in a rural or more (sub-) urban
environment did not have a significant effect on their
annoyance sensitivity. Only people living in ‘pig
production concentration areas’ showed lower
annoyance sensitivity than in other areas, indicating a
higher tolerance to pig odour exposure.
The dose-effect relationships, differentiated for
subgroups as discussed above, are shown in . The
information as provided above can be the starting point
for a set of limit and target values for exposure,
associated with differentiated levels of protection
against nuisance.
A level of 10 % of respondents annoyed has been chosen
as a practical guide value, which is more than double the
‘background’ or ‘baseline’ level for odour annoyance, as
assessed in areas not exposed to (bio) industrial odours.
The percentage value of 10% is slightly less than the
stated policy objective of the regulator in the
Netherlands to limit the fraction of people annoyed by
odours to 12%. Although this regulatory objective lacks
a well-reasoned scientific motivation, is has been used in
regulatory practice since 1985 in hundreds of licensing
cases, with overall satisfactory results, for the Dutch
regulatory environment[20].
Of course, the Agency will have to take into account
specific conditions to set criteria for Irish conditions,
reflecting a level of environmental quality and
protection compatible with Irish society. Ideally, dose-
effect relationships for Irish citizens in Irish conditions
should be assessed, to confirm the findings obtained
abroad.
The guide values for establishing exposure criteria are
Odour Impacts and Odour Emission Control Measures for Intensive Agriculture
31
outlined below:
• The curve for One source, non-agricultural residents
represents the group with the highest ‘annoyance
sensitivity’. This group consists of people with no
professional involvement with the agricultural sector,
exposed to the effects of a single source, in rural or
(sub-) urban areas. This sub-group can be regarded as
the group with the least tolerance to pig odours.
However, it is likely to be the largest subgroup in the
general public. This group has therefore been
regarded in this study as representative of the general
public. For this group, an annoyance percentage of
10% is associated with an exposure to pig odours of
C98, 1-hour = 1.3 ouE/m3.
• The curves for One source, non-agricultural
residents, living in pig production concentration area
and Multiple source, non-agricultural residents living
in pig production concentration area coincide, when
only the one most dominant source is included in the
calculation of exposure. These groups represent a
selection of the general public with a lower sensitivity
to annoyance. These people live in an environment
where pig odours have become a feature of their
environment, and pig production is apparently more
accepted to take its place in that environment. This
sample of the population can been regarded as
representing the general public, with intermediate
annoyance sensitivity, showing an increased
tolerance to pig odours as an existing element in the
status quo of their residential environment.
For this group, an annoyance level of 10% is
associated with an exposure to pig odours
of C98, 1-hour ≈ 3.2 ouE/m3.
• The curve for two or more sources, non-agricultural
residents living in ‘pig production concentration
areas’ (not shown in Figure 5) represents the sub-
group of the general public with the lowest
annoyance sensitivity. Although these residents had
no involvement with the agricultural sector, they live
in areas where pig production is a significant feature
of that area. This subgroup has been regarded to
represent the general public, with the lowest
annoyance sensitivity, showing increased tolerance to
pig odours as significant element in the status quo of
their residential environment. To arrive at a maximum
value for ‘tolerable exposure, we have looked to this
group, with the exposure calculated on the basis of all
relevant sources of pig odour combined. For this
group, 10% annoyance is associated to an exposure to
pig odours of C98, 1-hour ≈ 6.3 ouE/m3.
• The curve for concentration area, farmers represents
a subgroup that can be characterised as the most
tolerant in the survey, given their association with
agriculture in pig production concentration areas.
This group, associated with the source of the odours,
cannot be considered to be representative for the
general public. The exposure associated with 10%
annoyance in these persons directly involved in
agriculture in concentration areas is C98, 1-hour ≈ 13
ouE/m3. This value is indicative as an absolute upper
exposure limit, but is as such not usable as a starting
point for an exposure guideline aimed at protecting
the general public.
The exposure level of C98, 1-hour ≈ 6.3 ouE/m3 associated
with 10% annoyance in the most tolerant selection from
the general public[4], combined with the finding[3] that
for a selection of (bio)-industry odours 10% of
respondents experiencing serious annoyance is
associated with C98, 1-hour = 5 ouE/m3, underpins a
suggested upper limit value for odour exposure to be set
not higher than C98, 1-hour ≤ 6 ouE/m3. This
recommendation is based on a substantial set of data
from independently conducted studies, as described
above (n = approximately 620 respondents).
The value for the general public of C98, 1-hour ≈ 1.3
ouE/m3 is associated with 10% annoyance in the general
public underpins a target value for odour exposure at a
value of C98, 1-hour ≤ 1.5 ouE/m3, based on a substantial
set of data (n = approximately 1500 respondents).
A framework of suggested limit and target values on the
basis of the results of epidemiological dose-effect
studies as discussed above is outlined in section 8.3.
7.1 Generic approaches to livestock odour management and regulation
Odour Impacts and Odour Emission Control Measures for Intensive Agriculture
32
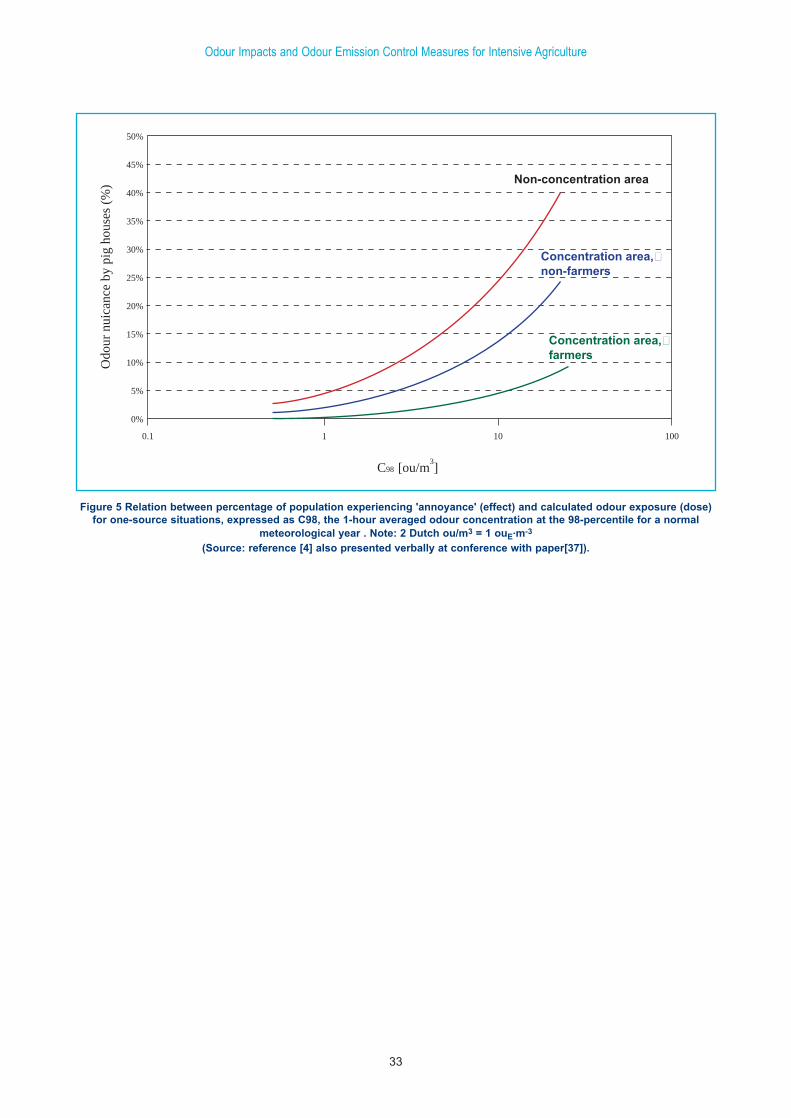
Odour Impacts and Odour Emission Control Measures for Intensive Agriculture
33
0%
5%
10%
15%
20%
25%
30%
35%
40%
45%
50%
10.1 10 100
Non-concentration area
Concentration area,�non-farmers
Concentration area,�farmers
C98 [ou/m3]
Odo
ur n
uica
nce
by p
ig h
ouse
s (%
)
Figure 5 Relation between percentage of population experiencing 'annoyance' (effect) and calculated odour exposure (dose)for one-source situations, expressed as C98, the 1-hour averaged odour concentration at the 98-percentile for a normal
meteorological year . Note: 2 Dutch ou/m3 = 1 ouE.m-3
(Source: reference [4] also presented verbally at conference with paper[37]).

Odour Impacts and Odour Emission Control Measures for Intensive Agriculture
34
Pig producers have a responsibility to minimise the
impact of their business on the environment, and to
avoid ‘loss of amenity’ and nuisance occurring in the
vicinity of their production site. Odours, as an
environmental stressor, tend to have a reach well beyond
the site boundary.
In many countries, nuisance law has existed for many
years. This type of legislation is very general in its
nature, often relying on appointed environmental health
officers or law enforcement officers to make individual
judgements on the question of whether the odour
experienced constitutes a nuisance in legal terms.
To assist regulatory agencies in managing odour issues,
a number of countries have issued guidelines,
regulations or even legislation in their efforts to apply a
regulatory mechanism to odours from pig production
units.
The majority of these guidelines use a schedule of
setback distances, based on the size of the facility
expressed as total number of animals, to define the
minimum distance between pig houses from dwellings
in the vicinity, with a view to avoiding odour annoyance
This type of setback distance guidelines started to
appear in the early 1970s and have been adopted in a
number of countries. In some cases, the setback tables
have been developed from their early, simple form into
an elaborate mechanism, taking into account different
types of housing, operational practices, usage of the
surrounding area, cumulative effects of multiple pig
producers, etc.
Although this approach provides a detailed framework
for assessment, the basis for the setback distances is
rarely based on systematic scientific observations. The
first guidelines were published in the Netherlands in
1971 as a graph of setback distances versus the number
of pigs[18]. These graphs were based on the limited
observations of a handful of Health Inspectors. This
provided a pragmatic approach that has been applied
effectively for many years, in spite of the fact that the
guidelines were based on very limited experimental
data.
In a limited number of European countries, specific
regulations for odours from livestock were introduced
well before industrial odours became a regulatory issue,
in the early 1980s. The more quantitative approach of
measuring emissions and modelling their impact off-
site, which was applied to industrial odour sources, was
generally not applied to agricultural odours. For a
variety of reasons, however, there is a tendency for the
approach towards odour annoyance management in
agriculture and in industry to converge. This
development is a result of a variety of factors, such as
the enlargement of the scale of pig production units, the
tendency towards diversification of land use in rural
areas and the introduction of IPC and IPPC for both
industrial and livestock operations (over a certain
minimum size).
Currently, data are becoming available which allow the
setting of environmental targets for odour exposure on
the basis of actual ‘epidemiological’ studies into the
prevalence of odour annoyance as a result of exposure to
pig odours[4]. The emission factors for pigs, in different
stages of their life cycle, have been measured in detail,
using standardised methods[5,10]. The availability of
these data allows the design of an assessment framework
that translates these scientific background data into
objectives of a society in terms of environmental quality.
Summarising, there are three generic approaches to
managing the impact of pig production odours in a
regulatory framework:
1. Nuisance Law approach: No Nuisance at the
boundary
Assessment and enforcement on the basis of the
individual judgement of inspectors
2. Setback Distances: Pragmatic semi-quantitative
approach based on experience
Assessment based on a schedule of distances
depending on the number of animals, sometimes
more elaborate to take into account operational
Odour Impacts and Odour Emission Control Measures for Intensive Agriculture
35
7. Comparison of regulatory approaches indifferent countries
practice, land use in the vicinity, cumulative effects
etc. Tables with setback distances have been used
typically for relatively small pig units, e.g. ≤ 500
sows.
3. Air quality criteria for odour exposure:Quantitative approach based on the dose-effect
relationship
Assessment based on epidemiological research into
the prevalence of annoyance caused by odours from
pig production. These criteria can be implemented
using the general approach common to air quality
issues. Impact assessment is based on emission
factors and atmospheric dispersion modelling. The
approach in individual cases can be simplified for
practical implementation similar to setback distance
schedules, if the outcome is straightforward.
For the framework for assessment of the impact of pig
odours in Ireland, the latter option is considered the best
approach. A quantitative approach provides the best
basis for judgements that are based on objective data,
while leaving a margin of flexibility to allow more
subjective factors to be taken into account in the
licensing procedure.
7.2 Background to the use of quantitative odour exposure criteria
At the time of writing this report in 2001, there is no
clear guidance available on the assessment of impacts of
livestock odours in Ireland. The obligation to avoid
nuisance does exist, however.
Some other European countries have moved towards the
use of quantitative assessment methods for regulating
odour exposure since the 1980s.
Authorities in the Netherlands have used quantitative air
quality criteria for odours in licensing since 1985[19].
Initially, an overall air quality target was set for licensing
industrial sources of odour. This regulation
differentiated between existing sources and applications
for new sources on greenfield sites. The limit value for
existing sources was set at C98, 1-hour ≤ 0.5 ouE/m3 , while
for new sources a stricter limit at a higher percentile was
prescribed: C99.5, 1-hour ≤ 0.5 ouE/m3.
Data collected by survey in 1990 in The Netherlands
from populations surrounding 200 industrial odour
sources where the exposure standard of 0.5 ouE/m3 for a
maximum of 2% of all hours (C98, 1-hour ≤ 0.5 ouE/m3)
had been in place for some years, has shown that, when
this standard is met, there are no justifiable
complaints[20].
In 1995, a group of Dutch industries successfully
lobbied to obtain a more lenient regulatory framework,
which allowed differentiation between odours with a
high odour annoyance potential (e.g. rendering) and
those with a lower annoyance potential (e.g. coffee
roasters, bakeries). This has resulted in a set of
differentiated target values of between 0.5 and 3.5
ouE/m3 as a 98-percentile for industrial sources (see
Table 7). A strict value of C98, 1-hour ≤ 0.5 ouE/m3 is
applied to very unpleasant odours, with a high odour
annoyance potential, while more acceptable industrial
odours are regulated to more lenient values, e.g. C98, 1-
hour ≤ 3.5 ouE/m3 (e.g. coffee roasting).[15]. Also, the
regional and local authorities have been given more say
and flexibility to take account of local conditions in the
licensing process.
In the UK, the first instance of regulatory approval of
this approach and an exposure standard of 5 ouE/m3 was
in a Planning Inquiry held into a proposal for a new
sewage treatment facility at Newbiggin-by-the-Sea in
spring 1993. The Inspector in his report accepted this
approach and stated that "he was satisfied that the
evaluation undertaken demonstrated that the proposals
would not give rise to a risk of unacceptable odour
emissions beyond the boundary of the appeal site" (case
ref. APP/F2930/A/92 206240)[16].
7.2.1 The reasoning underpinning the choice of odour exposure limit values varies.
In the UK literature[36], the reasoning underlying a
choice of limit value is typically based on extrapolation
of findings in laboratory studies, rather than relying on
epidemiological data. The argument is that, by
definition, 1 ouE/m3 is the detection threshold of 50% of
a qualified panel of observers working in an odour-free
laboratory using odour-free air as the zero reference (the
selection criteria result in the qualified panel being more
sensitive to a particular odourant than the general
population). The recognition threshold is generally
between 1 and 5 times this concentration (1-5 ouE/m3)
and the concentration at which the odour may be
Odour Impacts and Odour Emission Control Measures for Intensive Agriculture
36
considered to be a nuisance is between 5 and 10 ouE/m3,
although this figure can be as low as 2 ouE/m3 for
particular offensive odours. Laboratory research in
Ireland by Carney and Dodd found that pig odours reach
a nuisance threshold at between 2.3 and 9.6 times
(average 4.8 times) the concentration at the detection
threshold[21]
Although this argument provides a useful insight, it does
not tell the full story. To fully consider the relationship
between downwind odour concentration and nuisance,
the length of time that a receptor is subject to a threshold
concentration must be considered. For example, a ‘faint
odour’ that can be perceived by a receptor for a few
hours per year with those hours dispersed throughout the
year, would be unlikely to cause a nuisance. The same
concentration perceived for the majority of the year,
undoubtedly would. Relationships between
concentration, time of exposure and resulting nuisance
(or freedom of nuisance) can only be determined by
surveying populations living in the vicinity of odour
sources, using an epidemiological approach.
There is a need for a standardised quantitative method
for the measurement of ‘odour annoyance potential’ to
differentiate between different odours. It should allow
the translation of knowledge on the dose-effect
relationship, collected in an epidemiological survey, to
another odour, using a more simple and effective
laboratory method to do so. Such a method is not yet
available. A feasibility study to review the options to
develop a method for determining annoyance potential
of odours has been completed, however, giving an
overview of the options and identifying the steps needed
to develop and validate the required method[1]. The
prospects for developing a standardised method for
determining annoyance potential are promising.
Until a proper method for odour annoyance
measurements is available, it will be difficult to relate
specific odours to dose-effect relationship information
for other odours, on the basis of comparing the odour
annoyance potentials. Until a method for assessing
odour annoyance potential becomes available, the best
indicator for annoyance potential is probably the use of
hedonic tone, or a scale of like and dislike.
For now, the best possible basis for odour exposure
criteria is the use of actual epidemiological research into
the prevalence of odour annoyance, as a result of
exposure to that specific odour. This dose-effect
relationship has recently been established for pig odours
in the Netherlands[4]. It should be taken into account that
the dose-effect relationship depends on the population
involved. To transfer results of research in one country
to another country requires some interpretation, to arrive
at odour exposure criteria best suited to the conditions in
that country. Environmental quality standards are set to
reflect the requirements and aspirations of a society, and
hence contain a policy judgement, even if the principles
are laid out using scientific data.
7.3 Overview of livestock odour guidelines indifferent countries
The guidelines for limiting the impact of pig odours in
different countries tend to reflect the history and
structure of the pig industry in each national setting.
Most regulations and guidance use setback distances as
the main instrument to reduce the impact of pig odours
on people living in the vicinity. In some cases (UK) the
guidance focuses entirely on good practice, in the form
of a Code of Good Agricultural Practice for the
Protection of Air by the Ministry of Agriculture,
Fisheries and Food (MAFF).
Setback distances are in some cases suggested in general
terms, as a ‘desirable distance’ (USA), or as a minimum
suggested distance (Ireland, currently). In other
countries, more elaborate guidance has been developed,
allowing a more precise determination of setback
distances based on a number of factors, such as:
• The number of animals on the site, specified to their
stage in the lifecycle
• The design and operation of the facility (e.g. housing
type, manure storage, feed composition)
• The use of the vicinity (e.g. neighbouring farmhouses
only, isolated dwellings, residential developments)
Examples of countries where such detailed schedules are
used to determine setback distances for licensing
purposes in specific cases are Germany, Austria and The
Netherlands.
The approach towards reducing pig odour impact has
been described in detail in the annexes to this report for:
Odour Impacts and Odour Emission Control Measures for Intensive Agriculture
37
Germany, the Netherlands, the United Kingdom, New
Zealand and the United States.
In this chapter, a short overview is provided for each of
these countries, followed by a comparison of the
different regulatory approaches, by comparing the
setback distances for fictitious pig production sites.
7.3.1 Germany
The law concerning air quality issues in Germany is the
Bundes Immissionsschutz Gesetz (known as
‘BimSchG’), or the Federal Immission Control act of
1990.
All odours from any commercial installation are
considered an annoyance, according to §3 of
‘BimSchG’. For licensing and enforcement, however,
the issue is to determine whether the annoyance
constitutes a ‘significant disturbance’, based on the
‘relevance of the annoyance’. However, the ‘BimSchG’
does not provide for criteria to determine when an
annoyance becomes a significant disturbance
(nuisance).
Criteria on how to achieve the general principles
concerning air quality are not provided for in the
BimSchG, nor in the second relevant official regulatory
document, which provides technical guidance for
specific industries,. The Technische Anleitung zur
Reinhaltung der Luft, or TA-Luft, details the technical
measures, expected to be applied in different sectors of
industry and agriculture, including methods for
assessment. The TA-Luft is available in English, titled:
Technical Instruction on Air Quality control.
The TA-Luft defines a maximum ‘odour frequency’, as
an ambient air quality characteristic, but does not
specify a method to assess this parameter. In 1994 a
method was introduced by the Department of the
Environment of Nordrheinland Westfalen. The
document is available in English translation:
Determination and Evaluation of odour immissions -
Odour exposure guideline
This method is based on a method for long-term field
panel observations, in which the fraction of ‘odour
hours’ is determined by a team of assessors assigned to
make observations at intervals over a period several
months at pre-defined locations on a grid around the
source in question. The method has been applied on pig
units[9]. This method can be applied to determine
licensing applications.
However, in most cases, a technical guideline is applied,
that provides detailed advice on the design and operation
of pig units and other livestock operations.
The national standard, VDI3471:1986, defines the
practice for reducing the impact of pig production units.
Setback distances are determined on the basis of a table
to establish the number of Grossvieheinheiten (1 GV is
equivalent to 500kg live weight). The number of GV is
then related to the required minimum setback distance
using a graph. The setback distance graph gives
distances for up to 750 GV, approximately equivalent to
575 integrated sows in an Irish unit. A points system is
used to characterise the operational practice and design,
which is accounted for in different curves on the setback
distance graph.
For a 400 sow unit, which is close to the Irish licensing
limit, the setback distance would be between
approximately 390 and 620m, depending on the number
of points.
A more detailed description, including the distance
graph, is given in Annex A.1.
7.3.2 The Netherlands
Setback distances are determined on the basis of a graph
relating ‘pig units’, equivalent to a fattener, to setback
distances. Different curves are given, depending on the
land use in the vicinity. Different graphs have been used
since the first publication of a guideline of this type, in
1971. Currently the graphs from the 1985 guideline are
prescribed, providing graphs for production units of up
to 2,500 pig units (equivalent to fatteners). A new
guideline was proposed in 1995, with an identical set of
setback distance curves. However, the description of
categories of land use to which these curves were to be
applied was modified, effectively leading to a more
lenient policy on pig odours. However, the guideline as
revised in 1995 has been judged to be too lenient in a
number of cases by the State Council, the appeal court
for planning decisions. A policy review by the Ministry
of Public Planning and the Environment is now ongoing
Odour Impacts and Odour Emission Control Measures for Intensive Agriculture
38
(1999-2001). This review, which involves detailed
research into the actual annoyance experienced at
different levels of exposure to pig odours, is expected to
lead to a more restrictive system based on air quality
criteria.
A more detailed description, including the distance
graph, is given in Annex A.2.
7.3.3 United Kingdom
The Environmental Protection Act of 1990 provides the
legal framework for avoiding and controlling odour
nuisance in the United Kingdom. The Environmental
Health department of the Local Authority is responsible
for its enforcement. Under Part III, Section 79 of the
Act, the local authority has a duty to inspect their area
and detect any statutory nuisance. Reasonably
practicable steps are to be undertaken to investigate
complaints by residents made to them.
Where a local authority Environmental Health
Department is satisfied that a statutory nuisance exists,
or is likely to occur or recur, it has a duty to serve an
abatement notice under Part III, Section 80 of the Act
requiring:
• the abatement of the nuisance or prohibiting or
restricting its occurrence or recurrence; and
• the execution of such works and the taking of such
other steps as may be necessary for these purposes.
When appropriate action is not taken as a result of an
Abatement Orders, significant fines of up to 20,000
pounds can be imposed.
The law on statutory nuisance is far from
straightforward. A key problem is that no criteria are
provided to decide when occurrence of an odour
constitutes a nuisance, and when it is acceptable. The
system relies heavily on the individual judgement of the
Environmental Health Inspector. In practice a wide
variety of licence conditions occur.
Planning consents have to be granted on the basis of the
Town and Country Planning (General Permitted
Development) Order of 1995 (GPDO). New livestock
facilities, such as livestock buildings, slurry storage
facilities, and extensions or alterations to such facilities,
need planning permission when these will be within a
distance of 400 m from the boundary of any protected
buildings (such as residential houses or schools).
Under the Town and Country Planning (Assessment of
Environmental Effects) Regulations of 1988 an
environmental assessment is to be carried out for certain
types of major project which are likely to have
significant effects on the environment. For livestock
units this requirement is likely to apply to new pig units
of more than 400 sows or 5000 fatteners and new poultry
units of more than 100,000 broilers or 50,000 layers.
In planning procedures, the use of odour modelling with
application of a criterion of 5 ouE/m3 as a 98-percentile
of hourly values has been accepted as an acceptable
approach to demonstrate that no statutory nuisance
would arise, in a planning enquiry involving a
wastewater treatment plant at Newbiggin-by-the-Sea,
Northumberland, planning reference APP/F2930/A/92
206240, UK, 1993[16].
The main document providing guidance is:
• The Air Code, Code of Good Agricultural Practice for
the protection of Air, revised 1998, Ministry of
Agriculture, Fisheries and Food and the Welsh Office
Agriculture Departments, October 1998.
The Code provides general guidance on the legal
background, and on good practice for production., The
main part of guidance on odours is given in Part B of the
Code, which contains a wealth of sound general advice,
but is remarkably limited on technical detail and
quantitative assessment and management information.
The Code does not contain any specific recommendation
on setback distances, other than suggesting that any pig
unit located at less than 400 metres from residences
should take extra care in implementing the advice given
in the Code.
For details on the Code of Practice, see Annex A.3.
7.3.4 United States of America
The regulations for odour in the United States of
Odour Impacts and Odour Emission Control Measures for Intensive Agriculture
39
America vary from state to state. The main legal basis
for the regulations is the nuisance law. Various states
have guidelines specifically aimed at managing odour
emissions from pig units. In Annex A.4 a guideline
issued by the EPA in Texas[17] is described in more
detail.
In 1994, the American Society of Agricultural Engineers
indicated that a ‘desirable distance’ for siting livestock
facilities in general is 1600 meters from housing
developments and 400 to 800 meters from neighbouring
domestic dwellings.
The EPA guidance indicates that the setback distance
should be at least 3.6 kilometres and preferably 7.2
kilometres for ‘larger facilities’.
Details on US swine odour guidelines are provided in
Annex A.4.
7.3.5 New Zealand
A detailed Code of Practice is applied in New Zealand,
within the general legal framework of the nuisance law.
The New Zealand Code of Practice (CoP) contains two
types of setback distances:
• Fixed setback distances, that must be observed in all
cases, regardless of the size of the production unit
• Adjustable setback distances that depend on the size
of operation and a set of correction factors for site-
specific operational characteristics.
The adjustable setback distances must be applied to pig
production units with 2000 pigs or more.
For any piggery of more than 5000 pigs, the potential to
create adverse effects needs to be determined on an
individual case basis. The size of the buffer zone for
such a piggery is determined to reflect this assessment.
Setback distances are determined on the basis of the P-
factor, which counts all pigs older than 70 days.
Breeding units with weaners only are counted using a
conversion of 1 breeding sow = 5 pigs.
For an integrated unit of approximately 400 sows (2000
P-units in New Zealand), setback distances in excess of
between 500 and 2000 meters would apply, depending
on land use in the vicinity. Obviously, the New Zealand
setback distances are quite strict, reflecting the
availability of land and the high priority given to
environmental quality in that country.
For details on the New Zealand Code of Practice, see
Annex A.5.
7.3.6 Comparison of setback distances in different countries for fictitious pig units
The nationally advised practice, guidelines and
regulations are compared for a number of countries, in
general terms, by applying their particular approach to
pig production units of a certain size. The comparison is
not as detailed as the legal application in the country
might require, but serves to illustrate differences in
expectations of environmental quality for odour impact
in the societies involved. The results are presented in
Table 9.
Odour Impacts and Odour Emission Control Measures for Intensive Agriculture
40
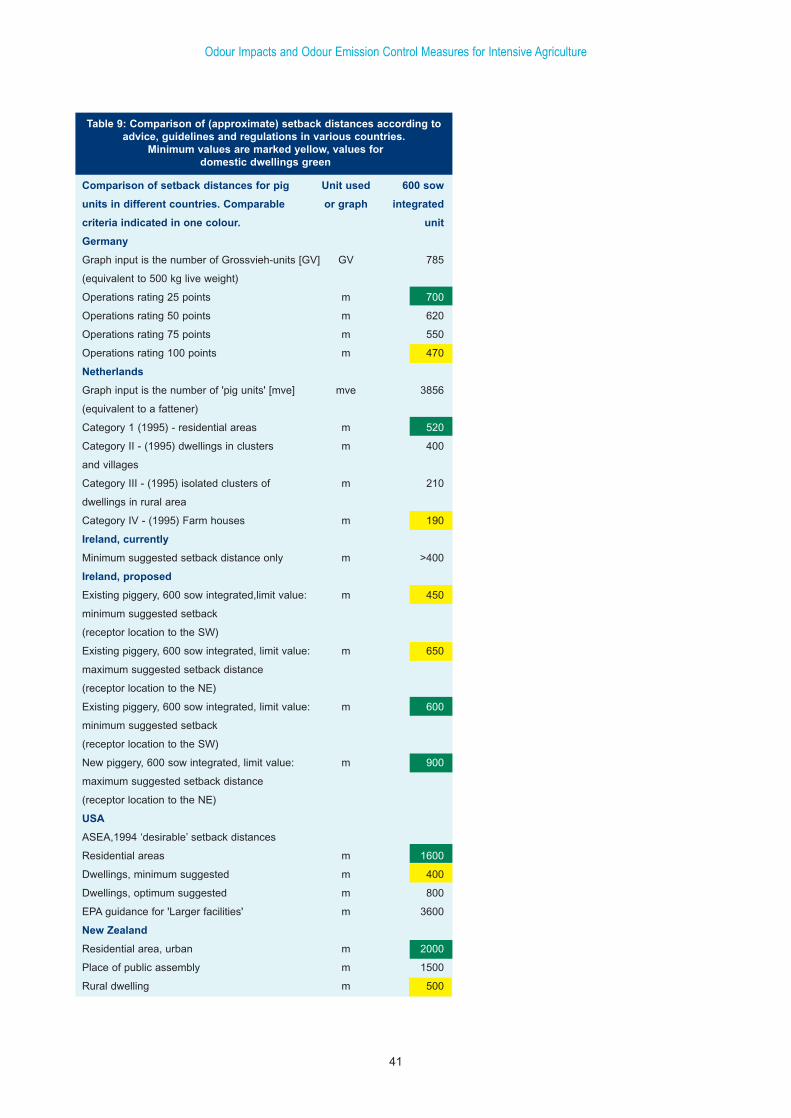
Odour Impacts and Odour Emission Control Measures for Intensive Agriculture
41
Comparison of setback distances for pig Unit used 600 sow
units in different countries. Comparable or graph integrated
criteria indicated in one colour. unit
Germany
Graph input is the number of Grossvieh-units [GV] GV 785
(equivalent to 500 kg live weight)
Operations rating 25 points m 700
Operations rating 50 points m 620
Operations rating 75 points m 550
Operations rating 100 points m 470
Netherlands
Graph input is the number of 'pig units' [mve] mve 3856
(equivalent to a fattener)
Category 1 (1995) - residential areas m 520
Category II - (1995) dwellings in clusters m 400
and villages
Category III - (1995) isolated clusters of m 210
dwellings in rural area
Category IV - (1995) Farm houses m 190
Ireland, currently
Minimum suggested setback distance only m >400
Ireland, proposed
Existing piggery, 600 sow integrated,limit value: m 450
minimum suggested setback
(receptor location to the SW)
Existing piggery, 600 sow integrated, limit value: m 650
maximum suggested setback distance
(receptor location to the NE)
Existing piggery, 600 sow integrated, limit value: m 600
minimum suggested setback
(receptor location to the SW)
New piggery, 600 sow integrated, limit value: m 900
maximum suggested setback distance
(receptor location to the NE)
USA
ASEA,1994 ‘desirable’ setback distances
Residential areas m 1600
Dwellings, minimum suggested m 400
Dwellings, optimum suggested m 800
EPA guidance for 'Larger facilities' m 3600
New Zealand
Residential area, urban m 2000
Place of public assembly m 1500
Rural dwelling m 500
Table 9: Comparison of (approximate) setback distances according to advice, guidelines and regulations in various countries.
Minimum values are marked yellow, values fordomestic dwellings green

Odour Impacts and Odour Emission Control Measures for Intensive Agriculture
42
8.1 Scope of impact assessment framework
The proposed framework for assessing the odour impact
of pig production units that is outlined in this chapter has
a clearly delineated scope:
• The framework aims to assist the Agency in assessing
the odour impact of pig production units in licensing
procedures.
• The assessment framework is suitable for existing pig
production units and for new projects in greenfield
locations.
• The impact of odours released from land-spreading
operations is outside the scope of this study.
• As the issue of planning is outside the authority of
the EPA, issues and instruments of planning are
outside the scope of the assessment framework, while
recognising that sound planning is the most effective
method of protecting the interests of the public and of
the pig producers.
• The framework does not differentiate in assessing the
impact for a single sensitive receptor, such as a
residential house, or larger numbers of dwellings.
• The framework is aimed at assessing the situation as
it is described in the licence application and will not
consider potential changes in the configuration
through building or change of use.
• The framework is aimed at assessing pig production
units that require a licence, according to the First
Schedule to the EPA Act, 1992, which states:
6.2. The rearing of pigs in installations, whether within thesame complex or within 100 metres of that complex, where thecapacity exceeds 1,000 units on Gley soils or 3,000 units onother soils and where units have the following equivalents:
1 pig = 1 unit1 sow, including progeny = 10 units
Implementation of a guideline based on the proposed
framework will require careful consideration of the
transitional phase, taking into account the historical
development in which dwellings were previously
allowed to coexist with pig units in situations where the
buffer zones were insufficient. The issue of how to
achieve such a transition is an essential aspect of policy
implementation. However, being an issue of regulatory
policy, it is beyond the scope of this report.
A consultation process involving the pig industry sector
should form part of the implementation process, to
ensure that its application in the licensing process is
practicable.
8.2 Legal framework
8.2.1 European legislation
As a result of implementation of European Community
guideline 97/11/EG, and a more recent amendment in
Regulation SI no. 93, 1999 in the Regulations on
Environmental Impact Assessment, an environmental
impact assessment is required for all pig production
units, which have
'…………installations for intensive rearing of
pigs....which would have more than 2000 places for
production pigs (over 30kg) in a finishing unit, more
than 400 places for sows in a breeding unit or more
than 200 places for sows in an integrated unit'.
The European Council Directive 96/61, concerning
Integrated Pollution Prevention and Control (IPPC) is
relevant to pig production. According to the
requirements of article 16, the Best Available
Techniques (BAT) are to be identified for the European
Intensive Livestock Industry, including pig production.
The IPPC directive defines BAT in its article 2, sub 11:
"Best Available Techniques" means the most
effective and advanced stage in the development of
activities and their methods of operation which
indicate the practical suitability of particular
techniques for providing in principle the basis for
Odour Impacts and Odour Emission Control Measures for Intensive Agriculture
43
8. Proposed framework for impact assessmentwith a view to licensing
emission limit values designed to prevent and, where
it is not practicable, generally to reduce emissions
and the impact on the environment as a whole.
"Techniques" include both the technology used and
the way in which the installation is designed, built,
maintained, operated and decommissioned.
"Available" techniques mean those developed on a
scale which allows implementation in the relevant
industrial sector, under economically and technically
viable conditions, taking into consideration the costs
and advantages, whether or not the techniques are
used or produced inside the Member State in
question, as long as they are reasonably accessible to
the operator.
"Best" means most effective in achieving a high
general level of protection of the environment as a
whole.
When determining BAT the following considerations
must be taken into account, as listed in Annex 4 of the
directive:
Considerations to be taken into account generally or
in specific cases when determining best available
techniques, as defined in Article 2 (11), bearing in
mind the likely costs and benefits of a measure and
the principles of precaution and prevention:
1. The use of low-waste technology;
2. the use of less hazardous substances;
3. the furthering of recovery and recycling of
substances generated and used in the process
and of waste,where appropriate;
4. comparable processes, facilities or methods of
operation which have been tried with success on
an industrial scale;
5. technological advances and changes in scientific
knowledge and understanding;
6. the nature, effects and volume of the emissions
concerned;
7. the commissioning dates for new and existing
installations;
8. the length of time needed to introduce best
available techniques;
9. the consumption and nature of raw materials
(including water) used in the process and their
energy efficiency;
10. the need to prevent or reduce to a minimum the
overall impact of the emissions on the
environment and the risks to it;
11. the need to prevent accidents and to minimise the
consequences for the environment;
12. the information published by the Commission
pursuant to Article 16 (2) or by international
organizations
It should be noted that the identification of BAT at
individual pig- or poultry farms is not necessarily the
same for all European farms. The so-called "local
aspects" may influence the selection of BAT between
Member States, or even between pig- or poultry farms
within a Member State. Relevant local aspects are for
example nuisance (odour, noise, coarse dust) and local
air or water quality.
8.2.2 Irish legislation and guidelines
The European requirement for environmental impact
statements is roughly compatible with the licensing
requirements set out in the First Schedule to the EPA Act
of 1992. The Act implies that licensing is required for
any units that fall within the following description:
6.2. The rearing of pigs in installations, whether
within the same complex or within 100 meters of that
complex, where the capacity exceeds 1,000 units on
Gley soils or 3,000 units on other soils and where
units have the following equivalents:
1 pig = 1 unit
1 sow, including progeny = 10 units
Integrated Pollution Control (IPC) licensing will
become a requirement for pig production units over a
certain size. The dates at which existing units should
Odour Impacts and Odour Emission Control Measures for Intensive Agriculture
44
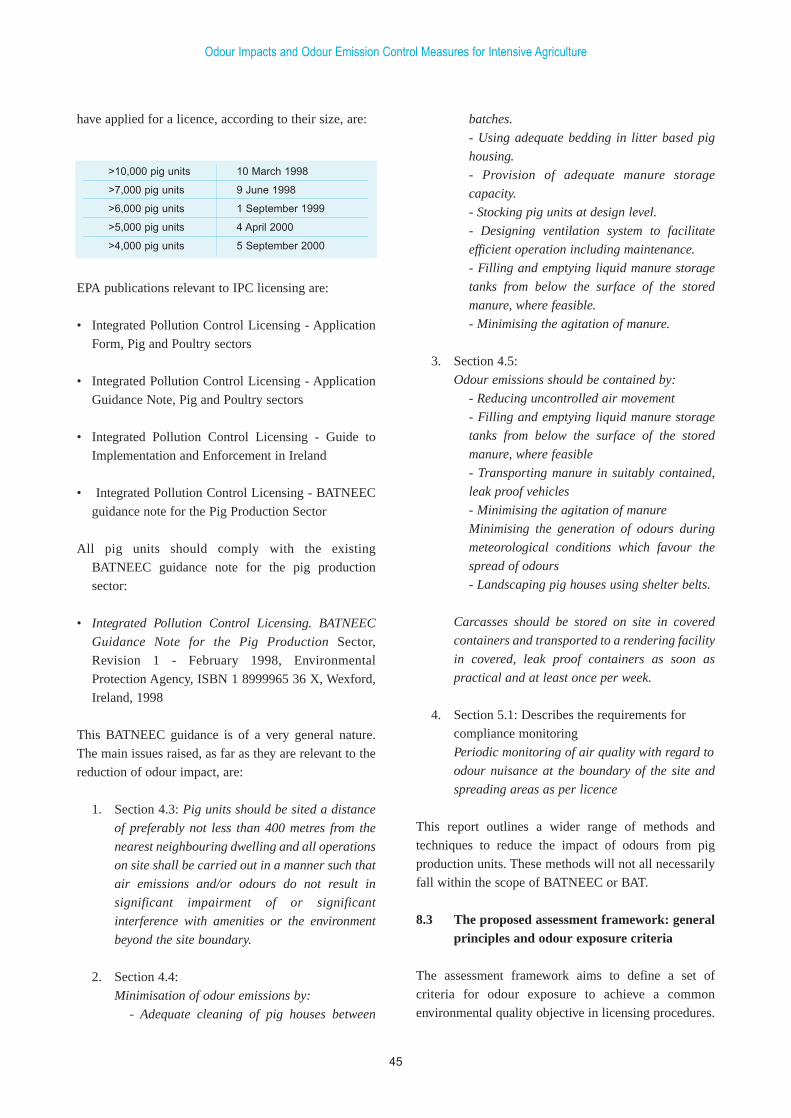
have applied for a licence, according to their size, are: batches.
- Using adequate bedding in litter based pig
housing.
- Provision of adequate manure storage
capacity.
- Stocking pig units at design level.
- Designing ventilation system to facilitate
efficient operation including maintenance.
- Filling and emptying liquid manure storage
tanks from below the surface of the stored
manure, where feasible.
- Minimising the agitation of manure.
3. Section 4.5:
Odour emissions should be contained by:
- Reducing uncontrolled air movement
- Filling and emptying liquid manure storage
tanks from below the surface of the stored
manure, where feasible
- Transporting manure in suitably contained,
leak proof vehicles
- Minimising the agitation of manure
Minimising the generation of odours during
meteorological conditions which favour the
spread of odours
- Landscaping pig houses using shelter belts.
Carcasses should be stored on site in covered
containers and transported to a rendering facility
in covered, leak proof containers as soon as
practical and at least once per week.
4. Section 5.1: Describes the requirements for
compliance monitoring
Periodic monitoring of air quality with regard to
odour nuisance at the boundary of the site and
spreading areas as per licence
This report outlines a wider range of methods and
techniques to reduce the impact of odours from pig
production units. These methods will not all necessarily
fall within the scope of BATNEEC or BAT.
8.3 The proposed assessment framework: generalprinciples and odour exposure criteria
The assessment framework aims to define a set of
criteria for odour exposure to achieve a common
environmental quality objective in licensing procedures.
EPA publications relevant to IPC licensing are:
• Integrated Pollution Control Licensing - Application
Form, Pig and Poultry sectors
• Integrated Pollution Control Licensing - Application
Guidance Note, Pig and Poultry sectors
• Integrated Pollution Control Licensing - Guide to
Implementation and Enforcement in Ireland
• Integrated Pollution Control Licensing - BATNEEC
guidance note for the Pig Production Sector
All pig units should comply with the existing
BATNEEC guidance note for the pig production
sector:
• Integrated Pollution Control Licensing. BATNEEC
Guidance Note for the Pig Production Sector,
Revision 1 - February 1998, Environmental
Protection Agency, ISBN 1 8999965 36 X, Wexford,
Ireland, 1998
This BATNEEC guidance is of a very general nature.
The main issues raised, as far as they are relevant to the
reduction of odour impact, are:
1. Section 4.3: Pig units should be sited a distance
of preferably not less than 400 metres from the
nearest neighbouring dwelling and all operations
on site shall be carried out in a manner such that
air emissions and/or odours do not result in
significant impairment of or significant
interference with amenities or the environment
beyond the site boundary.
2. Section 4.4:
Minimisation of odour emissions by:
- Adequate cleaning of pig houses between
Odour Impacts and Odour Emission Control Measures for Intensive Agriculture
45
>10,000 pig units 10 March 1998
>7,000 pig units 9 June 1998
>6,000 pig units 1 September 1999
>5,000 pig units 4 April 2000
>4,000 pig units 5 September 2000
The propensity to experience annoyance caused by
environmental odours, or annoyance sensitivity, is
variable in a population of residents. Due to the wide
range of annoyance sensitivity of individuals, a zero-
impact approach is not realistic. The aim is to set
environmental quality criteria for odours associated with
an acceptable level of annoyance, sufficiently low to
prevent nuisance. The required level of protection is to
some degree a political choice, reflecting the
expectations of environmental quality of the society in
question. These expectations are not only determined by
human physiological characteristics, but also reflect the
expectations of environmental aesthetic quality. These
expectations are a function of the social, economic and
cultural outlook of a particular society at any given
moment.
The core of the framework is a set of target and limit
values for calculated odour exposure. Using emission
factors for the animals in a given production unit, which
may be adjusted for low-emission housing types and
other mitigating factors, the odour exposure in the
vicinity can be calculated, using atmospheric dispersion
models.
For straightforward cases, a simplified calculation
method can be used to determine whether the impact is
well within the target values. If that is the case, no actual
modelling is required. If the situation is ‘borderline’, a
modelling exercise is necessary to assess the impact
specifically for the location in question.
The calculated odour exposure is expressed as a value
for the one-hour average odour concentration that is not
exceeded during 98% of all the hours in a year with
average weather conditions. This value is the 98-
percentile of all calculated hourly concentrations, or C98,
1-hour in short, and is expressed as odour concentration in
European odour units per cubic metre (ouE/m3) This
value is obtained using the emission rate (estimate),
combined with the characteristics of the emissions
(height of emission point, exit velocity, location), in a
mathematical model for atmospheric dispersion. These
models can take the local topography, obstacles in the
wind flow and meteorological conditions into account.
The environmental quality targets are based on extensive
dose-effect studies that were carried out in the
Netherlands in 1999, involving more than 2303 people
living in the vicinity of pig production units[4], see
section 6.2. In these studies the percentage of the
exposed population experiencing odour annoyance was
determined using a standardised telephone questionnaire
method (see section 5.2.1.1). The person was classified
as ‘annoyed’ if they experienced ‘occasional or frequent
annoyance because of livestock housing units’.
In proposing the environmental quality criteria for
Ireland, the general objective has been to reduce the
percentage of the population ‘annoyed’ by odour
exposure to less than 10% of the resident population in
the vicinity. The choice of this level of annoyance to be
‘acceptable’ cannot be made on purely scientific
grounds. It is a pragmatic value, based on the experience
accrued from developing an odour policy in the
Netherlands, where a policy target of 12% annoyance
was formulated in 1988 [23]. The experience with
licensing in the Netherlands, using criteria on that basis,
supports the feasibility of that value, and its practical
effectiveness. However, it must be clearly stated that this
practical experience, built up in one country, can only
provide a starting point for choosing an appropriate
environmental target for Ireland. In the end, such an
environmental target reflects the ambitions and
requirements of a society, and is, therefore, a matter of
policy, supported by scientific information.
At the selected level of annoyance, the risk of annoyance
developing to nuisance is limited, in most
circumstances, but not excluded. Nuisance may still
occur in unfavourable situations, which can be
determined by secondary factors such as disrupted
community relations, a history of ‘odour incidents’ on
the production unit, other environmental stressors
(noise, dust), etc.
The ‘annoyance sensitivity’, or the propensity of a
population to be annoyed by odours, at similar exposure
levels, has been found to differ. The highest annoyance
sensitivity is found in situations where one pig
production unit is the cause of the exposure, and where
those exposed are not employed in the agricultural
sector. The lowest annoyance sensitivity was found in
people who were employed in the agricultural sector,
exposed to the cumulative pig odours originating in two
or more pig production units, living in areas where pig
production is the predominant economic activity.
Using dose-effect relationships that were established
Odour Impacts and Odour Emission Control Measures for Intensive Agriculture
46
experimentally in a large-scale study[4] as a starting
point, a three-tiered set of limit and target values was
defined for impact assessment in Ireland. These odour
exposure criteria aim to define ‘acceptable odour
exposure’ that should not be exceeded at locations that
can be classified as a ‘sensitive receptor’ for odours, as
described in section 8.4. The environmental quality
criteria are:
• Target value: C98, 1-hour ≤ 1.5 ouE/m3
The target value provides a general level of protection
against odour annoyance for the general public,
aiming to limit the percentage of people experiencing
some form of odour-induced annoyance to 10% or
less. The target value is to be used as an
environmental quality target for all situations.
The target value is achieved when the calculated
odour exposure for all locations of odour sensitive
receptors is less than an hourly average odour
concentration of 1.5 ouE/m3 in 98% of all hours in an
average meteorological year.
• Limit value for new pig production units: C98, 1-
hour ≤ 3.0 ouE/m3
The limit value for new pig production units provides
a minimum level of protection against odour
annoyance, aiming to limit the percentage of those
experiencing some form of odour-induced annoyance
to 10% or less in the general public, assuming some
degree of acceptance of the rural nature of their living
environment.
The limit value for new pig production units shall not
be exceeded in the vicinity of new pig production
units to ensure a minimum environmental quality.
The limit value for new pig production units is
complied with when for all locations of odour
sensitive receptors the calculated odour exposure is
less than an hourly average odour concentration of
3.0 ouE/m3 in 98% of all hours in an average
meteorological year.
• Limit value for existing pig production units: C98,
1-hour ≤ 6.0 ouE/m3
The limit value for existing pig production units
provides a minimum level of protection against odour
annoyance, aiming to limit the percentage of people
experiencing some form of odour-induced annoyance
to 10% or less, in the most tolerant selection of the
population.
The limit value for existing pig production units shall
not be exceeded in the vicinity of existing pig
production units to ensure the minimum
environmental quality in an agricultural setting. A
phased plan must be made to reduce the odour
impact, with time, to the limit value for new pig
production units and, eventually, the target value.
The limit value for existing production units is
complied with when for all locations of odour
sensitive receptors the calculated odour exposure is
less than an hourly average odour concentration of
6.0 ouE/m3 in 98% of all hours in an average
meteorological year.
These criteria for odour exposure aim to provide a
framework that can be used to attain a general
environmental quality in Ireland, while recognising that
in some cases existing pig production units may need a
considerable period of time to achieve that target. In
some cases, the time allowed will have to take into
account the cycle of normal replacement of assets such
as housing, to allow implementation of a structural
solution.
For those situations, a limit value is set that will reduce
the impact of odours to a level deemed acceptable for the
most tolerant sections of society, with a strong affinity
with the agricultural sector.
As a general principle, however, a target value is set to
ensure that, with time, an environmental quality is
achieved throughout the country that allows a diversified
use of the countryside, not excluding or limiting
recreational and residential use.
8.4 Definition of sensitive receptors
To make the concept of ‘impairment of amenity’
operational, it is useful to determine what objects or
structures, intended to be used by people, constitute a
sensitive receptor. To decide whether a location should
be classified as an odour sensitive receptor, the
following issues must be considered:
• Is the facility for permanent use, throughout the year?
• Is the facility suitable as overnight accommodation?
Odour Impacts and Odour Emission Control Measures for Intensive Agriculture
47
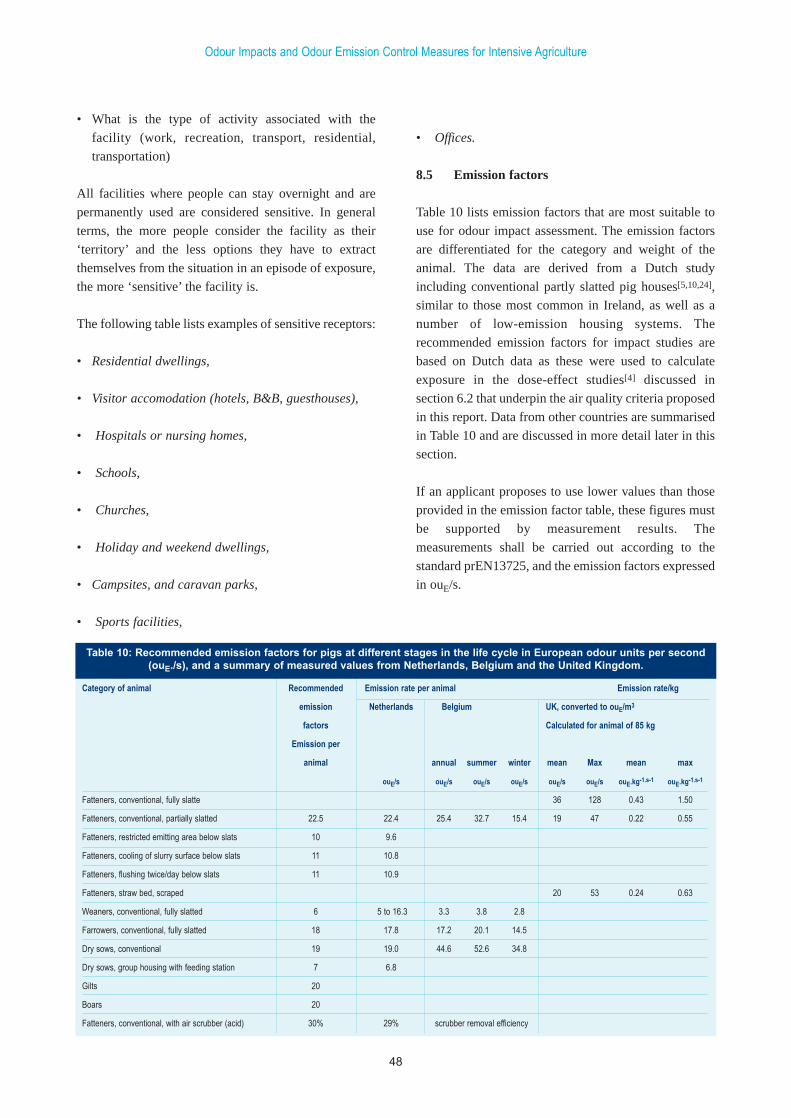
• What is the type of activity associated with the
facility (work, recreation, transport, residential,
transportation)
All facilities where people can stay overnight and are
permanently used are considered sensitive. In general
terms, the more people consider the facility as their
‘territory’ and the less options they have to extract
themselves from the situation in an episode of exposure,
the more ‘sensitive’ the facility is.
The following table lists examples of sensitive receptors:
• Residential dwellings,
• Visitor accomodation (hotels, B&B, guesthouses),
• Hospitals or nursing homes,
• Schools,
• Churches,
• Holiday and weekend dwellings,
• Campsites, and caravan parks,
• Sports facilities,
• Offices.
8.5 Emission factors
Table 10 lists emission factors that are most suitable to
use for odour impact assessment. The emission factors
are differentiated for the category and weight of the
animal. The data are derived from a Dutch study
including conventional partly slatted pig houses[5,10,24],
similar to those most common in Ireland, as well as a
number of low-emission housing systems. The
recommended emission factors for impact studies are
based on Dutch data as these were used to calculate
exposure in the dose-effect studies[4] discussed in
section 6.2 that underpin the air quality criteria proposed
in this report. Data from other countries are summarised
in Table 10 and are discussed in more detail later in this
section.
If an applicant proposes to use lower values than those
provided in the emission factor table, these figures must
be supported by measurement results. The
measurements shall be carried out according to the
standard prEN13725, and the emission factors expressed
in ouE/s.
Odour Impacts and Odour Emission Control Measures for Intensive Agriculture
48
Category of animal Recommended Emission rate per animal Emission rate/kg
emission Netherlands Belgium UK, converted to ouE/m3
factors Calculated for animal of 85 kg
Emission per
animal annual summer winter mean Max mean max
ouE/s ouE/s ouE/s ouE/s ouE/s ouE/s ouE.kg-1.s-1 ouE.kg-1.s-1
Fatteners, conventional, fully slatte 36 128 0.43 1.50
Fatteners, conventional, partially slatted 22.5 22.4 25.4 32.7 15.4 19 47 0.22 0.55
Fatteners, restricted emitting area below slats 10 9.6
Fatteners, cooling of slurry surface below slats 11 10.8
Fatteners, flushing twice/day below slats 11 10.9
Fatteners, straw bed, scraped 20 53 0.24 0.63
Weaners, conventional, fully slatted 6 5 to 16.3 3.3 3.8 2.8
Farrowers, conventional, fully slatted 18 17.8 17.2 20.1 14.5
Dry sows, conventional 19 19.0 44.6 52.6 34.8
Dry sows, group housing with feeding station 7 6.8
Gilts 20
Boars 20
Fatteners, conventional, with air scrubber (acid) 30% 29% scrubber removal efficiency
Table 10: Recommended emission factors for pigs at different stages in the life cycle in European odour units per second(ouE./s), and a summary of measured values from Netherlands, Belgium and the United Kingdom.
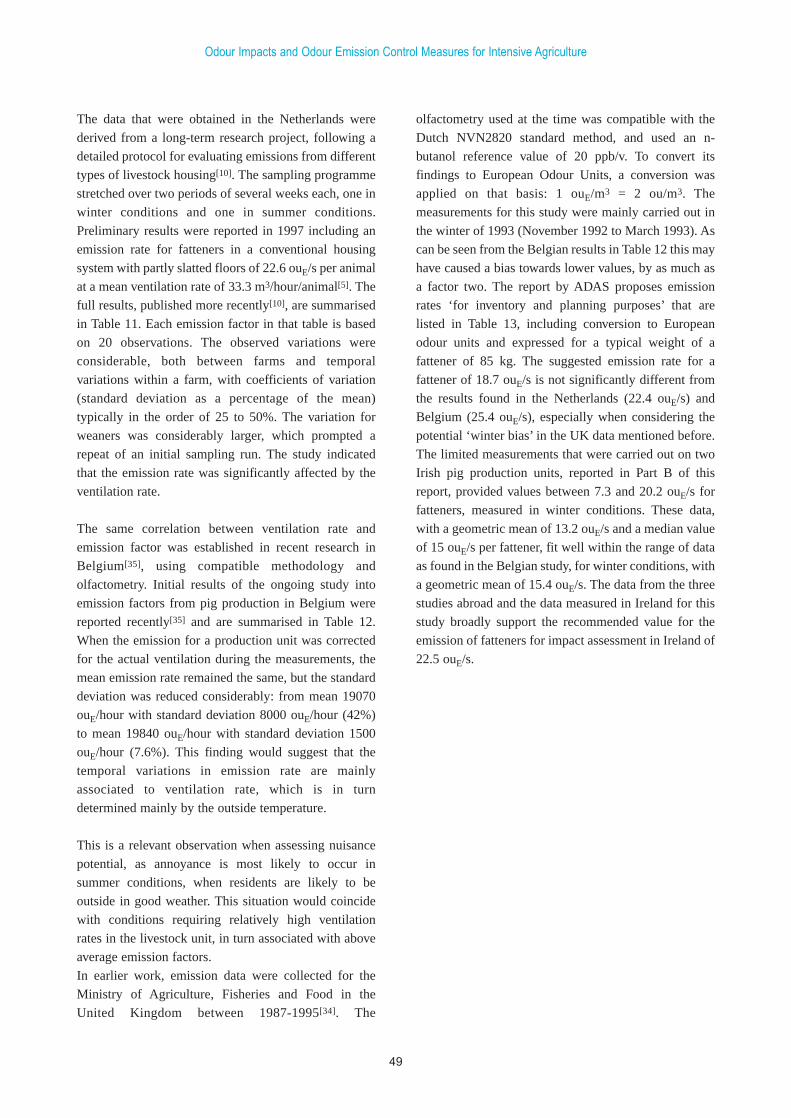
The data that were obtained in the Netherlands were
derived from a long-term research project, following a
detailed protocol for evaluating emissions from different
types of livestock housing[10]. The sampling programme
stretched over two periods of several weeks each, one in
winter conditions and one in summer conditions.
Preliminary results were reported in 1997 including an
emission rate for fatteners in a conventional housing
system with partly slatted floors of 22.6 ouE/s per animal
at a mean ventilation rate of 33.3 m3/hour/animal[5]. The
full results, published more recently[10], are summarised
in Table 11. Each emission factor in that table is based
on 20 observations. The observed variations were
considerable, both between farms and temporal
variations within a farm, with coefficients of variation
(standard deviation as a percentage of the mean)
typically in the order of 25 to 50%. The variation for
weaners was considerably larger, which prompted a
repeat of an initial sampling run. The study indicated
that the emission rate was significantly affected by the
ventilation rate.
The same correlation between ventilation rate and
emission factor was established in recent research in
Belgium[35], using compatible methodology and
olfactometry. Initial results of the ongoing study into
emission factors from pig production in Belgium were
reported recently[35] and are summarised in Table 12.
When the emission for a production unit was corrected
for the actual ventilation during the measurements, the
mean emission rate remained the same, but the standard
deviation was reduced considerably: from mean 19070
ouE/hour with standard deviation 8000 ouE/hour (42%)
to mean 19840 ouE/hour with standard deviation 1500
ouE/hour (7.6%). This finding would suggest that the
temporal variations in emission rate are mainly
associated to ventilation rate, which is in turn
determined mainly by the outside temperature.
This is a relevant observation when assessing nuisance
potential, as annoyance is most likely to occur in
summer conditions, when residents are likely to be
outside in good weather. This situation would coincide
with conditions requiring relatively high ventilation
rates in the livestock unit, in turn associated with above
average emission factors.
In earlier work, emission data were collected for the
Ministry of Agriculture, Fisheries and Food in the
United Kingdom between 1987-1995[34]. The
olfactometry used at the time was compatible with the
Dutch NVN2820 standard method, and used an n-
butanol reference value of 20 ppb/v. To convert its
findings to European Odour Units, a conversion was
applied on that basis: 1 ouE/m3 = 2 ou/m3. The
measurements for this study were mainly carried out in
the winter of 1993 (November 1992 to March 1993). As
can be seen from the Belgian results in Table 12 this may
have caused a bias towards lower values, by as much as
a factor two. The report by ADAS proposes emission
rates ‘for inventory and planning purposes’ that are
listed in Table 13, including conversion to European
odour units and expressed for a typical weight of a
fattener of 85 kg. The suggested emission rate for a
fattener of 18.7 ouE/s is not significantly different from
the results found in the Netherlands (22.4 ouE/s) and
Belgium (25.4 ouE/s), especially when considering the
potential ‘winter bias’ in the UK data mentioned before.
The limited measurements that were carried out on two
Irish pig production units, reported in Part B of this
report, provided values between 7.3 and 20.2 ouE/s for
fatteners, measured in winter conditions. These data,
with a geometric mean of 13.2 ouE/s and a median value
of 15 ouE/s per fattener, fit well within the range of data
as found in the Belgian study, for winter conditions, with
a geometric mean of 15.4 ouE/s. The data from the three
studies abroad and the data measured in Ireland for this
study broadly support the recommended value for the
emission of fatteners for impact assessment in Ireland of
22.5 ouE/s.
Odour Impacts and Odour Emission Control Measures for Intensive Agriculture
49
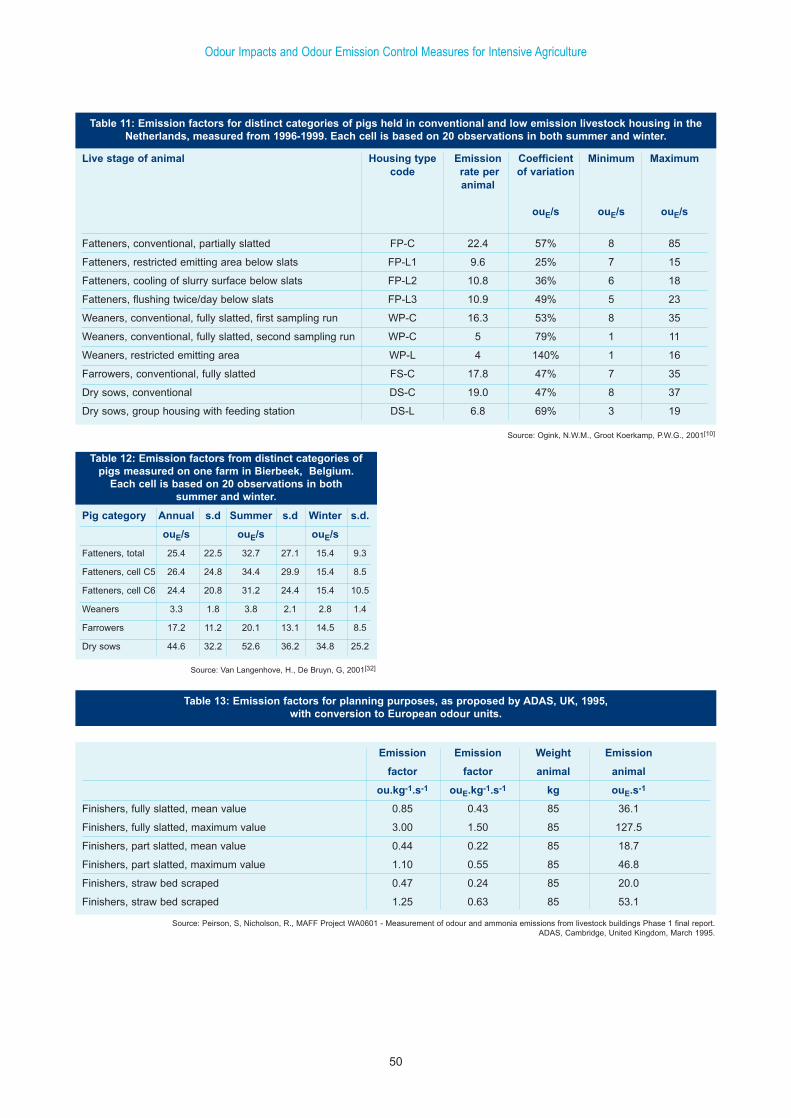
Odour Impacts and Odour Emission Control Measures for Intensive Agriculture
50
Live stage of animal Housing type Emission Coefficient Minimum Maximum code rate per of variation
animal
ouE/s ouE/s ouE/s
Fatteners, conventional, partially slatted FP-C 22.4 57% 8 85
Fatteners, restricted emitting area below slats FP-L1 9.6 25% 7 15
Fatteners, cooling of slurry surface below slats FP-L2 10.8 36% 6 18
Fatteners, flushing twice/day below slats FP-L3 10.9 49% 5 23
Weaners, conventional, fully slatted, first sampling run WP-C 16.3 53% 8 35
Weaners, conventional, fully slatted, second sampling run WP-C 5 79% 1 11
Weaners, restricted emitting area WP-L 4 140% 1 16
Farrowers, conventional, fully slatted FS-C 17.8 47% 7 35
Dry sows, conventional DS-C 19.0 47% 8 37
Dry sows, group housing with feeding station DS-L 6.8 69% 3 19
Source: Ogink, N.W.M., Groot Koerkamp, P.W.G., 2001[10]
Table 11: Emission factors for distinct categories of pigs held in conventional and low emission livestock housing in theNetherlands, measured from 1996-1999. Each cell is based on 20 observations in both summer and winter.
Pig category Annual s.d Summer s.d Winter s.d.
ouE/s ouE/s ouE/s
Fatteners, total 25.4 22.5 32.7 27.1 15.4 9.3
Fatteners, cell C5 26.4 24.8 34.4 29.9 15.4 8.5
Fatteners, cell C6 24.4 20.8 31.2 24.4 15.4 10.5
Weaners 3.3 1.8 3.8 2.1 2.8 1.4
Farrowers 17.2 11.2 20.1 13.1 14.5 8.5
Dry sows 44.6 32.2 52.6 36.2 34.8 25.2
Table 12: Emission factors from distinct categories ofpigs measured on one farm in Bierbeek, Belgium.
Each cell is based on 20 observations in bothsummer and winter.
Source: Van Langenhove, H., De Bruyn, G, 2001[32]
Table 13: Emission factors for planning purposes, as proposed by ADAS, UK, 1995,with conversion to European odour units.
Source: Peirson, S, Nicholson, R., MAFF Project WA0601 - Measurement of odour and ammonia emissions from livestock buildings Phase 1 final report. ADAS, Cambridge, United Kingdom, March 1995.
Emission Emission Weight Emission
factor factor animal animal
ou.kg-1.s-1 ouE.kg-1.s-1 kg ouE.s-1
Finishers, fully slatted, mean value 0.85 0.43 85 36.1
Finishers, fully slatted, maximum value 3.00 1.50 85 127.5
Finishers, part slatted, mean value 0.44 0.22 85 18.7
Finishers, part slatted, maximum value 1.10 0.55 85 46.8
Finishers, straw bed scraped 0.47 0.24 85 20.0
Finishers, straw bed scraped 1.25 0.63 85 53.1
After conversion of the UK results to European odour
units (1 ouE.m-3 = 2 ge.m-3) the mean emission factors
from the UK study are in the order of 0.43 ouE.s-1.kg-1
for a fattener on a fully slatted system and 0.22 ouE.s-
1.kg-1 for a part slatted system. These values correspond
with Dutch data presented in Table 11 that are equivalent
to specific emission rate for fatteners of 85 kg live
weight on a part slatted system of 0.26 ouE.s-1.kg-1 .
Limited measurements on an Irish pig unit, presented in
Part B of the report of this study, arrived at a (geometric)
mean specific emission rate of 0.22 ouE.s-1.kg-1 for
fatteners.
As the differences between measured emissions per
animal from different sources are not clearly significant,
given the observed variation of emission rates measured
on different days within one pig unit and between pig
units, the data presented in Table 10 provide the best
estimate for emission rates currently available.
8.6 Cumulation
In the Irish situation, cumulative impact of large
numbers of sources affecting the same receptor site is
relatively rare. It has been found that even in situations
where cumulated exposure from multiple pig production
units occurs, the impact in terms of percentage of people
annoyed can be adequately predicted on the basis of the
calculated exposure caused by the one dominant source
only[4]. Therefore, in order to simplify the assessment,
only the predominant source is to be used in assessment
of impact.
The predominant source is defined as the source with the
largest proportional contribution to the odour impact
(C98, 1-hour) at the receptor location in question.
8.7 Practical application of the assessment framework
The assessment framework provides for a simplified
assessment method for cases in which it can be
reasonably expected that the underlying environmental
quality criteria will be met. Those cases can be assessed
using a simple screening method, employing map
overlays with standard contours. The aim is to reduce
the burden of assessment where this is feasible, with
reasonable confidence.
In those cases where the answer to the question: Are the
environmental quality targets for odour attained? is not
easily answered with an unequivocal Yes, a more
detailed assessment route must be followed. The
detailed assessment involves making a best estimate of
odour emissions, on the basis of the number of animals
present at the facility at full design capacity and a
schedule of emission factors per animal, differentiated to
the stages in the life cycle of the pig. These factors can
take low-emission practices into account, when relevant
emission factors are available or abatement efficiency
can be reliably estimated.
Only in those cases where the applicant asserts that
lower emission factors than those listed in this document
are applicable, will measurements of emissions per
animal on site be required. The statistical design of the
sampling programme must be suitable, in that case, to
yield statistically significant conclusions on differences
with the standard emission factors.
Contours can be calculated, using the estimated
emissions and a suitable atmospheric dispersion model,
which uses the topographical and meteorological data
applicable to the specific site, and drawn on the map of
the vicinity to represent the environmental quality
targets that have been set as the basis for this assessment
framework. Comparing the location of odour sensitive
receptors, such as residential dwellings, relative to these
contours, will provide the licensing officer with the
framework for setting licensing conditions.
The assessment process for licensing, where odour
exposure is involved, has been outlined in Figure 6. This
approach to assessment has been illustrated in three case
studies, see Chapter 10.
Odour Impacts and Odour Emission Control Measures for Intensive Agriculture
51
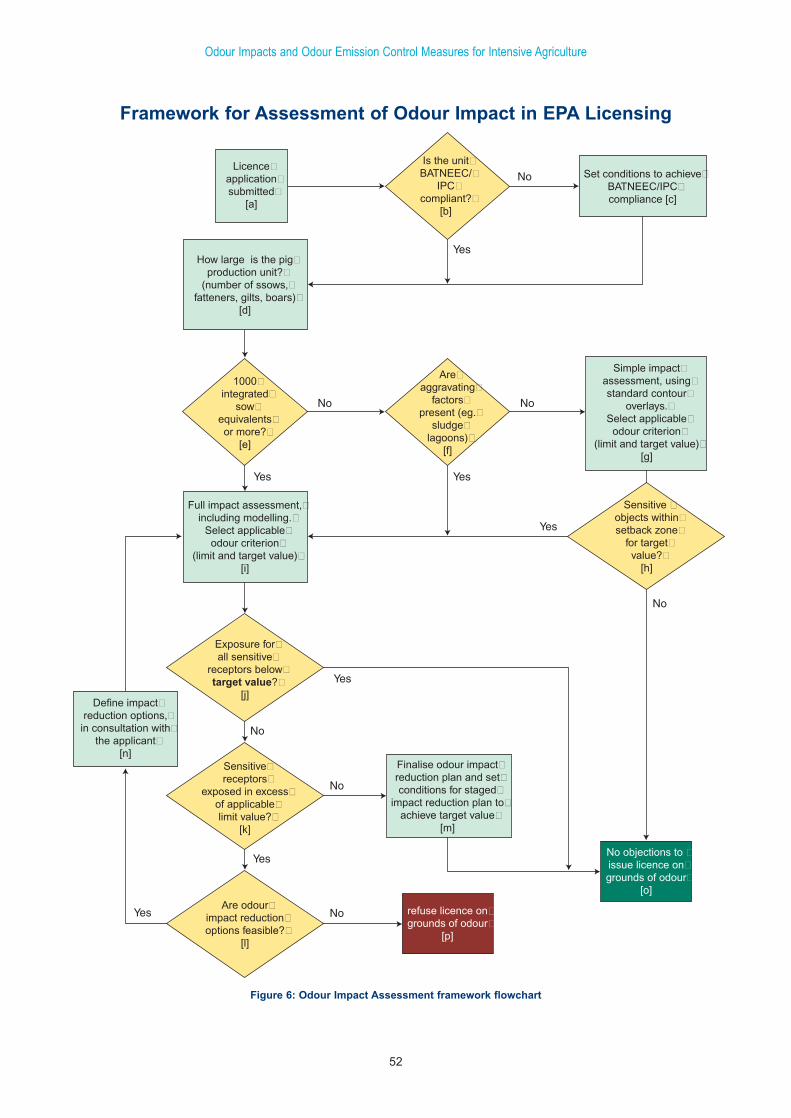
Odour Impacts and Odour Emission Control Measures for Intensive Agriculture
52
Full impact assessment,�including modelling.�
Select applicable�odour criterion�
(limit and target value)�[i]
Exposure for�all sensitive�
receptors below�target value?�
[j]
Sensitive�receptors�
exposed in excess�of applicable�limit value?�
[k]
Finalise odour impact�reduction plan and set�conditions for staged�
impact reduction plan to�achieve target value�
[m]
refuse licence on�grounds of odour�
[p]
Are odour�impact reduction�options feasible?�
[l]
Define impact�reduction options,�
in consultation with�the applicant�
[n]
How large is the pig�production unit?�
(number of ssows,�fatteners, gilts, boars)�
[d]
1000�integrated�
sow�equivalents�or more?�
[e]
Are�aggravating�
factors�present (eg.�
sludge�lagoons)�
[f]
Licence�application�submitted�
[a]
Is the unit�BATNEEC/�
IPC�compliant?�
[b]
Set conditions to achieve�BATNEEC/IPC�compliance [c]
Simple impact�assessment, using�standard contour�
overlays.�Select applicable�
odour criterion�(limit and target value)�
[g]
Sensitive �objects within�setback zone�
for target�value?�
[h]
No objections to �issue licence on�grounds of odour�
[o]
Figure 6: Odour Impact Assessment framework flowchart
Framework for Assessment of Odour Impact in EPA Licensing
8.8 The general, simple case: assessment by screening using standard contour overlays
To make a first assessment, figures with standard
contours for integrated units have been produced, which
are included in Annex E of this report. These contours
represent a simple case, for flat terrain, for an inland
meteorological station (Claremorris). By copying these
standard contours on an overhead sheet, at the scale
appropriate for the topographical map of the vicinity, a
quick assessment can be made, aimed at establishing
whether the pig production unit involved is well clear of
potentially causing a nuisance. If that is the case, the
assessment for the application does not need to go any
further.
In the event that the outcome is either ‘borderline’ or
indicates that sensitive receptors are within the standard
contours, a more detailed assessment is to be made.
The relevant figures can be found in Annex E:
• Figure 16 Standard contour overlay, representing
typical contours for the target value for all pig
production units of C98, 1-hour = 1.5 ouE/m3, for
integrated sow units of different sizes, scale 1:50,000.
• Figure 15 Standard contour overlay, representing
typical contours for the limit value for new pig
production units of C98, 1-hour = 3 ouE/m3, for
integrated sow units of different sizes, scale 1:50,000.
• Figure 17 Standard contour overlay, representing
typical contours for the limit value for existing pig
production units of C98, 1-hour = 6 ouE/m3 , for
integrated sow units of different sizes, scale 1:10,560.
The contours can be a-symmetrical to some degree,
reflecting the predominant SW wind directions in
combination with wind velocity and stability of the
atmosphere in Ireland. The setback distances can, as a
result, be dependent on the location of the sensitive
receptor relative to the source.
The standard contours were calculated using
meteorological data for Claremorris, for the years 1993
to 1995 (inclusive). The terrain was assumed to be
perfectly flat for the purpose of the calculation of
standard contour lines for screening purposes.
The protocol for the simple assessment using standard
contour overlays is summarised below:
1. Determine which criterion is applicable
2. Select the appropriate overlay figure
3. Copy to the standard contour figure on an overhead
sheet at the correct scale for the underlying
topographical map, on which the locations of the
sensitive receptors are marked
4. Determine the size of the pig production unit of the
applicant. Choose the contour for the nearest higher
number of sows: this is the appropriate standard
contour
5. Place the overlay on the topographical map, with the
centre cross in the centre of the pig production unit
6. Assess if any sensitive receptors are located within
the appropriate standard contour. If that is the case,
carry out a full impact assessment.
7. If no sensitive receptors are located within the
appropriate standard contour, the licence can be
approved, as far as odour impact is concerned, as long
as BATNEEC conditions are applied.
The standard contours provide a reasonable indication of
the impacted area, but specific factors, such as local
topography and meteorology and configuration of
emission points may have a significant impact on the
actual shape and location of the contours for the specific
study site. Where the final decision hinges on detailed
location of contours, actual modelling is advisable,
particularly if the consequences of the decision are
potentially large.
In making impact assessments all relevant local
information should be considered and its implications
for the impact of the odour exposure on the nuisance
potential should be taken into account.
8.9 Full impact assessment using atmospheric modelling
To carry out a full impact assessment, a modelling study
needs to be carried out, using a suitable atmospheric
Odour Impacts and Odour Emission Control Measures for Intensive Agriculture
53
dispersion model to determine the contours on the map
where a chosen exposure criterion occurs (e.g. C98, 1-hour
= 3 ouE/m3).
The outcome of the model depends entirely on the data
input. It is important to collect adequate data for model
input. This requires a balanced approach. Too little detail
may, therefore, lead to unreliable results, while too
much detail may require an inappropriate amount of
resources to collect, perhaps wrongly suggesting an
accuracy for the prediction that is unrealistic relative to
the inherent uncertainties in the model.
The typical data required are:
• Source characterisation data, describing the location,
flow characteristics and emission rates of the source;
• Terrain data, describing the topography of the study
area, and characterising the ‘terrain roughness, or the
typical size of obstacles as far as these affect the
turbulence in the boundary layer of the atmosphere;
• Meteorological data, for a minimum of 3 years,
consisting of a continuous set of hourly observations
for wind direction, wind speed and ‘stability class’, a
parameter describing the turbulence in the boundary
layer.
The collection of those data is described below. Before
modelling, a decision must be made as to which
exposure criterion is to be applied to the production unit
under study. Then the following data need to be
collected:
1) Source characterisation:
a) Prepare an inventory of the location, dimensions
and height of the production units (buildings,
storage facilities, ventilation points, air treatment
units, etc.)
This inventory can be done on a detailed scale,
locating individual ventilation shafts, their
location, capacity, mean regulated rate, etc.
However, this level of detail will, generally
speaking, not be required. The larger the distance
to the sensitive receptor, the less detail is
required. At a distance of 100 m, the location of
a ventilator may have an effect, which is likely to
be irrelevant at a distance of 800 m. A simplified
method, dividing the area of buildings into areas
(or pixels) of no more than approximately 20 m x
20 m, each represented by one point source, will
provide sufficient detail for the impact
assessment at distances of approximately 200 m
and more from the source.
b) Determine the emission per building, on the basis
of the housing capacity and the type of animals
housed in that building. Using the emission
factors, listed in table Table 11, the emission for
that housing unit can be determined, and
assigned to as many point sources as is deemed
necessary to represent the emission adequately
for the purpose of modelling. The ventilation
flow rate, the height of the emission point, the
exit velocity and the diameter of the exit duct
must be estimated based on the actual conditions
and the number of animals represented by the
area chosen. As odour annoyance is most likely
to occur in summer, when residents are outside,
or have windows open, the exit velocity based on
summer ventilation rates are arguably the most
relevant to use in modelling. For establishing the
worst case, winter ventilation rates should be
used to establish input for dispersion modelling.
Some models accommodate different sets of
sources to be entered as input for each season, or
even per month, which is the most accurate
approach.
2) Characterisation of terrain in the vicinity
a) Topography.
To calculate a contour for an exposure criterion,
e.g. C98, 1-hour = 3 ouE/m3, a grid of receptor
points is required. The model will calculate
exposure for each point on the grid, and then use
a suitable interpolation method to draw a
continuous contour line. Specific receptor
locations on the grid may be entered,
representing the location of defined sensitive
receptors, for detailed consideration. In setting
up a grid, the following considerations apply.
A finer grid causes significantly longer runtimes
for the modelling software. A coarser grid
increases the risk of errors induced by the
interpolation to draw contour lines. At distances
Odour Impacts and Odour Emission Control Measures for Intensive Agriculture
54
up to 300 m a grid with a grid step of 50 m is
advisable. Between 300 m and 1000 m a grid step
of 100 m is recommended. Between 100 m and
2000 m a grid step of 250 m is required. At larger
distances a grid step of 500 m may be used.
Slight topographical features, such as elevation
differences of 5 m or less, within the first 300-
400 m or 10 m or less at distances greater than
300 m are not very relevant for the model results
in most cases, except those that are borderline
relative to compliance with the selected criterion
for the site.
i) If topography is not an issue, a grid of
receptor at the same elevation as the source
can be used.
ii) If topography is an issue, than an actual
elevation must be added to each point on the
receptor grid. Elevation can be obtained from
maps, preferably directly in digital format.
b) Terrain roughness.
Terrain roughness is a parameter with the unit
metre [m] that is used to characterise mechanical
turbulence in the lowest part of the mixing layer,
just above the earth surface. The parameter is
determined on the basis of the size of obstacles,
using the following scale:
i) 0.03 m - plain surface with only low vegetation
(grassland) with only occasional small
obstacles, e.g. airfields, plain meadows or
field after ploughing.
ii) 0.10 m - Fields with regular cover of low
crops, or grasslands with drainage ditches no
more than 20m apart. Occasional minor
obstacles can occur at distances in excess of
20 times their height, such as low windrows,
single lines of trees without leaves, individual
farm buildings.
iii) 0.25 m - Fields with intermittently high and
low crops. Larger scale obstacles (e.g. rows of
trees with leaves, low orchards) occur at
distances of more than 15 times their height.
iv) 0.50 m - Larger obstacles (e.g. larger farm
buildings, wooded areas) occur at distances of
approximately 10 times their height,
separated by shrubs, new forest with young
trees and mature orchards.
v) 1.0 m - Area regularly covered by larger
obstacles, at distances not exceeding a few
times the height of these obstacles, e.g.
mature forest, low to medium density
residential areas in villages and towns.
vi) 3.0 m - Cityscape with intermittent low, single
and double storey, and higher multi-storey
buildings. Can also apply to woods with very
high trees and many, irregular openings.
3) Meteorological data
A minimum of 3 years of continuous meteorological
observations is required, giving hourly observations of
wind speed, wind direction and stability class (see also
section 5.3.3).
8.10 Specific terms and definitions
• Distance to source. The distance between the off-site
receptor point, such as the closest elevation of a
corner of a residence, and the nearest emission point
(ventilation shaft or natural opening).
Odour Impacts and Odour Emission Control Measures for Intensive Agriculture
55

Odour Impacts and Odour Emission Control Measures for Intensive Agriculture
56
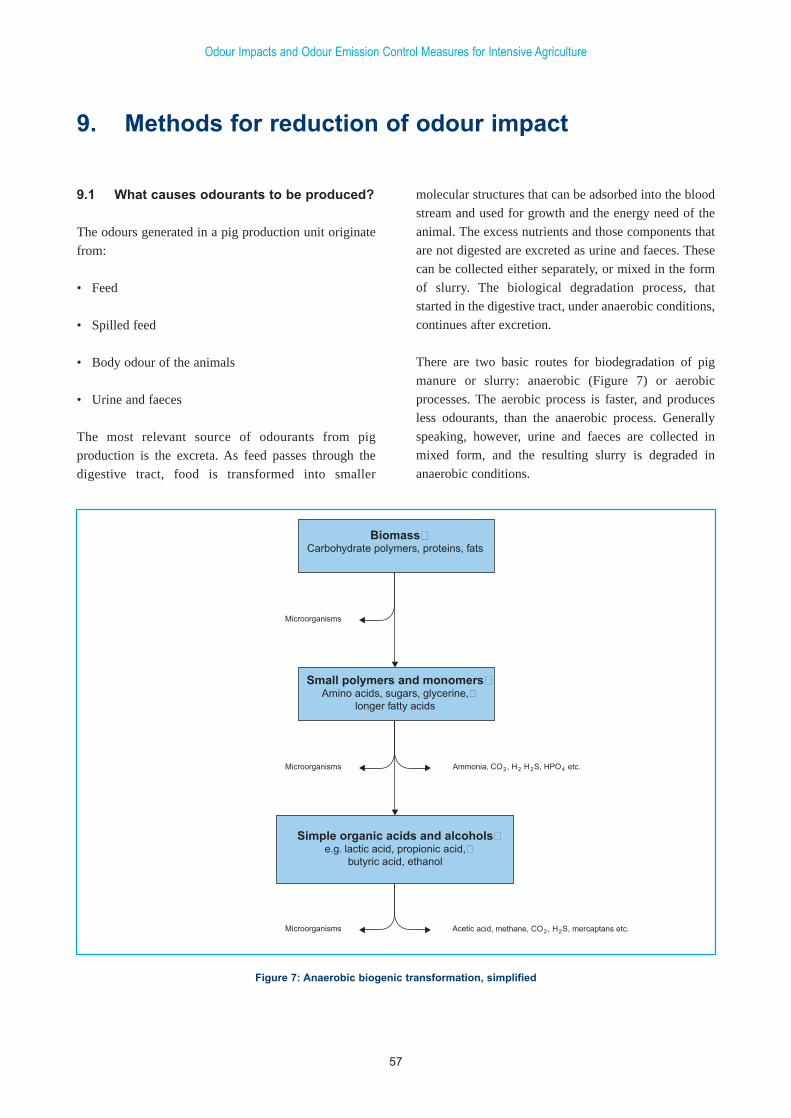
9.1 What causes odourants to be produced?
The odours generated in a pig production unit originate
from:
• Feed
• Spilled feed
• Body odour of the animals
• Urine and faeces
The most relevant source of odourants from pig
production is the excreta. As feed passes through the
digestive tract, food is transformed into smaller
molecular structures that can be adsorbed into the blood
stream and used for growth and the energy need of the
animal. The excess nutrients and those components that
are not digested are excreted as urine and faeces. These
can be collected either separately, or mixed in the form
of slurry. The biological degradation process, that
started in the digestive tract, under anaerobic conditions,
continues after excretion.
There are two basic routes for biodegradation of pig
manure or slurry: anaerobic (Figure 7) or aerobic
processes. The aerobic process is faster, and produces
less odourants, than the anaerobic process. Generally
speaking, however, urine and faeces are collected in
mixed form, and the resulting slurry is degraded in
anaerobic conditions.
Odour Impacts and Odour Emission Control Measures for Intensive Agriculture
57
9. Methods for reduction of odour impact
Biomass�Carbohydrate polymers, proteins, fats
Small polymers and monomers�Amino acids, sugars, glycerine,�
longer fatty acids
Simple organic acids and alcohols�e.g. lactic acid, propionic acid,�
butyric acid, ethanol
Figure 7: Anaerobic biogenic transformation, simplified
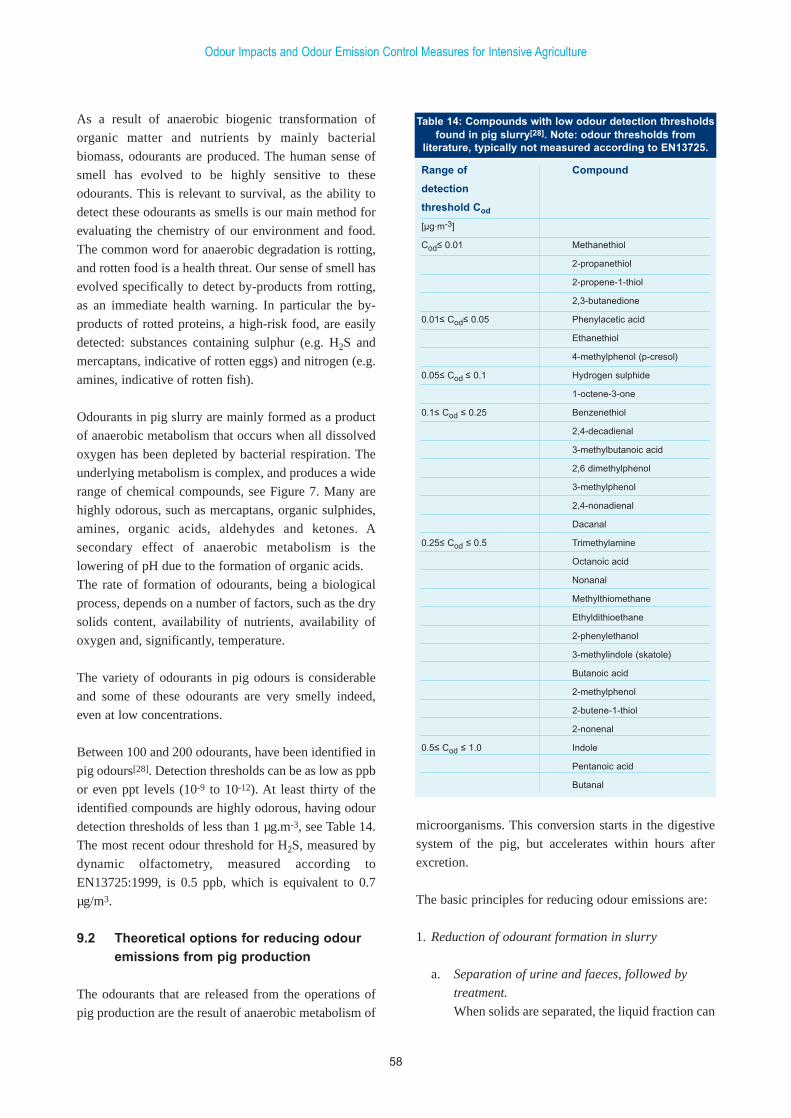
As a result of anaerobic biogenic transformation of
organic matter and nutrients by mainly bacterial
biomass, odourants are produced. The human sense of
smell has evolved to be highly sensitive to these
odourants. This is relevant to survival, as the ability to
detect these odourants as smells is our main method for
evaluating the chemistry of our environment and food.
The common word for anaerobic degradation is rotting,
and rotten food is a health threat. Our sense of smell has
evolved specifically to detect by-products from rotting,
as an immediate health warning. In particular the by-
products of rotted proteins, a high-risk food, are easily
detected: substances containing sulphur (e.g. H2S and
mercaptans, indicative of rotten eggs) and nitrogen (e.g.
amines, indicative of rotten fish).
Odourants in pig slurry are mainly formed as a product
of anaerobic metabolism that occurs when all dissolved
oxygen has been depleted by bacterial respiration. The
underlying metabolism is complex, and produces a wide
range of chemical compounds, see Figure 7. Many are
highly odorous, such as mercaptans, organic sulphides,
amines, organic acids, aldehydes and ketones. A
secondary effect of anaerobic metabolism is the
lowering of pH due to the formation of organic acids.
The rate of formation of odourants, being a biological
process, depends on a number of factors, such as the dry
solids content, availability of nutrients, availability of
oxygen and, significantly, temperature.
The variety of odourants in pig odours is considerable
and some of these odourants are very smelly indeed,
even at low concentrations.
Between 100 and 200 odourants, have been identified in
pig odours[28]. Detection thresholds can be as low as ppb
or even ppt levels (10-9 to 10-12). At least thirty of the
identified compounds are highly odorous, having odour
detection thresholds of less than 1 µg.m-3, see Table 14.
The most recent odour threshold for H2S, measured by
dynamic olfactometry, measured according to
EN13725:1999, is 0.5 ppb, which is equivalent to 0.7
µg/m3.
9.2 Theoretical options for reducing odour emissions from pig production
The odourants that are released from the operations of
pig production are the result of anaerobic metabolism of
Odour Impacts and Odour Emission Control Measures for Intensive Agriculture
58
Range of Compound
detection
threshold Cod
[µg.m-3]
Cod≤ 0.01 Methanethiol
2-propanethiol
2-propene-1-thiol
2,3-butanedione
0.01≤ Cod≤ 0.05 Phenylacetic acid
Ethanethiol
4-methylphenol (p-cresol)
0.05≤ Cod ≤ 0.1 Hydrogen sulphide
1-octene-3-one
0.1≤ Cod ≤ 0.25 Benzenethiol
2,4-decadienal
3-methylbutanoic acid
2,6 dimethylphenol
3-methylphenol
2,4-nonadienal
Dacanal
0.25≤ Cod ≤ 0.5 Trimethylamine
Octanoic acid
Nonanal
Methylthiomethane
Ethyldithioethane
2-phenylethanol
3-methylindole (skatole)
Butanoic acid
2-methylphenol
2-butene-1-thiol
2-nonenal
0.5≤ Cod ≤ 1.0 Indole
Pentanoic acid
Butanal
Table 14: Compounds with low odour detection thresholdsfound in pig slurry[28]. Note: odour thresholds from
literature, typically not measured according to EN13725.
microorganisms. This conversion starts in the digestive
system of the pig, but accelerates within hours after
excretion.
The basic principles for reducing odour emissions are:
1. Reduction of odourant formation in slurry
a. Separation of urine and faeces, followed by
treatment.
When solids are separated, the liquid fraction can
be treated by aeration, reducing the production of
highly odorous compounds. The aerated liquid
can be used as flushing liquid to collect slurry
more efficiently from the pig houses. Aeration
and separation of the solid fraction also provides
a benefit in reducing the odour impact from
spreading.
b. Lowering of temperature of stored slurry
The relation between temperature and the
anaerobic metabolic rate is exponential. A
reduction of the slurry temperature from 20°C to
10°C causes a reduction to less than 50% of the
emission rate at 20°C.
c. Reduction of the protein content in feed
d. Collection of slurry in closed tanks, followed by
anaerobic digestion.
In this process the odourants that are produced
can be destroyed by controlled incineration of the
biogas. The digested slurry is significantly less
odorous, which is a great benefit when
spreading[29].
2. Reduction of transfer rate from the surface of slurry
a. pH control
The pH of the slurry can be used to manipulate
the balance between soluble, ionised forms of
odourants and less soluble, volatile forms.
Regulating the pH of slurry to low pH values, pH
≤ 7, can effectively control the emission of
ammonia from slurry. The effect on the transfer
rate of other odourants is ambiguous. At lower
pH values the organic fatty acids will be released
more readily to the atmosphere. Active chemical
control of pH is not a practical tool for odour
control.
b. Covering the surface
i. Natural crusting,
ii. Floating biological covers (straw, fibre),
iii. Floating covers (plastic film, polystyrene
panels or porous stone),
iv. Liquid additives (vegetable oils),
v. Air-filled plastic domes (over sludge storage
lagoons).
3. Reduction of exposed area of slurry, including
storage, soiled surfaces, grids etc
a. Different housing types, which include systems
such as:
i. Green Label pig houses, designed for low
ammonia emissions,
b. Frequent removal of slurry and storage in closed
tanks.
4. Extraction of ventilation air with treatment to reduce
odour concentration
a. bioscrubbers,
b. chemical scrubbers,
c. biofilters.
5. Miscellaneous additives
a. Feed additives,
b. Slurry additives.
The economics of installing the technology to abate
odour emissions must be assessed before this
technology can be imposed on existing pig unit
operations.
9.3 Good operational practice
It is good operational practice to keep the pigs and the
surfaces in and around buildings clean.
Pigs with manure on their skin will have a significantly
increased odour emission, as the body heat of the animal
will accelerate the release of odours significantly.
Every surface covered in manure will be a source of
odour. Reducing the exposed area of manure induces a
direct reduction in odour emissions.
Keeping a clean operation is a matter of combining good
design with good operational practice.
Sources of odour in and around buildings include:
• Wet and manure-covered floors;
• Dirty pigs, with manure on their skin;
• Spilled feed;
Odour Impacts and Odour Emission Control Measures for Intensive Agriculture
59
• Improper storage and disposal of dead pigs;
• Deep underfloor manure storage pits, with long
residence time;
• Dusty surfaces, that can capture and release
odourants;
• Elevated temperatures in manure storage pits and in
pig houses.
9.3.1 Slurry removal
Long storage times and large storage volumes increase
the emissions of odourants. As a general principle, pig
manure must be removed to adequate storage pits or be
subjected to an appropriate treatment, including land
spreading, as quickly as practicable. The current
widespread use of deep tanks under fully slatted pig
houses is not ideal from an odour management
perspective.
9.3.2 Cleanliness
• Ensure that pigs remain clean;
• Clean surfaces and slats regularly;
• Clean pens and storage units regularly, both the floors
and the structure, using adequate means such as high
pressure water washers;
• Remove any stagnant water from surfaces.
9.4 Housing design
9.4.1 Standard housing systems
The majority of existing housing in Ireland is the
traditional fully slatted system. The main source of
emission in these houses is the surface of the underfloor
slurry storage.
9.4.2 Low-emission housing systems
Low-emission housing systems have been developed,
mainly with the objective to reduce ammonia emissions.
Most systems will reduce odour emissions as well as
ammonia emissions, roughly in equal measures. The
main principles for reducing emissions to air from pig
housing are:
1. Limiting the exposed area of stored manure;
2. Frequent removal of manure by a sewage system;
3. Cooling manure, lowering the temperature of stored
manure;
4. Faster discharge of the manure from slats, by using
triangular iron bars, which are easily cleaned;
5. Frequent removal of manure by flushing or scraping.
A variety of systems have been developed, using these
principles. In the Netherlands strong incentives have
been made available to those implementing low
ammonia emission systems. This has resulted in a
relatively widespread application of a number of
systems. These systems are described in detail in a
document[30] that is publicly available on the Internet, at
http://www.infomil.nl/lucht/index.htm:
Hendriks, HJM, van de Weerdhof, AM, Dutch notes on
BAT for pig and poultry intensive livestock farming,
Ministry of Housing, Public Planning and the
Environment and the Ministry of Agriculture, Nature
Management and Fisheries, August1999.
The main characteristics, including extra investment
cost relative to constructing a fully slatted system, and
the suitability to retrofitting existing buildings, have
been summarised in Table 15.
Separate detailed studies for each of these housing
systems are available or will become available under the
so-called Green Label certification system. The detailed
reports include measured emission rates for odours for
each housing type.
Odour Impacts and Odour Emission Control Measures for Intensive Agriculture
60
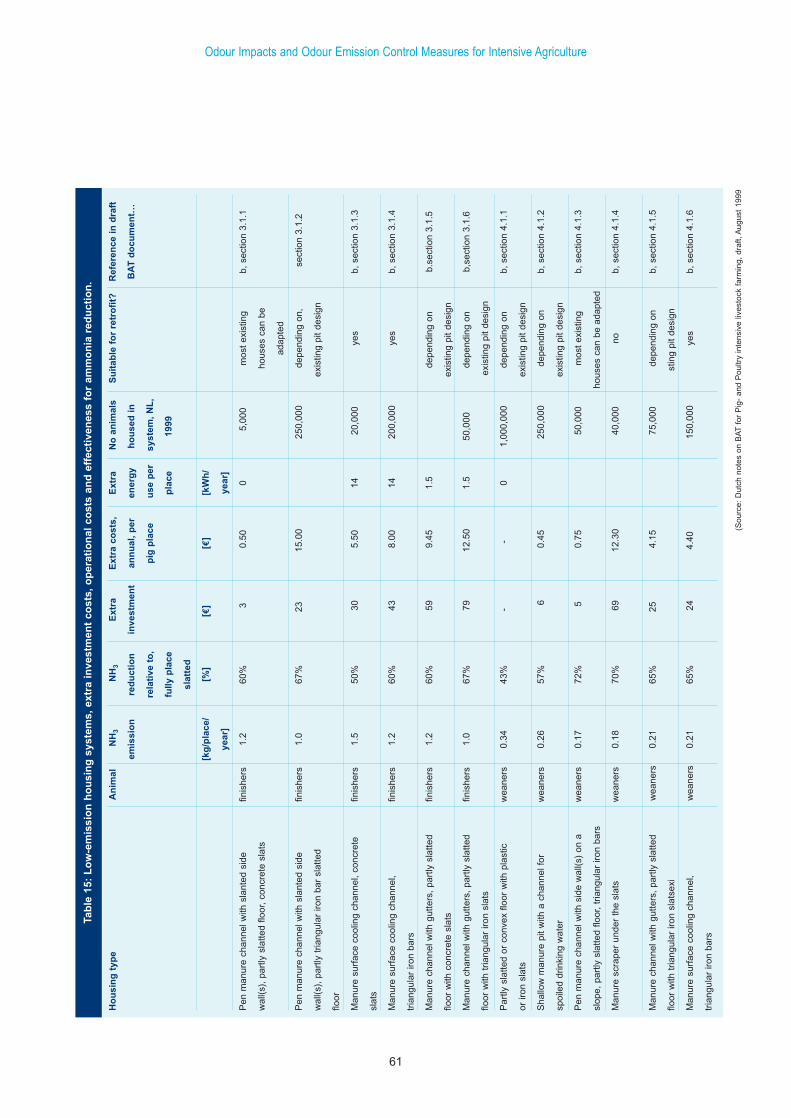
Odour Impacts and Odour Emission Control Measures for Intensive Agriculture
61
Tab
le 1
5: L
ow
-em
issi
on
ho
usi
ng
sys
tem
s, e
xtra
in
vest
men
t co
sts,
op
erat
ion
al c
ost
s an
d e
ffec
tive
nes
s fo
r am
mo
nia
red
uct
ion
.
Ho
usi
ng
typ
e A
nim
alN
H3
NH
3E
xtra
E
xtra
co
sts,
Ext
raN
o a
nim
als
Su
itab
le f
or
retr
ofi
t?
Ref
eren
ce i
n d
raft
emis
sio
n
red
uct
ion
inve
stm
ent
ann
ual
, p
er
ener
gy
ho
use
d i
nB
AT
do
cum
ent…
rela
tive
to
, p
ig p
lace
use
per
syst
em,
NL
,
fully
pla
ce
pla
ce19
99
slat
ted
[kg
/pla
ce/
[%]
[€]
[€]
[kW
h/
year
]ye
ar]
Pen
man
ure
chan
nel w
ith s
lant
ed s
ide
finis
hers
1.2
60%
3 0.
50
05,
000
mos
t ex
istin
gb,
sec
tion
3.1.
1
wal
l(s),
par
tly s
latte
d flo
or,
conc
rete
sla
tsho
uses
can
be
adap
ted
Pen
man
ure
chan
nel w
ith s
lant
ed s
ide
finis
hers
1.0
67%
23
15.0
0 25
0,00
0 de
pend
ing
on,
sect
ion
3.1.
2
wal
l(s),
par
tly t
riang
ular
iron
bar
sla
tted
exis
ting
pit
desi
gn
floor
Man
ure
surf
ace
cool
ing
chan
nel,
conc
rete
fin
ishe
rs1.
550
%30
5.
50
1420
,000
ye
s b,
sec
tion
3.1.
3
slat
s
Man
ure
surf
ace
cool
ing
chan
nel,
finis
hers
1.2
60%
43
8.00
14
200,
000
yes
b, s
ectio
n 3.
1.4
tria
ngul
ar ir
on b
ars
Man
ure
chan
nel w
ith g
utte
rs,
part
ly s
latte
d fin
ishe
rs1.
260
%59
9.
45
1.5
depe
ndin
g on
b.
sect
ion
3.1.
5
floor
with
con
cret
e sl
ats
exis
ting
pit
desi
gn
Man
ure
chan
nel w
ith g
utte
rs,
part
ly s
latte
d fin
ishe
rs1.
067
%79
12
.50
1.5
50,0
00
depe
ndin
g on
b,
sect
ion
3.1.
6
floor
with
tria
ngul
ar ir
on s
lats
exis
ting
pit
desi
gn
Par
tly s
latte
d or
con
vex
floor
with
pla
stic
wea
ners
0.34
43%
- -
01,
000,
000
depe
ndin
g on
b, s
ectio
n 4.
1.1
or ir
on s
lats
exis
ting
pit
desi
gn
Sha
llow
man
ure
pit
with
a c
hann
el f
orw
eane
rs0.
2657
%6
0.45
25
0,00
0 de
pend
ing
on
b, s
ectio
n 4.
1.2
spoi
led
drin
king
wat
erex
istin
g pi
t de
sign
Pen
man
ure
chan
nel w
ith s
ide
wal
l(s)
on a
wea
ners
0.17
72%
5 0.
75
50,0
00
mos
t ex
istin
g
b, s
ectio
n 4.
1.3
slop
e, p
artly
sla
tted
floor
, tr
iang
ular
iron
bar
sho
uses
can
be
adap
ted
Man
ure
scra
per
unde
r th
e sl
ats
wea
ners
0.18
70%
69
12.3
0 40
,000
no
b,
sec
tion
4.1.
4
Man
ure
chan
nel w
ith g
utte
rs,
part
ly s
latte
dw
eane
rs0.
2165
%25
4.
15
75,0
00
depe
ndin
g on
b,
sec
tion
4.1.
5
floor
with
tria
ngul
ar ir
on s
lats
exi
stin
g pi
t de
sign
Man
ure
surf
ace
cool
ing
chan
nel,
wea
ners
0.21
65%
24
4.40
15
0,00
0 ye
s b,
sec
tion
4.1.
6
tria
ngul
ar ir
on b
ars
(Sou
rce:
Dut
ch n
otes
on
BA
Tfo
r P
ig-
and
Pou
ltry
inte
nsiv
e liv
esto
ck f
arm
ing,
dra
ft, A
ugus
t 19
99
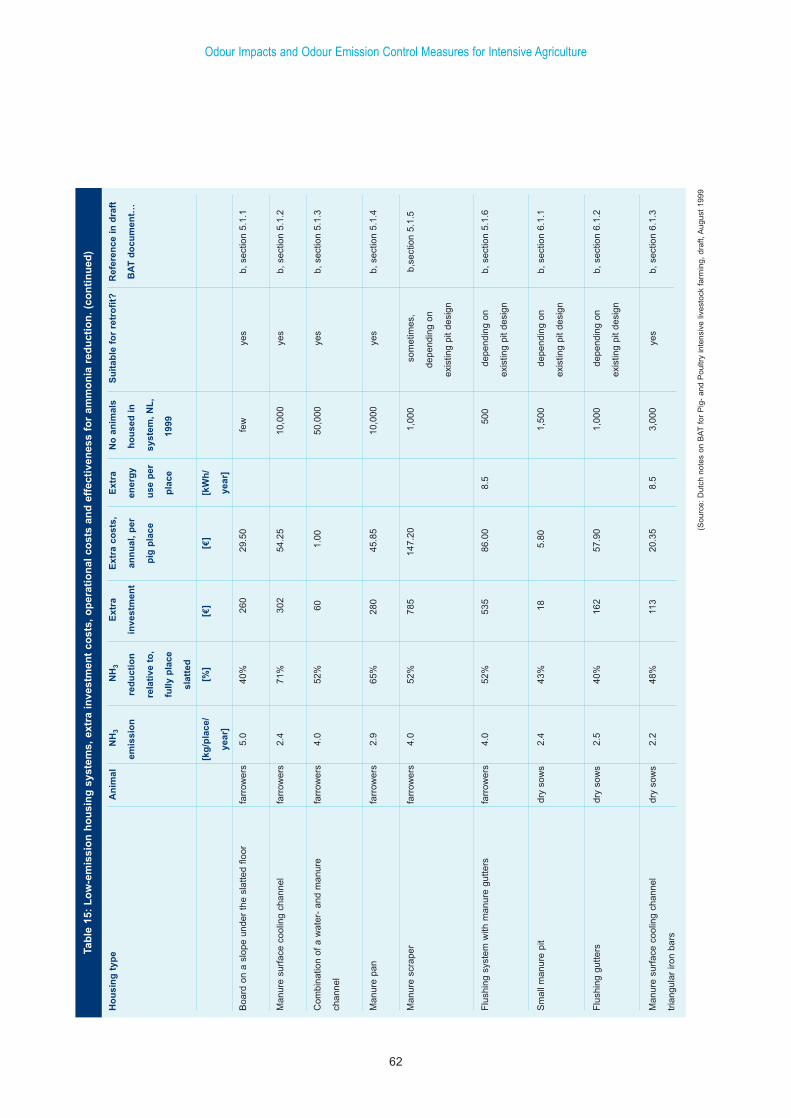
Odour Impacts and Odour Emission Control Measures for Intensive Agriculture
62
Tab
le 1
5: L
ow
-em
issi
on
ho
usi
ng
sys
tem
s, e
xtra
in
vest
men
t co
sts,
op
erat
ion
al c
ost
s an
d e
ffec
tive
nes
s fo
r am
mo
nia
red
uct
ion
. (c
on
tin
ued
)
Ho
usi
ng
typ
e A
nim
alN
H3
NH
3E
xtra
E
xtra
co
sts,
Ext
raN
o a
nim
als
Su
itab
le f
or
retr
ofi
t?
Ref
eren
ce i
n d
raft
emis
sio
n
red
uct
ion
inve
stm
ent
ann
ual
, p
er
ener
gy
ho
use
d i
nB
AT
do
cum
ent…
rela
tive
to
, p
ig p
lace
use
per
syst
em,
NL
,
fully
pla
ce
pla
ce19
99
slat
ted
[kg
/pla
ce/
[%]
[€]
[€]
[kW
h/
year
]ye
ar]
Boa
rd o
n a
slop
e un
der
the
slat
ted
floor
farr
ower
s5.
040
%26
0 29
.50
few
ye
s b,
sec
tion
5.1.
1
Man
ure
surf
ace
cool
ing
chan
nel
farr
ower
s2.
471
%30
2 54
.25
10,0
00
yes
b, s
ectio
n 5.
1.2
Com
bina
tion
of a
wat
er-
and
man
ure
farr
ower
s4.
052
%60
1.
00
50,0
00
yes
b, s
ectio
n 5.
1.3
chan
nel
Man
ure
pan
farr
ower
s2.
965
%28
0 45
.85
10,0
00
yes
b, s
ectio
n 5.
1.4
Man
ure
scra
per
farr
ower
s4.
052
%78
5 14
7.20
1,
000
som
etim
es,
b,se
ctio
n 5.
1.5
depe
ndin
g on
exis
ting
pit
desi
gn
Flu
shin
g sy
stem
with
man
ure
gutte
rsfa
rrow
ers
4.0
52%
535
86.0
0 8.
550
0 de
pend
ing
on
b, s
ectio
n 5.
1.6
exis
ting
pit
desi
gn
Sm
all m
anur
e pi
tdr
y so
ws
2.4
43%
18
5.80
1,
500
depe
ndin
g on
b,
sec
tion
6.1.
1
exis
ting
pit
desi
gn
Flu
shin
g gu
tters
dry
sow
s2.
540
%16
2 57
.90
1,00
0 de
pend
ing
on
b, s
ectio
n 6.
1.2
exis
ting
pit
desi
gn
Man
ure
surf
ace
cool
ing
chan
nel
dry
sow
s2.
248
%11
3 20
.35
8.5
3,00
0 ye
s b,
sec
tion
6.1.
3
tria
ngul
ar ir
on b
ars
(Sou
rce:
Dut
ch n
otes
on
BA
Tfo
r P
ig-
and
Pou
ltry
inte
nsiv
e liv
esto
ck f
arm
ing,
dra
ft, A
ugus
t 19
99
9.5 Optimisation of ventilation and atmospheric dilution
9.5.1 Ventilation in livestock housing
The ventilation rate in a pig production unit is
determined by the needs of the animals. Adequate
ventilation is vital, to perform the following functions:
• Regulate temperature
Pigs produce a significant quantity of energy, in the
form of heat. The excess heat is removed from the pig
houses with the ventilation air, so that the temperature
remains within the optimum temperature range,
which varies for different stages of the pig life cycle.
Too high temperatures cause growth rates to slow
down, while low temperatures increase the risk of
disease and cause a lower feed conversion efficiency.
• Remove excess carbon dioxide (and ammonia etc.)
Due to the high density of biomass in pig houses,
ventilation needs to be carefully regulated to remove
the CO2 produced by the respiration of the animals.
CO2 levels are kept below 3%.
Because of the importance of ventilation rates for pig
welfare and productivity, ventilation rates cannot be
easily modified.
Ventilation rates vary with the seasons. In summer, the
main determining factor is temperature control, while in
winter the CO2 concentration may become the main
determining parameter for the ventilation rate.
The ventilation rates in spring, summer and autumn are
the most relevant for the odour impact, as these are the
seasons where exposure in the vicinity of the facility is
most likely to cause annoyance. As odour annoyance is
most likely to occur in summer, when residents are
outside, or have windows open, the exit velocity based
on summer ventilation rates are arguably the most
relevant to use in modelling. For establishing the worst
case, winter ventilation rates should be used to establish
input for dispersion modelling. Some models would
accommodate inputting different sets of sources for each
season, or even per month, which is the most accurate
approach.
9.5.2 Optimisation of atmospheric dilution
9.5.2.1 Increase of emission height
Increasing the height at which the odorous emissions are
released into the atmosphere can be a relatively
economic and effective method to reduce the impact.
For a mechanically ventilated pig house with a number
of ventilators, raising the emission point to 4 or 5 metre
above the roof will limit the ‘building wake effect’ and
hence enhance dilution downwind. This is especially
noticeable at relatively short distances from the source
(up to 300 m). To optimise dispersion of odours in the
atmosphere, apex ventilators, especially those with
appropriate ducting aimed at lifting the emission point
above the roof, are preferable over side wall ventilators
More significant benefits can be obtained when the
ventilation flow is ducted to a central stack. By
increasing the stack height to between 10 m and 25 m, a
marked benefit is achieved in terms of downwind
dilution. The extent of this beneficial effect should be
determined for each situation on the basis of dispersion
modelling. The point of maximum concentration at
ground level will move away from the source when
raising the height of the emission point, which is
generally a benefit, but in some cases may cause an
increase of exposure for specific receptors.
In Figure 8 the effect of raising the emission height is
illustrated, for a typical emission for an integrated sow
unit of 670 sows, with:
• Natural ventilation or ventilation at roof level (4m);
• Mechanical ventilation, exit velocity 5 m/s, at 4 m
above roof level (8m);
• Mechanical ventilation, emission through stack at 15
m, exit velocity 5 m/s;
• Mechanical ventilation, emission through stack at 15
m, exit velocity 15 m/s.
9.5.2.2 Increase of emission velocity
Optimising the vertical velocity of the emission helps
‘plume rise’ to occur due to the momentum of the
Odour Impacts and Odour Emission Control Measures for Intensive Agriculture
63
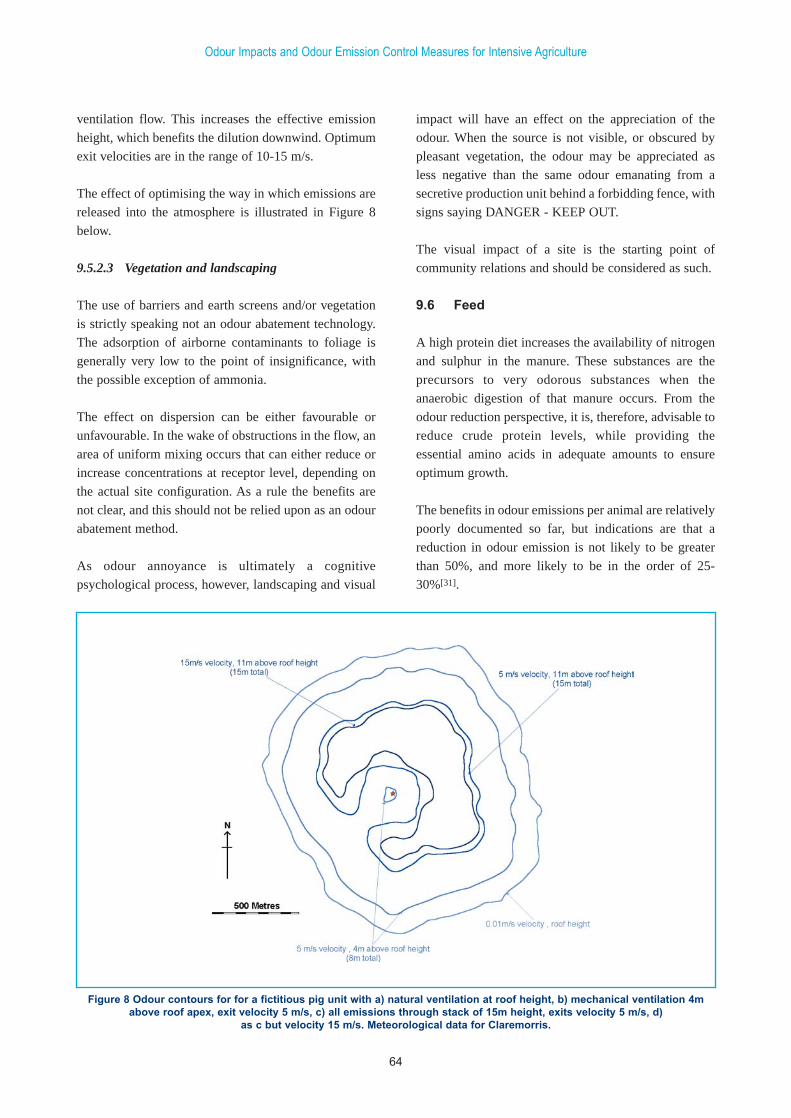
ventilation flow. This increases the effective emission
height, which benefits the dilution downwind. Optimum
exit velocities are in the range of 10-15 m/s.
The effect of optimising the way in which emissions are
released into the atmosphere is illustrated in Figure 8
below.
9.5.2.3 Vegetation and landscaping
The use of barriers and earth screens and/or vegetation
is strictly speaking not an odour abatement technology.
The adsorption of airborne contaminants to foliage is
generally very low to the point of insignificance, with
the possible exception of ammonia.
The effect on dispersion can be either favourable or
unfavourable. In the wake of obstructions in the flow, an
area of uniform mixing occurs that can either reduce or
increase concentrations at receptor level, depending on
the actual site configuration. As a rule the benefits are
not clear, and this should not be relied upon as an odour
abatement method.
As odour annoyance is ultimately a cognitive
psychological process, however, landscaping and visual
impact will have an effect on the appreciation of the
odour. When the source is not visible, or obscured by
pleasant vegetation, the odour may be appreciated as
less negative than the same odour emanating from a
secretive production unit behind a forbidding fence, with
signs saying DANGER - KEEP OUT.
The visual impact of a site is the starting point of
community relations and should be considered as such.
9.6 Feed
A high protein diet increases the availability of nitrogen
and sulphur in the manure. These substances are the
precursors to very odorous substances when the
anaerobic digestion of that manure occurs. From the
odour reduction perspective, it is, therefore, advisable to
reduce crude protein levels, while providing the
essential amino acids in adequate amounts to ensure
optimum growth.
The benefits in odour emissions per animal are relatively
poorly documented so far, but indications are that a
reduction in odour emission is not likely to be greater
than 50%, and more likely to be in the order of 25-
30%[31].
Odour Impacts and Odour Emission Control Measures for Intensive Agriculture
64
Figure 8 Odour contours for for a fictitious pig unit with a) natural ventilation at roof height, b) mechanical ventilation 4mabove roof apex, exit velocity 5 m/s, c) all emissions through stack of 15m height, exits velocity 5 m/s, d)
as c but velocity 15 m/s. Meteorological data for Claremorris.
9.7 Additives
9.7.1 Feed additives
Many feed additives have been introduced to the market
in recent years, and a number of producers claim
benefits in terms of reduced emissions of odourants as a
result.
Additives include:
1. Fats and oils. By reducing feed dust generation, the
release of dust-bound odourants can be reduced.
2. Absorbing additives, e.g. calcium bentonite, zeolite
and activated charcoal. These substances are added
with the objective to absorb odourants to counteract
their release from the manure.
3. Plant extracts. A natural extract from the yucca plant,
sarsaponin, has been reported to reduce ammonia
emissions. No significant effect on odourant releases
has been confirmed, however.
4. Enzymes.
5. Microbial formulae.
9.7.2 Slurry additives
Slurry additives are available in a wide variety of
products. The main generic types are reviewed in the
following sections.
9.7.3 Odour counteractants and masking agents
Masking agents and counteractants are gas phase
treatment methods, in which an odour treatment agent is
mixed directly with the foul airflow, usually by
atomising a liquid using sprays. This may be done in
ducts but also after release of the odourants into the
atmosphere, using open-air sprays.
• Masking agents are odourants with a relatively
pleasant odour, that are used to mix with the foul air
to produce a more acceptable mixed odour or even
‘drown out’ or overpower the foul odour with the
masking odour. The resultant odour is inherently
more intense than the original odour, but arguably the
character of the odour becomes less offensive.
• Counteractants are agents that interfere with
odourant molecules with the aim of reducing the
odour intensity of the mixture, as well as making the
character of the odour more acceptable. The
underlying process is not specified, but a form of
encapsulation on a molecular level is implied.
Masking agents may have a public relations benefit in
the short-term, communicating that some short-term
action has been undertaken in acute conflict situations.
In the long-term they may be counterproductive,
however, as the masking odour becomes associated with
the cause of the annoyance. As the intensity of the
masking odour is higher than that of the original odour,
it will increase the magnitude of the problem, rather than
reduce it.
Masking agents and counteractants are used fairly
frequently to provide immediate relief.
There is a lack of quantitative data to quantify potential
benefits of these techniques. A 1993 study for
wastewater treatment odour abatement by the Water
Research Centre in the UK did not demonstrate a
significant difference between the effectiveness of a
counteractant and water in reducing odours. Most
performance evaluations are anecdotal.
9.8 Extraction and treatment of ventilation air
Once the air can be ducted to a central point for
treatment there are a number of options for reducing the
odour concentration in the exhaust air. A number of
options have been listed here:
• Chemical scrubbing;
• Biological scrubbing;
• Biofiltration, potentially combined with pre-
treatment for H2S using a catalytic iron filter;
• Biofiltration on fixed medium substrate covered with
a biofilm, such as a lava-rock filter.
These techniques all have the potential to reduce the
odour concentration in the ventilation air significantly,
Odour Impacts and Odour Emission Control Measures for Intensive Agriculture
65
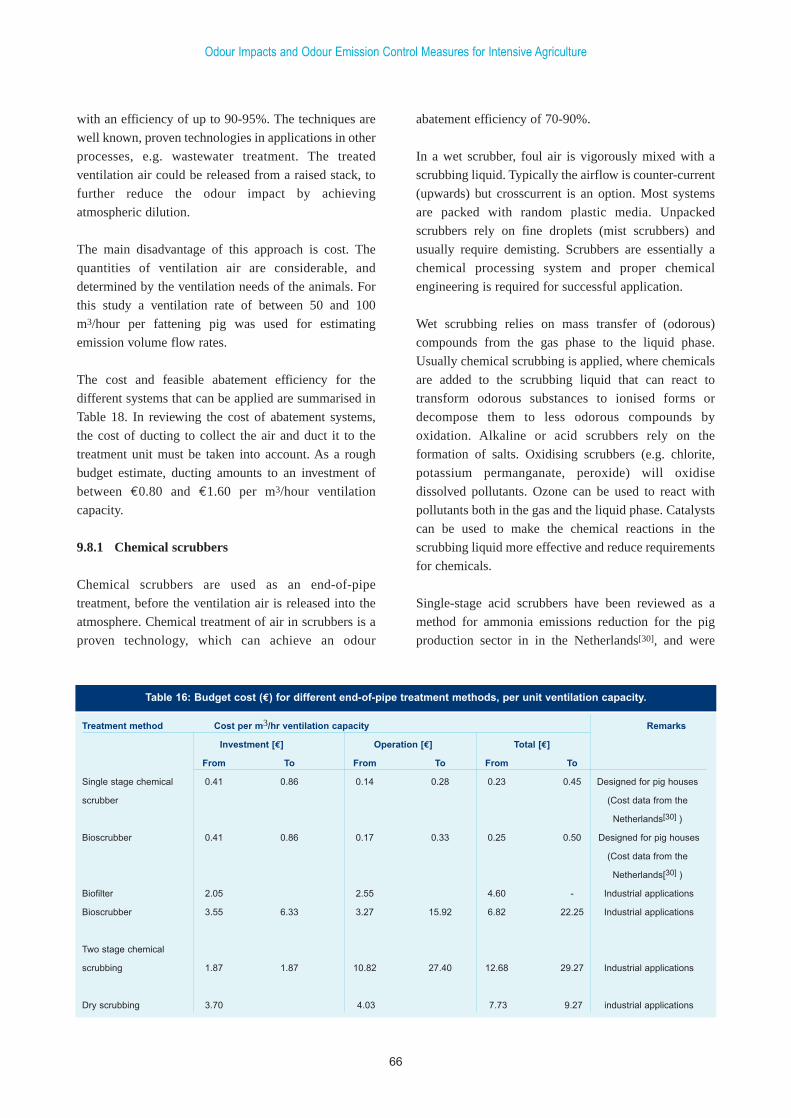
with an efficiency of up to 90-95%. The techniques are
well known, proven technologies in applications in other
processes, e.g. wastewater treatment. The treated
ventilation air could be released from a raised stack, to
further reduce the odour impact by achieving
atmospheric dilution.
The main disadvantage of this approach is cost. The
quantities of ventilation air are considerable, and
determined by the ventilation needs of the animals. For
this study a ventilation rate of between 50 and 100
m3/hour per fattening pig was used for estimating
emission volume flow rates.
The cost and feasible abatement efficiency for the
different systems that can be applied are summarised in
Table 18. In reviewing the cost of abatement systems,
the cost of ducting to collect the air and duct it to the
treatment unit must be taken into account. As a rough
budget estimate, ducting amounts to an investment of
between €0.80 and €1.60 per m3/hour ventilation
capacity.
9.8.1 Chemical scrubbers
Chemical scrubbers are used as an end-of-pipe
treatment, before the ventilation air is released into the
atmosphere. Chemical treatment of air in scrubbers is a
proven technology, which can achieve an odour
abatement efficiency of 70-90%.
In a wet scrubber, foul air is vigorously mixed with a
scrubbing liquid. Typically the airflow is counter-current
(upwards) but crosscurrent is an option. Most systems
are packed with random plastic media. Unpacked
scrubbers rely on fine droplets (mist scrubbers) and
usually require demisting. Scrubbers are essentially a
chemical processing system and proper chemical
engineering is required for successful application.
Wet scrubbing relies on mass transfer of (odorous)
compounds from the gas phase to the liquid phase.
Usually chemical scrubbing is applied, where chemicals
are added to the scrubbing liquid that can react to
transform odorous substances to ionised forms or
decompose them to less odorous compounds by
oxidation. Alkaline or acid scrubbers rely on the
formation of salts. Oxidising scrubbers (e.g. chlorite,
potassium permanganate, peroxide) will oxidise
dissolved pollutants. Ozone can be used to react with
pollutants both in the gas and the liquid phase. Catalysts
can be used to make the chemical reactions in the
scrubbing liquid more effective and reduce requirements
for chemicals.
Single-stage acid scrubbers have been reviewed as a
method for ammonia emissions reduction for the pig
production sector in in the Netherlands[30], and were
Odour Impacts and Odour Emission Control Measures for Intensive Agriculture
66
Treatment method Cost per m3/hr ventilation capacity Remarks
Investment [€] Operation [€] Total [€]
From To From To From To
Single stage chemical 0.41 0.86 0.14 0.28 0.23 0.45 Designed for pig houses
scrubber (Cost data from the
Netherlands[30] )
Bioscrubber 0.41 0.86 0.17 0.33 0.25 0.50 Designed for pig houses
(Cost data from the
Netherlands[30] )
Biofilter 2.05 2.55 4.60 - Industrial applications
Bioscrubber 3.55 6.33 3.27 15.92 6.82 22.25 Industrial applications
Two stage chemical
scrubbing 1.87 1.87 10.82 27.40 12.68 29.27 Industrial applications
Dry scrubbing 3.70 4.03 7.73 9.27 industrial applications
Table 16: Budget cost (€) for different end-of-pipe treatment methods, per unit ventilation capacity.
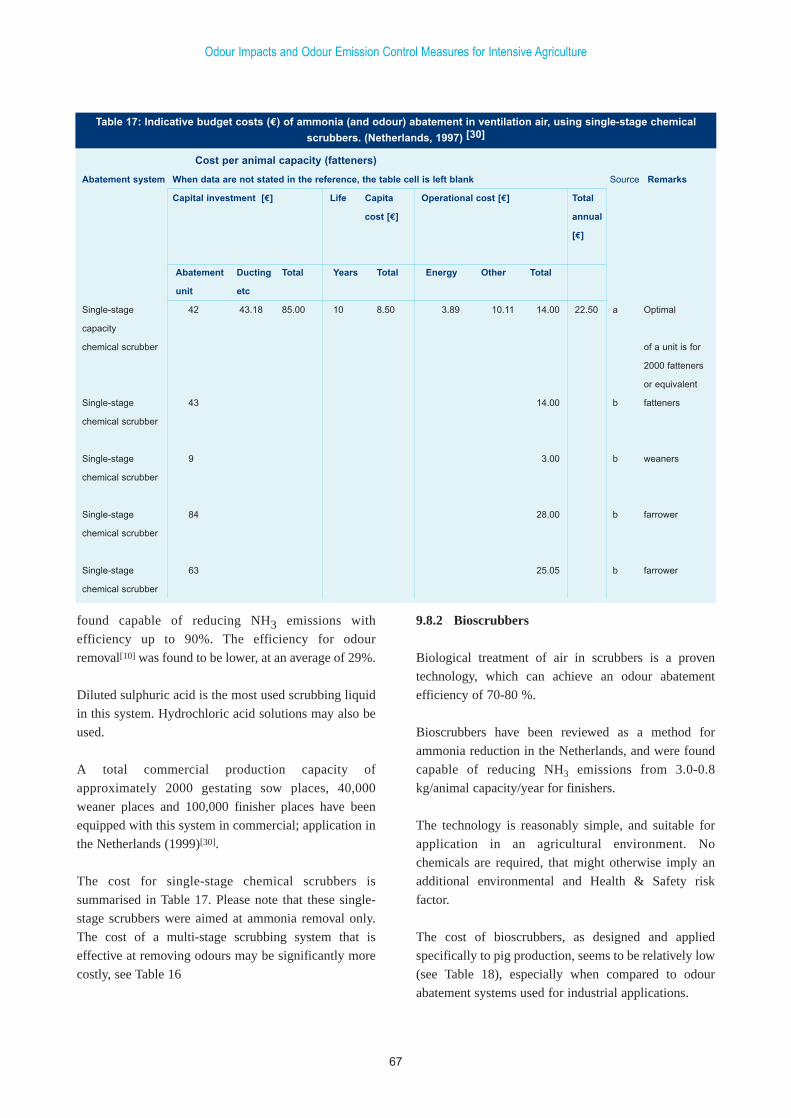
found capable of reducing NH3 emissions with
efficiency up to 90%. The efficiency for odour
removal[10] was found to be lower, at an average of 29%.
Diluted sulphuric acid is the most used scrubbing liquid
in this system. Hydrochloric acid solutions may also be
used.
A total commercial production capacity of
approximately 2000 gestating sow places, 40,000
weaner places and 100,000 finisher places have been
equipped with this system in commercial; application in
the Netherlands (1999)[30].
The cost for single-stage chemical scrubbers is
summarised in Table 17. Please note that these single-
stage scrubbers were aimed at ammonia removal only.
The cost of a multi-stage scrubbing system that is
effective at removing odours may be significantly more
costly, see Table 16
9.8.2 Bioscrubbers
Biological treatment of air in scrubbers is a proven
technology, which can achieve an odour abatement
efficiency of 70-80 %.
Bioscrubbers have been reviewed as a method for
ammonia reduction in the Netherlands, and were found
capable of reducing NH3 emissions from 3.0-0.8
kg/animal capacity/year for finishers.
The technology is reasonably simple, and suitable for
application in an agricultural environment. No
chemicals are required, that might otherwise imply an
additional environmental and Health & Safety risk
factor.
The cost of bioscrubbers, as designed and applied
specifically to pig production, seems to be relatively low
(see Table 18), especially when compared to odour
abatement systems used for industrial applications.
Odour Impacts and Odour Emission Control Measures for Intensive Agriculture
67
Cost per animal capacity (fatteners)
Abatement system When data are not stated in the reference, the table cell is left blank Source Remarks
Capital investment [€] Life Capita Operational cost [€] Total
cost [€] annual
[€]
Abatement Ducting Total Years Total Energy Other Total
unit etc
Single-stage 42 43.18 85.00 10 8.50 3.89 10.11 14.00 22.50 a Optimal
capacity
chemical scrubber of a unit is for
2000 fatteners
or equivalent
Single-stage 43 14.00 b fatteners
chemical scrubber
Single-stage 9 3.00 b weaners
chemical scrubber
Single-stage 84 28.00 b farrower
chemical scrubber
Single-stage 63 25.05 b farrower
chemical scrubber
Table 17: Indicative budget costs (€) of ammonia (and odour) abatement in ventilation air, using single-stage chemical
scrubbers. (Netherlands, 1997) [30]
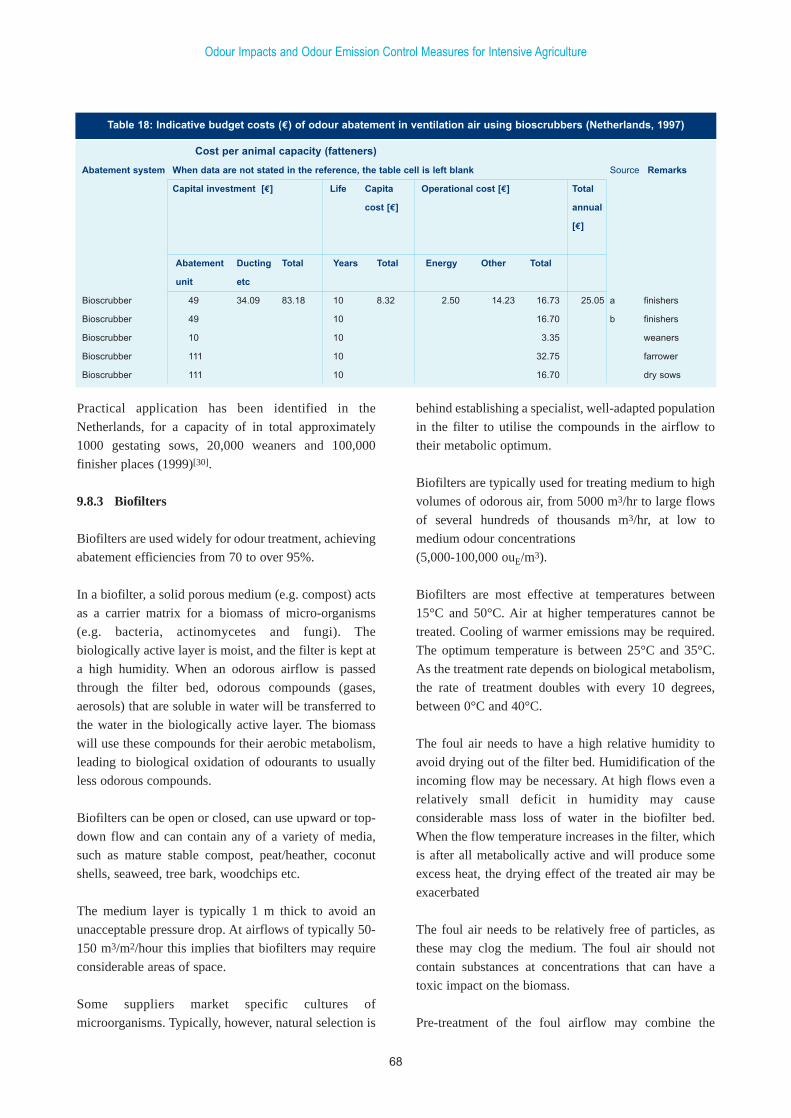
Practical application has been identified in the
Netherlands, for a capacity of in total approximately
1000 gestating sows, 20,000 weaners and 100,000
finisher places (1999)[30].
9.8.3 Biofilters
Biofilters are used widely for odour treatment, achieving
abatement efficiencies from 70 to over 95%.
In a biofilter, a solid porous medium (e.g. compost) acts
as a carrier matrix for a biomass of micro-organisms
(e.g. bacteria, actinomycetes and fungi). The
biologically active layer is moist, and the filter is kept at
a high humidity. When an odorous airflow is passed
through the filter bed, odorous compounds (gases,
aerosols) that are soluble in water will be transferred to
the water in the biologically active layer. The biomass
will use these compounds for their aerobic metabolism,
leading to biological oxidation of odourants to usually
less odorous compounds.
Biofilters can be open or closed, can use upward or top-
down flow and can contain any of a variety of media,
such as mature stable compost, peat/heather, coconut
shells, seaweed, tree bark, woodchips etc.
The medium layer is typically 1 m thick to avoid an
unacceptable pressure drop. At airflows of typically 50-
150 m3/m2/hour this implies that biofilters may require
considerable areas of space.
Some suppliers market specific cultures of
microorganisms. Typically, however, natural selection is
behind establishing a specialist, well-adapted population
in the filter to utilise the compounds in the airflow to
their metabolic optimum.
Biofilters are typically used for treating medium to high
volumes of odorous air, from 5000 m3/hr to large flows
of several hundreds of thousands m3/hr, at low to
medium odour concentrations
(5,000-100,000 ouE/m3).
Biofilters are most effective at temperatures between
15°C and 50°C. Air at higher temperatures cannot be
treated. Cooling of warmer emissions may be required.
The optimum temperature is between 25°C and 35°C.
As the treatment rate depends on biological metabolism,
the rate of treatment doubles with every 10 degrees,
between 0°C and 40°C.
The foul air needs to have a high relative humidity to
avoid drying out of the filter bed. Humidification of the
incoming flow may be necessary. At high flows even a
relatively small deficit in humidity may cause
considerable mass loss of water in the biofilter bed.
When the flow temperature increases in the filter, which
is after all metabolically active and will produce some
excess heat, the drying effect of the treated air may be
exacerbated
The foul air needs to be relatively free of particles, as
these may clog the medium. The foul air should not
contain substances at concentrations that can have a
toxic impact on the biomass.
Pre-treatment of the foul airflow may combine the
Odour Impacts and Odour Emission Control Measures for Intensive Agriculture
68
Cost per animal capacity (fatteners)
Abatement system When data are not stated in the reference, the table cell is left blank Source Remarks
Capital investment [€] Life Capita Operational cost [€] Total
cost [€] annual
[€]
Abatement Ducting Total Years Total Energy Other Total
unit etc
Bioscrubber 49 34.09 83.18 10 8.32 2.50 14.23 16.73 25.05 a finishers
Bioscrubber 49 10 16.70 b finishers
Bioscrubber 10 10 3.35 weaners
Bioscrubber 111 10 32.75 farrower
Bioscrubber 111 10 16.70 dry sows
Table 18: Indicative budget costs (€) of odour abatement in ventilation air using bioscrubbers (Netherlands, 1997)

removal of particles and the cooling and humidification
of the flow before entering the biological treatment,
using counter flow sprays.
The design of the humidification or irrigation system of
the filter is crucial to its effective use. Irrigation can have
multiple functions:
• Moisture control
The primary function of irrigation is to keep the
moisture content of the filter at the required level. The
optimum moisture content may vary for different
media.
• Removal of metabolic products and pH control
In beds with, for example, a high H2S loading, the pH
in the filter tends to come down to very low values.
The effectiveness of the filter is reduced, as a result.
The optimum pH is between pH=6 and pH=8.
Irrigation can help to remove acids to the drain. Some
materials are more suitable to be irrigated in this
manner (e.g. tree bark is suitable, while peat will tend
to become soggy and lose its structure).
• Nutrient supply
If the loading of the filter is very low additional
nutrients may be required to maintain sufficient
biomass. Surface water can be considered for this
purpose.
Irrigation is best provided by an array of nozzles, with
an even distribution over the surface of the bed. Dry
patches should be avoided, as these may cause
irreversible loss of effectiveness locally.
Biofilters typically have a distinctive residual odour,
which will not be far below 100-300 ouE/m3. However,
this residual odour will in most cases resemble the odour
of the soil, which is an earthy odour generally not
recognised as annoying, as its character resembles that
of odours naturally emitted from soil.
9.8.4 Ozone treatment of ventilation air
Treatment of air using ozone is applied in feed
production as an end-of-pipe odour treatment method.
Practical application in pig production is rare.
Ozone is a highly reactive oxidising gas that can break
down odourants to less odorous oxidised forms.
The working principle is that odourants in the foul air
are mixed with air containing the treatment agent. In the
case of UV treatment, ultraviolet radiation is used to
ionise the oxygen in the foul air itself. The radicals that
are formed, including ozone (O3) will react with the
odourants, oxidising these to less odorous compounds.
The process depends mainly on turbulence (mixing),
oxidant concentration and residence time. Residence
time in the mixing chamber should be at least > 1
second, preferably as long as several seconds.
UV systems seem to be more effective when used to
break down odourants with small molecular weight,
such as H2S, but less effective on larger molecules.
Although manufacturers claim that the technology is
suitable for large volume flows, residence time in the
mixing chamber is difficult to maintain at the required
length of one or more seconds.
Performance is claimed to be >90% for H2S. It is known
that efficiency is reduced for odourants with increasing
molecular mass. Little information is available for such
odourants, but indicative data would point to abatement
efficiencies around 50%.
• Strengths
- Low capital cost;
- Suitable for on/off operation.
• Weaknesses
- Odour abatement efficiency for odourants with
higher molecular mass remains questionable.
9.9 Slurry storage
Slurry storage can be a highly significant source in terms
of odour annoyance potential. Under anaerobic
conditions, high concentrations of odourants can be
formed in slurry, which can be released in highly
concentrated ‘puffs’ when slurry is being handled.
Turbulence, resulting from ‘stirring’ and pumping, can
increase the emissions from the surface by an order of
magnitude (factor 10) compared to a still surface.
On the other hand, natural crust formation can reduce
the emissions from the surface significantly.
Odour Impacts and Odour Emission Control Measures for Intensive Agriculture
69

In assessing the relevance of slurry storage for odour
annoyance potential it helps to realise that odour
concentrations over slurry, or in headspaces, can reach
tens or even hundreds of thousands of ouE/m3, whereas
the odour concentration in pig house ventilation air
rarely exceeds 5,000 ouE/m3. Small volumes of very
strong odours can, under unfavourable circumstances,
travel quite far and cause a strong odour intensity to be
perceived by persons downwind. As this perception can
be of high intensity, this can trigger annoyance and
exacerbate nuisance.
It is therefore a significant area of interest to assess
slurry storage and handling for transport as an area of
opportunity for minimising odour impacts.
9.9.1 Odour emission reduction in open slurry storage
In many cases, slurry is stored in open tanks. In Ireland,
storage underneath the fully slatted floors is common.
Extra storage in the open air is becoming more of an
issue lately. This is typically achieved in open to tanks or
lagoons, built from foil, glass coated metal or concrete.
To reduce emissions from open, uncovered tanks, the
following factors and approaches are relevant:
• Reduce the surface area to volume ratio (deeper
tanks, rather than a larger area);
• Minimise turbulence, by careful design of tubing. All
filling should occur under the liquid surface to avoid
turbulence;
• If possible, formation of a natural crust should be
encouraged;
• Treatment of sludge by mechanical separation or
digestion or aeration can drastically reduce content of
odourants, and hence the odour emission;
• Temporary cover such as straw, in a 10-20 cm layer,
has been suggested as an effective method for
reducing emissions from the surface;
• Reduce area of liquid exposed to air, using temporary
or floating covers (e.g. polystyrene floating panels).
These can reduce emissions significantly. Ammonia
emission reductions of 70-80% have been reported.
9.9.2 Enclosed slurry storage
There are a number of options for enclosed slurry
storage. This has a direct advantage in stopping almost
all emissions to atmosphere. In rigid tanks, however,
great care should be taken that highly odorous air from
the headspace is not released in a ‘puff’ when loading or
unloading. The headspace from tanker and tank can be
attached, to form a closed system, or some form of
odour control can be used. Enclosed tanks inherently
form a potential Health & Safety risk, when incidental
access is required, as they are likely to contain lethal
concentrations of gases like H2S.
Flexible solutions are becoming more popular, using
methods of cover that avoid creation of headspace. An
example of a covered storage without headspace are foil
basins in an earth enclosure, with a floating foil cover.
Floats support the cover, and an extraction system for
escaping digestion gas is provided in the design. They
are made out of reinforced plastic (PVC) foil of 1 mm
thick (see Figure 9). Stirring of the slurry is achieved
through pumping slurry through a specially designed
fixed tubing system. These fully enclosed foil basins
have an economic lifespan of at least ten years.
Hundreds if not thousands of these systems have been
installed in the Netherlands, at commercial pig units. No
precise cost data are available, but the supplier indicates
that the investment cost is close to half the cost of a
concrete storage tank of the same capacity. The foil liner
will be viable for an economic life of 10-14 years.
A relatively new approach is the use of large ‘slurry
cushions’, derived from military storage systems for fuel
and water.
Existing open top tanks can be covered by add-on
covers, typically made out of glass reinforced plastics.
From Canada the use of inflatable domes has been
reported, although few details are available as to the
practical application of such systems.
Odour Impacts and Odour Emission Control Measures for Intensive Agriculture
70
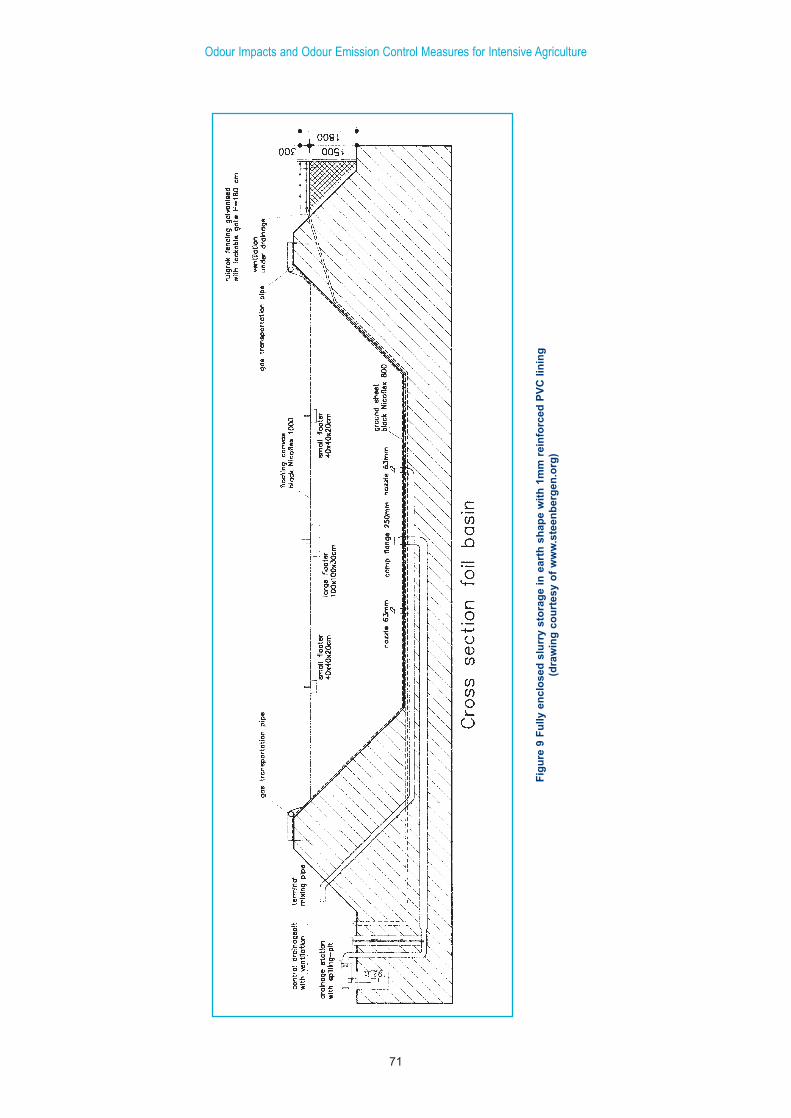
Odour Impacts and Odour Emission Control Measures for Intensive Agriculture
71
Fig
ure
9 F
ully
en
clo
sed
slu
rry
sto
rag
e in
ear
th s
hap
e w
ith
1m
m r
ein
forc
ed P
VC
lin
ing
(dra
win
g c
ou
rtes
y o
f w
ww
.ste
enb
erg
en.o
rg)
Odour Impacts and Odour Emission Control Measures for Intensive Agriculture
72
9.9.3 Operational aspects of slurry storage
The following operational practices can be applied to
reduce odour emissions from slurry storage:
• When the storage is not in use, clean the surfaces
carefully. Even a few inches of anaerobic sludge at
the bottom can be a significant source of odour
emission;
• Avoid turbulence and splashing, as these can cause
emissions from the surface to be increased by an
order of magnitude;
• Always use pipes and tubes that extend to below the
liquid surface when filling;
• Promote and preserve natural crust formation;
• Keep storage periods as brief as possible;
• Choose your moment for any sludge handling
operation, so that the wind direction is favourable,
winds moderate to high and the atmosphere turbulent.
In the course of this project two case studies were
conducted for pig units in the Irish context. The case
studies included odour emission measurements. For
both locations dispersion modelling was used to assess
the odour impact. Abatement options were considered to
reduce the impact.
The case studies were conducted at two sites, and the
characteristics are summarised below:
• A large integrated pig unit, with approximately 1000
sows in fully slatted pig houses;
• A medium sized integrated pig unit, with
approximately 590 sows in fully slatted pig houses;
The case studies for the two sites listed above are
reported in Part B of this report, titled: Case studies
assessing the odour emissions and impact of two pig
production units in the Irish Situation The
measurements of odour emissions carried out at these
two sites are also included in Part B.
For full details of the case studies, including a detailed
report on odour emission measurements, please refer to
Part B of this report, that is structured as a complete
document. The essence of this report is provided below
in an executive summary.
10.1 Executive summary Part B: Case studies assessing the odour emissions and impact of two pig production units in the Irish Situation
The Environmental Protection Agency has initiated a
study into Odour Impacts and Odour Emission Control
Measures for Intensive Agriculture, with the objective to
assist the Agency in formulating its approach for
processing the license applications with a view to
achieving transparent and uniform decision-making.
In the course of this project, three case studies were
conducted to assess the odour impact of pig production
units in the Irish context. At two of these locations odour
emission measurements were conducted. For all three
cases dispersion modelling was used to assess the odour
impact. Abatement options were considered to reduce
the impact.
The objectives of these case studies were:
• To illustrate the approach as outlined the main
Agency study Odour Impacts and Odour Emission
Control Measures for Intensive Agriculture;
• To obtain a limited set of emission measurements for
Irish conditions, to assess whether these are
significantly different from the distribution of results
found in the much larger data set from the
Netherlands[5, 10].
It should be noted that the case studies were not intended
to provide an overview representative for most Irish pig
units. The scope of the case studies was too limited to do
so. Similarly, the scale of the emission measurements
was not sufficient to yield specific emission factors
generally representative for Irish conditions.
The case studies prompted the following conclusions:
Conclusions on the results of finisher emission ratemeasurements in Ireland
The geometric mean emission rate of 13.2 ouE/s per
finisher measured in Ireland in winter conditions for this
study is about one third lower than the value of 22.6
ouE/s per finisher found in a larger study in the
Netherlands[10].
Given the relatively small number of samples, collected
in the Irish study, and the statistical variance as derived
from the larger Dutch study, the difference in the mean
outcome is too small to be statistically significant.
Therefore, it is justified to use the emission factors
derived in the Netherlands for emission estimates in
Ireland, until emission factors specifically measured in
Irish conditions are become available for a larger sample
of study sites.
Odour Impacts and Odour Emission Control Measures for Intensive Agriculture
73
10. Two case studies
Odour impact study Farm A
Farm A is a large integrated unit, containing over 17 000
animals. It is therefore no surprise that total emissions
are high, and the odour footprint relatively large.
However, given the locality of the farm - its distance
from residential units and its rural context, there seems
to be no urgency as no complaints have been registered.
The only concerns that were identified during the site
visits were the uncovered slurry store and carcass skips.
It is the opinion of Odournet UK that these sources may
become a significant emitter of odours during the warm
summer months. However, having undertaken sampling
during a cool spring day, there is no quantitative data to
support this.
The modelling shows that in the current situation a
limited number of (five) dwellings may be affected by
odour impacts in excess of the limit value. It is therefore
necessary to seriously consider the need to reduce
emissions and the options to do so. In the short-term
measures to reduce emissions from sludge storage
should be considered. In the longer term, replacement of
housing assets could reduce the number of dwellings
exposed to odour impacts in excess of the limit value,
conceivably to zero. The target value will be difficult to
attain for farm A. The farm can be made sustainable at
current stock levels, from the perspective of odour
impact, provided that the community recognises and
accepts the rural context in the vicinity.
Odour impact study Farm B
Farm B is a relatively small-scale operation. Under
current circumstances, the odour footprint does not
include any domestic dwellings within the limit value
contour. This farm does not require the installation of
any abatement options if current stock numbers and
good practice are maintained.
In the long-term, a reduction of odour emissions should
be considered when normal renewal of housing assets
becomes an issue. This could achieve attainment of the
target value for all dwellings in the vicinity, or create
room for some growth of stock when the agricultural
context of the area is recognised and accepted as the
status quo.
Odour Impacts and Odour Emission Control Measures for Intensive Agriculture
74
This report does not aim to provide one answer to a
well-defined question, with a concise set of conclusions.
Rather, it aims to provide the information, required by
the Environmental Protection Agency, for defining a
framework for answering the complex questions that
need to be addressed to achieve a systematic and
transparent IPC licensing policy. Such a policy will
ultimately be required if a reasonable and durable
balance is to be achieved between the economic interests
of the pig producer and the environmental interests of
those using the vicinity to live, work and play.
On the basis of the issues explored in the full text, a
number of general conclusions can be made to highlight
the essence of the report:
1) A significant number of pig production units will
require a licence, based on current National and
European legislation
2) An assessment framework based on quantitative
emissions is the most likely to achieve a transparent
licensing practice that achieves a balance between
the interests of the pig producer and those who use
the surroundings as their living environment.
3) The proposed assessment framework identifies one
environmental target for all situations. To allow for a
degree of flexibility two limit values have been set,
for new production unit applications and for existing
facilities. The ‘space’ between the target and the
limit values can be used in the licensing process to
tailor the conditions to the specific requirements and
opportunities that exist for that licence application.
4) The proposed framework for target and limit values
is, in general terms, compatible with the setback
distances required or advised in other countries, such
as Germany, Netherlands, New Zealand.
5) The prevailing wind direction in Ireland causes a
distribution of odours that is not entirely
symmetrical. The actual meteorology of the location
of the pig unit in question and the actual position of
the receptor relative to the source, are therefore a
factor in determining the setback distance required in
a particular direction. These particular circumstances
increase the need for specific modelling, in cases
where the outcome is not clear-cut.
6) The geometric mean emission rate of 13.2 ouE/s per
finisher measured for winter conditions in Ireland for
this study is about one third lower than the annual
mean value of 22.6 ouE/s per finisher found in a
larger study in the Netherlands.
7) Given the relatively small number of samples,
collected in the Irish study, and the statistical
variance as derived from the larger Dutch study, the
difference in the mean outcome is too small to be
statistically significant.
8) It is therefore justified to use the emission factors
derived in the Netherlands for emission estimates in
Ireland, until emission factors specifically measured
in Irish conditions are available for a larger sample
of study sites.
9) The options for reducing odour emissions from pig
production do exist. Reductions to 50% relative to
the most common fully slatted production unit are
quite feasible. However, the financial viability of
many retrofit methods is an issue of concern, given
the low economic returns on pig production.
10)The economics of installing the technology to abate
odour emissions must be assessed before this
technology can be imposed on existing pig unit
operations.
11)The most viable low-emission options involve
modification of pig houses, or replacement by new
low emission design housing. Such structural
abatement can only be reasonably achieved in the
normal economic cycle of asset replacement, in most
cases
12)Retro fitting of abatement systems, using air
treatment systems such as bioscrubbers, chemical
scrubbers or biofilters, can achieve significant
Odour Impacts and Odour Emission Control Measures for Intensive Agriculture
75
11. Conclusions
emission reductions of between 70% and over 95%.
The main impediment is the additional cost incurred,
which can increase the cost of a pig produced by
roughly 10-20%. Market conditions in recent years,
generally speaking, do not allow such an increased
cost.
13)Good operational practice, including suitable
landscaping, tree screens and pro-active community
relations, remain a main factor in reducing
annoyance and avoiding annoyance developing into
nuisance.
14)A suitable production site for a given production
capacity will become a major asset for any pig
producer, which may become a main factor in
determining the sustainability of the activity.
Producers are well advised to use the planning
process to their advantage and be pro-active in
counteracting any encroachment into the existing
setback zone by any developments that may be
termed an ‘odour sensitive receptor’.
15)By making transparent the assessment of the impact
of pig production on the vicinity, the proposed
framework can contribute in practice to the
protection of the interests of both pig producers and
the general public.
Odour Impacts and Odour Emission Control Measures for Intensive Agriculture
76
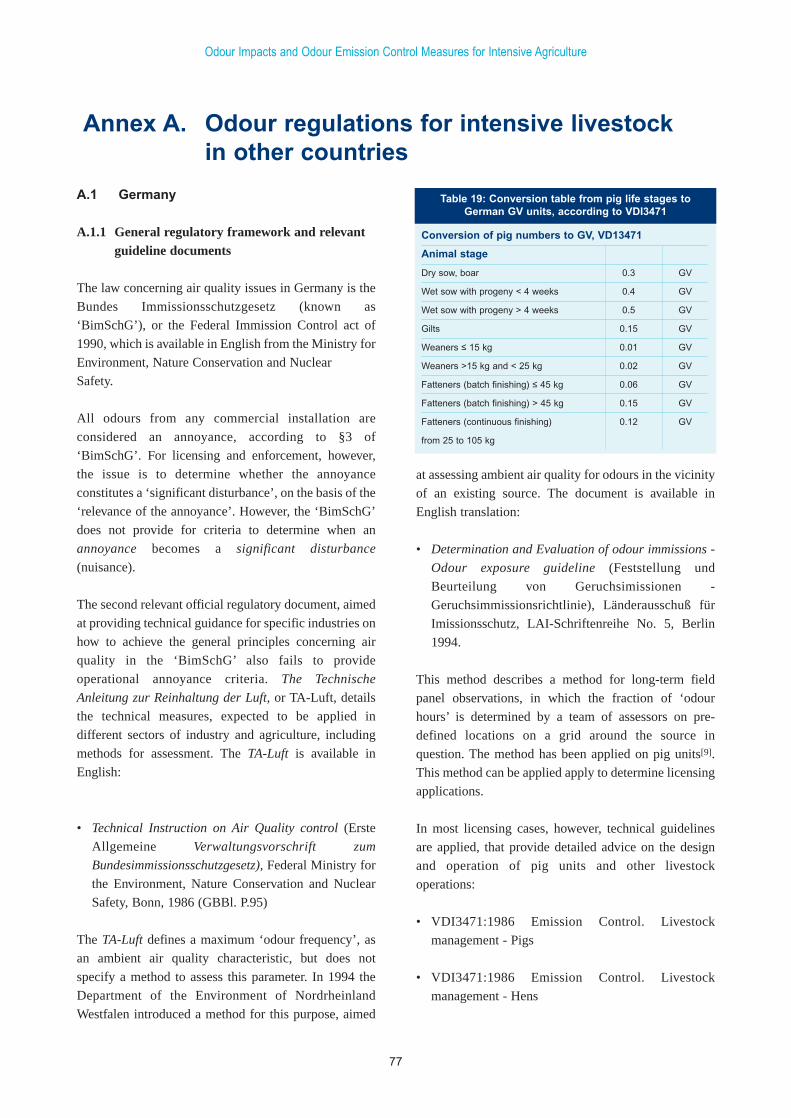
A.1 Germany
A.1.1 General regulatory framework and relevant guideline documents
The law concerning air quality issues in Germany is the
Bundes Immissionsschutzgesetz (known as
‘BimSchG’), or the Federal Immission Control act of
1990, which is available in English from the Ministry for
Environment, Nature Conservation and Nuclear
Safety.
All odours from any commercial installation are
considered an annoyance, according to §3 of
‘BimSchG’. For licensing and enforcement, however,
the issue is to determine whether the annoyance
constitutes a ‘significant disturbance’, on the basis of the
‘relevance of the annoyance’. However, the ‘BimSchG’
does not provide for criteria to determine when an
annoyance becomes a significant disturbance
(nuisance).
The second relevant official regulatory document, aimed
at providing technical guidance for specific industries on
how to achieve the general principles concerning air
quality in the ‘BimSchG’ also fails to provide
operational annoyance criteria. The Technische
Anleitung zur Reinhaltung der Luft, or TA-Luft, details
the technical measures, expected to be applied in
different sectors of industry and agriculture, including
methods for assessment. The TA-Luft is available in
English:
• Technical Instruction on Air Quality control (Erste
Allgemeine Verwaltungsvorschrift zum
Bundesimmissionsschutzgesetz), Federal Ministry for
the Environment, Nature Conservation and Nuclear
Safety, Bonn, 1986 (GBBl. P.95)
The TA-Luft defines a maximum ‘odour frequency’, as
an ambient air quality characteristic, but does not
specify a method to assess this parameter. In 1994 the
Department of the Environment of Nordrheinland
Westfalen introduced a method for this purpose, aimed
at assessing ambient air quality for odours in the vicinity
of an existing source. The document is available in
English translation:
• Determination and Evaluation of odour immissions -
Odour exposure guideline (Feststellung und
Beurteilung von Geruchsimissionen -
Geruchsimmissionsrichtlinie), Länderausschuß für
Imissionsschutz, LAI-Schriftenreihe No. 5, Berlin
1994.
This method describes a method for long-term field
panel observations, in which the fraction of ‘odour
hours’ is determined by a team of assessors on pre-
defined locations on a grid around the source in
question. The method has been applied on pig units[9].
This method can be applied apply to determine licensing
applications.
In most licensing cases, however, technical guidelines
are applied, that provide detailed advice on the design
and operation of pig units and other livestock
operations:
• VDI3471:1986 Emission Control. Livestock
management - Pigs
• VDI3471:1986 Emission Control. Livestock
management - Hens
Odour Impacts and Odour Emission Control Measures for Intensive Agriculture
77
Annex A. Odour regulations for intensive livestockin other countries
Conversion of pig numbers to GV, VD13471
Animal stage
Dry sow, boar 0.3 GV
Wet sow with progeny < 4 weeks 0.4 GV
Wet sow with progeny > 4 weeks 0.5 GV
Gilts 0.15 GV
Weaners ≤ 15 kg 0.01 GV
Weaners >15 kg and < 25 kg 0.02 GV
Fatteners (batch finishing) ≤ 45 kg 0.06 GV
Fatteners (batch finishing) > 45 kg 0.15 GV
Fatteners (continuous finishing) 0.12 GV
from 25 to 105 kg
Table 19: Conversion table from pig life stages toGerman GV units, according to VDI3471
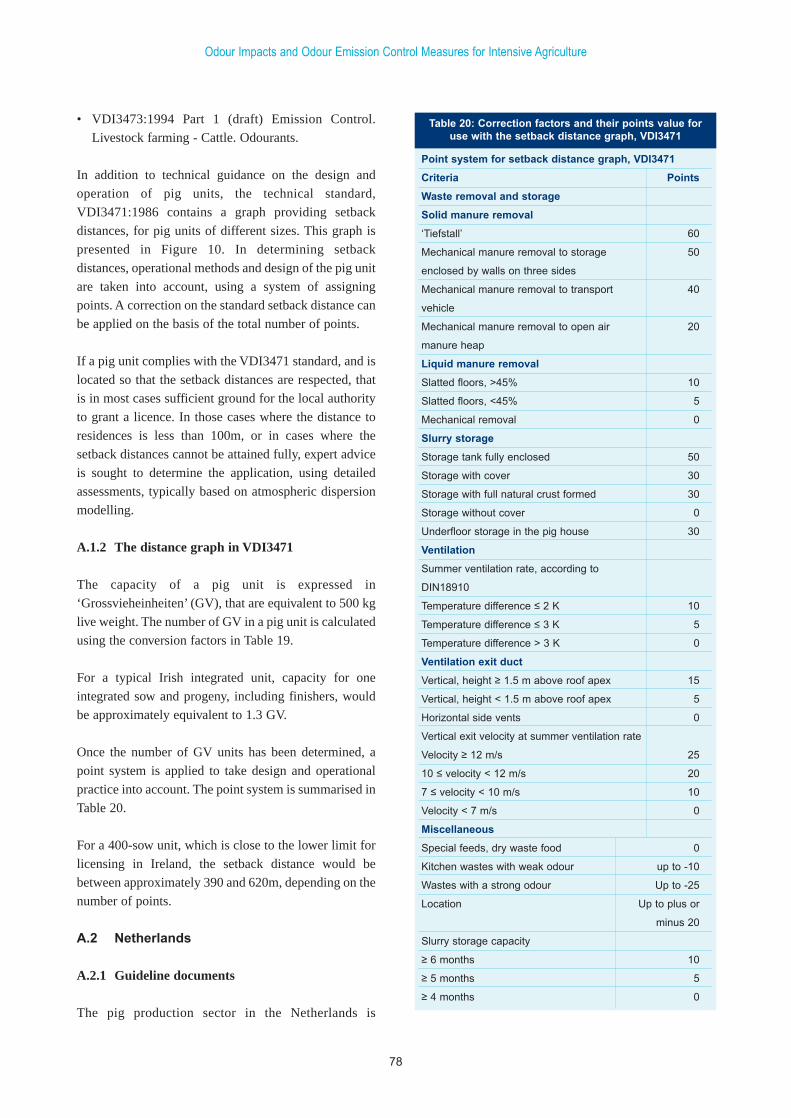
• VDI3473:1994 Part 1 (draft) Emission Control.
Livestock farming - Cattle. Odourants.
In addition to technical guidance on the design and
operation of pig units, the technical standard,
VDI3471:1986 contains a graph providing setback
distances, for pig units of different sizes. This graph is
presented in Figure 10. In determining setback
distances, operational methods and design of the pig unit
are taken into account, using a system of assigning
points. A correction on the standard setback distance can
be applied on the basis of the total number of points.
If a pig unit complies with the VDI3471 standard, and is
located so that the setback distances are respected, that
is in most cases sufficient ground for the local authority
to grant a licence. In those cases where the distance to
residences is less than 100m, or in cases where the
setback distances cannot be attained fully, expert advice
is sought to determine the application, using detailed
assessments, typically based on atmospheric dispersion
modelling.
A.1.2 The distance graph in VDI3471
The capacity of a pig unit is expressed in
‘Grossvieheinheiten’ (GV), that are equivalent to 500 kg
live weight. The number of GV in a pig unit is calculated
using the conversion factors in Table 19.
For a typical Irish integrated unit, capacity for one
integrated sow and progeny, including finishers, would
be approximately equivalent to 1.3 GV.
Once the number of GV units has been determined, a
point system is applied to take design and operational
practice into account. The point system is summarised in
Table 20.
For a 400-sow unit, which is close to the lower limit for
licensing in Ireland, the setback distance would be
between approximately 390 and 620m, depending on the
number of points.
A.2 Netherlands
A.2.1 Guideline documents
The pig production sector in the Netherlands is
Odour Impacts and Odour Emission Control Measures for Intensive Agriculture
78
Point system for setback distance graph, VDI3471
Criteria Points
Waste removal and storage
Solid manure removal
‘Tiefstall’ 60
Mechanical manure removal to storage 50
enclosed by walls on three sides
Mechanical manure removal to transport 40
vehicle
Mechanical manure removal to open air 20
manure heap
Liquid manure removal
Slatted floors, >45% 10
Slatted floors, <45% 5
Mechanical removal 0
Slurry storage
Storage tank fully enclosed 50
Storage with cover 30
Storage with full natural crust formed 30
Storage without cover 0
Underfloor storage in the pig house 30
Ventilation
Summer ventilation rate, according to
DIN18910
Temperature difference ≤ 2 K 10
Temperature difference ≤ 3 K 5
Temperature difference > 3 K 0
Ventilation exit duct
Vertical, height ≥ 1.5 m above roof apex 15
Vertical, height < 1.5 m above roof apex 5
Horizontal side vents 0
Vertical exit velocity at summer ventilation rate
Velocity ≥ 12 m/s 25
10 ≤ velocity < 12 m/s 20
7 ≤ velocity < 10 m/s 10
Velocity < 7 m/s 0
Miscellaneous
Special feeds, dry waste food 0
Kitchen wastes with weak odour up to -10
Wastes with a strong odour Up to -25
Location Up to plus or
minus 20
Slurry storage capacity
≥ 6 months 10
≥ 5 months 5
≥ 4 months 0
Table 20: Correction factors and their points value foruse with the setback distance graph, VDI3471
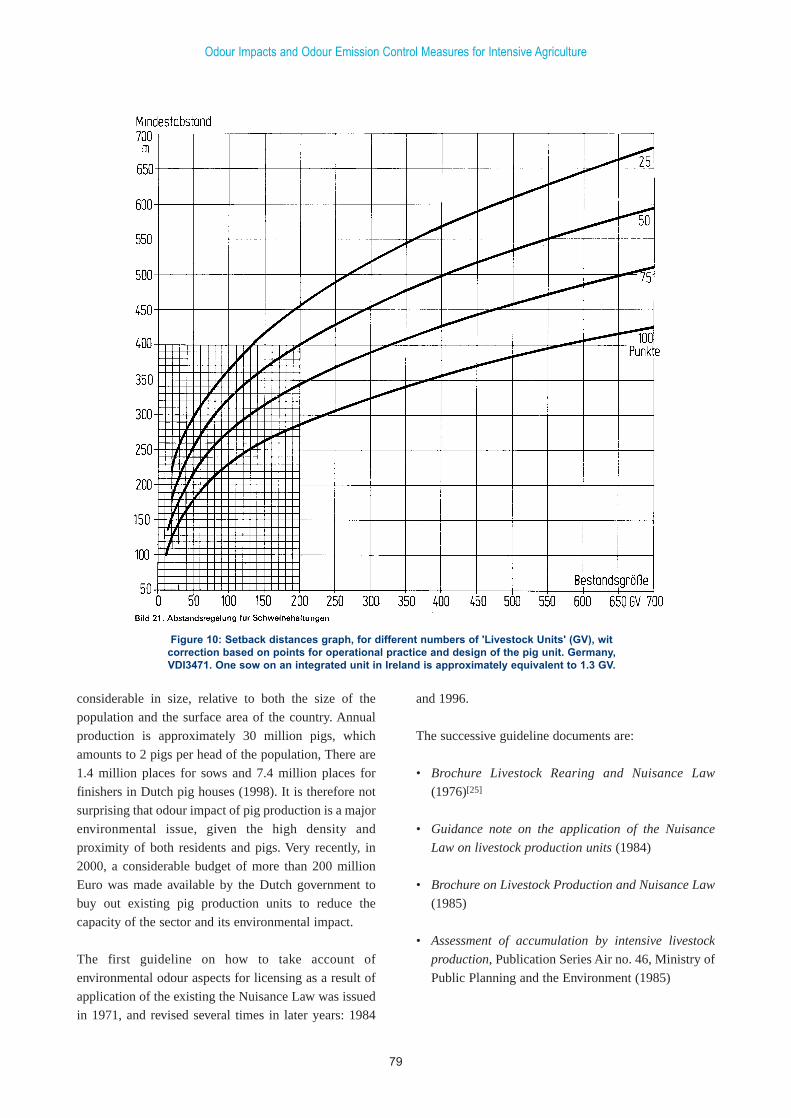
considerable in size, relative to both the size of the
population and the surface area of the country. Annual
production is approximately 30 million pigs, which
amounts to 2 pigs per head of the population, There are
1.4 million places for sows and 7.4 million places for
finishers in Dutch pig houses (1998). It is therefore not
surprising that odour impact of pig production is a major
environmental issue, given the high density and
proximity of both residents and pigs. Very recently, in
2000, a considerable budget of more than 200 million
Euro was made available by the Dutch government to
buy out existing pig production units to reduce the
capacity of the sector and its environmental impact.
The first guideline on how to take account of
environmental odour aspects for licensing as a result of
application of the existing the Nuisance Law was issued
in 1971, and revised several times in later years: 1984
and 1996.
The successive guideline documents are:
• Brochure Livestock Rearing and Nuisance Law
(1976)[25]
• Guidance note on the application of the Nuisance
Law on livestock production units (1984)
• Brochure on Livestock Production and Nuisance Law
(1985)
• Assessment of accumulation by intensive livestock
production, Publication Series Air no. 46, Ministry of
Public Planning and the Environment (1985)
Odour Impacts and Odour Emission Control Measures for Intensive Agriculture
79
Figure 10: Setback distances graph, for different numbers of 'Livestock Units' (GV), witcorrection based on points for operational practice and design of the pig unit. Germany,VDI3471. One sow on an integrated unit in Ireland is approximately equivalent to 1.3 GV.
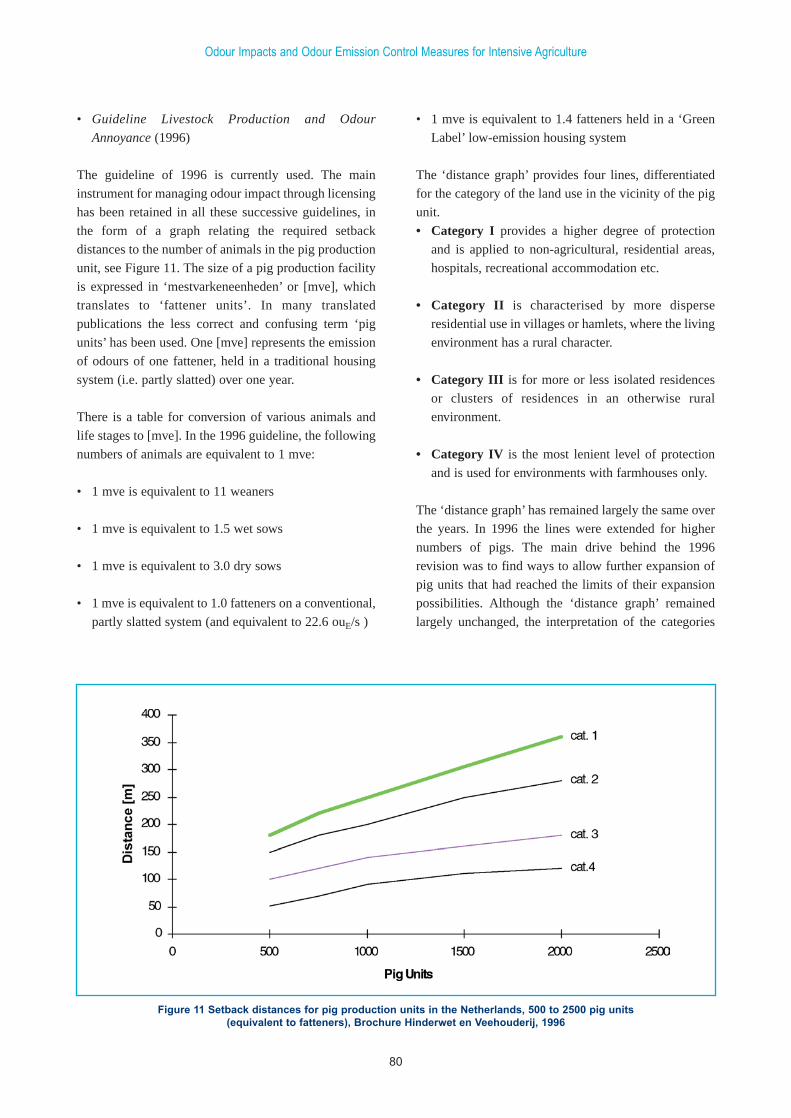
• Guideline Livestock Production and Odour
Annoyance (1996)
The guideline of 1996 is currently used. The main
instrument for managing odour impact through licensing
has been retained in all these successive guidelines, in
the form of a graph relating the required setback
distances to the number of animals in the pig production
unit, see Figure 11. The size of a pig production facility
is expressed in ‘mestvarkeneenheden’ or [mve], which
translates to ‘fattener units’. In many translated
publications the less correct and confusing term ‘pig
units’ has been used. One [mve] represents the emission
of odours of one fattener, held in a traditional housing
system (i.e. partly slatted) over one year.
There is a table for conversion of various animals and
life stages to [mve]. In the 1996 guideline, the following
numbers of animals are equivalent to 1 mve:
• 1 mve is equivalent to 11 weaners
• 1 mve is equivalent to 1.5 wet sows
• 1 mve is equivalent to 3.0 dry sows
• 1 mve is equivalent to 1.0 fatteners on a conventional,
partly slatted system (and equivalent to 22.6 ouE/s )
• 1 mve is equivalent to 1.4 fatteners held in a ‘Green
Label’ low-emission housing system
The ‘distance graph’ provides four lines, differentiated
for the category of the land use in the vicinity of the pig
unit.
• Category I provides a higher degree of protection
and is applied to non-agricultural, residential areas,
hospitals, recreational accommodation etc.
• Category II is characterised by more disperse
residential use in villages or hamlets, where the living
environment has a rural character.
• Category III is for more or less isolated residences
or clusters of residences in an otherwise rural
environment.
• Category IV is the most lenient level of protection
and is used for environments with farmhouses only.
The ‘distance graph’ has remained largely the same over
the years. In 1996 the lines were extended for higher
numbers of pigs. The main drive behind the 1996
revision was to find ways to allow further expansion of
pig units that had reached the limits of their expansion
possibilities. Although the ‘distance graph’ remained
largely unchanged, the interpretation of the categories
Odour Impacts and Odour Emission Control Measures for Intensive Agriculture
80
Figure 11 Setback distances for pig production units in the Netherlands, 500 to 2500 pig units(equivalent to fatteners), Brochure Hinderwet en Veehouderij, 1996
and the method of measuring distances between
buildings and residences was adapted to allow some
degree of further expansion, while maintaining the
objective that no ‘severe odour nuisance’ should occur.
Another modification concerned the conversion for
various animals and life stages to [mve] units, which
now included values for low emission housing, the
certified ‘Green Label’ housing systems. Using the
expanded table for these ‘Green Label’ systems allowed
existing pig units to expand, providing that they used
these low emission housing systems. .
In 1997 and 1998 a number of rulings of the Council of
State, the highest appeal court for planning cases, have
challenged parts of the revisions of 1996. Particularly
the modifications in the application of the categories,
that implied that a number of categories of residences
were moved to a less protected category, was not
accepted. The Council of Stated judged the motivation
for the revisions insufficient. As a result, the Ministry of
Public Planning and the Environment has started a
number of research projects, to establish the scientific
basis for the relation between exposure to pig odours
and actual levels of annoyance. A second project
involves the measurement of emission factors for
different life stages of pigs. The results will be used as
the starting point for a major policy review, named
Revision of policy instruments for rural odour policy,
with the Dutch acronym VIAS. The review is currently
ongoing and is expected to lead to introduction of a fully
revised guideline in autumn 2000 or early in 2001.
It is expected that the ‘distance graph’ will continue to
be applied, but the use of four categories of land use may
be simplified and adapted to reflect the results of the
dose-effect studies. In addition, a revision of the
conversion factors to [mve][ for different life stages is
expected to be revised, on the basis of recently measured
values.
A.3 United Kingdom
The Environmental Protection Act of 1990 provides the
legal framework for avoiding and controlling odour
nuisance in the United Kingdom. The Environmental
Health department of the Local Authority is responsible
for its enforcement. Under Part III, Section 79 of the
Act, the local authority has a duty to inspect their area
and detect any statutory nuisance. Reasonably
practicable steps are to be undertaken to investigate
complaints by residents made to them.
Statutory Nuisances are defined in Section 79 of the Act.
The relevant passages, relating to odour, are:
• …any dust, steam, smell or other effluvia arising on
industrial, trade or business premises and being
prejudicial to health or a nuisance;
• fumes or gases so as to be prejudicial to health or a
nuisance;
• any animal kept in such a place or manner as to be
prejudicial to health or a nuisance; and
• any other matter declared by any enactment to be a
statutory nuisance.
Where a local authority Environmental Health
Department is satisfied that a statutory nuisance exists,
or is likely to occur or recur, it has a duty to serve an
abatement notice under Part III, Section 80 of the Act
requiring:
• the abatement of the nuisance or prohibiting or
restricting its occurrence or recurrence; and
• the execution of such works and the taking of such
other steps as may be necessary for these purposes.
A person served with an abatement notice may appeal to
the Magistrates Court within 21 days of being served
with the notice. In the event the person does not comply
with the Abatement Notice fines up to GBP 20,000 may
be imposed. In such cases, it is a defence to show that
you have used the best practicable means (BPM) to
prevent or counteract the nuisance. BPM is defined to
have regard among other things to local conditions and
circumstances, to the current state of technical
knowledge and to the financial implications.
The law on statutory nuisance is far from
straightforward. A key problem is that no criteria are
provided to decide when occurrence of an odour
constitutes a nuisance, and when it is acceptable. The
system relies heavily on the individual judgement of the
Environmental Health Inspector. In practice a wide
variety of licence conditions occur.
Odour Impacts and Odour Emission Control Measures for Intensive Agriculture
81
Planning consents have to be granted on the basis of the
Town and Country Planning (General Permitted
Development) Order of 1995 (GPDO). New livestock
facilities, such as livestock buildings, slurry storage
facilities, and extensions or alterations to such facilities,
need planning permission when these will be within a
distance of 400m from the boundary of any protected
buildings (such as residential houses or schools).
Under the Town and Country Planning (Assessment of
Environmental Effects) Regulations of 1988 an
environmental assessment is to be carried out for certain
types of major project which are likely to have
significant effects on the environment. For livestock
units this requirement is likely to apply to new pig units
of more than 400 sows or 5000 fatteners and new poultry
units of more than 100,000 broilers or 50,000 layers.
For planning procedures, the use of odour modelling
with application of a criterion of 5 ouE/m3 as a 98-
percentile of hourly values has been accepted as an
acceptable approach to demonstrate that no statutory
nuisance would arise, in a planning enquiry involving a
wastewater treatment plant at Newbiggin-by-the-Sea,
Northumberland, planning reference APP/F2930/A/92
206240, UK, 1993[16].
The main document providing guidance is:
• The Air Code, Code of Good Agricultural Practice for
the protection of Air, revised 1998, Ministry of
Agriculture, Fisheries and Food and the Welsh Office
Agriculture Departments, October 1998.
The Code provides general guidance on the legal
background, and on good practice for production. The
main part of guidance on odours is given in Part B of the
Code, which contains a wealth of sound general advice,
but is remarkably limited on technical detail and
quantitative assessment and management information.
The Code does not contain any specific recommendation
on setback distances, other than suggesting that any pig
unit located at less than 400 metres from residences
should take extra care in implementing the advice given
in the Code.
A.4 United States
Swine CAFO odours: Guidance for Environmental
Impact Assessment, US EPA, Region 6, Dallas, Texas,
contract no. 68-D3-0142, 1997
A.4.1 Setback distances:
The American Society of Agricultural Engineers
(ASEA,1994) indicates that a ‘desirable distance’ for
siting livestock facilities in general is 1600 m from
housing developments and 400-800 m from
neighbouring domestic dwellings.
The EPA guidance indicates that the setback distance
should be at least 3.6 km and preferably 7.2 km for
‘larger facilities’.
A.5 New Zealand
A Code of Practice for pig production and siting is
available on the Internet,
at www-aghort.massey.ac.nz/centres/mrc/extension/cop
The New Zealand Code of Practice (CoP) contains two
types of setback distances:
• Fixed setback distances, that must be observed in all
cases, regardless of the size of the production unit
• Adjustable setback distances that depend on the size
of operation and a set of correction factors for
operational characteristics.
The adjustable setback distances must be applied to pig
production units with 2000 pigs or more.
For any piggery having more than 5000 pigs, the
potential to create adverse effects will have to be
determined on an individual case basis. The size of the
buffer zone for such a piggery will reflect this.
One pig is counted for the P-factor when it is older than
70 days. Breeding units with weaners only are counted
using a conversion of 1 breeding sow = 5 pigs.
Odour Impacts and Odour Emission Control Measures for Intensive Agriculture
82
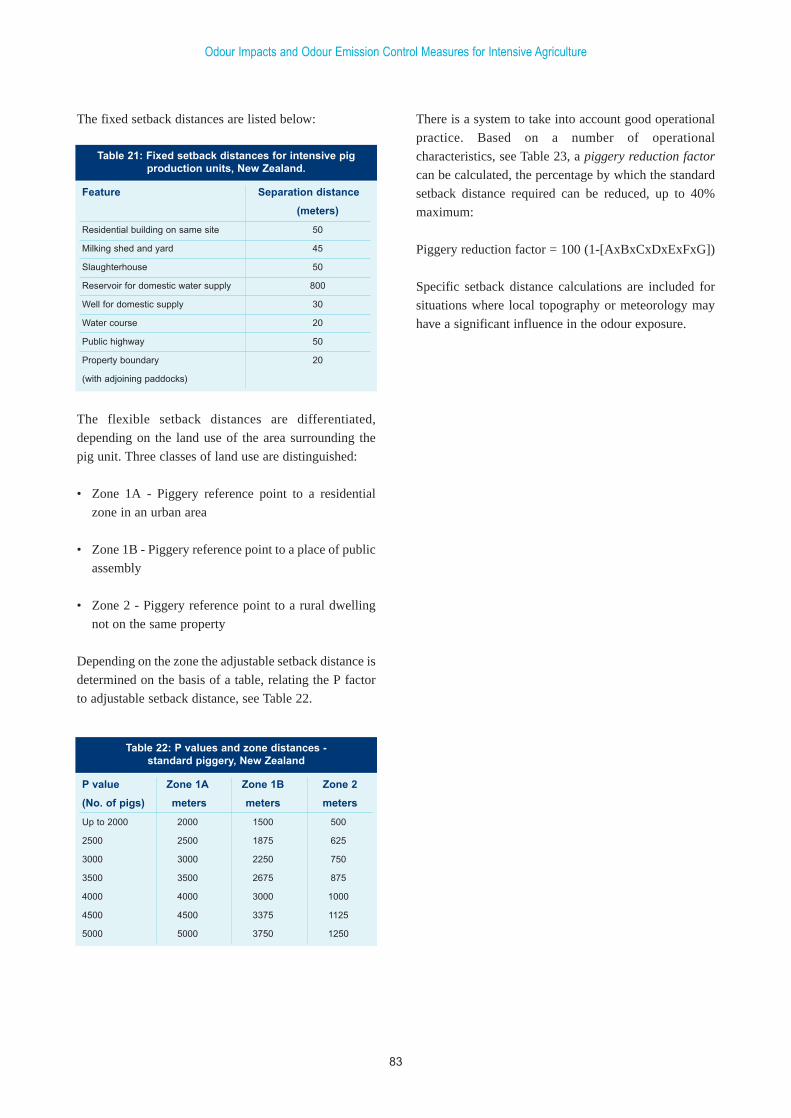
The fixed setback distances are listed below: There is a system to take into account good operational
practice. Based on a number of operational
characteristics, see Table 23, a piggery reduction factor
can be calculated, the percentage by which the standard
setback distance required can be reduced, up to 40%
maximum:
Piggery reduction factor = 100 (1-[AxBxCxDxExFxG])
Specific setback distance calculations are included for
situations where local topography or meteorology may
have a significant influence in the odour exposure.
The flexible setback distances are differentiated,
depending on the land use of the area surrounding the
pig unit. Three classes of land use are distinguished:
• Zone 1A - Piggery reference point to a residential
zone in an urban area
• Zone 1B - Piggery reference point to a place of public
assembly
• Zone 2 - Piggery reference point to a rural dwelling
not on the same property
Depending on the zone the adjustable setback distance is
determined on the basis of a table, relating the P factor
to adjustable setback distance, see Table 22.
Odour Impacts and Odour Emission Control Measures for Intensive Agriculture
83
Feature Separation distance
(meters)
Residential building on same site 50
Milking shed and yard 45
Slaughterhouse 50
Reservoir for domestic water supply 800
Well for domestic supply 30
Water course 20
Public highway 50
Property boundary 20
(with adjoining paddocks)
Table 21: Fixed setback distances for intensive pigproduction units, New Zealand.
P value Zone 1A Zone 1B Zone 2
(No. of pigs) meters meters meters
Up to 2000 2000 1500 500
2500 2500 1875 625
3000 3000 2250 750
3500 3500 2675 875
4000 4000 3000 1000
4500 4500 3375 1125
5000 5000 3750 1250
Table 22: P values and zone distances -standard piggery, New Zealand
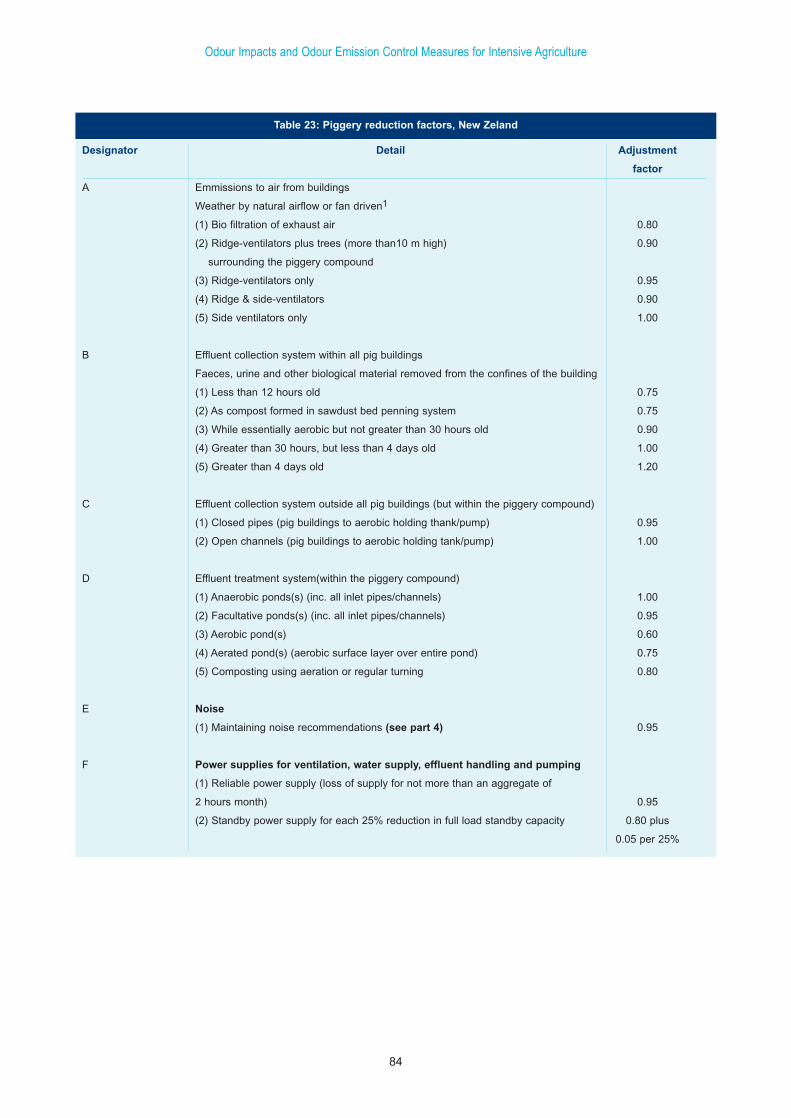
Odour Impacts and Odour Emission Control Measures for Intensive Agriculture
84
Designator Detail Adjustment
factor
A Emmissions to air from buildings
Weather by natural airflow or fan driven1
(1) Bio filtration of exhaust air 0.80
(2) Ridge-ventilators plus trees (more than10 m high) 0.90
surrounding the piggery compound
(3) Ridge-ventilators only 0.95
(4) Ridge & side-ventilators 0.90
(5) Side ventilators only 1.00
B Effluent collection system within all pig buildings
Faeces, urine and other biological material removed from the confines of the building
(1) Less than 12 hours old 0.75
(2) As compost formed in sawdust bed penning system 0.75
(3) While essentially aerobic but not greater than 30 hours old 0.90
(4) Greater than 30 hours, but less than 4 days old 1.00
(5) Greater than 4 days old 1.20
C Effluent collection system outside all pig buildings (but within the piggery compound)
(1) Closed pipes (pig buildings to aerobic holding thank/pump) 0.95
(2) Open channels (pig buildings to aerobic holding tank/pump) 1.00
D Effluent treatment system(within the piggery compound)
(1) Anaerobic ponds(s) (inc. all inlet pipes/channels) 1.00
(2) Facultative ponds(s) (inc. all inlet pipes/channels) 0.95
(3) Aerobic pond(s) 0.60
(4) Aerated pond(s) (aerobic surface layer over entire pond) 0.75
(5) Composting using aeration or regular turning 0.80
E Noise
(1) Maintaining noise recommendations (see part 4) 0.95
F Power supplies for ventilation, water supply, effluent handling and pumping
(1) Reliable power supply (loss of supply for not more than an aggregate of
2 hours month) 0.95
(2) Standby power supply for each 25% reduction in full load standby capacity 0.80 plus
0.05 per 25%
Table 23: Piggery reduction factors, New Zeland

Odour Impacts and Odour Emission Control Measures for Intensive Agriculture
85
Designator Detail Adjustment
factor
G Management
Stock under surveillance:
24 hours/day 0.90
12-23 hours/day 0.95
6-11 hours/day 1.00
1-5 hours/day 1.10
less than 1 hour/day 1.20
Stock under surveillance shall mean that a person, qualified or competent to have charge of stock and deal with routine or
emergency conditions is monitoring the fuctions of that piggery.
1 For ventilation requirements see:
British Standards Institution. (1990). BS 5502: 1990 Building & Structures for Agriculture. Part 42: Code of practice for design and
construction of pig buildings. London. BSI
The Code of Practice - Pig Farming calls for a high standard at all piggeries, which is achieved by good management control of
odour generating procedures. A piggery scoring a negative adjustment factor (i.e. an increase) in variable buffer zone distance
would not meet the requirements of this Code of Practice.
Table 23: Piggery reduction factors, New Zeland (continued)

Odour Impacts and Odour Emission Control Measures for Intensive Agriculture
86
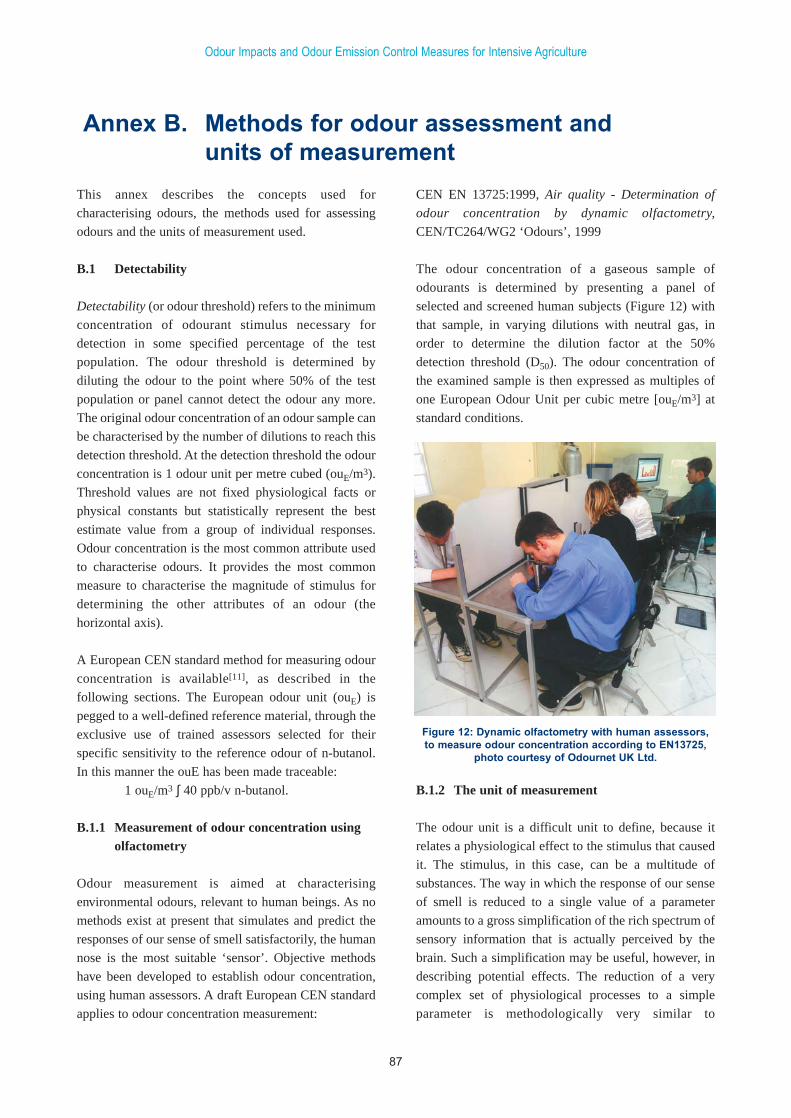
This annex describes the concepts used for
characterising odours, the methods used for assessing
odours and the units of measurement used.
B.1 Detectability
Detectability (or odour threshold) refers to the minimum
concentration of odourant stimulus necessary for
detection in some specified percentage of the test
population. The odour threshold is determined by
diluting the odour to the point where 50% of the test
population or panel cannot detect the odour any more.
The original odour concentration of an odour sample can
be characterised by the number of dilutions to reach this
detection threshold. At the detection threshold the odour
concentration is 1 odour unit per metre cubed (ouE/m3).
Threshold values are not fixed physiological facts or
physical constants but statistically represent the best
estimate value from a group of individual responses.
Odour concentration is the most common attribute used
to characterise odours. It provides the most common
measure to characterise the magnitude of stimulus for
determining the other attributes of an odour (the
horizontal axis).
A European CEN standard method for measuring odour
concentration is available[11], as described in the
following sections. The European odour unit (ouE) is
pegged to a well-defined reference material, through the
exclusive use of trained assessors selected for their
specific sensitivity to the reference odour of n-butanol.
In this manner the ouE has been made traceable:
1 ouE/m3 ∫ 40 ppb/v n-butanol.
B.1.1 Measurement of odour concentration using olfactometry
Odour measurement is aimed at characterising
environmental odours, relevant to human beings. As no
methods exist at present that simulates and predict the
responses of our sense of smell satisfactorily, the human
nose is the most suitable ‘sensor’. Objective methods
have been developed to establish odour concentration,
using human assessors. A draft European CEN standard
applies to odour concentration measurement:
CEN EN 13725:1999, Air quality - Determination of
odour concentration by dynamic olfactometry,
CEN/TC264/WG2 ‘Odours’, 1999
The odour concentration of a gaseous sample of
odourants is determined by presenting a panel of
selected and screened human subjects (Figure 12) with
that sample, in varying dilutions with neutral gas, in
order to determine the dilution factor at the 50%
detection threshold (D50). The odour concentration of
the examined sample is then expressed as multiples of
one European Odour Unit per cubic metre [ouE/m3] at
standard conditions.
B.1.2 The unit of measurement
The odour unit is a difficult unit to define, because it
relates a physiological effect to the stimulus that caused
it. The stimulus, in this case, can be a multitude of
substances. The way in which the response of our sense
of smell is reduced to a single value of a parameter
amounts to a gross simplification of the rich spectrum of
sensory information that is actually perceived by the
brain. Such a simplification may be useful, however, in
describing potential effects. The reduction of a very
complex set of physiological processes to a simple
parameter is methodologically very similar to
Odour Impacts and Odour Emission Control Measures for Intensive Agriculture
87
Annex B. Methods for odour assessment andunits of measurement
Figure 12: Dynamic olfactometry with human assessors,to measure odour concentration according to EN13725,
photo courtesy of Odournet UK Ltd.
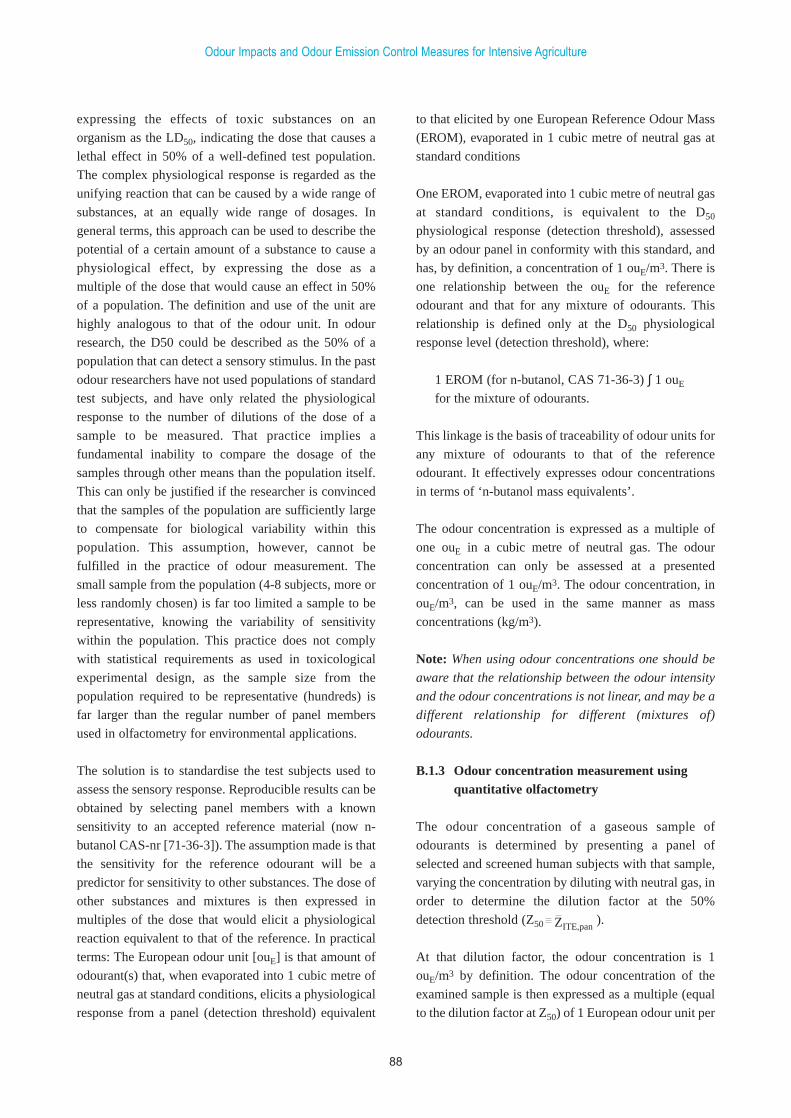
expressing the effects of toxic substances on an
organism as the LD50, indicating the dose that causes a
lethal effect in 50% of a well-defined test population.
The complex physiological response is regarded as the
unifying reaction that can be caused by a wide range of
substances, at an equally wide range of dosages. In
general terms, this approach can be used to describe the
potential of a certain amount of a substance to cause a
physiological effect, by expressing the dose as a
multiple of the dose that would cause an effect in 50%
of a population. The definition and use of the unit are
highly analogous to that of the odour unit. In odour
research, the D50 could be described as the 50% of a
population that can detect a sensory stimulus. In the past
odour researchers have not used populations of standard
test subjects, and have only related the physiological
response to the number of dilutions of the dose of a
sample to be measured. That practice implies a
fundamental inability to compare the dosage of the
samples through other means than the population itself.
This can only be justified if the researcher is convinced
that the samples of the population are sufficiently large
to compensate for biological variability within this
population. This assumption, however, cannot be
fulfilled in the practice of odour measurement. The
small sample from the population (4-8 subjects, more or
less randomly chosen) is far too limited a sample to be
representative, knowing the variability of sensitivity
within the population. This practice does not comply
with statistical requirements as used in toxicological
experimental design, as the sample size from the
population required to be representative (hundreds) is
far larger than the regular number of panel members
used in olfactometry for environmental applications.
The solution is to standardise the test subjects used to
assess the sensory response. Reproducible results can be
obtained by selecting panel members with a known
sensitivity to an accepted reference material (now n-
butanol CAS-nr [71-36-3]). The assumption made is that
the sensitivity for the reference odourant will be a
predictor for sensitivity to other substances. The dose of
other substances and mixtures is then expressed in
multiples of the dose that would elicit a physiological
reaction equivalent to that of the reference. In practical
terms: The European odour unit [ouE] is that amount of
odourant(s) that, when evaporated into 1 cubic metre of
neutral gas at standard conditions, elicits a physiological
response from a panel (detection threshold) equivalent
to that elicited by one European Reference Odour Mass
(EROM), evaporated in 1 cubic metre of neutral gas at
standard conditions
One EROM, evaporated into 1 cubic metre of neutral gas
at standard conditions, is equivalent to the D50
physiological response (detection threshold), assessed
by an odour panel in conformity with this standard, and
has, by definition, a concentration of 1 ouE/m3. There is
one relationship between the ouE for the reference
odourant and that for any mixture of odourants. This
relationship is defined only at the D50 physiological
response level (detection threshold), where:
1 EROM (for n-butanol, CAS 71-36-3) ∫ 1 ouE
for the mixture of odourants.
This linkage is the basis of traceability of odour units for
any mixture of odourants to that of the reference
odourant. It effectively expresses odour concentrations
in terms of ‘n-butanol mass equivalents’.
The odour concentration is expressed as a multiple of
one ouE in a cubic metre of neutral gas. The odour
concentration can only be assessed at a presented
concentration of 1 ouE/m3. The odour concentration, in
ouE/m3, can be used in the same manner as mass
concentrations (kg/m3).
Note: When using odour concentrations one should be
aware that the relationship between the odour intensity
and the odour concentrations is not linear, and may be a
different relationship for different (mixtures of)
odourants.
B.1.3 Odour concentration measurement using quantitative olfactometry
The odour concentration of a gaseous sample of
odourants is determined by presenting a panel of
selected and screened human subjects with that sample,
varying the concentration by diluting with neutral gas, in
order to determine the dilution factor at the 50%
detection threshold (Z50 ZITE,pan).
At that dilution factor, the odour concentration is 1
ouE/m3 by definition. The odour concentration of the
examined sample is then expressed as a multiple (equal
to the dilution factor at Z50) of 1 European odour unit per
Odour Impacts and Odour Emission Control Measures for Intensive Agriculture
88
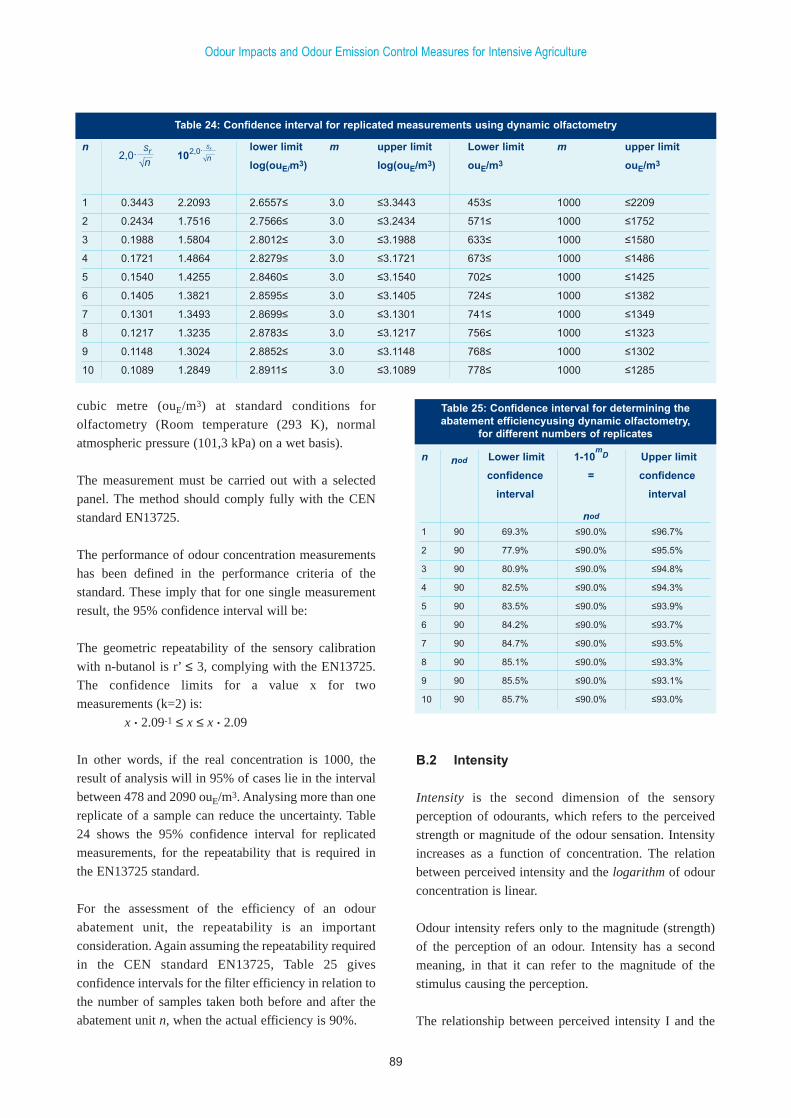
cubic metre (ouE/m3) at standard conditions for
olfactometry (Room temperature (293 K), normal
atmospheric pressure (101,3 kPa) on a wet basis).
The measurement must be carried out with a selected
panel. The method should comply fully with the CEN
standard EN13725.
The performance of odour concentration measurements
has been defined in the performance criteria of the
standard. These imply that for one single measurement
result, the 95% confidence interval will be:
The geometric repeatability of the sensory calibration
with n-butanol is r’ ≤ 3, complying with the EN13725.
The confidence limits for a value x for two
measurements (k=2) is:
x . 2.09-1 ≤ x ≤ x . 2.09
In other words, if the real concentration is 1000, the
result of analysis will in 95% of cases lie in the interval
between 478 and 2090 ouE/m3. Analysing more than one
replicate of a sample can reduce the uncertainty. Table
24 shows the 95% confidence interval for replicated
measurements, for the repeatability that is required in
the EN13725 standard.
For the assessment of the efficiency of an odour
abatement unit, the repeatability is an important
consideration. Again assuming the repeatability required
in the CEN standard EN13725, Table 25 gives
confidence intervals for the filter efficiency in relation to
the number of samples taken both before and after the
abatement unit n, when the actual efficiency is 90%.
B.2 Intensity
Intensity is the second dimension of the sensory
perception of odourants, which refers to the perceived
strength or magnitude of the odour sensation. Intensity
increases as a function of concentration. The relation
between perceived intensity and the logarithm of odour
concentration is linear.
Odour intensity refers only to the magnitude (strength)
of the perception of an odour. Intensity has a second
meaning, in that it can refer to the magnitude of the
stimulus causing the perception.
The relationship between perceived intensity I and the
Odour Impacts and Odour Emission Control Measures for Intensive Agriculture
89
n lower limit m upper limit Lower limit m upper limit
log(ouE/m3) log(ouE/m3) ouE/m3 ouE/m3
1 0.3443 2.2093 2.6557≤ 3.0 ≤3.3443 453≤ 1000 ≤2209
2 0.2434 1.7516 2.7566≤ 3.0 ≤3.2434 571≤ 1000 ≤1752
3 0.1988 1.5804 2.8012≤ 3.0 ≤3.1988 633≤ 1000 ≤1580
4 0.1721 1.4864 2.8279≤ 3.0 ≤3.1721 673≤ 1000 ≤1486
5 0.1540 1.4255 2.8460≤ 3.0 ≤3.1540 702≤ 1000 ≤1425
6 0.1405 1.3821 2.8595≤ 3.0 ≤3.1405 724≤ 1000 ≤1382
7 0.1301 1.3493 2.8699≤ 3.0 ≤3.1301 741≤ 1000 ≤1349
8 0.1217 1.3235 2.8783≤ 3.0 ≤3.1217 756≤ 1000 ≤1323
9 0.1148 1.3024 2.8852≤ 3.0 ≤3.1148 768≤ 1000 ≤1302
10 0.1089 1.2849 2.8911≤ 3.0 ≤3.1089 778≤ 1000 ≤1285
Table 24: Confidence interval for replicated measurements using dynamic olfactometry
2,0. Sr
√n2,0. Sr
√n10
n nod Lower limit 1-10m
D Upper limit
confidence = confidence
interval interval
nod
1 90 69.3% ≤90.0% ≤96.7%
2 90 77.9% ≤90.0% ≤95.5%
3 90 80.9% ≤90.0% ≤94.8%
4 90 82.5% ≤90.0% ≤94.3%
5 90 83.5% ≤90.0% ≤93.9%
6 90 84.2% ≤90.0% ≤93.7%
7 90 84.7% ≤90.0% ≤93.5%
8 90 85.1% ≤90.0% ≤93.3%
9 90 85.5% ≤90.0% ≤93.1%
10 90 85.7% ≤90.0% ≤93.0%
Table 25: Confidence interval for determining theabatement efficiencyusing dynamic olfactometry,
for different numbers of replicates
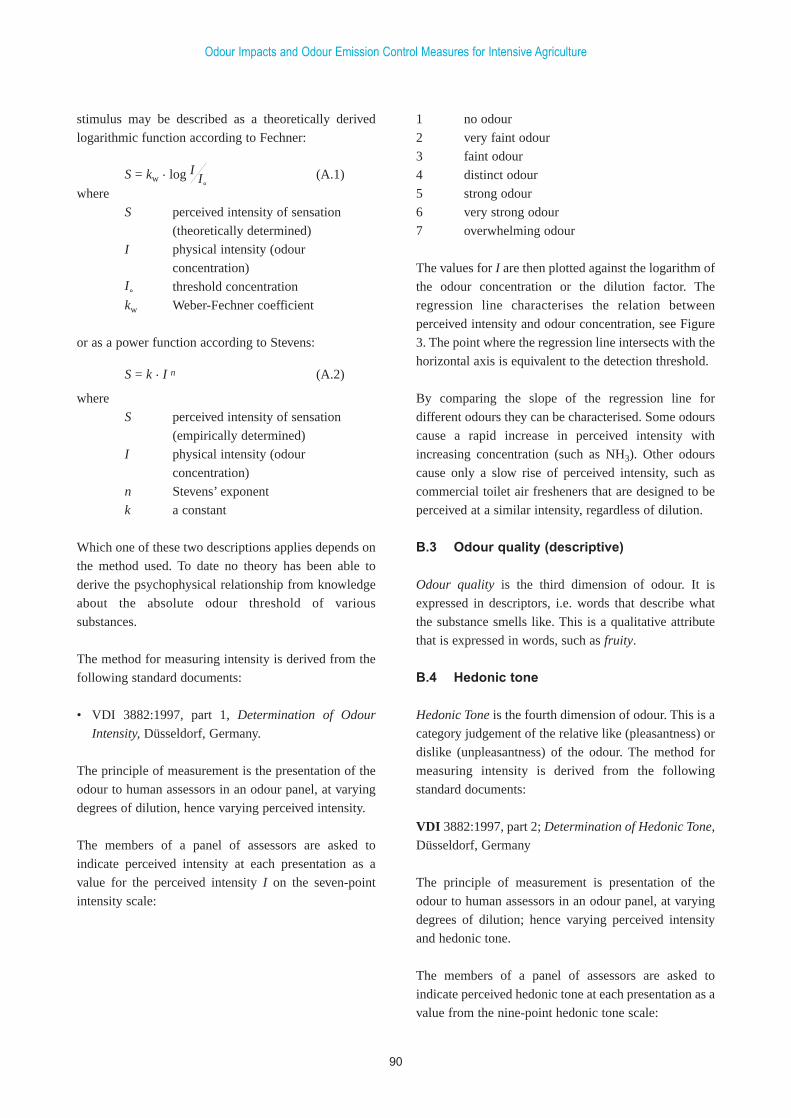
stimulus may be described as a theoretically derived
logarithmic function according to Fechner:
where
S perceived intensity of sensation
(theoretically determined)
I physical intensity (odour
concentration)I˚
threshold concentration
kw Weber-Fechner coefficient
or as a power function according to Stevens:
where
S perceived intensity of sensation
(empirically determined)
I physical intensity (odour
concentration)
n Stevens’ exponent
k a constant
Which one of these two descriptions applies depends on
the method used. To date no theory has been able to
derive the psychophysical relationship from knowledge
about the absolute odour threshold of various
substances.
The method for measuring intensity is derived from the
following standard documents:
• VDI 3882:1997, part 1, Determination of Odour
Intensity, Düsseldorf, Germany.
The principle of measurement is the presentation of the
odour to human assessors in an odour panel, at varying
degrees of dilution, hence varying perceived intensity.
The members of a panel of assessors are asked to
indicate perceived intensity at each presentation as a
value for the perceived intensity I on the seven-point
intensity scale:
1 no odour
2 very faint odour
3 faint odour
4 distinct odour
5 strong odour
6 very strong odour
7 overwhelming odour
The values for I are then plotted against the logarithm of
the odour concentration or the dilution factor. The
regression line characterises the relation between
perceived intensity and odour concentration, see Figure
3. The point where the regression line intersects with the
horizontal axis is equivalent to the detection threshold.
By comparing the slope of the regression line for
different odours they can be characterised. Some odours
cause a rapid increase in perceived intensity with
increasing concentration (such as NH3). Other odours
cause only a slow rise of perceived intensity, such as
commercial toilet air fresheners that are designed to be
perceived at a similar intensity, regardless of dilution.
B.3 Odour quality (descriptive)
Odour quality is the third dimension of odour. It is
expressed in descriptors, i.e. words that describe what
the substance smells like. This is a qualitative attribute
that is expressed in words, such as fruity.
B.4 Hedonic tone
Hedonic Tone is the fourth dimension of odour. This is a
category judgement of the relative like (pleasantness) or
dislike (unpleasantness) of the odour. The method for
measuring intensity is derived from the following
standard documents:
VDI 3882:1997, part 2; Determination of Hedonic Tone,
Düsseldorf, Germany
The principle of measurement is presentation of the
odour to human assessors in an odour panel, at varying
degrees of dilution; hence varying perceived intensity
and hedonic tone.
The members of a panel of assessors are asked to
indicate perceived hedonic tone at each presentation as a
value from the nine-point hedonic tone scale:
Odour Impacts and Odour Emission Control Measures for Intensive Agriculture
90
S = kw. log I I
˚(A.1)
S = k . I n (A.2)
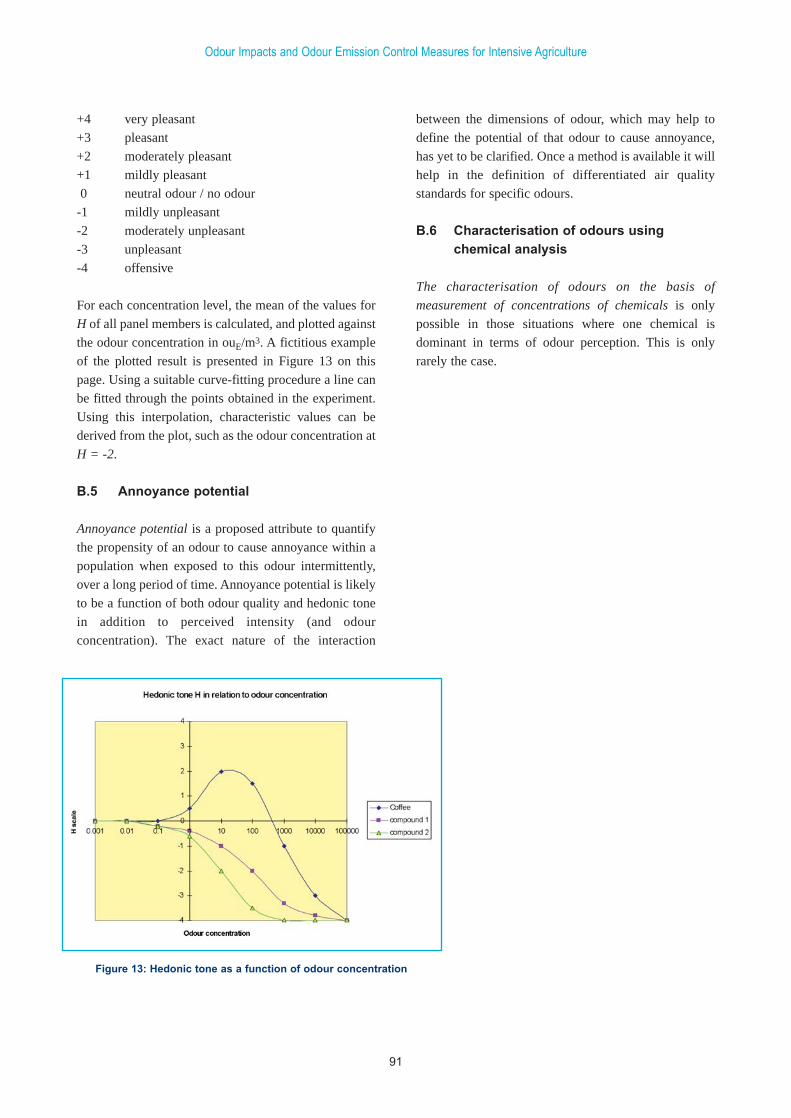
+4 very pleasant
+3 pleasant
+2 moderately pleasant
+1 mildly pleasant
0 neutral odour / no odour
-1 mildly unpleasant
-2 moderately unpleasant
-3 unpleasant
-4 offensive
For each concentration level, the mean of the values for
H of all panel members is calculated, and plotted against
the odour concentration in ouE/m3. A fictitious example
of the plotted result is presented in Figure 13 on this
page. Using a suitable curve-fitting procedure a line can
be fitted through the points obtained in the experiment.
Using this interpolation, characteristic values can be
derived from the plot, such as the odour concentration at
H = -2.
B.5 Annoyance potential
Annoyance potential is a proposed attribute to quantify
the propensity of an odour to cause annoyance within a
population when exposed to this odour intermittently,
over a long period of time. Annoyance potential is likely
to be a function of both odour quality and hedonic tone
in addition to perceived intensity (and odour
concentration). The exact nature of the interaction
between the dimensions of odour, which may help to
define the potential of that odour to cause annoyance,
has yet to be clarified. Once a method is available it will
help in the definition of differentiated air quality
standards for specific odours.
B.6 Characterisation of odours using chemical analysis
The characterisation of odours on the basis of
measurement of concentrations of chemicals is only
possible in those situations where one chemical is
dominant in terms of odour perception. This is only
rarely the case.
Odour Impacts and Odour Emission Control Measures for Intensive Agriculture
91
Figure 13: Hedonic tone as a function of odour concentration

Odour Impacts and Odour Emission Control Measures for Intensive Agriculture
92
accuracy: Closeness of agreement between test result
and the accepted reference value.
(sensory) adaptation: Temporary modification of the
sensitivity of a sense organ due to continued and/or
repeated stimulation. [ISO 5492:1992]
amenity: The quality of being pleasing or agreeable in
situation, prospect, disposition etc. [Websters
Encyclopedic Unabridged Dictionary]
anosmia: Lack of sensitivity to olfactory stimuli. [ISO
5492:1992]
assessor: Somebody who participates in odour testing.
Best Available Technique (BAT) The most effective and
advanced stage in the development of activities and their
methods of operation which indicate the practical
suitability of particular techniques for providing in
principle the basis for emission limit values designed to
prevent and, where it is not practicable, generally to
reduce emissions and the impact on the environment as
a whole.
• "Techniques" include both the technology used and
the way in which the installation is designed, built,
maintained, operated and decommissioned.
• "Available" techniques mean those developed on a
scale which allows implementation in the relevant
industrial sector, under economically and technically
viable conditions, taking into consideration the costs
and advantages, whether or not the techniques are
used or produced inside the Member State in
question, as long as they are reasonably accessible to
the operator.
• "Best" means most effective in achieving a high
general level of protection of the environment as a
whole. [IPPC directive 96/61, 1996, article 2, sub
11]
detection threshold, (for a reference material): The
odourant concentration which has a probability of 0.5 of
being detected under the conditions of the test.
detection threshold (for an environmental sample): The
dilution factor at which the sample has a probability of
0.5 of being detected under the conditions of the test.
diffuse sources: Sources with defined dimensions
(mostly surface sources) which do not have a defined
waste air flow, such as waste dumps, lagoons, fields after
manure spreading, non-aerated compost piles.
dilution factor: The dilution factor is the ratio between
flow or volume after dilution and the flow or volume of
the odorous gas. [AFNOR X 43-104E, see bibliography,
Appendix J]
dynamic olfactometer: A dynamic olfactometer
delivers a flow of mixtures of odorous and neutral gas
with known dilution factors to a common outlet.
[AFNOR X 43-101E, modified, see bibliography,
Appendix J]
dynamic olfactometry: Olfactometry using a dynamic
olfactometer
emission factor: The emission per unit product. (e.g. for
wastewater treatment works expressed in this report the
emission rate in ouE/s per kg BOD, in screened sewage)
European odour unit, ouE/m3 : That amount of
odourant(s) that, when evaporated into 1 cubic metre of
neutral gas at standard conditions, elicits a physiological
response from a panel (detection threshold) equivalent
to that elicited by one European Reference Odour Mass
(EROM), evaporated in one cubic metre of neutral gas at
standard conditions
European Reference Odour Mass , EROM : The
accepted reference value for the European odour unit,
equal to a defined mass of a certified reference material.
One EROM is equivalent to 123 µg n-butanol (CAS 71-
36-3). Evaporated in 1 cubic metre of neutral gas this
produces a concentration of 0.040 µmol/mol.
Odour Impacts and Odour Emission Control Measures for Intensive Agriculture
93
Annex C. Glossary
forced choice method: For this standard the following
definition applies: An olfactometric method in which
assessors are forced to make a choice out of two or more
air flows, one of which is the diluted sample, even if no
difference is observed.
fugitive sources: Elusive or difficult to identify sources
releasing undefined quantities of odourants e.g. valve
and flange leakage, passive ventilation apertures etc.
hedonic tone: attribute of an odour, indicating like or
dislike
individual threshold estimate, ITE : The detection
threshold applying to an individual estimated on the
basis of one dilution series.
lower detection limit, LDL : Lowest value of the air
quality characteristic which, with 95% probability, can
be distinguished from a zero sample [ISO 6879].
neutral gas : Air or nitrogen that is treated in such a way
that it is as odourless as possible and that does,
according to panel members, not interfere with the
odour under investigation.
Safety Warning: Nitrogen is only used to predilute the
sample itself. For the olfactometer the neutral gas used
to dilute the sample and present a reference shall be air.
objective method: Any method in which the effects of
personal opinions are minimised. [ISO 5492]
odourant— A substance which stimulates a human
olfactory system so that an odour is perceived.
odourant flow rate: The odourant flow rate is the
quantity of odorous substances passing through a
defined area at each time unit. It is the product of the
odour concentration cod and the outlet velocity v and the
outlet area A or the product of the odour concentration
cod and the pertinent volume flow rate V&. Its unit is
ouE/h (or ouE/min or ouE/s, respectively.)
Note: The odourant (emission) flow rate is the quantity equivalent to
the emission mass or volume flow rate, for example in dispersion
models.
odorous gas: Gas that contains odourants.
odour: Organoleptic attribute perceptible by the
olfactory organ on sniffing certain volatile substances.
[ISO 5492]
odour abatement efficiency: The reduction of the
odour concentration or the odourant flow rate due to an
abatement technique, expressed as a fraction (or
percentage) of the odour concentration in the odourant
flow rate of the untreated gas stream.
odour concentration: The number of European odour
units in a cubic metre of gas at standard conditions.
Note: The odour concentration is not a linear measure for the intensity
of an odour. Steven’s Law describes the a-linear relation between
odour stimulus and its perceived intensity. When using odour
concentrations in dispersion modelling, the issue is complicated by the
effects of the averaging time of the dispersion model, further
complicating the use of the odour concentration as a direct measure for
dose. To define a ‘no nuisance level’, the entire method of dosage
evaluation, including the dispersion model, will yield a ‘dose’. The
relation between this ‘dose’ and its effect (odour annoyance) should be
validated in practical situations to be a useful predictive tool for
occurrence of odour nuisance.
odour detection: To become aware of the sensation
resulting from adequate stimulation of the olfactory
system.
odour panel: See panel.
odour sensitive receptor: The closest fixed building or
installation where odour annoyance may occur, such as
residential homes, school, hospital, overnight facility for
holidays etc.
odour threshold: See panel threshold.
odour unit: See European Odour Unit
olfactometer: Apparatus in which a sample of odorous
gas is diluted with neutral gas in a defined ratio and
presented to assessors.
olfactometry: Measurement of the response of
assessors to olfactory stimuli. [ISO 5492]
olfactory: Pertaining to the sense of smell. [ISO 5492]
Odour Impacts and Odour Emission Control Measures for Intensive Agriculture
94
olfactory receptor: Specific part of the olfactory
system which responds to an odourant. [after ISO 5492]
olfactory stimulus: That which can excite an olfactory
receptor. [ISO 5492, modified]
panel: A group of panel members.
panel member: An assessor who is qualified to judge
samples of odorous gas, using dynamic olfactometry
within the scope of this standard.
panel selection: Procedure to determine which
assessors are qualified as panel members.
panel threshold: Detection threshold applying to a
panel.
perception: Awareness of the effects of single or
multiple sensory stimuli. [ISO 5492]
population (detection) threshold: Detection threshold
applying to the general population, if this population is
not specified.
proficiency testing: The system for objectively testing
laboratory results by an external agency.
quality: The totality of features and characteristics of a
product or service that bear on its ability to satisfy stated
or implied needs. [ISO 6879]
quality assurance: All those planned and systematic
actions necessary to provide adequate confidence that a
product, process or service will satisfy given
requirements for quality. [ISO 6879]
recognition threshold: The odour concentration which
has a probability of 0.5 of being recognised under the
conditions of the test (definition not applied in this
standard).
repeatability: Precision under repeatability conditions.
[ISO 5725-part 1]
repeatability conditions: Conditions where
independent test results are obtained with the same
method on identical test material in the same laboratory
by the same operator using the same equipment within
short intervals of time. [ISO 5725-part 1]
reproducibility: Precision under reproducibility
conditions. [ISO 5725-part 1]
reproducibility conditions: Conditions where test
results are obtained with the same method on identical
test material in different laboratories with different
operators using different equipment. [ISO 5725-part 1]
sensitive receptor: see odour sensitive receptor:
sensory fatigue: Form of adaptation in which a decrease
in sensitivity occurs. [ISO 5492]
to smell: To detect or to attempt to detect an odourant.
specific emission rate: The emission rate per unit of
area of liquid or solid
standard conditions for olfactometry: At room
temperature (293 K), normal atmospheric pressure
(101.3 kPa) on a wet basis [as in ISO 10780].
Note: This applies both to olfactometric measurements and volume
flow rates of emissions.
static olfactometer: A static olfactometer dilutes by
mixing two known volumes of gas, odorous and
odourless, respectively. The rate of dilution is calculated
from the volumes. [AFNOR X 43-101E, see
bibliography, Appendix J]
step factor: The factor by which each dilution factor in
a dilution series differs from adjacent dilutions.
subjective method: Any method in which the personal
opinions are taken into consideration. [ISO 5492]
substance: Species of matter of definite chemical
composition.
test result: The value of a characteristic obtained by
completely carrying out a specific measurement, once.
volatile organic compound: organic substance that will
readily evaporate from a liquid into gas phase.
Odour Impacts and Odour Emission Control Measures for Intensive Agriculture
95

Odour Impacts and Odour Emission Control Measures for Intensive Agriculture
96
1 Van Harreveld, APh, Schakel, A., Valk, CJ, Vreeburg, S,, Feasibility study for the development of astandardised method for assessment of odour nuisance and odour annoyance potential, Project PD 207Action programme Standardisation and Validation of Environmental Assessment Methods (EnglishSummary, Project Research Amsterdam BV, Amsterdam, 1999. ISBN90-805641-1-7 Electronicallyavailable at www.odournet.com).
2 Oberthür, R., Ein logarithmischer Maßstab mit dB-Einheiten zur Darstellung des Geruchsstoffpegels(translation: a logarithmic measure of odour intensity, using decibel units), Staub - Reinhalt. luft 50, pp.175--183, 1990
3 Miedema, H.M.E., Walpot, J.I., Steunenberg, C.F., Exposure-annoyance relationships for odours fromstationary sources, Atmospheric Environment 34 (2000) 2927-2936, 2000.
4 anon. (2001A), Geurhinderonderzoek Stallen Intensieve Veehouderij (English: Odour annoyance causedby intensive livestock housing), in print, Publication number 010164/h/04-01 22317/209, Ministry ofHousing, Public Planning and the Environment, The Hague, The Netherlands, 2001.
5 Ogink, N.W.M., Klarenbeek, J.V., Evaluation of a standard sampling method for determination of odouremission from animal housing systems and calibration of the Dutch pig odour unit into standardised odourunits, In: Proceedings of the Int. Symposium on Ammonia and Odour Control from Animal ProductionFacilities, NVTL, Rosmalen, Netherlands, 1997.
6 Anzion CJM, Dragt A, Kuijk van AHJ, Post JG, Document meten en rekenen geur (Document onmeasuring and calculating odours), Publikatiereeks Lucht 115, Ministry for Housing, Public Planning andthe Environment (VROM), Den Haag, Netherlands, 1994
7 VDI 3940 Determination of Odorants in Ambient Air by Field Inspections, May 1991
8 Determination and Evaluation of Odour Emissions - Directive on Odour (Feststellung und Beurteilung vonGeruchsimmissionen (Geruchsimmissions-Richtlinie) mit Begründung und Auslegungshinweisen),Laenderausschuss fuer Immissionsschutz, LAI Schriftenreihe No.5, Berlin, 1994
9 Steinheider, B., Both, R., Winneke G., Die Erfassung der Geruchsbelästigung durch Tierstallimmissionenbei Anwohnern (The assessment of odour impact on people living in the vicinity of livestock houses),Gefahrstoffe-Reinhaltung der Luft 58 , 1998.
10 Ogink, N.W.M., Groot Koerkamp, P.W.G., Comparison of odour emissions from animal housing systemeswith low ammonia emission., in: Proceedings of the 1st IWA International Conference on Odour andVOCs: Measurement, Regulation and Control Techniques, University of New South Wales, Sydney,Australia, March 2001, ISBN 0 7 334 1769 8-
11 EN13725 ‘Odour concentration measurement by dynamic olfactometry’, CEN, 1999.
12 Misselbrook TH, Clarkson CR, Pain BF: Relationship Between Concentration and Intensity of Odors forPig Slurry and Broiler Houses. Journal of Agricultural Engineering Research 55: 163-169, 1993.
Odour Impacts and Odour Emission Control Measures for Intensive Agriculture
97
Annex D. References
13 Dravnieks A.., T. Masurat, R.A.Lamm, Hedonics of Odors and Odor Descriptors, Journal of the AirPollution Control Association, Vol.34 no.7, 1984.
14 Valk, CJ, Anzion, C.J.M, van Harreveld, A.Ph., Van Belois, H, Geurhinder: de kwaliteit van debesluitvorming moet verbeteren (Odour annoyance: the quality of decisions in environmentalmanagement must improve), Journal: Lucht, 3, september 1998, ISSN0925-9953
15 NeR Nederlandse Emissie Richtlijn, Hindersystematiek Geur. (Netherlands Emissions Guideline.Framework for odour nuisance), InfoMil, 1996
16 Department of the Environment, Northern Reg. Office, Town and Country Planning Act - Section 78.Appeal by Northumbrian Water Ltd: Land adjacent to Spital Burn, Newbiggin-by-the-Sea,Northumberland, planning reference APP/F2930/A/92 206240, UK, 1993
17 US EPA / Lee Wilson & Associates, Swine Cafo Odors: Guidance for Environmental Impact Assessment,US EPA, 1996
18 van Harreveld, A. Ph. , Klarenbeek, J.V., On the regulations, measurement and abatement of odoursemanating from livestock housing in the Netherlands, In: New Knowledge in Livestock Odour,Proceedings of the International Livestock Odour Conference 1995, pp.16-21, Iowa, USA
19 Van Harreveld, A.Ph., Introduction and Related Practical Aspects of Odour Regulations in theNetherlands: in: Derenzo and Gnyp, TR18, Recent Developments and Current Practices in OdourRegulations, Controls and Technology, AWMA, 1991, ISBN 0-923204-0
20 Inventarisatie Epos; Eindrapport van de eerste fase van het Evaluatie Project OntwerpStankconcentratienormen (EPOS90) (translation: Inventory for Project Evaluation of Provisional OdourConcentration Standards), Ministry of Public Planning and the Environment, 1990.
21 Carney, P.G., Dodd, V.A., The Measurement of Agricultural Malodours, J. Agric. Engng. Res. (1989) 43,197-209.
22 VDI3471:1986 Emission control - Livestock Management - Pigs (Emissionsminderung - Tierhaltung -Schweine), VDI Handbuch Reinhaltung der Luft, Band 3, Beuth Verlag, Jun 1986
23 NMP 1 Nationaal Milieubeleidsplan I,(National Environmental Plan), Ministry of Housing, Public Planningand the Environment, Den Haag, Netherlands, 1988.
24 Beoordelingsrichtlijn in het kader van Groen Label Stallen (Guideline for the assessment of Green Labellivestock housing systems), ed. 1996, Ministry of Housing, Public Planning and the Environment and theMinistry of Agriculture, The Hague, Netherlands, 1996.
25 Brochure Veehouderij en Hinderwet (Brochure Livestock rearing and nuisance law), Staatsuitgeverij, DenHaag, The Netherlands, 1976
26 EPA, Guideline on air quality models (revised), july 1986, EPA, EPA-450/2-78-027R.
27 EPA, User's guide to MPTER: a Multiple Point Gaussian dispersion algorithm with optional TERrainAdjustment, April 1980, EPA, EPA-600/8-80-016
Odour Impacts and Odour Emission Control Measures for Intensive Agriculture
98
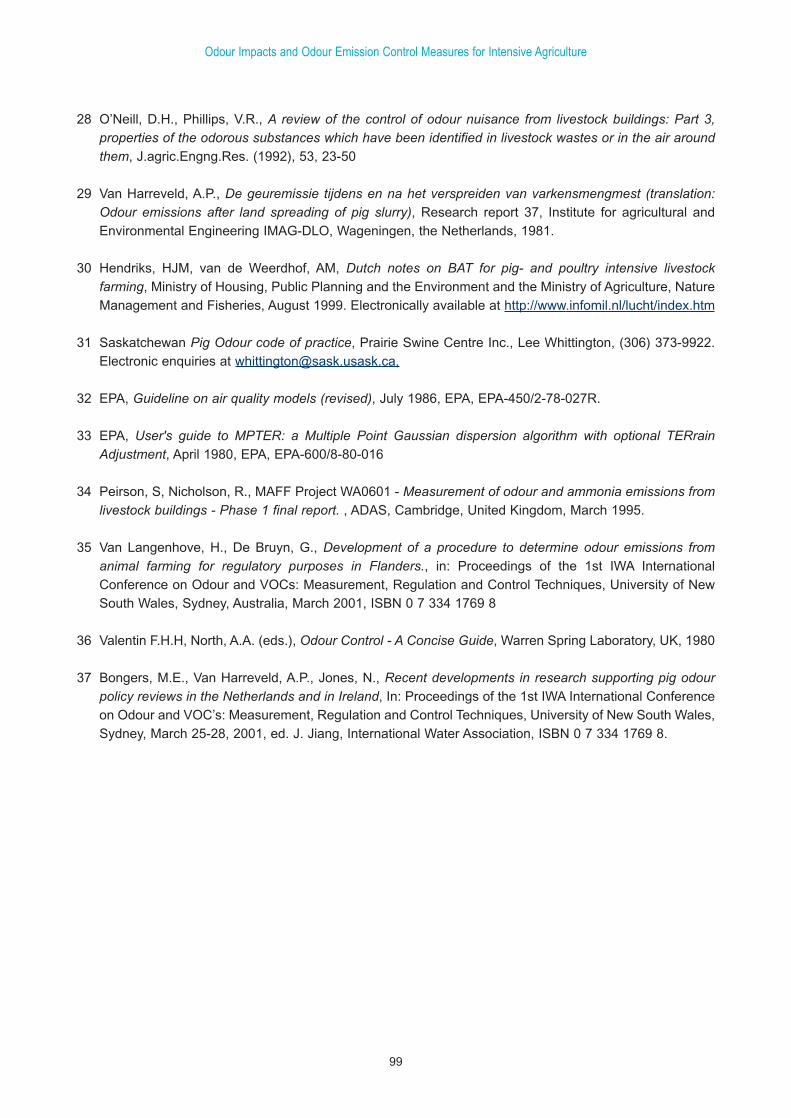
28 O’Neill, D.H., Phillips, V.R., A review of the control of odour nuisance from livestock buildings: Part 3,properties of the odorous substances which have been identified in livestock wastes or in the air aroundthem, J.agric.Engng.Res. (1992), 53, 23-50
29 Van Harreveld, A.P., De geuremissie tijdens en na het verspreiden van varkensmengmest (translation:Odour emissions after land spreading of pig slurry), Research report 37, Institute for agricultural andEnvironmental Engineering IMAG-DLO, Wageningen, the Netherlands, 1981.
30 Hendriks, HJM, van de Weerdhof, AM, Dutch notes on BAT for pig- and poultry intensive livestockfarming, Ministry of Housing, Public Planning and the Environment and the Ministry of Agriculture, NatureManagement and Fisheries, August 1999. Electronically available at http://www.infomil.nl/lucht/index.htm
31 Saskatchewan Pig Odour code of practice, Prairie Swine Centre Inc., Lee Whittington, (306) 373-9922.Electronic enquiries at [email protected],
32 EPA, Guideline on air quality models (revised), July 1986, EPA, EPA-450/2-78-027R.
33 EPA, User's guide to MPTER: a Multiple Point Gaussian dispersion algorithm with optional TERrainAdjustment, April 1980, EPA, EPA-600/8-80-016
34 Peirson, S, Nicholson, R., MAFF Project WA0601 - Measurement of odour and ammonia emissions fromlivestock buildings - Phase 1 final report. , ADAS, Cambridge, United Kingdom, March 1995.
35 Van Langenhove, H., De Bruyn, G., Development of a procedure to determine odour emissions fromanimal farming for regulatory purposes in Flanders., in: Proceedings of the 1st IWA InternationalConference on Odour and VOCs: Measurement, Regulation and Control Techniques, University of NewSouth Wales, Sydney, Australia, March 2001, ISBN 0 7 334 1769 8
36 Valentin F.H.H, North, A.A. (eds.), Odour Control - A Concise Guide, Warren Spring Laboratory, UK, 1980
37 Bongers, M.E., Van Harreveld, A.P., Jones, N., Recent developments in research supporting pig odourpolicy reviews in the Netherlands and in Ireland, In: Proceedings of the 1st IWA International Conferenceon Odour and VOC’s: Measurement, Regulation and Control Techniques, University of New South Wales,Sydney, March 25-28, 2001, ed. J. Jiang, International Water Association, ISBN 0 7 334 1769 8.
Odour Impacts and Odour Emission Control Measures for Intensive Agriculture
99

Odour Impacts and Odour Emission Control Measures for Intensive Agriculture
100
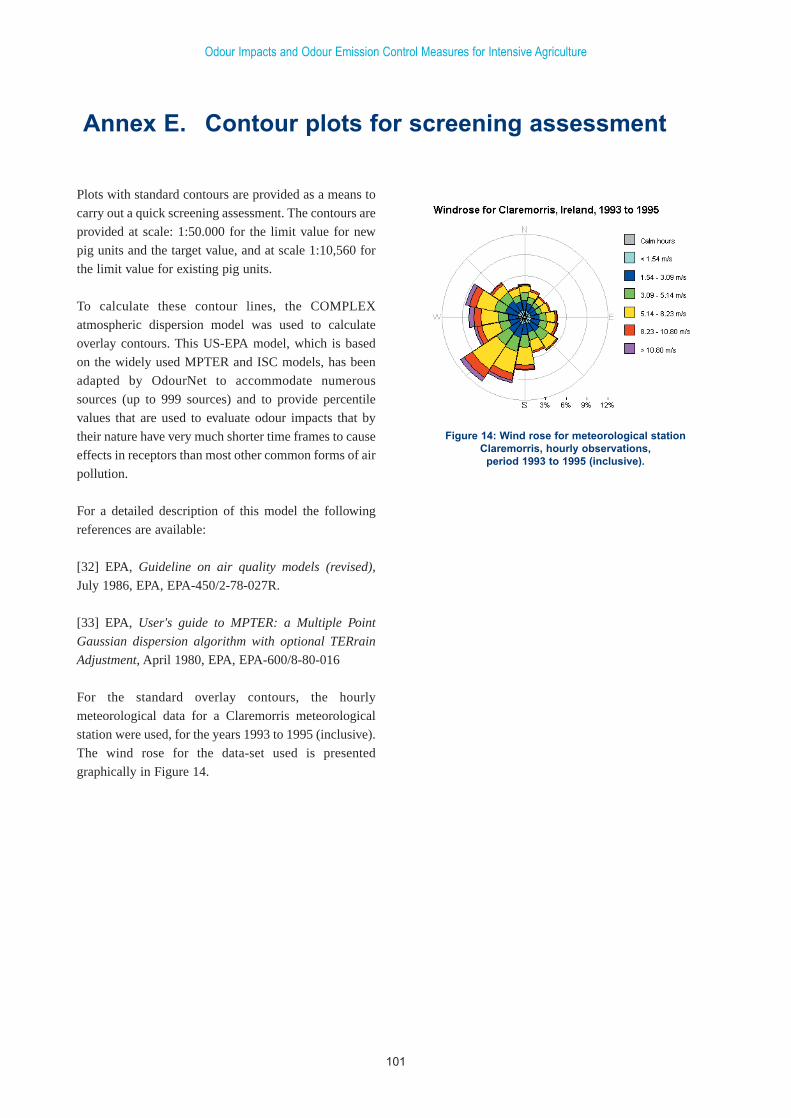
Figure 14: Wind rose for meteorological stationClaremorris, hourly observations,
period 1993 to 1995 (inclusive).
Plots with standard contours are provided as a means to
carry out a quick screening assessment. The contours are
provided at scale: 1:50.000 for the limit value for new
pig units and the target value, and at scale 1:10,560 for
the limit value for existing pig units.
To calculate these contour lines, the COMPLEX
atmospheric dispersion model was used to calculate
overlay contours. This US-EPA model, which is based
on the widely used MPTER and ISC models, has been
adapted by OdourNet to accommodate numerous
sources (up to 999 sources) and to provide percentile
values that are used to evaluate odour impacts that by
their nature have very much shorter time frames to cause
effects in receptors than most other common forms of air
pollution.
For a detailed description of this model the following
references are available:
[32] EPA, Guideline on air quality models (revised),
July 1986, EPA, EPA-450/2-78-027R.
[33] EPA, User's guide to MPTER: a Multiple Point
Gaussian dispersion algorithm with optional TERrain
Adjustment, April 1980, EPA, EPA-600/8-80-016
For the standard overlay contours, the hourly
meteorological data for a Claremorris meteorological
station were used, for the years 1993 to 1995 (inclusive).
The wind rose for the data-set used is presented
graphically in Figure 14.
Odour Impacts and Odour Emission Control Measures for Intensive Agriculture
101
Annex E. Contour plots for screening assessment
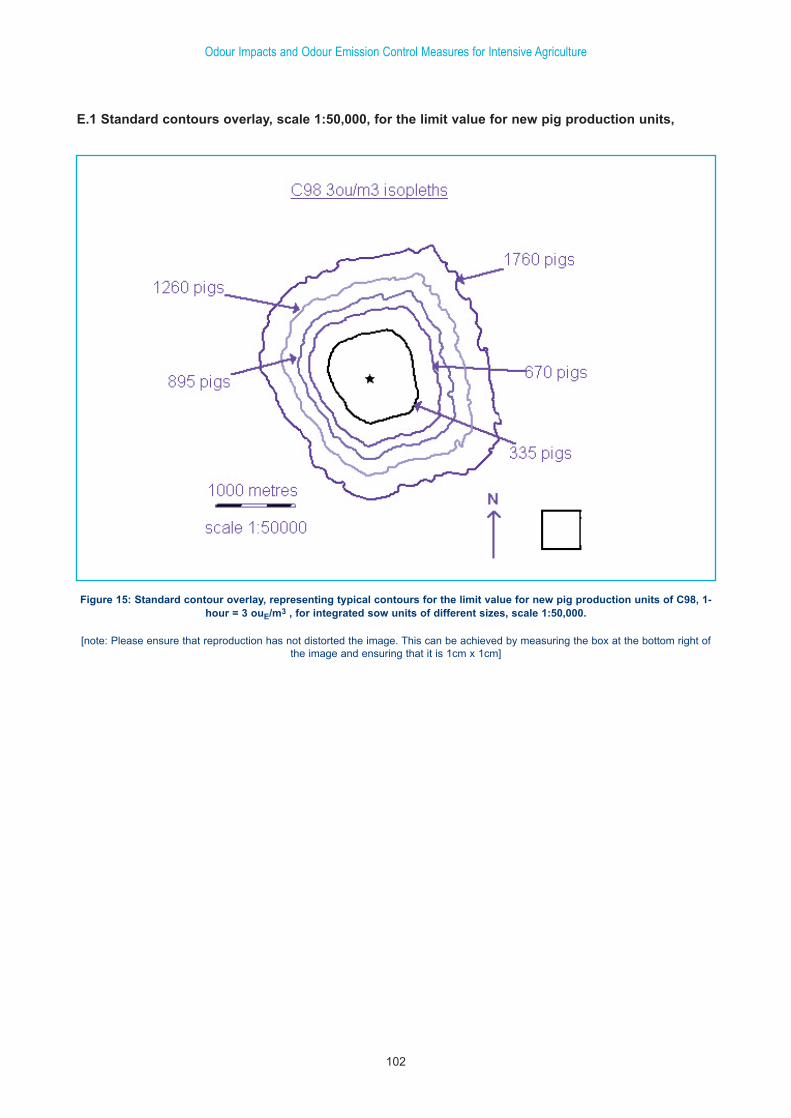
Odour Impacts and Odour Emission Control Measures for Intensive Agriculture
102
Figure 15: Standard contour overlay, representing typical contours for the limit value for new pig production units of C98, 1-hour = 3 ouE/m3 , for integrated sow units of different sizes, scale 1:50,000.
[note: Please ensure that reproduction has not distorted the image. This can be achieved by measuring the box at the bottom right ofthe image and ensuring that it is 1cm x 1cm]
E.1 Standard contours overlay, scale 1:50,000, for the limit value for new pig production units,
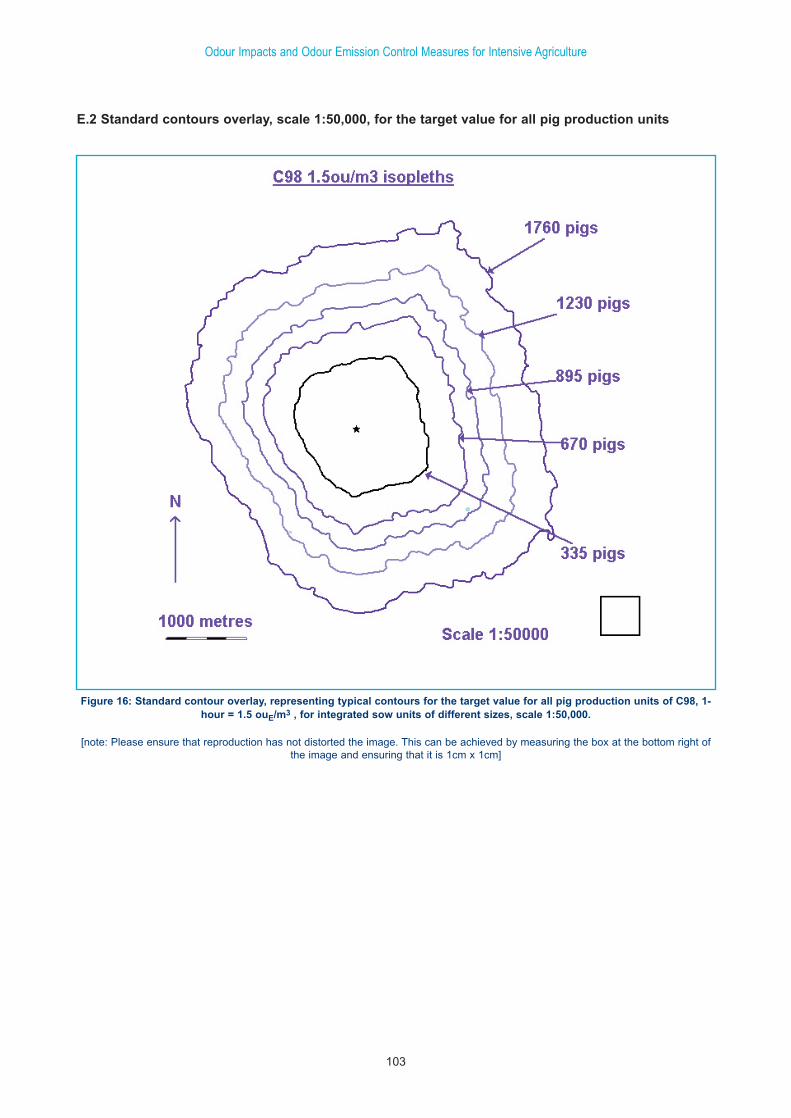
Odour Impacts and Odour Emission Control Measures for Intensive Agriculture
103
Figure 16: Standard contour overlay, representing typical contours for the target value for all pig production units of C98, 1-hour = 1.5 ouE/m3 , for integrated sow units of different sizes, scale 1:50,000.
[note: Please ensure that reproduction has not distorted the image. This can be achieved by measuring the box at the bottom right ofthe image and ensuring that it is 1cm x 1cm]
E.2 Standard contours overlay, scale 1:50,000, for the target value for all pig production units
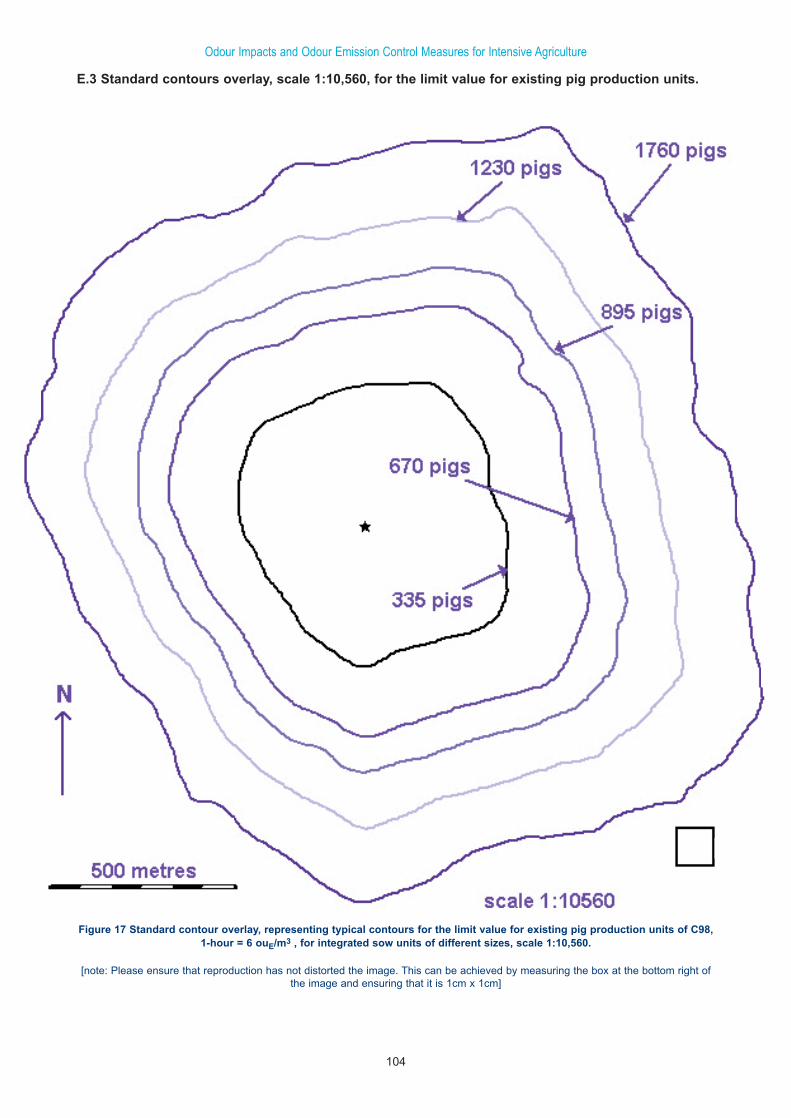
Odour Impacts and Odour Emission Control Measures for Intensive Agriculture
104
Figure 17 Standard contour overlay, representing typical contours for the limit value for existing pig production units of C98,1-hour = 6 ouE/m3 , for integrated sow units of different sizes, scale 1:10,560.
[note: Please ensure that reproduction has not distorted the image. This can be achieved by measuring the box at the bottom right ofthe image and ensuring that it is 1cm x 1cm]
E.3 Standard contours overlay, scale 1:10,560, for the limit value for existing pig production units.
ODOUR IMPACTS AND ODOUR EMISSIONCONTROL MEASURES
FOR INTENSIVE AGRICULTURE
Part B Case studies assessing the odour emissions and impact oftwo pig production units in the Irish Situation
© Environmental Protection Agency 2001
All or part of this publication may be reproduced without further permission, provided thesource is acknowledged.
Although every effort has been made to ensure the accuracy of the material contained in thispublication, complete accuracy cannot be guaranteed. Neither the Environmental ProtectionAgency nor the author(s) accept any responsibility whatsoever for loss or damage occasionedor claimed to have been occasioned, in part or in full, as a consequence of any person acting,
or refraining from acting, as a result of a matter contained in this publication.
Project informationThis report was commissioned by:Environmental Protection Agency
Johnstown Castle Estate, Wexford, IrelandContact: Dr. Vera Power / Dr. Tom Stafford
and was issued by:OdourNet UK Ltd
5 St Margaret’s Street, Bradford-on-Avon, Bath BA15 1DAContacts: Mr. Ton van Harreveld, Mr. Matt Stoaling
Copyright notice© OdourNet UK Ltd, 2000.Sources of information used
The following sources of information were among those used in preparing this report:• Scale site plans provided by farm representatives
• Information collected during site survey by Odournet consultants• The draft report of the Dutch IMAG data
AcknowledgementsThe authors wish to thank the owners and operators of farms A and B, the officers involved
and all others who provided the information on which this report is based,for their cooperation.
Contents
1. SCOPE OF STUDY. . . . . . . . . . . . . . . . . . . . . . . . . . . . . . . . . . . . . . . . . . . . . . . . . . . . . . . . . . . . . . . . . . . 3
2. DETAILED DESCRIPTION OF APPROACH AND METHODOLOGY . . . . . . . . . . . . . . . . . . . . . . . . . . . 5
3. RESULTS . . . . . . . . . . . . . . . . . . . . . . . . . . . . . . . . . . . . . . . . . . . . . . . . . . . . . . . . . . . . . . . . . . . . . . . . . . 9
4. DISCUSSION OF THE RESULTS OF ATMOSPHERIC DISPERSION MODELLING
OF THE EXISTING SITUATION . . . . . . . . . . . . . . . . . . . . . . . . . . . . . . . . . . . . . . . . . . . . . . . . . . . . . . . 15
5. OPTIONS FOR REDUCING THE ODOUR IMPACT. . . . . . . . . . . . . . . . . . . . . . . . . . . . . . . . . . . . . . . . 17
6. CONCLUSIONS . . . . . . . . . . . . . . . . . . . . . . . . . . . . . . . . . . . . . . . . . . . . . . . . . . . . . . . . . . . . . . . . . . . . 21
7. ANNEX: SUMMARY OF LARGE-SCALE SURVEY TO ESTABLISH PIG ODOUR
EMISSION FACTORS IN THE NETHERLANDS. . . . . . . . . . . . . . . . . . . . . . . . . . . . . . . . . . . . . . . . . . . 23
8. ANNEX: REFERENCES. . . . . . . . . . . . . . . . . . . . . . . . . . . . . . . . . . . . . . . . . . . . . . . . . . . . . . . . . . . . . . 25
9. ANNEX: FIGURES. . . . . . . . . . . . . . . . . . . . . . . . . . . . . . . . . . . . . . . . . . . . . . . . . . . . . . . . . . . . . . . . . . 27

Odour Impacts and Odour Emission Control Measures for Intensive Agriculture
The Environmental Protection Agency has initiated a
study into Odour Impacts and Odour Emission Control
Measures for Intensive Agriculture, with the objective to
assist the Agency in formulating its approach for
processing the license applications with a view to
achieving transparent and uniform decision-making.
In the course of this project two case studies were
conducted to assess the odour impact of pig production
units in the Irish context. At these locations odour
emission measurements were conducted and dispersion
modelling was used to assess the odour impact.
Abatement options were considered to reduce the
impact.
The objectives of these case studies was:
• To illustrate the approach as outlined the main
Agency study Odour Impacts and Odour Emission
Control Measures for Intensive Agriculture
• To obtain a limited set of emission measurements for
Irish conditions, to assess whether these are
significantly different from the distribution of results
found in the much larger data set from the
Netherlands[5, 10].
The case studies were not intended to provide a
representative overview representative for most Irish pig
units. The scope of the case studies and is too limited to
do so. Similarly, the scale of the emission measurements
was not sufficient to yield specific emission factors for
Irish conditions.
The case studies prompted the following conclusions:
Conclusions on the results of finisher emission ratemeasurements in Ireland
The emission rate of 13.2 ouE/s per finisher measured in
Ireland for this study in winter conditions is about one
third lower than the annual mean value of 22.6 ouE/s per
finisher found in a larger study in the Netherlands
Given the relatively small number of samples, collected
in the Irish study, and the statistical variance as derived
from the larger Dutch study, the difference in the mean
outcome is too small to be statistically significant.
Therefore, it is justified to use the emission factors
derived in the Netherlands for emission estimates in
Ireland, as long as emission factors specifically
measured in Irish conditions are not available for a
larger sample of study sites.
Odour impact study Farm A
Farm A is a large integrated unit, containing over 17000
animals. It is therefore no surprise that total emissions
are high, and the odour footprint relatively large.
However, given the locality of the farm - its distance
from residential units and its rural context, there seems
to be no urgency as no complaints have been registered.
The only concerns resulting from the site visits were the
uncovered slurry store and carcass skips. It is the
opinion of Odournet UK that these sources may become
a significant emitter of odours during the warmth of
summer. However, having undertaken sampling during a
cool spring day, there is no quantitative data to support
this.
The modelling shows that in the current situation a
limited number of (ten) dwellings may be affected by
odour impacts in excess of the limit value. It is therefore
necessary to seriously consider options to reduce
emissions. In the short-term measures to reduce
emissions from sludge storage should be considered. In
the longer term, replacement of housing assets could
reduce the number of dwellings exposed to odour
impacts in excess of the limit value, conceivably to zero.
The target value will be difficult to attain for farm A. The
farm can be made sustainable at current stock levels,
from the perspective of odour impact, provided that the
community recognises and accepts the rural context in
the vicinity.
Odour impact study Farm B
Farm B is a relatively small-scale operation. Under
current circumstances, four properties fall within the
odour footprint and therefore may be affected by odour
Odour Impacts and Odour Emission Control Measures for Intensive Agriculture
1
Executive Summary

impacts in excess of the limit value. This farm would
require to consider the implementation of abatement
options if current stock numbers are maintained.
In the long term, a reduction of odour emissions should
be considered when normal renewal of pig housing
assets becomes an issue. This could achieve attainment
of the limit value for all dwellings in the vicinity, and
possibly create room for some growth of stock when the
agricultural context of the area is recognised and
accepted as the status quo.
Odour Impacts and Odour Emission Control Measures for Intensive Agriculture
2
1.1 Scope
The Environmental Protection Agency has initiated a
study into Odour Impacts and Odour Emission Control
Measures for Intensive Agriculture, with the objective to
assist the Agency in formulating its approach for
processing the license applications with a view to
achieving transparent and uniform decision-making.
In the course of this project two case studies were
conducted to assess the odour impact of pig production
units in the Irish context. At these locations odour
emission measurements were conducted and dispersion
modelling was used to assess the odour impact.
Abatement options were considered to reduce the
impact.
The objectives of these case studies was:
• To illustrate the approach as outlined the main
Agency study Odour Impacts and Odour Emission
Control Measures for Intensive Agriculture (Part A)
• To obtain a limited set of emission measurements for
Irish conditions, to assess whether these are
significantly different from the distribution of results
found in the much larger data set from the
Netherlands[5, 10].
The case studies were not intended to provide a
representative overview representative for most Irish pig
units.
Similarly, the scale of the emission measurements was
not sufficient to yield specific emission factors for Irish
conditions. The aim was limited to assessing whether the
results found in this limited study can be considered to
fall within the distribution of the data found in the much
larger study in the Netherlands.
The operational practice in pig production in Ireland is
different in a number of aspects from practices in the
Netherlands, as are the environmental conditions, see
also section 7. These differences are not likely to cause
significantly different odour emissions. Of course it
would be preferable to have emission factors specifically
obtained for Irish conditions. However, if reliable
specific emission factors for Irish production practice
are required, a much larger programme of odour
emission measurements is required.
The case studies were conducted at three sites, and the
characteristics summarised below:
• Case A: a large integrated pig unit, with
approximately 1000 sows in fully slatted pig houses
• Case B: a medium sized integrated pig unit, with
approximately 590 sows in fully slatted pig houses
The case study reports were prepared on the basis of
information provided by the client, the Environmental
Protection Agency and observations made during a site
visit by the authors to the two farms in question. Odour
samples were taken at representative locations and
analysed at the Odournet odour laboratory in Bradford-
on-Avon.
1.1.1 Study objectives
The study aimed to achieve the following objectives:
1 Assess the local situation during two site visits;
2 Determine appropriate sampling locations and
numbers;
3 Collect samples and analyse in the Odournet UK
laboratory.
4 Compare these the measured emissions in this limited
sample relative to the distribution of results of the
Dutch data. These have been used as the basis of
emission estimates in the general background study.
5 Estimate the potential impact of the pig production
units on any nearby residential properties;
6 Identify financially viable options for reducing the
odour impact of the production units.
Odour Impacts and Odour Emission Control Measures for Intensive Agriculture
3
1. Scope of study

Odour Impacts and Odour Emission Control Measures for Intensive Agriculture
4
2.1 Approach
This study can be regarded as having two distinct aims:
1. Limited measurement of emission rates to assess
whether results in Ireland lie within the range of data
from a larger study in the Netherlands
2. Detailed odour emission estimate and odour
dispersion model study for each of the two farms
The results of these distinct parts of the study will be
discussed in separate sections in the Results section
2.2 Limited measurement of emission rates for pigs
2.2.1 Objectives and approach to sampling
The purpose of the sampling was principally to collect
data for comparison with odour emissions rates
measured at similar pig units in the Netherlands. As the
contribution of fatteners to the total odour emissions is
the largest, during the rearing process, odour sampling
was principally concentrated within fattening houses.
In addition a limited number of samples was collected to
determine the emission rate from external uncovered
sludge storage facilities.
The sampling took the following relevant factors into
account:
• Sample timing - One day of sampling was carried
out at each of the two farms. At each farm samples
were taken from several groups of fatteners. The
groups varied from one another in age and
consequently average live weight of each group.
• Time of the day - Due to the necessity to collect all
number of samples within one day, and transport the
samples for analysis the following day, sampling was
carried out between 07.30am and 3.00pm.
• Ventilation - The ventilation rate was measured at
regular intervals during the collection of each sample.
The velocity within each extract duct from the room
being sampled was measured using a hot wire
anemometer. A number of the ducts were fitted with
large manually adjustable dampers, these resulted in
uneven airflow through the ducts and made precise
measurement difficult to achieve.
• Other Parameters - Ambient temperature and wind
speed/direction were recorded at each site.
2.2.2 Odour sampling and analysis
Odour concentration was determined according to the
EN13725 Odour concentration measurement by
dynamic olfactometry[11] and results expressed in odour
units (ouE·m-3).
2.3 Detailed odour impact assessment for the two farms
Initially a model of the sources was constructed on a
geographic information system (GIS), using:
• Site plans,
• Waypoints logged onto a portable Global Positioning
System (GPS)
• Digitised Ordnance Survey 1:50,000 maps (provided
by the Irish EPA)
Then the emissions for each building on the farms were
estimated on the basis of the number of animals and
their size and age, using emission factors that were
established on the basis of extensive measurements in
the Netherlands[5, 10].
Using the estimated emission rates, a source
characterisation model was constructed and used as
input for an atmospheric dispersion model. Combined
with additional input data, such as hourly
meteorological data for a nearby station, and digitised
terrain data (topography), the model was constructed
and applied to establish a first estimate of the
Odour Impacts and Odour Emission Control Measures for Intensive Agriculture
5
2. Detailed description of approach and methodology

environmental impact with regard to odorous emissions.
As in the other studies, meteorological data were used
for the station located at Claremorris, covering the
period 1993 to 1995 (inclusive).
The COMPLEX-1 atmospheric dispersion model was
used, as described in the next section. The model
produces a probability of exceeding a certain hourly
average concentration, at locations where people may be
exposed.
When an annoyance criterion is applied to these results,
a contour can be plotted which contains the area in
which odour annoyance may occur.
A discussion on how the results of odour dispersion
modelling should be interpreted is included in section
2.3.3 below.
2.3.1 The dispersion model used: Complex-I
COMPLEX-1 is an air pollution dispersion model,
which can be used for estimating air pollutant
concentrations in complex terrain. It was originally
developed in the United States by the Environmental
Protection Agency (EPA).
Complex terrain models are normally applied to
stationary sources of gaseous pollutants (like SO2) and
particulates. The model is based on the so-called
Gaussian plume model and it can be used to calculate
one-hour to twenty-four-hour averaged concentrations at
specific receptor points in a complex topography. The
receptor points may be situated below as well as above
stack height.
COMPLEX-1 is based on the MPTER model[27] and
incorporates the plume impaction algorithm of
VALLEY. With COMPLEX-1 computations can be
made for up to 250 point sources and 180 receptors
located within 50 kilometres of the sources[26].
MPTER is most applicable for source-receptor distances
less then 10 kilometres. It can be used in rural as well as
in urban areas, with flat or rolling terrain where a single
wind vector for each hour adequately approximates the
flow over the source and receptor sites. The Terrain
adjustment option of MPTER is limited to receptors
whose elevation is no higher than the lowest stack top
elevation of the sources considered.
COMPLEX-1 is a modification of the MPTER model
that incorporates the plume impaction algorithm of the
VALLEY model. As a result COMPLEX-1 can also
calculate ambient concentrations in situations where
MPTER is not applicable, i.e. at receptors situated at a
level above stack height.
The COMPLEX-1 model calculates and summarises the
individual contribution to the overall emission pattern of
each source, for each hour, at each point in the receptor
grid. This summarised data can then be plotted as
contours of equal odour exposure on a topographic map.
2.3.2 Methodology: Construction of the model of emissions and atmospheric dispersion
The following scenarios are modelled within this study
for Farm A and Farm B:
• Scenario 1: Represents the actual existing situation at
the farms, with mechanical ventilation. Modelling
will encompass ventilation rates based upon those
measured on the day of survey - which will not be
equivalent to those under different climatic
conditions. Emissions will be through the roof vents
at a height of approximately 4m.
• Scenario 2: The situation will be as scenario 1, but
assuming an abatement of 50% (utilising best
practice techniques).
The COMPLEX-1 dispersion model requires 3 distinct
types of input data to run:
• Data concerning the location, physical dimensions,
frequency of activity and odour emission of the
source.
• Local meteorological data.
• Local topographic data.
2.3.2.1 Odour source data
Odournet UK have identified and included all relevant
sources in the odour emission model. Emission rates for
each building were estimated on the basis of the number
Odour Impacts and Odour Emission Control Measures for Intensive Agriculture
6
of animals housed and their life stage, using emission
factors as proposed in the main EPA odour impact study
document, that were derived from a large scale Dutch
study[5, 10], summarised in an Annex, section 7 of this
report. These data were used to construct a model of the
source emissions providing the input data for odour
dispersion modelling.
2.3.2.2 Meteorological data
The COMPLEX-1 model requires hourly averaged
values for wind speed, wind direction and height of the
mixing layer. The mixing layer height enables the
atmospheric stability to be classified into one of six
`Pasquill' categories, ranging from very stable to very
unstable. Unstable conditions are the most favourable
for dispersion of odours in the atmosphere.
Hourly meteorological data for the years 1993 to 1995
(inclusive) recorded at Claremorris were used for the
modelling exercise.
2.3.2.3 Topographic data
We often refer to this as receptor data as it describes the
location of receptors potentially exposed to odours. It
consists of an X,Y,Z grid with an additional parameter H
referring to the height of the receptor above ground (i.e.
nose height).
2.3.3 Interpretation of odour modelling output data
The results of the modelling are presented in the form of
contours or isopleths (lines connecting equal frequency
of occurrence) for: 1.5, 3 and 6 ouE/m3 as a 98
percentile. These contours describe the area associated
with the following proposed air quality criteria:
• Target value: C98, 1-hour < 1.5 ouE·m-3
The target value provides a general level of protection
against odour annoyance for the general public,
aiming to limit the percentage of people experiencing
some form of annoyance to 10% or less. The target
value shall be used as an environmental quality target
for all situations.
The target value is achieved when the calculated
odour exposure for all locations of odour sensitive
receptors is less than an hourly average odour
concentration of 1.5 ouE·m-3 in 98% of all hours in an
average meteorological year.
• Limit value for new pig production units: C98, 1-
hour < 3.0 ouE·m-3
The limit value for new pig production units provides
a minimum level of protection against odour
annoyance, aiming to limit the percentage of those
experiencing some form of annoyance to 10% or less
in a the general public, assuming some degree of
acceptance of the rural nature of their living
environment.
The limit value for new pig production units shall not
be exceeded in the vicinity of new pig production
units to ensure a minimum environmental quality.
The limit value for new pig production units is
complied with when for all locations of odour
sensitive receptors the calculated odour exposure is
less than an hourly average odour concentration of
3.0 ouE·m-3 in 98% of all hours in an average
meteorological year.
• Limit value for existing pig production units: C98,
1-hour < 6.0 ouE·m-3
The limit value for new pig production units provides
a minimum level of protection against odour
annoyance, aiming to limit the percentage of people
experiencing some form of annoyance to 10% or less,
in the most tolerant selection of the population.
The limit value for existing pig production units shall
not be exceeded in the vicinity of existing pig
production units to ensure the minimum
environmental quality in an agricultural setting. A
phased plan must be made to reduce the odour
impact, with time, to the target value.
The limit value for new existing production units is
complied with when for all locations of odour
sensitive receptors the calculated odour exposure is
less than an hourly average odour concentration of
6.0 ouE·m-3 in 98% of all hours in an average
meteorological year.
These criteria are proposed in the main study prepared
for the EPA, and are underpinned by actual dose effect
Odour Impacts and Odour Emission Control Measures for Intensive Agriculture
7
relationships established on the basis of the percentage
of residents annoyed, as determined by telephone
survey[3].
The modelling results cannot be assumed to be an exact
mirror of reality. The model will be less effective in
predicting the actual exposure in a single hour,
especially at distances to the source of less than 100 m.
The models are more effective in predicting the
probability of exposure levels over a large number of
hours, such as the four-year data set of hourly
observations used for this study.
The contours represent the area where the maximum
hourly average ground level concentration will be
greater than 1.5, 3 or 6 ouE·m3 for more than 2 % of the
hours in the year.
The predicted ground level concentrations are above
background concentrations and only relate to odour
originating from the works.
2.3.4 Model of source: odour emission estimation
2.3.4.1 Assumptions used in determining odouremission rate
The following assumptions have been used to model the
emissions for all scenarios.
• The odour concentration is homogeneous within the
building.
• The numbers of pigs as provided by the farm
representatives are accurate, and the animals are
evenly distributed amongst the buildings as
appropriate.
• The situations found during the site survey are
representative of normal operation
• The movement of animals has not been modelled. For
instance, transfer between buildings and delivery /
dispatch.
Odour Impacts and Odour Emission Control Measures for Intensive Agriculture
8
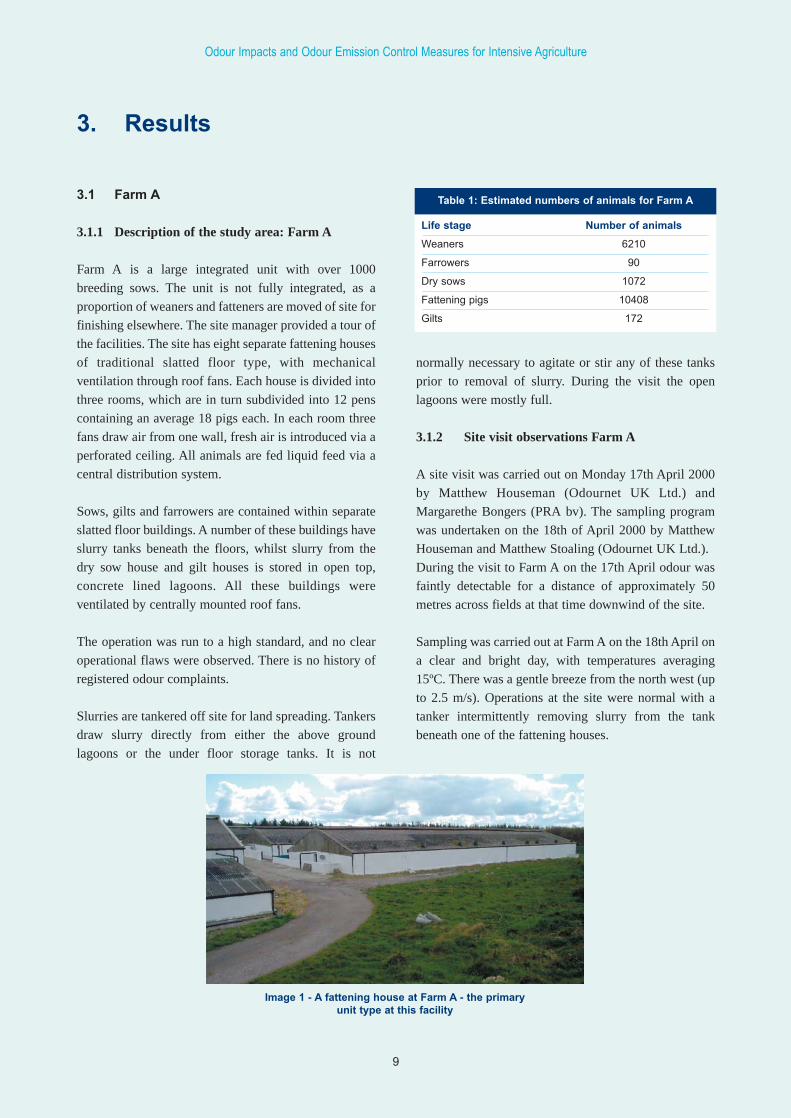
3.1 Farm A
3.1.1 Description of the study area: Farm A
Farm A is a large integrated unit with over 1000
breeding sows. The unit is not fully integrated, as a
proportion of weaners and fatteners are moved of site for
finishing elsewhere. The site manager provided a tour of
the facilities. The site has eight separate fattening houses
of traditional slatted floor type, with mechanical
ventilation through roof fans. Each house is divided into
three rooms, which are in turn subdivided into 12 pens
containing an average 18 pigs each. In each room three
fans draw air from one wall, fresh air is introduced via a
perforated ceiling. All animals are fed liquid feed via a
central distribution system.
Sows, gilts and farrowers are contained within separate
slatted floor buildings. A number of these buildings have
slurry tanks beneath the floors, whilst slurry from the
dry sow house and gilt houses is stored in open top,
concrete lined lagoons. All these buildings were
ventilated by centrally mounted roof fans.
The operation was run to a high standard, and no clear
operational flaws were observed. There is no history of
registered odour complaints.
Slurries are tankered off site for land spreading. Tankers
draw slurry directly from either the above ground
lagoons or the under floor storage tanks. It is not
normally necessary to agitate or stir any of these tanks
prior to removal of slurry. During the visit the open
lagoons were mostly full.
3.1.2 Site visit observations Farm A
A site visit was carried out on Monday 17th April 2000
by Matthew Houseman (Odournet UK Ltd.) and
Margarethe Bongers (PRA bv). The sampling program
was undertaken on the 18th of April 2000 by Matthew
Houseman and Matthew Stoaling (Odournet UK Ltd.).
During the visit to Farm A on the 17th April odour was
faintly detectable for a distance of approximately 50
metres across fields at that time downwind of the site.
Sampling was carried out at Farm A on the 18th April on
a clear and bright day, with temperatures averaging
15ºC. There was a gentle breeze from the north west (up
to 2.5 m/s). Operations at the site were normal with a
tanker intermittently removing slurry from the tank
beneath one of the fattening houses.
Odour Impacts and Odour Emission Control Measures for Intensive Agriculture
9
3. Results
Image 1 - A fattening house at Farm A - the primaryunit type at this facility
Life stage Number of animals
Weaners 6210
Farrowers 90
Dry sows 1072
Fattening pigs 10408
Gilts 172
Table 1: Estimated numbers of animals for Farm A

3.2 Farm B
3.2.1 Description of Farm B
Farm B is an integrated production unit with
approximately 590 breeding sows. All production takes
place within one site.
Weaners are raised in groups of 160 in slatted floor
rooms with a single centrally mounted ventilator in each
room. Fattening then takes place in rooms of twelve
pens, with approximately 250 pigs per room. The
fattening rooms are also mechanically ventilated with
two centrally mounted fans in each room. Final finishers
of approximate 90 kg live weight are kept in smaller
groups of approximately 36. These groups are in smaller
stalls with sidewall mounted mechanical ventilation. All
pigs at Farm B are fed with a dry blended feed.
The operation was run in a professional manner, and the
site was kept clean and tidy. There is no history of
registered odour complaints.
Slurries are usually stored in underground tanks beneath
the slatted floors. Tankers take slurry from land
application directly from these tanks. An additional
circular, open topped storage tank is available. However
due to the low density of pig units in the vicinity of Farm
B finding land for spreading is not usually difficult and
hence the tank is rarely in use.
3.2.2 Site visit observations Farm BA site visit was carried out on Monday 17th April, 2000
by Matthew Houseman (Odournet UK Ltd.) and
Margarethe Bongers (PRA bv). The sampling program
was undertaken on the 19th of April 2000 by Matthew
Houseman and Matthew Stoaling (Odournet UK Ltd.).
No odour was detectable off site from Farm B on the
17th April.
Sampling was carried out at Farm B on the 19th April as
heavy rain crossed Southern Ireland, with outside
temperatures falling to 8˚C at the end of the sampling.
There was a strong wind from the south west (up to 6.5
m/s).
Operations at the site were normal with no sludge
removal operations taking place.
3.3 Odour emission measurements
In order to simplify the practice of producing a detailed
odour study for farms in Ireland, the use of emission
estimates based on emission factors per animal has been
proposed in this document. The most recent and detailed
study regarding pig emission factors was identified, to
form the basis for these emission factors. The emission
estimates were derived from data collected in a study
commissioned by the Ministry of Public Planning and
the Environment in the Netherlands, and carried out by
Odour Impacts and Odour Emission Control Measures for Intensive Agriculture
10
Image 2 - The fattening houses at Farm B. The centrally mountedextraction vents can be clearly observed.
Life stage Number of animals
Weaners 2964
Suckling sows with piglets 114
Dry sows 479
Fattening pigs 2192
Gilts 101
Boars 18
Table 2: Estimated numbers of animals for Farm B
the Institute for Agricultural Engineering IMAG-DLO in
Wageningen[5].
A detailed account of the approach and methodologies
used in the IMAG-DLO study is available in annex 7 of
this report. In general, the methods employed when
sampling from the two Irish farms were as close to those
used in the Dutch project as possible. However, due the
variable nature of the construction of pig housing, and
conditions, some assumptions were made. These are
also outlined in annex 7.
It was decided to conduct the measurements in Ireland
for one housing type only, so the statistical uncertainty
could be limited within the given scope of the sampling
programme. As the primary sources of odour at an
integrated unit are the fattening houses, all samples were
taken within these buildings. The results of the
measurements in Ireland were compared with the Dutch
data for all housing types. In order for the Irish samples
to be comparable to those collected in the Dutch study,
the protocols used in the Dutch study were followed
wherever practicable.
3.3.1 Description of sampled pig units and conditions during sampling
All fatteners sampled within the two Irish case study
farms were housed within slatted floor buildings
equipped with mechanical ventilation. The number of
pigs per room varied from 36 to 260.
• Floor area and animal places - Floor area per pig
varied depending upon animal weight, but was in line
with Irish Animal Welfare Regulations (Note: these
are currently only applicable to new pig units).
• Feed - Pigs were fed a liquid feed at Farm A and a dry
feed at Farm B.
3.3.1.1 Sampling at Farm A
Sampling was carried out at Farm A on the 18th April on
a clear and bright day, with temperatures averaging
15˚C. There was a gentle breeze from the north west (up
to 2.5 m/s). Operations at the site were normal with a
tanker intermittently removing slurry from the tank
beneath one of the fattening houses.
Three samples were taken at each point. The surface of
the lagoon was sampled twice, and one sample of
ambient air was collected. Samples in the pig units were
typically taken within the central passageway of each
pig house at a height of 1.5 metres above the slatted
floor. Each sample took approximately 30 minutes to
collect. Samples were collected between 08.00 and
approximately 16.00 hours.
No sampling took place during the feeding of pigs.
During sampling the air flow velocity of each fan within
the particular room was measured. At least five
measurements were taken per fan. During the fan
measurements the percentage of fan capacity employed
was recorded from the display on the ventilation control
units.
3.3.1.2 Sampling at site B
Sampling was carried out at Site B on the 19th April as
heavy rain crossed the area, with outside temperatures
falling to 8˚C at the end of the sampling. There was a
strong wind from the south west (up to 6.5 m/s).
Operations at the site were normal with no sludge
removal operations taking place.
Odour sampling was principally concentrated within
fattening houses. Three samples were taken at each
point. Samples were typically taken within the central
passageway of each pig house at a height of 1.5 metres
above the slatted floor. Each sample took approximately
30 minutes to collect. Sampling took place between
07.30 and approximately 15.50 hours.
No sampling took place during the feeding of pigs.
During sampling the air flow velocity of each fan within
the particular room was measured. At least five
measurements were taken per fan. During the fan
measurements the % of fan capacity employed was
recorded from the display on the ventilation control
units.
3.3.1.3 Number of samples
Twelve samples were taken from fattening pigs housing
at each farm. This represented triplicate samples from
four groups of fatteners at each farm.
Odour Impacts and Odour Emission Control Measures for Intensive Agriculture
11
In addition an ambient sample and two samples from the
surface of a slurry lagoon were taken at Farm A and
three samples from a weaner house at Farm B. Therefore
of the 31 samples taken, 24 were directly aimed at the
comparison with emission rates as determined in the
Netherlands.
3.3.2 Results of emission rate measurements
The results of the measurements of odour emissions,
carried out on site A and site B, are presented in Table 3.
The emission factors per animal (in ouE/s per animal
place) were calculated by multiplying odour
concentration (ouE/m3) with ventilation rate (m3/s) per
animal place, to obtain an emission rate in ouE/s per
animal.
For each sampling location, the geometric mean of the
replicate samples was calculated.
The overall emission for a finisher was calculated as the
median value of all measured emission factors for
finishers of all weights, giving an emission rate of 15
ouE/s per animal place at an average ventilation rate of
50 m3/h per animal. The geometric mean was 13.2 ouE/s
per animal
For weaners, only one emission rate was obtained, on
the basis of triplicate samples, with a value of 2.8 ouE/s
per animal place.
In addition to the measurements in the pig houses, a
sample was collected of ambient air on the lee side of
Farm A. The odour concentration was below the
detection limit of 40 ouE/m3 as expected.
Two samples were collected using a Lindvall hood for
sampling area sources. The flow velocity under the hood
was 0.39 m/s. The specific emission rate calculated on
the basis of the geometric mean of the results of 2813
ouE/m3 is 31 ouE/m2/s.
3.3.3 Discussion of emission measurement results
The median emission rate measured in this limited study
in Ireland, of 13.2 ouE/s, is approximately one third
lower than the value of 22.6 ouE/s per fattening pig that
was the result of the study in the Netherlands[5,10] (see
summary of that research in annex 7).
The difference is considerable, but not sufficiently large
to conclude that the observations obtained in Ireland are
significantly different. The observed difference would
fall within the statistical variability between farms and
within farms that was found in the study in the
Netherlands[5].
Odour Impacts and Odour Emission Control Measures for Intensive Agriculture
12
Stage Odour concentration ventilation No of fans % of Odour No. of Emission
rate per room max. fan emission rate per
capacity animals rate animal
sample a sample b sample c Geomean
ouE/m3 m3/s ouE/s ouE/s
Site A
Fatteners 35 - 40 kg 1499 1914 262 909 3.9 3 45% 3546 216 16.4
Fatteners 70 kg 1483 1394 679 1120 3.9 3 44% 4367 216 20.2
Fatteners 90 kg 764 n/a 379 538 3.0 3 37% 1587 216 7.3
Fatteners 50 kg 1073 n/a 1345 1201 2.8 3 34% 3364 216 15.6
Site B
Fatteners 70 kg 961 1450 1508 1281 3.0 2 21% 3868 262 14.8
Fatteners 40 kg 2243 1641 1505 1769 2.7 2 18% 4777 256 18.7
Fatteners 60 kg 862 908 731 830 3.2 2 24% 2640 239 11.0
Fatteners 90 kg 403 289 1498 559 0.5 1 n/a 279 36 7.8
Weaners 40 kg 779 549 400 555 0.8 1 43% 455 164 2.8
Table 3: Emission rates for finishers and weaners, calculated from measured odour concentration and ventilation
rates per finisher measured at site A and B, Ireland, April 2000.
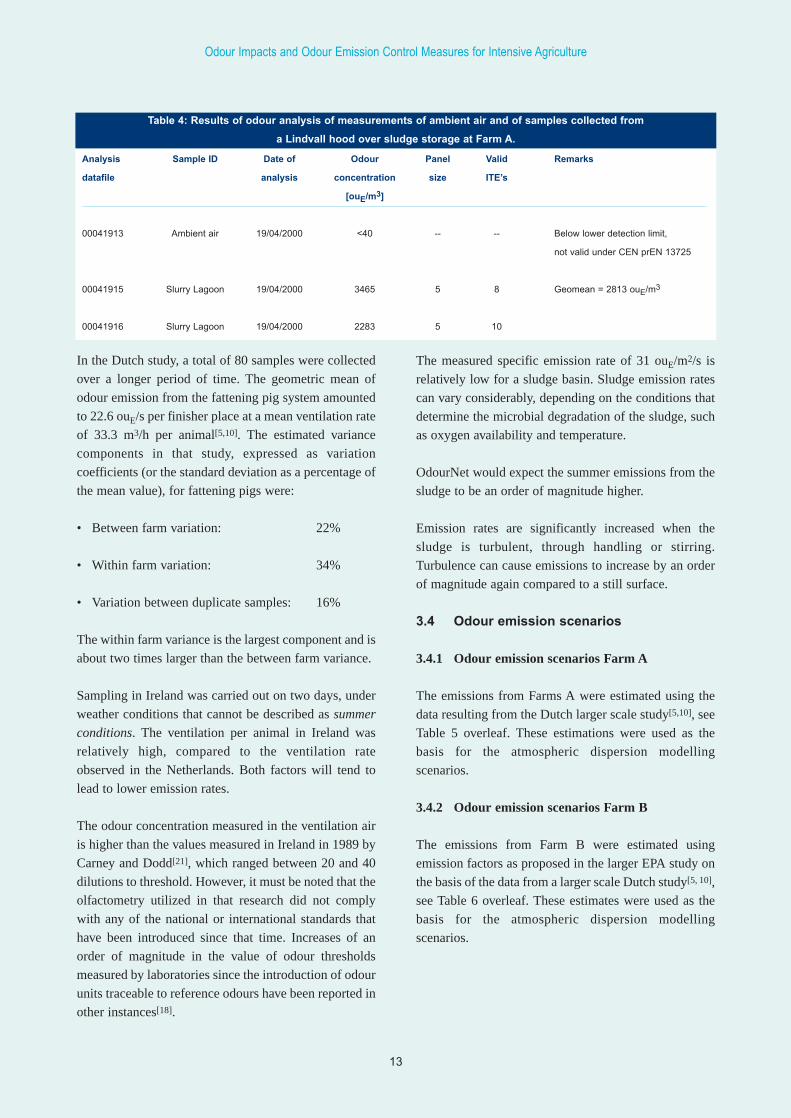
In the Dutch study, a total of 80 samples were collected
over a longer period of time. The geometric mean of
odour emission from the fattening pig system amounted
to 22.6 ouE/s per finisher place at a mean ventilation rate
of 33.3 m3/h per animal[5,10]. The estimated variance
components in that study, expressed as variation
coefficients (or the standard deviation as a percentage of
the mean value), for fattening pigs were:
• Between farm variation: 22%
• Within farm variation: 34%
• Variation between duplicate samples: 16%
The within farm variance is the largest component and is
about two times larger than the between farm variance.
Sampling in Ireland was carried out on two days, under
weather conditions that cannot be described as summer
conditions. The ventilation per animal in Ireland was
relatively high, compared to the ventilation rate
observed in the Netherlands. Both factors will tend to
lead to lower emission rates.
The odour concentration measured in the ventilation air
is higher than the values measured in Ireland in 1989 by
Carney and Dodd[21], which ranged between 20 and 40
dilutions to threshold. However, it must be noted that the
olfactometry utilized in that research did not comply
with any of the national or international standards that
have been introduced since that time. Increases of an
order of magnitude in the value of odour thresholds
measured by laboratories since the introduction of odour
units traceable to reference odours have been reported in
other instances[18].
The measured specific emission rate of 31 ouE/m2/s is
relatively low for a sludge basin. Sludge emission rates
can vary considerably, depending on the conditions that
determine the microbial degradation of the sludge, such
as oxygen availability and temperature.
OdourNet would expect the summer emissions from the
sludge to be an order of magnitude higher.
Emission rates are significantly increased when the
sludge is turbulent, through handling or stirring.
Turbulence can cause emissions to increase by an order
of magnitude again compared to a still surface.
3.4 Odour emission scenarios
3.4.1 Odour emission scenarios Farm A
The emissions from Farms A were estimated using the
data resulting from the Dutch larger scale study[5,10], see
Table 5 overleaf. These estimations were used as the
basis for the atmospheric dispersion modelling
scenarios.
3.4.2 Odour emission scenarios Farm B
The emissions from Farm B were estimated using
emission factors as proposed in the larger EPA study on
the basis of the data from a larger scale Dutch study[5, 10],
see Table 6 overleaf. These estimates were used as the
basis for the atmospheric dispersion modelling
scenarios.
Odour Impacts and Odour Emission Control Measures for Intensive Agriculture
13
Analysis Sample ID Date of Odour Panel Valid Remarks
datafile analysis concentration size ITE’s
[ouE/m3]
00041913 Ambient air 19/04/2000 <40 -- -- Below lower detection limit,
not valid under CEN prEN 13725
00041915 Slurry Lagoon 19/04/2000 3465 5 8 Geomean = 2813 ouE/m3
00041916 Slurry Lagoon 19/04/2000 2283 5 10
Table 4: Results of odour analysis of measurements of ambient air and of samples collected from
a Lindvall hood over sludge storage at Farm A.
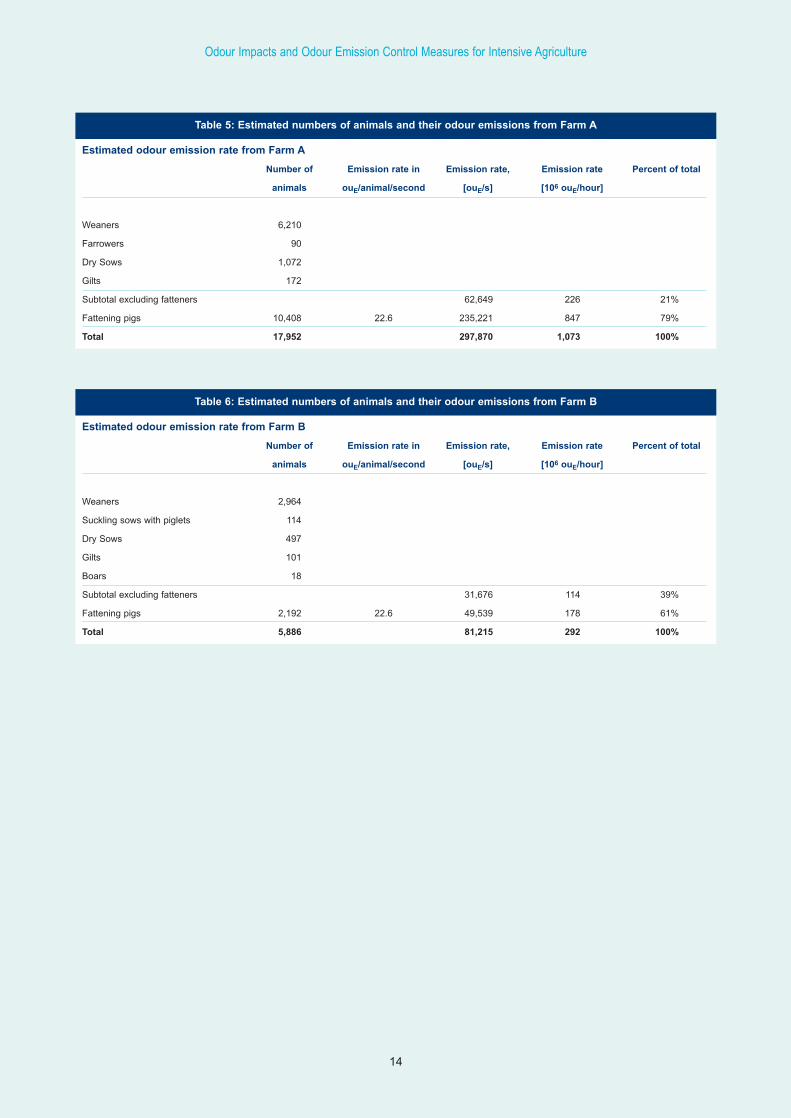
Odour Impacts and Odour Emission Control Measures for Intensive Agriculture
14
Estimated odour emission rate from Farm A
Number of Emission rate in Emission rate, Emission rate Percent of total
animals ouE/animal/second [ouE/s] [106 ouE/hour]
Weaners 6,210
Farrowers 90
Dry Sows 1,072
Gilts 172
Subtotal excluding fatteners 62,649 226 21%
Fattening pigs 10,408 22.6 235,221 847 79%
Total 17,952 297,870 1,073 100%
Table 5: Estimated numbers of animals and their odour emissions from Farm A
Estimated odour emission rate from Farm B
Number of Emission rate in Emission rate, Emission rate Percent of total
animals ouE/animal/second [ouE/s] [106 ouE/hour]
Weaners 2,964
Suckling sows with piglets 114
Dry Sows 497
Gilts 101
Boars 18
Subtotal excluding fatteners 31,676 114 39%
Fattening pigs 2,192 22.6 49,539 178 61%
Total 5,886 81,215 292 100%
Table 6: Estimated numbers of animals and their odour emissions from Farm B
Note: For guidance on interpretation of the odour
contours, refer to section 2.3.3.
The results of the model run for the two scenarios are
discussed below. The contour lines indicate the area in
which the limit value values of target value C98, 1-hour =
1.5 ouE/m3, the limit value for new pig units in
Greenfield sites C98, 1-hour = 3ouE/m3 and the limit value
for existing pig units of
C98, 1-hour = 6 ouE/m3 will be exceeded.
• In reality, the case studies all concerned existing pig
units, so that the limit value should be applied. The
target value should be regarded as a long-term goal.
The C98, 1-hour indicates that the limit concentration is
exceeded during 2% of the 8760 hours in an ‘average
year’. This equals approximately 175 hours.
4.1.1 The situation at Farm A
The results of the model run for the existing situation,
Scenario 1, are presented in a figure, annex 9.1. The
contour for the limit value C98, 1-hour = 6 ouE/m3 extends
for considerable distances, of over 1 km from the farm
buildings. Given the location of the farm, the number of
dwellings affected is limited. OdourNet does not have
access to a detailed survey of the dwellings in the
vicinity, nor their use. From the map it would appear that
ten dwellings are within the limit value contour. These
may be farmhouses, in which case it can be argued that
these dwellings can expect a more lenient level of
protection, in the absence of complaints. To achieve a
more acceptable situation, however, the emissions from
Farm A should be reduced in the long term.
When a 50% reduction of emissions is achieved, the
odour impact of Farm A is significantly reduced. The
number of dwellings indicated on the map that lie within
the limit value contour is reduced to two, see the map in
Annex 9.2. These dwellings are quite close to the limit
value of the contour. It is likely that optimisation of
ventilation, in combination with a 50% odour emissions
reduction, would reduce the odour footprint so far as to
not include any dwellings.
The area in which the impact is such that the target value
of C98, 1-hour = 1.5 ouE/m3 is exceeded does include a
significant number of approximately 100 dwellings,
even for Scenario 1.
The overall implication is that for Farm A reductions are
feasible that would enable continuation of operations at
the current site, when exposure in excess of the target
value is deemed acceptable. There is, however, a need to
reduce emissions to bring exposure within the limit
value. The options for an increase of production levels at
the site of farm A are not easily attained, without more
drastic odour control measures that are not generally
considered financially viable at current market
conditions.
4.1.2 The situation at Farm B
The results of the existing situation at Farm B, modelled
in Scenario 1, are presented in a figure, annex 9.3. The
contour for the limit value C98, 1-hour = 6 ouE/m3 extends
for relatively modest distances, of less than 500 m from
the farm buildings. OdourNet does not have access to a
detailed survey of the dwellings in the vicinity, nor their
use. From the map it would appear, however, that four
dwellings are located within the limit value contour.
The area in which the impact is such that the target value
of C98, 1-hour = 1.5 ouE/m3 is exceeded does include a
significant number of dwellings (nine).
Although in the short term no odour emission reduction
would be required, a reduction should be the aim when
replacing assets, by using specifically low-emission
housing systems. These can achieve a 50% reduction of
emissions. The situation that would arise as a result of
such a reduction is shown on the map in Annex 9.4. In
this situation, the contour representing the target value
(C98, 1-hour = 1.5 ouE/m3) is reduced to such a degree that
four dwellings are affected
The overall implications for Farm B are limited, in that
no immediate actions are required. The odour impact in
the current situation is reasonably acceptable, given its
rural context. To adhere to the proposed limit value
Odour Impacts and Odour Emission Control Measures for Intensive Agriculture
15
4. Discussion of the results of Atmospheric Dispersion modelling of the existing situation

limited abatement options can be considered, e.g.
optimising the release of ventilation air by increasing
height of release and vertical velocity. Continued
attention to avoiding incidental releases caused by
actions such as slurry loading is essential, especially
when weather conditions are unfavourable, given the
short distance to the nearest dwellings. In the long term
low-emission housing is an option to be considered
when replacing current housing assets, with a view to
attaining the target value and, potentially, creating
options for growth of stock numbers in this location.
Odour Impacts and Odour Emission Control Measures for Intensive Agriculture
16

The two pig production units surveyed in this study are
similar in their design, and abatement options discussed
here will apply to both, generally speaking.
There is one difference in that Farm A has a sludge
storage and transfer unit, with a rectangular open buffer
tank and a storage tank. This source will be discussed
separately.
To reduce the odour impact from the pig production at
current capacity levels there are fundamentally three
options:
1. Reduce the emissions by modification of production
method and type of pig housing units
2. Reduce the emissions by collection of ventilation air
followed by treatment in an odour abatement unit
3. Reduce emissions by good operational practice -
especially storage of slurries at Farm A
4. Reduce emissions by reducing production capacity
5.1 Operational practice
Although farms are already aware of operational
requirements for reducing odour emissions through
appropriate cleaning, covering of skips, etc., there were
still many adaptations that could be made to the
operational practice that would have a significant effect
on the odour emitted. For instance, at Farm A, the
carcass skip was not housed in an appropriate building
or covered (see image 3, below). A simple and cheap
cover, and regular emptying, would result in emissions
from this source being dramatically reduced.
The risk of causing annoyance may be reduced by
carefully planning actions on the farms and related to
land spreading. Odournet UK recommends:
• Suspend sludge transfer operations in unfavourable
conditions (low winds in summer conditions in the
direction of the closest residences)
• Avoid land spreading in the vicinity to reduce odour
impact associated with the farm operations,
especially in dry weather or summer conditions
5.2 Modification of production method
A modification that could be implemented in the short
term at Farm A, is an overhaul of slurry storage practice.
Images 4 and 5 show the current situation. There are a
number of options available for sludge storage that
reduces emissions.
Modifications may include:
• Collection of slurry in closed tanks, followed by
anaerobic digestion.
In this process the odourants that are produced can be
destroyed by controlled incineration of the biogas.
Odour Impacts and Odour Emission Control Measures for Intensive Agriculture
17
5. Options for reducing the odour impact
Image 3 - An uncovered carcass skip is a source with a high potential to causeannoyance in summer conditions.
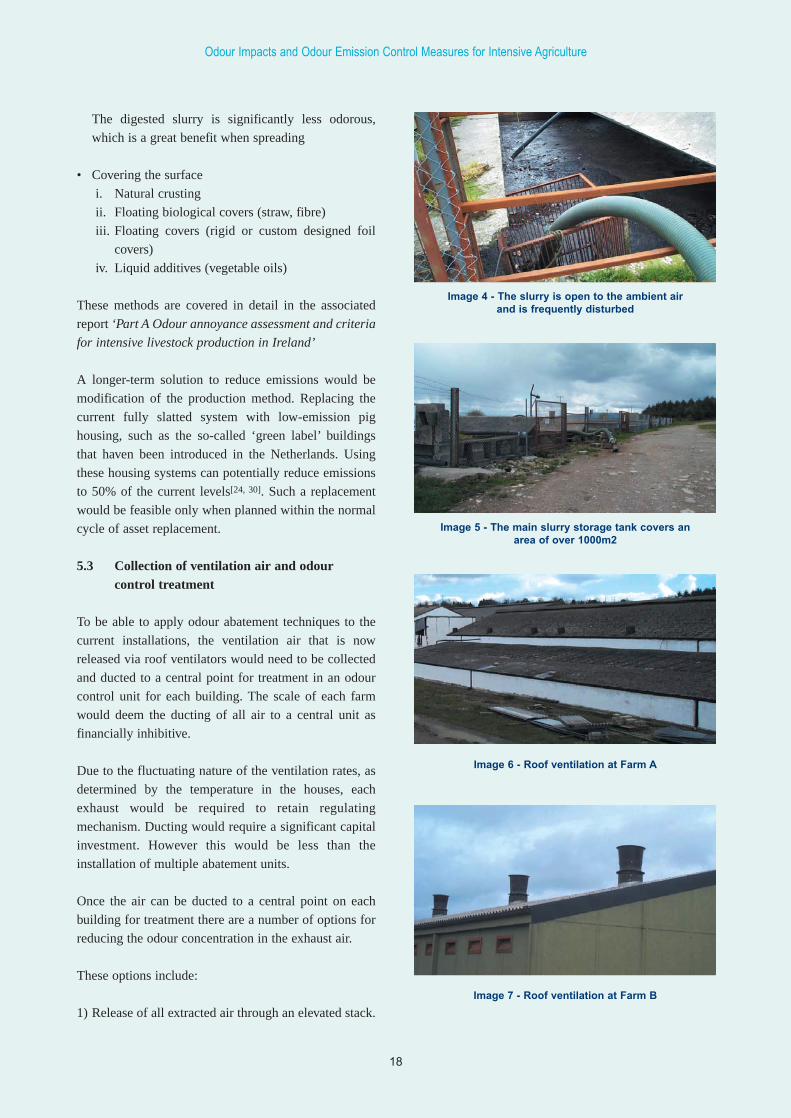
The digested slurry is significantly less odorous,
which is a great benefit when spreading
• Covering the surface
i. Natural crusting
ii. Floating biological covers (straw, fibre)
iii. Floating covers (rigid or custom designed foil
covers)
iv. Liquid additives (vegetable oils)
These methods are covered in detail in the associated
report ‘Part A Odour annoyance assessment and criteria
for intensive livestock production in Ireland’
A longer-term solution to reduce emissions would be
modification of the production method. Replacing the
current fully slatted system with low-emission pig
housing, such as the so-called ‘green label’ buildings
that haven been introduced in the Netherlands. Using
these housing systems can potentially reduce emissions
to 50% of the current levels[24, 30]. Such a replacement
would be feasible only when planned within the normal
cycle of asset replacement.
5.3 Collection of ventilation air and odour control treatment
To be able to apply odour abatement techniques to the
current installations, the ventilation air that is now
released via roof ventilators would need to be collected
and ducted to a central point for treatment in an odour
control unit for each building. The scale of each farm
would deem the ducting of all air to a central unit as
financially inhibitive.
Due to the fluctuating nature of the ventilation rates, as
determined by the temperature in the houses, each
exhaust would be required to retain regulating
mechanism. Ducting would require a significant capital
investment. However this would be less than the
installation of multiple abatement units.
Once the air can be ducted to a central point on each
building for treatment there are a number of options for
reducing the odour concentration in the exhaust air.
These options include:
1) Release of all extracted air through an elevated stack.
Odour Impacts and Odour Emission Control Measures for Intensive Agriculture
18
Image 4 - The slurry is open to the ambient airand is frequently disturbed
Image 5 - The main slurry storage tank covers anarea of over 1000m2
Image 6 - Roof ventilation at Farm A
Image 7 - Roof ventilation at Farm B
This can achieve significant reduction of ground level
concentrations through enhanced atmospheric
dilution
2) Odour abatement through treatment by:
a) Chemical scrubbing
b) Biological scrubbing
c) Biofiltration, potentially combined with pre-
treatment for H2S using a catalytic iron filter
d) Biofiltration on fixed medium substrate covered
with a biofilm, such as a lava-rock filter.
These treatment techniques are described in detail in the
associated reports. These techniques all have the
potential to reduce the odour concentration in the
ventilation air significantly, with a reported efficiency of
up to 90 to 95%.
After treatment the treated ventilation air could be
released from a raised stack, to further reduce the odour
impact by achieving atmospheric dilution. Increasing
the velocity of the exit air will also increase this effect.
This approach is a costly but effective solution. The
quantities of ventilation air are considerable, and
determined by the ventilation needs of the animals.
Assuming a ventilation rate of 0.5 m3/kg pig/hour the
total estimated ventilation flow rate for Farm A would be
524,000 m3/hour.
Treatment options are not considered in detail in this
report, as the associated cost is prohibitive under current
market conditions.
Odour Impacts and Odour Emission Control Measures for Intensive Agriculture
19

Odour Impacts and Odour Emission Control Measures for Intensive Agriculture
20
6.1.1 Conclusions on the results of finisher emission rate measurements in Ireland
The geometric mean emission rate of 13.2 ouE/s per
finisher measured in Ireland for this study is about one
third lower than the value of 22.6 ouE/s per finisher
found in a larger study in the Netherlands.
Given the relatively small number of samples, collected
in the Irish study, and the statistical variance as derived
from the larger Dutch study, the difference in the mean
outcome is too small to be statistically significant.
Therefore, it is justified to use the emission factors
derived in the Netherlands for emission estimates in
Ireland, as long as emission factors specifically
measured in Irish conditions are not available for a
larger sample of study sites.
6.1.2 Odour impact study Farm A
Farm A is a large integrated unit, containing over 17000
animals. It is therefore no surprise that total emissions
are high, and the odour footprint relatively large.
However, given the locality of the farm - it’s distance
from residential units and it’s rural context, there seems
to be no urgency as no complaints have been registered.
The only concerns resulting from the site visits were the
uncovered slurry store and carcass skips. It is the
opinion of Odournet UK that these sources may become
a significant emitter of odours during the warmth of
summer. However, having undertaken sampling during a
cool spring day, there is no quantitative data to support
this.
The modelling shows that in the current situation a
limited number of (ten) dwellings may be affected by
odour impacts in excess of the limit value. It is therefore
necessary to seriously consider options to reduce
emissions. In the short-term measures to reduce
emissions from sludge storage should be considered. In
the longer term, replacement of housing assets could
reduce the number of dwellings exposed to odour
impacts in excess of the limit value, conceivably to zero.
The target value will be difficult to attain for farm A. The
farm can be made sustainable at current stock levels,
from the perspective of odour impact, provided that the
community recognises and accepts the rural context in
the vicinity.
6.1.3 Odour impact study Farm B
Farm B is a relatively small-scale operation. Under
current circumstances, the odour footprint includes four
domestic dwellings within the limit value contour. This
farm may require the installation of abatement options.
However, this would not be critical if current stock
numbers and good practice are maintained. Continued
attention to avoiding incidental releases caused by
actions such as slurry loading is essential, especially
when weather conditions are unfavourable, given the
short distance to the nearest dwellings.
In the long term, a reduction of odour emissions should
be considered when normal renewal of housing assets
becomes an issue. This could achieve attainment of the
limit value for all dwellings in the vicinity and,
potentially, create room for some growth of stock when
the agricultural context of the area is recognised and
accepted as the status quo.
Odour Impacts and Odour Emission Control Measures for Intensive Agriculture
21
6. Conclusions

Odour Impacts and Odour Emission Control Measures for Intensive Agriculture
22
7.1 Background
The regulatory system in the Netherlands to control
odour nuisance from agricultural sources, uses the
‘mestvarkeneenheid’ or MVE (literally ‘fattening pig
unit’) as the basic emission unit for livestock emissions.
One MVE represents the odour emission from one
fattening pig place in a traditional housing system with
a fully slatted floor and slurry storage tanks beneath the
slats.
In the Netherlands, fattening pigs are defined as boars
from about 25 kg till 7 months (final live weight
between 90 and 120 kg) or sows from about 25 kg till
their first cover.
Odour measurements were carried out by the Institute of
Agricultural and Environmental Engineering (IMAG-
DLO) in a project funded by the Dutch government to
establish an emission factor for the Dutch pig unit into
standardised odour units[5]. The measurements are based
on an official Dutch measurement protocol
(‘Meetprotocol voor geuremissies uit stallen’). For
aspects of methodology the protocol refers to ‘Guideline
for assessment of low ammonia emission housing
systems’.
The housing conditions, sampling method and results
are described below. The design of the sampling
programme was derived from the guidance in the
references listed below (the numbers between
parentheses refer to the main list of references in this
report):
• [5] Ogink, N.W.M., Klarenbeek, J.V., ‘Evaluation of
a standard sampling method for determination of
odour emission from animal housings and calibration
of the Dutch pig unit into standardised odour units’,
Institute of Agricultural and Environmental
Engineering (IMAG-DLO);
• Werkgroep emissiefactoren, Meetprotocol voor
geuremissies uit stallen (translated:Measurement
protocol for odour emission from livestock
operations), Ministry of Agriculture, Nature
Management and Fisheries, The Netherlands, 1996;
• [24] Beoordelingsrichtlijn in het kader van Groen
Label Stallen (Guideline for the assessment of Green
Label livestock housing systems), ed. 1996, Ministry
of Housing, Public Planning and the Environment
and the Ministry of Agriculture, The Hague,
Netherlands, 1996.
7.2 Study sites selection and methodology
Four pig units were randomly selected by IMAG-DLO,
each including substantial numbers of fattening pigs. To
be suitable for the study the following features were
required at each site:
• Housing system - The housing system should consist
of mechanically ventilated compartments with pens
equipped with partially slatted floors and slurry
storage underneath.
• Floor area and animal places - Each pig in the final
weight range should have at least 0.70 m2 floor area
of which a maximum 0.40 m2 may be slatted. Animal
places varied between sites from 80 to 130 pigs per
compartment. The floor area is determined by the
housing conditions required to meet animal welfare
regulations.
• Feed - Pigs were fed standard feeds (starter feed and
finishing feed) with protein and energy contents
within prescribed ranges that are similar to those
prescribed for ammonia measurements[24].
• Sample timing -Two successive fattening rounds
were sampled, of which one round had to start in the
second quarter of the year. In each round five odour
samples were taken evenly distributed over the
fattening period.
At each production site the odour emission of a single
compartment was measured. As one group of pigs is
kept in one compartment during their fattening stage,
Odour Impacts and Odour Emission Control Measures for Intensive Agriculture
23
7. Annex: Summary of large-scale survey to establish pig odour emission factors in theNetherlands.
the same pigs are sampled at five different stages.
• Time of the day - Samples were collected during
two-hour periods between 10:00 AM and 12:00 AM
only. These sampling periods were timed to coincide
with relatively high odour emissions during the daily
cycle. Two reasons support this choice. Firstly whilst
emissions are known to be strongest around midday,
variations in emission for the rest of a 24-hour day are
not yet fully quantified. Second, strongest emissions
will contribute most to odour nuisance.
• Number of samples - Samples were collected at each
of the four study sites, in the course of five sampling
sessions at each site, at different stage life cycle
stages of a group of fatteners. As two groups of
fatteners were followed sampling took place on ten
discrete days per site. Each sample was taken in
duplicate, giving a total of 20 samples per site, or a
total of 80 samples for the four farms within the
study.
The required number of samples was defined by the
statistical accuracy (uncertainty) per sample and by
possible variation in emission during the year
(seasonal differences). The timing of sampling was
designed to follow the guidance provided in
‘Beoordelingsrichtlijn Groen Label Stallen’, in order
to derive a representative yearly average.
• Sampling method - The samples were collected
using the lung method. This requires odour sample
bags to be placed within airtight containers. A
vacuum is then applied to the airtight container,
surrounding the sample bag. As the bag expands to
fill the vacuum it draws odorous air into the bag via a
tube from the site of interest.
The evacuation rate was volume proportional to the
ventilation rate of the fan (controlled by a critical
orifice). The inlet of the sampling tube was located in
the ventilation shaft before the fan. Both the sampling
tubes and the containers were heated if necessary to
avoid condensation. The odour bags remained in the
container until analysis in the odour lab within 30
hours after collection.
• Odour Analysis - Odour concentration were
determined according to the Dutch olfactometric
standard method NVN2820:1995 and results
expressed in Dutch odour units (ge/m3). Please note
that 1 ouE/m3 = 2 ge/m3. This is a fixed proportion,
caused by selecting assessors with an average
detection threshold of 20 ppb/v n-butanol for
NVN2820, while EN13725 selects using 40 ppb/v n-
butanol.
• Ventilation - During sampling the ventilation rate
was measured continuously by a fan wheel
anemometer in the ventilation shaft.
• Other parameters - Temperature and humidity were
measured in the compartment and outdoors by
combined sensors.
7.2.1 Results
Odour emissions (ouE/s per animal place) were
calculated by multiplying odour concentration in
ouE·m-3 with ventilation rate (m3/s) per animal place.
For sampling day the geometric mean of the duplicate
samples was calculated. The average per facility was
calculated as the geometric mean of the results from
each sampling day.
The geometric mean of odour emission from the
fattening pig system amounted to 22.6 ouE/s per animal
place at a ventilation rate of 33.3 m3/h per animal.
The estimated variance components, expressed as mean
percentage deviations, for fattening pigs were:
Between farm variation : 22%
Within farm variation : 34%
Variation between duplicate samples : 16%
The within farm variance is the largest component and is
about two times larger than the between farm variance.
Odour Impacts and Odour Emission Control Measures for Intensive Agriculture
24
3 Miedema, H.M.E., Walpot, J.I., Steunenberg, C.F., Exposure-annoyance relationships for odours from stationary
sources, Atmospheric Environment 34 (2000) 2927-2936,, 2000.
5 Ogink, N.W.M., Klarenbeek, J.V., Evaluation of a standard sampling method for determination of odour emission
from animal housing systems and calibration of the Dutch pig odour unit into standardised odour units, In:
Proceedings of the Int. Symposium on Ammonia and Odour Control from Animal Production Facilities, NVTL,
Rosmalen, Netherlands, 1997.
10 Ogink, NWM, Lens, PN, Odour Emissions from livestock operations (original title: Geuremissie uit de veehouderij.
Overzichtsrapportage van geurmetingen in de varkenshouderij, pluimveehouderij en rundveehouderij), Institute for
agricultural and Environmental Engineering IMAG-DLO, Netherlands, in press, publication March 2001
11 EN13725 ‘Odour concentration measurement by dynamic olfactometry’, CEN, 1999.
18 van Harreveld, A. Ph. , Klarenbeek, J.V., On the regulations, measurement and abatement of odours emanating from
livestock housing in the Netherlands, In: New knowledge in Livestock Odor, Proceedings of the International
Livestock Odor Conference 1995, pp.16-21, Iowa, USA
20 Inventarisatie Epos; Eindrapport van de eerste fase van het Evaluatie Project Ontwerp Stankconcentratienormen
(EPOS90) (translation: Inventory for Project Evaluation of Provisional Odour Concentration Standards), Ministry
of Public Planning and the Environment, 1990.
21 Carney, P.G., Dodd, V.A., The Measurement of Agricultural Malodours, J. Agric. Engng. Res. (1989) 43, 197-209.
24 Beoordelingsrichtlijn in het kader van Groen Label Stallen (Guideline for the assessment of Green Label livestock
housing systems), ed. 1996, Ministry of Housing, Public Planning and the Environment and the Ministry of
Agriculture, The Hague, Netherlands, 1996.
26 EPA, Guideline on air quality models (revised), july 1986, EPA, EPA-450/2-78-027R.
27 EPA, User's guide to MPTER: a Multiple Point Gaussian dispersion algorithm with optional TERrain Adjustment,
April 1980, EPA, EPA-600/8-80-016
30 Hendriks, HJM, van de Weerdhof, AM, Dutch notes on BAT for pig- and poultry intensive livestock farming,
Ministry of Housing, Public Planning and the Environment and the Ministry of Agriculture, Nature Management and
Fisheries, August 1999. Electronically available at http://www.infomil.nl/lucht/index.htm
Odour Impacts and Odour Emission Control Measures for Intensive Agriculture
25
8. Annex: References

Odour Impacts and Odour Emission Control Measures for Intensive Agriculture
26
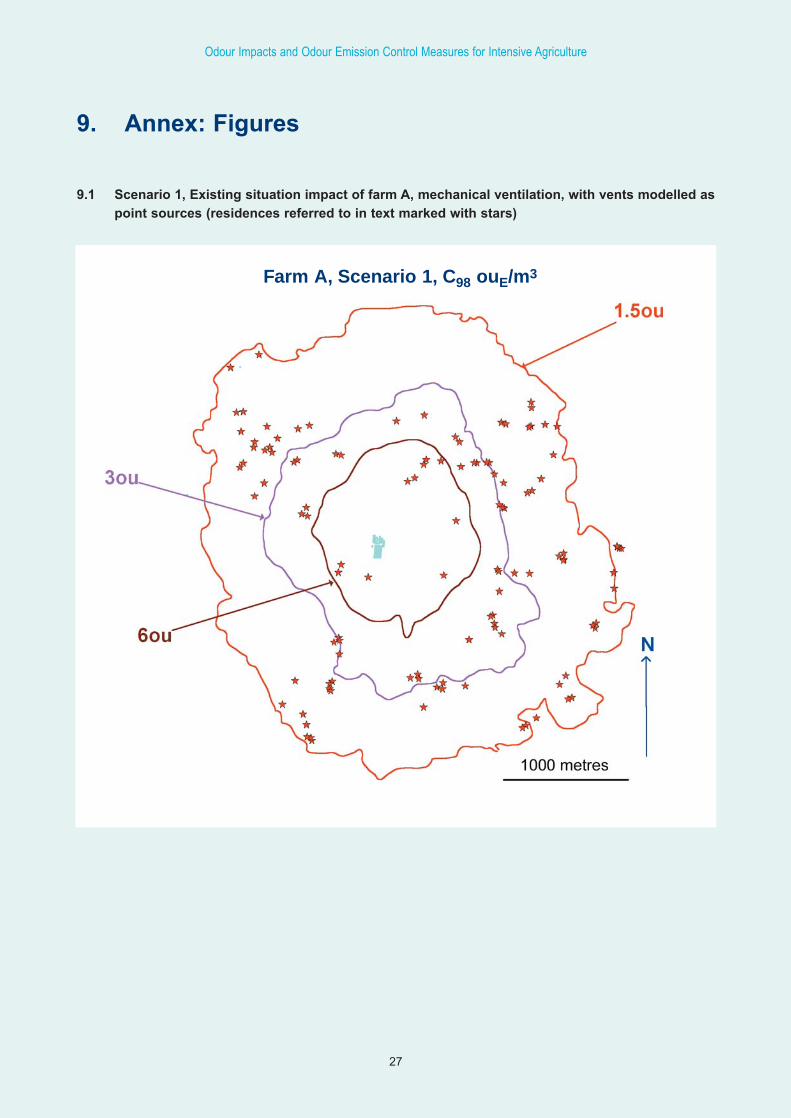
9.1 Scenario 1, Existing situation impact of farm A, mechanical ventilation, with vents modelled aspoint sources (residences referred to in text marked with stars)
Odour Impacts and Odour Emission Control Measures for Intensive Agriculture
27
9. Annex: Figures
Farm A, Scenario 1, C98 ouE/m3
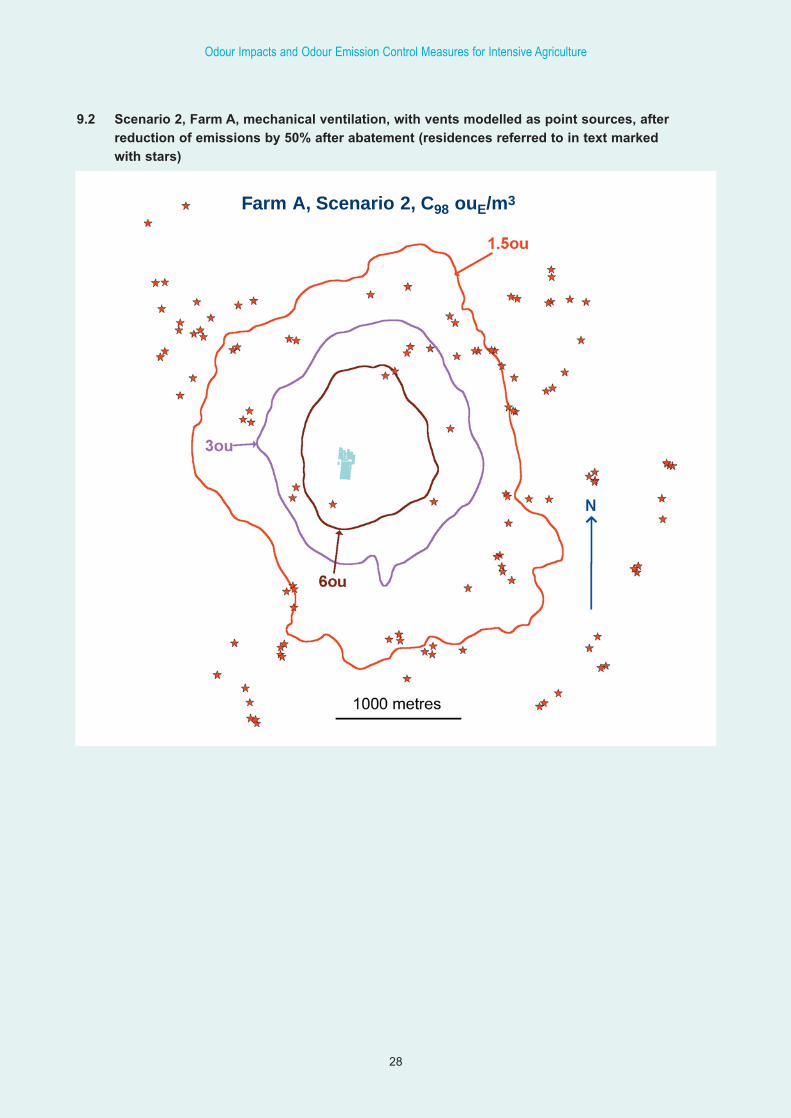
Odour Impacts and Odour Emission Control Measures for Intensive Agriculture
28
9.2 Scenario 2, Farm A, mechanical ventilation, with vents modelled as point sources, after reduction of emissions by 50% after abatement (residences referred to in text markedwith stars)
Farm A, Scenario 2, C98 ouE/m3
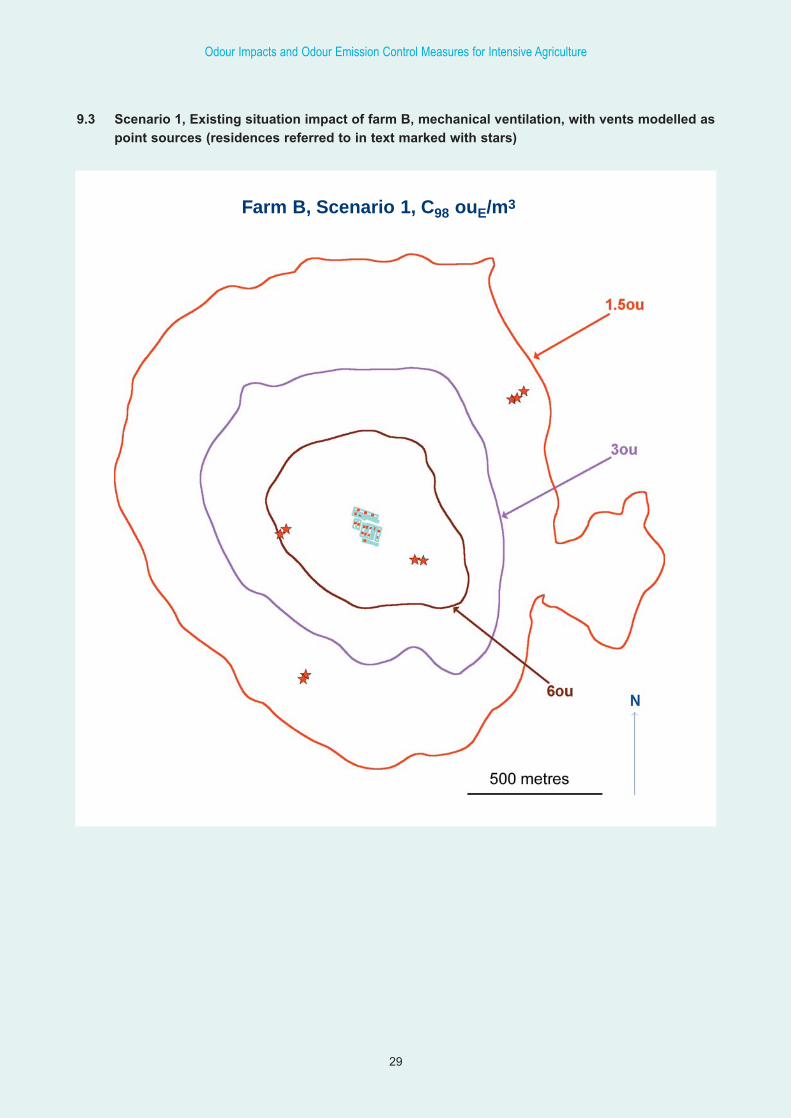
Odour Impacts and Odour Emission Control Measures for Intensive Agriculture
29
9.3 Scenario 1, Existing situation impact of farm B, mechanical ventilation, with vents modelled aspoint sources (residences referred to in text marked with stars)
Farm B, Scenario 1, C98 ouE/m3
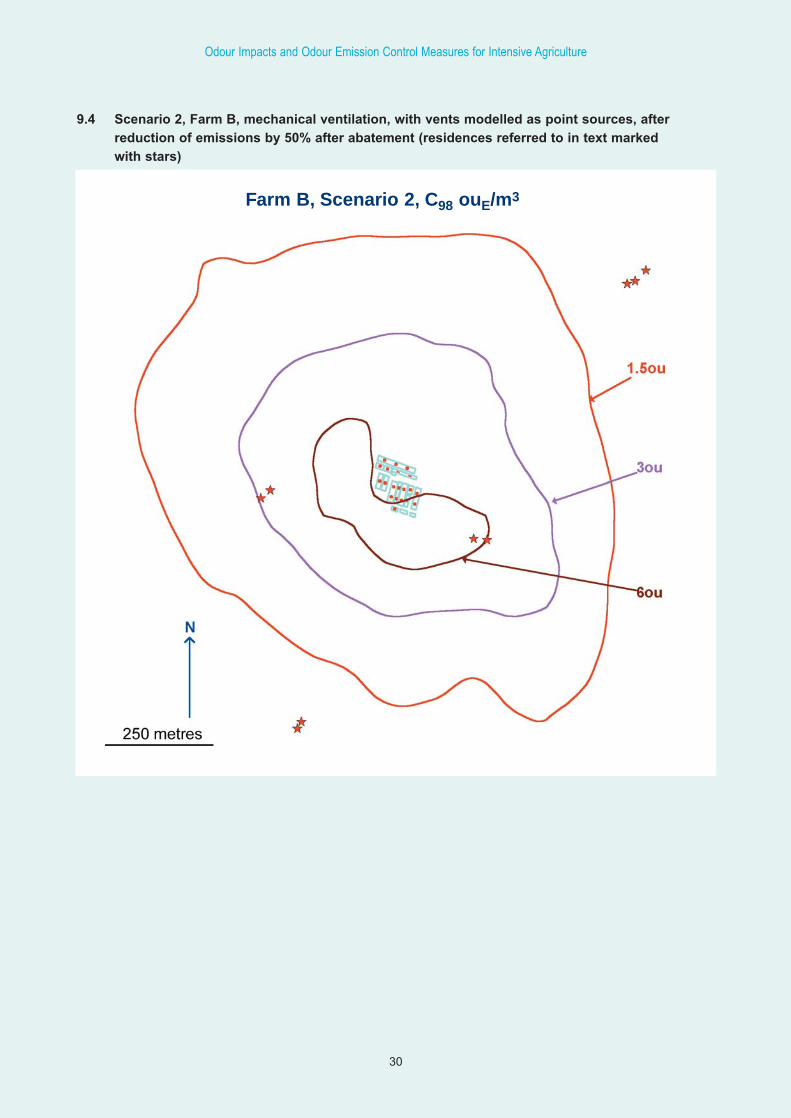
Odour Impacts and Odour Emission Control Measures for Intensive Agriculture
30
9.4 Scenario 2, Farm B, mechanical ventilation, with vents modelled as point sources, after reduction of emissions by 50% after abatement (residences referred to in text markedwith stars)
Farm B, Scenario 2, C98 ouE/m3