October 5, 2017 Price $13.52^ Ferroglobe Preliminary US Si ... · PDF fileUS DOC Imposes...
14
USD Prev. 2015A Prev. 2016A Prev. 2017E Prev. 2018E Rev. (MM) -- 2,040.0 -- 1,581.0 -- 1,713.0 -- 2,003.0 EBITDA (MM) -- 295.0 -- 73.0 -- 159.0 -- 358.0 Cons. EPS -- -- -- -- -- 0.09 -- 0.86 EPS Mar -- -- -- (0.04) -- (0.03)A -- -- Jun -- -- -- (0.01) -- 0.05A -- -- Sep -- -- -- (0.09) -- 0.01 -- -- Dec -- -- -- (0.09) -- 0.02 -- -- FY Dec -- 0.21 -- (0.24) -- 0.04 -- 0.70 FY P/E 64.4x NM NM 19.3x Price Performance OCT-16 FEB-17 JUN-17 OCT-17 16 14 12 10 8 ^Prior trading day's closing price unless otherwise noted. COMPANY NOTE Company Update USA | Industrials | Materials (Steel) October 5, 2017 Ferroglobe (GSM) US Levies 4-135% Preliminary Si Metal Antidumping Duties; Reiterate Buy EQUITY RESEARCH AMERICAS BUY Price target $16.75 Price $13.52^ Financial Summary Book Value (MM): $906.5 Book Value/Share: $5.27 Net Debt (MM): $433.6 Return on Avg. Equity: (0.9)% Net Debt/Capital: 28.5% Long-Term Debt (MM): $590.1 LTD/Cap: 38.7% Cash & ST Invest. (MM): $183.6 Market Data 52 Week Range: $14.46 - $8.54 Total Entprs. Value (MM): $2,756.3 Market Cap. (MM): $2,322.7 Insider Ownership: 58.8% Institutional Ownership: 41.3% Shares Out. (MM): 171.8 Float (MM): 70.7 Avg. Daily Vol.: 658,383 Martin Englert * Equity Analyst (646) 805-5421 [email protected] Seth Rosenfeld, CFA § Equity Analyst +44 (0) 20 7029 8772 [email protected] Alan Spence, CFA § Equity Analyst +44 (0) 20 7029 8311 [email protected] * Jefferies LLC § Jefferies International Limited Key Takeaway The imposition of US Si metal import duties of 4-135% is a positive catalyst for GSM with shares likely moving higher on the open tomorrow. Duties will ultimately result in upward price pressure on Si due to supply-side constraints as ~28% of supply is stripped from the US market, however, this response may be temporarily delayed due to recent hiccups in the US supply-demand balance. We reiterate our Buy and $16.75 target price on the shares of GSM. Si Duties a Positive Catalyst for GSM & US Market: The implementation of US Si metal import duties will act to further constrain supply and likely lead to higher pricing, but near term headwinds may delay the response. We note July Si imports jumped +43% MoM, likely the result of importers under review of the pending trade cases attempting to move material before the floodgates closed. As a result of increased supply, it could cap more immediate upward moves in spot Si prices. Further, Wacker’s poly facility outage and REC’s idling (China"s Silicon Retracement Trajectory Moderating with Signs of Stabilization ) likely translates to a short-lived stepdown in demand during 4Q. Despite these near-term headwinds, post preliminary duties, we remain positive on Western Si pricing fundamentals reiterating our Buy on GSM shares. US DOC Imposes Preliminary Si AD Duties: On October 4, 2017, the US Department of Commerce (DOC) imposed preliminary Si metal import antidumping (AD) duties of; 57-135% against Brazil (~21% US consumption TTM July ‘17), Australia of 21% (~7%) and Norway of 4% (~4%). Preliminary AD duties of 57-135% against the leading import source, Brazil, were higher and broader than we expected hitting Dow's facilities in addition to the more critical merchant market. A detailed timeline and table of AD/CV preliminary duties is provided on page 4, exhibit 3. Recent Research: Preliminary US Si Dumping Duties Expected Tomorrow; Canada Executes No Sugarcoating; China Silicon Inflects & Europe Plays Catch-Up Global Upsurge of Silicon Prices Gains Breadth as Euro Prices Move Leverage to Price Apparent; Setting the Stage for 2018; Maintain Buy Valuation/Risks Valuation: GSM trades at 7.5x 2018E EV/EBITDA versus its historical 8.8x median (5-13x range) and the US steel sector at 6.3x. Our $16.75 PT implies 9.0x 2018E EV/EBITDA. Risks: a) Si metals pricing, b) capacity additions, & c) FX. Please see analyst certifications, important disclosure information, and information regarding the status of non-US analysts on pages 10 to 14 of this report.
Transcript of October 5, 2017 Price $13.52^ Ferroglobe Preliminary US Si ... · PDF fileUS DOC Imposes...

USD Prev. 2015A Prev. 2016A Prev. 2017E Prev. 2018E
Rev. (MM) -- 2,040.0 -- 1,581.0 -- 1,713.0 -- 2,003.0
EBITDA (MM) -- 295.0 -- 73.0 -- 159.0 -- 358.0
Cons. EPS -- -- -- -- -- 0.09 -- 0.86
EPS
Mar -- -- -- (0.04) -- (0.03)A -- --
Jun -- -- -- (0.01) -- 0.05A -- --
Sep -- -- -- (0.09) -- 0.01 -- --
Dec -- -- -- (0.09) -- 0.02 -- --
FY Dec -- 0.21 -- (0.24) -- 0.04 -- 0.70
FY P/E 64.4x NM NM 19.3x
Price Performance
OCT-16 FEB-17 JUN-17 OCT-17
16
14
12
10
8
^Prior trading day's closing price unlessotherwise noted.
COMPANY NOTE
Company Update
USA | Industrials | Materials (Steel) October 5, 2017
Ferroglobe (GSM)US Levies 4-135% Preliminary Si MetalAntidumping Duties; Reiterate Buy
EQU
ITY R
ESEARC
H A
MERIC
AS
BUYPrice target $16.75
Price $13.52^
Financial SummaryBook Value (MM): $906.5Book Value/Share: $5.27Net Debt (MM): $433.6Return on Avg. Equity: (0.9)%Net Debt/Capital: 28.5%Long-Term Debt (MM): $590.1LTD/Cap: 38.7%Cash & ST Invest. (MM): $183.6
Market Data52 Week Range: $14.46 - $8.54Total Entprs. Value (MM): $2,756.3Market Cap. (MM): $2,322.7Insider Ownership: 58.8%Institutional Ownership: 41.3%Shares Out. (MM): 171.8Float (MM): 70.7Avg. Daily Vol.: 658,383
Martin Englert *Equity Analyst
(646) 805-5421 [email protected] Rosenfeld, CFA §
Equity Analyst+44 (0) 20 7029 8772 [email protected]
Alan Spence, CFA §Equity Analyst
+44 (0) 20 7029 8311 [email protected]
* Jefferies LLC § Jefferies International Limited
Key TakeawayThe imposition of US Si metal import duties of 4-135% is a positive catalystfor GSM with shares likely moving higher on the open tomorrow. Duties willultimately result in upward price pressure on Si due to supply-side constraintsas ~28% of supply is stripped from the US market, however, this response maybe temporarily delayed due to recent hiccups in the US supply-demand balance.We reiterate our Buy and $16.75 target price on the shares of GSM.
Si Duties a Positive Catalyst for GSM & US Market: The implementation of US Simetal import duties will act to further constrain supply and likely lead to higher pricing,but near term headwinds may delay the response. We note July Si imports jumped +43%MoM, likely the result of importers under review of the pending trade cases attempting tomove material before the floodgates closed. As a result of increased supply, it could capmore immediate upward moves in spot Si prices. Further, Wacker’s poly facility outage andREC’s idling (China"s Silicon Retracement Trajectory Moderating with Signs of Stabilization)likely translates to a short-lived stepdown in demand during 4Q. Despite these near-termheadwinds, post preliminary duties, we remain positive on Western Si pricing fundamentalsreiterating our Buy on GSM shares.
US DOC Imposes Preliminary Si AD Duties: On October 4, 2017, the US Departmentof Commerce (DOC) imposed preliminary Si metal import antidumping (AD) duties of;57-135% against Brazil (~21% US consumption TTM July ‘17), Australia of 21% (~7%) andNorway of 4% (~4%). Preliminary AD duties of 57-135% against the leading import source,Brazil, were higher and broader than we expected hitting Dow's facilities in addition to themore critical merchant market. A detailed timeline and table of AD/CV preliminary duties isprovided on page 4, exhibit 3.
Recent Research:Preliminary US Si Dumping Duties Expected Tomorrow; Canada ExecutesNo Sugarcoating; China Silicon Inflects & Europe Plays Catch-UpGlobal Upsurge of Silicon Prices Gains Breadth as Euro Prices MoveLeverage to Price Apparent; Setting the Stage for 2018; Maintain Buy
Valuation/RisksValuation: GSM trades at 7.5x 2018E EV/EBITDA versus its historical 8.8x median (5-13xrange) and the US steel sector at 6.3x. Our $16.75 PT implies 9.0x 2018E EV/EBITDA.
Risks: a) Si metals pricing, b) capacity additions, & c) FX.
Please see analyst certifications, important disclosure information, and information regarding the status of non-US analysts on pages 10 to 14 of this report.

Contents US Silicon Trade ............................................................................................................................ 3 US Silicon Dumping-Subsidy & Timeline ....................................................................................... 4 Canada Silicon Dumping-Subsidy & Timeline................................................................................ 5 Weekly Silicon Metal & Alloy Price Trends ................................................................................... 6 Exchange Rates ............................................................................................................................. 8 Weekly Silicon Metals Price Summary .......................................................................................... 9
GSM
Company Update
October 5, 2017
page 2 of 14 , Equity Analyst, (646) 805-5421, [email protected] Englert
Please see important disclosure information on pages 10 - 14 of this report.

US Silicon Trade
Exhibit 1: Monthly US Si Metal Imports
Source: US Census
Exhibit 2: Annual US Si Metal Imports
Source: US Census
8.25.0 5.4
8.75.3 4.9 6.4 6.3
4.8 3.55.2
7.4
2.0
1.2 1.2
0.8
1.5 1.90.6
2.32.0
2.91.5
4.1
1.22.7
1.8
0
5
10
15
20
US
Si I
mp
ort
s (,
00
0 t
on
ne
s)
Brazil Australia Kazakhstan Norway Other
50 68 42
74 84 71 62 77 47 62 71
22
12
14
0
50
100
150
200
250
2007 2008 2009 2010 2011 2012 2013 2014 2015 2016 TTM
July
17'
US
Si I
mp
ort
s (,
00
0 t
on
ne
s)
Brazil Australia Kazakhstan Norway Other
GSM
Company Update
October 5, 2017
page 3 of 14 , Equity Analyst, (646) 805-5421, [email protected] Englert
Please see important disclosure information on pages 10 - 14 of this report.

US Silicon Dumping-Subsidy & Timeline
Exhibit 3: US Preliminary Silicon Dumping & Subsidy
Exporter Dumping % Subsidy % Total
Brazil
DC Brazil 56.78% 3.69% 60.47%
LIASA 134.92% 52.07% 186.99%
Rima 56.78% 3.69% 60.47%
Others 56.78% 3.69% 60.47%
Norway
Elkem 3.74% 3.74%
Others 3.74% 3.74%
Australia
Simcoa 20.79% 16.23% 37.02%
Others 20.79% 16.23% 37.02%
Kazakhstan
Tau-Ken Temir LLP 120.00% 120.00%
Others 120.00% 120.00%
Past Events
March 8, 2017 GSM petitions for dumping-subsidy on silicon metal imports
March 29, 2017 US DOC pursues silicon import investigation
April 21, 2017 ITC affirms US industry harmed by silicon imports on preliminary basis
May 16, 2017 DOC postpones preliminary CV to August 7, 2017
July 12, 2017 GSM requests DOC postpone preliminary AD to October 14, 2017
July 27, 2017 DOC grants postponement of preliminary AD to October 4, 2017
August 8, 2017 DOC preliminary CV determination
October 4, 2017 DOC preliminary AD determination
Upcoming Events
December 18, 2017 DOC final CV determination
February 16, 2018 DOC final AD determination
Source: US DOC, Jefferies
GSM
Company Update
October 5, 2017
page 4 of 14 , Equity Analyst, (646) 805-5421, [email protected] Englert
Please see important disclosure information on pages 10 - 14 of this report.

Canada Silicon Dumping-Subsidy & Timeline
Exhibit 4: Canada Silicon Dumping & Subsidy
Exporter Dumping % Subsidy % Total
Brazil
Ligas de Aluminio S.A. 27.8% 7.2% 35.0%
Polymet Alloys Inc. (USA) 27.8% 2.8% 30.6%
Rima Industrial S.A. 0.0% 2.7% 2.7%
All other exporters in Brazil 27.8% 6.0% 33.8%
Kazakhstan
Tau-Ken Temir 18.2% 40.3% 58.5%
All other exporters in Kazakhstan 86.5% 269.7% 356.2%
Laos
All exporters in Laos 85.2% 85.2%
Malaysia
All exporters in Malaysia 85.2% 10.6% 95.8%
Norway
Elkem AS 1.2% 2.8% 4.0%
Russia 0.0% 0.0% 0.0%
Thailand
Sica New Materials Co., Ltd. 51.0% 0.8% 51.8%
All other exporters in Thailand 85.2% 0.5% 85.7%
Past Events
February 21, 2017 CBSA launches investigations into silicon metal imports
April 21, 2017 CBSA injury affirmed in preliminary determination
May 18, 2017 CBSA extends preliminary duty determination
July 5, 2017 CBSA preliminary dumping & subsidy rates
October 3, 2017 (by) CBSA final dumping + subsidy margin determination
Upcoming Events
November 2, 2017 (by) Canadian International Trade Tribunal injury determination
Note: <2% dumping and <1% subsidy are determined to be insignificant.
Source: Jefferies, CBSA
GSM
Company Update
October 5, 2017
page 5 of 14 , Equity Analyst, (646) 805-5421, [email protected] Englert
Please see important disclosure information on pages 10 - 14 of this report.
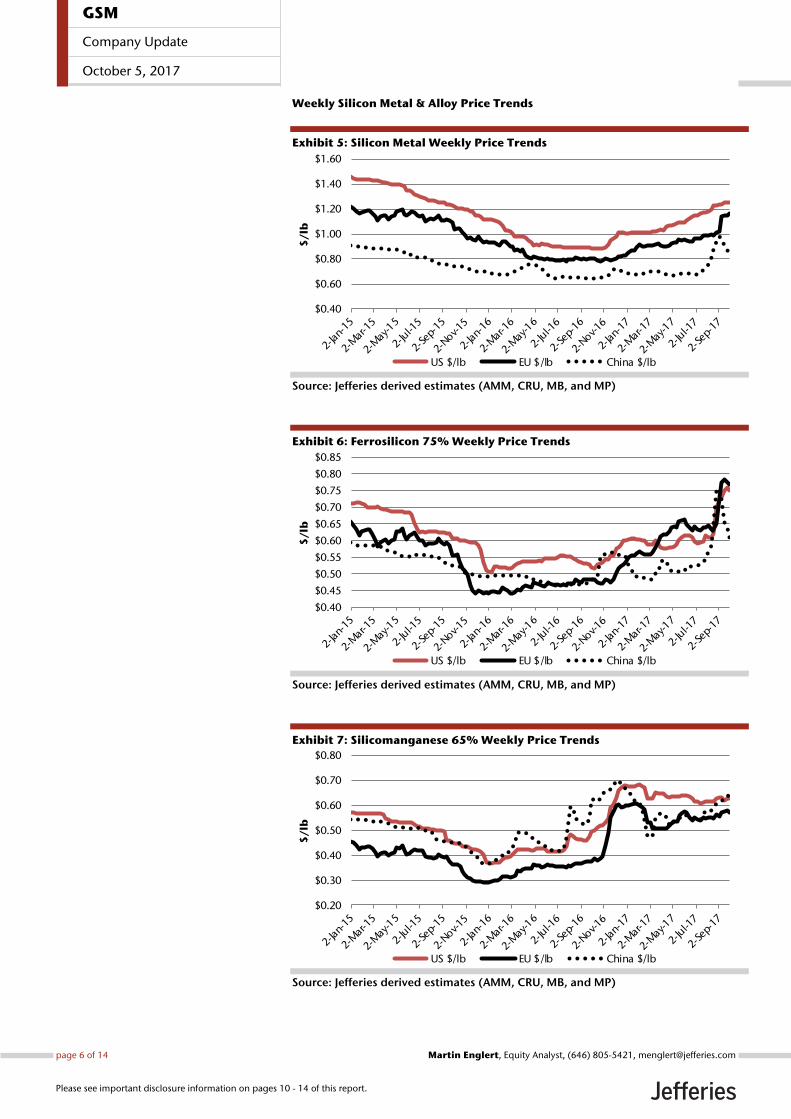
Weekly Silicon Metal & Alloy Price Trends
Exhibit 5: Silicon Metal Weekly Price Trends
Source: Jefferies derived estimates (AMM, CRU, MB, and MP)
Exhibit 6: Ferrosilicon 75% Weekly Price Trends
Source: Jefferies derived estimates (AMM, CRU, MB, and MP)
Exhibit 7: Silicomanganese 65% Weekly Price Trends
Source: Jefferies derived estimates (AMM, CRU, MB, and MP)
$0.40
$0.60
$0.80
$1.00
$1.20
$1.40
$1.60
$/
lb
US $/lb EU $/lb China $/lb
$0.40
$0.45
$0.50
$0.55
$0.60
$0.65
$0.70
$0.75
$0.80
$0.85
$/
lb
US $/lb EU $/lb China $/lb
$0.20
$0.30
$0.40
$0.50
$0.60
$0.70
$0.80
$/
lb
US $/lb EU $/lb China $/lb
GSM
Company Update
October 5, 2017
page 6 of 14 , Equity Analyst, (646) 805-5421, [email protected] Englert
Please see important disclosure information on pages 10 - 14 of this report.

Exhibit 8: Manganese Ore (44%) CFR China Weekly Price Trends
Source: Jefferies derived estimates (AMM, CRU, MB, and MP)
Exhibit 9: Iron Unit Inputs for FeSi Weekly Price Trends
Source: Jefferies derived estimates & MB
$0.00
$1.00
$2.00
$3.00
$4.00
$5.00
$6.00
$7.00
$8.00
$9.00
$10.00
$/
dm
tu
$0.00
$0.02
$0.04
$0.06
$0.08
$0.10
$0.12
$/
lb
Mill Scale $/lb Turnings $/lb
GSM
Company Update
October 5, 2017
page 7 of 14 , Equity Analyst, (646) 805-5421, [email protected] Englert
Please see important disclosure information on pages 10 - 14 of this report.

Exchange Rates
Exhibit 10: USD/EUR
Source: Factset
Exhibit 11: USD/BRL
Source: Factset
Exhibit 12: USD/CHN
Source: Factset
Exhibit 13: USD/RUB
Source: Factset
Exhibit 14: USD/ZAR
Source: Factset
Exhibit 15: USD/NOK
Source: Factset
0.80 €
0.82 €
0.84 €
0.86 €
0.88 €
0.90 €
0.92 €
0.94 €
0.96 €
0.98 €
US
D/
EU
R
R$ 2.0
R$ 2.5
R$ 3.0
R$ 3.5
R$ 4.0
R$ 4.5
US
D/
BR
L
¥6.00
¥6.20
¥6.40
¥6.60
¥6.80
¥7.00
¥7.20
US
D/
CN
H
40 ₽
45 ₽
50 ₽
55 ₽
60 ₽
65 ₽
70 ₽
75 ₽
80 ₽
85 ₽
US
D/
RU
B
R 10
R 11
R 12
R 13
R 14
R 15
R 16
R 17
R 18
US
D/
ZA
R
kr 7.0
kr 7.2
kr 7.4
kr 7.6
kr 7.8
kr 8.0
kr 8.2
kr 8.4
kr 8.6
kr 8.8
kr 9.0
US
D/
NO
K
GSM
Company Update
October 5, 2017
page 8 of 14 , Equity Analyst, (646) 805-5421, [email protected] Englert
Please see important disclosure information on pages 10 - 14 of this report.

Weekly Silicon Metals Price Summary
Exhibit 16: Silicon Metals & Alloys Weekly Pricing
Source: Jefferies derived estimates (AMM, CRU, MB, and MP)
Si Metal & Alloys Price Summary
Product Date
Si Metal (98.5%) 09/29/17 1-week 4-weeks 8-weeks 52-weeks 1-week 4-weeks 8-weeks 52-weeks
US $/lb 1.257 0.000 0.01 0.07 0.37 1.26 1.24 1.18 0.89
EU $/lb 1.166 0.021 0.15 0.18 0.36 1.14 1.02 0.99 0.81
EU €/lb 0.989 0.031 0.13 0.15 0.27 0.96 0.86 0.84 0.72
China $/lb 0.847 (0.023) (0.14) 0.10 0.20 0.87 0.98 0.75 0.65
FeSi (75%) 09/29/17 1-week 4-weeks 8-weeks 52-weeks 1-week 4-weeks 8-weeks 52-weeks
US $/lb 0.753 (0.009) 0.03 0.14 0.23 0.76 0.72 0.61 0.52
EU $/lb 0.771 (0.005) 0.04 0.13 0.29 0.78 0.73 0.65 0.48
EU €/lb 0.654 0.005 0.04 0.11 0.22 0.65 0.62 0.55 0.43
China $/lb 0.611 (0.026) (0.15) 0.04 0.13 0.64 0.76 0.57 0.49
SiMn (65%) 09/29/17 1-week 4-weeks 8-weeks 52-weeks 1-week 4-weeks 8-weeks 52-weeks
US $/lb 0.630 0.000 (0.00) 0.01 0.14 0.63 0.63 0.62 0.49
EU $/lb 0.572 (0.009) 0.01 0.02 0.19 0.58 0.56 0.55 0.38
EU €/lb 0.486 (0.001) 0.01 0.02 0.15 0.49 0.47 0.47 0.34
China $/lb 0.635 (0.007) 0.02 0.05 0.01 0.64 0.61 0.58 0.62
Input Materials 09/29/17 1-week 4-weeks 8-weeks 52-weeks 1-week 4-weeks 8-weeks 52-weeks
Mn Ore (44%) $/dmtu 6.465 0.031 0.35 0.39 1.42 6.43 6.12 6.08 5.05
Mn Ore (100%) $/lb 0.293 0.001 0.02 0.02 0.06 0.29 0.28 0.28 0.23
Mill Scale $/lb 0.025 0.000 (0.00) (0.00) 0.00 0.02 0.03 0.03 0.02
Turnings $/lb 0.083 0.000 (0.00) (0.00) 0.02 0.08 0.09 0.09 0.06
Exchange Rates 09/29/17 1-week 4-weeks 8-weeks 52-weeks 1-week 4-weeks 8-weeks 52-weeks
USD/EUR 0.85 0.01 0.01 (0.00) (0.04) 0.84 0.84 0.85 0.89
USD/CNH 6.65 0.07 0.09 (0.08) (0.02) 6.58 6.56 6.74 6.68
USD/BRL 3.18 0.06 0.04 0.05 (0.08) 3.13 3.14 3.13 3.26
USD/RUB 57.86 0.32 0.36 (2.11) (5.02) 57.53 57.50 59.97 62.87
USD/AUD 1.27 0.02 0.02 0.01 (0.03) 1.26 1.25 1.26 1.31
USD/ZAR 13.52 0.27 0.58 0.09 (0.21) 13.25 12.94 13.42 13.73
USD/NOK 7.94 0.14 0.14 (0.04) (0.04) 7.80 7.80 7.98 7.98
Net Change
Friday, September 29, 2017
Price Level Weeks Prior
GSM
Company Update
October 5, 2017
page 9 of 14 , Equity Analyst, (646) 805-5421, [email protected] Englert
Please see important disclosure information on pages 10 - 14 of this report.

Company DescriptionFerroglobe (NASDAQ ticker GSM), headquartered in London, UK, is a global specialty metals producer brought about from the merger ofGlobe and FerroAtlántica towards the end of 2015. The company produces silicon metal as well as other silicon based alloys with a significantmanufacturing footprint in both North America and Europe. The Globe operations consist of 11 production facilities and three mining sites insix countries with nearly 90% of revenue stemming from the North American market. The FerroAtlántica operations consist of 15 productionfacilities and five mining operations in five countries as well as hydroelectric power assets in Spain and France with the majority of revenuestemming from the European market. GSM maintains a partially vertically integrated model which owns hydro power, specialty coal, quartz,charcoal, woodchips, gravel and electrodes, all key inputs for silicon/silicon based metal manufacturing. Its products service customers withinthe chemicals, aluminum, solar, steel and iron industries.
Analyst Certification:I, Martin Englert, certify that all of the views expressed in this research report accurately reflect my personal views about the subject security(ies) andsubject company(ies). I also certify that no part of my compensation was, is, or will be, directly or indirectly, related to the specific recommendationsor views expressed in this research report.I, Seth Rosenfeld, CFA, certify that all of the views expressed in this research report accurately reflect my personal views about the subjectsecurity(ies) and subject company(ies). I also certify that no part of my compensation was, is, or will be, directly or indirectly, related to the specificrecommendations or views expressed in this research report.I, Alan Spence, CFA, certify that all of the views expressed in this research report accurately reflect my personal views about the subject security(ies) andsubject company(ies). I also certify that no part of my compensation was, is, or will be, directly or indirectly, related to the specific recommendationsor views expressed in this research report.Registration of non-US analysts: Seth Rosenfeld, CFA is employed by Jefferies International Limited, a non-US affiliate of Jefferies LLC and is notregistered/qualified as a research analyst with FINRA. This analyst(s) may not be an associated person of Jefferies LLC, a FINRA member firm, andtherefore may not be subject to the FINRA Rule 2241 and restrictions on communications with a subject company, public appearances and tradingsecurities held by a research analyst.Registration of non-US analysts: Alan Spence, CFA is employed by Jefferies International Limited, a non-US affiliate of Jefferies LLC and is notregistered/qualified as a research analyst with FINRA. This analyst(s) may not be an associated person of Jefferies LLC, a FINRA member firm, andtherefore may not be subject to the FINRA Rule 2241 and restrictions on communications with a subject company, public appearances and tradingsecurities held by a research analyst.As is the case with all Jefferies employees, the analyst(s) responsible for the coverage of the financial instruments discussed in this report receivescompensation based in part on the overall performance of the firm, including investment banking income. We seek to update our research asappropriate, but various regulations may prevent us from doing so. Aside from certain industry reports published on a periodic basis, the large majorityof reports are published at irregular intervals as appropriate in the analyst's judgement.
Investment Recommendation Record(Article 3(1)e and Article 7 of MAR)
Recommendation Published , 19:22 ET. October 5, 2017Recommendation Distributed , 19:22 ET. October 5, 2017
Company Specific DisclosuresJefferies Group LLC makes a market in the securities or ADRs of Ferroglobe.
Explanation of Jefferies RatingsBuy - Describes securities that we expect to provide a total return (price appreciation plus yield) of 15% or more within a 12-month period.Hold - Describes securities that we expect to provide a total return (price appreciation plus yield) of plus 15% or minus 10% within a 12-month period.Underperform - Describes securities that we expect to provide a total return (price appreciation plus yield) of minus 10% or less within a 12-monthperiod.The expected total return (price appreciation plus yield) for Buy rated securities with an average security price consistently below $10 is 20% or morewithin a 12-month period as these companies are typically more volatile than the overall stock market. For Hold rated securities with an averagesecurity price consistently below $10, the expected total return (price appreciation plus yield) is plus or minus 20% within a 12-month period. ForUnderperform rated securities with an average security price consistently below $10, the expected total return (price appreciation plus yield) is minus20% or less within a 12-month period.NR - The investment rating and price target have been temporarily suspended. Such suspensions are in compliance with applicable regulations and/or Jefferies policies.CS - Coverage Suspended. Jefferies has suspended coverage of this company.NC - Not covered. Jefferies does not cover this company.Restricted - Describes issuers where, in conjunction with Jefferies engagement in certain transactions, company policy or applicable securitiesregulations prohibit certain types of communications, including investment recommendations.
GSM
Company Update
October 5, 2017
page 10 of 14 , Equity Analyst, (646) 805-5421, [email protected] Englert
Please see important disclosure information on pages 10 - 14 of this report.

Monitor - Describes securities whose company fundamentals and financials are being monitored, and for which no financial projections or opinionson the investment merits of the company are provided.
Valuation MethodologyJefferies' methodology for assigning ratings may include the following: market capitalization, maturity, growth/value, volatility and expected totalreturn over the next 12 months. The price targets are based on several methodologies, which may include, but are not restricted to, analyses of marketrisk, growth rate, revenue stream, discounted cash flow (DCF), EBITDA, EPS, cash flow (CF), free cash flow (FCF), EV/EBITDA, P/E, PE/growth, P/CF,P/FCF, premium (discount)/average group EV/EBITDA, premium (discount)/average group P/E, sum of the parts, net asset value, dividend returns,and return on equity (ROE) over the next 12 months.
Jefferies Franchise PicksJefferies Franchise Picks include stock selections from among the best stock ideas from our equity analysts over a 12 month period. Stock selectionis based on fundamental analysis and may take into account other factors such as analyst conviction, differentiated analysis, a favorable risk/rewardratio and investment themes that Jefferies analysts are recommending. Jefferies Franchise Picks will include only Buy rated stocks and the numbercan vary depending on analyst recommendations for inclusion. Stocks will be added as new opportunities arise and removed when the reason forinclusion changes, the stock has met its desired return, if it is no longer rated Buy and/or if it triggers a stop loss. Stocks having 120 day volatility inthe bottom quartile of S&P stocks will continue to have a 15% stop loss, and the remainder will have a 20% stop. Franchise Picks are not intendedto represent a recommended portfolio of stocks and is not sector based, but we may note where we believe a Pick falls within an investment stylesuch as growth or value.
Risks which may impede the achievement of our Price TargetThis report was prepared for general circulation and does not provide investment recommendations specific to individual investors. As such, thefinancial instruments discussed in this report may not be suitable for all investors and investors must make their own investment decisions basedupon their specific investment objectives and financial situation utilizing their own financial advisors as they deem necessary. Past performance ofthe financial instruments recommended in this report should not be taken as an indication or guarantee of future results. The price, value of, andincome from, any of the financial instruments mentioned in this report can rise as well as fall and may be affected by changes in economic, financialand political factors. If a financial instrument is denominated in a currency other than the investor's home currency, a change in exchange rates mayadversely affect the price of, value of, or income derived from the financial instrument described in this report. In addition, investors in securities suchas ADRs, whose values are affected by the currency of the underlying security, effectively assume currency risk.
Other Companies Mentioned in This Report• Ferroglobe (GSM: $13.52, BUY)
Notes: Each box in the Rating and Price Target History chart above represents actions over the past three years in which an analyst initiated on acompany, made a change to a rating or price target of a company or discontinued coverage of a company.Legend:
I: Initiating Coverage
D: Dropped Coverage
B: Buy
GSM
Company Update
October 5, 2017
page 11 of 14 , Equity Analyst, (646) 805-5421, [email protected] Englert
Please see important disclosure information on pages 10 - 14 of this report.

H: Hold
UP: Underperform
For Important Disclosure information on companies recommended in this report, please visit our website at https://javatar.bluematrix.com/sellside/Disclosures.action or call 212.284.2300.
Distribution of RatingsIB Serv./Past 12 Mos.
Rating Count Percent Count Percent
BUY 1103 51.33% 336 30.46%HOLD 899 41.83% 180 20.02%UNDERPERFORM 147 6.84% 17 11.56%
GSM
Company Update
October 5, 2017
page 12 of 14 , Equity Analyst, (646) 805-5421, [email protected] Englert
Please see important disclosure information on pages 10 - 14 of this report.

Other Important DisclosuresJefferies does and seeks to do business with companies covered in its research reports. As a result, investors should be aware that Jefferies may have aconflict of interest that could affect the objectivity of this report. Investors should consider this report as only a single factor in making their investmentdecision.Jefferies Equity Research refers to research reports produced by analysts employed by one of the following Jefferies Group LLC (“Jefferies”) groupcompanies:United States: Jefferies LLC which is an SEC registered firm and a member of FINRA.United Kingdom: Jefferies International Limited, which is authorized and regulated by the Financial Conduct Authority; registered in England andWales No. 1978621; registered office: Vintners Place, 68 Upper Thames Street, London EC4V 3BJ; telephone +44 (0)20 7029 8000; facsimile +44 (0)207029 8010.Hong Kong: Jefferies Hong Kong Limited, which is licensed by the Securities and Futures Commission of Hong Kong with CE number ATS546; locatedat Suite 2201, 22nd Floor, Cheung Kong Center, 2 Queen’s Road Central, Hong Kong.Singapore: Jefferies Singapore Limited, which is licensed by the Monetary Authority of Singapore; located at 80 Raffles Place #15-20, UOB Plaza 2,Singapore 048624, telephone: +65 6551 3950.Japan: Jefferies (Japan) Limited, Tokyo Branch, which is a securities company registered by the Financial Services Agency of Japan and is a memberof the Japan Securities Dealers Association; located at Hibiya Marine Bldg, 3F, 1-5-1 Yuraku-cho, Chiyoda-ku, Tokyo 100-0006; telephone +813 52516100; facsimile +813 5251 6101.India: Jefferies India Private Limited (CIN - U74140MH2007PTC200509), which is licensed by the Securities and Exchange Board of India as a MerchantBanker (INM000011443), Research Analyst (INH000000701) and a Stock Broker with Bombay Stock Exchange Limited (INB011491033) and NationalStock Exchange of India Limited (INB231491037) in the Capital Market Segment; located at 42/43, 2 North Avenue, Maker Maxity, Bandra-KurlaComplex, Bandra (East) Mumbai 400 051, India; Tel +91 22 4356 6000.This material has been prepared by Jefferies employing appropriate expertise, and in the belief that it is fair and not misleading. The information setforth herein was obtained from sources believed to be reliable, but has not been independently verified by Jefferies. Therefore, except for any obligationunder applicable rules we do not guarantee its accuracy. Additional and supporting information is available upon request. Unless prohibited by theprovisions of Regulation S of the U.S. Securities Act of 1933, this material is distributed in the United States ("US"), by Jefferies LLC, a US-registeredbroker-dealer, which accepts responsibility for its contents in accordance with the provisions of Rule 15a-6, under the US Securities Exchange Act of1934. Transactions by or on behalf of any US person may only be effected through Jefferies LLC. In the United Kingdom and European EconomicArea this report is issued and/or approved for distribution by Jefferies International Limited and is intended for use only by persons who have, or havebeen assessed as having, suitable professional experience and expertise, or by persons to whom it can be otherwise lawfully distributed. JefferiesInternational Limited Equity Research personnel are separated from other business groups and are not under their supervision or control. JefferiesInternational Limited has implemented policies to (i) address conflicts of interest related to the preparation, content and distribution of research reports,public appearances, and interactions between research analysts and those outside of the research department; (ii) ensure that research analysts areinsulated from the review, pressure, or oversight by persons engaged in investment banking services activities or other persons who might be biased intheir judgment or supervision; and (iii) promote objective and reliable research that reflects the truly held opinions of research analysts and prevents theuse of research reports or research analysts to manipulate or condition the market or improperly favor the interests of the Jefferies International Limitedor a current or prospective customer or class of customers. Jefferies International Limited may allow its analysts to undertake private consultancywork. Jefferies International Limited’s conflicts management policy sets out the arrangements Jefferies International Limited employs to manage anypotential conflicts of interest that may arise as a result of such consultancy work. Jefferies International Ltd, its affiliates or subsidiaries, may make amarket or provide liquidity in the financial instruments referred to in this investment recommendation. For Canadian investors, this material is intendedfor use only by professional or institutional investors. None of the investments or investment services mentioned or described herein is available toother persons or to anyone in Canada who is not a "Designated Institution" as defined by the Securities Act (Ontario). In Singapore, Jefferies SingaporeLimited is regulated by the Monetary Authority of Singapore. For investors in the Republic of Singapore, this material is provided by Jefferies SingaporeLimited pursuant to Regulation 32C of the Financial Advisers Regulations. The material contained in this document is intended solely for accredited,expert or institutional investors, as defined under the Securities and Futures Act (Cap. 289 of Singapore). If there are any matters arising from, orin connection with this material, please contact Jefferies Singapore Limited, located at 80 Raffles Place #15-20, UOB Plaza 2, Singapore 048624,telephone: +65 6551 3950. In Japan this material is issued and distributed by Jefferies (Japan) Limited to institutional investors only. In Hong Kong,this report is issued and approved by Jefferies Hong Kong Limited and is intended for use only by professional investors as defined in the Hong KongSecurities and Futures Ordinance and its subsidiary legislation. In the Republic of China (Taiwan), this report should not be distributed. The researchin relation to this report is conducted outside the PRC. This report does not constitute an offer to sell or the solicitation of an offer to buy any securitiesin the PRC. PRC investors shall have the relevant qualifications to invest in such securities and shall be responsible for obtaining all relevant approvals,licenses, verifications and/or registrations from the relevant governmental authorities themselves. In India this report is made available by JefferiesIndia Private Limited. In Australia this information is issued solely by Jefferies International Limited and is directed solely at wholesale clients withinthe meaning of the Corporations Act 2001 of Australia (the "Act") in connection with their consideration of any investment or investment servicethat is the subject of this document. Any offer or issue that is the subject of this document does not require, and this document is not, a disclosuredocument or product disclosure statement within the meaning of the Act. Jefferies International Limited is authorised and regulated by the FinancialConduct Authority under the laws of the United Kingdom, which differ from Australian laws. Jefferies International Limited has obtained relief underAustralian Securities and Investments Commission Class Order 03/1099, which conditionally exempts it from holding an Australian financial serviceslicence under the Act in respect of the provision of certain financial services to wholesale clients. Recipients of this document in any other jurisdictionsshould inform themselves about and observe any applicable legal requirements in relation to the receipt of this document.
This report is not an offer or solicitation of an offer to buy or sell any security or derivative instrument, or to make any investment. Any opinion orestimate constitutes the preparer's best judgment as of the date of preparation, and is subject to change without notice. Jefferies assumes no obligationto maintain or update this report based on subsequent information and events. Jefferies, its associates or affiliates, and its respective officers, directors,and employees may have long or short positions in, or may buy or sell any of the securities, derivative instruments or other investments mentioned ordescribed herein, either as agent or as principal for their own account. Upon request Jefferies may provide specialized research products or servicesto certain customers focusing on the prospects for individual covered stocks as compared to other covered stocks over varying time horizons orunder differing market conditions. While the views expressed in these situations may not always be directionally consistent with the long-term views
GSM
Company Update
October 5, 2017
page 13 of 14 , Equity Analyst, (646) 805-5421, [email protected] Englert
Please see important disclosure information on pages 10 - 14 of this report.

expressed in the analyst's published research, the analyst has a reasonable basis and any inconsistencies can be reasonably explained. This materialdoes not constitute a personal recommendation or take into account the particular investment objectives, financial situations, or needs of individualclients. Clients should consider whether any advice or recommendation in this report is suitable for their particular circumstances and, if appropriate,seek professional advice, including tax advice. The price and value of the investments referred to herein and the income from them may fluctuate. Pastperformance is not a guide to future performance, future returns are not guaranteed, and a loss of original capital may occur. Fluctuations in exchangerates could have adverse effects on the value or price of, or income derived from, certain investments. This report has been prepared independently ofany issuer of securities mentioned herein and not in connection with any proposed offering of securities or as agent of any issuer of securities. Noneof Jefferies, any of its affiliates or its research analysts has any authority whatsoever to make any representations or warranty on behalf of the issuer(s).Jefferies policy prohibits research personnel from disclosing a recommendation, investment rating, or investment thesis for review by an issuer priorto the publication of a research report containing such rating, recommendation or investment thesis. Any comments or statements made herein arethose of the author(s) and may differ from the views of Jefferies.
This report may contain information obtained from third parties, including ratings from credit ratings agencies such as Standard & Poor’s. Reproductionand distribution of third party content in any form is prohibited except with the prior written permission of the related third party. Third party contentproviders do not guarantee the accuracy, completeness, timeliness or availability of any information, including ratings, and are not responsible forany errors or omissions (negligent or otherwise), regardless of the cause, or for the results obtained from the use of such content. Third party contentproviders give no express or implied warranties, including, but not limited to, any warranties of merchantability or fitness for a particular purpose oruse. Third party content providers shall not be liable for any direct, indirect, incidental, exemplary, compensatory, punitive, special or consequentialdamages, costs, expenses, legal fees, or losses (including lost income or profits and opportunity costs) in connection with any use of their content,including ratings. Credit ratings are statements of opinions and are not statements of fact or recommendations to purchase, hold or sell securities. Theydo not address the suitability of securities or the suitability of securities for investment purposes, and should not be relied on as investment advice.
Jefferies research reports are disseminated and available primarily electronically, and, in some cases, in printed form. Electronic research issimultaneously available to all clients. Additional research products including models are available on Jefferies Global Markets Portal. This report orany portion hereof may not be reprinted, sold or redistributed without the written consent of Jefferies. Neither Jefferies nor any officer nor employee ofJefferies accepts any liability whatsoever for any direct, indirect or consequential damages or losses arising from any use of this report or its contents.
For Important Disclosure information, please visit our website at https://javatar.bluematrix.com/sellside/Disclosures.action or call 1.888.JEFFERIES
© 2017 Jefferies Group LLC
GSM
Company Update
October 5, 2017
page 14 of 14 , Equity Analyst, (646) 805-5421, [email protected] Englert
Please see important disclosure information on pages 10 - 14 of this report.