Icahn Conversion to T. Rowe Price ITS ABOUT BEING THERE. DaVita Inc. Conversion to T. Rowe Price.

T. ROWE PRICE
October 31, 2020ANNUAL REPORT
RPGEX Global Growth Stock Fund
PAGLX Global Growth Stock Fund– Advisor Class
RGGIX Global Growth Stock Fund– I Class
Beginning on January 1, 2021, as permitted by SEC regulations, paper copies of the T. Rowe Price funds’ annual and semiannual shareholder reports will no longer be mailed, unless you specifically request them. Instead, shareholder reports will be made available on the funds’ website (troweprice.com/prospectus), and you will be notified by mail with a website link to access the reports each time a report is posted to the site.
If you already elected to receive reports electronically, you will not be affected by this change and need not take any action. At any time, shareholders who invest directly in T. Rowe Price funds may generally elect to receive reports or other communications electronically by enrolling at troweprice.com/paperless or, if you are a retirement plan sponsor or invest in the funds through a financial intermediary (such as an investment advisor, broker-dealer, insurance company, or bank), by contacting your representative or your financial intermediary.
You may elect to continue receiving paper copies of future shareholder reports free of charge. To do so, if you invest directly with T. Rowe Price, please call T. Rowe Price as follows: IRA, nonretirement account holders, and institutional investors, 1-800-225-5132; small business retirement accounts, 1-800-492-7670. If you are a retirement plan sponsor or invest in the T. Rowe Price funds through a financial intermediary, please contact your representative or financial intermediary or follow additional instructions if included with this document. Your election to receive paper copies of reports will apply to all funds held in your account with your financial intermediary or, if you invest directly in the T. Rowe Price funds, with T. Rowe Price. Your election can be changed at any time in the future.
For more insights from T. Rowe Price investment professionals, go to troweprice.com.
argle_1020_P5Proof #

argle_1020_P5Proof #
Log in to your account at troweprice.com for more information.
* Certain mutual fund accounts that are assessed an annual account service fee can also save money by switching to e-delivery.
It’s fast—receive your statements and confirmations faster than U.S. mail.
It’s convenient—access your important account documents whenever you need them.
It’s secure—we protect your online accounts using “True Identity” to confirm new accounts and make verification faster and more secure.
It can save you money—where applicable, T. Rowe Price passes on the cost savings to fund holders.*
TO ENROLL:If you invest directly with T. Rowe Price, go to troweprice.com/paperless.
If you invest through an investment advisor, a bank, or a brokerage firm, please contact that organization and ask if it can provide electronic documentation.
Go PaperlessSign up for e-delivery of your statements, confirmations, and prospectuses or shareholder reports.
T. ROWE PRICE GlObAl GROWTh STOCk Fund
HIGHLIGHTS
nn The Global Growth Stock Fund returned 29.88% during the period, significantly outperforming both its benchmark, the MSCI All Country World Index Net, and the Lipper peer group average.
nn Relative performance was aided by stock selection in the consumer discretionary and information technology sectors, as well as overweight positions in those sectors. No sectors detracted from relative performance. At the regional level, stock selection in North America and developed Europe contributed the most; no regions detracted on a relative basis.
nn We have been focused on maintaining a broadly balanced portfolio and remained largely sector neutral in our positioning. Our largest overweights at the end of the reporting period were in the financials and consumer discretionary sectors, while our largest underweights were in consumer staples and energy. At the regional level, select emerging markets still represent a fertile source of long-term ideas and constituted a meaningful component of the portfolio.
nn We are constructive on global equities over the medium term, given the scale of the stimulus efforts around the globe, which should further support markets. However, we are cognizant of the current heightened risk environment and are focused on maintaining a diversified portfolio of our best ideas while making use of stock-specific opportunities to upgrade the portfolio when they arise.

argle_1020_P5Proof #
1
T. ROWE PRICE GlObAl GROWTh STOCk Fund
CIO Market Commentary
Global financial markets faced historic challenges during your fund’s fiscal year, the 12-month period ended October 31, 2020, as the spread of the coronavirus and lockdown measures decimated economic activity in the spring and led to sharp sell-offs. Markets were resilient, though, and many sectors finished in positive territory.
The year began on a positive note, with major stock benchmarks in the U.S., Europe, and Japan recording gains through the middle of February, but global markets became increasingly volatile as the pandemic spread outside China. As the extent of the crisis grew, investors rapidly moved their assets into U.S. Treasuries and cash. By March 23, the S&P 500 Index had fallen by about a third from the start of the year, and even traditionally safer areas of the market, such as high-quality bonds, sold off during the downturn.
In response to the rapid economic contraction, governments and central banks around the world took extraordinary actions to support the economy. In the U.S., the federal government approved relief packages totaling $2.4 trillion, or over 11% of gross domestic product, while the Federal Reserve cut interest rates close to zero and began massive purchases of government, mortgage-backed, and corporate bonds to stimulate the economy and increase liquidity in the fixed income market. In just a few months, the Fed engaged in twice as much quantitative easing as it did during the entire global financial crisis from 2008 to 2010. The European Central Bank and the Bank of Japan also committed to significant asset purchase programs, and other central banks cut rates or bought bonds to support their economies.
Boosted by the stimulus and an easing of lockdowns during the summer, global economies began a rapid recovery, although most indicators remained below pre-pandemic levels at the end of the period. Financial markets also rebounded, but it was an uneven recovery.
Investors favored mega-cap information technology and internet-related firms, which benefited from the work-from-home environment and an acceleration in demand for online services, while other sectors have yet to bounce back. Energy companies were hit hard by a steep drop in oil prices due to declining demand, and airlines, hotels, and shopping centers struggled amid lockdown orders and consumer reluctance to resume activities where social distancing wasn’t possible.

argle_1020_P5Proof #
2
T. ROWE PRICE GlObAl GROWTh STOCk Fund
Growth stocks significantly outperformed value shares during the period, and U.S. equities, led by the tech giants, generally outpaced international benchmarks. Asian shares performed well as China and other countries in the region have been successful in controlling the coronavirus, while European stocks produced negative returns as a resurgence of the virus led to a second round of lockdowns at the end of the period. Despite steep losses in Latin America, emerging markets stocks recorded generally solid gains.
The U.S. dollar weakened during the period, as negative real (inflation-adjusted) interest rates and slower growth relative to the rest of the world made the greenback less attractive. Currency results varied widely at the country level, but a stronger euro and yen aided returns for U.S. investors in Europe and Japan, respectively. In the fixed income universe, Treasuries recorded solid gains as yields dropped to record lows, and investment-grade corporate bonds rallied on strong investor demand.
As the period ended in late October, rising coronavirus caseloads in the U.S. and Europe made it clear that the pandemic is not over, although we are hopeful that a vaccine will bring about an eventual return to normalcy in the new year. Whatever challenges we face in 2021, I can assure you that our commitment to fundamental research remains steady.
Our investment teams continue to meet regularly with executives from the companies we are investing in, although video conferencing has largely replaced on-site visits. We remain focused on the long term and continue to ground our decision-making in rigorous analysis, an approach that we believe will benefit our shareholders in this dynamic market environment.
Thank you for your continued confidence in T. Rowe Price.
Sincerely,
Robert SharpsGroup Chief Investment Officer

argle_1020_P5Proof #
3
T. ROWE PRICE GlObAl GROWTh STOCk Fund
Management’s discussion of Fund Performance
INVESTMENT OBJECTIVE
The fund seeks long-term growth of capital through investments primarily in the common stocks of large-cap companies throughout the world, including the U.S.
FUND COMMENTARY
How did the fund perform in the past 12 months?
The Global Growth Stock Fund returned 29.88% in the 12-month period ended October 31, 2020. The fund outperformed both the MSCI All Country World Index Net benchmark, which returned 4.89%, and the Lipper Global Multi-Cap Growth Funds Average, which returned 21.32%. (Returns for the Advisor
and I Class shares reflect different fee structures. Past performance cannot guarantee future results.)
What factors influenced the fund’s performance?
From a sector perspective, the fund’s relative performance was aided by our stock selection in the consumer discretionary and information technology sectors, and our overweight positions in those sectors also helped. No sectors detracted
on a relative basis. At the regional level, holdings in North America and developed Europe were the most beneficial to relative performance. No regions detracted on a relative basis.
Within the consumer discretionary sector, our position in Tesla was the largest relative contributor. The stock spiked in late 2019 and early 2020 on encouraging news, including higher-than-expected deliveries in the last three months of 2019 as well as strong earnings results. Tesla continued to do well throughout 2020 amid bullish market sentiment and robust growth, with an aggressive ramp-up in production for the new Model Y and made-in-China Model 3. We think Tesla is a highly differentiated innovator that will continue to disrupt the automobile industry. The recent model releases further diversify its product lineup, and its recently opened Chinese production facility and
Total ReturnPeriods Ended 10/31/20 6 Months 12 Months
Global Growth Stock Fund 27.49% 29.88%
Global Growth Stock Fund–Advisor Class 27.31 29.63
Global Growth Stock Fund– I Class 27.57 30.00
MSCI All Country World Index net 13.61 4.89
lipper Global Multi-Cap Growth Funds Average 22.06 21.32
PERFORMANCE COMPARISON

argle_1020_P5Proof #
4
T. ROWE PRICE GlObAl GROWTh STOCk Fund
improving scale and financial discipline should enable Tesla to continue to gain market share. (Please refer to the portfolio of investments for a complete list of holdings and the amount each represents in the portfolio.)
Within the information technology sector, DocuSign, the leader in the large and rapidly growing electronic signature (e-signature) market, led relative results. The firm reported a series of strong earnings results highlighted by impressive billings growth, retention rates, and new customer additions as the coronavirus has accelerated digital transformation. Going forward, we think DocuSign will benefit from increased adoption of e-signature processes as part of a broader risk mitigation effort that companies will put in place via digitization of previously physical processes.
Our position in Southeast Asian mobile gaming and e-commerce platform Sea within the communication services sector also boosted relative performance. The stock rose on consistently solid earnings results, with healthy growth across all business segments. Gaming and e-commerce business Shopee accelerated in terms of revenue and user adoption, and the firm’s financial technology business SeaMoney, while in its infancy, is showing promise. The coronavirus pandemic has structurally shifted user behavior online to a staggering degree, which has been a boon for Sea. We think the company is strongly positioned to become the largest internet platform and game operator in the region.
How is the fund positioned?
Despite the unprecedented volatility and uncertainty present in markets over the past year, we maintained our focus on building the portfolio from the bottom up. As we entered the year, we had already reduced the degree of risk within the portfolio and were playing it “down the middle of the fairway” to maintain a balanced portfolio that is largely sector neutral and account for the mosaic of risk and return opportunities that we were seeing in the market. While the coronavirus pandemic was a shock to the global financial system and there remains significant uncertainty, we gradually started to add more risk to the portfolio, buying names we want to own on the other side of the pandemic at much cheaper prices. As the year progressed and markets reached new highs after the sharp March sell-off, we saw a greater degree of difficulty in navigating the global landscape and, in this environment, we believed a diversified and balanced portfolio was more important than ever. We still own a blend of structural winners, durable compounders, and higher-yielding names that held up well during the March sell-off but lagged on the way back up. The portfolio remains well diversified across sectors and regions with a focus on stocks that have the potential for robust returns over a two- to three-year time horizon.
argle_1020_P5Proof #
5
T. ROWE PRICE GlObAl GROWTh STOCk Fund
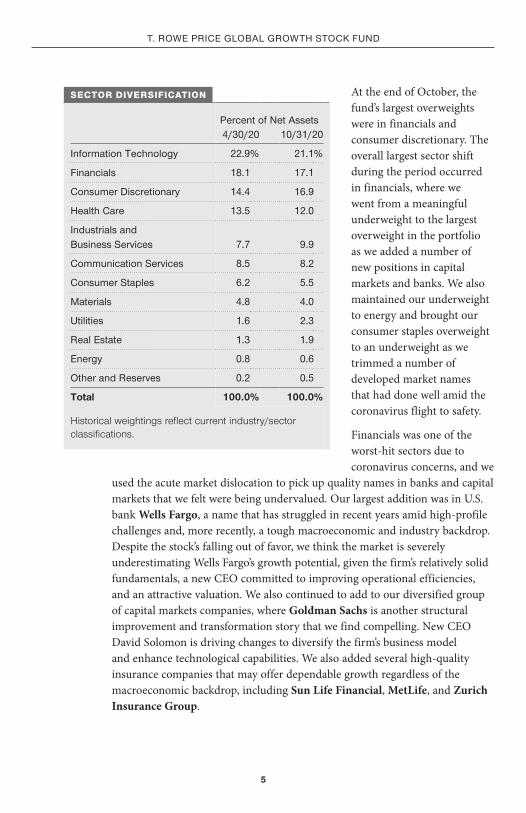
At the end of October, the fund’s largest overweights were in financials and consumer discretionary. The overall largest sector shift during the period occurred in financials, where we went from a meaningful underweight to the largest overweight in the portfolio as we added a number of new positions in capital markets and banks. We also maintained our underweight to energy and brought our consumer staples overweight to an underweight as we trimmed a number of developed market names that had done well amid the coronavirus flight to safety.
Financials was one of the worst-hit sectors due to coronavirus concerns, and we
used the acute market dislocation to pick up quality names in banks and capital markets that we felt were being undervalued. Our largest addition was in U.S. bank Wells Fargo, a name that has struggled in recent years amid high-profile challenges and, more recently, a tough macroeconomic and industry backdrop. Despite the stock’s falling out of favor, we think the market is severely underestimating Wells Fargo’s growth potential, given the firm’s relatively solid fundamentals, a new CEO committed to improving operational efficiencies, and an attractive valuation. We also continued to add to our diversified group of capital markets companies, where Goldman Sachs is another structural improvement and transformation story that we find compelling. New CEO David Solomon is driving changes to diversify the firm’s business model and enhance technological capabilities. We also added several high-quality insurance companies that may offer dependable growth regardless of the macroeconomic backdrop, including Sun Life Financial, MetLife, and Zurich Insurance Group.
Percent of net Assets4/30/20 10/31/20
Information Technology 22.9% 21.1%
Financials 18.1 17.1
Consumer discretionary 14.4 16.9
health Care 13.5 12.0
Industrials and business Services 7.7 9.9
Communication Services 8.5 8.2
Consumer Staples 6.2 5.5
Materials 4.8 4.0
utilities 1.6 2.3
Real Estate 1.3 1.9
Energy 0.8 0.6
Other and Reserves 0.2 0.5
Total 100.0% 100.0%
Historical weightings reflect current industry/sector classifications.
SECTOR DIVERSIFICATION

argle_1020_P5Proof #
6
T. ROWE PRICE GlObAl GROWTh STOCk Fund
Apart from the long-term secular tailwinds that have been present in health care, the coronavirus pandemic has brought forward nascent trends in the sector and put a number of industries in the spotlight amid the search for a COVID-19 (the disease caused by the coronavirus) vaccine and treatment therapies. Although we reduced our exposure to traditional pharmaceutical companies, we added meaningfully to the life sciences industry, starting positions in two contract research organizations (CROs), Evotec and PPD. CROs are vital to the pharmaceutical, biotechnology, and medical device industries, allowing them to be nimbler and broader in their research and development. This has become even more important in a global pandemic where there is a race to find ways to treat and protect people from a novel virus. We also initiated positions in DiaSorin, AstraZeneca, and Thermo Fisher Scientific, all names that we think will benefit from the current coronavirus landscape and beyond.
In consumer staples, we moved on from a number of names that had held up well during market volatility, like Nestle, as well as several with more subdued outlooks and where our conviction was lower, like Diageo, Heineken, and Turkish sweets manufacturer Ulker Biskuvi Sanayi.
Regionally, we increased our weightings to North America and developed Europe while reducing our exposure to Pacific ex-Japan, especially China. Many Asian stocks held up well as the region appeared to successfully slow or altogether eliminate the spread of the coronavirus. Meanwhile, developed Europe and U.S. stocks pulled back during the initial stages of the health crisis as these regions struggled with more acute outbreaks. While we are underweight North America, it still makes up the majority of our geographic allocation at approximately 57% of assets. We continue to maintain a significant overweight to emerging markets and favor what we consider the more fertile and demographically advantaged regions, such as India, Indonesia, the Philippines, Peru, and Vietnam. Our exposure to China is very purposeful in areas such as artificial intelligence and health care that we think can be long-term holds.
What is portfolio management’s outlook?
We think we are now at a point where, tactically, it makes sense to be more prudent than two or three months ago as there are still a number of significant risks for investors to contend with. We are seeing a resurgence of coronavirus cases in Europe and an extended first wave in many places in the U.S. It has proven more difficult to keep the spread at bay and, even though there are many vaccine candidates in development utilizing diverse technologies and platforms, it is far from a certainty that we will have an effective near-term

argle_1020_P5Proof #
7
T. ROWE PRICE GlObAl GROWTh STOCk Fund
solution. Additionally, results from the U.S. presidential election and the future of China-U.S. tensions remain a question mark. There is also the growing possibility of a hard Brexit, which could be viewed as a negative modifier if it were to occur and is another risk that needs to be monitored.
The breathtaking amount of fiscal and monetary stimulus from governments and central banks in both developed and emerging economies since March has created a firmly entrenched narrative that we are in an extremely low interest rate environment for longer, in a world with extremely low growth. We have seen a clear demarcation of winners and losers, with the ongoing pandemic rapidly accelerating what were already durable secular trends, and with limited alternatives for investors, more money has been chasing those winners. Concurrently, we are seeing other investor behaviors and broad sets of data points that suggest some areas of the market could be early in a bubble. These prospects just raise the complexity of the environment we are in and reemphasize the importance of focusing on the portfolio stock by stock.
While we have a more cautious near-term outlook for global equities, we continue to like what we own in the portfolio and remain more constructive over the medium term, given the scale of the stimulus efforts around the globe, which should further support risk assets. However, there are still significant and unpredictable risks to manage, and we think a measure of diversification remains key. With volatility likely to be an ongoing feature of markets near term, we will remain focused on our holdings and make use of stock-specific opportunities to upgrade the portfolio when they arise.
The views expressed reflect the opinions of T. Rowe Price as of the date of this report and are subject to change based on changes in market, economic, or other conditions. These views are not intended to be a forecast of future events and are no guarantee of future results.

argle_1020_P5Proof #
8
T. ROWE PRICE GlObAl GROWTh STOCk Fund
RISKS OF INTERNATIONAL INVESTING
Funds that invest overseas generally carry more risk than funds that invest strictly in U.S. assets. Risks can result from varying stages of economic and political development; differing regulatory environments, trading days, and accounting standards; and higher transaction costs of non-U.S. markets. Non-U.S. investments are also subject to currency risk, or a decline in the value of a foreign currency versus the U.S. dollar, which reduces the dollar value of securities denominated in that currency. The risks of investing outside the U.S. are heightened for any investments in emerging markets, which are susceptible to greater volatility than investments in developed markets.
BENCHMARK INFORMATION
Note: Lipper, a Thomson Reuters Company, is the source for all Lipper content reflected in these materials. Copyright 2020 © Refinitiv. All rights reserved. Any copying, republication or redistribution of Lipper content is expressly prohibited without the prior written consent of Lipper. Lipper shall not be liable for any errors or delays in the content, or for any actions taken in reliance thereon.
Note: MSCI makes no express or implied warranties or representations and shall have no liability whatsoever with respect to any MSCI data contained herein. The MSCI data may not be further redistributed or used as a basis for other indices or any securities or financial products. This report is not approved, reviewed, or produced by MSCI.

argle_1020_P5Proof #
9
T. ROWE PRICE GlObAl GROWTh STOCk Fund
TWENTY-FIVE LARGEST HOLDINGS
Percent ofnet Assets
10/31/20
Amazon.com, united States 3.2%Alibaba Group holding, China 2.5Alphabet, united States 2.4Facebook, united States 1.9nextEra Energy, united States 1.2
Evotec, Germany 1.2Wells Fargo, united States 1.2Tencent holdings, China 1.1Sempra Energy, united States 1.1Roper Technologies, united States 1.1
Fiserv, united States 1.0hdFC bank, India 1.0Sea, Singapore 1.0FedEx, united States 1.0Apple, united States 0.9
danaher, united States 0.9Chubb, united States 0.9kotak Mahindra bank, India 0.9Salesforce.com, united States 0.9Microsoft, united States 0.9
Morgan Stanley, united States 0.9Fifth Third bancorp, united States 0.8Charles Schwab, united States 0.8Workday, united States 0.8Intuit, united States 0.8
Total 30.4%
Note: The information shown does not reflect any exchange-traded funds (ETFs), cash reserves, or collateral for securities lending that may be held in the portfolio.
PORTFOLIO HIGHLIGHTS

argle_1020_P5Proof #
10
T. ROWE PRICE GlObAl GROWTh STOCk Fund
AVERAGE ANNUAL COMPOUND TOTAL RETURN
Periods Ended 10/31/20 1 Year 5 Years 10 YearsSince
InceptionInception
date
Global Growth Stock Fund 29.88% 15.07% 11.71% – –
Global Growth Stock Fund–Advisor Class 29.63 14.90 11.57 – –
Global Growth Stock Fund– I Class 30.00 – – 18.46% 3/6/17
This table shows how the fund would have performed each year if its actual (or cumulative) returns for the periods shown had been earned at a constant rate. Returns do not reflect taxes that the shareholder may pay on fund distributions or the redemption of fund shares. Past performance cannot guarantee future results.
This chart shows the value of a hypothetical $10,000 investment in the fund over the past 10 fiscal year periods or since inception (for funds lacking 10-year records). The result is compared with benchmarks, which include a broad-based market index and may also include a peer group average or index. Market indexes do not include expenses, which are deducted from fund returns as well as mutual fund averages and indexes.
GROWTH OF $10,000
As of 10/31/20
$30,26021,38727,084
Global Growth Stock FundMSCI All Country World Index NetLipper Global Multi-Cap Growth Funds Average
10/2010/1910/1810/1710/1610/1510/1410/1310/1210/1110/10
10,000
15,000
20,000
25,000
30,000
$35,000
GLOBAL GROWTH STOCK FUND
Note: Performance for the Advisor and I Class shares will vary due to their differing fee structures. See the Average Annual Compound Total Return table.

argle_1020_P5Proof #
11
T. ROWE PRICE GlObAl GROWTh STOCk Fund
EXPENSE RATIO
Global Growth Stock Fund 0.90%
Global Growth Stock Fund–Advisor Class 1.21
Global Growth Stock Fund–I Class 0.72
The expense ratio shown is as of the fund’s most recent prospectus. This number may vary from the expense ratio shown elsewhere in this report because it is based on a different time period and, if applicable, includes acquired fund fees and expenses but does not include fee or expense waivers.
FUND EXPENSE EXAMPLE
As a mutual fund shareholder, you may incur two types of costs: (1) transaction costs, such as redemption fees or sales loads, and (2) ongoing costs, including management fees, distribution and service (12b-1) fees, and other fund expenses. The following example is intended to help you understand your ongoing costs (in dollars) of investing in the fund and to compare these costs with the ongoing costs of investing in other mutual funds. The example is based on an investment of $1,000 invested at the beginning of the most recent six-month period and held for the entire period.
Please note that the fund has three share classes: The original share class (Investor Class) charges no distribution and service (12b-1) fee, the Advisor Class shares are offered only through unaffiliated brokers and other financial intermediaries and charge a 0.25% 12b-1 fee, and I Class shares are available to institutionally oriented clients and impose no 12b-1 or administrative fee payment. Each share class is presented separately in the table.
Actual ExpensesThe first line of the following table (Actual) provides information about actual account values and expenses based on the fund’s actual returns. You may use the information on this line, together with your account balance, to estimate the expenses that you paid over the period. Simply divide your account value by $1,000 (for example, an $8,600 account value divided by $1,000 = 8.6), then multiply the result by the number on the first line under the heading “Expenses Paid During Period” to estimate the expenses you paid on your account during this period.
Hypothetical Example for Comparison PurposesThe information on the second line of the table (Hypothetical) is based on hypothetical account values and expenses derived from the fund’s actual expense ratio and an assumed 5% per year rate of return before expenses (not the fund’s actual return). You may compare the ongoing costs of investing in the fund with other funds by contrasting this 5% hypothetical example and the 5% hypothetical examples that appear in the shareholder reports of the other funds. The hypothetical account values and expenses may not be used to estimate the actual ending account balance or expenses you paid for the period.

argle_1020_P5Proof #
12
T. ROWE PRICE GlObAl GROWTh STOCk Fund
FUND EXPENSE EXAMPLE (CONTINUED)
Note: T. Rowe Price charges an annual account service fee of $20, generally for accounts with less than $10,000. The fee is waived for any investor whose T. Rowe Price mutual fund accounts total $50,000 or more; accounts electing to receive electronic delivery of account statements, transaction confirmations, prospectuses, and shareholder reports; or accounts of an investor who is a T. Rowe Price Personal Services or Enhanced Personal Services client (enrollment in these programs generally requires T. Rowe Price assets of at least $250,000). This fee is not included in the accompanying table. If you are subject to the fee, keep it in mind when you are estimating the ongoing expenses of investing in the fund and when comparing the expenses of this fund with other funds.
You should also be aware that the expenses shown in the table highlight only your ongoing costs and do not reflect any transaction costs, such as redemption fees or sales loads. Therefore, the second line of the table is useful in comparing ongoing costs only and will not help you determine the relative total costs of owning different funds. To the extent a fund charges transaction costs, however, the total cost of owning that fund is higher.
beginning Account Value
5/1/20
Ending Account Value
10/31/20
Expenses Paid during Period*
5/1/20 to 10/31/20
Investor ClassActual $1,000.00 $1,274.90 $4.75
hypothetical (assumes 5% return before expenses) 1,000.00 1,020.96 4.22
Advisor ClassActual 1,000.00 1,273.10 6.29
hypothetical (assumes 5% return before expenses) 1,000.00 1,019.61 5.58
I ClassActual 1,000.00 1,275.70 3.89
hypothetical (assumes 5% return before expenses) 1,000.00 1,021.72 3.46
* Expenses are equal to the fund’s annualized expense ratio for the 6-month period, multiplied by the average account value over the period, multiplied by the number of days in the most recent fiscal half year (184), and divided by the days in the year (366) to reflect the half-year period. The annualized expense ratio of the Investor Class was 0.83%, the Advisor Class was 1.10%, and the I Class was 0.68%.
GLOBAL GROWTH STOCK FUND

argle_1020_P5Proof #
13
T. ROWE PRICE GlObAl GROWTh STOCk Fund
QUARTER-END RETURNS
Periods Ended 9/30/20 1 Year 5 Years 10 YearsSince
InceptionInception
date
Global Growth Stock Fund 33.20% 16.84% 12.28% – –
Global Growth Stock Fund– Advisor Class 32.92 16.67 12.13 – –
Global Growth Stock Fund– I Class 33.33 – – 18.96% 3/6/17
The fund’s performance information represents only past performance and is not necessarily an indication of future results. Current performance may be lower or higher than the performance data cited. Share price, principal value, and return will vary, and you may have a gain or loss when you sell your shares. For the most recent month-end performance, please visit our website (troweprice.com) or contact a T. Rowe Price representative at 1-800-225-5132 or, for Advisor and I Class shares, 1-800-638-8790.
This table provides returns through the most recent calendar quarter-end rather than through the end of the fund’s fiscal period. It shows how the fund would have performed each year if its actual (or cumulative) returns for the periods shown had been earned at a constant rate. Average annual total return figures include changes in principal value, reinvested dividends, and capital gain distributions. Returns do not reflect taxes that the shareholder may pay on fund distributions or the redemption of fund shares. When assessing performance, investors should consider both short- and long-term returns.

argle_1020_P5Proof #
14
T. ROWE PRICE GlObAl GROWTh STOCk Fund
FINANCIAL HIGHLIGHTS For a share outstanding throughout each period
Investor Class
Year Ended
10/31/20 10/31/19 10/31/18 10/31/17 10/31/16
NET ASSET VALUE Beginning of period $ 28.60 $ 24.74 $ 24.92 $ 19.46 $ 19.94
Investment activities
Net investment income(1) (2) 0.03 0.10 0.02 0.06 0.08
Net realized and unrealized gain/loss 8.50 4.15 –(3) 5.53 0.37
Total from investment activities 8.53 4.25 0.02 5.59 0.45
Distributions
Net investment income (0.07) – – (0.09) (0.18)
Net realized gain – (0.39) (0.21) (0.04) (0.75)
Total distributions (0.07) (0.39) (0.21) (0.13) (0.93)
Redemption fees added to paid-in capital(1) (4) – – (3) 0.01 – (3) – (3)
NET ASSET VALUE End of period $ 37.06 $ 28.60 $ 24.74 $ 24.92 $ 19.46

argle_1020_P5Proof #
15
The accompanying notes are an integral part of these financial statements.
T. ROWE PRICE GlObAl GROWTh STOCk Fund
FINANCIAL HIGHLIGHTS For a share outstanding throughout each period
Investor Class
Year Ended
10/31/20 10/31/19 10/31/18 10/31/17 10/31/16
Ratios/Supplemental Data
Total return(2) (5) 29.88% 17.53% 0.10% 28.93% 2.40%
Ratios to average net assets:(2)
Gross expenses before waivers/payments by Price Associates 0.85% 0.93% 1.00% 1.10% 1.19%
Net expenses after waivers/payments by Price Associates 0.85% 0.93% 1.00% 1.01% 1.00%
Net investment income 0.09% 0.37% 0.09% 0.28% 0.44%
Portfolio turnover rate 85.4% 66.3% 120.0% 69.7% 73.3%
Net assets, end of period (in thousands) $ 482,762 $ 226,633 $ 172,872 $ 136,932 $ 92,748
(1) Per share amounts calculated using average shares outstanding method. (2) See Note 8 for details of expense-related arrangements with Price Associates. (3) Amounts round to less than $0.01 per share. (4) The fund charged redemption fees through March 31, 2019. (5) Total return reflects the rate that an investor would have earned on an investment in the fund
during each period, assuming reinvestment of all distributions, and payment of no redemption or account fees, if applicable.

argle_1020_P5Proof #
16
T. ROWE PRICE GlObAl GROWTh STOCk Fund
FINANCIAL HIGHLIGHTS For a share outstanding throughout each period
Advisor Class
Year Ended
10/31/20 10/31/19 10/31/18 10/31/17 10/31/16
NET ASSET VALUE Beginning of period $ 28.43 $ 24.58 $ 24.77 $ 19.34 $ 19.81
Investment activities
Net investment income (loss)(1) (2) (0.07) 0.06 –(3) 0.04 0.07
Net realized and unrealized gain/loss 8.48 4.11 –(3) 5.50 0.36
Total from investment activities 8.41 4.17 –(3) 5.54 0.43
Distributions
Net investment income (0.06) – – (0.07) (0.15)
Net realized gain – (0.32) (0.19) (0.04) (0.75)
Total distributions (0.06) (0.32) (0.19) (0.11) (0.90)
NET ASSET VALUE End of period $ 36.78 $ 28.43 $ 24.58 $ 24.77 $ 19.34

argle_1020_P5Proof #
17
The accompanying notes are an integral part of these financial statements.
T. ROWE PRICE GlObAl GROWTh STOCk Fund
FINANCIAL HIGHLIGHTS For a share outstanding throughout each period
Advisor Class
Year Ended
10/31/20 10/31/19 10/31/18 10/31/17 10/31/16
Ratios/Supplemental Data
Total return(2) (4) 29.63% 17.25% (0.02)% 28.82% 2.31%
Ratios to average net assets:(2)
Gross expenses before waivers/payments by Price Associates 1.12% 1.21% 1.18% 1.38% 1.45%
Net expenses after waivers/payments by Price Associates 1.10% 1.10% 1.10% 1.11% 1.10%
Net investment income (loss) (0.20)% 0.21% (0.02)% 0.17% 0.36%
Portfolio turnover rate 85.4% 66.3% 120.0% 69.7% 73.3%
Net assets, end of period (in thousands) $ 13,668 $ 3,637 $ 2,363 $ 1,960 $ 1,373
(1) Per share amounts calculated using average shares outstanding method. (2) See Note 8 for details of expense-related arrangements with Price Associates. (3) Amounts round to less than $0.01 per share. (4) Total return reflects the rate that an investor would have earned on an investment in the fund
during each period, assuming reinvestment of all distributions, and payment of no redemption or account fees, if applicable.

argle_1020_P5Proof #
18
T. ROWE PRICE GlObAl GROWTh STOCk Fund
FINANCIAL HIGHLIGHTS For a share outstanding throughout each period
I Class
Year Ended
10/31/20 10/31/19 10/31/18
3/6/17(1) Through 10/31/17
NET ASSET VALUE Beginning of period $ 28.66 $ 24.81 $ 24.97 $ 20.65
Investment activities
Net investment income(2) (3) 0.09 0.16 0.09 0.02
Net realized and unrealized gain/loss 8.49 4.15 –(4) 4.30
Total from investment activities 8.58 4.31 0.09 4.32
Distributions
Net investment income (0.08) (0.06) (0.03) –
Net realized gain – (0.40) (0.22) –
Total distributions (0.08) (0.46) (0.25) –
NET ASSET VALUE End of period $ 37.16 $ 28.66 $ 24.81 $ 24.97

argle_1020_P5Proof #
19
The accompanying notes are an integral part of these financial statements.
T. ROWE PRICE GlObAl GROWTh STOCk Fund
FINANCIAL HIGHLIGHTS For a share outstanding throughout each period
I Class
Year Ended
10/31/20 10/31/19 10/31/18
3/6/17(1) Through 10/31/17
Ratios/Supplemental Data
Total return(3) (5) 30.00% 17.78% 0.33% 20.92%
Ratios to average net assets:(3)
Gross expenses before waivers/payments by Price Associates 0.69% 0.72% 0.74% 0.89%(6)
Net expenses after waivers/payments by Price Associates 0.69% 0.69% 0.68% 0.70%(6)
Net investment income 0.27% 0.59% 0.32% 0.20%(6)
Portfolio turnover rate 85.4% 66.3% 120.0% 69.7%
Net assets, end of period (in thousands) $ 659,189 $ 262,632 $ 211,811 $ 34,109
(1) Inception date (2) Per share amounts calculated using average shares outstanding method. (3) See Note 8 for details of expense-related arrangements with Price Associates. (4) Amounts round to less than $0.01 per share. (5) Total return reflects the rate that an investor would have earned on an investment in the fund
during each period, assuming reinvestment of all distributions, and payment of no redemption or account fees, if applicable. Total return is not annualized for periods less than one year.
(6) Annualized

argle_1020_P5Proof #
20
T. ROWE PRICE GlObAl GROWTh STOCk Fund
October 31, 2020
PORTFOLIO OF INVESTMENTS‡
(Cost and value in $000s)
ARGENTINA 0.5%
Common Stocks 0.5%
MercadoLibre (USD) (1) 4,340 5,269
Total Argentina (Cost $1,055) 5,269
BRAZIL 1.3%
Common Stocks 1.3%
Magazine Luiza 1,106,216 4,729
StoneCo, Class A (USD) (1) 94,960 4,989
XP, Class A (USD) (1) 122,963 4,929
Total Brazil (Cost $7,971) 14,647
CANADA 2.6%
Common Stocks 2.6%
Brookfield Asset Management, Class A (USD) 260,699 7,764
Lundin Mining 693,000 4,187
Magna International (USD) 60,900 3,113
National Bank of Canada 47,469 2,278
Shopify, Class A (USD) (1) 6,823 6,314
Sun Life Financial (USD) 171,066 6,812
Total Canada (Cost $24,612) 30,468
CAYMAN ISLANDS 0.5%
Common Stocks 0.3%
ANT International, Class C, Acquisition Date: 6/7/18, Cost: $2,115 (USD) (1)(2) 377,026 3,891
3,891
Convertible Preferred Stocks 0.2%
ByteDance, Series E, Acquisition Date: 7/8/19, Cost: $1,291 (USD) (1)(2)(3) 26,185 2,162
2,162
Total Cayman Islands (Cost $3,406) 6,053
Shares $ Value

argle_1020_P5Proof #
21
Shares $ Value
T. ROWE PRICE GlObAl GROWTh STOCk Fund
(Cost and value in $000s)
CHINA 5.8%
Common Stocks 5.1%
Alibaba Group Holding, ADR (USD) (1) 94,040 28,653
China Resources Beer Holdings (HKD) 702,000 4,356
GDS Holdings, Class A (HKD) (1) 225,177 2,349
JD.com, ADR (USD) (1) 48,640 3,965
MINISO Group Holding, Class A, ADR (USD) (1)(4) 166,759 3,185
Tencent Holdings (HKD) 168,700 12,890
Wuxi Biologics Cayman (HKD) (1) 145,000 4,072
59,470
Common Stocks - China A Shares 0.7%
Glodon, A Shares (CNH) 295,211 3,143
Gree Electric Appliances of Zhuhai, A Shares (CNH) 527,200 4,622
7,765
Total China (Cost $41,147) 67,235
FRANCE 1.3%
Common Stocks 1.3%
EssilorLuxottica (1) 37,158 4,587
Eurofins Scientific (1) 10,478 8,344
Safran (1) 25,774 2,719
Total France (Cost $11,284) 15,650
GERMANY 6.0%
Common Stocks 5.6%
Delivery Hero (1) 70,000 8,036
Evotec (1)(4) 531,883 14,056
Flatex (1) 45,075 2,415
Infineon Technologies 292,536 8,145
Shop Apotheke Europe (1) 33,286 5,523
Siemens 49,356 5,790
Symrise 68,604 8,460
TeamViewer (1) 86,403 3,808

argle_1020_P5Proof #
22
Shares $ Value
T. ROWE PRICE GlObAl GROWTh STOCk Fund
(Cost and value in $000s)
Zalando (1) 94,524 8,802
65,035
Preferred Stocks 0.4%
Sartorius (5) 11,167 4,727
4,727
Total Germany (Cost $55,208) 69,762
HONG KONG 0.9%
Common Stocks 0.9%
AIA Group 744,800 7,088
Galaxy Entertainment Group 515,000 3,404
Total Hong Kong (Cost $9,815) 10,492
INDIA 4.7%
Common Stocks 4.7%
Axis Bank (1) 651,752 4,307
Britannia Industries 82,925 3,889
Godrej Consumer Products 364,832 3,278
Havells India 430,193 4,230
HDFC Asset Management 81,425 2,472
HDFC Bank (1) 356,243 5,684
HDFC Bank, ADR (USD) (1)(4) 104,588 6,008
Housing Development Finance 174,558 4,523
Kotak Mahindra Bank (1) 517,954 10,792
One97 Communications, Series G, Acquisition Date: 12/3/19, Cost: $1,563 (USD) (1)(2)(3) 6,139 1,565
Pidilite Industries 171,452 3,633
United Spirits (1) 502,356 3,418
Total India (Cost $46,552) 53,799
INDONESIA 1.5%
Common Stocks 1.5%
Bank Central Asia 4,246,000 8,355
Kalbe Farma 22,960,200 2,382

argle_1020_P5Proof #
23
Shares $ Value
T. ROWE PRICE GlObAl GROWTh STOCk Fund
(Cost and value in $000s)
Sumber Alfaria Trijaya 76,706,500 3,558
Unilever Indonesia 5,762,400 3,058
Total Indonesia (Cost $15,824) 17,353
ITALY 0.6%
Common Stocks 0.6%
DiaSorin 29,611 6,500
Total Italy (Cost $5,858) 6,500
JAPAN 1.5%
Common Stocks 1.5%
Daiichi Sankyo 87,700 2,315
FANUC 10,700 2,260
Keyence 15,900 7,216
Recruit Holdings 68,200 2,595
Sumitomo Metal Mining 102,000 3,170
Total Japan (Cost $11,711) 17,556
NETHERLANDS 1.7%
Common Stocks 1.7%
Adyen (1) 3,338 5,611
Argenx, ADR (USD) (1) 14,806 3,674
ASML Holding (USD) 15,778 5,699
Koninklijke DSM 30,934 4,947
Total Netherlands (Cost $10,980) 19,931
NIGERIA 0.2%
Common Stocks 0.2%
Nestle Nigeria 517,381 1,904
Total Nigeria (Cost $1,876) 1,904

argle_1020_P5Proof #
24
Shares $ Value
T. ROWE PRICE GlObAl GROWTh STOCk Fund
(Cost and value in $000s)
NORWAY 0.2%
Common Stocks 0.2%
Norsk Hydro (1) 876,552 2,463
Total Norway (Cost $2,123) 2,463
PERU 0.9%
Common Stocks 0.9%
Credicorp (USD) 46,446 5,326
InRetail Peru (USD) 167,257 5,637
Total Peru (Cost $11,015) 10,963
PHILIPPINES 1.9%
Common Stocks 1.9%
Ayala Land 4,847,400 3,300
BDO Unibank 1,735,713 3,178
Jollibee Foods 1,083,340 3,799
SM Investments 357,086 7,003
Universal Robina 1,494,990 4,252
Total Philippines (Cost $23,200) 21,532
PORTUGAL 0.2%
Common Stocks 0.2%
Galp Energia 266,365 2,163
Total Portugal (Cost $3,326) 2,163
SINGAPORE 1.0%
Common Stocks 1.0%
Sea, ADR (USD) (1)(4) 72,804 11,481
Total Singapore (Cost $837) 11,481

argle_1020_P5Proof #
25
Shares $ Value
T. ROWE PRICE GlObAl GROWTh STOCk Fund
(Cost and value in $000s)
SOUTH AFRICA 0.4%
Common Stocks 0.4%
Naspers, N Shares (1) 23,897 4,665
Total South Africa (Cost $4,022) 4,665
SOUTH KOREA 0.5%
Common Stocks 0.5%
Samsung Electronics 107,054 5,381
Total South Korea (Cost $4,425) 5,381
SWEDEN 1.7%
Common Stocks 1.7%
Assa Abloy, B Shares 288,531 6,184
Boliden 169,090 4,611
Hexagon, B Shares (1) 76,724 5,624
Swedbank, A Shares (1) 242,871 3,802
Total Sweden (Cost $15,870) 20,221
SWITZERLAND 2.0%
Common Stocks 2.0%
Julius Baer Group 94,096 4,188
Lonza Group 11,155 6,759
Partners Group Holding 4,398 3,960
Temenos 25,824 2,775
Zurich Insurance Group 15,272 5,072
Total Switzerland (Cost $20,666) 22,754
UNITED KINGDOM 6.5%
Common Stocks 6.5%
Ashtead Group 118,818 4,294
ASOS (1) 70,016 3,995
AstraZeneca, ADR (USD) 110,965 5,566
boohoo Group (1)(4) 1,587,062 5,562

argle_1020_P5Proof #
26
Shares $ Value
T. ROWE PRICE GlObAl GROWTh STOCk Fund
(Cost and value in $000s)
Derwent London 74,918 2,580
Experian 179,153 6,563
Farfetch, Class A (USD) (1) 202,797 5,705
HomeServe 249,484 3,575
London Stock Exchange Group 40,680 4,385
Mondi 195,307 3,702
Next 52,403 3,958
Ocado Group (1) 170,939 5,041
Rentokil Initial (1) 845,623 5,757
THG Holdings (1) 751,765 6,424
Unilever 145,935 8,317
Total United Kingdom (Cost $60,789) 75,424
UNITED STATES 54.1%
Common Stocks 52.6%
Agilent Technologies 34,011 3,472
Alnylam Pharmaceuticals (1) 20,984 2,580
Alphabet, Class C (1) 17,420 28,238
Amazon.com (1) 12,091 36,710
American Campus Communities, REIT 30,594 1,146
Amphenol, Class A 45,003 5,078
Apple 100,632 10,955
Atlassian, Class A (1) 30,575 5,859
Avalara (1) 38,018 5,667
AvalonBay Communities, REIT 55,700 7,750
Booking Holdings (1) 1,984 3,219
Charles Schwab 232,618 9,563
Chart Industries (1) 80,700 6,815
Chubb 83,775 10,883
Cigna 48,408 8,083
Clorox 24,200 5,015
CME Group 21,168 3,190
Colgate-Palmolive 63,650 5,021
CoStar Group (1) 5,312 4,375
Coupa Software (1) 15,152 4,056

argle_1020_P5Proof #
27
Shares $ Value
T. ROWE PRICE GlObAl GROWTh STOCk Fund
(Cost and value in $000s)
Crowdstrike Holdings, Class A (1) 29,319 3,631
Danaher 47,605 10,927
Datadog, Class A (1) 45,264 4,108
DocuSign (1) 33,175 6,710
EOG Resources 127,313 4,359
Epic Games, Acquisition Date: 6/18/20, Cost: $3,528 (1)(2)(3) 6,136 3,528
Estee Lauder, Class A 23,590 5,182
Etsy (1) 47,329 5,755
Facebook, Class A (1) 83,568 21,988
FedEx 42,800 11,105
Fifth Third Bancorp 420,263 9,759
Fiserv (1) 125,892 12,019
FleetCor Technologies (1) 14,332 3,166
General Electric 1,160,487 8,611
Global Payments 55,300 8,723
Goldman Sachs Group 45,287 8,561
HCA Healthcare 31,569 3,913
Hilton Worldwide Holdings 37,620 3,303
IDEX 34,600 5,895
Incyte (1) 55,882 4,842
International Paper 122,975 5,380
Intuit 28,237 8,886
Intuitive Surgical (1) 10,578 7,056
KKR 243,906 8,329
Linde 23,888 5,263
Marriott International, Class A 35,705 3,316
Marsh & McLennan 45,359 4,693
MetLife 186,910 7,075
Microsoft 49,764 10,076
Monolithic Power Systems 11,900 3,803
Morgan Stanley 207,063 9,970
Netflix (1) 16,239 7,726
NextEra Energy 192,896 14,122
NVIDIA 8,100 4,061
Okta (1) 17,953 3,767
Paycom Software (1) 14,282 5,200

argle_1020_P5Proof #
28
Shares $ Value
T. ROWE PRICE GlObAl GROWTh STOCk Fund
(Cost and value in $000s)
PayPal Holdings (1) 28,324 5,272
Peloton Interactive, Class A (1) 38,100 4,199
PPD (1) 156,634 5,150
Prologis, REIT 18,008 1,786
Roper Technologies 34,298 12,736
salesforce.com (1) 44,599 10,359
Sempra Energy 102,638 12,867
ServiceNow (1) 13,712 6,823
Snap, Class A (1) 221,902 8,741
Snowflake, Class A (1)(4) 14,067 3,517
Splunk (1) 22,992 4,553
Stripe, Class B, Acquisition Date: 12/17/19, Cost: $296 (1)(2)(3) 18,846 296
Stryker 35,468 7,165
Teladoc Health (1)(4) 23,310 4,579
Teledyne Technologies (1) 18,819 5,818
Tesla (1) 11,045 4,286
Thermo Fisher Scientific 8,989 4,253
Tradeweb Markets, Class A 116,362 6,339
Trimble (1) 98,000 4,717
UnitedHealth Group 21,944 6,696
Veeva Systems, Class A (1) 25,380 6,854
Vertex Pharmaceuticals (1) 22,519 4,692
Visa, Class A 39,623 7,200
Waste Connections 49,243 4,891
Wayfair, Class A (1)(4) 22,500 5,581
Wells Fargo 621,261 13,326
Weyerhaeuser, REIT 179,791 4,906
Wix.com (1) 18,652 4,613
Workday, Class A (1) 43,523 9,145
Zendesk (1) 38,729 4,297
608,140
Convertible Preferred Stocks 1.6%
Aurora Innovation, Series B, Acquisition Date: 3/1/19, Cost: $605 (1)(2)(3) 65,500 605
Magic Leap, Series D, Acquisition Date: 10/12/17, Cost: $1,153 (1)(2)(3) 42,712 115

argle_1020_P5Proof #
29
Shares $ Value
T. ROWE PRICE GlObAl GROWTh STOCk Fund
(Cost and value in $000s)
Rappi, Series E, Acquisition Date: 9/8/20, Cost: $4,762 (1)(2)(3) 79,700 4,762
Rivian Automotive, Series E, Acquisition Date: 7/10/20, Cost: $5,756 (1)(2)(3) 371,582 5,756
SpaceX, Series K, Acquisition Date: 5/21/19, Cost: $2,163 (1)(2)(3) 10,605 2,863
Uipath, Series D-1, Acquisition Date: 4/26/19, Cost: $753 (1)(2)(3) 57,435 1,068
Uipath, Series D-2, Acquisition Date: 4/26/19, Cost: $127 (1)(2)(3) 9,645 179
Uipath, Series E, Acquisition Date: 7/9/20, Cost: $27 (1)(2)(3) 1,435 27
Waymo, Series A-2, Acquisition Date: 5/8/20, Cost: $2,587 (1)(2)(3) 30,126 2,587
17,962
Total United States (Cost $470,677) 626,102
VIETNAM 0.9%
Common Stocks 0.9%
Masan Group (1) 1,964,175 7,116
Military Commercial Joint Stock Bank (1) 3,907,171 3,143
Total Vietnam (Cost $9,305) 10,259
SHORT-TERM INVESTMENTS 0.6%
Money Market Funds 0.6%
T. Rowe Price Government Reserve Fund, 0.09% (6)(7) 6,980,504 6,981
Total Short-Term Investments (Cost $6,981) 6,981

argle_1020_P5Proof #
30
Shares $ Value
T. ROWE PRICE GlObAl GROWTh STOCk Fund
(Cost and value in $000s)(Cost and value in $000s)
SECURITIES LENDING COLLATERAL 2.6%
INVESTMENTS IN A POOLED ACCOUNT THROUGH SECURITIES LENDING PROGRAM WITH JPMORGAN CHASE BANK 2.6%
Short-Term Funds 2.6%
T. Rowe Price Short-Term Fund, 0.16% (6)(7) 3,037,133 30,371
Total Investments in a Pooled Account through Securities Lending Program with JPMorgan Chase Bank 30,371
Total Securities Lending Collateral (Cost $30,371) 30,371
Total Investments in Securities 102.7% of Net Assets (Cost $910,906) $ 1,187,379
‡
Country classifications are generally based on MSCI categories or another unaffiliated third party data provider; Shares are denominated in the currency of the country presented unless otherwise noted.
(1) Non-income producing (2)
Security cannot be offered for public resale without first being registered under the Securities Act of 1933 and related rules ("restricted security"). Acquisition date represents the day on which an enforceable right to acquire such security is obtained and is presented along with related cost in the security description. The fund has registration rights for certain restricted securities. Any costs related to such registration are borne by the issuer. The aggregate value of restricted securities (excluding 144A holdings) at period-end amounts to $29,404 and represents 2.5% of net assets.
(3) See Note 2. Level 3 in fair value hierarchy. (4) See Note 4. All or a portion of this security is on loan at October 31, 2020. (5)
Preferred stocks are shares that carry certain preferential rights. The dividend rate may not be consistent each pay period and could be zero for a particular year.
(6) Affiliated Companies (7) Seven-day yield
ADR American Depositary Receipts CNH Offshore China Renminbi HKD Hong Kong Dollar REIT
A domestic Real Estate Investment Trust whose distributions pass-through with original tax character to the shareholder
USD U.S. Dollar

argle_1020_P5Proof #
31
T. ROWE PRICE GlObAl GROWTh STOCk Fund
The accompanying notes are an integral part of these financial statements.
($000s)
AFFILIATED COMPANIES
The fund may invest in certain securities that are considered affiliated companies. As defined by the 1940 Act, an affiliated company is one in which the fund owns 5% or more of the outstanding voting securities, or a company that is under common ownership or control. The following securities were considered affiliated companies for all or some portion of the year ended October 31, 2020. Net realized gain (loss), investment income, change in net unrealized gain/loss, and purchase and sales cost reflect all activity for the period then ended.
Affiliate Net Realized Gain
(Loss)
Change in NetUnrealizedGain/Loss
InvestmentIncome
T. Rowe Price Government Reserve Fund $ — $ — $ 17 T. Rowe Price Short-Term Fund — — —++ Totals $ —# $ — $ 17+
Supplementary Investment Schedule
Affiliate Value
10/31/19Purchase
CostSalesCost
Value10/31/20
T. Rowe Price Government Reserve Fund $ 1,468 ¤ ¤ $ 6,981 T. Rowe Price Short-Term Fund 24,806 ¤ ¤ 30,371 Total $ 37,352^
# Capital gain distributions from mutual funds represented $0 of the net realized gain (loss). ++ Excludes earnings on securities lending collateral, which are subject to rebates and fees as
described in Note 4. + Investment income comprised $17 of dividend income and $0 of interest income. ¤ Purchase and sale information not shown for cash management funds. ^ The cost basis of investments in affiliated companies was $37,352.

argle_1020_P5Proof #
32
T. ROWE PRICE GlObAl GROWTh STOCk Fund
October 31, 2020
($000s, except shares and per share amounts)
STATEMENT OF ASSETS AND LIABILITIES
Assets Investments in securities, at value (cost $910,906) $ 1,187,379 Receivable for investment securities sold 9,139 Receivable for shares sold 2,978 Dividends receivable 354 Cash 230 Foreign currency (cost $70) 70 Other assets 419 Total assets 1,200,569
Liabilities Obligation to return securities lending collateral 30,371 Payable for investment securities purchased 12,961 Investment management fees payable 642 Payable for shares redeemed 446 Due to affiliates 73 Other liabilities 457 Total liabilities 44,950
N E T A S S E T S $ 1 , 1 5 5 , 6 1 9
argle_1020_P5Proof #
33
T. ROWE PRICE GlObAl GROWTh STOCk Fund
October 31, 2020
($000s, except shares and per share amounts)
The accompanying notes are an integral part of these financial statements.
STATEMENT OF ASSETS AND LIABILITIES
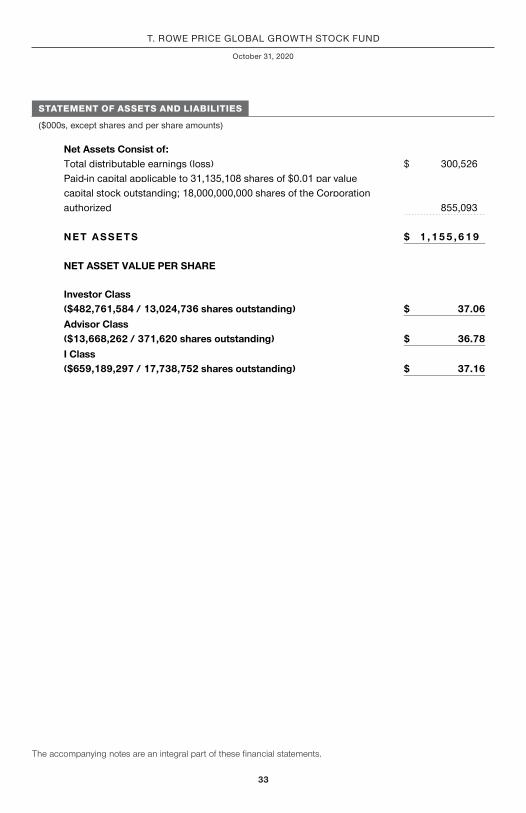
Net Assets Consist of: Total distributable earnings (loss) $ 300,526 Paid-in capital applicable to 31,135,108 shares of $0.01 par value capital stock outstanding; 18,000,000,000 shares of the Corporation authorized 855,093
N E T A S S E T S $ 1 , 1 5 5 , 6 1 9
NET ASSET VALUE PER SHARE
Investor Class ($482,761,584 / 13,024,736 shares outstanding) $ 37.06 Advisor Class ($13,668,262 / 371,620 shares outstanding) $ 36.78 I Class ($659,189,297 / 17,738,752 shares outstanding) $ 37.16

argle_1020_P5Proof #
34
T. ROWE PRICE GlObAl GROWTh STOCk Fund
($000s)
STATEMENT OF OPERATIONS
Year Ended
10/31/20Investment Income (Loss) Income Dividend (net of foreign taxes of $411) $ 7,395 Securities lending 320 Other, non cash 429
Total income 8,144 Expenses Investment management 5,459
Shareholder servicing Investor Class $ 495 Advisor Class 12 I Class 4 511
Rule 12b-1 fees Advisor Class 17
Prospectus and shareholder reports Investor Class 27 I Class 4 31
Custody and accounting 199 Registration 137 Legal and audit 87 Directors 2 Miscellaneous 37 Waived / paid by Price Associates (25)
Total expenses 6,455 Net investment income 1,689
Realized and Unrealized Gain / Loss Net realized gain (loss) Securities (net of foreign taxes of $1) 54,555 Forward currency exchange contracts 245 Foreign currency transactions (22)
Net realized gain 54,778

argle_1020_P5Proof #
35
T. ROWE PRICE GlObAl GROWTh STOCk Fund
($000s)
The accompanying notes are an integral part of these financial statements.
STATEMENT OF OPERATIONS
Year Ended
10/31/20Change in net unrealized gain / loss Securities (net of decrease in deferred foreign taxes of $20) 169,301 Forward currency exchange contracts (56) Other assets and liabilities denominated in foreign currencies 24
Change in net unrealized gain / loss 169,269 Net realized and unrealized gain / loss 224,047
INCREASE IN NET ASSETS FROM OPERATIONS $ 225,736

argle_1020_P5Proof #
36
T. ROWE PRICE GlObAl GROWTh STOCk Fund
($000s)
STATEMENT OF CHANGES IN NET ASSETS
YearEnded
10/31/20 10/31/19Increase (Decrease) in Net Assets Operations
Net investment income $ 1,689 $ 2,130 Net realized gain (loss) 54,778 (13,868) Change in net unrealized gain / loss 169,269 79,524
Increase in net assets from operations 225,736 67,786
Distributions to shareholders Net earnings Investor Class (562) (2,704) Advisor Class (7) (23) I Class (1,273) (3,942)
Decrease in net assets from distributions (1,842) (6,669)
Capital share transactions* Shares sold Investor Class 246,068 69,882 Advisor Class 10,162 1,789 I Class 181,557 46,701
Shares issued in connection with fund acquisition - I Class 151,133 –
Distributions reinvested Investor Class 532 2,548 Advisor Class 7 23 I Class 1,272 3,938 Shares redeemed Investor Class (74,716) (47,061) Advisor Class (1,901) (872) I Class (75,291) (32,226) Redemption fees received – 17
Increase in net assets from capital share transactions 438,823 44,739

argle_1020_P5Proof #
37
T. ROWE PRICE GlObAl GROWTh STOCk Fund
($000s)
The accompanying notes are an integral part of these financial statements.
STATEMENT OF CHANGES IN NET ASSETS
YearEnded
10/31/20 10/31/19Net Assets Increase during period 662,717 105,856 Beginning of period 492,902 387,046 En d o f p e r io d $ 1 , 1 5 5 , 6 1 9 $ 4 9 2 , 9 0 2
*Share information Shares sold Investor Class 7,448 2,583 Advisor Class 311 65 I Class 5,625 1,658
Shares issued in connection with fund acquisition - I Class 5,163 –
Distributions reinvested Investor Class 18 109 Advisor Class – 1 I Class 42 168 Shares redeemed Investor Class (2,366) (1,754) Advisor Class (67) (34) I Class (2,255) (1,199)
Increase in shares outstanding 13,919 1,597

argle_1020_P5Proof #
38
T. ROWE PRICE GlObAl GROWTh STOCk Fund
NOTES TO FINANCIAL STATEMENTS
T. Rowe Price International Funds, Inc. (the corporation) is registered under the Investment Company Act of 1940 (the 1940 Act). The Global Growth Stock Fund (the fund) is a diversified, open-end management investment company established by the corporation. The fund seeks long-term growth of capital through investments primarily in the common stocks of large-cap companies throughout the world, including the U.S. The fund has three classes of shares: the Global Growth Stock Fund (Investor Class), the Global Growth Stock Fund–Advisor Class (Advisor Class), and the Global Growth Stock Fund–I Class (I Class). Advisor Class shares are sold only through various brokers and other financial intermediaries. I Class shares require a $1 million initial investment minimum, although the minimum generally is waived for retirement plans, financial intermediaries, and certain other accounts. The Advisor Class operates under a Board-approved Rule 12b-1 plan pursuant to which the class compensates financial intermediaries for distribution, shareholder servicing, and/or certain administrative services; the Investor and I Classes do not pay Rule 12b-1 fees. Each class has exclusive voting rights on matters related solely to that class; separate voting rights on matters that relate to all classes; and, in all other respects, the same rights and obligations as the other classes.
NOTE 1 - SIGNIFICANT ACCOUNTING POLICIES
Basis of Preparation The fund is an investment company and follows accounting and reporting guidance in the Financial Accounting Standards Board (FASB) Accounting Standards Codification Topic 946 (ASC 946). The accompanying financial statements were prepared in accordance with accounting principles generally accepted in the United States of America (GAAP), including, but not limited to, ASC 946. GAAP requires the use of estimates made by management. Management believes that estimates and valuations are appropriate; however, actual results may differ from those estimates, and the valuations reflected in the accompanying financial statements may differ from the value ultimately realized upon sale or maturity.
Investment Transactions, Investment Income, and Distributions Investment transactions are accounted for on the trade date basis. Income and expenses are recorded on the accrual basis. Realized gains and losses are reported on the identified cost basis. Income tax-related interest and penalties, if incurred, are recorded as income tax expense. Dividends received from mutual fund investments are reflected as dividend income; capital gain distributions are reflected as realized gain/loss. Dividend income and capital gain distributions are recorded on the ex-dividend date. Distributions from

argle_1020_P5Proof #
39
T. ROWE PRICE GlObAl GROWTh STOCk Fund
REITs are initially recorded as dividend income and, to the extent such represent a return of capital or capital gain for tax purposes, are reclassified when such information becomes available. Non-cash dividends, if any, are recorded at the fair market value of the asset received. Distributions to shareholders are recorded on the ex-dividend date. Income distributions, if any, are declared and paid by each class annually. A capital gain distribution may also be declared and paid by the fund annually.
Currency Translation Assets, including investments, and liabilities denominated in foreign currencies are translated into U.S. dollar values each day at the prevailing exchange rate, using the mean of the bid and asked prices of such currencies against U.S. dollars as quoted by a major bank. Purchases and sales of securities, income, and expenses are translated into U.S. dollars at the prevailing exchange rate on the respective date of such transaction. The effect of changes in foreign currency exchange rates on realized and unrealized security gains and losses is not bifurcated from the portion attributable to changes in market prices.
Class Accounting Shareholder servicing, prospectus, and shareholder report expenses incurred by each class are charged directly to the class to which they relate. Expenses common to all classes, investment income, and realized and unrealized gains and losses are allocated to the classes based upon the relative daily net assets of each class. The Advisor Class pays Rule 12b-1 fees, in an amount not exceeding 0.25% of the class’s average daily net assets.
Redemption Fees Prior to April 1, 2019, a 2% fee was assessed on redemptions of fund shares held for 90 days or less to deter short-term trading and to protect the interests of long-term shareholders. Redemption fees were withheld from proceeds that shareholders received from the sale or exchange of fund shares. The fees were paid to the fund and were recorded as an increase to paid-in capital. The fees may have caused the redemption price per share to differ from the net asset value per share.
In-Kind Subscriptions Under certain circumstances, and when considered to be in the best interest of all shareholders, the fund may accept portfolio securities rather than cash as payment for the purchase of fund shares (in-kind subscription). For financial reporting and tax purposes, the cost basis of contributed securities is equal to the market value of the securities on the date of contribution. In-kind subscriptions result in no gain or loss and no tax consequences for the fund. During the year ended October 31, 2020, the fund accepted $34,107,000 of in-kind subscriptions all of which were from other T. Rowe Price funds.
argle_1020_P5Proof #
40
T. ROWE PRICE GlObAl GROWTh STOCk Fund
Capital Transactions Each investor’s interest in the net assets of the fund is represented by fund shares. The fund’s net asset value (NAV) per share is computed at the close of the New York Stock Exchange (NYSE), normally 4 p.m. ET, each day the NYSE is open for business. However, the NAV per share may be calculated at a time other than the normal close of the NYSE if trading on the NYSE is restricted, if the NYSE closes earlier, or as may be permitted by the SEC. Purchases and redemptions of fund shares are transacted at the next-computed NAV per share, after receipt of the transaction order by T. Rowe Price Associates, Inc., or its agents.
Indemnification In the normal course of business, the fund may provide indemnification in connection with its officers and directors, service providers, and/or private company investments. The fund’s maximum exposure under these arrangements is unknown; however, the risk of material loss is currently considered to be remote.
NOTE 2 - VALUATION
Fair Value The fund’s financial instruments are valued at the close of the NYSE and are reported at fair value, which GAAP defines as the price that would be received to sell an asset or paid to transfer a liability in an orderly transaction between market participants at the measurement date. The T. Rowe Price Valuation Committee (the Valuation Committee) is an internal committee that has been delegated certain responsibilities by the fund’s Board of Directors (the Board) to ensure that financial instruments are appropriately priced at fair value in accordance with GAAP and the 1940 Act. Subject to oversight by the Board, the Valuation Committee develops and oversees pricing-related policies and procedures and approves all fair value determinations. Specifically, the Valuation Committee establishes policies and procedures used in valuing financial instruments, including those which cannot be valued in accordance with normal procedures or using pricing vendors; determines pricing techniques, sources, and persons eligible to effect fair value pricing actions; evaluates the services and performance of the pricing vendors; oversees the pricing process to ensure policies and procedures are being followed; and provides guidance on internal controls and valuation-related matters. The Valuation Committee provides periodic reporting to the Board on valuation matters.

argle_1020_P5Proof #
41
T. ROWE PRICE GlObAl GROWTh STOCk Fund
Various valuation techniques and inputs are used to determine the fair value of financial instruments. GAAP establishes the following fair value hierarchy that categorizes the inputs used to measure fair value:
Level 1 – quoted prices (unadjusted) in active markets for identical financial instruments that the fund can access at the reporting date
Level 2 – inputs other than Level 1 quoted prices that are observable, either directly or indirectly (including, but not limited to, quoted prices for similar financial instruments in active markets, quoted prices for identical or similar financial instruments in inactive markets, interest rates and yield curves, implied volatilities, and credit spreads)
Level 3 – unobservable inputs (including the fund’s own assumptions in determining fair value)
Observable inputs are developed using market data, such as publicly available information about actual events or transactions, and reflect the assumptions that market participants would use to price the financial instrument. Unobservable inputs are those for which market data are not available and are developed using the best information available about the assumptions that market participants would use to price the financial instrument. GAAP requires valuation techniques to maximize the use of relevant observable inputs and minimize the use of unobservable inputs. When multiple inputs are used to derive fair value, the financial instrument is assigned to the level within the fair value hierarchy based on the lowest-level input that is significant to the fair value of the financial instrument. Input levels are not necessarily an indication of the risk or liquidity associated with financial instruments at that level but rather the degree of judgment used in determining those values.
Valuation Techniques Equity securities, including exchange-traded funds, listed or regularly traded on a securities exchange or in the over-the-counter (OTC) market are valued at the last quoted sale price or, for certain markets, the official closing price at the time the valuations are made. OTC Bulletin Board securities are valued at the mean of the closing bid and asked prices. A security that is listed or traded on more than one exchange is valued at the quotation on the exchange determined to be the primary market for such security. Listed securities not traded on a particular day are valued at the mean of the closing bid and asked prices for domestic securities and the last quoted sale or closing price for international securities.
The last quoted prices of non-U.S. equity securities may be adjusted to reflect the fair value of such securities at the close of the NYSE, if the fund determines that developments between the close of a foreign market and the close of the NYSE will
argle_1020_P5Proof #
42
T. ROWE PRICE GlObAl GROWTh STOCk Fund
affect the value of some or all of its portfolio securities. Each business day, the fund uses information from outside pricing services to evaluate and, if appropriate, decide whether it is necessary to adjust quoted prices to reflect fair value by reviewing a variety of factors, including developments in foreign markets, the performance of U.S. securities markets, and the performance of instruments trading in U.S. markets that represent foreign securities and baskets of foreign securities. The fund uses outside pricing services to provide it with quoted prices and information to evaluate or adjust those prices. The fund cannot predict how often it will use quoted prices and how often it will determine it necessary to adjust those prices to reflect fair value.
Investments in mutual funds are valued at the mutual fund’s closing NAV per share on the day of valuation. Assets and liabilities other than financial instruments, including short-term receivables and payables, are carried at cost, or estimated realizable value, if less, which approximates fair value.
Investments for which market quotations or market-based valuations are not readily available or deemed unreliable are valued at fair value as determined in good faith by the Valuation Committee, in accordance with fair valuation policies and procedures. The objective of any fair value pricing determination is to arrive at a price that could reasonably be expected from a current sale. Financial instruments fair valued by the Valuation Committee are primarily private placements, restricted securities, warrants, rights, and other securities that are not publicly traded. Factors used in determining fair value vary by type of investment and may include market or investment specific considerations. The Valuation Committee typically will afford greatest weight to actual prices in arm’s length transactions, to the extent they represent orderly transactions between market participants, transaction information can be reliably obtained, and prices are deemed representative of fair value. However, the Valuation Committee may also consider other valuation methods such as market-based valuation multiples; a discount or premium from market value of a similar, freely traded security of the same issuer; discounted cash flows; yield to maturity; or some combination. Fair value determinations are reviewed on a regular basis and updated as information becomes available, including actual purchase and sale transactions of the investment. Because any fair value determination involves a significant amount of judgment, there is a degree of subjectivity inherent in such pricing decisions, and fair value prices determined by the Valuation Committee could differ from those of other market participants.

argle_1020_P5Proof #
43
T. ROWE PRICE GlObAl GROWTh STOCk Fund
Valuation Inputs The following table summarizes the fund’s financial instruments, based on the inputs used to determine their fair values on October 31, 2020 (for further detail by category, please refer to the accompanying Portfolio of Investments):
($000s) Level 1 Level 2 Level 3 Total Value
Assets
Common Stocks $ 722,768 $ 397,019 $ 5,389 $ 1,125,176
Convertible Preferred Stocks — — 20,124 20,124
Preferred Stocks — 4,727 — 4,727
Short-Term Investments 6,981 — — 6,981
Securities lending Collateral 30,371 — — 30,371
Total $ 760,120 $ 401,746 $ 25,513 $ 1,187,379
Following is a reconciliation of the fund’s Level 3 holdings for the year ended October 31, 2020. Gain (loss) reflects both realized and change in unrealized gain/loss on Level 3 holdings during the period, if any, and is included on the accompanying Statement of Operations. The change in unrealized gain/loss on Level 3 instruments held at October 31, 2020, totaled $913,000 for the year ended October 31, 2020. During the year ended October 31, 2020, transfers out of Level 3 were because observable market data became available for the security.
($000s) Beginning Balance 11/1/19
Gain (Loss) During Period
Total Purchases+
Transfers Out of
Level 3
Ending Balance
10/31/20
Investment in Securities
Common Stocks $ 988 $ 3 $ 5,386 $ (988) $ 5,389
Convertible Preferred Stocks 3,620 910 15,594 — 20,124
Total $ 4,608 $ 913 $ 20,980 $ (988) $ 25,513
+ $2,463,000 of Total Purchases relates to securities acquired through a merger effected on November 25, 2019.

argle_1020_P5Proof #
44
T. ROWE PRICE GlObAl GROWTh STOCk Fund
NOTE 3 - DERIVATIVE INSTRUMENTS
During the year ended October 31, 2020, the fund invested in derivative instruments. As defined by GAAP, a derivative is a financial instrument whose value is derived from an underlying security price, foreign exchange rate, interest rate, index of prices or rates, or other variable; it requires little or no initial investment and permits or requires net settlement. The fund invests in derivatives only if the expected risks and rewards are consistent with its investment objectives, policies, and overall risk profile, as described in its prospectus and Statement of Additional Information. The fund may use derivatives for a variety of purposes, such as seeking to hedge against declines in principal value, increase yield, invest in an asset with greater efficiency and at a lower cost than is possible through direct investment, to enhance return, or to adjust credit exposure. The risks associated with the use of derivatives are different from, and potentially much greater than, the risks associated with investing directly in the instruments on which the derivatives are based. The fund at all times maintains sufficient cash reserves, liquid assets, or other SEC-permitted asset types to cover its settlement obligations under open derivative contracts.
The fund values its derivatives at fair value and recognizes changes in fair value currently in its results of operations. Accordingly, the fund does not follow hedge accounting, even for derivatives employed as economic hedges. Generally, the fund accounts for its derivatives on a gross basis. It does not offset the fair value of derivative liabilities against the fair value of derivative assets on its financial statements, nor does it offset the fair value of derivative instruments against the right to reclaim or obligation to return collateral. As of October 31, 2020, the fund held no derivative instruments.
Additionally, during the year ended October 31, 2020, the fund recognized $245,000 of realized gain on Forward Currency Exchange Contracts and a $(56,000) change in unrealized gain/loss on Forward Currency Exchange Contracts related to its investments in foreign exchange derivatives; such amounts are included on the accompanying Statement of Operations.
Forward Currency Exchange Contracts The fund is subject to foreign currency exchange rate risk in the normal course of pursuing its investment objectives. It uses forward currency exchange contracts (forwards) primarily to protect its non-U.S. dollar-denominated securities from adverse currency movements. A forward involves an obligation to purchase or sell a fixed amount of a specific currency on a future date at a price set at the time of the contract. Although certain forwards may be settled by exchanging only the net gain or loss on the contract, most forwards are settled with the exchange of the underlying currencies in accordance with the specified terms. Forwards are valued at the unrealized gain or loss on the contract, which reflects the

argle_1020_P5Proof #
45
T. ROWE PRICE GlObAl GROWTh STOCk Fund
net amount the fund either is entitled to receive or obligated to deliver, as measured by the difference between the forward exchange rates at the date of entry into the contract and the forward rates at the reporting date. Appreciated forwards are reflected as assets and depreciated forwards are reflected as liabilities on the accompanying Statement of Assets and Liabilities. Risks related to the use of forwards include the possible failure of counterparties to meet the terms of the agreements; that anticipated currency movements will not occur, thereby reducing the fund’s total return; and the potential for losses in excess of the fund’s initial investment. During the year ended October 31, 2020, the volume of the fund’s activity in forwards, based on underlying notional amounts, was approximately 2% of net assets.
NOTE 4 - OTHER INVESTMENT TRANSACTIONS
Consistent with its investment objective, the fund engages in the following practices to manage exposure to certain risks and/or to enhance performance. The investment objective, policies, program, and risk factors of the fund are described more fully in the fund’s prospectus and Statement of Additional Information.
Emerging and Frontier Markets The fund invests, either directly or through investments in other T. Rowe Price funds, in securities of companies located in, issued by governments of, or denominated in or linked to the currencies of emerging and frontier market countries. Emerging markets, and to a greater extent frontier markets, generally have economic structures that are less diverse and mature, and political systems that are less stable, than developed countries. These markets may be subject to greater political, economic, and social uncertainty and differing regulatory environments that may potentially impact the fund’s ability to buy or sell certain securities or repatriate proceeds to U.S. dollars. Such securities are often subject to greater price volatility, less liquidity, and higher rates of inflation than U.S. securities. Investing in frontier markets is significantly riskier than investing in other countries, including emerging markets.
Restricted Securities The fund invests in securities that are subject to legal or contractual restrictions on resale. Prompt sale of such securities at an acceptable price may be difficult and may involve substantial delays and additional costs.
Securities Lending The fund may lend its securities to approved borrowers to earn additional income. Its securities lending activities are administered by a lending agent in accordance with a securities lending agreement. Security loans generally do not have stated maturity dates, and the fund may recall a security at any time. The fund receives collateral in the form of cash or U.S. government securities. Collateral is maintained over the life of the loan in an amount not less than the value of loaned securities; any

argle_1020_P5Proof #
46
T. ROWE PRICE GlObAl GROWTh STOCk Fund
additional collateral required due to changes in security values is delivered to the fund the next business day. Cash collateral is invested in accordance with investment guidelines approved by fund management. Additionally, the lending agent indemnifies the fund against losses resulting from borrower default. Although risk is mitigated by the collateral and indemnification, the fund could experience a delay in recovering its securities and a possible loss of income or value if the borrower fails to return the securities, collateral investments decline in value, and the lending agent fails to perform. Securities lending revenue consists of earnings on invested collateral and borrowing fees, net of any rebates to the borrower, compensation to the lending agent, and other administrative costs. In accordance with GAAP, investments made with cash collateral are reflected in the accompanying financial statements, but collateral received in the form of securities is not. At October 31, 2020, the value of loaned securities was $28,550,000; the value of cash collateral and related investments was $30,371,000.
Other Purchases and sales of portfolio securities other than short-term securities aggregated $1,015,600,000 and $724,757,000, respectively, for the year ended October 31, 2020.
NOTE 5 - FEDERAL INCOME TAXES
Generally, no provision for federal income taxes is required since the fund intends to continue to qualify as a regulated investment company under Subchapter M of the Internal Revenue Code and distribute to shareholders all of its taxable income and gains. Distributions determined in accordance with federal income tax regulations may differ in amount or character from net investment income and realized gains for financial reporting purposes.
The fund files U.S. federal, state, and local tax returns as required. The fund’s tax returns are subject to examination by the relevant tax authorities until expiration of the applicable statute of limitations, which is generally three years after the filing of the tax return but which can be extended to six years in certain circumstances. Tax returns for open years have incorporated no uncertain tax positions that require a provision for income taxes.
Financial reporting records are adjusted for permanent book/tax differences to reflect tax character but are not adjusted for temporary differences. The permanent book/tax adjustments have no impact on results of operations or net assets and relate primarily

argle_1020_P5Proof #
47
T. ROWE PRICE GlObAl GROWTh STOCk Fund
to a tax practice that treats a portion of the proceeds from each redemption of capital shares as a distribution of taxable net investment income or realized capital gain and the character of foreign capital gains taxes. For the year ended October 31, 2020, the following reclassification was recorded:
($000s)
Total distributable earnings (loss) $ (11,237)
Paid-in capital 11,237
Distributions during the years ended October 31, 2020 and October 31, 2019, totaled $1,842,000 and $6,669,000, respectively, and were characterized as ordinary income for tax purposes. At October 31, 2020, the tax-basis cost of investments, and components of net assets were as follows:
($000s)
Cost of investments $ 930,032
unrealized appreciation $ 299,678
unrealized depreciation (42,608)
net unrealized appreciation (depreciation) 257,070
undistributed ordinary income 43,456
Paid-in capital 855,093
net assets $ 1,155,619
The difference between book-basis and tax-basis net unrealized appreciation (depreciation) is attributable to the deferral of losses from wash sales and the realization of gains/losses on passive foreign investment companies for tax purposes. The fund intends to retain realized gains to the extent of available capital loss carryforwards. During the year ended October 31, 2020, the fund utilized $10,549,000 of capital loss carryforwards.

argle_1020_P5Proof #
48
T. ROWE PRICE GlObAl GROWTh STOCk Fund
NOTE 6 - FOREIGN TAXES
The fund is subject to foreign income taxes imposed by certain countries in which it invests. Additionally, capital gains realized upon disposition of securities issued in or by certain foreign countries are subject to capital gains tax imposed by those countries. All taxes are computed in accordance with the applicable foreign tax law, and, to the extent permitted, capital losses are used to offset capital gains. Taxes attributable to income are accrued by the fund as a reduction of income. Current and deferred tax expense attributable to capital gains is reflected as a component of realized or change in unrealized gain/loss on securities in the accompanying financial statements. To the extent that the fund has country specific capital loss carryforwards, such carryforwards are applied against net unrealized gains when determining the deferred tax liability. Any deferred tax liability incurred by the fund is included in either Other liabilities or Deferred tax liability on the accompanying Statement of Assets and Liabilities.
NOTE 7 - ACQUISITION
On November 25, 2019, the fund acquired substantially all of the assets of the Institutional Global Growth Equity Fund (the acquired fund), pursuant to the Agreement and Plan of Reorganization dated July 31, 2019. The acquired fund was available only to institutional investors and required an initial investment of $1,000,000; the same as the fund’s I Class investment minimum. The acquired fund shared a nearly identical investment program as the fund and had a lower net expense ratio. Accordingly, it no longer made sense to offer both funds. The Boards of the acquired fund and the fund approved the reorganization and, the Board of the acquired fund approved its liquidation and dissolution. The acquisition was accomplished by a tax-free exchange of 5,163,000 shares of the fund with a value of $151,133,000 for all 6,075,000 shares of the acquired fund then outstanding, with the same value. The exchange was based on values at the close of the NYSE on the immediately preceding business day, November 22, 2019. The net assets of the acquired fund at that date included $39,196,000 of unrealized appreciation. Assets of the acquired fund, including securities of $143,905,000, cash of $6,982,000, and receivables and other assets of $247,000, and payables of $1,000, were combined with those of the fund, resulting in aggregate net assets of $698,135,000 immediately after the acquisition.

argle_1020_P5Proof #
49
T. ROWE PRICE GlObAl GROWTh STOCk Fund
Pro forma results of operations of the combined entity for the entire year ended October 31, 2020, as though the acquisition had occurred as of the beginning of the year (rather than on the actual acquisition date), are as follows:
($000s)
net investment income $ 1,669
net realized gain (loss) 74,802
Change in net unrealized gain/loss 153,206
Increase (decrease) in net assets from operations $ 229,677
Because the combined investment portfolios have been managed as a single portfolio since the acquisition was completed, it is not practicable to separate the amounts of revenue and earnings of the acquired fund that have been included in the fund’s accompanying Statement of Operations since November 25, 2019.
NOTE 8 - RELATED PARTY TRANSACTIONS
The fund is managed by T. Rowe Price Associates, Inc. (Price Associates), a wholly owned subsidiary of T. Rowe Price Group, Inc. (Price Group). Price Associates has entered into a sub-advisory agreement(s) with one or more of its wholly owned subsidiaries, to provide investment advisory services to the fund. The investment management agreement between the fund and Price Associates provides for an annual investment management fee, which is computed daily and paid monthly. The fee consists of an individual fund fee, equal to 0.35% of the fund’s average daily net assets, and a group fee. The group fee rate is calculated based on the combined net assets of certain mutual funds sponsored by Price Associates (the group) applied to a graduated fee schedule, with rates ranging from 0.48% for the first $1 billion of assets to 0.260% for assets in excess of $845 billion. The fund’s group fee is determined by applying the group fee rate to the fund’s average daily net assets. The fee is computed daily and paid monthly. At October 31, 2020, the effective annual group fee rate was 0.29%. Effective November 1, 2019, Price Associates agreed to permanently waive a portion of the fund’s annual investment management fee in order to limit the fund’s management fees to 0.65% of the fund’s average daily net assets. This agreement can only be modified or terminated with approval by the fund’s shareholders. The fund has no obligation to repay fees waived under this arrangement No management fees were waived under this arrangement for the year ended October 31, 2020.

argle_1020_P5Proof #
50
T. ROWE PRICE GlObAl GROWTh STOCk Fund
The Investor Class and Advisor Class are each subject to a contractual expense limitation through the expense limitation date indicated in the table below. During the limitation period, Price Associates is required to waive its management fee or pay any expenses (excluding interest; expenses related to borrowings, taxes, and brokerage; and other non-recurring expenses permitted by the investment management agreement) that would otherwise cause the class’s ratio of annualized total expenses to average net assets (net expense ratio) to exceed its expense limitation. Each class is required to repay Price Associates for expenses previously waived/paid to the extent the class’s net assets grow or expenses decline sufficiently to allow repayment without causing the class’s net expense ratio (after the repayment is taken into account) to exceed the lesser of: (1) the expense limitation in place at the time such amounts were waived; or (2) the class’s current expense limitation. However, no repayment will be made more than three years after the date of a payment or waiver.
The I Class is also subject to an operating expense limitation (I Class Limit) pursuant to which Price Associates is contractually required to pay all operating expenses of the I Class, excluding management fees; interest; expenses related to borrowings, taxes, and brokerage; and other non-recurring expenses permitted by the investment management agreement, to the extent such operating expenses, on an annualized basis, exceed the I Class Limit. This agreement will continue through the expense limitation date indicated in the table below, and may be renewed, revised, or revoked only with approval of the fund’s Board. The I Class is required to repay Price Associates for expenses previously paid to the extent the class’s net assets grow or expenses decline sufficiently to allow repayment without causing the class’s operating expenses (after the repayment is taken into account) to exceed the lesser of: (1) the I Class Limit in place at the time such amounts were paid; or (2) the current I Class Limit. However, no repayment will be made more than three years after the date of a payment or waiver.
Pursuant to these agreements, expenses were waived/paid by and/or repaid to Price Associates during the year ended October 31, 2020 as indicated in the table below. Including these amounts, expenses previously waived/paid by Price Associates in the amount of $41,000 remain subject to repayment by the fund at October 31, 2020. Any repayment of expenses previously waived/paid by Price Associates during the period would be included in the net investment income and expense ratios presented on the accompanying Financial Highlights.
Investor Class Advisor Class I Class
Expense limitation/I Class limit 1.00% 1.10% 0.05%
Expense limitation date 02/28/21 02/28/21 02/28/21
(Waived)/repaid during the period ($000s) $(2) $(1) $(22)

argle_1020_P5Proof #
51
T. ROWE PRICE GlObAl GROWTh STOCk Fund
In addition, the fund has entered into service agreements with Price Associates and two wholly owned subsidiaries of Price Associates, each an affiliate of the fund (collectively, Price). Price Associates provides certain accounting and administrative services to the fund. T. Rowe Price Services, Inc. provides shareholder and administrative services in its capacity as the fund’s transfer and dividend-disbursing agent. T. Rowe Price Retirement Plan Services, Inc. provides subaccounting and recordkeeping services for certain retirement accounts invested in the Investor Class. For the year ended October 31, 2020, expenses incurred pursuant to these service agreements were $67,000 for Price Associates; $250,000 for T. Rowe Price Services, Inc.; and $8,000 for T. Rowe Price Retirement Plan Services, Inc. All amounts due to and due from Price, exclusive of investment management fees payable, are presented net on the accompanying Statement of Assets and Liabilities.
The fund may invest its cash reserves in certain open-end management investment companies managed by Price Associates and considered affiliates of the fund: the T. Rowe Price Government Reserve Fund or the T. Rowe Price Treasury Reserve Fund, organized as money market funds, or the T. Rowe Price Short-Term Fund, a short-term bond fund (collectively, the Price Reserve Funds). The Price Reserve Funds are offered as short-term investment options to mutual funds, trusts, and other accounts managed by Price Associates or its affiliates and are not available for direct purchase by members of the public. Cash collateral from securities lending is invested in the T. Rowe Price Short-Term Fund. The Price Reserve Funds pay no investment management fees.
As of October 31, 2020, T. Rowe Price Group, Inc., or its wholly owned subsidiaries, owned 404,606 shares of the I Class, representing 2% of the I Class’s net assets.
The fund may participate in securities purchase and sale transactions with other funds or accounts advised by Price Associates (cross trades), in accordance with procedures adopted by the fund’s Board and Securities and Exchange Commission rules, which require, among other things, that such purchase and sale cross trades be effected at the independent current market price of the security. During the year ended October 31, 2020, the aggregate value of purchases and sales cross trades with other funds or accounts advised by Price Associates was less than 1% of the fund’s net assets as of October 31, 2020.
Effective January 1, 2020, Price Associates has voluntarily agreed to reimburse the fund from its own resources on a monthly basis for the cost of investment research embedded in the cost of the fund’s securities trades. This agreement may be rescinded at any time. For the year ended October 31, 2020, this reimbursement amounted to $49,000, which is included in Net realized gain (loss) on Securities in the Statement of Operations.

argle_1020_P5Proof #
52
T. ROWE PRICE GlObAl GROWTh STOCk Fund
NOTE 9 - OTHER MATTERS
Unpredictable events such as environmental or natural disasters, war, terrorism, pandemics, outbreaks of infectious diseases, and similar public health threats may significantly affect the economy and the markets and issuers in which a fund invests. Certain events may cause instability across global markets, including reduced liquidity and disruptions in trading markets, while some events may affect certain geographic regions, countries, sectors, and industries more significantly than others, and exacerbate other pre-existing political, social, and economic risks.
These types of events may also cause widespread fear and uncertainty, and result in, among other things: quarantines and travel restrictions, including border closings; disruptions to business operations and supply chains; exchange trading suspensions and closures, and overall reduced liquidity of securities, derivatives, and commodities trading markets; reductions in consumer demand and economic output; and significant challenges in healthcare service preparation and delivery. The funds could be negatively impacted if the value of a portfolio holding were harmed by such political or economic conditions or events. In addition, the operations of the funds, their investment advisers, and the funds’ service providers may be significantly impacted, or even temporarily halted, as a result of extensive employee illnesses or unavailability, government quarantine measures, and restrictions on travel or meetings and other factors related to public emergencies. Recently, a novel strain of coronavirus (COVID-19) has resulted in disruptions to global business activity and caused significant volatility and declines in global financial markets.
Governmental and quasi-governmental authorities and regulators have in the past responded to major economic disruptions with a variety of significant fiscal and monetary policy changes, including but not limited to, direct capital infusions into companies, new monetary programs, and dramatically lower interest rates. An unexpected or quick reversal of these policies, or the ineffectiveness of these policies, could negatively impact overall investor sentiment and further increase volatility in securities markets.

argle_1020_P5Proof #
53
T. ROWE PRICE GlObAl GROWTh STOCk Fund
REPORT OF INDEPENDENT REGISTERED PUBLIC ACCOUNTING FIRM
To the Board of Directors of T. Rowe Price International Funds, Inc. and Shareholders of T. Rowe Price Global Growth Stock Fund
Opinion on the Financial StatementsWe have audited the accompanying statement of assets and liabilities, including the portfolio of investments, of T. Rowe Price Global Growth Stock Fund (one of the funds constituting T. Rowe Price International Funds, Inc., referred to hereafter as the “Fund”) as of October 31, 2020, the related statement of operations for the year ended October 31, 2020, the statement of changes in net assets for each of the two years in the period ended October 31, 2020, including the related notes, and the financial highlights for each of the periods indicated therein (collectively referred to as the “financial statements”). In our opinion, the financial statements present fairly, in all material respects, the financial position of the Fund as of October 31, 2020, the results of its operations for the year then ended, the changes in its net assets for each of the two years in the period ended October 31, 2020 and the financial highlights for each of the periods indicated therein, in conformity with accounting principles generally accepted in the United States of America.
Basis for OpinionThese financial statements are the responsibility of the Fund’s management. Our responsibility is to express an opinion on the Fund’s financial statements based on our audits. We are a public accounting firm registered with the Public Company Accounting Oversight Board (United States) (PCAOB) and are required to be independent with respect to the Fund in accordance with the U.S. federal securities laws and the applicable rules and regulations of the Securities and Exchange Commission and the PCAOB.
We conducted our audits of these financial statements in accordance with the standards of the PCAOB. Those standards require that we plan and perform the audit to obtain reasonable assurance about whether the financial statements are free of material misstatement, whether due to error or fraud.

argle_1020_P5Proof #
54
T. ROWE PRICE GlObAl GROWTh STOCk Fund
Our audits included performing procedures to assess the risks of material misstatement of the financial statements, whether due to error or fraud, and performing procedures that respond to those risks. Such procedures included examining, on a test basis, evidence regarding the amounts and disclosures in the financial statements. Our audits also included evaluating the accounting principles used and significant estimates made by management, as well as evaluating the overall presentation of the financial statements. Our procedures included confirmation of securities owned as of October 31, 2020 by correspondence with the custodian, transfer agent and brokers; when replies were not received from brokers, we performed other auditing procedures. We believe that our audits provide a reasonable basis for our opinion.
PricewaterhouseCoopers LLP Baltimore, Maryland December 17, 2020
We have served as the auditor of one or more investment companies in the T. Rowe Price group of investment companies since 1973.
REPORT OF INDEPENDENT REGISTERED PUBLIC ACCOUNTING FIRM (CONTINUED)

argle_1020_P5Proof #
55
T. ROWE PRICE GlObAl GROWTh STOCk Fund
TAX INFORMATION (UNAUDITED) FOR THE TAX YEAR ENDED 10/31/20
We are providing this information as required by the Internal Revenue Code. The amounts shown may differ from those elsewhere in this report because of differences between tax and financial reporting requirements.The fund’s distributions to shareholders included $3,814,000 from short-term capital gains.For taxable non-corporate shareholders, $7,423,000 of the fund’s income represents qualified dividend income subject to long-term capital gains tax rate of not greater than 20%.For taxable non-corporate shareholders, $6,217,000 of the fund’s income represents qualified dividend income subject to a long-term capitals gains tax rate of not greater than 20%.For corporate shareholders, $3,224,000 of the fund’s income qualifies for the dividends-received deduction.For individuals and certain trusts and estates which are entitled to claim a deduction of up to 20% of their combined qualified real estate investment trust (REIT) dividends, $22,000 of the fund’s income qualifies as qualified real estate investment trust (REIT) dividends.
INFORMATION ON PROXY VOTING POLICIES, PROCEDURES, AND RECORDS
A description of the policies and procedures used by T. Rowe Price funds and portfolios to determine how to vote proxies relating to portfolio securities is available in each fund’s Statement of Additional Information. You may request this document by calling 1-800-225-5132 or by accessing the SEC’s website, sec.gov. The description of our proxy voting policies and procedures is also available on our corporate website. To access it, please visit the following Web page:https://www.troweprice.com/corporate/en/utility/policies.htmlScroll down to the section near the bottom of the page that says, “Proxy Voting Policies.” Click on the Proxy Voting Policies link in the shaded box.Each fund’s most recent annual proxy voting record is available on our website and through the SEC’s website. To access it through T. Rowe Price, visit the website location shown above, and scroll down to the section near the bottom of the page that says, “Proxy Voting Records.” Click on the Proxy Voting Records link in the shaded box.
HOW TO OBTAIN QUARTERLY PORTFOLIO HOLDINGS
Effective for reporting periods on or after March 1, 2019, a fund, except a money market fund, files a complete schedule of portfolio holdings with the Securities and Exchange Commission (SEC) for the first and third quarters of each fiscal year as an exhibit to its reports on Form N-PORT. Prior to March 1, 2019, a fund, including a money market fund, filed a complete schedule of portfolio holdings with the SEC for the first and third quarters of each fiscal year on Form N-Q. A money market fund files detailed month-end portfolio holdings information on Form N-MFP with the SEC each month and posts a complete schedule of portfolio holdings on its website (troweprice.com) as of each month-end for the previous six months. A fund’s Forms N-PORT, N-MFP, and N-Q are available electronically on the SEC’s website (sec.gov).

argle_1020_P5Proof #
56
T. ROWE PRICE GlObAl GROWTh STOCk Fund
LIQUIDITY RISK MANAGEMENT PROGRAM
In accordance with Rule 22e-4 (Liquidity Rule) under the Investment Company Act of 1940, as amended, the fund has established a liquidity risk management program (Liquidity Program) reasonably designed to assess and manage the fund’s liquidity risk, which generally represents the risk that the fund would not be able to meet redemption requests without significant dilution of remaining investors’ interests in the fund. The fund’s Board of Directors (Board) has appointed the fund’s investment advisor, T. Rowe Price Associates, Inc. (Price Associates), as the administrator of the Liquidity Program. As administrator, Price Associates is responsible for overseeing the day-to-day operations of the Liquidity Program and, among other things, is responsible for assessing, managing, and reviewing with the Board at least annually the liquidity risk of each T. Rowe Price fund. Price Associates has delegated oversight of the Liquidity Program to a Liquidity Risk Committee (LRC), which is a cross-functional committee composed of personnel from multiple departments within Price Associates.
The Liquidity Program’s principal objectives include supporting the T. Rowe Price funds’ compliance with limits on investments in illiquid assets and mitigating the risk that the fund will be unable to timely meet its redemption obligations. The Liquidity Program also includes a number of elements that support the management and assessment of liquidity risk, including an annual assessment of factors that influence the fund’s liquidity and the periodic classification and reclassification of a fund’s investments into categories that reflect the LRC’s assessment of their relative liquidity under current market conditions. Under the Liquidity Program, every investment held by the fund is classified at least monthly into one of four liquidity categories based on estimations of the investment’s ability to be sold during designated time frames in current market conditions without significantly changing the investment’s market value.
As required by the Liquidity Rule, at a meeting held on May 4, 2020, the Board was presented with an annual assessment prepared by the LRC, on behalf of Price Associates, that addressed the operation of the Liquidity Program and assessed its adequacy and effectiveness of implementation, including any material changes to the Liquidity Program and the determination of each fund’s Highly Liquid Investment Minimum (HLIM). The annual assessment included consideration of the following factors, as applicable: the fund’s investment strategy and liquidity of portfolio investments during normal and reasonably foreseeable stressed conditions, including whether the investment strategy is appropriate for an open-end fund, the extent to which the strategy involves a relatively concentrated portfolio or large positions in particular issuers, and the use of borrowings for investment purposes and derivatives; short-term and long-term cash flow projections covering both normal and reasonably foreseeable stressed conditions; and holdings of cash and cash equivalents, as well as available borrowing arrangements.
For the fund and other T. Rowe Price funds, the annual assessment incorporated a report related to a fund’s holdings, shareholder and portfolio concentration, any borrowings during the period, cash flow projections, and other relevant data for the period of June 1, 2019, through March 31, 2020. The report described the methodology for classifying a
argle_1020_P5Proof #
57
T. ROWE PRICE GlObAl GROWTh STOCk Fund
LIQUIDITY RISK MANAGEMENT PROGRAM (CONTINUED)
fund’s investments (including derivative transactions) into one of four liquidity categories, as well as the percentage of a fund’s investments assigned to each category. It also explained the methodology for establishing a fund’s HLIM and noted that the LRC reviews the HLIM assigned to each fund no less frequently than annually.
Certain provisions of the Liquidity Program initially became effective on December 1, 2018, and the full Liquidity Program was formally approved by the Board in April 2019. During the period covered by the annual assessment, the LRC has concluded, and reported to the Board, that the Liquidity Program since its implementation has operated adequately and effectively and is reasonably designed to assess and manage the fund’s liquidity risk.

argle_1020_P5Proof #
58
T. ROWE PRICE GlObAl GROWTh STOCk Fund
ABOUT THE FUND’S DIRECTORS AND OFFICERS
Your fund is overseen by a board of directors (board) that meets regularly to review a wide variety of matters affecting or potentially affecting the fund, including performance, investment programs, compliance matters, advisory fees and expenses, service providers, and business and regulatory affairs. The board elects the fund’s officers, who are listed in the final table. At least 75% of the board’s members are considered to be independent, i.e., not “interested persons” as defined in Section 2(a)(19) of the 1940 Act, of the boards of T. Rowe Price Associates, Inc. (T. Rowe Price), and its affiliates; “interested” directors and officers are employees of T. Rowe Price. The business address of each director and officer is 100 East Pratt Street, baltimore, Maryland 21202. The Statement of Additional Information includes additional information about the fund directors and is available without charge by calling a T. Rowe Price representative at 1-800-638-5660.
INDEPENDENT DIRECTORS(a)
Name(Year of Birth)Year Elected[Number of T. Rowe PricePortfolios Overseen]
Principal Occupation(s) and Directorships of Public Companies and Other Investment Companies During the Past Five Years
Teresa bryce bazemore(1959)2018[191]
President, Radian Guaranty (2008 to 2017); Chief Executive Officer, bazemore Consulting llC (2018 to present); director, Chimera Investment Corporation (2017 to present); director, Federal home loan bank of Pittsburgh (2017 to February 2019)
Ronald J. daniels(1959)2018[191]
President, The Johns hopkins university(b) and Professor, Political Science department, The Johns hopkins university (2009 to present); director, lyndhurst holdings (2015 to present); director, bridgebio Pharma, Inc. (2020 to present)
bruce W. duncan(1951)2013[191]
President, Chief Executive Officer, and director, CyrusOne, Inc. (2020 to present); Chief Executive Officer and director (2009 to 2016), Chairman of the board (2016 to 2020), and President (2009 to 2016), First Industrial Realty Trust, owner and operator of industrial properties; Chairman of the board (2005 to 2016) and director (1999 to 2016), Starwood hotels & Resorts, a hotel and leisure company; Member, Investment Company Institute board of Governors (2017 to 2019); Member, Independent directors Council Governing board (2017 to 2019); Senior Advisor, kkR (2018 to present); director, boston Properties (2016 to present); director, Marriott International, Inc. (2016 to 2020)
Robert J. Gerrard, Jr.(1952)2012[191]
Advisory board Member, Pipeline Crisis/Winning Strategies, a collaborative working to improve opportunities for young African Americans (1997 to 2016); Chairman of the board, all funds (since July 2018)

argle_1020_P5Proof #
59
T. ROWE PRICE GlObAl GROWTh STOCk Fund
Name(Year of Birth)Year Elected[Number of T. Rowe PricePortfolios Overseen]
Principal Occupation(s) and Directorships of Public Companies and Other Investment Companies During the Past Five Years
Paul F. Mcbride(1956)2013[191]
Advisory board Member, Vizzia Technologies (2015 to present); board Member, dunbar Armored (2012 to 2018)
Cecilia E. Rouse, Ph.d.(1963)2012[191]
dean, Princeton School of Public and International Affairs (2012 to present); Professor and Researcher, Princeton university (1992 to present); director of Education Studies Committee, MdRC, a nonprofit education and social policy research organization (2011 to 2020); Member, national Academy of Education (2010 to present); board Member, national bureau of Economic Research (2011 to present); board Member of the Council on Foreign Relations (2018 to present); board Member, The Pennington School (2017 to present); board Member, the university of Rhode Island (2020 to present); Chair of Committee on the Status of Minority Groups in the Economic Profession of the American Economic Association (2012 to 2018); Vice President (2015 to 2016) and board Member (2018 to present), American Economic Association
John G. Schreiber(1946)2001[191]
Owner/President, Centaur Capital Partners, Inc., a real estate investment company (1991 to present); Cofounder, Partner, and Cochairman of the Investment Committee, blackstone Real Estate Advisors, l.P. (1992 to 2015); director, blackstone Mortgage Trust, a real estate finance company (2012 to 2016); director and Chairman of the board, brixmor Property Group, Inc. (2013 to present); director, hilton Worldwide (2007 to present); director, hudson Pacific Properties (2014 to 2016); director, Invitation homes (2014 to 2017); director, JMb Realty Corporation (1980 to present)
(a) All information about the independent directors was current as of December 31, 2019, unless otherwise indicated, except for the number of portfolios overseen, which is current as of the date of this report.
(b) William J. Stromberg, president and chief executive officer of T. Rowe Price Group, Inc., the parent company of the Price Funds’ investment advisor, has served on the Board of Trustees of Johns Hopkins University since 2014.
INDEPENDENT DIRECTORS(a) (CONTINUED)

argle_1020_P5Proof #
60
T. ROWE PRICE GlObAl GROWTh STOCk Fund
INTERESTED DIRECTORS(a)
Name(Year of Birth)Year Elected[Number of T. Rowe Price Portfolios Overseen]
Principal Occupation(s) and Directorships of Public Companies and Other Investment Companies During the Past Five Years
david Oestreicher(1967)2018[191]
Chief legal Officer, Vice President, and Secretary, T. Rowe Price Group, Inc.; Chairman of the board, Chief Executive Officer, President, and Secretary, T. Rowe Price Trust Company; director, Vice President, and Secretary, T. Rowe Price, T. Rowe Price Investment Services, Inc., T. Rowe Price Retirement Plan Services, Inc., and T. Rowe Price Services, Inc.; Vice President and Secretary, T. Rowe Price International; Vice President, T. Rowe Price hong kong (Price hong kong), T. Rowe Price Japan (Price Japan), and T. Rowe Price Singapore (Price Singapore); Principal Executive Officer and Executive Vice President, all funds
Robert W. Sharps, CFA, CPA(1971)2017[191]
director and Vice President, T. Rowe Price; Vice President, T. Rowe Price Group, Inc., and T. Rowe Price Trust Company; Vice President, International Funds
(a) All information about the interested directors was current as of December 31, 2019, unless otherwise indicated, except for the number of portfolios overseen, which is current as of the date of this report.
OFFICERS
Name (Year of Birth)Position Held With International Funds Principal Occupation(s)
Mariel Abreu (1981) Vice President
Vice President, T. Rowe Price and T. Rowe Price Group, Inc.
Jason R. Adams (1979) Executive Vice President
Vice President T. Rowe Price and T. Rowe Price Group, Inc.
ulle Adamson, CFA (1979) Executive Vice President
Vice President, T. Rowe Price Group, Inc., and T. Rowe Price International
Roy h. Adkins (1970) Vice President
Vice President, T. Rowe Price Group, Inc., and T. Rowe Price International
Christopher d. Alderson (1962) President
director and Vice President, T. Rowe Price International; Vice President, Price hong kong, Price Singapore, and T. Rowe Price Group, Inc.
Unless otherwise noted, officers have been employees of T. Rowe Price or T. Rowe Price International for at least 5 years.

argle_1020_P5Proof #
61
T. ROWE PRICE GlObAl GROWTh STOCk Fund
Name (Year of Birth)Position Held With International Funds Principal Occupation(s)
Syed h. Ali (1970) Vice President
Vice President, Price hong kong, Price Singapore, and T. Rowe Price Group, Inc.
kennard W. Allen (1977) Vice President
Vice President, T. Rowe Price and T. Rowe Price Group, Inc.
Paulina Amieva (1981) Vice President
Vice President, T. Rowe Price and T. Rowe Price Group, Inc.
Malik S. Asif (1981) Vice President
Vice President, T. Rowe Price Group, Inc., and T. Rowe Price International
Ziad bakri, M.d., CFA (1980) Vice President
Vice President, T. Rowe Price and T. Rowe Price Group, Inc.
harishankar balkrishna (1983) Vice President
Vice President, T. Rowe Price Group, Inc., and T. Rowe Price International
Sheena l. barbosa (1983) Vice President
Vice President, Price hong kong and T. Rowe Price Group, Inc.
Peter J. bates, CFA (1974) Executive Vice President
Vice President, T. Rowe Price and T. Rowe Price Group, Inc.
Jason A. bauer (1979) Vice President
Vice President, T. Rowe Price and T. Rowe Price Group, Inc.
luis M. baylac (1982) Vice President
Vice President, T. Rowe Price Group, Inc., and T. Rowe Price International
Oliver d.M. bell (1969) Executive Vice President
Vice President, T. Rowe Price Group, Inc., and T. Rowe Price International
R. Scott berg, CFA (1972) Executive Vice President
Vice President, T. Rowe Price, T. Rowe Price Group, Inc., and T. Rowe Price Trust Company
Steve E. boothe, CFA (1977) Vice President
Vice President, T. Rowe Price and T. Rowe Price Group, Inc.
Peter I. botoucharov (1965) Vice President
Vice President, T. Rowe Price Group, Inc., and T. Rowe Price International
Tala boulos (1984) Vice President
Vice President, T. Rowe Price Group, Inc., and T. Rowe Price International
darrell n. braman (1963) Vice President
Vice President, Price hong kong, Price Singapore, T. Rowe Price, T. Rowe Price Group, Inc., T. Rowe Price International, T. Rowe Price Investment Services, Inc., and T. Rowe Price Services, Inc.
Unless otherwise noted, officers have been employees of T. Rowe Price or T. Rowe Price International for at least 5 years.
OFFICERS (CONTINUED)

argle_1020_P5Proof #
62
T. ROWE PRICE GlObAl GROWTh STOCk Fund
Name (Year of Birth)Position Held With International Funds Principal Occupation(s)
Christopher P. brown, Jr., CFA (1977) Vice President
Vice President, T. Rowe Price and T. Rowe Price Group, Inc.
Sheldon Chan (1981) Vice President
Vice President, Price hong kong and T. Rowe Price Group, Inc.
Andrew Chang (1983) Vice President
Vice President, Price Singapore and T. Rowe Price Group, Inc.
Carolyn hoi Che Chu (1974) Vice President
Vice President, Price hong kong and T. Rowe Price Group, Inc.
Archibald Ciganer, CFA (1976) Executive Vice President
director and Vice President, Price Japan; Vice President, T. Rowe Price Group, Inc.
Richard n. Clattenburg, CFA (1979) Executive Vice President
Vice President, Price Japan, Price Singapore, T. Rowe Price, T. Rowe Price Group, Inc., T. Rowe Price International, and T. Rowe Price Trust Company
Michael J. Conelius, CFA (1964) Executive Vice President
Vice President, T. Rowe Price, T. Rowe Price Group, Inc., T. Rowe Price International, and T. Rowe Price Trust Company
Michael F. Connelly, CFA (1977) Vice President
Vice President, T. Rowe Price and T. Rowe Price Group, Inc.
Andrew S. davis (1978) Vice President
Vice President, T. Rowe Price and T. Rowe Price Group, Inc.
Richard de los Reyes (1975) Vice President
Vice President, T. Rowe Price, T. Rowe Price Group, Inc., and T. Rowe Price Trust Company
Michael della Vedova (1969) Executive Vice President
Vice President, T. Rowe Price Group, Inc., and T. Rowe Price International
Ion dent, CFA (1991) Vice President
Employee, T. Rowe Price; formerly, Associate, Equity Research, deutsche bank (to 2018)
Maria Elena drew (1973) Vice President
Vice President, T. Rowe Price Group, Inc., and T. Rowe Price International; formerly, Executive director, Goldman Sachs Asset Management (to 2017)
Shawn T. driscoll (1975) Vice President
Vice President, T. Rowe Price, T. Rowe Price Group, Inc., and T. Rowe Price Trust Company
Unless otherwise noted, officers have been employees of T. Rowe Price or T. Rowe Price International for at least 5 years.
OFFICERS (CONTINUED)

argle_1020_P5Proof #
63
T. ROWE PRICE GlObAl GROWTh STOCk Fund
Name (Year of Birth)Position Held With International Funds Principal Occupation(s)
Alan S. dupski, CPA (1982) Principal Financial Officer, Vice President, and Treasurer
Vice President, T. Rowe Price, T. Rowe Price Group, Inc., and T. Rowe Price Trust Company
bridget A. Ebner (1970) Vice President
Vice President, T. Rowe Price and T. Rowe Price Group, Inc.
david J. Eiswert, CFA (1972) Executive Vice President
Vice President, T. Rowe Price and T. Rowe Price Group, Inc.
dawei Feng (1979) Vice President
Vice President, Price hong kong and T. Rowe Price Group, Inc.; formerly, head of China Consumer in Equity Research, Credit lyonnais Asia-Pacific (to 2018)
Ryan W. Ferro (1985) Vice President
Vice President, T. Rowe Price and T. Rowe Price Group, Inc.
Mark S. Finn, CFA, CPA (1963) Vice President
Vice President, T. Rowe Price, T. Rowe Price Group, Inc., and T. Rowe Price Trust Company
Quentin S. Fitzsimmons (1968) Vice President
Vice President, T. Rowe Price Group, Inc., and T. Rowe Price International
Melissa C. Gallagher (1974) Vice President
Vice President, T. Rowe Price Group, Inc., and T. Rowe Price International
Justin T. Gerbereux, CFA (1975) Vice President
Vice President, T. Rowe Price, T. Rowe Price Group, Inc., and T. Rowe Price Trust Company
Aaron Gifford, CFA (1987) Vice President
Vice President, T. Rowe Price and T. Rowe Price Group, Inc.; formerly, Strategist, Morgan Stanley & Co. llC (to 2017)
John R. Gilner (1961) Chief Compliance Officer
Chief Compliance Officer and Vice President, T. Rowe Price; Vice President, T. Rowe Price Group, Inc., and T. Rowe Price Investment Services, Inc.
Vishnu V. Gopal (1979) Vice President
Vice President, Price hong kong and T. Rowe Price Group, Inc.
Joel Grant (1978) Vice President
Vice President, T. Rowe Price and T. Rowe Price Group, Inc.
Gary J. Greb (1961) Vice President
Vice President, T. Rowe Price, T. Rowe Price International, and T. Rowe Price Trust Company
Paul d. Greene II (1978) Vice President
Vice President, T. Rowe Price and T. Rowe Price Group, Inc.
Unless otherwise noted, officers have been employees of T. Rowe Price or T. Rowe Price International for at least 5 years.
OFFICERS (CONTINUED)

argle_1020_P5Proof #
64
T. ROWE PRICE GlObAl GROWTh STOCk Fund
Name (Year of Birth)Position Held With International Funds Principal Occupation(s)
benjamin Griffiths, CFA (1977) Executive Vice President
Vice President, T. Rowe Price Group, Inc., and T. Rowe Price International
Gianluca Guicciardi (1983) Vice President
Vice President, T. Rowe Price Group, Inc., and T. Rowe Price International
Richard l. hall (1979) Vice President
Vice President, T. Rowe Price and T. Rowe Price Group, Inc.
nabil hanano, CFA (1984) Vice President
Vice President, T. Rowe Price Group, Inc., and T. Rowe Price International
daniel b. hirsch, CFA (1985) Vice President
Vice President, T. Rowe Price and T. Rowe Price Group, Inc.
Jeffrey holford, Ph.d., ACA (1972) Vice President
Vice President, T. Rowe Price and T. Rowe Price Group, Inc.; formerly, Managing director, Jeffries Financial Group (to 2018)
Stefan hubrich, Ph.d., CFA (1974) Vice President
Vice President, T. Rowe Price and T. Rowe Price Group, Inc.
Arif husain, CFA (1972) Executive Vice President
Vice President, T. Rowe Price Group, Inc., and T. Rowe Price International
hiromasa Ikeda (1971) Vice President
Vice President, Price hong kong and T. Rowe Price Group, Inc.
Tetsuji Inoue (1971) Vice President
Vice President, Price hong kong, T. Rowe Price Group, Inc., and T. Rowe Price International
Michael d. Jacobs (1971) Vice President
Vice President, Price Japan, T. Rowe Price Group, Inc., and T. Rowe Price International
Randal S. Jenneke (1971) Vice President
Vice President, T. Rowe Price Group, Inc.
Prashant G. Jeyaganesh (1983) Vice President
Vice President, T. Rowe Price and T. Rowe Price Group, Inc.
nina P. Jones, CPA (1980) Vice President
Vice President, T. Rowe Price and T. Rowe Price Group, Inc.
Yoichiro kai (1973) Vice President
Vice President, Price Singapore, T. Rowe Price Group, Inc., and T. Rowe Price International
Jacob h. kann, CFA (1987) Vice President
Vice President, T. Rowe Price and T. Rowe Price Group, Inc.
Unless otherwise noted, officers have been employees of T. Rowe Price or T. Rowe Price International for at least 5 years.
OFFICERS (CONTINUED)
argle_1020_P5Proof #
65
T. ROWE PRICE GlObAl GROWTh STOCk Fund
Name (Year of Birth)Position Held With International Funds Principal Occupation(s)
Jai kapadia (1982) Vice President
Vice President, Price hong kong and T. Rowe Price Group, Inc.
Andrew J. keirle (1974) Executive Vice President
Vice President, T. Rowe Price Group, Inc., and T. Rowe Price International
Takanori kobayashi (1981) Vice President
Vice President, Price Japan, T. Rowe Price Group, Inc., and T. Rowe Price International; formerly, Research Analyst, Allianz Global Investors (to 2017)
Paul J. krug, CPA (1964) Vice President
Vice President, T. Rowe Price, T. Rowe Price Group, Inc., and T. Rowe Price Trust Company
Christopher J. kushlis, CFA (1976) Vice President
Vice President, T. Rowe Price Group, Inc., and T. Rowe Price International
Shengrong lau (1982) Vice President
Vice President, Price Singapore and T. Rowe Price Group, Inc.
Mark J. lawrence (1970) Vice President
Vice President, T. Rowe Price Group, Inc., and T. Rowe Price International
Jacqueline l. liu (1979) Vice President
Vice President, Price hong kong and T. Rowe Price Group, Inc.
Johannes loefstrand (1988) Vice President
Vice President, T. Rowe Price Group, Inc., and T. Rowe Price International
Anh lu (1968) Executive Vice President
Vice President, Price hong kong and T. Rowe Price Group, Inc.
Sebastien Mallet (1974) Vice President
Vice President, T. Rowe Price Group, Inc., and T. Rowe Price International
Jennifer Martin (1972) Vice President
Vice President, T. Rowe Price and T. Rowe Price Group, Inc.
Ryan Martyn (1979) Vice President
Vice President, T. Rowe Price Group, Inc., and T. Rowe Price International
Raymond A. Mills, Ph.d., CFA (1960) Executive Vice President
Vice President, T. Rowe Price, T. Rowe Price Group, Inc., T. Rowe Price International, and T. Rowe Price Trust Company
Jihong Min (1979) Vice President
Vice President, Price Singapore and T. Rowe Price Group, Inc.
Eric C. Moffett (1974) Executive Vice President
Vice President, Price hong kong and T. Rowe Price Group, Inc.
Unless otherwise noted, officers have been employees of T. Rowe Price or T. Rowe Price International for at least 5 years.
OFFICERS (CONTINUED)

argle_1020_P5Proof #
66
T. ROWE PRICE GlObAl GROWTh STOCk Fund
Name (Year of Birth)Position Held With International Funds Principal Occupation(s)
Ivan Morozov, CFA (1987) Vice President
Vice President, T. Rowe Price Group, Inc., and T. Rowe Price International
Samy b. Muaddi, CFA (1984) Executive Vice President
Vice President, T. Rowe Price and T. Rowe Price Group, Inc.
Tobias F. Mueller, CFA (1980) Executive Vice President
Vice President, T. Rowe Price Group, Inc., and T. Rowe Price International
Joshua nelson (1977) Executive Vice President
Vice President, T. Rowe Price, T. Rowe Price Group, Inc., T. Rowe Price International, and T. Rowe Price Trust Company
Philip A. nestico (1976) Vice President
Vice President, T. Rowe Price and T. Rowe Price Group, Inc.
Michael niedzielski (1979) Vice President
Vice President T. Rowe Price Group, Inc., and T. Rowe Price International
Sridhar nishtala (1975) Vice President
director and Vice President, Price Singapore; Vice President, T. Rowe Price Group, Inc.
Jason nogueira, CFA (1974) Executive Vice President
Vice President, T. Rowe Price and T. Rowe Price Group, Inc.
kenneth A. Orchard (1975) Executive Vice President
Vice President, T. Rowe Price Group, Inc., and T. Rowe Price International
Curt J. Organt, CFA (1968) Vice President
Vice President, T. Rowe Price and T. Rowe Price Group, Inc.
Paul T. O’Sullivan (1973) Vice President
Vice President, T. Rowe Price Group, Inc., and T. Rowe Price International
Oluwaseun A. Oyegunle, CFA (1984) Vice President
Vice President, T. Rowe Price Group, Inc., and T. Rowe Price International
Gonzalo Pángaro, CFA (1968) Executive Vice President
Vice President, T. Rowe Price Group, Inc., and T. Rowe Price International
Fran M. Pollack-Matz (1961) Vice President and Secretary
Vice President, T. Rowe Price and T. Rowe Price Group, Inc.
Vivek Rajeswaran (1985) Vice President
Vice President, T. Rowe Price and T. Rowe Price Group, Inc.
Shannon h. Rauser (1987) Assistant Secretary
Assistant Vice President, T. Rowe Price
Unless otherwise noted, officers have been employees of T. Rowe Price or T. Rowe Price International for at least 5 years.
OFFICERS (CONTINUED)

argle_1020_P5Proof #
67
T. ROWE PRICE GlObAl GROWTh STOCk Fund
Name (Year of Birth)Position Held With International Funds Principal Occupation(s)
Todd Reese (1990) Vice President
Employee, T. Rowe Price; formerly, Investment Analyst, Trian Fund Management (to 2016)
Melanie A. Rizzo (1982) Vice President
Vice President, T. Rowe Price and T. Rowe Price Group, Inc.
david l. Rowlett, CFA (1975) Vice President
Vice President, T. Rowe Price and T. Rowe Price Group, Inc.
Federico Santilli, CFA (1974) Executive Vice President
Vice President, T. Rowe Price Group, Inc., and T. Rowe Price International
nikolaj Schmidt (1975) Vice President
Vice President, T. Rowe Price Group, Inc., and T. Rowe Price International
Sebastian Schrott (1977) Vice President
Vice President, T. Rowe Price Group, Inc., and T. Rowe Price International
bin Shen, CFA (1987) Vice President
Vice President, T. Rowe Price International
John C.A. Sherman (1969) Vice President
Vice President, T. Rowe Price and T. Rowe Price Group, Inc.
Gabriel Solomon (1977) Vice President
Vice President, T. Rowe Price and T. Rowe Price Group, Inc.
Scott d. Solomon, CFA (1981) Vice President
Vice President, T. Rowe Price and T. Rowe Price Group, Inc.
Joshua k. Spencer, CFA (1973) Vice President
Vice President, T. Rowe Price, T. Rowe Price Group, Inc., and T. Rowe Price Trust Company
david Stanley (1963) Vice President
Vice President, T. Rowe Price Group, Inc., and T. Rowe Price International
Saurabh Sud, CFA (1985) Executive Vice President
Vice President, T. Rowe Price and T. Rowe Price Group, Inc.; formerly, Senior Vice President, PIMCO (to 2018)
Taymour R. Tamaddon, CFA (1976) Vice President
Vice President, T. Rowe Price, T. Rowe Price Group, Inc., and T. Rowe Price Trust Company
Ju Yen Tan (1972) Vice President
Vice President, T. Rowe Price Group, Inc., and T. Rowe Price International
Sin dee Tan, CFA (1979) Vice President
Vice President, T. Rowe Price Group, Inc., and T. Rowe Price International
Unless otherwise noted, officers have been employees of T. Rowe Price or T. Rowe Price International for at least 5 years.
OFFICERS (CONTINUED)

argle_1020_P5Proof #
68
T. ROWE PRICE GlObAl GROWTh STOCk Fund
Name (Year of Birth)Position Held With International Funds Principal Occupation(s)
dean Tenerelli (1964) Executive Vice President
Vice President, T. Rowe Price Group, Inc., and T. Rowe Price International
Siby Thomas (1979) Vice President
Vice President, T. Rowe Price and T. Rowe Price Group, Inc.
Justin Thomson (1968) Executive Vice President
Vice President, T. Rowe Price Group, Inc., and T. Rowe Price International
Mark J. Vaselkiv (1958) Executive Vice President
Vice President, T. Rowe Price, T. Rowe Price Group, Inc., and T. Rowe Price Trust Company
Rupinder Vig (1979) Vice President
Vice President, T. Rowe Price Group, Inc., and T. Rowe Price International; formerly, Partner, Egerton Capital (to 2016)
Willem Visser (1979) Vice President
Vice President, T. Rowe Price Group, Inc., and T. Rowe Price International; formerly, Investment Analyst, nn Investment Partners (to 2017)
Chris Vost (1989) Vice President
Vice President, T. Rowe Price Group, Inc., and T. Rowe Price International
Zenon Voyiatzis (1971) Vice President
Vice President, T. Rowe Price Group, Inc., and T. Rowe Price International
Verena E. Wachnitz, CFA (1978) Executive Vice President
Vice President, T. Rowe Price Group, Inc., and T. Rowe Price International
david J. Wallack (1960) Vice President
Vice President, T. Rowe Price, T. Rowe Price Group, Inc., and T. Rowe Price Trust Company
dai Wang (1989) Vice President
Vice President, Price hong kong and T. Rowe Price Group, Inc.
Megan Warren (1968) Vice President
Vice President, T. Rowe Price, T. Rowe Price Group, Inc., T. Rowe Price Retirement Plan Services, Inc., T. Rowe Price Services, Inc., and T. Rowe Price Trust Company; formerly, Executive director, JPMorgan Chase (to 2017)
hiroshi Watanabe, CFA (1975) Vice President
director and Vice President, Price Japan; Vice President, T. Rowe Price Group, Inc.
Clive M. Williams (1966) Vice President
Vice President, Price hong kong, Price Singapore, T. Rowe Price, T. Rowe Price Group, Inc., and T. Rowe Price International
Unless otherwise noted, officers have been employees of T. Rowe Price or T. Rowe Price International for at least 5 years.
OFFICERS (CONTINUED)

argle_1020_P5Proof #
69
T. ROWE PRICE GlObAl GROWTh STOCk Fund
Name (Year of Birth)Position Held With International Funds Principal Occupation(s)
J. howard Woodward, CFA (1974) Vice President
Vice President, T. Rowe Price Group, Inc., and T. Rowe Price International
Marta Yago (1977) Vice President
Vice President, T. Rowe Price Group, Inc., and T. Rowe Price International
benjamin T. Yeagle (1978) Vice President
Vice President, T. Rowe Price and T. Rowe Price Group, Inc.
Ernest C. Yeung, CFA (1979) Executive Vice President
director and Vice President, Price hong kong; Vice President, T. Rowe Price Group, Inc.
Alison Mei ling Yip (1966) Vice President
Vice President, Price hong kong and T. Rowe Price Group, Inc.
Eric Yuan (1984) Vice President
Vice President, Price hong kong and T. Rowe Price Group, Inc.; formerly, student, Columbia business School (to 2016)
Wenli Zheng (1979) Vice President
Vice President, Price hong kong and T. Rowe Price Group, Inc.
Unless otherwise noted, officers have been employees of T. Rowe Price or T. Rowe Price International for at least 5 years.
OFFICERS (CONTINUED)

argle_1020_P5Proof #
202012-1373887F174-050 12/20
You have manyinvestment goals.
Explore products and services that can help you achieve them.Whether you want to put away more money for retirement, for a child’s education, or for other priorities, we have solutions for you. See how we can help you accomplish the investment goals that are important to you.
RETIREMENTn IRAs: Traditional, Roth,
Rollover/Transfer, or Brokerage
n Small Business Plans help minimize taxes, maximize savings
n T. Rowe Price® ActivePlus Portfolios1 for online investing powered by experts
GENERAL INVESTINGn Individual or Joint
Tenantn Brokerage2 offers
access to stocks, ETFs, bonds, and more
n Gifts and transfers to a child (UGMA/UTMAs)
n Trustn Transfer on Death
COLLEGE SAVINGSn T. Rowe Price-managed
529 plans offer tax-advantaged solutions for families saving money for college tuition and education-related expenses
Visit troweprice.com/broadrange
Call 1-800-225-5132 to request a prospectus or summary prospectus; each includes investment objectives, risks, fees, expenses, and other information that you should read and consider carefully before investing.
All mutual funds are subject to market risk, including possible loss of principal. Investing internationally involves special risks including economic and political uncertainty and currency fluctuation.
1 The T. Rowe Price® ActivePlus Portfolios is a discretionary investment management program provided by T. Rowe Price Advisory Services, Inc., a registered investment adviser under the Investment Advisers Act of 1940. Brokerage services are provided by T. Rowe Price Investment Services, Inc., member FINRA/SIPC. Brokerage accounts are carried by Pershing LLC, a BNY Mellon Company, member NYSE/FINRA/SIPC. T. Rowe Price Advisory Services, Inc., and T. Rowe Price Investment Services, Inc., are affiliated companies.
2 Brokerage services are provided by T. Rowe Price Investment Services, Inc., member FINRA/SIPC. Brokerage accounts are carried by Pershing LLC, a BNY Mellon Company, member NYSE/FINRA/SIPC.
T. Rowe Price Investment Services, Inc. | 100 East Pratt Street | Baltimore, MD 21202-1009