October 24, 2011 National List Manager USDA/AMS/NOP ... · USDA/AMS/NOP, Standards Division 1400...
135
October 24, 2011 Lisa Brines, Ph.D. National List Manager USDA/AMS/NOP, Standards Division 1400 Independence Ave. SW Room 2646-So., Ag Stop 0268 Washington, DC 20250-0268 RE: Petition for inclusion of L-Methionine on the National List at §205.605(b) as a synthetic non-agricultural substance allowed in or on processed infant formula products labeled as “organic” or “made with organic (specified ingredients)” with the annotation “for use only in infant formula based on isolated soy protein.” Dear Dr. Brines, The International Formula Council (IFC) is an association of manufacturers and marketers of formulated nutrition products (e.g., infant formulas and adult nutritionals) whose members are based predominantly in North America. IFC members support the American Academy of Pediatrics’ (AAP) position that breastfeeding is the preferred method of feeding infants. We also agree with the AAP that, for infants who do not receive breast milk, iron-fortified infant formula is the only safe and recommended alternative, IFC members are committed to providing infant formulas of the highest quality for those mothers who cannot or choose not to breastfeed, discontinue breastfeeding prior to one year or choose to supplement. This petition seeks to add L-Methionine to the National List to permit its addition as a nonagricultural ingredient in infant formula based on isolated soy protein. L-Methionine is an essential amino acid for humans of all ages. Amino acids are the building blocks of protein. An essential amino acid is one that must be provided in the foods in our diet since our bodies do not have the capability of producing enough of it for normal metabolism and growth. Supplementing isolated soy protein with L-methionine improves the biological value of the protein and makes it nutritionally similar to breast milk protein and the protein of milk-based infant formula in its ability to sustain normal growth and development of young infants. L-Methionine must be added to infant formulas based on isolated soy protein to satisfy the protein biological quality requirement in the U.S. Food and Drug Administration (FDA) regulation for infant formula [21 CFR 107.100(f)] and to support normal growth and development of full-term infants fed soy isolate infant formulas. Only the L-form of methionine is permitted in infant food by FDA regulation [21 CFR 172.230]. Thus, L- methionine is necessary for the production of the organic product identified as infant formula based on isolated soy protein. Our petition and its appendices provide answers to all of the questions in the Guidelines on Procedures for Submitting National List Petitions, and in a manner that satisfies the criteria in the OFPA. We are available to provide any additional information that is required to complete your review process and recommendation. Sincerely, Mardi K. Mountford, MPH Executive Vice President
Transcript of October 24, 2011 National List Manager USDA/AMS/NOP ... · USDA/AMS/NOP, Standards Division 1400...

October 24, 2011 Lisa Brines, Ph.D. National List Manager USDA/AMS/NOP, Standards Division 1400 Independence Ave. SW Room 2646-So., Ag Stop 0268 Washington, DC 20250-0268 RE: Petition for inclusion of L-Methionine on the National List at §205.605(b) as a synthetic non-agricultural substance allowed in or on processed infant formula products labeled as “organic” or “made with organic (specified ingredients)” with the annotation “for use only in infant formula based on isolated soy protein.”
Dear Dr. Brines, The International Formula Council (IFC) is an association of manufacturers and marketers of formulated nutrition products (e.g., infant formulas and adult nutritionals) whose members are based predominantly in North America. IFC members support the American Academy of Pediatrics’ (AAP) position that breastfeeding is the preferred method of feeding infants. We also agree with the AAP that, for infants who do not receive breast milk, iron-fortified infant formula is the only safe and recommended alternative, IFC members are committed to providing infant formulas of the highest quality for those mothers who cannot or choose not to breastfeed, discontinue breastfeeding prior to one year or choose to supplement. This petition seeks to add L-Methionine to the National List to permit its addition as a nonagricultural ingredient in infant formula based on isolated soy protein. L-Methionine is an essential amino acid for humans of all ages. Amino acids are the building blocks of protein. An essential amino acid is one that must be provided in the foods in our diet since our bodies do not have the capability of producing enough of it for normal metabolism and growth. Supplementing isolated soy protein with L-methionine improves the biological value of the protein and makes it nutritionally similar to breast milk protein and the protein of milk-based infant formula in its ability to sustain normal growth and development of young infants. L-Methionine must be added to infant formulas based on isolated soy protein to satisfy the protein biological quality requirement in the U.S. Food and Drug Administration (FDA) regulation for infant formula [21 CFR 107.100(f)] and to support normal growth and development of full-term infants fed soy isolate infant formulas. Only the L-form of methionine is permitted in infant food by FDA regulation [21 CFR 172.230]. Thus, L-methionine is necessary for the production of the organic product identified as infant formula based on isolated soy protein. Our petition and its appendices provide answers to all of the questions in the Guidelines on Procedures for Submitting National List Petitions, and in a manner that satisfies the criteria in the OFPA. We are available to provide any additional information that is required to complete your review process and recommendation.
Sincerely,
Mardi K. Mountford, MPH Executive Vice President

Petition for Inclusion of L-Methionine on the National List
for Use in Infant Formula Based on Isolated Soy Protein
Item A
The petitioned substance L-Methionine will be included on § 205.605, Non-agricultural (non-
organic) substances allowed in or on processed products labeled as „„organic‟‟ or „„made with
organic (specified ingredients),‟‟ with the annotation “for use only in infant formula based on
isolated soy protein.”
Item B
1. The substance’s chemical or material common name.
The name of the substance is (L)-Methionine. L-Methionine is an essential amino acid for
humans of all ages. Amino acids are the building blocks of protein. An essential amino acid is
one that must be provided in the foods in our diet since our bodies do not have the capability of
producing enough of it for normal metabolism and growth.
Synonyms for L-methionine include the following:
(S)-2-Amino-4-(methylthio)butanoic acid
2-Amino-4-(methylthio)butyric acid, (S)-
2-Amino-4-methylthiobutanoic acid (S)-
Butanoic acid, 2-amino-4-(methylthio)-, (S)-
L(-)-Amino-gamma-methylthiobutyric acid
L-alpha-Amino-gamma-methylmercaptobutyric acid
L-alpha-Amino-gamma-methylthiobutyric acid
L-gamma-Methylthio-alpha-aminobutyric acid
It is important to stress that the form of methionine used in human infant nutrition must be the
natural “L-form,” the physiologically occurring form of methionine. Use of the unnatural “D-form”
in the present application is prohibited by the FAO/WHO Codex Alimentarius Commission
Standard for infant formula and by FDA regulation (21 CFR 172.230: “DL-Methionine (not for
infant foods)”).
2. The manufacturer’s or producer’s name, address and telephone number and other
contact information of the manufacturer/producer of the substance listed in the petition.
Two manufacturers currently certified as suppliers of L-methionine are Sekisui Medical
Company and Evonik-Rexim Pharmaceutical Company.
Sekisui Medical Company
KDX Nihombashi 313 building 5F
3-13-5, Nihombashi, Chuo-ku, Tokyo, 103-0027
Tel.: +81-3-3272-0671 / Fax: +81-3-3278-8774
http://www.sekisuimedical.jp/
Petition for Inclusion of L-Methionine on the National List for Use in Infant Formula
Based on Isolated Soy Protein
2
Evonik Rexim (Nanning) Pharmaceutical Co., Ltd
No.10, Wenjiang Road
Wuming County
530100 Nanning, China
c/o Evonik Degussa Corp. USA
379 Interpace Parkway
Parsippany,NJ 07054
Tel.: 973-541-8000 / Fax: 973-541-8040
3. The current use of L-Methionine is as a nutritionally essential amino acid used to
improve the biological value of infant formula based on isolated soy protein.
4. L-Methionine is currently used as an ingredient in infant formulas based on isolated
soy protein.
Isolated soy protein contains sufficiently less of the essential amino acid methionine than do the
proteins in breast milk and milk-based infant formula to make methionine the “limiting essential
amino acid” (the essential amino acid in lowest relative amount for adequate growth and
development) of isolated soy protein. Supplementing isolated soy protein with L-methionine
improves the biological value of the protein and makes it nutritionally equivalent to breast milk
protein and the protein of milk-based infant formula in its ability to sustain normal growth and
development of young infants.
5. The source of the substance and a detailed description of its manufacturing or
processing procedures from the basic component(s) to the final product.
The following information is excerpted and adapted from the description of L-methionine in the
Hazardous Substances Data Base prepared by the National Library of Medicine and taken from
an authoritative and reliable source1.
The production method of choice for L-methionine is the enzymatic resolution of racemic N-
acetyl-DL-methionine using acylase from Aspergillus oryzae. The production is carried out in a
continuously operated fixed-bed or enzyme membrane reactor. Alternatively, L-methionine may
be produced by microbial conversion (fermentation) of the corresponding 5-substituted
hydantoin. Growing cells of Pseudomonas sp. strain NS671 convert DL-5-(2-
methylthioethyl)hydantoin to L-methionine; a final concentration of 34 g/L and a molar yield of
93% have been obtained.
1 Eggersdorfer M et al; Ullmann's Encyclopedia of Industrial Chemistry 7th ed. (2008). New York, NY:
John Wiley & Sons; Vitamins.

Petition for Inclusion of L-Methionine on the National List for Use in Infant Formula
Based on Isolated Soy Protein
3
The most economic way for production of DL-methionine is the chemical process based on
acrolein, methyl mercaptan, hydrogen cyanide, and ammonium carbonate. β-
Methylthiopropionaldehyde, formed by addition of methyl mercaptan to acrolein, is the
intermediate that reacts with hydrogen cyanide to give alpha-hydroxy-gamma-
methylthiobutyronitrile. Treatment with ammonium carbonate leads to 5-(β-
methylthioethyl)hydantoin that is saponified by potassium carbonate giving DL-methionine in up
to 95% yield, calculated on acrolein.
Additional synthetic production processes for DL-methionine are mentioned in the 2001 TAP
Review for DL-methionine usage in organic livestock production. See page 3, Appendix A.
Supplier Evonik Rexim uses an enzymatic process for the final step in the production of L-
methionine.
Supplier Sekisui Medical Co. synthesizes DL-methionine via hydantoin intermediates and then
isolates the L-amino acid by enzymatic resolution.
6. A summary of any available previous reviews by State or private certification
programs or other organizations of the petitioned substance.
The National List currently includes DL-methionine, DL-methionine hydroxyl analog, and DL-
methionine hydroxyl analog calcium, as feed additives for use in organic poultry production, at
§205.603(d)(1). The National Organic Standards Board Technical Advisory Panel Review for
the USDA National Organic Program on methionine for livestock use dated May 21, 2001 is
attached as Appendix A.
NOP posted a Final Rule on synthetic Methionine in organic livestock production on March 14,
2011 that extended the allowance for methionine in organic poultry production until October 1,
2012, at the following maximum allowable limits of methionine per ton of feed: 4 pounds for
layers, 5 pounds for broilers, and 6 pounds for turkeys and all other poultry.
Critically, the sources of methionine allowed on the National List for livestock (poultry) include
the racemic DL-form and two synthetic analogs of methionine, all three of which are NOT
allowed in infant formula products.
The L-form of methionine has not been petitioned or formally reviewed for use in organic
handling of infant formula based on isolated soy protein.
The report in the National Library of Medicine Hazardous Substances Data Bank is attached as
Appendix B
7. Regulatory information
The FDA regulates the use in foods of amino acids, including L-methionine, at 21 CFR 172.320;
see Appendix C. L-Methionine is a food additive permitted for direct addition to food for human
consumption, as long as 1) the quantity of the substance added to food does not exceed the
amount reasonably required to accomplish its intended physical, nutritive, or other technical

Petition for Inclusion of L-Methionine on the National List for Use in Infant Formula
Based on Isolated Soy Protein
4
effect in food, and 2) any substance intended for use in or on food is of appropriate food grade
and is prepared and handled as a food ingredient.
The FDA promulgates the Infant Formula regulations under the authority of the Infant Formula
Act. 21 CFR 107.100(f) requires a minimum biological quality for the protein in infant formula. As
noted below in Items B.11 and B.12, the addition of L-methionine to infant formula based on
isolated soy protein is required for normal growth and development of the young infant and to
achieve the minimum biological quality required at 21 CFR 107.100(f), which is provided in
Appendix C.
The FAO/WHO Codex Alimentarius Commission created a Codex Standard for infant formula
over thirty years ago. Two elements of this standard are relevant to this petition. The standard
requires a minimum biological quality of the protein in infant formula; isolated soy protein
requires L-methionine addition to achieve the minimum. The Codex standard also requires use
of the natural L-form of an amino acid, including methionine. The latest Codex standard for
infant formula also is included in Appendix C.
8(a). The Chemical Abstract Service (CAS) number of L-methionine is 63-68-3.
8(b). The label of the currently marketed organic infant formula product that contains L-
methionine is attached as Appendix D.
9. The substance’s physical properties and chemical mode of action.
Physical Properties:
Physical state and appearance: Powdered solid
Color: White
Odor: Slight
Taste: Sulfurous
Molecular Weight: 149.21 g/mole
Solubility: Soluble in water, warm dilute alcohol
pH (1% solution in water): 5.85 (slightly acidic)
Melting Point: 281°C (537.8°F)

Petition for Inclusion of L-Methionine on the National List for Use in Infant Formula
Based on Isolated Soy Protein
5
Mode of Action: L-methionine is an indispensable amino acid. Humans, as well as other non-
ruminant mammals, cannot fix inorganic sulfur into organic molecules and must rely on ingested
sulfur amino acids, such as methionine, for the synthesis of protein and biologically active sulfur.
L-Methionine is currently used as a nutritionally essential amino acid required to improve the
biological value of a marketed organic infant formula based on isolated soy protein. L-
Methionine has been added to conventional soy isolate based infant formulas in the U.S. for
over forty-five years.
(a) Chemical interactions with other substances, especially substances used in organic
production.
DL-methionine is allowed on the National List for use in poultry rations, to improve the nutritional
quality of soybean-based rations. L-methionine also can be used for this purpose. L-methionine
is an unreactive powder that easily blends into dry mixes and is soluble in water, especially
warm or hot water, so it can be disperse in wet mashes.
(b) Toxicity and environmental persistence (Source of data: Hazardous Substances Data
Bank; see Appendix B).
Human Toxicity: Based on distribution data from the 1984-1994 NHANES III, the mean daily
intake for all life stage and gender groups of methionine from food and supplements is 1.8
grams per day. Men 51 though 70 years of age had the highest intakes at the 99th percentile of
4.1 grams per day.2
Methionine supplements (5 g/day) for periods of weeks were reportedly innocuous in humans.
Single oral doses of 7 g produced lethargy in six individuals and oral administration of 10.5 g of
L-methionine to one produced nausea and vomiting.
Non-Human Toxicity: L-Methionine is an essential amino acid for rats, mice, chickens, and
swine, as well as for humans. L-methionine needs to be furnished along with other essential
amino acids for it to be incorporated into the proteins needed for normal growth and
development. A diet devoid of methionine does not sustain life. Conversely, administering a
large, non-physiological level of L-methionine, in the absence of other essential amino acids,
can create metabolic imbalance and toxicity.
A single dietary dose (2.7% of the diet) of L-methionine decreased body growth and also
reduced food intake in rats. Dietary excesses of L-methionine (2.7% of the diet) for 6, 13, or 20
days have been associated with erythrocyte engorgement and accumulation of hemosiderine in
rats, and there was a depression of growth and splenic damage. Dietary intakes of 2 to 4% of L-
methionine caused slight changes in liver cells in rats and slight decreases in liver iron content.
2 Dietary Reference Intakes for Energy, Carbohydrate, Fiber, Fat, Fatty Acids, Cholesterol, Protein, and
Amino Acids. Institute of Medicine, National Academies Press, 2005, page 725.

Petition for Inclusion of L-Methionine on the National List for Use in Infant Formula
Based on Isolated Soy Protein
6
Darkened spleens caused by increases in iron deposition have been observed in weanling rats
fed 1.8% methionine diets for 28 days. Male Wistar rats were fed either an L-methionine-
supplemented (2.5 g/100 g) diet without changing any other dietary components or a control
(0.86 g/100 g) diet for 7 weeks. L-Methionine supplementation in the diet specifically increases
mitochondrial ROS production and mitochondrial DNA oxidative damage in rat liver
mitochondria offering a plausible mechanism for its hepatotoxicity.
Environmental Persistence: L-Methionine is formed in natural waters through metabolism of
naturally occurring proteins. It is one of the nine indispensable amino acids that cannot be
synthesized to meet body needs in animals and therefore must be provided in the diet. L-
methionine is not expected to adsorb to suspended solids and sediment. The potential for
bioconcentration in aquatic organisms is low. Using a laboratory activated sludge system, L-
methionine exhibited an 80% theoretical BOD reduction in 16 days.
L-Methionine has been shown to degrade in sunlit natural water through a photo-sensitized
oxidation involving singlet oxygen. Assuming that the top meter of sunlit natural water has a
singlet oxygen concentration of 4X10-14 M, the photooxidation half-life for the reaction L-
methionine with singlet oxygen has been estimated to be about 200 hr at pH 6-11. The near-
surface photooxidation rate (via singlet oxygen) of L-methionine in Okefenokee Swamp water
from Georgia is predicted to be about 3 hr. Bioconcentration and volatilization are not expected
to be important fate processes because of its high water solubility.
(c) Environmental impacts from its use and/or manufacture.
L-methionine is an indispensable amino acid that cannot be synthesized in the body of animals
and therefore must be provided in the diet. L-Methionine is used in normal metabolism and is
incorporated into the protein of every living organism on the earth. This accounts for its rapid
biological degradation in aquatic systems (See Item 9.b.)
In 2005, the environmental impact of the use and manufacture of synthetic methionine was
described in correspondence from Degussa (predecessor of Evonik) to NOP that is available on
the NOP website3 and is included in Appendix B.
The manufacturing plant of Evonik Rexim in Wuming, China, is ISO-certified and FDA-inspected
and operates according to HAACP (Hazard Analysis/Critical Control Points) requirements.
Sustainable development is an integral part of the business process. Economic, ecologic, and
societal aspects are given equal consideration.
The manufacturing plant of Sekisui Medical Co. for L-methionine is Iwate Factory in
Hachimantai City, approximately 600 km north of Tokyo. Sekisui actively takes steps to
preserve the environment. They reached a pollution prevention agreement with Hachimantai city
(former Matsuo village) in 1977, and constructed an anaerobic fermentation processing facility
in 1992. They obtained ISO14001 certification in Spring 2001.
3 http://www.ams.usda.gov/AMSv1.0/getfile?dDocName=STELPRD3479561 accessed 7 August 2011.

Petition for Inclusion of L-Methionine on the National List for Use in Infant Formula
Based on Isolated Soy Protein
7
(d) Effects on human health.
L-Methionine is an essential, indispensable amino acid. Humans cannot fix inorganic sulfur into
organic molecules and must rely on ingested sulfur amino acids, such as methionine, for the
synthesis of protein and biologically active sulfur compounds.
L-Methionine has other, non-nutritional uses. It is used as a hepatoprotectant (liver protector)
and as an antidote to acetaminophen poisoning, the result of which is liver damage.
(e) Effects on soil organisms, crops, or livestock.
Poultry have a greater need for this essential sulfur-containing amino acid than do other food
and fiber livestock sources, because they have feathers. DL-methionine is a customary
ingredient in poultry rations. L-Methionine can replace the DL-form in this application.
10. Safety information about the substance including a Material Safety Data Sheet
(MSDS) and a substance report from the National Institute of Environmental Health
Studies.
An MSDS is attached in Appendix E. The Hazardous Substances Data Bank information on L-
methionine prepared by the National Library of Medicine is included in Appendix B.
11. Research information about L-Methionine, including comprehensive substance
research reviews and research bibliographies.
General nutritional research information for L-methionine has been summarized by the Institute
of Medicine in 20054, and is included in Appendix F.
This petition requests the allowance on the National List of L-methionine solely for use in infant
formula based on isolated soy protein. Consequently, this section of the petition will focus on
research information and comprehensive research reviews about this use.
Infant formulas based on isolated soy protein were first introduced around 1965, following the
commercial introduction of high quality isolated soy protein raw materials. Edible soy protein is
isolated from defatted soy flour or soy „flakes‟ by dispersing the flour or flakes in mildly alkaline
water containing sodium hydroxide or potassium hydroxide at a pH less than 9 (a baking soda
(sodium bicarbonate) solution has a pH of about 8.4). The extract is clarified to remove the
insoluble material – insoluble protein, fiber – and the "supernatant" is then acidified to a pH
range of 4-5. The globular proteins precipitate as curd. The protein-curd is collected and
separated from the soy whey by centrifugation. The curd may be neutralized (solubilized) with
sodium hydroxide or potassium hydroxide prior to drying to yield a soluble proteinate powder.
4 Dietary Reference Intakes for Energy, Carbohydrate, Fiber, Fat, Fatty Acids, Cholesterol, Protein, and
Amino Acids. Institute of Medicine, National Academies Press, 2005.

Petition for Inclusion of L-Methionine on the National List for Use in Infant Formula
Based on Isolated Soy Protein
8
Conventional soy protein isolate5 is produced from hexane-extracted soy flakes and the acidifier
is hydrochloric acid; both hexane and hydrochloric acid are unacceptable in an organic process.
One commercial process6 for organic soy protein isolate uses carbon dioxide to “de-fat” full-fat
soy flour and citric acid for pH adjustment. The organic isolated soy protein7 used in the
currently marketed organic infant formula shown in Appendix D is produced from mechanically
pressed soybeans, with citric acid being used as the acidifier. All these isolated soy proteins
have substantially identical amino acid profiles, confirming that they contain the same globular
protein fraction of the soybean.
The fact that each of these isolated soy proteins represent the same protein fraction of the
soybean means that the infant nutritional research on conventional soy protein isolates
published over the past 50 years is applicable to the more recently developed organic isolated
soy protein and organic soy protein isolate.
Federal regulations8 require that the protein efficiency ratio (PER) of the nitrogen source of an
infant formula be at least 70% of that of casein, a standard protein. Isolated soy proteins used in
infant formulas are supplemented with L-methionine, the limiting amino acid. The extent of
supplementation is that necessary to meet the requirements of FDA with respect to the PER.9
Clinical evidence supports the addition of L-methionine to infant formula based on isolated soy
protein.
Fomon et al. (1979)10 compared the data of nine normal full-term infants fed a soy isolate-based
formula unsupplemented with methionine with similar data from 10 similar infants fed the same
formula supplemented with L-methionine. Statistically significant differences were as follows:
lesser weight gain per 100 kcal by infants fed the unsupplemented soy isolate-based formula
than by infants fed milk-based or other soy isolate-based formulas; lesser serum concentrations
of albumin at age 28 days by infants fed the unsupplemented soy isolate-based formula than by
breast-fed infants; greater serum concentrations of urea nitrogen by infants receiving the
unsupplemented soy isolate-based formula than by those receiving the same formula
supplemented with L-methionine. The results suggest that normal infants fed a formula
providing 2.25 /100 kcal of isolated soy protein not fortified with methionine perform less well
during the first 6 weeks of life than do breast-fed infants and infants fed milk-based formulas or
5 The commercial definition of “protein isolate” is a material with no less than 90% protein, dry matter
basis.The isolated protein extracted from hexane-defatted soy flakes contains very little fat. 6 U.S. Patent Application 20070207255, published September 6, 2007: “Plant-derived protein
compositions.” 7 Mechanically pressing is not as efficient a means for removing soy oil from soybeans as is hexane
extraction. Consequently, the soy protein material resulting from this organic process contains about 15% oil and thus less than 90% protein, and it cannot be designated “soy protein isolate.” 8 21 CFR 107.100(f).
9 Nutrition of Normal Infants. S. J. Fomon. 1993. Mosby, St. Louis. Page 126.
10 Fomon SJ, Ziegler EE, Filer LJ, Jr., Nelson SE & Edwards BB (1979) Methionine fortification of a soy
protein formula fed to infants. Am J Clin Nutr 32, 2460-2471.

Petition for Inclusion of L-Methionine on the National List for Use in Infant Formula
Based on Isolated Soy Protein
9
formulas based on isolated soy protein fortified with methionine. The limiting nutrient appears to
have been methionine. A copy of this study can be found in Appendix G.
In another study by Fomon et al. (1986)11, measurement of weight gain and serum
concentrations of urea nitrogen and albumin clearly showed a beneficial effect of methionine
supplementation at protein concentrations of 2.2 and 2.6 g/100 kcal. This is relevant to the
currently marketed organic infant formula based on isolated soy protein (label shown in
Appendix D), which provides protein at 2.5 g/100 kcal. A copy of this study also can be found in
Appendix G.
A major authoritative body, the Committee on Nutrition of the European Society for Pediatric
Gastroenterology and Nutrition, reviewed soy isolate infant formulas twice in the past twenty-five
years. These two reviews also can be found in Appendix G. In 1990, their statement12 read:
Isolated soy protein if appropriately processed is a good vegetable protein source for
children (7). It has a high nutritional value and its amino acid composition rating is 96%
that of casein, and even after allowance has been made for digestibility, the amino acid
score is 89% overall and still remains above 80% when the least available amino acid,
methionine, is considered, but nevertheless this is limiting (8). Thus even when protein
intake is not marginal, methionine supplements are needed to ensure growth, and to
maintain nitrogen balance and circulating plasma albumin concentrations (9). The
Committee considers, therefore, that soy protein isolate based infant and follow-up
formulas should contain at least 30 mg (200 pmol) of methionine/100 kcal (50 pmol (7.3
mg)/100 kJ), approximating to the amount in human breast milk.
In 2006, the ESPGHAN Committee on Nutrition13 wrote:
Soy protein isolates are derived from delipidated soy flour (90-95%) by elimination of
soluble carbohydrates and mineral salts (5). Soy protein has a lower biologic value than
cows‟ milk protein. The nitrogen conversion factor, which allows us to calculate the
protein content from the total nitrogen content, is lower for soy protein isolate than for
cows‟ milk protein. Soy and cows‟ milk proteins have a different amino acid pattern (i.e.,
soy protein contains lower amounts of methionine, branched chain amino acids lysine,
and proline and higher quantities of aspartate, glycine, arginine, and cystine than cows‟
milk protein) (14). To ensure adequate growth, nitrogen balance, and plasma albumin
concentrations, methionine supplements have been recommended (15,16).
The Committee specifically set a minimum of 2.25 grams of protein per 100 kcal and a minimum
L-methionine level of 29 mg/100 kcal for infant formula based on isolated soy protein.
11 Fomon SJ, Ziegler EE, Nelson SE & Edwards BB (1986) Requirement for sulfur-containing amino acids
in infancy. J Nutr 116, 1405-1422. 12
Aggett, P. J., F. Haschke, et al. (1990). "Comment on the composition of soy protein based infant and follow-up formulas. ESPGAN Committee on Nutrition." Acta Paediatr Scand 79(10): 1001-1005. 13
Agostoni C, Axelsson I, Goulet O, Koletzko B, Michaelsen KF, Puntis J, Rieu D, Rigo J, Shamir R, Szajewska H & Turck D (2006) Soy protein infant formulae and follow-on formulae: a commentary by the ESPGHAN Committee on Nutrition. J Pediatr Gastroenterol Nutr 42, 352-361.

Petition for Inclusion of L-Methionine on the National List for Use in Infant Formula
Based on Isolated Soy Protein
10
12. Petition Justification Statement for Inclusion of the Synthetic L-Methionine on the
National List at §205.605(b)
L-Methionine must be added to infant formulas based on isolated soy protein to satisfy the
protein biological quality requirement in the FDA regulation for infant formula [21 CFR
107.100(f)] and to support normal growth and development of full-term infants fed soy isolate
infant formulas. Only the L-form of methionine is permitted in infant food by FDA regulation [21
CFR 172.230]. Thus, L-methionine is necessary for the production of the organic product
identified as infant formula based on isolated soy protein.
Currently, all commercially available L-methionine is made from synthetic intermediates,
followed either by a final fermentation or by enzymatic resolution, According to our interpretation
of the definition of synthetic at §205.2, this L-methionine is synthetic.
L-Methionine is found naturally in proteins. Many L-amino acids are produced commercially by
fermentation, a process that may result in the L-amino acid being nonsynthetic. In 2011, it was
announced14 that a new industrial bio-fermentation process to produce L-methionine from plant-
based raw materials would be industrialized in Southeast Asia, at the end of 2013. However, the
announcement also included a reference to the production of methyl mercaptan, a sulfur-based
intermediate said to be key to the manufacture of methionine. Using this synthetic material in
the bio-fermentation process would make this L-methionine synthetic, as we read the definition
in §205.2.
The justification for soy-based infant formula is clearly described in “Infant Nutrition and Feeding
– A reference Handbook for Nutrition and Health Counselors in the WIC and CSF Programs,” a
resource published by the Food and Nutrition Service of USDA [Publ. No. FNS-288]15.
Soy-Based Infant Formula
Soy-based infant formulas were developed for infants who cannot tolerate infant formula
made from cow‟s milk. These infant formulas contain soy protein isolate made from
soybean solids as the protein source, vegetable oils as the fat source, added
carbohydrate (usually sucrose and/or corn syrup solids), and vitamins and minerals.
Soy-based infant formulas are fortified with the essential amino acid methionine, which is
found in very low quantities in soybeans. In these infant formulas, 10 to 11 percent of the
kilocalories are provided by protein, 45 to 49 percent by fat, and 41 to 43 percent by
carbohydrate. All soy-based infant formulas are fortified with similar amounts of iron as
milk-based iron-fortified infant formulas.
The AAP16 has stated that soy-based infant formulas are safe and effective alternatives
to cow‟s milk-based infant formulas, but have no advantage over them.
14 http://www.arkema.com/pdf/EN/press_release/2011/cj_and_arkema_press_release_va.pdf
15 http://www.nal.usda.gov/wicworks/Topics/FG/Chapter4_InfantFormulaFeeding.pdf. Accessed 28
September 2011. 16
The American Academy of Pediatrics

Petition for Inclusion of L-Methionine on the National List for Use in Infant Formula
Based on Isolated Soy Protein
11
Soy-based infant formulas may be indicated in the following situations:
Infants with galactosemia (a rare metabolic disorder) or hereditary lactase
deficiency
Infants whose parents are seeking a vegetarian diet for their full-term infant or
Infants with documented IgE-mediated allergy to cow‟s milk protein.
The use of soy-based infant formulas has no proven benefit in the following situations:
Healthy infants with acute gastroenteritis in whom lactose intolerance has not
been documented
Infants with colic
Prevention of allergy in healthy or high-risk infants, and
Infants with documented cow‟s milk protein-induced enteropathy or enterocolitis.
A larger question relates to justifying the need for infant formula. Breast milk is universally
recognized as the preferred feeding for infants in the first year of life (at least). Breast feeding
should be the exclusive nutrition of the infant for the first four to six months of life and the
nutritional foundation for the rest of the first year of life, when the infant begins to become
accustomed to the tastes and textures of the foods consumed by the rest of the family.
Given the nutritional superiority of breast milk and its general benefits, which range from higher
IQ to better speech enunciation, why is infant formula needed? The answer is found in the
Breastfeeding Report Card of the United States, 201017, the latest year available, which shows
that only 3 out of every 4 new mothers in the U.S. starts out breastfeeding. Rates of
breastfeeding at 6 and 12 months as well as the rate of exclusive breastfeeding at 3 months are
discouragingly low, as the following chart shows.
Ever
Breastfed
Breastfeeding
at 6 months
Breastfeeding
at 12 months
Exclusive breast-
feeding at 3 months
U.S. National 75.0% 43.0% 22.4% 33.0%
These data demonstrate the need for infant formula as a substitute for human milk in meeting
the normal nutritional requirements of infants who are not receiving only breast milk. Infant
formulas must conform to the regulations at Parts 106 and 107, Title 21, Code of Federal
Regulations, which require that an infant formula shall be nutritionally adequate to promote
normal growth and development when use in accordance with its directions for use.
13. A Confidential Business Information Statement
This petition contains no Confidential Business Information.
17 http://www.cdc.gov/breastfeeding/pdf/BreastfeedingReportCard2010.pdf Accessed September 27,
2011.

Appendices
Petition for addition of the Synthetic Substance L-METHIONINE to the National List of
Substances Allowed as Ingredients in or on Processed Products Labeled as “organic” or
“made with organic (specified ingredients or food group(s)).”
Appendix A National Organic Standards Board Technical Advisory Panel Review of DL-
Methionine in Organic Livestock Production for the USDA National Organic Program,
May 21, 2001
Appendix B Toxicology and Environmental Information
Hazardous Substances Data Bank – L-Methionine
2005 Letter and Enclosure from Degussa Corporation to Arthur Neal, NOP
Appendix C U.S. Regulations and International Standards
L-Methionine regulation - CFR 172.320
Infant Formula regulations - 21 CFR 107.100(f) biological quality
Codex Alimentarius Commission Standard 72-1981
Appendix D Product Label
Appendix E L-Methionine Material Safety Data Sheet (MSDS)
Appendix F Dietary Reference Intakes for Energy, Carbohydrate, Fiber, Fat, Fatty Acids,
Cholesterol, Protein, and Amino Acids. Institute of Medicine, National Academies Press,
2005. Pp. 725-6.
Appendix G Pediatric Research Studies and Reviews
Fomon SJ, Ziegler EE, Filer LJ, Jr., Nelson SE & Edwards BB (1979) Methionine fortification of a soy protein formula fed to infants. Am J Clin Nutr 32, 2460-2471.
Fomon SJ, Ziegler EE, Nelson SE & Edwards BB (1986) Requirement for sulfur-containing amino acids in infancy. J Nutr 116, 1405-1422.
Aggett PJ, Haschke F, Heine W, Hernell O, Launiala K, Rey J, Rubino A, Schoch G, Senterre J & Tormo R (1990) Comment on the composition of soy protein based infant and follow-up formulas. ESPGAN Committee on Nutrition. Acta Paediatr Scand 79, 1001-1005.
Agostoni C, Axelsson I, Goulet O, Koletzko B, Michaelsen KF, Puntis J, Rieu D, Rigo J, Shamir R, Szajewska H & Turck D (2006) Soy protein infant formulae and follow-on formulae: a commentary by the ESPGHAN Committee on Nutrition. J Pediatr Gastroenterol Nutr 42, 352-361.

for the USDA National Organic Program
May 21, 2001
Methionine
Livestock
Executive Summary 1 2 3 4 5 6 7 8 9
10 11 12 13 14 15 16 17 18 19 20 21 22 23 24 25 26 27 28 29 30 31 32 33 34 35 36 37 38 39 40 41 42 43 44
The NOSB received a petition in 1995 to add all synthetic amino acids to the National List. After deliberation of a review prepared by the TAP in 1996 and 1999, the NOSB requested a case-by-case review of synthetic amino acids used in livestock production, and referred three forms of methionine to the TAP. All of the TAP reviewers found these three forms to be synthetic. Two TAP reviewers advised that synthetic methionine remain prohibited. The one reviewer who advises the NOSB to recommend adding synthetic methionine to the National List agrees that it is not compatible with organic principles and suggests limitations on its use until non-synthetic sources are more widely available. The majority of the reviewers advise the NOSB to not add them to the National List for the following reasons:
1) Adequate organic and natural sources of protein are available [§6517(c)(1)(A)(ii)]; 2) Methionine supplementation is primarily to increase growth and production, not to maintain bird health, and
this is counter to principles embodied in the OFPA requirements for organic feed [§6509(c)(1)]; 3) Pure amino acids in general and synthetic forms of methionine in particular are not compatible with a
sustainable, whole-systems approach to animal nutrition and nutrient cycling [§6518(m)(7)]. Methionine is an essential amino acid needed for healthy and productive poultry. It is generally the first limiting amino acid in poultry diets. Synthetic (“pure”) amino acids are produced either synthetically or from genetically engineered sources and involve the use of highly toxic and hazardous chemicals such as hydrogen cyanide, ammonia, and mercaptaldehyde. Synthesis of DL-methionine, and DL-methionine hydroxy analogs also result in significant pollution of the environment. These sources of methionine do not occur in nature. Most amino acids are metabolized from protein, even in conventional feeding situations. Adequate levels of essential amino acids can be obtained in the diet of poultry fed adequate levels of intact protein from natural sources. Synthetic amino acids are used to improve feed conversion efficiency and lower feed costs. Although there may be limitations in the current supply of diverse organic protein sources, a requirement for natural, non-GMO sources of methionine will stimulate market development in organic and approved feedstuffs. Other natural sources, such as fish meal, crab meal, and yeast are also available, and would be more compatible with organic standards than synthetic ones. Clarification of the status of some of these alternatives is needed. If synthetic substances are allowed to substitute for organic feed, that undermines the incentive to produce organic feedstuffs. Humans have raised poultry for centuries without synthetic amino acids. Synthetic amino acids have become part of the standard poultry diet only over the past 50 years or so as production has moved from extensive pasture-based nutrition to high-density confinement systems. Reliance on a higher protein diet to achieve necessary amino acid balance may result in higher excretion of uric acid that can form ammonia in the litter. Under an organic management system where there is access to the outdoors, suitable densities, and integrated management of manure and crop production this is not a problem. “Excess” nitrogen is not a waste problem in an organic system; it is a valuable resource that needs to be managed in an integrated and holistic way.
Appendix A Page A1

Livestock
Identification 45 46 47 48 49 50 51 52
53 54 55 56 57 58 59 60 61 62 63
Chemical Names: 2-amino-4-methylthiobutyric acid and α-amino-γ-methylmercaptobutyric acid Other Names: DL-methionine, D-methionine, L-methionine, Met, Acimethin
CAS Numbers: 59-51-8 (DL-methionine) 63-68-3 (L-methionine) 348-67-4 (D-methionine) Other Codes: International Feed Names (IFN): DL-methionine: 5-03-86 DL-methionine hydroxy analog calcium: 5-03-87 DL-methionine hydroxy analog: 5-30-28
Poultry Production 64 65 66 67 68 69 70
Background: This supplementary information was requested by the NOSB to be added to the 1999 Technical Advisory Panel general review of amino acids for use in livestock production. The NOSB tabled the decision in October of 1999 on amino acids for all livestock, and decided to consider only the use of methionine for poultry production. Supporting information for this use was received (Krengel, 2001) and this additional information is addressed in this review in addition to a more recent review of the literature.
Summary of TAP Reviewer Analysis 1 71 72
Synthetic / Non-Synthetic:
Allowed or Prohibited
Suggested Annotation:
Synthetic (3-0) Prohibit (2) None. Allow (1) Source must be non-GM. For poultry rations only. Only when
alternatives are not available including ration diversity and acceptable animal and plant sources, or enzyme digested natural protein sources. Not to exceed 0.1% by weight in any feed source directly fed to poultry.
73
Characterization 74 75 76 77 78
Note: The description of composition, properties, and manufacturing process (how made) remains the same as provided in the 1999 TAP review. The sections on specific uses, action, combinations, regulatory status, and review under OFPA criteria 1,2,5,6, and 7 have been revised to consider poultry production.
79 80 81 82
Composition: Amino acids have an amino group (NH2) adjacent to a carboxyl (COOH) group on a carbon. The model amino acid for livestock production is methionine. The formula for methionine is H2NCH3SCH2CH2COOH. Properties: 83
1 This Technical Advisory Panel (TAP) review is based on the information available as of the date of this review. This review addresses the requirements of the Organic Foods Production Act to the best of the investigator’s ability, and has been reviewed by experts on the TAP. The substance is evaluated against the criteria found in section 2119(m) of the OFPA [7 USC 6517(m)]. The information and advice presented to the NOSB is based on the technical evaluation against that criteria, and does not incorporate commercial availability, socio-economic impact or other factors that the NOSB and the USDA may want to consider in making decisions.
Appendix A Page A2

84 85 86 87
L-Methionine: Colorless or white lustrous plates, or a white crystalline powder. Has a slight, characteristic odor. Soluble in water, alkali solutions, and mineral acids. Slightly soluble in alcohol, insoluble in ether. MP 280-282°C. It is assymetric, forming both an L- and a D- enantiomer. Methionine hydroxy analog (MHA) is available in liquid form.
88 89 90 91 92 93 94 95 96 97 98 99
100 101 102 103 104 105
How Made: Methionine may be isolated from naturally occurring sources, produced from genetically engineered organisms, or entirely synthesized by a wide number of processes. While methionine has been produced by fermentation in laboratory conditions, racemic mixtures of D- and L- methionine (DL-Methionine) are usually produced entirely by chemical methods (Araki and Ozeki, 1991). Methionine can be produced from the reaction of acrolein with methyl mercaptan in the presence of a catalyst (Fong, et al., 1981). Another method uses propylene, hydrogen sulfide, methane, and ammonia to make the intermediates acrolein, methylthiol, and hydrocyanic acid (DeGussa). The Strecker synthesis can be used with α-methylthiopropionaldehyde as the aldehyde (Fong, et al., 1981). A recently patented process reacts 3-methylmercaptopropionaldehyde, ammonia, hydrogen cyanide, and carbon dioxide in the presence of water in three reaction steps (Geiger et al., 1998). Other methods are discussed in the 1999 Crops Amino Acid TAP review. DL-methionine hydroxy analog calcium and DL-methionine hydroxy analog forms are considered to be alpha-keto acid analogues in which the amine group has been replaced by a hydroxy (OH) group. These forms are converted to the amino form in the bird by transamination in the liver, using non-essential amino acids such as glutamic acid (Cheeke 1999; Leeson 1991). These forms are produced by reacting hydrogen cyanide with an aldehyde that has been treated with a sulfite source to form a cyanohydrin. The aldehydes used are prepared from either hydrogen sulfide or an alkyl mercaptan with an aldeyhde such as acrolein and are then hydrolyzed using sulfuric or hydrochloric acid (USPO 1956).
106 107 108 109 110 111 112 113 114 115 116 117 118 119 120 121 122 123 124 125 126
Specific Uses: The requested use for methionine in poultry production is as a feed supplement. For optimum health and performance, the animal’s diet must contain adequate quantities of all nutrients needed, including amino acids. The essential amino acid furthest below the level needed to build protein is known as the limiting amino acid. A shortage of the limiting amino acid will constrain animal growth, reduce feed efficiency, and in extreme cases cause a nutritional deficiency. Supplementation with isolated amino acids increases feed conversion efficiency, thus lowering feed costs per unit of weight gain or production (Pond, Church, and Pond, 1995). Methionine is considered to be the first limiting amino acid in corn-soy poultry diets, followed by lysine and arginine (Baker 1989, NRC 1994, Cheeke 1999). An extensive literature has been published that documents the efforts to optimize the balance of amino acids in poultry diets in order to lower costs, reduce need for animal or fish proteins, replace soy meal with less expensive or more locally available plant proteins, and utilize plant proteins more efficiently (De Gussa 1995, 1996; North 1990; Neto, et. al. 2000; Cino 1999; Emmert 2000; DiMello 1994; Weibel 2000). Amino acids are also used in livestock health care. Methionine is used as a urine acidifier because excretion of its sulfate anion lowers urine pH. Its sulfate anion may also displace phosphate from magnesium-ammonium-phosphate hexahydrate (struvite, double phosphate, or triple phosphate if calcium is also present) crystals and uroliths, which form best at a pH above 6.4-6.6. As a result of these effects, methionine is used to assist in dissolving and/or preventing uroliths, kidney stones, bladder stones, or urologic syndromes thought to be caused by struvite uroliths or crystals (Lewis, Morris, and Hand, 1987). Methionine is also used to assist in the treatment and/or prevention of hepatic lipidosis because of its need for body fat mobilization and transport.
127 128 129 130 131 132 133 134 135 136 137 138
Action: Amino acids form protein. Of the 22 amino acids found in body proteins, the National Research Council lists 13 as essential in poultry diets, and these must be consumed in feed. These 13 are: arginine, glycine, histidine, isoleucine, leucine, lysine, methionine, cystine, phenylalanine, proline, threonine, tryptophan, and valine (NRC 1994). Five that are deemed critcial in poultry rations are methionine, cystine, lysine, tryptophan, and arginine (North, 1990). Animals convert dietary protein into tissue protein through digestive processes. Proteins are metabolized by animals through two phases: catabolism (degradation from body tissue to the free amino acid pool) and anabolism (synthesis into body tissue). Amino acids utilized as proteins are primary constituents of structural and protective tissues, including skin, feathers, bone, ligaments, as well as muscles and organs.
139 Combinations:
Appendix A Page A3

140 141 142 143
Amino acids are combined in feed rations of grains, beans, oilseeds, and other meals with antioxidants, vitamins, minerals, antibiotics, and hormones (Pond, Church, and Pond, 1995). Methionine is a precursor in the diet to cystine, and the amount needed in the diet depends on the amount of cystine also present. Requirements for methionine are frequently cited in terms of methionine plus cystine, because methionine converts to cystine as needed.
Status 144 145 146 147 148 149 150 151 152 153
OFPA, USDA Final Rule Amino acids do not appear on the list of synthetics that may be allowed according to the OFPA [7 USC 6517(c)(1)(B)(i)]. This list of permitted synthetics includes vitamins and minerals, livestock paraciticides, and medicines. Medicines can not be administered in the absence of illness (7USC 6509(d)(1)(C), and growth promoters including hormone, antibiotics, and synthetic trace elements may not be used to stimulate growth or production of livestock [7USC 6509(c)(3)]. Feed must be produced organically, and cannot contain synthetic nitrogen in the form of urea [7 USC 6509(c)]. Under the requirements of the USDA rule at 7CFR 205.237, synthetic substances added to feed must be listed under 205.603 or else will be prohibited at date of implementation.
154 155 156 157 158 159 160 161 162
Regulatory Regulated as a nutrient / dietary supplement by FDA (21 CFR 582.5475). The Association of American Feed Control Officials (AAFCO) set the standard of identity for DL-methionine as containing a minimum of 99% racemic 2-amino-4-methylthiobutyric acid (AAFCO, 2001). The AAFCO model regulation states that “the term Methionine Supplement may be used in the ingredient list on a feed tag to indicate the addition of DL-Methionine” (AAFCO, 2001). AAFCO also lists a feed definition for DL-Methionine hydroxy analogue calcium (min. 97% racemic 2-amino-4-methylthiobutyric acid, 21 CFR 582.5477) and DL-Methionine hdyroxy analogue, (min. 88% racemic 2-amino-4-methylthiobutyric acid, 21 CFR 582.5477).
163 164 165 166 167 168
Status among Certifiers Current published standards shows that two U.S. certifiers clearly prohibit amino acids (OCIA 2000; CCOF Intl. 2001) and some explicitly allow (FVO 2001; Oregon Tilth 1998; QAI 1999 - for nonruminants). Various other state and private certifiers either explicitly or implicitly allow the use of essential amino acids. The status among U.S. certifiers remains unresolved awaiting a recommendation by the NOSB.
169 170 171 172 173 174
Historic Use The history of use in organic production is not clear due to lack of specific mention in most agency standards. The widepread use of crystalline (pure) amino acids in formulated rations has expanded greatly since 1980 for non-organic poultry production. Most current use in organic poultry production appears to be as a supplement for broilers (meat chickens) and turkeys as well as for laying hen feed rations. International 175
176 177 178 179 180 181 182 183 184 185 186 187 188 189
CODEX - The Codex Draft Guidelines for Livestock production, approved May 2000 (Alinorm 01/22 Appendix II Annex 1. B. item 18) state that:
• feedstuffs of mineral origin, trace elements, vitamins, or provitamins can only be used if they are of natural origin. In case of shortage of these substances, or in exceptional circumstances, chemically well-defined analogic substances may be used;
• synthetic nitrogen or non-protein nitrogen compounds shall not be used. This draft is considered to be at step 8 of the Codex process, and will go the Codex Alimentarius Commission in July 2001 for adoption (Joint FAO/WHO Standards Programme). This was considered to prohibit urea, (Lovisolo, 2001) and appears to also prohibit synthetic amino acids.1 EU 2092/91 - The European Standards do not include amino acids among permitted feedstuffs (European Union, 1999).
1 Non-protein nitrogen compounds include substances such as urea and ammoniated materials (AAFCO, 2001). In the technical literature, non-protein nitrogen is considered to include “free amino acids, amino acid amides, glucosides containing nitrogen, nuleotides, urea, nitrates, ammonium salts and other low-molecular weight compounds containing nitrogen” (Boda, 1990).
Appendix A Page A4

190 191 192 193 194 195 196
IFOAM - Amino acids are prohibited for use in feed by IFOAM (IFOAM, 2000). IFOAM also supported the interpretation of the CODEX prohibition of non-protein nitrogen to extend to pure amino acids (Schmid, 2001). Canada - Canadian standards allow essential amino acids, but explicitly prohibit ones from genetically engineered sources and state that the material may have some additional requirements. Operators are instructed to consult with their certification body for approval (Canadian General Standards Board, 1999).
OFPA 2119(m) Criteria 197
199 200 201 202 203 204 205 206 207 208 209
211 212 213 214 215 216 217 218 219 220 221 222 223 224 225 226 227 228 229 230 231
233 234 235 236 237 238 239 240 241 242 243
(1) The potential of such substances for detrimental chemical interactions with other materials used in organic farming systems. 198 The primary chemical interaction is the dietary intake by animals. While many of the interactions may be regarded as beneficial, excess methionine in a diet may cause deficiencies in other amino acids and induce toxicity (D’Mello, 1994). Methionine, while often one of the most limiting amino acids, is also one that readily goes to toxic excess. Small excesses of methionine can be deleterious (Buttery and D’Mello, 1994). Errrors in feed formulation or excess supplemental methionine can actually depress growth and development at levels of 40 g/kg (4.0%) (Baker, 1989, NRC 1994). Excess methionine exacerbates deficiencies of vitamin B-6, which results in depressed growth and feed intake (Scherer, 2000). Growth depressions resulting from excess supplemental amino acids include lesions in tissues and organs (D’Mello, 1994). Methionine is “well established as being among the most toxic of all amino acids when fed at excess levels in a diet” (Edmonds and Baker, 1987 cited in Scherer, 2000).
(2) The toxicity and mode of action of the substance and of its breakdown products or any contaminants, and their persistence and areas 210 of concentration in the environment. While it is nutritionally essential, methionine excesses are far more toxic to poultry than similar excesses of tryptophan, lysine, and threonine (National Research Council, 1994). Force feeding methionine to excess can result in death to chicks (National Research Council, 1994). However, NRC acknowledges that such toxicities are unlikely in practical circumstances for poultry, in that an amino acid toxicity requires a particularly high level of an amino acid relative to all others. Supplemental levels fed to poultry are usually fed at lower levels, ranging from 0.3 - 0.5% of the diet. Susceptiblity of an animal to imbalances and excesses is influenced by the overall protein supply, and animals that are fed relatively high levels of protein are more tolerant (Buttery and D’Mello, 1994). A dosage of 2 g / mature cat / day (20 to 30 g / kg dry diet) for 20 days induces anorexia, ataxia, cyanosis, methemoglobinemia and Heinz body formation resulting in hemolytic anemia (Maede, 1985). Rat studies of methionine is significantly toxic in excess (Regina, et al., 1993). High levels of methionine were found to be toxic to hepatic cells and liver function of the rat models. The results of this study indicated that the biochemical reason for the extreme sensitivity of mammals to excess dietary methionine is thought to be due to the accumulation of toxic catabolites, most notably, S-adenosylmethione, resulting in liver dysfunction. L-methionine has an acute LD50 of 4,328 mg/kg (rat) (NIEHS, 1999b). NIEHS carcinogenicity and teratogenicity are not available, but reports positive mutagenicity (NIEHS, 1999b). Methionine is stable in crystalline form at standard temperature and pressure.
(3) The probability of environmental contamination during manufacture, use, misuse or disposal of such substance. 232 Synthetic production of DL-methionine involves a number of toxic source chemicals and intermediates. Each of the several manufacturing processes used to produce DL-methionine was rated as either “moderately heavy” to “extreme” (Fong, et al., 1981). Newer processes have not replaced many of the feedstocks. Several of the feedstocks are likely to result in ruptured storage tanks, leaking chemicals, and releases into the environment. The methionine production process is listed by EPA as a hazardous air pollutant (40 CFR 63.184). Methyl mercaptan can react with water, steam, or acids to produce flammable and toxic vapors (Sax, 1984). The EPA rates methyl mercaptan fires as highly hazardous and can cause death by respiratory paralysis (EPA, 1987). Acrolein has a toxicity rating of 5 (on a scale of 1 to 6 with 6 being most toxic) (Gosselin, 1984) and it is also an aquatic herbicide (Meister, 1999). The acrolein process involves several steps that render it synthetic as well (1994). Acrolein itself is an extreme irritant.
Appendix A Page A5
244 245 246 247 248 249 250 251
253 254 255 256 257 258 259 260 261 262 263 264 265 266
268
Hydrogen cyanide is produced by further processing of methane and ammonia. Hydrogen cyanide is a gas that is highly toxic. Hydrogen cyanide has a toxicity rating of 6 and is one of the fastest acting poisons known to man (Gosselin, 1984). Exposure causes paralysis, unconsciousness, convulsions, and respiratory arrest. Death usually results from exposure at 300 ppm concentrations for a few minutes. Manufacture of hydrogen cyanide is a significant source of atmospheric release of cyanide (Midwest Research Institute, 1993). Ammonia is a corrosive agent. Methane is a central nervous system depressant (Gosselin, 1984).
(4) The effect of the substance on human health. 252
Methionine is essential in small amounts in the human diet, and is sold over-the-counter as a dietary supplement. The L- form of methionine is used extensively in human medicine for a variety of therapeutic purposes, including pH and electrolyte balancing, parenteral nutrition, pharmaceutical adjuvant, and other applications. It is in fact one of the top 800 drugs in human medicine (Mosby, 1997). Methionine may cause nausea, vomiting, dizziness, and irritability and should be used with caution in patients with severe liver disease (Reynolds, 1996). The D- form of methionine is not well utilized by humans (Lewis and Baker, 1995). Individuals may have allergic reactions to the D- isomers or a racemic mixture of DL-methionine. While a number of amino acids are considered GRAS for human consumption and as feed supplements, DL-methionine is not (see 21 CFR 172, 21 CFR 184, and 21 CFR 570.35). DL-methionine is unique among amino acids cleared for food use in that it is the only one listed that explicitly says it is not for use in infant feed formulas (21 CFR 173.320). When heated to decomposition, methionine emits dangerous and highly toxic fumes (NIEHS, 1999).
(5) The effects of the substance on biological and chemical interactions in the agroecosystem, including the physiological effects of the 267
substance on soil organisms (including the salt index and solubility of the soil), crops and livestock. Interactions and Imbalances 269
270 271 272 273 274 275 276 277 278 279 280 281 282 283 284 285 286 287 288 289 290 291 292 293 294 295 296 297 298 299
Protein is required for body development in all growing birds, and layers also need a good proportion since eggs consist of 13-14% protein. Broilers also need high energy diets as they are commericially raised to grow rapidly to reach about 4.4 lbs in 8 week at a desired food conversion rate of 1.8 (consuming less than 8 lbs of feed total) (Sainsbury, 2000). This is a 50-55 fold increase inbody weight by 6 weeks after hatching, which leads to a high amino acid requirement to meet the need for active growth (NRC 1994). The dietary requirement for protein is actually a requirement for the amino acids contained in the dietary protein. Protein quality is related to the proper balance of essential amino acids in the diet. The presence of nonessential amino acids in the diet also reduces the necessity of synthesizing them from the essential amino acids (NRC 1994). Amino acids in the body are constantly in flux between three states: stored in tissue, oxidized from tissue to free amino acids, and digested and excreted as uric acid. If some nonessential amino acids are low, they may be synthesized from others in the free amino acid pool, or degraded from those stored in tissue. Deficiencies or excesses of a particular amino acids can cause problems in availability of other amino acids (Buttery and D’Mello 1994; Baker 1989). Intact proteins (as in natural grains) are more slowly available in the digestive system, while pure sources of amino acids are more bioavailable than intact-protein sources (Baker, 1989). Excesses of some amino acids in an unbalanced source of crude protein can reduce feed intake and depress amino acid utilization (Pack, 1995). Depressed feed intake and growth at excess intake levels of protein has recently been attributed to insufficient supply of vitamin B-6 which is required to metabolize the sulfur amino acids (Scherer and Baker 2000). The requirement for sulfur containing amino acids of methionine, cystine, and cysteine can be misjudged due to inaccurate accounting for the availability of cystine in the diet (NRC, 1994). Other cases have shown significantly higher weights and faster gains from amino acid (lys+met) supplementation (Slominski et al, 1999). Also, the digestibility of practical ingredients, such as corn and soybeans, appears to be on the order of 85% or more (NRC, 1994). Amino acid requirements may be affected by environmental temperature extremes, basically because of the effect on feed intake, but amino acid supplementation will only affect weight gain if it improves feed intake (Baker 1989; NRC 1994). Interactions between deficiencies of methionine and several vitamins and minerals
Appendix A Page A6

have also been documented, and suggest that other dietary factors in addition to total protein have an effect on the efficency of amino acid utilization (Baker, D.H. et.al, 1999).
300 301 302
Environmental Impact 303 304 305 306 307 308 309 310 311 312 313 314 315 316 317 318 319 320 321 322 323 324 325 326 327
Managing the nitrogen cycle is seen as a challenge to livestock producers (Tamminga and Verstegen, 1992; Tamminga, 1992; Morse, no date). Poultry layer operations are experiencing increased costs and regulations for manure management (Sloan, et al., 1995). Supplementation with amino acids may allow dietary protein and excretory nitrogen levels to be reduced with a minimum reduction in egg output and no loss in weight gain in broilers (Summers, 1993; Sloan et al., 1995, Ferguson, et.al 1998). Excess ammonia build up in poultry houses can be a hazard to workers and birds if not properly ventilated (Ferguson, 1998). Feeding systems that reduce levels of protein fed using amino acid supplementation are not the only means identified to reduce nitrogen pollution from animal manure. Other potential solutions include lower animal densities; more frequent rotations; better manure storage, handling, and application techniques; use of enzymes; improved processing of the feed; and selection of more appropriate land and locations to graze and shelter animals (Archer and Nicholson, 1992; Tamminga, 1992; Tamminga and Verstegen, 1992). Increased digestiblilty of protein in feeds suplemented with microbial phytase provided better availabilty of most of the amino acids other than lysine and methionine and allowed for reduced P and Ca levels in feed, a goal in reducing phosphorus overload from poultry manure (Sebastian 1997). Another study found that reduced crude protein and energy content were needed in enzyme supplemented broiler diets, although availability of individual amino acids were not improved equally and were still deemed to need balancing (Zanella, et al 1999). One grower reported success with innovative housing design that allows twice daily cleanout of manure, combined with a commercial composting operation (La Flamme, 2001). Manure from organic operations has potential added value to organic crop farmers seeking to avoid manure from conventional operations. Some markets in the EU require that imported crops are documented to be grown free of “factory farm” manure, requiring additional verification from U.S. certifiers (McElroy, 2001). Impacts on Bird Health 328
329 330 331 332 333 334 335 336 337 338 339 340 341 342 343 344 345 346 347 348
350 351 352 353 354 355 356
A number of reports cite a benefit of methionine supplementation on reduced immunologic stress (Klasing, 1988; Tsiagbe et al, 1986). Immunologic stress is considered to be a response to microbial challenges, in these experiements due to injections of E. coli and Salmonella and other pathogens. This causes decreased feed rates and lower rates of growth. Chicks that received deficient levels of methionine were more subject to an impaired immune response. These experiments seem to be more applicable to a high density confinement system or high density production system in terms of bird treatment, and may not be very relevant to an organic system approach. A problem exacerbated by excess methionine is hepatic lipidosis, a condition of excessive fat in the liver commonly associated with caged birds and is related to the fact that wild diets are much lower in fat than seed diets fed to captive species (Aiello, 1998). This can be mangaged by a well balanced diet, and is reportedly not a problem in free range birds in organic systems (Krengel, 2001). Enteritis is a disease frequently observed in poultry that do not have access to the soil and green growing plants (Titus, 1942). Well managed pasture would prevent this cause of the disease. Reduced feathering has been reportedly linked to lack of methionine and cystine (Elliott, no date). Many other factors are also involved, including deficiencies of other amino acids, vitamins, zinc, feather pecking in cage systems, and cannibalism (Elliot, NRC 1994). Increased protein level is correlated with reduced feather loss and cannibalism (Ambrosen, 1997).
(6) The alternatives to using the substance in terms of practices or other available materials. 349 Birds raised on pasture with access to insects and worms historically did not need supplementation (Morrison, 1951), and smaller scale pastured operations have success without the need for synthetic supplements (Salatin, 1993). Pasture quality will vary according to field conditions and the season. However, free range poultry on well managed pasture are able to supplement their diets with insects, annelids, and fresh green forage (Smith and Daniel, 1982). The two most limiting amino acids, methionine and lysine, are found in richest sources in proteins of animal origin. Common natural sources of these amino acids have traditionally been fish meal and meat meal, especially for starter chicks and broilers (Sainsbury, 2000). The USDA organic program final rules do
Appendix A Page A7

not allow the use of meat meal as feed for poultry or mammals and may or may not allow fish or crab meal (7CFR 205).
357 358 359 360 361 362 363 364 365 366 367 368 369 370 371 372 373 374 375 376 377 378 379 380 381 382 383 384 385 386 387 388 389 390 391 392 393 394 395 396 397 398 399 400 401 402 403 404 405 406 407 408 409 410 411 412 413
Diets can be formulated without supplemented synthetic acids to meet the objective of adequate methionine percentages, but this usually requires an increase in crude protein level of the diet (Hadorn, 2000). Many studies have been done to identify a cost effective method of lowering protein content by supplementing with methionine and lysine. Often the control treatments are non-supplement grain based diets. A comparison study using supplemented and non-supplemented diets found that adequate dietary methionine can be attained, at a cost of higher intake of protein and less protein efficicy ratio (Emmert 2000). Another study fed a control diet using only corn and soy to satisfy amino acid levels compared to reduced protein supplemented with methionine and lysine, and these treatments were considered successful because performance was not lowered in 4-5 experiments (Harms, 1998). Rice and casein offer potential novel available sources of methionine (Lewis and Bayley, 1995). Yeast protein has long been known as a rich protein source relatively high in methionine+cystine (Erbersdobler, 1973; National Research Council, 1994), as well as phosphorous and B-complex vitamins (Morrison, 1951). As a natural feed supplement, NOSB should advise whether yeast is considered agricultural and required from organic sources or permitted as a natural substance. Other potential sources of available methionine for poultry appear to be sunflower meal and canola meal (Waibel et al., 1998). These natural sources are all currently of limited availability in organic forms. Alfalfa meal is reported to be a good additional protein source, though difficult to blend in commercial formulations. Optimally balancing these nutrients may be challenging to feed processors and livestock producers. Feed sources with high percentages of methionine are bloodmeal, fish meal, crab meal, corn gluten meal, and sunflower seed meal (National Research Council, 1994). If fish meal were permitted, there is a lack of supply that does not contain ethoxyquin, a synthetic antioxidant not permitted under the final rules. A limited supply of fish meal preserved with natural tocophorols has gone mostly into the pet food market (Mattocks, 2001). Corn gluten and sunflower seed meal are not currently very available in organic form, and feed formulators and nutritionists have reported difficulty in meeting NRC requirements for methionine based on currently available organic plant protein sources (Mattocks, Morrisson, Simmons, 2001). One feed mill operator feels he can meet even broiler needs with a combination of crab meal (at 75 lbs/ton or 3.75%) and organic corn gluten (Martens, 2001). Crab meal is a by-product of crab processing and not treated with preservatives but has limitations due to salt content. Another certified feed mill produces layer and range broiler rations without synthetic amino acids based only on plant products, including corn, soy, barly, oats, wheat, field peas, and flaxmeal. These products are labeled at a minimum of 0.3% met and 0.6% lysine, but reportedly achieve good results (White 2001, VOG). NRC requirements for amino acids and protein are designed to support maximimum growth and production. The recommended levels for methionine in poultry depend on species, stage, and level of feed consumption. For chickens, recommendations for layers range from 0.25% to 0.38% and for broilers 0.32 - 0.50%. NRC notes that maximum growth and production may not always ensure maximum economic returns when protein prices are high, and that if decreased performance can be tolerated, dietary concentrations of amino acids may be reduced somewhat to maximize economic returns (NRC, 1994). Methionine is known to have a direct effect on egg weight (size) and rate of lay, and is used by some producers to manipulate egg production to meet market needs, such as to increase egg size in younger birds, reduce it in older birds, or produce more eggs in off peak market periods (NRC 1994; Harms 1998; Simmons 2001). A reduction in rate of gain in broilers (longer time to finish) would be an outcome of lower than optimal methionine levels. Unless the diet contained other forms of sulfur containing amino acids (cystine or cysteine), problems with inadequate feathering might be encountered (Simmons, 2001). Temporarily confined poultry can be fed a practical organic corn / soybean ration. Depending on market conditions and on how other parts of the standards evolve, novel organic products can be developed as supplements. Among the potential alternative sources include organic dairy products such as casein (National Research Council, 1982 and 1994). Macroorganisms commonly found in healthy pasture soils cannot be discounted as a source of nutrient cycling in free-range poultry systems. Given the natural feeding habits of poultry and other birds, the use of earthworms is a logical source of protein in chicken feed (Fisher, 1988). Earthworm populations in a pasture depends on a
Appendix A Page A8

number of factors (Curry, 1998). The amino acid content of earthworms will vary depending on species and food source. However, earthworms have been found to accumulate and concentrate methionine found in the ecosystem in proportions greater than for other amino acids (Pokarzhevskii, et al., 1997). As a feed supplement, earthworms have been found to equal or surpass fish meal and meat meal as an animal protein source for poultry (Harwood and Sabine, 1978; Toboga, 1980; Mekada et al., 1979; and Jin-you et al., 1982 all cited in Edwards, 1998).
414 415 416 417 418 419 420 421 422 423 424
426 427 428 429 430 431 432 433 434 435 436 437 438 439 440 441 442 443 444 445 446 447 448 449 450
Earthworms can play a role in moderating nitrogen losses as well. Enzyme treatment of feedstuffs can improve amino acid availability and also reduce nitrogen pollution (Tamminga and Verstegen, 1992), as can changes in stocking density, rotations, and manure handling.
(7) Its compatibility with a system of sustainable agriculture. 425 In 1994 the NOSB recommended that feed and feed supplements be produced organically. When considering the review of feed additive vitamins and minerals, an NOSB statement of principles advised that non-synthetic viamins and mineral sources are preferable when available. The NOSB also advised that a farm plan should reflect attempts to decrease or eliminate use of feed additives when possible (NOSB, 1995). A constraint to optimal production in modern organic systems that are not able to utilize pasture based systems appears to be adequate organic sources of the first limiting amino acid, methionine. The allowance of isolated amino acids facilitates the use of the lowest cost, non-diverse corn-soy ration. It is the basis of conventional confinement animal production systems which may be considered as antithetical to the principals of organic livestock production. The source and method of production of synthetic amino from non-renewable fossil fuels and toxic chemicals is also questionable in compatiblilty with system of sustainable agriculture. The use of synthetic amino acids increases animal production by increased efficiency of protein conversion, which lowers feeding costs and reduces nitrogen content of the waste output. While this is not by itself unsustainable, synthetic amino acids discourage the integration of a whole-systems approach to cycling nutrients, particularly nitrogen, as part of an integrated crop-livestock production system. Allowance of synthetic sources of amino acids may discourage market development of organic plant sources, such as seed meals. Increased efficiency of protein conversion reduces the amount of nitrogen excreted (Summers, 1993; deLange, 1993). The cycling of nutrients from animals is part of an integrated farming system, and the environmental effects of manure management requires looking at the big picture (Archer and Nicholson, 1992). What is viewed as a liability in confinement animal systems—nitrogen production—is seen in cropping systems as a limiting factor resource. Reduction of nitrogen pollution may require improved range or pasture management, and with that either more frequent rotations or lower stocking rates.
TAP Reviewer Discussion2 451 Reviewer 1 [Eastern –Ph.D. Senior Research Chemist, reviewer in organic certification agency] 452
453 454 455 456 457 458 459 460 461 462 463 464
Commercially available amounts of Methionine can only be produced synthetically. All current routes are modification of the Strecker synthesis, and they share the same raw materials: acrolein, methanethiol (methyl mercaptan), along with various sources of ammonia and cyanide (McPherson, 1966; Gerhartz, 1985). The fundamental raw materials are hydrocarbons, sulfur, inorganic salts, and Nitrogen (McPherson, 1966). Methionine (Me) fed to livestock is a synthetic source of non-protein Nitrogen. Being an amino acid, it can be directly utilized in protein synthesis and, in effect, substitutes for protein derived from foodstuff. Me is metabolically linked with cystine and choline and is necessary for producing keratins used in feather growth (NAS Nutrition Req. of Poultry, 1994; Elliot no date). It is also considered the main limiting amino acid in modern poultry diets (NAS Nutrition Req. of Poultry, 1994). Me deficiency has become a problem in recent years due to the increasing use of low cost soybean protein and bird genetic selection for increase broiler growth or egg laying ability. High protein
2 OMRI’s information is enclosed is square brackets in italics. Where a reviewer corrected a technical point (e.g., the word should be “intravenous” rather than “subcutaneous”), these corrections were made in this document and are not listed here in the Reviewer Comments. The rest of the TAP Reviewer’s comments are edited for any identifying comments, redundant statements, and typographical errors. Text removed is identified by ellipses […].Additions to the TAP review text were incorporated into the review. Statements expressed by reviewers are their own and do not reflect the opinions of any other individual or organizations.
Appendix A Page A9

465 466 467 468 469 470 471 472 473 474 475 476 477 478 479 480 481 482 483 484 485 486 487 488 489 490 491 492 493 494 495 496 497 498 499 500 501 502 503 504 505 506 507 508 509 510 511 512 513 514 515 516 517 518 519 520 521
diets are necessary for fast growth but low feed cost are needed in business plans seeking to increase market share for Organic poultry products. In order to address the need for synthetic Me in Organic poultry management, several questions need to be considered: • Is synthetic Me necessary to grow healthy poultry? • Are there food-based protein that can economically provide balanced protein (including Me), maintaining both
bird health and producer economic viability? • Is a management system that relies on a critical synthetic feed additive consistent with the principles of Organic
Agriculture? The increasing need for Me is founded in the simplification of poultry diet to corn+ soybean + minerals that started in the 1950’s (Baker, 1989). Corn is one of the best energy sources of the grains (Wright 1987). However, its protein level is low (~ 8%) and a corn based diet is low in Lysine (Wright 1987). Soybean is high in protein and is an economic source of Lysine. It is low in Me, however, and diets that use soybean to increase protein (for broiler growth or more eggs) can cause Me to become the limiting amino acid (Garcia, Pesti, and Bakalli 99; Waibel et. al. 1999). The low concentration of Me in high-protein corn/soybean feed mixes has lead to wide use of synthetic Methionine supplementation in poultry feed mixes. Methionine is found in many feed mixes (both Organic and traditional) as an individual component and also contained in vitamin/mineral packs. Many poultry rations contain Me in both forms. Both the NAS and the Merck Veterinary Guide (8’ed 1998) set around 0.3 wt. % of total ration, which is higher than available in the average corn/soybean mix. The NAS recommended Me level is set for maximum performance. The report states “The protein and amino acid concentrations prescribed as requirements herein are intended to support maximum growth and production” (NAS Nutrition Req. of Poultry, 1994 p. 10). The NAS report and the studies supporting Me supplementation reviewed primarily use growth rate to determine proper Me levels in the diet (either total weight or percentage of breast meat), (Tsiagbe et. al 1987; Edwards and Baker, 1999; Garcia et al 99, Waibel et al 1999; Degussa Feedback Nov 1995 and March 1996). Reduced growth rate can be a symptom of amino acid deficiency (D’Mello). However, this type of growth retardation is accompanied by other physiological changes that take place to compensate for the deficiency. These changes can be hematologically measured (Torun 1979). In true deficiency, total body nitrogen balance would also go negative (Wintrobe et. al. 1970). The above reports do not present evidence clearly showing that the unsupplemented slow growing birds studied are malnourished. Lower than desired growth (or egg production) can also be due to less than optimal protein utilization in high protein rations. This is an economic consideration, not a health one. True deficiency in sulfur-bearing amino acids can cause improper feathering (Elliot, no date). Elliot notes that Me supplementation can improve feathering. The paper does not give a minimum Me level, or describe how feathering is effected by the interactions of Methionine, Cystine, and Choline. Tsiagbe et. al 1987 b note that the immune response of chicks challenged with an antigen changes with supplemental Me. Me was observed to activate certain parts of the chick’s immune system. The mechanism was unclear and the therapeutic effectiveness of Me supplementation was not studied. Enhancing poultry immune response to infectious diseases could be an important benefit of ration based Me; especially as aid in fighting Newcastle’s Disease. The data seen so far, however, is equivocal. Therefore, this reviewer must conclude that the primary use of crystalline Me in the current petition is to balance corn/soybean rations for maximum feed utilization and poultry productivity. As related in the body of this TAP review, pastured-based poultry can adequately maintain a proper diet (Salatin, 1993). Before the widespread availability of crystalline amino acid supplements, livestock nutritionists recommended mixing different types of food stuffs to achieve a supplementary relationship between the different proteins (Maynard and Loosli, 1962; Hart and Steenbock, 1919). This system used a combination of grains, roughage such as alfalfa, and a source of high quality protein such as gluten meal, whey, milk, or tankage. Hart and Steenbock found that swine fed corn + milk has initial better weight gains and produced less feces that swine fed corn + milk + alfalfa. The absence of roughage, however, led to long term deleterious health effects and shortened life span.
Appendix A Page A10
522 523 524 525 526 527 528 529 530 531 532 533 534 535 536 537 538 539 540 541 542 543 544 545 546 547 548 549 550 551 552 553 554 555 556 557 558 559 560 561 562 563 564 565 566 567 568 569 570 571 572 573 574 575 576 577
Dairy products (whey or powdered milk) contain good quantities of Me. Fresh and powdered organic cow’s and goat are both available. Their availability should increase as more organic processed food products appear on the market. Corn Gluten Feed (CGF) is also available and a good source of Me (crude protein usually 21 %). CGF has intermediate metabolizable energy (ME) and is low in lysine, tryptophane, and Calcium (Wright, 1987). It can successfully substitute for part of other high protein ration components (Wright, 1957). Corn gluten meal is a much better protein source. It is 60% protein, high Me, and is a good source of Me and cystine (Wright 87). It is low in lysine and tryptophane but is complemented by the amino acid balance in soybean. Several other plant-based protein sources are discussed in the main body of this TAP review. All plant-based poultry rations with Me levels of 0.3% are currently on the market and have been shown to produce 4 lb. broilers in eighth weeks (White, 2001). Animal-based protein sources are also available. Animal-based protein is consistent with the specific needs of chickens and turkeys; both being natural omnivores. Crab meal is an excellent balanced protein source that is close to the birds’ natural prey. Crab meal needs to be balanced with other feed ingredients to minimize salt in the diet and to keep the crab meal and mineral supplements within the 5% nonorganic ingredient limit (local certification agency requirements) (Martens, 2001). Rations that supply adequate Me for maximum poultry growth and egg production appear to exist. Some of these diets will be initially more expensive than the corn/soybean + crystalline methionine ration. The production and distribution systems for Organic feed corn and soybeans are established and large scale. Except for crab meal and corn gluten meal that are currently being used in poultry feed, the other soybean substitutes are mostly being sold into other markets. As the poultry market develops for these rations, prices will certainly fall. Some producers have argued that current bird genetics are optimized for corn/soybean rations, and that production would suffer if other protein sources were substituted for part of the soybeans. Producers of pastured ruminates and poultry are facing and solving similar problems. Older breeds of poultry still exist and people such as Tom Shelly of Virginia are actively working to breed back older traits into over-specialized poultry. Companies like Tysons also have active programs of collecting poultry genetics from around the world and this type of information could be used to guide breeding work. The switch from soybean + Me to soybean + other high Me protein source is not too large for current poultry genetics to handle, but if genetics need to be fine-tuned again, stock and breeders are available. Methionine appears to present no human health problem. Crystalline Me is well utilized by poultry (Baker 1989) and risk to humans from poultry products or excretions is minimal (Kleeman et al 1985). Excreted Me also appears to pose no environmental problems. It is rapidly photo-degraded in surface water, and is readily metabolized by bacteria in sediments (Kiene and Visscher, 1987). Several methionine feedstocks, however, present both environmental and human health difficulties. Hydrogen Cyanide is a poisonous, flammable gas that is unstable in the presence of moisture. The low boiling and flash points make Hydrogen Cyanide especially hazardous [25.7 ° C. and -17.8° C. respectively] (Klenk et. al. 1987). Acrolein is a flammable and toxic liquid. It is highly volatile (flash point - 26° C.) and can explosively polymerize if exposed to many contaminants (Ohara et. al. 1987). Synthetic amino acid supplementation can lower nitrogen emissions of poultry excreta by reducing the crude protein (food) in the diet (Ferguson, 1998). Synthetic amino acids are more absorbable than protein bound amino acids and can be balanced to minimize the amount of amount of protein catabolized to correct for a limiting amino acid. Careful control of temperature and humidity can also be used to further reduce nitrogen loss due to metabolic activity to maintain body temperature. Reduction in bird nitrogen emissions has been argued to decrease ventilation energy usage. Less energy used to ventilate poultry houses may be real (no data given). However, is the energy used to product the quantity (feed + synthetic AA + house energy) more or less than that needed to produce ( more feed + house energy)? Each amino acid needs different amounts of energy (in fossil fuel equivalents FFE). For example, the Me feedstock Hydrogen cyanide requires reaction temperatures of 1300° to 1500° C. during production ((Klenk et. al. 1987). The reviewer can not estimate whether savings in ventilating poultry houses is greater than the energy used to make the synthetic amino acids in the feed. A few years ago, the Green plastics industry touted that plastics made from agricultural
Appendix A Page A11

578 579 580 581 582 583 584 585 586 587 588 589 590 591 592 593 594 595 596 597 598 599 600 601 602 603 604 605 606 607 608 609 610 611 612 613 614 615 616
products used less FFE than plastics derived from petrochemicals. Detailed and conservative calculations showed the opposite to be true (Gerngross, 1999). Simple Me supplementation will have no major effect on amount of manure birds produce or on global nitrogen cycling. Another amino acid will become the prime limiting and the food-based protein will be inefficiently utilized. The idea of a synthetic diet, however, puts Me into a larger context. Food utilization is inefficient. Individual organisms in an ecosystem are very poor utilizes of resources. Animals leave many nutrients behind as manure, seed is a small proportion of plants biomass, and large batch microbial fermentation creates so much heat that the organisms would die unless cooled by an outside energy source. Ecosystem (or agro-ecosystem) efficiency can only be seen when the whole system is considered. One organism’s waste is another one’s food. The American Organic Standards principles of Organic Production and Handling state that “Organic agriculture is based on holistic production management systems which promote and enhance agro-ecosystem health, including biodiversity, biological cycles, and soil biological activity. Organic agriculture emphasizes the use of management practices in preference to the use of off-farm inputs, taking into account that regional conditions require locally adapted systems. These goals are met, where possible, through the use of cultural, biological, and mechanical methods, as opposed to using synthetic materials, to fulfill specific functions within the system.” (AOS standards Oct 1999). A synthetic diet is an attempt to isolate a part of an agro-ecosystem and then fine tune this part into efficiency. This process requires external inputs. The use of an amino acid supplement like Me to increase feed utilization efficiency is food substitution. Fundamentally, there are many similarities between amino acid substitution by synthetic Me and nitrogen substitution by feeding synthetic non-protein NPK compounds like Urea (NAS, 1976; Featherston, 1967). Feeding urea to livestock is prohibited (7 CFR Part 250.237.b.4). The evidence presented to this reviewer indicates that synthetic Methionine supplementation is currently used to increase feed utilization. Poultry rations composed of natural food stuffs can give adequate Me levels in both broilers and layers. Methionine should therefor be considered a prohibited synthetic substance. If the NOSB decides to prohibit Methionine poultry supplements, this reviewer would request that a phase-out period be established to allow producers to find different protein sources (to enhance soybeans) without disrupting their own operations or the current markets for the alternative protein sources. I would also request that the petitioners for Me supplements further research the possible immune enhancing effect of Me. If it is efficacious against infectious poultry diseases, I would hope that they would re-petition for that [medical] use. [Conclusion:] Methionine should be prohibited. Suitable high protein feed sources are available. Methionine supplementation is primarily to increase growth and production, not to maintain bird health. Reviewer 2 [Midwest--veterinarian performing product research and development, including organic feed formulation] 617
618 619 620 621 622 623 624 625 626 627 628 629 630 631 632 633 634
[Agrees that the database is accurate, and agrees with the evaluation of OFPA criteria with the following comments.] [Criteria 3 -The potential of such substances for detrimental chemical interactions with other materials used in organic farming systems;] I agree with the criteria evaluation, and add the following: Methionine is widely used in the general poultry ration business. Its rates of inclusion are well understood and unlikely to be misused, misformulated, or cause detrimental interactions or results. [Criteria 5 - The effects of the substance on biological and chemical interactions in the agroecosystem, including the physiological effects of the substance on soil organisms (including the salt index and solubility in the soil), crops and livestock] I agree with the criteria evaluation with the following comments: The requirement of sulfur containing amino acids can also be misjudged due to outdated tables showing the typical nutrient content of feeds. This is especially true for the recent past corresponding to the increase in synthetic sulfur containing amino acids. The Clean Air Act provisions reducing atmospheric sulfur levels and minimal applications of sulfur containing fertilizers lead to less than optimal sulfur supplies needed for plants to make sulfur containing amino acids. [Criteria 6 - The alternatives to using the substance in terms of practices or other available materials]
Appendix A Page A12

635 636 637 638 639 640 641 642 643 644 645 646 647 648 649 650 651 652 653 654 655 656 657 658 659 660 661 662 663 664 665 666 667 668 669 670 671 672 673 674 675 676 677 678 679 680 681 682 683 684 685 686 687 688 689 690 691
I agree with the criteria evaluation with the following comments: Lower than predicted levels of sulfur containing amino acids in plants grown with lower than optimal levels of soil sulfur means that pastured animals may no longer be able to meet their requirements as once thought. Pasturing is recognized as not feasible in many temperate climates on a year around basis. The short life span of broilers and cyclic nature of laying hens means meeting these animals’ nutritional requirement strictly through access to pasture is impossible for some poultry producers. Alternative animal protein sources are readily available in the feed industry. The suitability of these sources for organic production is of question. Much fish, crab, and shrimp meal result from harvesting natural populations of these animals. Are these natural supplies considered organic based on current knowledge of oceanic pollution? Organic aquaculture is not a large enough industry to support the needs of the poultry feed industry, nor does it appear that it will be for quite some time, if ever. The antioxidant additives used on high oil fish meal (menhaden, anchovy, etc.) are also questioned for organic suitability. The decision may come down to ‘the lesser of two evils’. Should synthetic amino acids be allowed or should natural proteins with some questions be allowed? Either way, they should be restricted to those species that specifically need them, more specifically poultry. [Criteria 7 - Its compatibility with a system of sustainable agriculture] I agree with the criteria evaluation with the following comments: Synthetic amino acid use discourages diversity of animal feed sources (e.g. typical corn - soybean diet). [Discussion] The letter [Kringel, 2001] overstates the hardships of ration diversity for poultry rations. Sources such as barley, wheat, and ground alfalfa are used in rations in my area. The alfalfa is only difficult for milling operations to mix. On farm mixers have no problem with it. My experience in poultry rations is that some source of methionine is necessary for acceptable growth, egg production, and health. The use of synthetic methionine appears to be geared toward maximizing production in the majority of cases. The primary reason that most feed companies utilize it is that it allows them to use only corn and soybeans as grain sources in cheaper rations. This means fewer bins, large supplies of cheap grain, and easier blending. Birds will survive with lower than NRC levels of methionine, but they will grow slower, produce less eggs, and have some disease problems such as pecking disorders. Yeast is not a feasible option at this time due to availability. There are also some questions regarding the GM status of grains used in producing several types of yeast products suitable for animal feeding, primarily in the brewers and distillers yeast products. Limiting the synthetic methionine included in rations to 0.1% would help alleviate my concern of limited ration diversity. Philosophically there may be some question. If it is good enough to use 0.1%, why not the full rate? Even so, I am in favor of the 0.1% level maximum as an annotation. Genetics for modern lines of birds does seem to have a bearing on methionine requirement according to some poultry gurus I have talked to in the past. They say it is true of laying hens as well. [Conclusion – Summarize why it should be allowed or prohibited for use in organic systems.] The only valid reason I can find for this material to be allowed is that no good alternatives exist that meet current organic standards. The merits of the material itself would indicate that it should be prohibited. One possible compromise may be to place the material in the restricted use category similar to synthetic minerals and vitamins. Restriction annotations could include “only when alternative sources, such as diverse protein source ingredients or suitable animal proteins (e.g. fish, crab, shrimp, whey, etc.) are not available.” This annotation leaves a big loophole. Feed producers can easily say that no alternatives are available, and who is going to subjectively decide what alternatives are suitable or adequate nutritionally?
Appendix A Page A13
692 693 694 695 696 697 698 699 700 701 702 703 704 705 706 707 708 709 710 711 712 713 714 715 716 717 718 719 720 721 722 723 724 725 726
A second alternative is to list a synthetic methionine use level restriction of 0.1% of the ration. This can be avoided by feed manufacturers simply by saying that a grain blend is to be used with some other feed source, such as pasture. Maybe a better restriction is 0.1% maximum in any feed or blend of feed used for poultry. Another alternative is to table the decision on synthetic amino acids in general and immediately evaluate the aquatic sources of natural sulfur containing amino acids. A decision would have to be made as to what may be acceptable for these sources and whether these sources are more acceptable than the synthetic amino acids or less acceptable. One of these two materials appears to be necessary to raise poultry under the conditions encountered by many producers. [Additional Comments] My personal recommendation is that the natural aquatic animal sources are the better method for obtaining sulfur containing amino acids. I think that natural populations of aquatic life should be acceptable to the organic feed industry. Farm raised aquaculture should meet organic production standards for inclusion into organic rations. After reading all the comments from various sources included in the information packet, I think the only real issue for aquatic sources is that of the antioxidants. One issue is that ethoxyquin is sometimes not listed on the label of some fish meal sources, so ration formulators may not even know that it is in the fish meal. Cost of ingredients should never be a factor in determining their suitability for organic production. The sources are quite available in all locations. Salt content limiting crab meal inclusion rates can be worked around if the meal is combined in rations containing diverse ground feed sources – corn, soybean, wheat, barley, oat, sunflower, pea, alfalfa or clover, etc. – even for birds that do not have access to pasture. A 0.1% maximum inclusion rate of synthetic methionine would also help with the limitations caused by the salt content of crab meal. I am in favor of allowing these aquatic sources, even if only for poultry rations, instead of synthetic amino acids. The last issue I will raise, is the effect of this material’s status on chelated trace mineral’s possible status in organic production systems. Commercially available chelated trace minerals are primarily bound to proteins, peptides or individual amino acids. [Recommendation Advised to the NOSB:] 727
728 729 730 731 732 733
[(a) The material is:] Synthetic [(b) For Crops and Livestock, the substance should be:] Added to the National List. [(c) Suggested Annotation, including justification:] Enzyme digested natural protein sources preferred, source must be non GM. For poultry rations only. Only when alternatives are not available including ration diversity and acceptable animal and plant sources. Not to exceed 0.1% by weight in any feed source directly fed to poultry. Reviewer 3 [Western-Midwestern veterinarian providing technical services to ranchers] 734
735 736 737 738 739 740 741 742 743 744 745 746 747
Methionine is an amino acid, a necessary component of certain proteins needed by livestock. L-methionine is a synthetic amino acid, produced by various chemical methods. The bottom line is that synthetic amino acids are prohibited in the national rule. They are also prohibited internationally. Feeding of synthetic amino acids is neither compatible with a system of sustainable agriculture nor does it follow the principles of organic agriculture. Both of these systems are based on a premise of access to the natural environment, with less reliance on off-farm inputs and better management of the ecosystem. This premise precludes the use of synthetics generally. According to Dr. Jason Emmert, poultry nutrition professor with the University of Arkansas, poultry producers are able to supply methionine in natural feedstuffs and pasture access, without the need for supplemental methionine. Pasture access will provide fresh grass and animal protein in the form of insects and earthworms. Grain rations will have to have additional soybean meal added, bringing the protein level to 23-24% crude protein. These diets can be
Appendix A Page A14

748 749 750 751 752 753 754 755 756 757 758 759 760 761 762 763 764 765 766 767 768 769 770 771 772 773 774 775 776 777 778
779 780 781 782 783 784 785 786 787 788 789 790 791 792 793 794 795 796
provided to poultry of all ages. Thus, many of the points regarding level of methionine recommended or age of bird needing additional supplementation are irrelevant to this discussion. One issue brought up for the need to supply synthetic methionine is the nitrogen level of litter. Nitrogen is often the limiting factor in farming systems, especially organic farms. The availability of organic litter could be another product of organic poultry operations, adding diversity and income to the farm. It could also help the farm to diversify by using the litter as fertilizer for pasture or other crops. In rereading the article about immunological stress, methionine deficient diets actually had less of a reduction in growth rate and feed efficiency in pathogen stressed chicks than methionine sufficient diets. [...] Too much of this research is done in strict confinement settings, with maximum growth rate in minimum time. Trying to apply research done in this production system to a sustainable (access to pasture, the outdoors, more natural feedstuffs, etc.) system can only be done to a certain extent. There is the concern that the poultry genetics are limited. This concern is valid, but like many of the other concerns listed, such as the need for more organic sources of various feedstuffs, the new organic rule will give the opportunity for supporting businesses to be formed to supply the needed genetics, feeds, and other allowed products. The supporting documentation and research for this TAP review indicates the great need for research investigating the unique management needs of organic farming systems. The articles referenced are about research geared for the confinement poultry industry whose goal is to produce maximum sellable product for the least amount of money in the least amount of time with little regard to the sustainability of this production system. I also feel that if we make an exception to the no synthetic amino acids ruling, we will hurt the public image of organic farming (quicker than it may happen anyway) and we also open the door to other exceptions. I feel it important to retain the “no” ruling now. It can be changed in the future if further research aimed at organic farms and their management strategies shows that adding a small amount of synthetics does indeed improve the life, health, and overall production of the organic chicken. In summary, the references and accompanying materials cover the points for continuing to prohibit synthetic methionine or any other amino acid. Methionine can be supplied through natural products, in quantities sufficient to meet birds’ nutrient requirements, at any age. This eliminates any necessity for synthetic methionine.
Conclusion All of the reviewers agree that the forms of methionine unders consideration, DL methionine, L methionine, and the hydroxy anlaog described in this review are synthetic. Two of the three reviewers find their use to be incompatible with organic systems and recommend prohibition. The third finds that use should be allowed only when natural sources or dietary sources are unavailable, and feels they should be allowed due to the lack of alternatives that meet organic standards. All reviewers agree that an allowance for synthetic amino acid use discourages diversity of animal feed sources, and that natural intact protein sources are more compatible with organic principles. By substituting a non-renewable synthetic input for organically grown crops as a source for nutrition, synthetic amino acids would thus reduce the amount of acreage, and the market created for organic feed and forage crops. Farmers who seek organic certification have less of an incentive to provide clean, fresh pasture as a primary source of animal nutrition if they have available synthetic amino acids. There is also some confusion in the livestock industry as to the organic status of natural alternatives, such as yeast, casein, and fish or crab meals. These alternatives are more in keeping with the NOSB recommendations for natural feed supplements than those from synthetic or potential GMO sources. A requirement for natural, non-GMO sources of methionine, and a clarification of the status of some of these alternatives will stimulate market development in organic and approved feedstuffs.
References 797 798 799 800 801
Note: * = included in packet compiled for NOSB Aiello, S.E. 1998. Merck Veterinary Manual. Eighth Edition. Whitehouse Station, NJ: Merck & Co.
Appendix A Page A15

802 803 804 805 806 807 808 809 810 811 812 813 814 815 816 817 818 819 820 821 822 823 824 825 826 827 828 829 830 831 832 833 834 835 836 837 838 839 840 841 842 843 844 845 846 847 848 849 850 851 852 853 854 855 856 857 858 859 860 861 862 863 864 865
Araki, K. and T. Ozeki. 1991. Amino acids (survey). Kirk-Othmer Encyclopedia of Chemical Technology 9: 504-571. Archer, J.R. and R.J. Nicholson. 1992. Liquid wastes from farm animal enterprises, in C. Phillips and D. Piggins, Farm Animals and
the Environment: 325-343. Oxon: CAB International. AAFCO. 2001. Association of American Feed Control Officials, Inc. Official Publication 2001. *Ambrosen,T., V.E. Petersen. 1997. The influence of protein level in the diet on cannibalism and quality of plumage of layers.
Poultry Scienc. 76:4, 559-563. * Baker, D.H. 1989. Amino acid nutrition of pigs and poultry, in W. Haresign and D.J.A. Cole (eds.), Recent Advances in Animal
Nutrition, 1989: 249-259. London: Butterworths. *Baker, D. H., H.M Edwards, C.S. Strunk, J. L. Emmert, C.M. Peter, I. Mavromichalis, T.M. Parr. 1999. Single versus multiple
deficiencies of methinnine, zinc riboflavin, vitamin B-6 and choline elicit surprising growth response in young chicks. Journal of Nutrition 129:12, 2239-2245.
* Boda, K. . Ed. 1990 Nonconventional Feedstuffs in the Nutrition of Farm Animals. Institute of Physiology of Farm Animals. Ivanka pri
Dunaji, Czechoslovakia. Elsevier, Amsterdam. p. 171. * Buttery, P.J. and J.P.F. D’Mello. 1994. Amino Acid Metabolism in Farm Animals: An Overview, in J.P.F. D’Mello (ed.) Amino
Acids in Farm Animal Nutrition: 1-10. Wallingford, UK: CAB International. Canadian General Standards Board. 1999. Organic Agriculture. Ottawa: Canadian General Standards Board. Cheeke, P. 1999. Applied Animal Nutrition, Feeds and Feeding 2nd ed. Prentice Hall, Saddle River NJ. * Cino D, M. F . Diaz, E. Lon-Wo, A. Gonzalez. 1999. Economical evaluation of raw legume grain meals and their potential use
in poultry feeding. Cuban Journal of Agricultural Science. 33:2, 121-127 (abstract). * Crawford, R.D. 1990. Poultry Breeding and Genetics. Elsevier. Pp. 631-633. Curry, J.P. 1998. The use of earthworms in the breakdown and management of organic wastes, in C.A. Edwards (ed.) Earthworm
Ecology: 327-376. Boca Raton, FL: CRC Press. * Degussa. 1995. Reducing the protein content of layer diets. Feed Back Special 1995:1-9. * Degussa. 1996. Ideal protein in broilers: A new concept to optimize amino acid nutrition. Feedback Special 1996:1-12. Degussa Corporation. No date. Amino Acids for Animal Nutrition. Frankfurt, West Germany: Degussa Corporation. de Lange, C.F.M. 1993. Formulation of diets to minimize the contribution of livestock to environmental pollution, in Proceedings of
the Arkansas Nutrition Conference: 9-21. Fayetteville: University of Arkansas. * D’Mello, J.P.F. 1994. Amino Acid Imbalances, Antagonisms, and Toxicities, in .P.F. D’Mello (ed.) Amino Acids in Farm Animal
Nutrition: 63-97. Wallingford, UK: CAB International. Edwards, C.A. 1998. The use of earthworms in the breakdown and management of organic wastes, in C.A. Edwards (ed.)
Earthworm Ecology: 327-376. Boca Raton, FL: CRC Press. *Edwards, Hordy M. III, D.H. Baker. 1999. Maintenance Sulfur Amino Acid Requirements of Young Chicks and Efficiency of
Their Use for Accretion of Whole-Body Sulfur Amino Acids and Protein. Poultry Science 78:1418-1423. * Elliot, M.A. (no date). Factors influencing feathering in commercial pullets and layers. Degussa Corp, Kennesaw GA. *Emmert , J.L, H.M. Edwards, D.H. Baker. 2000. Protein and body weight accretion of chicks on diets with widely varying
content s of soyabean meal supplemented or unsupplemented with its limiting amino acids. British Poultry Science 41: 2, 204, 213.
Environmental Protection Agency. 1987. EPA Chemical Profiles: Methyl Mercaptan. Washington: US EPA. Erblersdorer, H. 1973. Views on poultry requirements for amino acids and new sources of these nutrients suitable for use in the
feeding of poultry, in, Food and Agriculture Organization. 1973. Symposium on New Developments in the Provision of Amino Acids in the Diets of Pigs and Poultry: 114-177. New York: United Nations.
Appendix A Page A16

866 867 868 869 870 871 872 873 874 875 876 877 878 879 880 881 882 883 884 885 886
European Union. 1999. Council Regulation 1804/1999 Supplementing Regulation 2092/91 on Organic Production of
agriicultural products and indications referring thereto on agricultural products and foodstuffs to include livestock production. Official Journal of the European Communities 1804/1999.
Featherston, W. R., 1967, Utilization of Urea and other Sources of Non-protein Nitrogen by the Chicken, in M. H. Briggs, ed.
Urea as a Protein Supplement, Pergamon Press, NY, pp. 445 - 453. Ferguson, N.S., R.S. Gates, J.L. Taraba, A.H. Cantor, A. J. Pescatore, M. J. Ford, D.J. Burnham. 1998. The effect of dietary
protein on growth, ammonia concentration, and litter composition in broilers. Poultry Sci. 1998 72:1481-1487. Fisher, C. 1988. The nutritional value of earthworm meal for poultry, in C.A. Edwards and E.F. Neuhauser (eds.) Earthworms in
Waste and Environmental Management: 181-192. The Hague, NL: SPB Academic Publishing, bv. Fong, C.V., G.R. Goldgraben, J. Konz, P. Walker, and N.S. Zank. 1981. Condensation process for DL-Methionine production, in
A.S. Goldgraben et al. (eds) Organic Chemicals Manufacturing Hazards: 115-194. Ann Arbor, MI: Ann Arbor Science Publishers. Geiger; F., B. Halsberghe, H.J. Hasselbach, K. Hentschel, K. Huthmacher, M. Korfer, S.P. Mannsfeld, H. Tanner, F. Theissen, J.
Vanrobaeys, and K. Willigerodt (Assigned to Degussa AG). 1998. Process for the preparation of D,L-methionine or the salt thereof . US Patent *5,770,769.
887 888
Gerhartz, W. ed. 1985 Ullmann’s Encyclopedia of Industrial Chem. 5’th ed. V. A1. VCH Pub, Deerfield FL.
889 890 891 892 893 894 895 896 897 898 899 900 901
Gerngross, T. U., 1999, Can Biotechnology Move us Toward a Sustainable Society?, Nature Biotech. , 17, p. 541 - 544. Gosselin, R.E. et al. 1984. Clinical Toxicology of Commercial Products, 5th edition. Baltimore: Williams & Wilkins. *Hadorn, R. A. Gloor, H. Wiedmer. 2000 Effect of the exclusion of synthetic amino acids and potentially GMO-protein sources
in plant feeds on laying hens. Archiv fur Geflugelkinde. 64:2, 75-81. [German, abstract in English] * Harms, R.H., G. B. Russell. 1998 . Adding methinionine and lysine to broiler breeder diets to lower feed costs. Journal of
Applied Poultry Research. 1998. 7:2, 202-218. * Harms, R.H, G. B. Russell, H. Harlow, F.J. Ivey. 1998. The influence of methionine on commercial laying hens. J. App Poultry
Res. 7:1, 45-52.
902 903 904 905 906 907 908 909 910 911 912 913 914 915 916 917 918 919 920 921 922 923 924 925 926 927 928 929
Hart, E. B., and Steenbock, H., 1919, Maintenance and Production Value of Some Protein Mixtures, J. Biol. Chem. 38, pp. 267 - 285.
Harwood, M. and J.R. Sabine. 1978. The nutritive value of worm meal, in Proceedings of the 1st Australasian Poultry Stockfeed
Convention: 164-171. Sydney. International Federation of Organic Agriculture Movements. 2000. Basic Standards for Organic Production and Processing. Tholey-
Theley, Germany: International Federation of Organic Agriculture Movements. Joint FAO/WHO Standards Programme. 1999. Guidelines for the Production, Processing, Labelling and Marketing of Organic Processed
Foods.CAC/GL 32-1999. Rome, Italy: FAO/WHO. Jin-You, X., Z. Xian-Kuan, and P. Zhi-ren. 1982. Experimental research on the substitution of earthworm for fish meal in feeding
broilers. J. South China Normal College 1: 88-94. Kiene, R. P., and Visscher, P. T., 1987, Production and Fate of Methylated Sulfur Compounds from Methionine and
Dimethylsulfoniopropionate in Anoxic Salt Marsh Sediments, Appl. Envir. Mocrobiol:53, pp.2426 - 2434. Killmann, A., 1985 Ullmann’s Encyclopedia of Industrial Chem. 5’th ed. V. A2 VCH Pub, Deerfield FL. p. 85. Klenk, H., Griffiths, A., Huthmacher, K., Itzel, H., Knorre, H., Voigt, C., Weiberg, O., Ullmann’s Encyclopedia of Industrial Chem.
5’th ed. V. A8 VCH Pub, Deerfield FL. p. 159 - 165. * Klasing, K.C., D.M Barnes. 1988. Decreased amino acid requirement of growing chicks due to immunological stress J. Nutr.
1988 ; 118:1158-1164. * Krengel, D. 2001. Willowbrook Feeds Response to initial NOSB TAP review. Jan. 12, 2001.
Appendix A Page A17

930 931 932 933 934 935 936 937 938 939 940 941 942 943 944 945 946 947 948 949 950 951 952 953 954 955 956 957 958 959 960 961 962 963 964 965 966 967 968 969 970 971 972 973 974 975 976 977 978 979 980 981 982 983 984 985 986 987 988 989 990
La Flamme, Jesse. 2001. North Country Farms, NH. pers communication. *Leeson, S., J.D.Summers. 1991. Commercial Poultry Productioon 2nd Ed. Guelph Ontario. University Books. P 58-60. Lewis, A. J. 1995. Bioavailability of D-amino acids and DL-Hydroxy-methionine, in n C.B. Ammerman, D.H. Baker, and A.J.
Lewis, Bioavailability of Nutrients for Animals: 67-81. San Diego: Academic Press. Lewis, A. J. and H.S. Bayley. 1995. Amino acid bioavailability, in C.B. Ammerman, D.H. Baker, and A.J. Lewis, Bioavailability of
Nutrients for Animals: 35-65. San Diego: Academic Press. Lewis L.D., M.L. Morris M.L. and M.S. Hand. 1987. Small Animal Clinical Nutrition (3rd ed). Topeka, KS: Mark Morris Associates. *Lovisolo, R. 2001. Electronic mail communication. Maede Y, et al. 1985. Methionine induced hemolytic anemia with methemoglobinemia and Heinz body formation in erythrocytes
in cats. J. Japan Vet. Med. Assoc. 38: 568-571. * Martens, Klaas. 2001. Electronic mail communication, subject: synthetic amino acids, Feb.08 2001. Maynard, L. A., and Loosli, J. K., 1962, Animal Nutrition, McGraw-Hill, NY, 533 p. Mattocks, Jeff. 2001. Fertrell, Inc. pers. communication. McElroy, B. 2001. CCOF, presentation to Eco-Farm Conference, Jan. 27 2001, “Factory Farm Manure.” McPherson, T, A., 1966, Production of Lysine and Methionine, in Altxchul, A. M. ed. World Protein Resources, Advances in
Chemistry V. 57, Amer. Chem. Soc., Washington , D.C., 285 p. Mekada, H., N. Hayashi, H. Yokota, and J. Olcomura. 1979. Performance of growing and laying chickens fed diets containing
earthworms. J. Poultry Sci. 16: 293-297. Midwest Research Institute. 1993. Preliminary Data Search Report For Locating And Estimating Air Toxic Emissions From
Sources Of Cyanide Compounds. Washington: US EPA. Morrison, Frank B. 1951. Feeds and Feeding. Ithaca, NY: Morrison Publishing Co. Morrisson, L. 2001. Morrison Feeds, Vt. pers. communication. Morse, D. (1993?). Dietary manipulation of nutrients to prevent environmental contamination, in(?) Proceedings of the Arkansas
Nutrition Conference: 166-174. Fayetteville: University of Arkansas. (submitted by petitioner--don't have complete cite). Mosby. 1997. Mosby's Complete Drug Reference, (7th Ed). 1997. New York: Mosby Publishing. National Institute for Environmental Health Sciences (NIEHS). 1999a. National Toxicology Program Profile: Acrolein.
http://ntp-server.niehs.nih.gov/. National Institute for Environmental Health Sciences (NIEHS). 1999b. National Toxicology Program Profile: L-Methionine
http://ntp-server.niehs.nih.gov/. National Academy of Science, 1976, Urea and Other Nonprotein Nitrogen Compounds in Animal Nutrition, NAS Press, Washington D.
C., 120 p. *Neto,M., G Pesti, G. M. Bakalli, R. I. 2000 Influence of dietary protein level on the broiler chicken’s response to methionine
and betaine supplements. Poultry Sci. 79: 10, 1478-1484. * North, M.O.. and D. D. Bell. 1990. Commercial Chicken Production Manual, 4th ed. Van Nostrand Reinhold, NY. NOSB, Oct. 1995. Final Recommendation Addendum No. 18. In Sligh, Toward Organic Integrity, p. 168. * NRC. National Research Council. 1994. Nutrient Requirements of Poultry. 9th Ed. Washington, DC: National Academy Press.
991 992 993
Ohara, T., Sato, T. and Shimizu, N., Acrolein and Methacrolein, in Ullmann’s Encyclopedia of Industrial Chem. 5’th ed. V. A1 VCH Pub. Deerfield FL. p. 149 - 155.
Appendix A Page A18

994 995 996 997 998 999
1000 1001 1002 1003 1004 1005 1006 1007 1008 1009 1010 1011 1012 1013 1014 1015 1016 1017 1018 1019 1020 1021 1022 1023 1024 1025 1026 1027 1028 1029 1030 1031 1032 1033 1034 1035 1036 1037 1038 1039 1040 1041 1042 1043 1044 1045 1046 1047 1048 1049 1050 1051 1052 1053 1054 1055 1056
* Pack, M. 1995. Excess Protein can Deptress Amino Acid Utilization. Feed Mix Vol. 3: 6, 24 -25. Pond, W.G., D.C. Church, and K.R. Pond. 1995. Basic Animal Nutrition and Feeding. New York: John Wiley and Sons. * Pokarzhevskii, A.D., D.P. Zaboyev, G.N. Ganin, and S.A. Gordienko. 1997. Amino acids in earthworms: Are earthworms
ecosystemivorous? Soil Biol. Biochem. 29: 559-567. Regina, M., V. Pekka Korhonen, T.K. Smith, L. Alakuijala, and T.O. Eloranta. 1993. Methionine toxicity in the rat in relation to
hepatic accumulation of S-adenosylmethionine: Prevention by dietary stimulation of the hepatic transulfuration pathway. Arch. Biochem. Biophys. 300: 598-607.
Reynolds, JEF (ed.).1996. Martindale: The Extra Pharmacopeia, 31st edition. London: Royal Pharmaceutical Society. * Sainsbury, D. 2000. Poultry Health and Management 4th ed. includes a chapter “Organic Poultry Production.” Blackwell
Science, Cambridge England. * Salatin, J. 1993. Pastured Poultry Profits. Polyface, Inc. Swope,VA. Sax, N.I. 1984. Dangerous properties of industrial materials. 6th ed. New York: Van Nostrand Reinhold. * Scherer C. S., and D. H. Baker. 2000. Excess Dietary Methionine Markedly Increases the Vitamin B-6 Requirement of
Young Chicks. J. of Nutr. Sci. 130: 3055-3058. *Schmid, Otto. 2001. Comments of IFOAM to the use/exclusion of amino acids in feeding. IFOAM Head Office, c/o Oekozentrum
Imsbach, D-66636 Tholey-Theley, Germany. * Sebastian S. , S.P. Touchburn,E.R. Chavez, P.C. Lague. 1997 Apparent digestibility of protein and amino acids in broiler
chickens fed a corn – soybean diet supplemented with microbial phytase. Poultry Sci. 76:12, 1760-1769. Simmons, Robert. 2001. X-tra Factors, Inc. Lancaster PA. pers. communication. Sloan, D.R., R.H. Harms, D. Barnard, and R. Nordtedt. 1995. Effect of diet on feces composition and the implications on
environmental quality. J. Appl. Poultry Res. 4: 379-383. Slominski, B.A., J. Simbaya, L.D. Campbell, G. Rakow, and W. Guenter. 1999. Nutritive value for broilers of meals derived from
newly developed varieties of yellow seeded canola. Animal Feed Science and Technology 78: 249-262. Smith, P. and C. Daniel. 1982. The Chicken Book. San Francisco: North Point Press. Summers, J.D. 1993. Reducing nitrogen excretion of the laying hen by feeding lower crude protein diets. Poultry Sci. 72: 1473-1478. Summers, J.D. 1995. Canola meal and acid-base balance. Animal Feed Sci. and Tech. 53: 109-115. *Swain, B.K., T. S. Johri. 2000. Effect of supplemental methionine, choline and their combinations on the performance and
immune response of broilers. British Poultry Science. 200. 41:1, 83-88. Tamminga, S. 1992. Gaseious pollutants produced by farm animal enterprises, in in C. Phillips and D. Piggins, Farm Animals and
the Environment: 345-357. Oxon: CAB International. *Tamminga, S. and M.W.A. Verstegen. 1992. Implications of Nutrition of Animals on Environmental Pollution, in P.C.
Garnsworthy, W. Haresign and D.J.A. Cole (eds.), Recent Advances in Animal Nutrition, 1992: 113-130. London: Butterworths. Tamminga, S. 1992. Gaseious pollutants produced by farm animal enterprises, in in C. Phillips and D. Piggins, Farm Animals and
the Environment: 345-357. Oxon: CAB International. Titus, H.W. 1942. Nutritional diseases of poultry. Keeping Livestock Healthy--1942 Yearbook of Agriculture. Washington: US
Department of Agriculture. Toboga, L. 1980. the nutritional value of earthworms for chickens. British Poultry Science 21: 405-410. Torun, B. 1979, Nutritional Quality of Soybean Proetin Isolates: studies in Children of Preschool Age, in Wilcke, H., Hopkins, D.,
Waggle, D., ed., Soy Protein and Human Nutrition, Academic Press, NY, 406 p.
Appendix A Page A19

TAP Review Methionine Livestock
May 21, 2001 Page 20 of 21
* Tsiagbe V.K., M. E. Cook, A. E. Harper, and M.L. Sunde. 1987. Enhanced Immune Responses in Broiler Chicks Fed Methionine Supplemented Diets. Poutry Sci. 66:1147-1154.
1057 1058 1059 1060 1061 1062 1063 1064 1065 1066 1067 1068 1069 1070 1071 1072 1073
*U. S. Patent Office 1956. Number 2,745,745. Poultry Feed. Assigned to Monsanto Chemical Co., St. Louis MO May 15 1956. * Vermont Organic Grain. 2001 Labels for poultry feed products. Waibel, P.E., C.W. Carlson, J.A. Brannon, and S.L. Noll. 1998. Use of alternative protein sources on a true available amino acid
basis for growing turkeys. J. Appl. Poultry Res. 7: 1-8 * Waibel, P.E., C.W. Carlson, J.A. Brannon, and S.L. Noll. 1998. Use of alternative protein sources on a true available amino acid
basis for growing turkeys. J. Appl. Poultry Res. 7: 1-8 * Waibel P.E., C. W. Carlson, J.A. Brannon, S.L. Noll. 2000. Limiting amino acids after methionine and lysine with growing
turkeys fed low protein diets. Poultry Science 79(9)1290-1298. Wintrobe, M., Thorn, G., Adams, R., Bennet, I., Braunwals, E., Isselbacher,.K., and Petersdorf., R., ed. Harrison’s Principles of
Internal Medicine 6’th ed. McGraw Hill, NY. 2016 p. 1074 1075 1076 1077 1078 1079 1080 1081 1082 1083 1084 1085 1086 1087 1088 1089 1090
Wright, K. N., 1957, Whats ahead for Corn Gluten Feed? Feed Merchant, May, pp. 64- 76. Wright, K. N., 1987, Nutritional Properties and Feeding Value of Corn and its By-products, in Watson, S. A., and Ramstad, P. E.
ed, Corn: Chemistry and Technology, Amer. Assoc. Cereal Chemists, St. Paul MN, 605 p. White, E. 2001 Personal communication. Vermont Organic Grain, Bethel VT. * Zanella, I. N.K. Sakomura, F.G. Silversides, A Fiquerido, M. Pack. 1999. Effect of enzyme supplementation of broiler diets
based on corn and soybeans. Poultry Sci. 1999. 78:4, 561-568. This TAP Review was completed pursuant to United States Department of Agriculture Purchase Order 40-6395-0.
Appendix A Page A20

Hazardous Substances Data Bank – L-Methionine
1
L)-Methionine
CASRN: 63-68-3
Environmental Fate/Exposure Summary : (L)-Methionine's production and use as a nutritional supplement in animal feeds may result in
its release to the environment through various waste streams. (L)-Methionine is formed in
natural waters through metabolism of naturally occurring proteins and is a naturally occurring
amino acid, being present in foods such as maize, rice, wheat, potato, soybeans, lettuce, apples,
oranges, beef, fish, milk, cheese and eggs. If released to air, an estimated vapor pressure of
8.1X10⁻⁸ mm Hg at 25 deg C indicates (L)-methionine will exist in both the vapor and
particulate phases in the atmosphere. Vapor-phase (L)-methionine will be degraded in the
atmosphere by reaction with photochemically-produced hydroxyl radicals; the half-life for this
reaction in air is estimated to be 7.5 hours. Particulate-phase (L)-methionine will be removed
from the atmosphere by wet or dry deposition. (L)-Methionine does not contain chromophores
that absorb at wavelengths >290 nm and therefore is not expected to be susceptible to direct
photolysis by sunlight. If released to soil, (L)-methionine is expected to have very high mobility
based upon an estimated Koc of 8. The pKa values of (L)-methionine are 2.28 and 9.21, which
indicate that this compound will exist as a zwitterion which may affect its adsorption to soils and
sediments. Volatilization from moist soil is not expected because ions do not volatilize. (L)-
Methionine may not volatilize from dry soil surfaces based upon its vapor pressure. Using a
laboratory activated sludge system, (L)-methionine exhibited an 80% theoretical BOD reduction
in 16 days, producing 3-mercaptopropionate, methanethiol and dimethylsulfide; this suggests
that biodegradation may be an important environmental fate process. If released into water, (L)-
methionine is not expected to adsorb to suspended solids and sediment based upon the estimated
Koc. The pKa values of 2.28 and 9.21 indicate (L)-methionine will exist as a zwitterion at pH
values of 5 to 9 and therefore volatilization from water surfaces is not expected to be an
important fate process. An estimated BCF of 3 suggests the potential for bioconcentration in
aquatic organisms is low. Hydrolysis is not expected to be an important environmental fate
process since this compound lacks functional groups that hydrolyze under environmental
conditions. (L)-Methionine has been shown to degrade in sunlit natural water through photo-
sensitized oxidation involving singlet oxygen. Occupational exposure to (L)-methionine may
occur through inhalation and dermal contact with this compound at workplaces where (L)-
methionine is produced or used. Monitoring data indicate that the general population may be
exposed to (L)-methionine via ingestion of food. (SRC) **PEER REVIEWED**
Appendix B Page B1

Hazardous Substances Data Bank – L-Methionine
2
Probable Routes of Human Exposure : NIOSH (NOES Survey 1981-1983) has statistically estimated that 28,250 workers (17,038 of
these were female) were potentially exposed to (L)-methionine in the US(1). Occupational
exposure to (L)-methionine may occur through inhalation and dermal contact with this
compound at workplaces where (L)-methionine is produced or used. Monitoring and use data
indicate that the general population may be exposed to (L)-methionine via ingestion of food or
other consumer products containing (L)-methionine(SRC). [(1) NIOSH; NOES. National Occupational Exposure Survey conducted from 1981-
1983. Estimated numbers of employees potentially exposed to specific agents
by 2-digit standard industrial classification (SIC). Available from, as of
Feb 19, 2010: http://www.cdc.gov/noes/ **PEER REVIEWED**
Non-Human Toxicity Excerpts : /ALTERNATIVE and IN VITRO TESTS/ L-methionine (Met) is hepatotoxic at high
concentrations. Because Met toxicity in freshly isolated mouse hepatocytes is gender-dependent,
the goal of this study was to assess the roles of Met accumulation and metabolism in the
increased sensitivity of male hepatocytes to Met toxicity compared with female hepatocytes.
Male hepatocytes incubated with Met (30 mM) at 37 degrees C exhibited higher levels of
intracellular Met at 0.5, 1.0, and 1.5 h, respectively, compared to female hepatocytes.
Conversely, female hepatocytes had higher levels of S-adenosyl-L-methionine compared to
male hepatocytes. Female hepatocytes also exhibited higher L-methionine-L-sulfoxide levels
relative to control hepatocytes, whereas the increases in L-methionine-D-sulfoxide (Met-D-O)
levels were similar in hepatocytes of both genders. Addition of aminooxyacetic acid (AOAA), an
inhibitor of Met transamination, significantly increased Met levels at 1.5 h and increased Met-d-
O levels at 1.0 and 1.5 h only in Met-exposed male hepatocytes. No gender differences in
cytosolic Met transamination activity by glutamine transaminase K were detected. However,
female mouse liver cytosol exhibited higher methionine-dl-sulfoxide (MetO) reductase activity
than male mouse liver cytosol at low (0.25 and 0.5 mM) MetO concentrations. Collectively,
these results suggest that increased cellular Met accumulation, decreased Met transmethylation,
and increased Met and MetO transamination in male mouse hepatocytes may be contributing to
the higher sensitivity of the male mouse hepatocytes to Met toxicity in comparison with female
mouse hepatocytes. [Dever JT et al; Toxicol Appl Pharmacol 236 (3): 358-65 (2009). Available
from, as of March 17, 2010:
http://www.ncbi.nlm.nih.gov/entrez/query.fcgi?cmd=Retrieve&db=pubmed&dopt=Abs
tract&list_uids=19236888 **PEER REVIEWED**
Environmental Fate : TERRESTRIAL FATE: Based on a classification scheme(1), an estimated Koc value of 8(SRC),
determined from a log Kow of -1.87(2) and a regression-derived equation(3), indicates that (L)-
methionine is expected to have very high mobility in soil(SRC). The pKa values of (L)-
methionine are 2.28 and 9.21(4), indicate that this compound will exist as a zwitterion which
may affect its adsorption to soils and sediments(SRC). Volatilization from moist soil is not
expected because ions do not volatilize(SRC). (L)-Methionine is not expected to volatilize from
dry soil surfaces(SRC) based upon an estimated vapor pressure of 8.1X10⁻⁸ mm Hg at 25 deg
Appendix B Page B2

Hazardous Substances Data Bank – L-Methionine
3
C(SRC), determined from a fragment constant method(5). Using a laboratory activated sludge
system, (L)-methionine exhibited an 80% theoretical BOD reduction in 16 days, producing 3-
mercaptopropionate, methanethiol and dimethylsulfide(6); this suggests that biodegradation may
be an important environmental fate process in soil(SRC). [(1) Swann RL et al; Res Rev 85: 17-28 (1983) (2) Hansch C et al; Exploring
QSAR. Hydrophobic, Electronic, and Steric Constants. ACS Prof Ref Book.
Heller SR, consult. ed., Washington, DC: Amer Chem Soc p. 15 (1995) (3) US
EPA; Estimation Program Interface (EPI) Suite. Ver. 4.0. Jan, 2009. Available
from http://www.epa.gov/oppt/exposure/pubs/episuitedl.htm as of Feb 19, 2010.
(4) Drauz K et al; Ullmann's Encyclopedia of Industrial Chemistry. 7th ed.
(2008). New York, NY: John Wiley & Sons; Amino Acids. Online Posting Date:
Apr 15, 2007. (5) Lyman WJ; p. 31 in Environmental Exposure From Chemicals
Vol I, Neely WB, Blau GE, eds, Boca Raton, FL: CRC Press (1985) (6)
Engelbrecht RS, McKinney RE; Sew Indust Wastes 29: 1350-62 (1957)] **PEER
REVIEWED**
Environmental Biodegradation : ANAEROBIC: The biotransformation of (L)-methionine in anoxic sediment slurries was found
to produce 3-mercaptopropionate(1). In salt marsh sediment slurries, microbial metabolism of
(L)-methionine yielded methanethiol as the major volatile organosulfur product, with the
formation of lesser amounts of dimethylsulfide(2); the decomposition of (L)-methionine
occurred rapidly in anoxic salt marsh sediments(2). (L)-Methionine was highly bioconvertible
(68-90% CO2 evolution) in 35-78 day anaerobic degradation studies using waste activated
sludge from the San Jose-Santa Clara Water Pollution Control Plant(3). [(1) Kiene RP, Taylor BF; Nature 332: 148-50 (1988) (2) Kiene RP, Visscher
PT; Appl Environ Microbiol 53: 2426-34 (1987) (3) Stuckey DC, McCarty PL;
Water Res 18: 1343-53 (1984)] **PEER REVIEWED**
Soil Adsorption/Mobility : The Koc of (L)-methionine is estimated as 8(SRC), using a log Kow of -1.87(1) and a
regression-derived equation(2). According to a classification scheme(3), this estimated Koc
value suggests that (L)-methionine is expected to have very mobility in soil. The pKa values of
(L)-methionine are 2.28 and 9.21(4), indicate that this compound will exist as a zwitterion
which may affect its adsorption to soils and sediments(SRC). One study found that (L)-
methionine was one of many amino acids that sorbed to carbonate sediments in seawater(5); a
positive correlation between surface area (of the sediment) and the amount of sorbed amino acids
indicated that sorption from solution (partitioning from the water column to sediment) was a
likely mechanism(5). [(1) Hansch C et al; Exploring QSAR. Hydrophobic, Electronic, and Steric
Constants. ACS Prof Ref Book. Heller SR, consult. ed., Washington, DC: Amer
Chem Soc p. 15 (1995) (2) US EPA; Estimation Program Interface (EPI) Suite.
Ver. 4.0. Jan, 2009. Available from
http://www.epa.gov/oppt/exposure/pubs/episuitedl.htm as of Feb 19, 2010. (3)
Swann RL et al; Res Rev 85: 17-28 (1983) (4) Drauz K et al; Ullmann's
Encyclopedia of Industrial Chemistry. 7th ed. (2008). New York, NY: John
Wiley & Sons; Amino Acids. Online Posting Date: Apr 15, 2007. (5) Muller PJ,
Suess E; Geochim Casmochim Acta 41: 941-9 (1977)] **PEER REVIEWED**
Appendix B Page B3

Hazardous Substances Data Bank – L-Methionine
4
Methods of Manufacturing : The production method of choice for L-methionine is still the enzymatic resolution of racemic
N-acetyl-methionine using acylase from Aspergillus oryzae. The production is carried out in a
continuously operated fixed-bed or enzyme membrane reactor. Alternatively, L-methionine may
be produced by microbial conversion of the corresponding 5-substituted hydantoin. With
growing cells of Pseudomonas sp. strain NS671, D,L-5-(2-methylthioethyl)hydantoin was
converted to L-methionine; a final concentration of 34 g/L and a molar yield of 93% have been
obtained. [Eggersdorfer M et al; Ullmann's Encyclopedia of Industrial Chemistry 7th ed.
(2008). New York, NY: John Wiley & Sons; Vitamins. Online Posting Date: June
15, 2000] **PEER REVIEWED**
Methods of Manufacturing : The most economic way for production of D,L-methionine is the chemical process based on
acrolein, methyl mercaptan, hydrogen cyanide, and ammonium carbonate. beta-
Methylthiopropionaldehyde, formed by addition of methyl mercaptan to acrolein, is the
intermediate that reacts with hydrogen cyanide to give alpha-hydroxy-gamma-
methylthiobutyronitrile. Treatment with ammonium carbonate leads to 5-(beta-
methylthioethyl)hydantoin that is saponified by potassium carbonate giving D,L-methionine in
up to 95% yield, calculated on acrolein. /D,L-Methionine/ [Eggersdorfer M et al; Ullmann's Encyclopedia of Industrial Chemistry 7th ed.
(2008). New York, NY: John Wiley & Sons; Vitamins. Online Posting Date: June
15, 2000] **PEER REVIEWED**
Interactions : The use of nitrofurans as veterinary drugs has been banned in the EU since 1993 due to doubts
on the safety of the protein-bound residues of these drugs in edible products. Furazolidone (FUZ)
is a nitrofuran drug, which has been used for many years as an antibacterial drug in veterinary
practice. ... Forty female Sprague-Dawley rats were divided into four groups included the
untreated control group; a group treated with FUZ (300 mg/kg bw); a group treated with a
mixture of L-cysteine (300 mg/kg b.w.) and L-methionine (42.8 mg/kg b.w.) and a group treated
with FUZ plus the mixture of L-cysteine and L-methionine for 10 days. The results indicated
that FUZ induced hormonal disturbances involving thyroid, ovarian and adrenal hormones.
Moreover, FUZ increased the micronucleus formation and induced changes in polymorphic band
patterns. The combined treatment with FUZ and the mixture of L-cysteine and L-methionine
succeeded to prevent or diminish the endocrine disturbance and the clastogenic effects of FUZ... [Ahmed HH et al; Toxicology 243 (1-2): 31-42 (2008). Available from, as of
March 17, 2010:
http://www.ncbi.nlm.nih.gov/entrez/query.fcgi?cmd=Retrieve&db=pubmed&dopt=Abs
tract&list_uids=17964703 **PEER REVIEWED**
Natural Pollution Sources : (L)-Methionine is formed in natural waters through metabolism of naturally occurring
proteins(1). It is one of the nine indispensable amino acids that cannot be synthesized to meet
body needs in animals and therefore must be provided in the diet(2). (L)-Methionine is a
Appendix B Page B4

Hazardous Substances Data Bank – L-Methionine
5
naturally occurring amino acid constituent of egg albumin, casein, and beta-lactoglobulin
proteins(3); (L)-methionine occurs naturally in foods such as maize, rice, wheat, potato,
soybeans, lettuce, bean, tomato, apples, oranges, beef, veal, fish, milk, cheese and eggs(3). [(1) Kiene RP, Visscher PT; Appl Environ Microbiol 53: 2426-34 (1987) (2)
NAS, Food and Nutrition Board, Institute of Medicine; Dietary Reference
Intakes for Energy, Carbohydrate, Fiber, Fat, Fatty Acids, Cholesterol,
Protein, and Amino Acids (Macronutrients). National Academy Press,
Washington, D.C. (2005). Available from, as of August 17, 2010:
http://books.nap.edu/openbook.php?record_id=10490&page=589 (3) Drauz K et al;
Ullmann's Encyclopedia of Industrial Chemistry. 7th ed. (2008). New York, NY:
John Wiley & Sons; Amino Acids. Online Posting Date: Apr 15, 2007.] **PEER
REVIEWED**
Environmental Fate : AQUATIC FATE: Based on a classification scheme(1), an estimated Koc value of 8(SRC),
determined from a log Kow of -1.87(2) and a regression-derived equation(3), indicates that (L)-
methionine is not expected to adsorb to suspended solids and sediment(SRC). The pKa values of
2.28 and 9.21(4) indicates (L)-methionine will exist as a zwitterion at pH values of 5 to 9 and
therefore volatilization from water surfaces is not expected to be an important fate process(5).
According to a classification scheme(6), an estimated BCF of 3(SRC), from its log Kow(2) and a
regression-derived equation(7), suggests the potential for bioconcentration in aquatic organisms
is low(SRC). Using a laboratory activated sludge system, (L)-methionine exhibited an 80%
theoretical BOD reduction in 16 days, producing 3-mercaptopropionate, methanethiol and
dimethylsulfide(8); this suggests that biodegradation may be an important environmental fate
process in water(SRC). [(1) Swann RL et al; Res Rev 85: 17-28 (1983) (2) Hansch C et al; Exploring
QSAR. Hydrophobic, Electronic, and Steric Constants. ACS Prof Ref Book.
Heller SR, consult. ed., Washington, DC: Amer Chem Soc p. 15 (1995) (3) US
EPA; Estimation Program Interface (EPI) Suite. Ver. 4.0. Jan, 2009. Available
from http://www.epa.gov/oppt/exposure/pubs/episuitedl.htm as of Feb 19, 2010.
(4) Drauz K et al; Ullmann's Encyclopedia of Industrial Chemistry. 7th ed.
(2008). New York, NY: John Wiley & Sons; Amino Acids. Online Posting Date:
Apr 15, 2007. (5) Doucette WJ; pp. 141-188 in Handbook of Property Estimation
Methods for Chemicals. Boethling RS, Mackay D, eds, Boca Raton, FL: Lewis
Publ (2000) (6) Franke C et al; Chemosphere 29: 1501-14 (1994) (7) Meylan WM
et al; Environ Toxicol Chem 18: 664-72 (1999) (8) Engelbrecht RS, McKinney
RE; Sew Indust Wastes 29: 1350-62 (1957)] **PEER REVIEWED**
Environmental Fate : AQUATIC FATE: (L)-Methionine has been shown to degrade in sunlit natural water through a
photo-sensitized oxidation involving singlet oxygen(1,2); assuming that the top meter of sunlit
natural water has a singlet oxygen concn of 4X10-14 M, the photooxidation half-life for the
reaction (L)-methionine with singlet oxygen has been estimated to be about 200 hr at pH 6-
11(1); the near-surface photooxidation rate (via singlet oxygen) of (L)-methionine in
Okefenokee Swamp water from Georgia is predicted to be about 3 hr(2). Bioconcentration and
volatilization are not expected to important fate processes because of its high water
solubility(SRC). [(1) Haag WR, Holgne J; Environ Sci Technol 20: 341-8 (1986) (2) Zepp RG et
al; Nature 267: 421-3 (1977)] **PEER REVIEWED**
Appendix B Page B5

Hazardous Substances Data Bank – L-Methionine
6
Environmental Fate : ATMOSPHERIC FATE: According to a model of gas/particle partitioning of semivolatile
organic compounds in the atmosphere(1), (L)-methionine, which has an estimated vapor
pressure of 8.1X10⁻⁸ mm Hg at 25 deg C(SRC), determined from a fragment constant
method(2), will exist in both the vapor and particulate phases in the ambient atmosphere. Vapor-
phase (L)-methionine is degraded in the atmosphere by reaction with photochemically-produced
hydroxyl radicals(SRC); the half-life for this reaction in air is estimated to be 7.5 hours(SRC),
calculated from its rate constant of 5.1X10⁻¹¹ cu cm/molecule-sec at 25 deg C(SRC) that was
derived using a structure estimation method(3). (L)-Methionine does not contain chromophores
that absorb at wavelengths >290 nm(4) and therefore is not expected to be susceptible to direct
photolysis by sunlight(SRC). [(1) Bidleman TF; Environ Sci Technol 22: 361-367 (1988) (2) Lyman WJ; p. 31
in Environmental Exposure From Chemicals Vol I, Neely WB, Blau GE, eds, Boca
Raton, FL: CRC Press (1985) (3) Meylan WM, Howard PH; Chemosphere 26: 2293-99
(1993) (4) Lyman WJ et al; Handbook of Chemical Property Estimation Methods.
Washington, DC: Amer Chem Soc pp. 8-12 (1990)] **PEER REVIEWED**
Environmental Biodegradation : AEROBIC: In a laboratory activated sludge system, (L)-methionine had an 80% theoretical
BOD reduction after 16 days of incubation(1). In a Warburg respirometer study using activated
sludge, (L)-methionine (at a concn of 500 mg/L) had a theoretical BOD of 2.6% over a 24-hr
incubation period(2). In an activated sludge system that had been acclimated to phenol, (L)-
methionine had a theoretical oxidation of 16% after 12 hrs of aeration(3). [(1) Engelbrecht RS, McKinney RE; Sew Indust Wastes 29: 1350-62 (1957) (2)
Malaney GW, Gerhold RM; J Water Pollut Control Fed 41: R18-R33 (1969) (3)
McKinney RE et al; Sew Indust Wastes 28: 547-57 (1956)] **PEER REVIEWED**
Environmental Abiotic Degradation : The rate constant for the vapor-phase reaction of (L)-methionine with photochemically-
produced hydroxyl radicals has been estimated as 6.1X10⁻¹¹ cu cm/molecule-sec at 25 deg
C(SRC) using a structure estimation method(1). This corresponds to an atmospheric half-life of
about 7.5 hours at an atmospheric concentration of 5X10+5 hydroxyl radicals per cu cm(1). (L)-
Methionine is not expected to undergo hydrolysis in the environment due to the lack of
functional groups that hydrolyze under environmental conditions(3). (L)-Methionine does not
contain chromophores that absorb at wavelengths >290 nm(3) and therefore is not expected to be
susceptible to direct photolysis by sunlight(SRC). [(1) Meylan WM, Howard PH; Chemosphere 26: 2293-99 (1993) (3) Lyman WJ et al;
Handbook of Chemical Property Estimation Methods. Washington, DC: Amer Chem
Soc pp. 7-4, 7-5, 8-12 (1990)] **PEER REVIEWED**
General Manufacturing Information : ... Available as d,l-methionine and as calcium salt of hydroxy analog of methionine. These
products are used ... in animal feeds ... Relative biological value of these compared to l-
Appendix B Page B6

Hazardous Substances Data Bank – L-Methionine
7
methionine ... evidence suggests equivalency on mole basis both in rats and man. [Furia, T.E. (ed.). CRC Handbook of Food Additives. 2nd ed. Cleveland: The
Chemical Rubber Co., 1972., p. 109] **PEER REVIEWED**
Volatilization from Water/Soil : The pKa values of 2.28 and 9.21(1) indicate (L)-methionine will exist as a zwitterion at pH
values of 5 to 9 and therefore volatilization from water surfaces is not expected to be an
important fate process(2). (L)-Methionine is not expected to volatilize from dry soil
surfaces(SRC) based upon an estimated vapor pressure of 8.1X10⁻⁸ mm Hg(SRC), determined
from a fragment constant method(3). [(1) Drauz K et al; Ullmann's Encyclopedia of Industrial Chemistry. 7th ed.
(2008). New York, NY: John Wiley & Sons; Amino Acids. Online Posting Date:
Apr 15, 2007. (2) Doucette WJ; pp. 141-188 in Handbook of Property Estimation
Methods for Chemicals. Boethling RS, Mackay D, eds. Boca Raton, FL: Lewis
Publ (2000) (3) Lyman WJ; p. 31 in Environmental Exposure From Chemicals Vol
I, Neely WB, Blau GE, eds, Boca Raton, FL: CRC Press (1985)] **PEER
REVIEWED**
Milk Concentrations : ENVIRONMENTAL: The average (L)-methionine content of cows milk is reported as 86
mg/100 g(1). The average (L)-methionine content of human milk is reported as 19 mg/100 g(1). [(1) Drauz K et al; Ullmann's Encyclopedia of Industrial Chemistry. 7th ed.
(2008). New York, NY: John Wiley & Sons; Amino Acids. Online Posting Date:
Apr 15, 2007.] **PEER REVIEWED**
Formulations/Preparations : Racemate mixture of D- and L- methionine [Gerhartz, W. (exec ed.). Ullmann's Encyclopedia of Industrial Chemistry. 5th
ed.Vol A1: Deerfield Beach, FL: VCH Publishers, 1985 to Present., p. VA2: 71
(1985)] **PEER REVIEWED**
U. S. Production : World market for L-methionine in 1982: 150 tons; World market for DL-methionine in 1982:
110,000 tons [Gerhartz, W. (exec ed.). Ullmann's Encyclopedia of Industrial Chemistry. 5th
ed.Vol A1: Deerfield Beach, FL: VCH Publishers, 1985 to Present., p. VA2: 90
(1985)] **PEER REVIEWED**
Human Toxicity Excerpts : /HUMAN EXPOSURE STUDIES/ ... Homocysteine levels in patients with inflammatory bowel
disease (IBD) /were studied/ during fasting and after methionine load to determine the true
prevalence of hyperhomocysteinemia and its relation with thrombotic events. METHODS:
Prospective analysis of homocysteine levels in consecutive patients with IBD during fasting and
6-8 hours after an oral methionine load. Levels of folate and vitamin B12 were also determined.
History of thrombotic events were recorded. RESULTS: Eighty-two patients with IBD ... were
Appendix B Page B7

Hazardous Substances Data Bank – L-Methionine
8
included. Eighteen patients (22%) had hyperhomocysteinemia during fasting. Mean levels of
homocysteine after methionine load were 20.4 +/- 18.1 umol/L (range, 1-79.7 umol/L), and 43
patients (52%) had hyperhomocysteinemia (> or =20 umol/L) after methionine load. Six
patients (7.3%) had history of thrombosis. The homocysteine levels during fasting and after
methionine load were significantly higher in patients with thrombotic events than in patients
without thrombosis (15.5 +/- 3.7 umol/L vs. 6.6 +/- 6.5 umol/L; P = 0.002; 44.5 +/- 20.9 umol/L
vs. 18.4 +/- 16.5 umol/L; P < 0.001, respectively)... [Zepeda-Gomez S et al; Inflammatory Bowel Dis 14 (3): 383-8 (2008). Available
from, as of March 17, 2010:
http://www.ncbi.nlm.nih.gov/entrez/query.fcgi?cmd=Retrieve&db=pubmed&dopt=Abs
tract&list_uids=17924554 **PEER REVIEWED**
Human Toxicity Excerpts : /SIGNS AND SYMPTOMS/ Methionine supplements (5 g/day) for periods of weeks were
reportedly innocuous in humans. ... Single oral doses of 7 g produced lethargy in six individuals
and oral administration of 10.5 g of L-methionine to one produced nausea and vomiting. After
an oral administration of 8 g/day of methionine (isomer not specified) for 4 days, serum folate
concentrations were decreased in five otherwise healthy adults. [NAS, Food and Nutrition Board, Institute of Medicine; Dietary Reference
Intakes for Energy, Carbohydrate, Fiber, Fat, Fatty Acids, Cholesterol,
Protein, and Amino Acids (Macronutrients). National Academy Press,
Washington, D.C., pg. 726, 2009. Available from, as of March 10, 2010:
http://www.nap.edu/catalog/10490.html **PEER REVIEWED**
Non-Human Toxicity Excerpts : /LABORATORY ANIMALS: Acute Exposure/ A single dietary dose (2.7% of the diet) of L-
methionine decreased body growth and also reduced food intake in rats. [NAS, Food and Nutrition Board, Institute of Medicine; Dietary Reference
Intakes for Energy, Carbohydrate, Fiber, Fat, Fatty Acids, Cholesterol,
Protein, and Amino Acids (Macronutrients). National Academy Press,
Washington, D.C., pg. 725, 2009. Available from, as of March 10, 2010:
http://www.nap.edu/catalog/10490.html **PEER REVIEWED**
Non-Human Toxicity Excerpts : /LABORATORY ANIMALS: Subchronic or Prechronic Exposure/ Dietary excesses of L-
methionine (2.7% of the diet) for 6, 13, or 20 days have been associated with erythrocyte
engorgement and accumulation of hemosiderine in rats, and there was a depression of growth
and splenic damage. [NAS, Food and Nutrition Board, Institute of Medicine; Dietary Reference
Intakes for Energy, Carbohydrate, Fiber, Fat, Fatty Acids, Cholesterol,
Protein, and Amino Acids (Macronutrients). National Academy Press,
Washington, D.C., pg. 725, 2009. Available from, as of March 10, 2010:
http://www.nap.edu/catalog/10490.html **PEER REVIEWED**
Non-Human Toxicity Excerpts : /LABORATORY ANIMALS: Subchronic or Prechronic Exposure/ Dietary intakes of 2 to 4% of
Appendix B Page B8

Hazardous Substances Data Bank – L-Methionine
9
L-methionine caused slight changes in liver cells in rats and slight decreases in liver iron
content. Darkened spleens caused by increases in iron deposition have been observed in
weanling rats fed 1.8% methionine diets for 28 days. [NAS, Food and Nutrition Board, Institute of Medicine; Dietary Reference
Intakes for Energy, Carbohydrate, Fiber, Fat, Fatty Acids, Cholesterol,
Protein, and Amino Acids (Macronutrients). National Academy Press,
Washington, D.C., pg. 725, 2009. Available from, as of March 10, 2010:
http://www.nap.edu/catalog/10490.html **PEER REVIEWED**
Non-Human Toxicity Excerpts : /LABORATORY ANIMALS: Subchronic or Prechronic Exposure/ ... Male Wistar rats were fed
either a L-methionine-supplemented (2.5 g/100 g) diet without changing any other dietary
components or a control (0.86 g/100 g) diet for 7 weeks. It was found that methionine
supplementation increased mitochondrial reactive oxygen species (ROS) generation and percent
free radical leak in rat liver mitochondria but not in rat heart. In agreement with these data
oxidative damage to mitochondrial DNA increased only in rat liver, but no changes were
observed in five different markers of protein oxidation in both organs. The content of
mitochondrial respiratory chain complexes and AIF (apoptosis inducing factor) did not change
after the dietary supplementation while fatty acid unsaturation decreased. Methionine, S-
AdenosylMethionine and S-AdenosylHomocysteine concentration increased in both organs in
the supplemented group. These results show that methionine supplementation in the diet
specifically increases mitochondrial ROS production and mitochondrial DNA oxidative damage
in rat liver mitochondria offering a plausible mechanism for its hepatotoxicity. [Gomez J et al; J Bioenergetics Biomembranes 41 (3): 309-21 (2009). Available
from, as of March 17, 2010:
http://www.ncbi.nlm.nih.gov/entrez/query.fcgi?cmd=Retrieve&db=pubmed&dopt=Abs
tract&list_uids=19633937 **PEER REVIEWED**
Absorption, Distribution & Excretion : ... Rats were fed diets containing [(14)C-methyl]l-methionine ... with 6% of sodium formate,
and conversion of (14)C into [(14)C]formate was measured in urine and exhaled air (as
(14)CO2) ... Total oxidation of [(14)C-methyl] into CO2, amounted to 60-87% for methionine ... [The Chemical Society. Foreign Compound Metabolism in Mammals. Volume 5: A
Review of the Literature Published during 1976 and 1977. London: The Chemical
Society, 1979., p. 435] **PEER REVIEWED**
Absorption, Distribution & Excretion : Using a double-lumen tube perfusion system the rates of absorption of L-methionine and
glucose from a 30 cm segment of the jejunum were estimated in eight relatively normal Zambian
African subjects. The effect of each substrate on the absorption of the other has also been
investigated. The solutions perfused were given at 12.0 ml/L/min, and contained 100 m-mole/L
of L-methionine, 100 m-mole/L of L-methionine and 150 m-mole/L of glucose or 150 m-
mole/L of glucose. The presence of glucose in the perfusing fluid did not significantly alter the
mean absorption rate of methionine ... . Five subjects had a transitory psychiatric disturbance
after the investigation. The cause of this is not clear, but was probably caused by the absorption
of a break-down product of methionine from the large intestine.
Appendix B Page B9

Hazardous Substances Data Bank – L-Methionine
10
[Cook GC; J Physiol 221 (3): 707-14 (1972). Available from, as of March 17,
2010:] **PEER REVIEWED** PubMed Abstract
Metabolism/Metabolites : ... Methionine ... is catabolized to a large extent independently of initial activation to S-adenosyl-
l-methionine. The system for catabolism ... appears analogous to one that catalyses oxidation of
S-methyl-l-cysteine methyl group ... The methyl group of methionine ... /has been/ shown ... to
yield formate in vitro and in vivo. [The Chemical Society. Foreign Compound Metabolism in Mammals. Volume 5: A
Review of the Literature Published during 1976 and 1977. London: The Chemical
Society, 1979., p. 435] **PEER REVIEWED**
Interactions : Poor folate status is associated with cognitive decline and dementia in older adults. ... To better
define the role of folate deficiency in cognitive dysfunction, ... rats /were fed/ folate-deficient
diets (0 mg FA/kg diet) with or without supplemental L-methionine for 10 wk, followed by
cognitive testing and tissue collection for hematological and biochemical analysis. Folate
deficiency with normal methionine impaired spatial memory and learning; however, this
impairment was prevented when the folate-deficient diet was supplemented with methionine... [Troen AM et al; J Nutrition 138 (12): 2502-9 (2008). Available from, as of
March 17, 2010:
http://www.ncbi.nlm.nih.gov/entrez/query.fcgi?cmd=Retrieve&db=pubmed&dopt=Abs
tract&list_uids=19022979 **PEER REVIEWED**
Interactions : Rats were fed diets supplemented with 1% L-methionine with and without 2.5% various amino
acids for 7 d to determine what amino acids other than glycine, serine, and cystine can suppress
methionine-induced hyperhomocysteinemia. L-Glutamic acid, L-histidine, and L-arginine
significantly suppressed methionine-induced enhancement of plasma homocysteine
concentrations, but the mechanisms underlying the effect of these amino acids are thought not to
be identical. [Fukada S-I et al; Biosci Biotech Biochem 72 (7): 1940-3 (2008). Available
from, as of March 17, 2010:
http://www.ncbi.nlm.nih.gov/entrez/query.fcgi?cmd=Retrieve&db=pubmed&dopt=Abs
tract&list_uids=18603771 **PEER REVIEWED**
Interactions : ... Rats fed on a vitamin B12 (B12)-deficient diet containing 180 g soybean protein per kg diet
showed marked histologic damage in their testes. /This paper reports/ the effect of B12-
deficiency on B12-dependent methionine synthase in the rats' testes and the effect of methionine
supplementation of the diet on testicular damage. Rats ... fed the soybean protein-based B12-
deficient diet for 120 d ... were in serious B12-deficiency /as measured by/ urinary
methylmalonic acid excretion and B12 content in tissues. Methionine synthase activity in the
testis of the B12-deficient rats was less than 2% of that in B12-supplemented (control) rats. To
complement disrupted methionine biosynthesis, methionine was supplied in the diet. A
Appendix B Page B10

Hazardous Substances Data Bank – L-Methionine
11
supplement of 5 g D,L-methionine per kg diet to the B12-deficient diet did not affect urinary
methylmalonic acid excretion of B12-deficient rats. The testicular histology of rats fed the
methionine-supplemented B12-deficient diet was almost indistinguishable from that of control
rats... [Yamada K et al; J Nutrit Sci Vitaminology 53 (2): 95-101. Available from, as
of March 17, 2010:
http://www.ncbi.nlm.nih.gov/entrez/query.fcgi?cmd=Retrieve&db=pubmed&dopt=Abs
tract&list_uids=17615995 **PEER REVIEWED**
Artificial Pollution Sources : (L)-Methionine's production and use as nutritional supplement in animal feeds(1) may result in
its release to the environment through various waste streams(SRC). [(1) Drauz K et al; Ullmann's Encyclopedia of Industrial Chemistry. 7th ed.
(2008). New York, NY: John Wiley & Sons; Amino Acids. Online Posting Date:
Apr 15, 2007.] **PEER REVIEWED**
Environmental Bioconcentration : An estimated BCF of 3 was calculated in fish for (L)-methionine(SRC), using a log Kow of -
1.87(1) and a regression-derived equation(2). According to a classification scheme(3), this BCF
suggests the potential for bioconcentration in aquatic organisms is low(SRC). [(1) Hansch C et al; Exploring QSAR. Hydrophobic, Electronic, and Steric
Constants. ACS Prof Ref Book. Heller SR, consult. ed., Washington, DC: Amer
Chem Soc p. 125 (1995) (2) US EPA; Estimation Program Interface (EPI) Suite.
Ver. 4.0. Jan, 2009. Available from
http://www.epa.gov/oppt/exposure/pubs/episuitedl.htm as of Feb 19, 2010. (3)
Franke C et al; Chemosphere 29: 1501-14 (1994)] **PEER REVIEWED**
Sediment/Soil Concentrations : SOIL: (L)-Methionine concentrations in three soil horizons of an active landfill, the Conica
Montemarte outside of Seville, Spain, were reported as 0.5 nmol/g (1.0-1.5 meters), 19.9 nmol/g
(3.0-3.5 meters), and 38.2 nmol/g (6.5-7.0 meters), 6, 18, and 24 months after deposition
respectively(1). [(1) Gonzalez-Vila, FJ et al; Chemosphere 31: 2817-25 (1995)] **PEER
REVIEWED**
Sediment/Soil Concentrations : SEDIMENT: (L)-Methionine concentrations of 0.46 to 0.055 umol/g were detected in carbonate
sediment samples collected from a lagoon of Fanning Island, an atoll in the Line Islands of the
Central Pacific Ocean(1). [(1) Muller PJ, Suess E; Geochim Casmochim Acta 41: 941-9 (1977)] **PEER
REVIEWED**
Animal Concentrations : Zebra mussels and clams sampled in November 1991 from Oneida Lake in NY State were found
to have (L)-methionine levels of 1.66 and 1.58 g/100 g dry wt, respectively(1).
Appendix B Page B11

Hazardous Substances Data Bank – L-Methionine
12
[(1) Secor CL et al; Chemosphere 26: 1559-75 (1993)] **PEER REVIEWED**
Body Burden : The average (L)-methionine content of human milk is reported as 19 mg/100 g(1). [(1) Drauz K et al; Ullmann's Encyclopedia of Industrial Chemistry. 7th ed.
(2008). NY, NY: John Wiley & Sons; Amino Acids. Online Posting Date: Apr 15,
2007.] **PEER REVIEWED**
FDA Requirements : L-Methionine is a food additive permitted for direct addition to food for human consumption, as
long as 1) the quantity of the substance added to food does not exceed the amount reasonably
required to accomplish its intended physical, nutritive, or other technical effect in food, and 2)
any substance intended for use in or on food is of appropriate food grade and is prepared and
handled as a food ingredient. [21 CFR 172.320 (USFDA); U.S. National Archives and Records Administration's
Electronic Code of Federal Regulations. Available from, as of March 19, 2010:
http://www.gpoaccess.gov/ecfr **PEER REVIEWED**
Appendix B Page B12

1
Neal, Arthur
From: [email protected]%inter2 [[email protected]] on behalf of [email protected]
Sent: Monday, August 08, 2005 4:19 PMTo: National ListSubject: TM-05-02 - Methionine in Organic Poultry Production
Attachments: Life Cycle Analysis of DL-Methionine.pdf
Life Cycle Analysis of DL-Meth...
Arthur NealDirector of Program AdministrationNational Organic programUSDA-AMS-TMP-NOP
Dear Mr. Neal,
we appreciate the extend of methionine use in organic poultry production until October 21,2008.
Methionine is an essential amino acid. At present, there are no alternative organic methionine-rich ingredients available in sufficient quantities.
I'm attaching a paper entitled "Life cycle analysis of DL-methionine in broiler meat production". In this work, we had an independent institute evaluate the production methodsand the effects of DL-methionine in poultry feeds. The results are very clear-cut, please have a look.
With best regards,
Dirk Hoehler
(See attached file: Life Cycle Analysis of DL-Methionine.pdf)
degussa.Dr. Dirk HoehlerDirector, Nutrition & Technical Services Degussa Corporation, Feed Additives1701 Barrett Lakes Blvd., Suite 340Kennesaw, GA 30144USA
Phone, office: 678-797-4326Phone, cell: 678-640-6104Fax: 678-797-4313
E-mail: [email protected]
Appendix B Page B13

amino acids and more.Information for the Feed Industry
Special IssueVolume 04 / Number 02 / June 2003
Life cycle analysis of DL-methionine in broiler meat production
byDr. Michael Binder
Appendix B Page B14

Key information
• This paper presents a comparative as-sessment of the ecological impact of me-thionine supplementation in poultrymeat production, using either syntheticDL-methionine or natural methioninederived from vegetable proteins.
• The study provides an energetic assess-ment of the entire life cycle of DL-me-thionine by process chain analysis.
• The comparison looks at the provision of1 kg methionine for supplementation of
Poultry / Environment
a methionine-deficient broiler rationwith DL-methionine vs. additional pro-tein from methionine-rich oilseeds. Theimpact of alternative feeding strategieson the environment is analysed by mea-suring critical environmental parame-ters.
• Supplementation of 1 kg synthetic DL-methionine requires less than one sixthof the energy needed to provide theequivalent amount of methionine from
Life cycle analysis of DL-methioninein broiler meat production
Volume 04/ Number 02 • June 2003 amino acids and more.
di i2
Appendix B Page B15

3
soybean meal or rapeseed meal. The sig-nificant reduction in energy use alsoleads to considerably lower process-rele-vant emissions, resulting in a sustainedcontribution towards reducing environ-mental pollution (eutrophication andacidification).
Life cycle analysis
The Feed Additives Business of DegussaAG is the world‘s largest producer ofamino acids for animal nutrition. Themain focus is on poultry and pig meatproduction, because amino acids arebuilding blocks of dietary proteins and assuch constitute a major factor for animalgrowth.
Degussa AG is quoted in the Dow JonesSustainability Index, therefore the FeedAdditives Division is committed to aproactive and consistent policy in thearea of environmental and health pro-tection. This is demonstrated by effortsto assess the environmental pros andcons of its products by means of lifecycle analysis (ecobalance). DL-methio-nine was the first product to be subject-ed to ecobalance testing in collabora-tion with the “ifeu” (Institute for Ener-gy and Environmental Research, Hei-delberg). The ISO 14040 to 14042 in-ternational standards were the basis forthese tests.
DL-methionine is manufactured exclu-sively from petrochemical raw materialsby a chemical process. It is also themost significant amino acid in animalnutrition measured by annual produc-tion value. The amino acid is currentlyproduced at three locations in threecountries. Degussa‘s production facilityat Wesseling/Germany also produces allessential intermediates on site.
Methionine is an essential amino acid,which plays a critical role in broiler pro-duction as the first-limiting amino acid.A methionine deficiency limits proteinbiosynthesis, which means that otheramino acids supplied with the diet canno longer be utilised. Methionine defi-ciency can be corrected either by the
provision of synthetic amino acids or byincreasing the proportion of methionine-rich natural feed ingredients, such assoybean meal or rapeseed meal.
Supplementing livestock diets with syn-thetic methionine enables to supply thislimiting amino acid with a high degreeof precision. At the same time, extractedsoybean meal or rapeseed meal, whichare extensively used in poultry produc-tion as sources of protein (and methio-nine), can be replaced by grains. Theprovision of the two alternative methio-nine sources was compared over theirentire life cycles.
Ecobalance testing allows an objectiveassessment of the ecological benefits offine-tuning the methionine content oftypical broiler rations by the addition ofsynthetic DL-methionine.
Equivalent feed mixtures as functional units
In the ecobalance evaluation of DL-me-thionine, alternative options for increas-ing the methionine content of completebroiler rations were compared. Firstly, apractical DL-methionine supplementeddiet was formulated which covers thebird‘s nutrient requirements (Diet A). InDiets B and C, dietary methionine con-tent was raised by increasing the propor-tion of soybean meal or rapeseed meal,respectively.
The energy content of all three feeds wasadjusted by varied amounts of vegetableoil supplementations. All three dietswere formulated to contain the samelevel of true digestible methionine. Thesystem “Diet A” is based on the technicalproduction of methionine as a specialitychemistry product. In the second andthird option (B, C) the methionine con-tent of the ration is adjusted by increas-ing the proportion of soybean meal orrapeseed meal. System B has to includethe cultivation of soybeans in North andSouth America, transport, and process-ing in an oil mill. In order to provide anutritionally equivalent mixture, thisautomatically entails a reduction of thecereal content – in this case wheat – inthe feed mixture, thereby lowering theenergy content of the ration. The re-duced amount of wheat is credited tothe system. In order to cover the re-quirement for metabolisable energy, theration is supplemented with energy-richsoy oil. The manufacture of oil is also in-cluded in the balance calculation. Provi-sion of the equivalent amount of me-thionine through rapeseed meal (themost important methionine-rich Euro-pean protein source) is evaluated andbalanced in the same way.
Additionally, each product system con-siders the specific emissions associatedwith the altered feed composition (high-er protein content), i.e., emissionscaused by poultry droppings and ma-nure applied to the land.
Ingredients (%) Diet A Diet B Diet C
Wheat 63.0 45.2 44.3
Soybean meal 27.0 43.0 27.0
Rapeseed meal – – 15.0
Soybean oil 5.0 6.8 5.0
Rapeseed oil - - 3.8
Minerals & vitamins 5.0 5.0 5.0
DL-methionine 0.06 – –
Metabolizable energy (ME, MJ/kg) 12.7 12.7 12.7
Crude protein (%) 20.4 25.7 23.2
True digestible methionine (%) 0.31 0.31 0.31
Table 1: Broiler rations formulated based on meeting the methionine requirementby supplementing DL-methionine (A) vs. increased amounts of soybeanmeal (B) and rapeseed meal (C)
Volume 04/ Number 02 • June 2003amino acids and more.
di i3
Appendix B Page B16

di i
Volume 04/ Number 02 • June 2003 amino acids and more.
4
The ecological comparison of the twoproduct systems is limited to consideringthe respective differences relative to thebasal mixture A. Both balanced productsystems are shown in the simplified flowchart in Figure 1. By standardising thedifferences in the respective feed formu-lations in Table 1 to 1 kg methionine ineach case, we can draw up the followingcomparative equation for further consid-eration:
The manufacture of DL-methionine bythe Degussa process (Figure 2) uses con-ventional petrochemical raw materialsand comprises a series of synthesis stepsin closed cycles with intensive recyclingof by-products.
Adverse environmental effects
Resource consumption / energy use
The consumption of natural resources isconsidered an impairment of the basisof human life. The conservation of re-sources plays an important role in allconsiderations about sustainable man-agement. The term “resources” is usual-ly confined to non-renewable mineralor fossil resources, which is closely re-lated to the total consumption of ener-gy. The “shortage” of a resource is tradi-tionally adopted as a criterion for evalu-ating resource depletion. To determinewhether a resource is in short supply, arelationship is established between thefactors consumption, potential renewaland reserves for a specific geographicalunit.
Poultry
Soybeans Wheat Minerals,vitamins
Soybeanmeal
Soybeanoil DL-methionine
Poultry feed
Poultry excrements(N-excretion)
Feed mill
Oil mill
Chemicalproduction
DL-methionine
Poultrygrowout
Application asagricultural fertilizer
Productionof soybeans
Productionof premixes
Productionof wheat
Figure 1: Life cycle of the various feed mixtures and the use of synthetic DL-methionine (The material flows refer to a complete broiler diet with a 1 kg higher methionine content than the basal mixture; the supply of methionine fromrapeseed meal can be assessed in the same way.)
1 kg DL-methionine
260 kg soybean meal29 kg soybean oil
-288 kg wheat
250 kg rapeseed meal29 kg rapeseed oil
-311 kg wheat
RawMaterials
Process
DLM
DLM-Synthesis
DLM-Isolation
Acrolein Methylmercaptan HCN
Oil
Propene
Natural gas
H2S CH3OH
Air; N2H2O
NH3
Recycling of:
• CO2
• NH3
Figure 2: Simplified process chart of the chemical synthesis of DL-methioninefrom petrochemical raw materials by the Degussa process
Appendix B Page B17
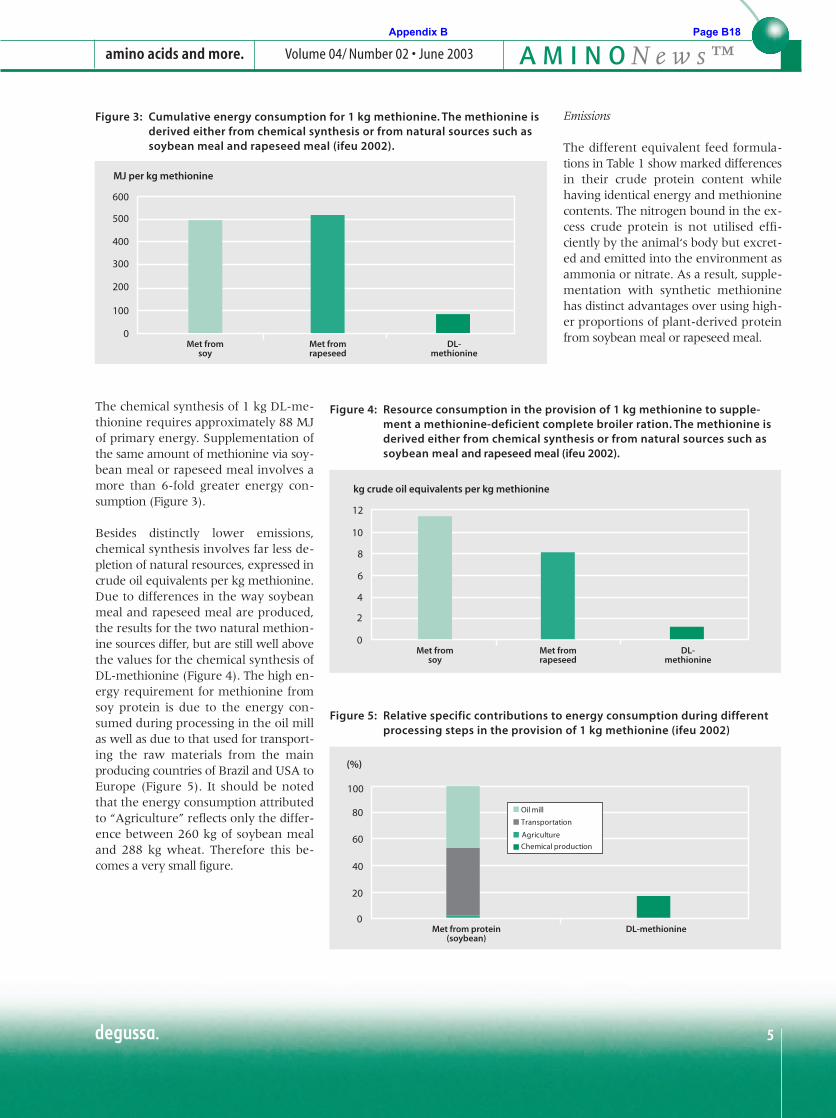
Volume 04/ Number 02 • June 2003amino acids and more.
di i5
600
MJ per kg methionine
500
400
300
200
100
0Met from
soyDL-
methionineMet fromrapeseed
Figure 3: Cumulative energy consumption for 1 kg methionine. The methionine isderived either from chemical synthesis or from natural sources such assoybean meal and rapeseed meal (ifeu 2002).
The chemical synthesis of 1 kg DL-me-thionine requires approximately 88 MJof primary energy. Supplementation ofthe same amount of methionine via soy-bean meal or rapeseed meal involves amore than 6-fold greater energy con-sumption (Figure 3).
Besides distinctly lower emissions,chemical synthesis involves far less de-pletion of natural resources, expressed incrude oil equivalents per kg methionine.Due to differences in the way soybeanmeal and rapeseed meal are produced,the results for the two natural methion-ine sources differ, but are still well abovethe values for the chemical synthesis ofDL-methionine (Figure 4). The high en-ergy requirement for methionine fromsoy protein is due to the energy con-sumed during processing in the oil millas well as due to that used for transport-ing the raw materials from the mainproducing countries of Brazil and USA toEurope (Figure 5). It should be notedthat the energy consumption attributedto “Agriculture” reflects only the differ-ence between 260 kg of soybean mealand 288 kg wheat. Therefore this be-comes a very small figure.
kg crude oil equivalents per kg methionine
12
Met fromsoy
DL-methionine
Met fromrapeseed
10
8
6
2
4
0
Figure 4: Resource consumption in the provision of 1 kg methionine to supple-ment a methionine-deficient complete broiler ration. The methionine isderived either from chemical synthesis or from natural sources such assoybean meal and rapeseed meal (ifeu 2002).
Emissions
The different equivalent feed formula-tions in Table 1 show marked differencesin their crude protein content whilehaving identical energy and methioninecontents. The nitrogen bound in the ex-cess crude protein is not utilised effi-ciently by the animal‘s body but excret-ed and emitted into the environment asammonia or nitrate. As a result, supple-mentation with synthetic methioninehas distinct advantages over using high-er proportions of plant-derived proteinfrom soybean meal or rapeseed meal.
(%)
100
Met from protein(soybean)
DL-methionine
80
60
40
0
20
Oil mill
Transportation
Agriculture
Chemical production
Figure 5: Relative specific contributions to energy consumption during differentprocessing steps in the provision of 1 kg methionine (ifeu 2002)
Appendix B Page B18

di i
Volume 04/ Number 02 • June 2003 amino acids and more.
6
kg PO4-equivalents per kg methionine
3.0
Met fromsoy
DL-methionine
Met fromrapeseed
2.5
2.0
1.5
0.5
1.0
0.0
Figure 6: Contributions to terrestrial eutrophication for the provision of 1 kg me-thionine either from chemical synthesis or from natural protein sourcessuch as soybean meal or rapeseed meal (ifeu 2002)
kg PO4-equivalents per kg methionine
1.0
Met fromsoy
DL-methionine
Met fromrapeseed
0.8
0.6
0.4
0.0
0.2
Figure 7: Contributions to aquatic eutrophication for the provision of 1 kg methio-nine either from chemical synthesis or from natural protein sources suchas soybean meal or rapeseed meal (ifeu 2002)
Both the emission of ammonia (NH3) in-to the air (terrestrial eutrophication; Fig-ure 6) and the pollution of water withnitrates (NO3
-, aquatic eutrophication;Figure 7) associated with the provisionof 1 kg methionine can be greatlyreduced.
Appendix B Page B19

Volume 04/ Number 02 • June 2003amino acids and more.
7diti
Dr. Michael Binder
email:
michael.binder@
degussa.com
References
ifeu (2002): Ökobilanz für Methionin in derGeflügelmast / Life cycle analysis for methio-nine in broiler meat production. ifeu (Insti-tute for Energy and Environmental Technol-ogy GmbH), Heidelberg.
Conclusion
Supplementation of broiler rations withsynthetic DL-methionine represents amajor contribution towards alleviatingenvironmental pollution compared withthe use of methionine-rich proteinsources such as soybean meal or rape-seed meal. Firstly, the chemical produc-tion of methionine requires far less ener-gy for achieving the same performancelevel with a given feed mixture. Second-ly, it causes far lower environmentalemissions. The lasting results are a sav-ing of resources and a reduced emissionof nitrogen and other compounds.
Appendix B Page B20
di i
Volume 04/ Number 02 • June 2003 amino acids and more.
This information and all further technical advice is based on our present knowl-edge and experience. However, it implies no liability or other legal responsibili-ty on our part, including with regard to existing third party intellectual propertyrights, especially patent rights. In particular, no warranty, whether express orimplied, or guarantee of product properties in the legal sense is intended orimplied. We reserve the right to make any changes according to technological
progress or further developments.The customer is not released from the oblig-ation to conduct careful inspection and testing of incoming goods. Per-formance of the product described herein should be verified by testing, whichshould be carried out only by qualified experts in the sole responsibility of a customer. Reference to trade names used by other companies is neither arecommendation, nor does it imply that similar products could not be used.
Degussa AG • Feed Additives • Rodenbacher Chaussee 4 • D-63457 Hanau-Wolfgang • Germany Marketing • Tel: +49-6181-59-6782 • Fax: +49-6181-59-6734Applied Technology • Tel: +49-6181-59-2256 • Fax: +49-6181-59-2192
NAFTA Degussa Corporation • Feed Additives • 1255 Roberts Blvd., Suite 110 • Kennesaw, GA 30144-3694 Tel: +1-770-419-8812 • Fax: +1-770-419-8814
ASPAC Degussa (SEA) Pte. Ltd. • 3 International Business Park • Nordic European Centre # 07-18 • Singapore 609927Tel: + 65-6890-6865 • Fax: + 65-6890-6870
E-mail: [email protected] • Internet: www.aminoacidsandmore.com
amino acids and more.
Amin
oNew
sTM
Appendix B Page B21

46
21 CFR Ch. I (4–1–09 Edition) § 172.280
be safely used as a component of food, subject to the following restrictions:
(a) The additive is prepared with 50 percent Fischer-Tropsch process syn-thetic paraffin, meeting the definition and specifications of § 172.615, and 50 percent of such synthetic paraffin to which is bonded succinic anhydride and succinic acid derivatives of isopropyl alcohol, polyethylene glycol, and poly-propylene glycol. It consists of a mix-ture of the Fischer-Tropsch process paraffin (alkane), alkyl succinic anhy-dride, alkyl succinic anhydride iso-propyl half ester, dialkyl succinic an-hydride polyethylene glycol half ester, and dialkyl succinic anhydride poly-propylene glycol half ester, where the alkane (alkyl) has a chain length of 30– 70 carbon atoms and the polyethylene and polypropylene glycols have molec-ular weights of 600 and 260, respec-tively.
(b) The additive meets the following specifications: Molecular weight, 880– 930; melting point, 215°–217 °F; acid number, 43–47; and saponification num-ber, 75–78.
(c) It is used or intended for use as a protective coating or component of protective coatings for fresh grape-fruit, lemons, limes, muskmelons, or-anges, sweetpotatoes, and tangerines.
(d) It is used in an amount not to ex-ceed that required to produce the in-tended effect.
§ 172.280 Terpene resin. The food additive terpene resin may
be safely used in accordance with the following prescribed conditions:
(a) The food additive is the beta-pinene polymer obtained by polym-erizing terpene hydrocarbons derived from wood. It has a softening point of 112 °C–118 °C, as determined by ASTM method E28–67 (Reapproved 1982), ‘‘Standard Test Method for Softening Point By Ring-and-Ball Apparatus,’’ which is incorporated by reference. Copies may be obtained from the Amer-ican Society for Testing Materials, 100 Barr Harbor Dr., West Conshohocken, Philadelphia, PA 19428-2959, or may be examined at the National Archives and Records Administration (NARA). For information on the availability of this material at NARA, call 202–741–6030, or go to: http://www.archives.gov/
federallregister/ codeloflfederallregulations/ ibrllocations.html.
(b) It is used or intended for use as follows:
(1) As a moisture barrier on soft gela-tin capsules in an amount not to ex-ceed 0.07 percent of the weight of the capsule.
(2) As a moisture barrier on powders of ascorbic acid or its salts in an amount not to exceed 7 percent of the weight of the powder.
[42 FR 14491, Mar. 15, 1977, as amended at 49 FR 10104, Mar. 19, 1984]
Subpart D—Special Dietary and Nutritional Additives
§ 172.310 Aluminum nicotinate. Aluminum nicotinate may be safely
used as a source of niacin in foods for special dietary use. A statement of the concentration of the additive, ex-pressed as niacin, shall appear on the label of the food additive container or on that of any intermediate premix prepared therefrom.
§ 172.315 Nicotinamide-ascorbic acid complex.
Nicotinamide-ascorbic acid complex may be safely used in accordance with the following prescribed conditions:
(a) The additive is the product of the controlled reaction between ascorbic acid and nicotinamide, melting in the range 141 °C to 145 °C.
(b) It is used as a source of ascorbic acid and nicotinamide in multivitamin preparations.
§ 172.320 Amino acids. The food additive amino acids may
be safely used as nutrients added to foods in accordance with the following conditions:
(a) The food additive consists of one or more of the following individual amino acids in the free, hydrated or an-hydrous form or as the hydrochloride, sodium or potassium salts:
L-Alanine L-Arginine L-Asparagine L-Aspartic acid L-Cysteine L-Cystine L-Glutamic acid
VerDate Nov<24>2008 14:38 May 05, 2009 Jkt 217067 PO 00000 Frm 00056 Fmt 8010 Sfmt 8010 Y:\SGML\217067.XXX 217067cpric
e-se
wel
l on
PR
OD
PC
61 w
ith C
FR
Appendix C Page C1

47
Food and Drug Administration, HHS § 172.320
L-Glutamine Aminoacetic acid (glycine) L-Histidine L-Isoleucine L-Leucine L-Lysine DL-Methionine (not for infant foods) L-Methionine L-Phenylalanine L-Proline L-Serine L-Threonine L-Tryptophan L-Tyrosine L-Valine
(b) The food additive meets the fol-lowing specifications:
(1) As found in ‘‘Food Chemicals Codex,’’ National Academy of Sciences/ National Research Council (NAS/NRC), 3d Ed. (1981), which is incorporated by reference (Copies may be obtained from the National Academy Press, 2101 Con-stitution Ave. NW., Washington, DC 20418, or may be examined at the Na-tional Archives and Records Adminis-tration (NARA). For information on the availability of this material at NARA, call 202–741–6030, or go to: http:// www.archives.gov/federallregister/ codeloflfederallregulations/ ibrllocations.html.) for the following:
L-Alanine L-Arginine L-Arginine Monohydrochloride L-Cysteine Monohydrochloride L-Cystine Aminoacetic acid (glycine) L-Leucine DL-Methionine L-Methionine L-Tryptophan L-Phenylalanine L-Proline L-Serine L-Threonine Glutamic Acid Hydrochloride L-Isoleucine L-Lysine Monohydrochloride Monopotassium L-glutamate L-Tyrosine L-Valine
(2) As found in ‘‘Specifications and Criteria for Biochemical Compounds,’’ NAS/NRC Publication, 3rd Ed. (1972), which is incorporated by reference (Copies are available from the Center for Food Safety and Applied Nutrition (HFS–200), Food and Drug Administra-tion, 5100 Paint Branch Pkwy., College Park, MD 20740, or available for inspec-tion at the National Archives and
Records Administration (NARA). For information on the availability of this material at NARA, call 202–741–6030, or go to: http://www.archives.gov/ federallregister/ codeloflfederallregulations/ ibrllocations.html.) for the following:
L-Asparagine L-Aspartic acid L-Glutamine L-Histidine
(c) The additive(s) is used or intended for use to significantly improve the bi-ological quality of the total protein in a food containing naturally occurring primarily-intact protein that is consid-ered a significant dietary protein source, provided that:
(1) A reasonable daily adult intake of the finished food furnishes at least 6.5 grams of naturally occurring primarily intact protein (based upon 10 percent of the daily allowance for the ‘‘reference’’ adult male recommended by the Na-tional Academy of Sciences in ‘‘Rec-ommended Dietary Allowances,’’ NAS Publication No. 1694, 7th Ed. (1968), which is incorporated by reference. Copies are available from the Center for Food Safety and Applied Nutrition (HFS–200), Food and Drug Administra-tion, 5100 Paint Branch Pkwy., College Park, MD 20740, or available for inspec-tion at the National Archives and Records Administration (NARA). For information on the availability of this material at NARA, call 202–741–6030, or go to: http://www.archives.gov/ federallregister/ codeloflfederallregulations/ ibrllocations.html.
(2) The additive(s) results in a pro-tein efficiency ratio (PER) of protein in the finished ready-to-eat food equiv-alent to casein as determined by the method specified in paragraph (d) of this section.
(3) Each amino acid (or combination of the minimum number necessary to achieve a statistically significant in-crease) added results in a statistically significant increase in the PER as de-termined by the method described in paragraph (d) of this section. The min-imum amount of the amino acid(s) to achieve the desired effect must be used and the increase in PER over the pri-marily-intact naturally occurring pro-tein in the food must be substantiated
VerDate Nov<24>2008 14:38 May 05, 2009 Jkt 217067 PO 00000 Frm 00057 Fmt 8010 Sfmt 8010 Y:\SGML\217067.XXX 217067cpric
e-se
wel
l on
PR
OD
PC
61 w
ith C
FR
Appendix C Page C2

48
21 CFR Ch. I (4–1–09 Edition) § 172.325
as a statistically significant difference with at least a probability (P) value of less than 0.05.
(4) The amount of the additive added for nutritive purposes plus the amount naturally present in free and combined (as protein) form does not exceed the following levels of amino acids ex-pressed as percent by weight of the total protein of the finished food:
Percent by weight of total pro-tein (ex-
pressed as free amino
acid)
L-Alanine .............................................................. 6.1 L-Arginine ............................................................ 6.6 L-Aspartic acid (including L-asparagine) ............. 7.0 L-Cystine (including L-cysteine) .......................... 2.3 L-Glutamic acid (including L-glutamine) .............. 12.4 Aminoacetic acid (glycine) ................................... 3.5 L-Histidine ............................................................ 2.4 L-Isoleucine ......................................................... 6.6 L-Leucine ............................................................. 8.8 L-Lysine ............................................................... 6.4 L- and DL-Methionine .......................................... 3.1 L-Phenylalanine ................................................... 5.8 L-Proline .............................................................. 4.2 L-Serine ............................................................... 8.4 L-Threonine ......................................................... 5.0 L-Tryptophan ....................................................... 1.6 L-Tyrosine ............................................................ 4.3 L-Valine ................................................................ 7.4
(d) Compliance with the limitations concerning PER under paragraph (c) of this section shall be determined by the method described in sections 43.212– 43.216, ‘‘Official Methods of Analysis of the Association of Official Analytical Chemists,’’ 13th Ed. (1980), which is in-corporated by reference. Copies may be obtained from the AOAC INTER-NATIONAL, 481 North Frederick Ave., suite 500, Gaithersburg, MD 20877, or may be examined at the National Ar-chives and Records Administration (NARA). For information on the avail-ability of this material at NARA, call 202–741–6030, or go to: http:// www.archives.gov/federallregister/ codeloflfederallregulations/ ibrllocations.html. Each manufacturer or person employing the additive(s) under the provisions of this section shall keep and maintain throughout the period of his use of the additive(s) and for a minimum of 3 years there-after, records of the tests required by this paragraph and other records re-quired to assure effectiveness and com-pliance with this regulation and shall
make such records available upon re-quest at all reasonable hours by any of-ficer or employee of the Food and Drug Administration, or any other officer or employee acting on behalf of the Sec-retary of Health and Human Services and shall permit such officer or em-ployee to conduct such inventories of raw and finished materials on hand as he deems necessary and otherwise to check the correctness of such records.
(e) To assure safe use of the additive, the label and labeling of the additive and any premix thereof shall bear, in addition to the other information re-quired by the Act, the following:
(1) The name of the amino acid(s) contained therein including the spe-cific optical and chemical form.
(2) The amounts of each amino acid contained in any mixture.
(3) Adequate directions for use to provide a finished food meeting the limitations prescribed by paragraph (c) of this section.
(f) The food additive amino acids added as nutrients to special dietary foods that are intended for use solely under medical supervision to meet nu-tritional requirements in specific med-ical conditions and comply with the re-quirements of part 105 of this chapter are exempt from the limitations in paragraphs (c) and (d) of this section and may be used in such foods at levels not to exceed good manufacturing practices.
[42 FR 14491, Mar. 15, 1977; 42 FR 56728, Oct. 28, 1977, as amended at 47 FR 11836, Mar. 19, 1982; 49 FR 10104, Mar. 19, 1984; 54 FR 24897, June 12, 1989; 59 FR 14550, Mar. 29, 1994; 61 FR 14480, Apr. 2, 1996]
§ 172.325 Bakers yeast protein. Bakers yeast protein may be safely
used in food in accordance with the fol-lowing conditions:
(a) Bakers yeast protein is the insol-uble proteinaceous material remaining after the mechanical rupture of yeast cells of Saccharomyces cerevisiae and re-moval of whole cell walls by cen-trifugation and separation of soluble cellular materials.
(b) The additive meets the following specifications on a dry weight basis:
(1) Zinc salts less than 500 parts per million (ppm) as zinc.
(2) Nucleic acid less than 2 percent.
VerDate Nov<24>2008 14:38 May 05, 2009 Jkt 217067 PO 00000 Frm 00058 Fmt 8010 Sfmt 8010 Y:\SGML\217067.XXX 217067cpric
e-se
wel
l on
PR
OD
PC
61 w
ith C
FR
Appendix C Page C3

196
21 CFR Ch. I (4–1–10 Edition) § 107.100
may exist and so notifies the manufac-turer, withdrawal of a product’s ex-empt status shall be effective on the date of receipt of notification from the Director of the Center for Food Safety and Applied Nutrition. Additional or modified requirements, or the with-drawal of an exemption, apply only to those formulas that are manufactured after the compliance date. A postpone-ment of the compliance date may be granted for good cause.
(3) FDA may decide that withdrawal of an exemption is necessary when, on the basis of its review under paragraph (d)(1) of this section, it concludes that quality control procedures are not ade-quate to ensure that the formula con-tains all required nutrients, that devi-ations in nutrient levels are not sup-ported by generally accepted scientific, nutritional, or medical rationale, or that deviations from subpart B of this part are not necessary to provide ap-propriate directions for preparation and use of the infant formula, or that additional labeling information is nec-essary.
(4) FDA will use the following cri-teria in determining whether devi-ations from the requirements of this subpart are necessary and will ade-quately protect the public health:
(i) A deviation from the nutrient re-quirements of section 412(g) of the act or of regulations promulgated under section 412(a)(2) of the act is necessary to provide an infant formula that is ap-propriate for the dietary management of a specific disease, disorder, or med-ical condition;
(ii) For exempt infant formulas sub-ject to paragraph (b) of this section, a deviation from the quality control pro-cedures requirements of part 106 is nec-essary because of unusal or difficult technological problems in manufac-turing the infant formula; and
(iii) A deviation from the labeling re-quirements of subpart B of this part is necessary because label information, including pictograms and symbols re-quired by those regulations, could lead to inappropriate use of the product.
(e) Notification requirements. (1) Infor-mation required by paragraphs (b) and (c) of this section shall be submitted to Center for Food Safety and Applied Nu-trition (HFS–830), Food and Drug Ad-
ministration, 5100 Paint Branch Pkwy., College Park, MD 20740.
(2) The manufacturer shall promptly notify FDA when the manufacturer has knowledge (as defined in section 412(c)(2) of the act) that reasonably supports the conclusion that an exempt infant formula that has been processed by the manufacturer and that has left an establishment subject to the control of the manufacturer may not provide the nutrients required by paragraph (b) or (c) of this section, or when there is an exempt infant formula that may be otherwise adulterated or misbranded and if so adulterated or misbranded presents a risk of human health. This notification shall be made, by tele-phone, to the Director of the appro-priate FDA district office specified in part 5, subpart M of this chapter. After normal business hours (8 a.m. to 4:30 p.m.), the FDA emergency number, 301– 443–1240, shall be used. The manufac-turer shall send a followup written con-firmation to the Center for Food Safe-ty and Applied Nutrition (HFS–605), Food and Drug Administration, 5100 Paint Branch Pkwy., College Park, MD 20740, and to the appropriate FDA dis-trict office specified in part 5, subpart M of this chapter.
[50 FR 48187, Nov. 22, 1985, as amended at 61 FR 14479, Apr. 2, 1996; 66 FR 17358, Mar. 30, 2001; 66 FR 56035, Nov. 6, 2001; 67 FR 9585, Mar. 4, 2002; 69 FR 17291, Apr. 2, 2004]
Subpart D—Nutrient Requirements
§ 107.100 Nutrient specifications. (a) An infant formula shall contain
the following nutrients at a level not less than the minimum level specified and not more than the maximum level specified for each 100 kilocalories of the infant formula in the form pre-pared for consumption as directed on the container:
Nutrients Unit of measure-ment
Min-imum level
Max-imum level
Protein Grams 1 .8 4 .5 Fat do 3 .3 6 .0
Percent calories 30 54 Linoleic acid Milligrams 300 ..........
Percent calories 2 .7 ..........
Vitamins
Vitamin A International Units 250 750
VerDate Nov<24>2008 07:59 Apr 26, 2010 Jkt 220066 PO 00000 Frm 00206 Fmt 8010 Sfmt 8010 Y:\SGML\220066.XXX 220066erow
e on
DS
K5C
LS3C
1PR
OD
with
CF
R
Appendix C Page C4

197
Food and Drug Administration, HHS § 107.210
Nutrients Unit of measure-ment
Min-imum level
Max-imum level
Vitamin D do 40 100 Vitamin E do 0 .7 ..........Vitamin K Micrograms 4 ..........Thiamine (vitamin B1) do 40 ..........Riboflavin (vitamin B2) do 60 ..........Vitamin B6 do 35 ..........Vitamin B12 do 0 .15 ..........Niacin 1 do 250 ..........Folic acid (folacin) do 4 ..........Pantothenic acid do 300 ..........Biotin 2 do 1 .5 ..........Vitamin C (ascorbic
acid) Milligrams 8 ..........
Choline 2 do 7 ..........Inositol 2 do 4 ..........
Minerals
Calcium do 60 ..........Phosphorus do 30 ..........Magnesium do 6 ..........Iron do 0 .15 3 .0 Zinc do 0 .5 ..........Manganese Micrograms 5 ..........Copper Micrograms 60 ..........Iodine do 5 75 Sodium Milligrams 20 60 Potassium do 80 200 Chloride do 55 150
1 The generic term ‘‘niacin’’ includes niacin (nicotinic acid) and niacinamide (nicotinamide).
2 Required only for non-milk-based infant formulas.
In addition to the specifications estab-lished in the table in this paragraph for vitamins and minerals, the following also apply:
(b) Vitamin E shall be present at a level of at least 0.7 International Unit of vitamin E per gram of linoleic acid.
(c) Any vitamin K added shall be in the form of phylloquinone.
(d) Vitamin B6 shall be present at a level of at least 15 micrograms of vita-min B6 for each gram of protein in ex-cess of 1.8 grams of protein per 100 kilocalories of infant formula in the form prepared for consumption as di-rected on the container.
(e) The ratio of calcium to phos-phorus in infant formula in the form prepared for consumption as directed on the container shall be no less than 1.1 and not more than 2.0.
(f) Protein shall be present in an amount not to exceed 4.5 grams per 100 kilocalories regardless of quality, and not less than 1.8 grams per 100 kilocalories of infant formula in the form prepared for consumption as di-rected on the container when its bio-logical quality is equivalent to or bet-ter than that of casein. If the biologi-cal quality of the protein is less than
that of casein, the minimum amount of protein shall be increased proportion-ately to compensate for its lower bio-logical quality. For example, an infant formula containing protein with a bio-logical quality of 75 percent of casein shall contain at least 2.4 grams of pro-tein (1.8/0.75). No protein with a bio-logical quality less than 70 percent of casein shall be used.
[50 FR 45108, Oct. 30, 1985]
Subpart E—Infant Formula Recalls
SOURCE: 54 FR 4008, Jan. 27, 1989, unless otherwise noted.
§ 107.200 Food and Drug Administra-tion-required recall.
When the Food and Drug Administra-tion determines that an adulterated or misbranded infant formula presents a risk to human health, a manufacturer shall immediately take all actions nec-essary to recall that formula, extend-ing to and including the retail level, consistent with the requirements of this subpart.
§ 107.210 Firm-initiated product re-movals.
(a) If a manufacturer has determined to recall voluntarily from the market an infant formula that is not subject to § 107.200 but that otherwise violates the laws and regulations administered by the Food and Drug Administration (FDA) and that would be subject to legal action, the manufacturer, upon prompt notification to FDA, shall ad-minister such voluntary recall con-sistent with the requirements of this subpart.
(b) If a manufacturer has determined to withdraw voluntarily from the mar-ket an infant formula that is adulter-ated or misbranded in only a minor way and that would not be subject to legal action, such removal from the market is deemed to be a market with-drawal, as defined in § 7.3(j) of this chapter. As required by § 107.240(a), the manufacturer shall promptly notify FDA of such violative formula and may, but is not required to, conduct such market withdrawal consistent with the requirements of this subpart pertaining to product recalls.
VerDate Nov<24>2008 07:59 Apr 26, 2010 Jkt 220066 PO 00000 Frm 00207 Fmt 8010 Sfmt 8010 Y:\SGML\220066.XXX 220066erow
e on
DS
K5C
LS3C
1PR
OD
with
CF
R
Appendix C Page C5

CODEX STAN 72 – 1981 Page 1 of 21
Formerly CAC/RS 72-1972. Adopted as a world-wide Standard 1981.Amended 1983, 1985,1987. Revision 2007
STANDARD FOR INFANT FORMULA AND FORMULAS FOR SPECIAL MEDICAL PURPOSES INTENDED FOR INFANTS
CODEX STAN 72 – 1981
SECTION A: REVISED STANDARD FOR INFANT FORMULA
PREAMBLE
This standard is divided into two sections. Section A refers to Infant Formula, and Section B deals with Formulas for Special Medical Purposes Intended for Infants.
1. SCOPE
1.1 This section of the Standard applies to infant formula in liquid or powdered form intended for use, where necessary, as a substitute for human milk in meeting the normal nutritional requirements of infants.
1.2 This section of the Standard contains compositional, quality and safety requirements for Infant Formula.
1.3 Only products that comply with the criteria laid down in the provisions of this section of this Standard would be accepted for marketing as infant formula. No product other than infant formula may be marketed or otherwise represented as suitable for satisfying by itself the nutritional requirements of normal healthy infants during the first months of life.
1.4 The application of this section of the Standard should take into account the recommendations made in the International Code of Marketing of Breast-milk Substitutes (1981), the Global Strategy for Infant and Young Child Feeding and World Health Assembly resolution WHA54.2 (2001).
2. DESCRIPTION
2.1 Product Definition
2.1.1 Infant formula means a breast-milk substitute specially manufactured to satisfy, by itself, the nutritional requirements of infants during the first months of life up to the introduction of appropriate complementary feeding.
2.1.2 The product is so processed by physical means only and so packaged as to prevent spoilage and contamination under all normal conditions of handling, storage and distribution in the country where the product is sold.
2.2 Other Definitions
The term infant means a person not more than 12 months of age.
3. ESSENTIAL COMPOSITION AND QUALITY FACTORS
3.1 Essential Composition
3.1.1 Infant formula is a product based on milk of cows or other animals or a mixture thereof and/or other ingredients which have been proven to be suitable for infant feeding. The nutritional safety and adequacy of infant formula shall be scientifically demonstrated to support growth and development of infants. All ingredients and food additives shall be gluten-free.
Appendix C Page C6

CODEX STAN 72 – 1981 Page 2 of 21
3.1.2 Infant formula prepared ready for consumption in accordance with instructions of the manufacturer shall contain per 100 ml not less than 60 kcal (250 kJ) and not more than 70 kcal (295 kJ) of energy.
3.1.3 Infant formula prepared ready for consumption shall contain per 100 kcal (100 kJ) the following nutrients with the following minimum and maximum or guidance upper levels (GUL)1, as appropriate. The general principles for establishing these levels are identified in Annex II of this standard.
a) Protein2), 3), 4)
Unit Minimum Maximum GUL g/100 kcal 1.8 5), 6) 3.0 - g/100 kJ 0.45 5), 6) 0.7 -
2) For the purpose of this standard, the calculation of the protein content of the final product prepared ready for consumption should be based on N x 6.25, unless a scientific justification is provided for the use of a different conversion factor for a particular product. The protein levels set in this standard are based on a nitrogen conversion factor of 6.25. The value of 6.38 is generally established as a specific factor appropriate for conversion of nitrogen to protein in other milk products, and the value of 5.71 as a specific factor for conversion of nitrogen to protein in other soy products. 3) For an equal energy value the formula must contain an available quantity of each essential and semi-essential amino acid at least equal to that contained in the reference protein (breast-milk as defined in Annex I); nevertheless for calculation purposes, the concentrations of tyrosine and phenylalanine may be added together. The concentrations of methionine and cysteine may be added together if the ratio is less than 2:1; in the case that the ratio is between 2:1 and 3:1 the suitability of the formula has to be demonstrated by clinical testing. 4) Isolated amino acids may be added to Infant Formula only to improve its nutritional value for infants. Essential and semi-essential amino acids may be added to improve protein quality, only in amounts necessary for that purpose. Only L-forms of amino acids shall be used. 5) The minimum value applies to cows’ milk protein. For infant formula based on non-cows’ milk protein other minimum values may need to be applied. For infant formula based on soy protein isolate, a minimum value of 2.25 g/100 kcal (0.5 g/100 kJ) applies. 6) Infant formula based on non-hydrolysed milk protein containing less than 2 g protein/ 100 kcal and infant formula based on hydrolysed protein containing less than 2.25 g protein/ 100 kcal should be clinically evaluated.
b) Lipids Total fat 7, 8)
Unit Minimum Maximum GUL g/100 kcal 4.4 6.0 - g/100 kJ 1.05 1.4 -
7) Commercially hydrogenated oils and fats shall not be used in infant formula. 8) Lauric and myristic acids are constituents of fats, but combined shall not exceed 20% of total fatty acids. The content of trans fatty acids shall not exceed 3 % of total fatty acids. Trans fatty acids are endogenous components of milk fat. The acceptance of up to 3% of trans fatty acids is intended to allow for the use of milk fat in infant formulae. The erucic acid content shall not exceed 1% of total fatty acids. The total content of phospholipids should not exceed 300 mg/100 kcal (72 mg/100 kJ).
1 Guidance upper levels are for nutrients without sufficient information for a science-based risk assessment. These levels are values derived on the basis of meeting nutritional requirements of infants and an established history of apparent safe use. They may be adjusted based on relevant scientific or technological progress. The purpose of the GULs is to provide guidance to manufacturers and they should not be interpreted as goal values. Nutrient contents in infant formulas should usually not exceed the GULs unless higher nutrient levels cannot be avoided due to high or variable contents in constituents of infant formulas or due to technological reasons. When a product type or form has ordinarily contained lower levels than the GULs, manufacturers should not increase levels of nutrients to approach the GULs.
Appendix C Page C7

CODEX STAN 72 – 1981 Page 3 of 21
Linoleic acid Unit Minimum Maximum GUL mg/100 kcal 300 - 1400 mg/100 kJ 70 - 330
α-Linolenic acid Unit Minimum Maximum GUL mg/100 kcal 50 N.S.* - mg/100 kJ 12 N.S. -
*N.S. = not specified
Ratio linoleic/ α-linolenic acid
Min Max 5:1 15:1
c) Carbohydrates
Total carbohydrates9)
Unit Minimum Maximum GUL g/100 kcal 9.0 14.0 - g/100 kJ 2.2 3.3 -
9) Lactose and glucose polymers should be the preferred carbohydrates in formula based on cows’ milk protein and hydrolysed protein. Only precooked and/or gelatinised starches gluten-free by nature may be added to Infant Formula up to 30% of total carbohydrates and up to 2 g/100 ml.
Sucrose, unless needed, and the addition of fructose as an ingredient should be avoided in infant formula, because of potential life-threatening symptoms in young infants with unrecognised hereditary fructose intolerance.
d) Vitamins
Vitamin A Unit Minimum Maximum GUL µg RE10)/100 kcal 60 180 -
µg RE10)/100 kJ 14 43 - 10) expressed as retinol equivalents (RE). 1 µg RE = 3.33 IU Vitamin A = 1 µg all-trans retinol. Retinol contents shall be provided by preformed retinol, while any contents of carotenoids should not be included in the calculation and declaration of vitamin A activity.
Appendix C Page C8

CODEX STAN 72 – 1981 Page 4 of 21
Vitamin D3
Unit Minimum Maximum GUL µg11)/100 kcal 1 2.5 -
µg11)/100 kJ 0.25 0.6 - 11) Calciferol. 1 µg calciferol = 40 IU vitamin D
Vitamin E Unit Minimum Maximum GUL mg α-TE12)/100 kcal 0.513) - 5
mg α-TE12)/100 kJ 0.1213) - 1.2 12) 1 mg α-TE (alpha-tocopherol equivalent) = 1 mg d-α-tocopherol 13) Vitamin E content shall be at least 0.5 mg α-TE per g PUFA, using the following factors of equivalence to adapt the minimal vitamin E content to the number of fatty acid double bonds in the formula: 0.5 mg -TE/g linoleic acid (18:2 n-6); 0.75 α-TE/g α-linolenic acid (18:3 n-3); 1.0 mg α-TE/g arachidonic acid (20:4 n-6); 1.25 mg α-TE/g eicosapentaenoic acid (20:5 n-3); 1.5 mg α-TE/g docosahexaenoic acid (22:6 n-3).
Vitamin K Unit Minimum Maximum GUL µg/100 kcal 4 - 27
µg/100 kJ 1 - 6.5
Thiamin Unit Minimum Maximum GUL µg/100 kcal 60 - 300
µg/100 kJ 14 - 72
Riboflavin Unit Minimum Maximum GUL µg/100 kcal 80 - 500
µg/100 kJ 19 - 119
Niacin14)
Unit Minimum Maximum GUL µg/100 kcal 300 - 1500
µg/100 kJ 70 - 360 14) Niacin refers to preformed niacin.
Vitamin B6
Unit Minimum Maximum GUL µg/100 kcal 35 - 175
µg/100 kJ 8.5 - 45
Appendix C Page C9
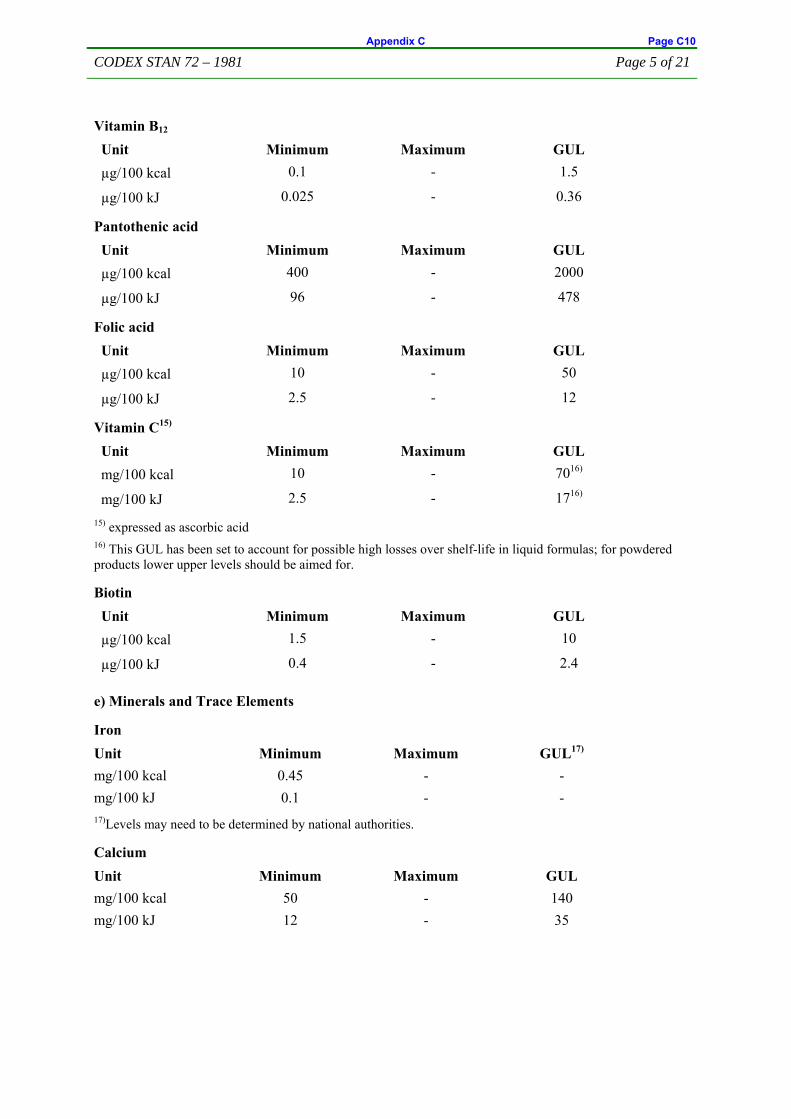
CODEX STAN 72 – 1981 Page 5 of 21
Vitamin B12
Unit Minimum Maximum GUL µg/100 kcal 0.1 - 1.5
µg/100 kJ 0.025 - 0.36
Pantothenic acid Unit Minimum Maximum GUL µg/100 kcal 400 - 2000
µg/100 kJ 96 - 478
Folic acid Unit Minimum Maximum GUL µg/100 kcal 10 - 50
µg/100 kJ 2.5 - 12
Vitamin C15)
Unit Minimum Maximum GUL mg/100 kcal 10 - 7016)
mg/100 kJ 2.5 - 1716)
15) expressed as ascorbic acid 16) This GUL has been set to account for possible high losses over shelf-life in liquid formulas; for powdered products lower upper levels should be aimed for.
Biotin Unit Minimum Maximum GUL µg/100 kcal 1.5 - 10
µg/100 kJ 0.4 - 2.4
e) Minerals and Trace Elements
Iron Unit Minimum Maximum GUL17)
mg/100 kcal 0.45 - - mg/100 kJ 0.1 - - 17)Levels may need to be determined by national authorities.
Calcium Unit Minimum Maximum GUL mg/100 kcal 50 - 140 mg/100 kJ 12 - 35
Appendix C Page C10

CODEX STAN 72 – 1981 Page 6 of 21
Phosphorus Unit Minimum Maximum GUL mg/100 kcal 25 - 10018)
mg/100 kJ 6 - 2418)
18) This GUL should accommodate higher needs with soy formula.
Ratio calcium/ phosphorus
Min Max 1:1 2:1
Magnesium Unit Minimum Maximum GUL mg/100 kcal 5 - 15 mg/100 kJ 1.2 - 3.6
Sodium Unit Minimum Maximum GUL mg/100 kcal 20 60 - mg/100 kJ 5 14 -
Chloride Unit Minimum Maximum GUL mg/100 kcal 50 160 - mg/100 kJ 12 38 -
Potassium Unit Minimum Maximum GUL mg/100 kcal 60 180 - mg/100 kJ 14 43 -
Manganese Unit Minimum Maximum GUL μg/100 kcal 1 - 100
μg/100 kJ 0.25 - 24
Iodine Unit Minimum Maximum GUL μg/100 kcal 10 - 60
μg/100 kJ 2.5 - 14
Selenium Unit Minimum Maximum GUL μg/100 kcal 1 - 9
μg/100 kJ 0.24 - 2.2
Appendix C Page C11

CODEX STAN 72 – 1981 Page 7 of 21
Copper 19)
Unit Minimum Maximum GUL μg/100 kcal 35 - 120
μg/100 kJ 8.5 - 29 19) Adjustment may be needed in these levels for infant formula made in regions with a high content of copper in the water supply.
Zinc Unit Minimum Maximum GUL mg/100 kcal 0.5 - 1.5 mg/100 kJ 0.12 - 0.36 f) Other Substances
Choline Unit Minimum Maximum GUL mg/100 kcal 7 - 50 mg/100 kJ 1.7 - 12
Myo-Inositol Unit Minimum Maximum GUL mg/100 kcal 4 - 40 mg/100 kJ 1 - 9.5
L-Carnitine Unit Minimum Maximum GUL mg/100 kcal 1.2 N.S. - mg/100 kJ 0.3 N.S. -
3.2 Optional ingredients
3.2.1 In addition to the compositional requirements listed under 3.1.3, other ingredients may be added in order to provide substances ordinarily found in human milk and to ensure that the formulation is suitable as the sole source of nutrition for the infant or to provide other benefits that are similar to outcomes of populations of breastfed babies.
3.2.2 The suitability for the particular nutritional uses of infants and the safety of these substances shall be scientifically demonstrated. The formula shall contain sufficient amounts of these substances to achieve the intended effect, taking into account levels in human milk.
3.2.3 The following substances may be added in conformity with national legislation, in which case their content per 100 kcal (100 kJ) in the Infant Formula ready for consumption shall not exceed:
Taurine Unit Minimum Maximum GUL mg/100 kcal - 12 - mg/100 kJ - 3 -
Appendix C Page C12

CODEX STAN 72 – 1981 Page 8 of 21
Total nucleotides
Levels may need to be determined by national authorities.
Docosahexaenoic Acid 20)
Unit Minimum Maximum GUL % of fatty acids - - 0.5 20) If docosahexaenoic acid (22:6 n-3) is added to infant formula, arachidonic acid (20:4 n-6) contents should reach at least the same concentration as DHA. The content of eicosapentaenoic acid (20:5 n-3), which can occur in sources of LC-PUFA, should not exceed the content of docosahexaenoic acid. National authorities may deviate from the above conditions, as appropriate for the nutritional needs.
3.2.4 Only L(+)lactic acid producing cultures may be used.
3.3 Fluoride
Fluoride should not be added to infant formula. In any case its level should not exceed 100 µg /100 kcal (24µg/100 kJ) in infant formula prepared ready for consumption as recommended by the manufacturer.
3.4 Vitamin Compounds and Mineral Salts
Vitamins and minerals added in accordance with Section 3.1.3 (d and e) and other nutrients added in accordance with 3.2.1 should be selected from the Advisory Lists of Mineral Salts and Vitamin Compounds for Use in Foods for Infants and Children (CAC/GL 10-1979).
3.5 Consistency and Particle Size
When prepared according to the label directions for use, the product shall be free of lumps and of large coarse particles and suitable for adequate feeding of young infants.
3.6 Purity Requirements
All ingredients shall be clean, of good quality, safe and suitable for ingestion by infants. They shall conform with their normal quality requirements, such as colour, flavour and odour.
3.7 Specific Prohibitions
The product and its component shall not have been treated by ionizing irradiation.
4. FOOD ADDITIVES
Only the food additives listed in this Section or in the Codex Advisory List of Mineral Salts and Vitamin Compounds for Use in Foods for Infants and Children (CAC/GL 10-1979) may be present in the foods described in section 2.1 of this Standard, as a result of carry-over from a raw material or other ingredient (including food additive) used to produce the food, subject to the following conditions:
a) The amount of the food additive in the raw materials or other ingredients (including food additives) does not exceed the maximum level specified; and
b) The food into which the food additive is carried over does not contain the food additive in greater quantity than would be introduced by the use of the raw materials or ingredients under good manufacturing practice, consistent with the provisions on carry-over in the Preamble of the General Standard for Food Additives (CAC/STAN 192-1995).
Appendix C Page C13

CODEX STAN 72 – 1981 Page 9 of 21
The following food additives are acceptable for use in the preparation of infant formula, as described in Section 2.1 of this Standard (in 100 ml of product, ready for consumption prepared following manufacturer’s instructions, unless otherwise indicated):
INS Additive Maximum level in 100 ml of the product ready for consumption
4.1 Thickeners
412 Guar gum 0.1 g in liquid formulas containing hydrolysed protein
410 Carob bean gum (Locust bean gum)
0.1 g in all types of infant formula
1412 Distarch phosphate
1414 Acetylated distarch phosphate
1413 Phosphated distarch phosphate
1440 Hydroxypropyl starch
0.5 g singly or in combination in soy-based infant formula only
2.5 g singly or in combination in hydrolyzed protein- and/or amino acid based infant formula only
407 Carrageenan2 0.03 g in regular milk-and soy-based liquid infant formula only
0.1 g in hydrolysed protein- and/or amino acid based liquid infant formula only
4.2 Emulsifiers
322 Lecithins 0.5 g in all types of infant formula22)
471 Mono- and diglycerides 0.4 g in all types of infant formula22)
4.3 Acidity Regulators
524 Sodium hydroxide 0.2 g singly or in combination and within the limits for sodium, potassium and calcium in section 3.1.3 (e) in all types of infant formula
500ii Sodium hydrogen carbonate
500i Sodium carbonate
525 Potassium hydroxide
501ii Potassium hydrogen carbonate
501i Potassium carbonate
526 Calcium hydroxide
0.2 g singly or in combination and within the limits for sodium, potassium and calcium in section 3.1.3 (e) in all types of infant formula
270 L(+) lactic acid Limited by GMP in all types of infant formula
2 Not endorsed by the 39th Session of the CCFA. JECFA evaluation is pending. national authorities may restrict its use until JECFA evaluation has been completed. 22) If more than one of the substances INS 322, 471 are added the maximum level for each of those substances is lowered with the relative part as present of the other substances
Appendix C Page C14

CODEX STAN 72 – 1981 Page 10 of 21
INS Additive Maximum level in 100 ml of the product ready for consumption
330 Citric acid Limited by GMP in all types of infant formula
331i Sodium dihydrogen citrate Limited by GMP in all types of infant formula
331iii Trisodium citrate Limited by GMP in all types of infant formula
332 Potassium citrate Limited by GMP in all types of infant formula
4.4 Antioxidants
307b Mixed tocopherol concentrate
1 mg in all types of infant formula singly or in combination
304i Ascorbyl palmitate 1 mg in all types of infant formula singly or in combination
4.9 Packaging Gases
290 Carbon dioxide
941 Nitrogen
GMP
5. CONTAMINANTS
5.1 Pesticide Residues
The product shall be prepared with special care under good manufacturing practices, so that residues of those pesticides which may be required in the production, storage or processing of the raw materials or the finished food ingredient do not remain, or, if technically unavoidable, are reduced to the maximum extent possible.
5.2 Other Contaminants
The product shall not contain contaminants or undesirable substances (e.g. biologically active substances) in amounts which may represent a hazard to the health of the infant. The product covered by the provisions of the Standard shall comply with those maximum residue limits and maximum levels established by the Codex Alimentarius Commission.
Maximum level
Lead 0.02 mg/kg (in the ready-to-use product)
6. HYGIENE
6.1 It is recommended that the product covered by the provisions of this standard be prepared and handled in accordance with the appropriate sections of the Recommended International Code of Practice - General Principles of Food Hygiene (CAC/RCP 1-1969), and other relevant Codex texts such as the Recommended International Code of Hygienic Practice for Foods for Infants and Children (CAC/RCP 21-1979).
6.2 The products should comply with any microbiological criteria established in accordance with the Principles for the Establishment and Application of Microbiological Criteria for Foods (CAC/GL 21-1997).
Appendix C Page C15
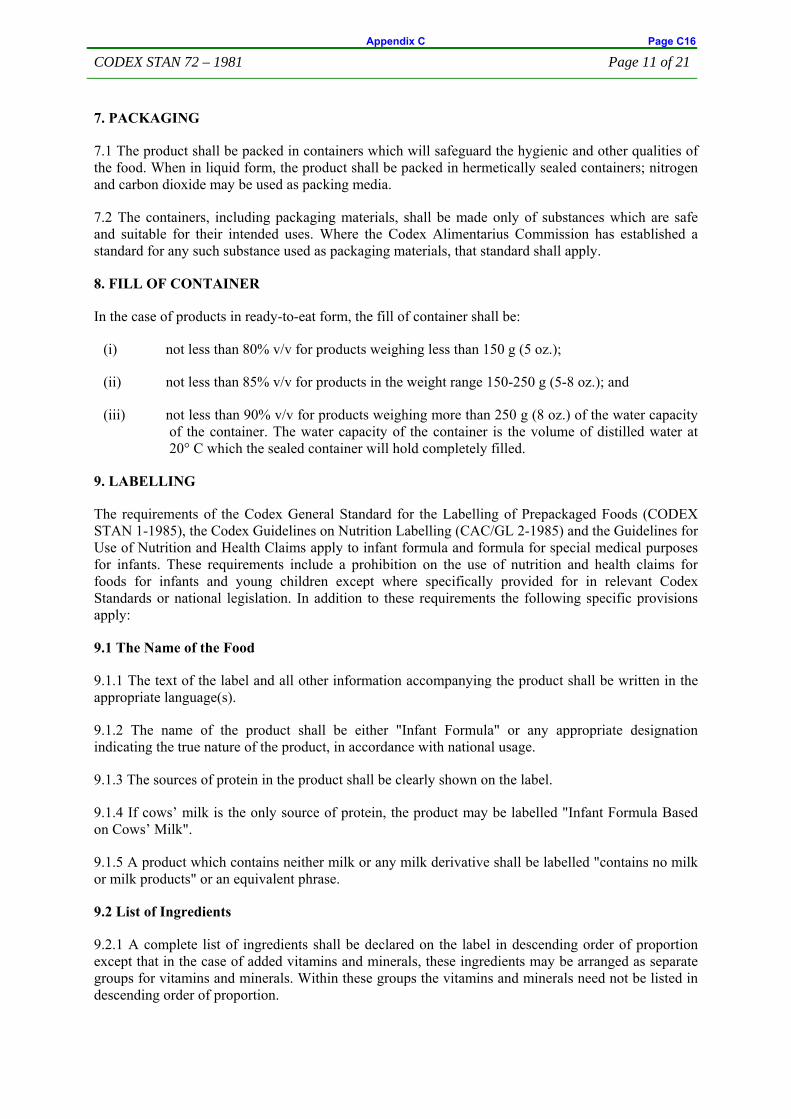
CODEX STAN 72 – 1981 Page 11 of 21
7. PACKAGING
7.1 The product shall be packed in containers which will safeguard the hygienic and other qualities of the food. When in liquid form, the product shall be packed in hermetically sealed containers; nitrogen and carbon dioxide may be used as packing media.
7.2 The containers, including packaging materials, shall be made only of substances which are safe and suitable for their intended uses. Where the Codex Alimentarius Commission has established a standard for any such substance used as packaging materials, that standard shall apply.
8. FILL OF CONTAINER
In the case of products in ready-to-eat form, the fill of container shall be:
(i) not less than 80% v/v for products weighing less than 150 g (5 oz.);
(ii) not less than 85% v/v for products in the weight range 150-250 g (5-8 oz.); and
(iii) not less than 90% v/v for products weighing more than 250 g (8 oz.) of the water capacity of the container. The water capacity of the container is the volume of distilled water at 20° C which the sealed container will hold completely filled.
9. LABELLING
The requirements of the Codex General Standard for the Labelling of Prepackaged Foods (CODEX STAN 1-1985), the Codex Guidelines on Nutrition Labelling (CAC/GL 2-1985) and the Guidelines for Use of Nutrition and Health Claims apply to infant formula and formula for special medical purposes for infants. These requirements include a prohibition on the use of nutrition and health claims for foods for infants and young children except where specifically provided for in relevant Codex Standards or national legislation. In addition to these requirements the following specific provisions apply:
9.1 The Name of the Food
9.1.1 The text of the label and all other information accompanying the product shall be written in the appropriate language(s).
9.1.2 The name of the product shall be either "Infant Formula" or any appropriate designation indicating the true nature of the product, in accordance with national usage.
9.1.3 The sources of protein in the product shall be clearly shown on the label.
9.1.4 If cows’ milk is the only source of protein, the product may be labelled "Infant Formula Based on Cows’ Milk".
9.1.5 A product which contains neither milk or any milk derivative shall be labelled "contains no milk or milk products" or an equivalent phrase.
9.2 List of Ingredients
9.2.1 A complete list of ingredients shall be declared on the label in descending order of proportion except that in the case of added vitamins and minerals, these ingredients may be arranged as separate groups for vitamins and minerals. Within these groups the vitamins and minerals need not be listed in descending order of proportion.
Appendix C Page C16

CODEX STAN 72 – 1981 Page 12 of 21
9.2.2 The specific name shall be declared for ingredients of animal or plant origin and for food additives. In addition, appropriate class names for these ingredients and additives may be included on the label.
9.3 Declaration of Nutritive Value
The declaration of nutrition information shall contain the following information which should be in the following order:
a) the amount of energy, expressed in kilocalories (kcal) and/or kilojoules (kJ), and the number of grammes of protein, carbohydrate and fat per 100 grammes or per 100 milliliters of the food as sold as well as per 100 milliliters of the food ready for use, when prepared according to the instructions on the label.
b) the total quantity of each vitamin, mineral, choline as listed in paragraph 3.1.3 and any other ingredient as listed in paragraph 3.2 of this Standard per 100 grammes or per 100 milliliters of the food as sold as well as per 100 milliliters of the food ready for use, when prepared according to the instructions on the label.
c) In addition, the declaration of nutrients in a) and b) per 100 kilocalories (or per 100 kilojoules) is permitted.
9.4 Date Marking and Storage Instructions
9.4.1 The date of minimum durability (preceded by the words "best before") shall be declared by the day, month and year in uncoded numerical sequence except that for products with a shelf-life of more than three months, the month and year will suffice. The month may be indicated by letters in those countries where such use will not confuse the consumer.
In the case of products requiring a declaration of month and year only, and the shelf-life of the product is valid to the end of a given year, the expression "end (stated year)" may be used as an alternative.
9.4.2 In addition to the date, any special conditions for the storage of the food shall be indicated if the validity of the date depends thereon.
Where practicable, storage instructions shall be in close proximity to the date marking.
9.5 Information for Use
9.5.1 Products in liquid form may be used either directly or in the case of concentrated liquid products, must be prepared with water that is safe or has been rendered safe by previous boiling before feeding, according to directions for use. Products in powder form should be reconstituted with water that is safe or has been rendered safe by previous boiling for preparation. Adequate directions for the appropriate preparation and handling should be in accordance with Good Hygienic Practice.
9.5.2 Adequate directions for the appropriate preparations and use of the product, including its storage and disposal after preparation, i.e. that formula remaining after feeding should be discarded, shall appear on the label and in any accompanying leaflet.
9.5.3 The label shall carry clear graphic instructions illustrating the method of preparation of the product.
9.5.4 The directions should be accompanied by a warning about the health hazards of inappropriate preparation, storage and use.
Appendix C Page C17
CODEX STAN 72 – 1981 Page 13 of 21
9.5.5 Adequate directions regarding the storage of the product after the container has been opened, shall appear on the label and in any accompanying leaflet.
9.6 Additional Labelling Requirements
9.6.1 Labels should not discourage breastfeeding. Each container label shall have a clear, conspicuous and easily readable message which includes the following points:
a) the words "important notice" or their equivalent;
b) the statement "Breast milk is the best food for your baby" or a similar statement as to the superiority of breastfeeding or breast milk;
c) a statement that the product should only be used on advice of a independent health worker as to the need for its use and the proper method of use.
9.6.2 The label shall have no pictures of infants and women nor any other picture or text which idealizes the use of infant formula.
9.6.3 The terms "humanized", "maternalized" or other similar terms shall not be used.
9.6.4 Information shall appear on the label to the effect that infants should receive complementary foods in addition to the formula, from an age that is appropriate for their specific growth and development needs, as advised by an independent health worker, and in any case from the age over six months.
9.6.5 The products shall be labelled in such a way as to avoid any risk of confusion between infant formula, follow-up formula, and formula for special medical purposes.
10. METHODS OF ANALYSIS AND SAMPLING3
3 To be finalized.
Appendix C Page C18

CODEX STAN 72 – 1981 Page 14 of 21
Annex I Essential and semi-essential amino acids in breast milk* For the purpose of this Standard the essential and semi-essential amino acids in human milk from published studies which report measurements of the total nitrogen content and/or the calculation method of the protein content, expressed as mg per g of nitrogen and as mg per 100 kcal are listed. The average level of an amino acid (mg per g of nitrogen) from each study was used to calculate the corresponding amino acid content per 100 kcal of an infant formula with the minimum protein content of 1.8 g/ 100 kcal accepted in this Standard (mg amino acid/g nitrogen in breast-milk divided by the nitrogen conversion factor of 6.25 and multiplied by 1.8). The mean of the sums of the average amino acid levels from all studies was converted in the same manner to the average amounts of an amino acid per g of protein (total nitrogen x 6.25) and per 100 kcal of energy (columns 19 and 20 of the table). National authorities may use all of the listed values.
* Adapted from Koletzko B, Baker S, Cleghorn G, et al, Global standard for the composition of infant formula: Recommendations of ESPGHAN coordinated international expert group. J Pediatr Gastroenterol Nutr. 2005;41:584-599.
Lönnerdal &Forsum (1985)
Darragh & Moughan (1998)
Bindels & Harzer (1985)
Janas et al. (1987)
Villalpando et al. (1998) Räihä et al. (2002) mod Nayman et al. (1979)
Yonekubo et al. (1991)
24 hours, pooled at 4-6 months
Pooled banked milk at 4-16 weeks
Pooled over 20 days at 10-14 weeks (n=20)
24 hours, pooled at 5 weeks (n=10)
24 hours, pooled at 8 weeks (n=10) Mexico
(n=40) Houston (n=40)
Pooled banked milk at >1 month
Milk at 21 days –2 months
Mean of all amino acids contents
mg amino acid per
g N 100 kcal
g N 100 kcal
g N 100 kcal
g N 100 kcal
g N 100 kcal
g N 100 kcal
g N 100 kcal
g N 100 kcal
g nitro-gen
g pro-tein
100 kcal
Cysteine 111
32 173 50 108 31 101 29 167 48 134 39 133 38 118 34 131 21 38
Histidine 111
32 156 45 255 73 112 32 112 32 108 31 122 35 150 43 141 23 41
Appendix C Page C19

CODEX STAN 72 – 1981 Page 15 of 21
Lönnerdal &Forsum (1985)
Darragh & Moughan (1998)
Bindels & Harzer (1985)
Janas et al. (1987)
Villalpando et al. (1998) Räihä et al. (2002) mod Nayman et al. (1979)
Yonekubo et al. (1991)
24 hours, pooled at 4-6 months
Pooled banked milk at 4-16 weeks
Pooled over 20 days at 10-14 weeks (n=20)
24 hours, pooled at 5 weeks (n=10)
24 hours, pooled at 8 weeks (n=10) Mexico
(n=40) Houston (n=40)
Pooled banked milk at >1 month
Milk at 21 days –2 months
Mean of all amino acids contents
mg amino acid per
g N 100 kcal
g N 100 kcal
g N 100 kcal
g N 100 kcal
g N 100 kcal
g N 100 kcal
g N 100 kcal
g N 100 kcal
g nitro-gen
g pro-tein
100 kcal
Isoleucine 242
70 333 96 376 108 306 88 292 84 331 95 300 86 374 108 319 51 92
Leucine 457
132 598 172 713 205 611 176 528 152 541 156 572 165 667 192 586 94 169
Lysine 314
90 406 117 522 150 365 105 366 105 408 118 361 104 421 121 395 63 114
Methionine
78 22 90 26 89 26 73 21 99 29 76 22 83 24 92 26 85 14 24
Phenyl-alanine
153 44 243 70 344 99 183 53 440 127 439 126 217 62 240 69 282 45 81
Threonine 217
62 316 91 344 99 251 72 248 71 242 70 256 74 269 77 268 43 77
Tryptophan NA NA 172 50 79 23 112 32 89 26 111 32 122 35 114 18 33
Tyrosine 201 58 241 69 369 106 191 55 292 84 299 86 233 67 249 72 259 42 75
Appendix C Page C20

CODEX STAN 72 – 1981 Page 16 of 21
Lönnerdal &Forsum (1985)
Darragh & Moughan (1998)
Bindels & Harzer (1985)
Janas et al. (1987)
Villalpando et al. (1998) Räihä et al. (2002) mod Nayman et al. (1979)
Yonekubo et al. (1991)
24 hours, pooled at 4-6 months
Pooled banked milk at 4-16 weeks
Pooled over 20 days at 10-14 weeks (n=20)
24 hours, pooled at 5 weeks (n=10)
24 hours, pooled at 8 weeks (n=10) Mexico
(n=40) Houston (n=40)
Pooled banked milk at >1 month
Milk at 21 days –2 months
Mean of all amino acids contents
mg amino acid per
g N 100 kcal
g N 100 kcal
g N 100 kcal
g N 100 kcal
g N 100 kcal
g N 100 kcal
g N 100 kcal
g N 100 kcal
g nitro-gen
g pro-tein
100 kcal
Valine 253 73 327 94 376 108 267 77 286 82 331 95 317 91 364 105 315 50 90
References
Bindels JG, Harzer G (1985) Aminosäuren- und Proteinzusammensetzung der Frauenmilch im Verlauf der Laktation. Ernährungs-Umschau 32: 223-224
Darragh AJ, Moughan PJ (1998) The amino acid composition of human milk corrected for amino acid digestibility. Br. J. Nutr. 80: 25-34
Janas LM, Picciano MF, Hatch TF (1987) Indices of protein metabolism in term infants fed either human milk or formulas with reduced protein concentration and various whey/casein ratios. J. Pediatr. 110: 838-848
Lönnerdal B, Forsum E (1985) Casein content of human milk. Am. J. Clin. Nutr. 41: 113-120
Räihä NCR, Fazzolari-Nesci A, Cajozzo C, Puccio G, Monestier A, Moro G, Minoli I, Haschke-Becher E, Bachmann C, Van't Hof M, Carrié Fässler A-L, Haschke F (2002) Whey predominant, whey modified infant formula with protein/energy ratio of 1.8 g/100 kcal: adequate and safe for term infants from birth to four months. J. Pediatr. Gastroenterol. Nutr. 35: 275-281
Villalpando S, Butte NF, Flores-Huerta S, Thotathuchery M (1998) Qualitative analysis of human milk produced by women consuming a maize-predominant diet typical of rural Mexico. Ann. Nutr. Metab. 42: 23-32
Yonekubo A, Onoda T, Humikara M, Hudohta K, Yamamoto Y. (1989) Total and free amino acid composition of the Japanese breast milk. J Jap Soc Nutr Food Sci 42: 194
Appendix C Page C21

CODEX STAN 72 – 1981 Page 17 of 21
Annex II
GENERAL PRINCIPLES FOR ESTABLISHING MINIMUM AND MAXIMUM VALUES FOR THE ESSENTIAL COMPOSITION OF INFANT FORMULA
1. The goal of establishing minimum and maximum values is to provide safe and nutritionally adequate infant formula products that meet the normal nutritional requirements of infants.
2. A nutritionally adequate infant formula will promote growth and development consistent with science based standards and meet the nutritional requirements of infants when fed as a sole source of nutrition during the first months of life up to the introduction of appropriate complementary feeding.
3. The values to be established are based on an independent evaluation, in particular of the scientific evidence of the amounts needed to meet the nutritional requirements of infants, considering relevant human infant studies and the composition of breast-milk.
4. In addition to the principles set out in No. 3, when setting minimum and maximum values, consideration will also be given to the safety of such values.
For nutrients with a documented risk of adverse health effects the upper levels to be taken into account will be determined using a science-based risk assessment approach. Where scientific data are not sufficient for a science-based risk assessment, consideration should be given to an established history of apparently safe use of the nutrient in infants, as appropriate. Values derived on the basis of meeting the nutritional requirements of infants and an established history of apparently safe use should be considered as interim guidance upper levels. The approach to setting maximum and upper guidance values shall be made transparent and comprehensible.
5. When establishing minimum and maximum amounts, the following should also be taken into account:
a) bioavailability, processing losses and shelf-life stability from the ingredients and formula matrix, b) total levels of a nutrient in infant formula, taking into account both naturally occurring nutrients in the ingredients and added nutrients, c) the inherent variability of nutrients in ingredients and in water that may be added to the infant formula during manufacture.
6. Overages for individual nutrients, as appropriate, to ensure that the required minimum levels are met throughout the shelf-life of the formula, will be included in the maximum value.
7. In establishing minimum or maximum amounts of nutrients per 100 kcal (or per 100 kJ) of infant formula based on consideration of reference values for the nutrients expressed as units per daily intake or per kilogram of body weight, the following assumptions will be considered:
a) The mean intake of prepared formula for infants from birth to six months of age is 750 ml per day, and b) a representative body weight for an infant over this period is 5 kg, and c) a representative caloric intake of an infant over this period is 500 kcal per day (or 100 kcal/kg/day).
Modifications of the approach may be needed when there is justification for deviating from one or more of these assumptions with regard to the specific formula product or specific infant population group.
Appendix C Page C22

CODEX STAN 72 – 1981 Page 18 of 21
SECTION B: FORMULA FOR SPECIAL MEDICAL PURPOSES INTENDED FOR INFANTS
1. SCOPE
1.1 This section of the Standard applies to Formula for Special Medical Purposes Intended for Infants in liquid or powdered form intended for use, where necessary, as a substitute for human milk or infant formula in meeting the special nutritional requirements arising from the disorder, disease or medical condition for whose dietary management the product has been formulated.
1.2 This section of the Standard contains compositional, quality, labelling and safety requirements for Formula for Special Medical Purposes Intended for Infants.
1.3 Only products that comply with the criteria laid down in the provisions of this section of this standard would be accepted for marketing as formula for special medical purposes intended for infants.
1.4 The application of this section of the Standard should take into account, as appropriate for the products to which the section applies and the special needs of the infants for whom they are intended, the recommendations made in the International Code of Marketing of Breast-milk Substitutes (1981), the Global Strategy for Infant and Young Child Feeding and World Health Assembly resolution WHA54.2 (2001).
2. DESCRIPTION
2.1 Product definition
2.1.1 Formula for Special Medical Purposes Intended for Infants means a substitute for human milk or infant formula that complies with Section 2, Description, of the Codex Standard for the Labelling of and Claims for Foods for Special Medical Purposes (CODEX STAN 180-1991) and is specially manufactured to satisfy, by itself, the special nutritional requirements of infants with specific disorders, diseases or medical conditions during the first months of life up to the introduction of appropriate complementary feeding.
2.1.2
See Section A 2.1.2
2.2 Other Definitions
See Section A 2.2
3. ESSENTIAL COMPOSITION AND QUALITY FACTORS
3.1 Essential Composition
3.1.1. Formula for Special Medical Purposes intended for Infants is a product based on ingredients based of animal, plant and/or synthetic origin suitable for human consumption. All ingredients and food additives shall be gluten-free.
3.1.2 The composition of Formula for Special Medical Purposes Intended for Infants shall be based on sound medical and nutritional principles. The nutritional safety and adequacy of the formula shall be scientifically demonstrated to support growth and development in the infants for whom it is intended,
Appendix C Page C23

CODEX STAN 72 – 1981 Page 19 of 21
as appropriate for the specific products and indications. Their use shall be demonstrated by scientific evidence to be beneficial in the dietary management of the infants for whom it is intended.
3.1.3 The energy content and nutrient composition of Formula for Special Medical Purposes intended for infants shall be based on the requirements for infant formula as given in sections A 3.1.2 and A 3.1.3, except for the compositional provisions which must be modified to meet the special nutritional requirements arising from the disease(s), disorder(s) or medical condition(s) for whose dietary management the product is specifically formulated, labelled and presented.
3.1.4 In addition to the requirements in 3.1.3 the following requirements shall also be taken into account, where appropriate:
Chromium Unit Minimum Maximum GUL μg/100 kcal 1.5 - 10
μg/100 kJ 0.4 - 2.4
Molybdenum Unit Minimum Maximum GUL μg/100 kcal 1.5 - 10
μg/100 kJ 0.4 - 2.4
3.2 Optional ingredients
3.2.1 In addition to the compositional requirements listed under 3.1.3, other ingredients may be added in order to provide substances ordinarily found in human milk or required to ensure that the formulation is suitable as the sole source of nutrition for the infant and for the dietary management of his/her disease, disorder or medical condition.
3.2.2 The suitability for the intended special medical purpose, the suitability for the particular nutritional use of infants and the safety of these substances shall be scientifically demonstrated. The formula shall contain sufficient amounts of these substances to achieve the intended effect.
3.2.3 Only L(+)lactic acid producing cultures may be used in Formulas for Special Medical Purposes for infants if shown to be safe and appropriate for use in these vulnerable populations.
3.3 Vitamin Compounds and Mineral Salts
See Section A 3.4
3.4 Consistency and Particle Size
See Section A 3.5
3.5 Purity Requirements
See Section A 3.6
3.6 Specific Prohibitions
See Section A 3.7
Appendix C Page C24

CODEX STAN 72 – 1981 Page 20 of 21
4. FOOD ADDITIVES
See Section A 4.
5. CONTAMINANTS
See Section A 5.
6. HYGIENE
See Section A 6.
7. PACKAGING
See Section A 7.
8. FILL OF CONTAINER
See Section A 8.
9. LABELLING
See introductory paragraph of Section A 9.
9.1 The Name of the Food
9.1.1 See Section A 9.1.1
9.1.2 The name of the product shall be "Formula for Special Medical Purposes Intended for Infants" or any appropriate designation indicating the true nature of the product, in accordance with national usage.
9.1.3 If cows’ milk is the only source of protein, the product may be labelled "Formula for Special Medical Purposes Intended for Infants Based on Cows’ Milk".
9.2 List of Ingredients
See Section A 9.2
9.3 Declaration of Nutritive Value
Formula for Special Medical Purposes Intended for Infants shall be labelled with complete nutrition labelling according to Section 4.2 of Codex Standard for the Labelling of and Claims for Foods for Special Medical Purposes (CODEX STAN 180-1991).
9.4 Date Marking and Storage Instructions
See Section A 9.4
9.5 Information for Use
See Section A 9.5
Appendix C Page C25

CODEX STAN 72 – 1981 Page 21 of 21
9.6 Additional Labelling Requirements
9.6.1 Formula for Special Medical Purposes Intended for Infants shall be labelled with the additional information as specified in Sections 4.4.1, 4.4.3, 4.4.4, 4.5.1 and 4.5.5 of CODEX STAN 180-1991.
9.6.2 A prominent statement indicating that the product is intended as the sole source of nutrition shall appear on the label.
9.6.3 In addition, the information specified in Sections 4.5.2, 4.5.3 and 4.5.6 of CODEX STAN 180-1991 shall be included on the label or be provided separately from the package.
9.6.4 Labels and information provided separately from the package should not discourage breastfeeding, unless breastfeeding is contraindicated on medical grounds for the disease(s), disorder(s) or medical condition(s) for which the product is intended.
9.6.5
See Section A 9.6.5
10. Methods of Analysis
See Section A 10.
Appendix C Page C26

Appendix D Page D1

MATERIAL SAFETY DATA SHEET L-METHIONINE USP/FCC
Material no.
Specification 140323
Order Number
Version 2.8 / US Revision date 08/27/2011 Print Date 09/28/2011 Page 1 / 7
MSDS-US (R11/011) / 8/27/2011 2:06
1. IDENTIFICATION OF THE SUBSTANCE/PREPARATION AND OF THE COMPANY/UNDERTAKING
For Food, Drug or Cosmetic Use Only
Product information Trade name : L-METHIONINE USP/FCC Use of the Substance / Preparation
: Pharmaceutical intermediate
Company : Evonik Degussa Corporation USA 379 Interpace Parkway Parsippany,NJ 07054 USA
Telephone : 973-541-8000
Telefax : 973-541-8040
US: CHEMTREC EMERGENCY NUMBER
: 800-424-9300
CANADA: CANUTEC EMERGENCY NUMBER
: 613-996-6666
Product Regulatory Services : 973-541-8060
2. HAZARDS IDENTIFICATION
*** EMERGENCY OVERVIEW ***
Form-crystalline Color-white Odor-Mild, characteristic odor. Dust may be irritating to respiratory tract. Fine dust, which may be formed through abrasion during transport or handling, can form explosive mixtures with air
POTENTIAL HEALTH EFFECTS
Eye contact
Possibly irritating. Skin Contact
Not expected to be absorbed through skin. Inhalation
May cause irritation to the respiratory tract. Ingestion
Regarded as essentially non-toxic by ingestion.
Appendix E Page E1

MATERIAL SAFETY DATA SHEET L-METHIONINE USP/FCC
Material no.
Specification 140323
Order Number
Version 2.8 / US Revision date 08/27/2011 Print Date 09/28/2011 Page 2 / 7
MSDS-US (R11/011) / 8/27/2011 2:06
3. COMPOSITION/INFORMATION ON INGREDIENTS
Other information
This product does not contain any components considered to be health hazards under the OSHA Hazard Communication Standard 29 CFR 1910.1200 or under the WHMIS Controlled Product Regulations in Canada.
4. FIRST AID MEASURES
Inhalation
If inhaled, remove to fresh air. If breathing is difficult, give oxygen. If unconscious, evaluate the need for artificial respiration. Get immediate medical attention.
Skin contact
Wash with water and soap as a precaution.
Eye contact
In case of contact, immediately flush eyes with plenty of water. Obtain medical attention if irritation develops.
Ingestion
If swallowed, rinse mouth with water, then drink large quantities of water to rinse throat and dilute stomach contents. Never give anything by mouth to an unconcious person. Consult a physician immediately.
5. FIRE-FIGHTING MEASURES
Suitable extinguishing media
Use water spray or fog, foam, dry chemical or CO2.
Specific hazards during fire fighting
In the case of fire, the following hazardous smoke fumes may be produced: flammable smouldering gases nitrogen oxides (NOx) Sulphur oxides In the event of fire and/or explosion do not breathe fumes.
Special protective equipment for fire-fighters
As in any fire, wear self-contained positive-pressure breathing apparatus, (MSHA/NIOSH approved or equivalent) and full protective gear.
Further information
Avoid dust formation.
6. ACCIDENTAL RELEASE MEASURES
Environmental precautions
Obey relevant local, state, provincial and federal laws and regulations. Do not contaminate any lakes, streams, ponds, groundwater or soil.
Appendix E Page E2

MATERIAL SAFETY DATA SHEET L-METHIONINE USP/FCC
Material no.
Specification 140323
Order Number
Version 2.8 / US Revision date 08/27/2011 Print Date 09/28/2011 Page 3 / 7
MSDS-US (R11/011) / 8/27/2011 2:06
Methods for cleaning up
Collect material and place in a disposal container.
Use cleaning techniques that do not generate dust clouds if ignition sources are present.
Dusts can form explosive mixtures with air.
Use only vacuum cleaners approved for combustible dust collection.
Additional advice
If dust is present, control smoking, open flames, sparks, static electricity and friction heat.
7. HANDLING AND STORAGE
Handling
Safe handling advice
Minimize dust generation and accumulation. May form flammable dust-air mixtures. Avoid breathing dust.
Advice on protection against fire and explosion
Prevent the generation of dust clouds, since dusts can form explosive mixtures with air. If dust forms, remove all sources of ignition and static discharge. Do not allow dust to collect in open or hidden areas. In product transfer systems involving the use of air as a fluidizing medium, the user must be sure to dissipate static charge by careful bonding and grounding of all equipment and personnel involved in fluid transfer, with continuity checks to prove effectiveness. Additional guidance on fire and explosion protection may be found in the consensus standard NFPA 654 for chemical dusts.
Storage
Requirements for storage areas and containers
Keep away from heat. Store in a cool, dry place. Keep container closed when not in use.
8. EXPOSURE CONTROLS / PERSONAL PROTECTION
Component occupational exposure guidelines
• exposure limit for dust
CAS-No. Control parameters 15 mg/m3 Time Weighted Average (TWA)
Permissible Exposure Limit (PEL):(OSHA Z1)
Total dust.
5 mg/m3 Time Weighted Average (TWA) Permissible Exposure Limit (PEL):(OSHA Z1)
Respirable fraction.
Appendix E Page E3
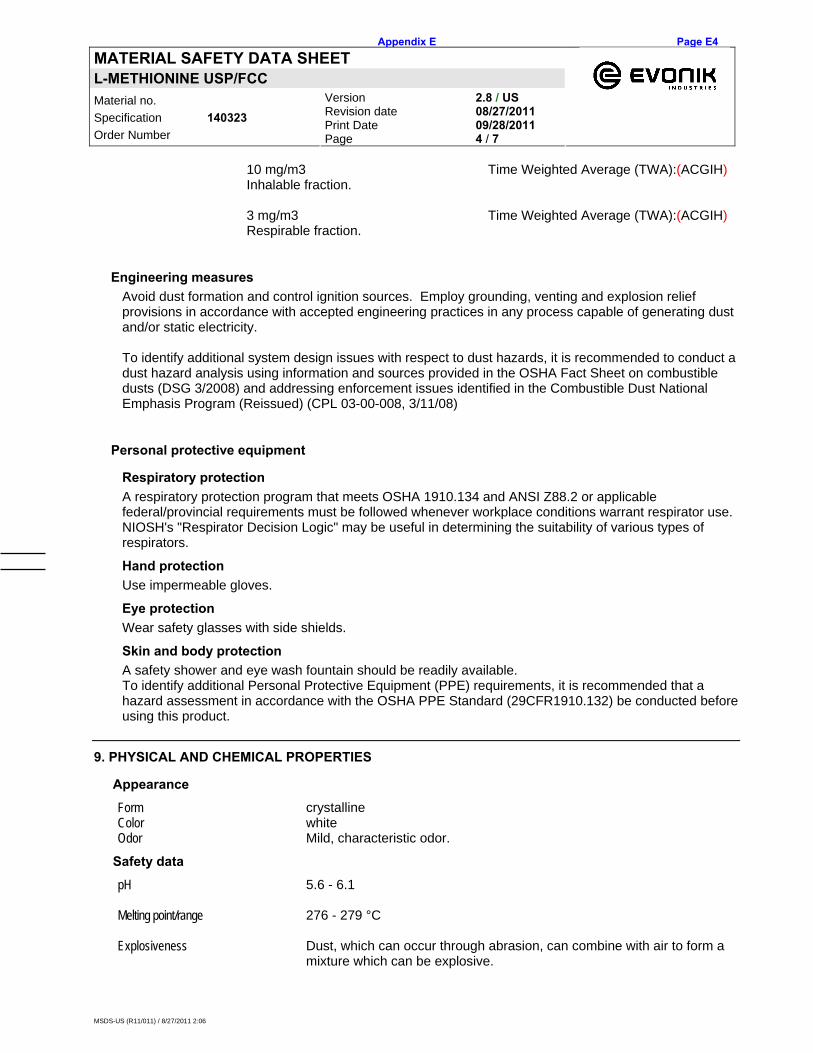
MATERIAL SAFETY DATA SHEET L-METHIONINE USP/FCC
Material no.
Specification 140323
Order Number
Version 2.8 / US Revision date 08/27/2011 Print Date 09/28/2011 Page 4 / 7
MSDS-US (R11/011) / 8/27/2011 2:06
10 mg/m3 Time Weighted Average (TWA):(ACGIH) Inhalable fraction.
3 mg/m3 Time Weighted Average (TWA):(ACGIH) Respirable fraction.
Engineering measures
Avoid dust formation and control ignition sources. Employ grounding, venting and explosion relief provisions in accordance with accepted engineering practices in any process capable of generating dust and/or static electricity. To identify additional system design issues with respect to dust hazards, it is recommended to conduct a dust hazard analysis using information and sources provided in the OSHA Fact Sheet on combustible dusts (DSG 3/2008) and addressing enforcement issues identified in the Combustible Dust National Emphasis Program (Reissued) (CPL 03-00-008, 3/11/08)
Personal protective equipment
Respiratory protection
A respiratory protection program that meets OSHA 1910.134 and ANSI Z88.2 or applicable federal/provincial requirements must be followed whenever workplace conditions warrant respirator use. NIOSH's "Respirator Decision Logic" may be useful in determining the suitability of various types of respirators.
Hand protection
Use impermeable gloves.
Eye protection
Wear safety glasses with side shields.
Skin and body protection
A safety shower and eye wash fountain should be readily available. To identify additional Personal Protective Equipment (PPE) requirements, it is recommended that a hazard assessment in accordance with the OSHA PPE Standard (29CFR1910.132) be conducted before using this product.
9. PHYSICAL AND CHEMICAL PROPERTIES
Appearance
Form crystalline Color white Odor Mild, characteristic odor.
Safety data
pH 5.6 - 6.1
Melting point/range 276 - 279 °C
Explosiveness Dust, which can occur through abrasion, can combine with air to form a mixture which can be explosive.
Appendix E Page E4

MATERIAL SAFETY DATA SHEET L-METHIONINE USP/FCC
Material no.
Specification 140323
Order Number
Version 2.8 / US Revision date 08/27/2011 Print Date 09/28/2011 Page 5 / 7
MSDS-US (R11/011) / 8/27/2011 2:06
Bulk density 420 kg/m3
10. STABILITY AND REACTIVITY
Conditions to avoid Operations that create dust.
Hazardous decomposition products Sulphur oxides, nitrogen oxides (NOx), Carbon oxides
Thermal decomposition Stable under normal conditions.
11. TOXICOLOGICAL INFORMATION
Product Acute oral toxicity LD50 Rat: > 10000 mg/kg (literature)
12. ECOLOGICAL INFORMATION
General Ecological Information There are no ecological data available.
13. DISPOSAL CONSIDERATIONS
WASTE DISPOSAL
Advice on disposal Waste must be disposed of in accordance with federal, state, provincial and local regulations.
14. TRANSPORT INFORMATION
Transport/further information
Not dangerous according to transport regulations.
15. REGULATORY INFORMATION
Information on ingredients / Non-hazardous components
This product contains the following non-hazardous components
L-Methionine CAS-No. 63-68-3 Percent (Wt./ Wt.) 100 %
US Federal Regulations
Appendix E Page E5

MATERIAL SAFETY DATA SHEET L-METHIONINE USP/FCC
Material no.
Specification 140323
Order Number
Version 2.8 / US Revision date 08/27/2011 Print Date 09/28/2011 Page 6 / 7
MSDS-US (R11/011) / 8/27/2011 2:06
OSHA
If listed below, chemical specific standards apply to the product or components:
• None listed Clean Air Act Section (112)
If listed below, components present at or above the de minimus level are hazardous air pollutants:
• None listed CERCLA Reportable Quantities
If listed below, a reportable quantity (RQ) applies to the product based on the percent of the named component:
• None listed SARA Title III Section 311/312 Hazard Categories
The product meets the criteria only for the listed hazard classes:
• No SARA Hazards SARA Title III Section 313 Reportable Substances
If listed below, components are subject to the reporting requirements of Section 313 of Title III of the Superfund Amendments and Reauthorization Act of 1986 and 40 CFR Part 372:
• None listed Toxic Substances Control Act (TSCA)
If listed below, non-proprietary substances are subject to export notification under Section 12 (b) of TSCA:
• None listed
State Regulations California Proposition 65
A warning under the California Drinking Water Act is required only if listed below:
• None listed
Appendix E Page E6

MATERIAL SAFETY DATA SHEET L-METHIONINE USP/FCC
Material no.
Specification 140323
Order Number
Version 2.8 / US Revision date 08/27/2011 Print Date 09/28/2011 Page 7 / 7
MSDS-US (R11/011) / 8/27/2011 2:06
International Chemical Inventory Status
Unless otherwise noted, this product is in compliance with the inventory listing of the countries shown below. For information on listing for countries not shown, contact the Product Regulatory Services Department.
• Europe (EINECS/ELINCS) Listed/registered
• USA (TSCA) Regulated food, drug, cosmetic
• Canada (DSL) Listed/registered
• Australia (AICS) Listed/registered
• Japan (MITI) Listed/registered
• Korea (TCCL) Listed/registered
• Philippines (PICCS) Listed/registered
• China Listed/registered
16. OTHER INFORMATION
HMIS Ratings
Health : 0 Flammability : N Physical Hazard : 0
Further information
Changes since the last version are highlighted in the margin. This version replaces all previous versions.
The information provided in this Safety Data Sheet is correct to the best of our knowledge, information and belief at the date of its publication. The information given is designed only as a guidance for safe handling, use, processing, storage, transportation, disposal and release and is not to be considered a warranty or quality specification. The information relates only to the specific material designated and may not be valid for such material used in combination with any other materials or in any process, unless specified in the text.
Appendix E Page E7
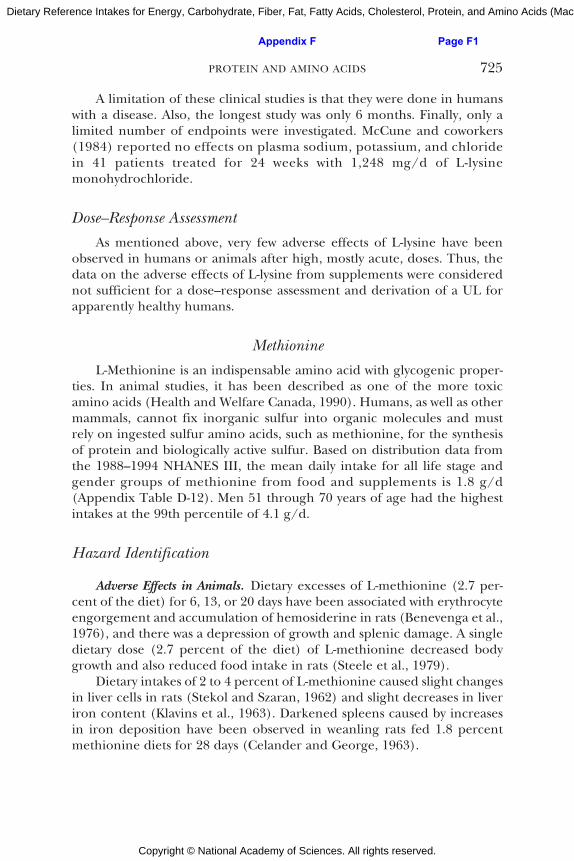
Copyright © National Academy of Sciences. All rights reserved.
Dietary Reference Intakes for Energy, Carbohydrate, Fiber, Fat, Fatty Acids, Cholesterol, Protein, and Amino Acids (Macronutrients)
PROTEIN AND AMINO ACIDS 725
A limitation of these clinical studies is that they were done in humanswith a disease. Also, the longest study was only 6 months. Finally, only alimited number of endpoints were investigated. McCune and coworkers(1984) reported no effects on plasma sodium, potassium, and chloridein 41 patients treated for 24 weeks with 1,248 mg/d of L-lysinemonohydrochloride.
Dose–Response Assessment
As mentioned above, very few adverse effects of L-lysine have beenobserved in humans or animals after high, mostly acute, doses. Thus, thedata on the adverse effects of L-lysine from supplements were considerednot sufficient for a dose–response assessment and derivation of a UL forapparently healthy humans.
Methionine
L-Methionine is an indispensable amino acid with glycogenic proper-ties. In animal studies, it has been described as one of the more toxicamino acids (Health and Welfare Canada, 1990). Humans, as well as othermammals, cannot fix inorganic sulfur into organic molecules and mustrely on ingested sulfur amino acids, such as methionine, for the synthesisof protein and biologically active sulfur. Based on distribution data fromthe 1988–1994 NHANES III, the mean daily intake for all life stage andgender groups of methionine from food and supplements is 1.8 g/d(Appendix Table D-12). Men 51 through 70 years of age had the highestintakes at the 99th percentile of 4.1 g/d.
Hazard Identification
Adverse Effects in Animals. Dietary excesses of L-methionine (2.7 per-cent of the diet) for 6, 13, or 20 days have been associated with erythrocyteengorgement and accumulation of hemosiderine in rats (Benevenga et al.,1976), and there was a depression of growth and splenic damage. A singledietary dose (2.7 percent of the diet) of L-methionine decreased bodygrowth and also reduced food intake in rats (Steele et al., 1979).
Dietary intakes of 2 to 4 percent of L-methionine caused slight changesin liver cells in rats (Stekol and Szaran, 1962) and slight decreases in liveriron content (Klavins et al., 1963). Darkened spleens caused by increasesin iron deposition have been observed in weanling rats fed 1.8 percentmethionine diets for 28 days (Celander and George, 1963).
Appendix F Page F1

Copyright © National Academy of Sciences. All rights reserved.
Dietary Reference Intakes for Energy, Carbohydrate, Fiber, Fat, Fatty Acids, Cholesterol, Protein, and Amino Acids (Macronutrients)
726 DIETARY REFERENCE INTAKES
Viau and Leathem (1973) fed pregnant rats 4 percent of their diet asmethionine and reported subnormal fetal and placental weights. How-ever, supplemental methionine prevented neural tube defects in ratembryos treated with teratogenic antivisceral yolk sac serum (Fawcett etal., 2000). In the mouse, the administration of methionine reducedexperimentally induced spina bifida (Ehlers et al., 1994). Other studies inrodent and primate models support the beneficial effect of methioninesupplementation in improving pregnancy outcomes (Chambers et al.,1995; Chatot et al., 1984; Coelho and Klein, 1990; Ferrari et al., 1994;Moephuli et al., 1997).
Adverse Effects in Humans. Single oral doses of about 0.6 g (adults) and0.08 g (infants) led to increased plasma levels of L-methionine andL-alanine, and decreased plasma concentrations of leucine, isoleucine,valine, tyrosine, tryptophan, and phenylalanine (Stegink et al., 1980, 1982b).Neither report included mention of any adverse effects. Methioninesupplements (5 g/d) for periods of weeks were reportedly innocuous inhumans (Health and Welfare Canada, 1990). A single oral dose of 7 g hasbeen associated with increased plasma concentrations of methionine andthe presence of mixed sulfides (Brattstrom et al., 1984). Single oral dosesof 7 g produced lethargy in six individuals and oral administration of 10.5 gof L-methionine to one produced nausea and vomiting (Perry et al., 1965).After an oral administration of 8 g/d of methionine (isomer not specified)for 4 days, serum folate concentrations were decreased in five otherwisehealthy adults (Connor et al., 1978).
High doses of methionine (~100 mg/kg of body weight) led toelevated plasma methionine and homocysteine concentrations (Brattstromet al., 1984, 1990; Clarke et al., 1991; Wilcken et al., 1983). Thus, it wasconcluded that elevated plasma homocysteine concentrations may be arisk factor for coronary disease (Clarke et al., 1991).
Infants more rapidly metabolized methionine than adults (Stegink etal., 1982b). In women whose average daily intake of methionine was abovethe lowest quartile of intake (greater than 1.34 g/d), a 30 to 40 percentreduction in neural tube defect-affected pregnancies was observed (Shawet al., 1997). These reductions were observed for both anencephaly andspina bifida.
Dose–Response Assessment
There are no adequate data to characterize a dose–response relationshipfor L-methionine. Thus the data on the adverse effects of L-methioninefrom supplements were considered not sufficient for a dose–responseassessment and derivation of a UL for apparently healthy humans.
Appendix F Page F2

2460 The American Journal of Clinical Nutrition 32: DECEMBER 1979, pp. 2460-2471. Printed in U.S.A.
Methionine fortification of a soy protein,formula fed to 2
Samuel J. Fomon,3 M. D., Ekhard E. Ziegler,4 M.D., Lloyd J. Filer, Jr.,3 M.D., Ph.D.,
Steven E. Nelson,5 B. S. , and Barbara B. Edwards,6 R. N.
ABSTRACT Data from study of nine normal full-term infants fed a soy isolate-based formula
unsupplemented with methionine were compared with similar data from study of 10 similar infants
fed the same formula supplemented with L-methionine and with data from previous studies of
larger groups of infants receiving various other feedings. Food intake, growth, and serum chemical
values were studied from 8 through 1 1 1 days of age. In addition, nitrogen balance studies were
carried out. Statistically significant differences were as follows: lesser weight gain per 100 kcal by
infants fed the unsupplemented soy isolate-based formula than by infants fed milk-based or other
soy isolate-based formulas; lesser serum concentrations of albumin at age 28 days by infants fed
the unsupplemented soy isolate-based formula than by breast-fed infants; greater serum concentra-
tions of urea nitrogen by infants receiving the unsupplemented soy isolate-based formula than bythose receiving the same formula supplemented with L-methionlne. A number of other differences
was noted but were not statistically significant. The results suggest that normal infants fed a
formula providing 2.25 g/b00 kcal of a soy protein isolate not fortified with methionine performed
less well during the first 6 weeks of life than did breast-fed infants and infants fed milk-based
formulas or other soy isolate-based formulas fortified with methionine. The limiting nutrient
appears to have been methionine. Am. J. Clin. Nuir. 32: 2460-2471, 1979.
In considering nutritional properties of soyprotein isolates, studies of infants are of par-
ticular interest. It has been estimated (1) that
approximately 10% of infants in the UnitedStates are fed soy isolate-based formulas dur-
ing the early months of life. This represents
the only large group of subjects likely to
obtain all or nearly all of their protein intake
from this source over extended periods oftime.
The biological quality of soy protein iso-lates, as determined by rat assay, ranges ap-
proximately from 65 to 85% that of casein(2). Addition of the first limiting amino acid,methionine, improves quality to that of caseinin rat assays (3) and to about 85% that ofcasein when assayed with newborn pigs (4).Proteins with biological quality less than 70%that of casein are prohibited from use ininfant formulas in the United States (5). In-fant formulas with protein from soy protein
isolate are therefore regularly supplementedwith L-methionme. However, few studies ofthe nutritional effect of methionine fortifica-tion of soy proteins have been carried outwith human infants. Graham (6) performed
nitrogen balance studies with four subjects, 6to 21 months old, during recovery from mal-
nutrition. With diets providing 4 or 6.4% of
energy from soy protein isolate, all four sub-jects showed improved nitrogen balance
when a supplement of 20 mg/kg per day of
DL-methionrne was given. The nature of thesoy protein isolate employed by Graham (6)
was not stated.We have reported (7) that female infants
fed a formula providing 6.5% of energy froma soy protein isolate fortified with L-methio-
nine demonstrated growth and serum chem-ical parameters indistinguishable from thoseof breastfed infants studied in similar fashion(8). Methionine intake was 24 mg/i#{174} kcaland it was concluded that the requirement ofnormal infants for methionine was probablynot greater than that value. It seemed likelythat a formula providing a similar amount of
From the Department of Pediatrics, College of Med-
icine, University of Iowa, Iowa City, Iowa 52242.2 Supported by United States Public Health Service
Grant HD 7578.
� Professor. 4Associate Professor. “Project Ana-
lyst. “Nurse Clinician.
by guest on Septem
ber 23, 2011w
ww
.ajcn.orgD
ownloaded from
Appendix G Page G1

SOY PROTEIN FORMULA FOR INFANTS 2461
methionine (per 100 kcal) exclusively fromsoy protein isolate, rather than from soy pro-tein isolate plus added L-methiomne, would
also satisfy the requirement ofnormal infants
for methionine.The present study provides observations of
food intake and growth of normal infants 8to I 12 days old fed a formula in which 9% ofenergy was derived from soy protein isolate.
This formula provided 25.9 mg/l00 kcal ofmethionine, all from soy protein isolate. It
had been our intention to feed this formulato a group of 15 normal infants and to com-
pare their growth and serum chemical param-eters with those of previously studied
breastfed infants (8) and infants fed various
formulas (7, 9; S. J. Fomon et a!., unpublisheddata). Subsequent events led us to change theexperimental design so that one group ofinfants received the formula with and anothergroup without a supplement of methionine.
Thus, the present study provides observations
of the effect of methionine fortification of soyprotein isolate used in infant feeding. In ad-
dition to observations of food intake andgrowth, metabolic balance studies were car-ried out.
Materials and methods
Subjects and enrollment procedures
Twenty-one normal full-term male infants with birth
weights more than 2500 g served as subjects in the study
of food intake and growth. They were enrolled between
6 and 9 days of age and all but one were observed until
I 12 days of age. Other normal infants (two males and
three females), ranging from 67 to 307 days old at the
time of study, served as subjects for metabolic balance
studies. The majority of the infants was children of
students or faculty of the University of Iowa.
At the time an infant was enrolled in the study, his
mother was interviewed by one of us (B.B.E.). The
program was outlined in detail, written permission was
obtained, and written instructions were provided. The
protocol for the study was reviewed and approved by theCommittee on Research Involving Human Subjects of
the University of Iowa.As already mentioned, our intention had been to
study 15 infants fed the experimental formula (formula
1-501) unfortified with methionine. The first three infants
(subjects 2221, 2222, and 2223-see Appendix Table 1)
were enrolled within a few days of one another and the
fourth infant (subject 2224) was enrolled 9 weeks later.
The first three infants demonstrated normal rates of
growth; serum concentrations of albumin at age 28 days
ranged from 3.05 to 3.15 g/dl. However, at 56 days ofage two of the three infants demonstrated serum concen-
trations of albumin less than 3.00 g/dl. We considered
these values suspiciously low and the infants were, there-
fore, maintained under close observation and enrollmentof additional infants was temporarily suspended.
At age 84 days serum concentrations of albumin of
two infants (blood was not obtained from the third
infant) were completely satisfactory: 3.65 and 3.78 g/dl.
Enrollment was, therefore, resumed and the next four
infants enrolled were given the formula with a supple-
ment of L-methionrne in the form of drops. Because
further observation of the first four infants enrolled
(those without methionine supplementation) offered no
cause for concern regarding growth or serum concentra-
tions of albumin, infants were thereafter enrolled alter-
nately with or without the methionine supplement. The
available supply of formula limited the study to 21
infants.
Of the infants who served as subjects in balance
studies, one (subject 2262, birth weight 3630 g) had
served as subject for a study of food intake and growth
during the interval 8 to I 12 days of age and was fed a
milk-based formula during that time. This infant hadthus not previously served as subject for metabolic bal-
ance studies. The other four infants (subjects 2 15 1, 2179,
2159, and 2281-birth weights 2905, 3090, 3330, and
3245 g, respectively) were enrolled as subjects for meta-
bolic balance studies during the first 2 weeks oflife and
participated in metabolic balance studies at approxi-
mately 14-day intervals until age 112 days, and at 14- to
28-day intervals thereafter. Before study with formula I-
501, subject 2281 had been fed a formula containing
partially deminerahized whey and subjects 2 15 1, 2179,
and 2 159 had been fed milk-based formulas.
Feeding
During the first few days after birth until 6 to 9 days
of age nearly all of the infants who were to be enrolled
in the growth study were fed commercially prepared
milk-based formulas. Subsequently, experimental for-
muha 1-501 was fed ad hibitum. This formula was pre-
pared from soy protein isolate (Edi-Pro A, Ralston Pur-
ma Company), vegetable oils (58% corn oil, 42% coconut
oil), carbohydrate (70% corn syrup solids, 30% sucrose),
vitamins, and minerals. Data on chemical composition
of the formula are presented in Table 1 . Expressed per
100 kcal, the formula provided 2.25 g of protein, 25.9
mg of methionine, and 27.0 mg of cystine. The formula
was prepared by the manufacturer (Ross Laboratories,
Columbus, Ohio) as a single batch and was supplied in
1 1,000 ready-to-feed, disposable glass bottles containing
240 ml. Formula was delivered to the family and volume
of intake determined as previously described (7, 9).The infants were fed this formula with or without a
supplement of L-methionine. The supplement provided
12 mg of L-methionine per milliliter of distilled water
and approximately I ml of this solution was added to
240 ml of formula immediately before feeding. The
addition was made by adding 25 drops of L-methionine
solution to the bottle (subjects 2225, 2227, 2228, and
2229) or by adding the amount by means of a dropper
calibrated to deliver 1 ml. With the supplement added,
methionine content of the formula became 22.6 mg/dl
(33.2 mg/100 kcal).
During the first 28 days of life the formula and a
fluoride supplement (Karidium Liquid, Lorvic Corpo-
by guest on Septem
ber 23, 2011w
ww
.ajcn.orgD
ownloaded from
Appendix G Page G2

644
40714.5
16.8
15.5
51
16.1
6.0
1.27
2900
400
15
0.15
0.39
0.78
11.8
0.66
0.1
5120
0.15
60
2462
TABLE IComposition of formula 1-501
Energy (kcal/I00 ml)
Major constituents V’I00 ml)
Protein
Fat
Carbohydrate
Mineral content per liter
Calcium (mg)
Phosphorus (mg)
Sodium (mEq)
Potassium (mEq)
Chloride (mEq)
Magnesium (mg)
Iron (mg)
Zinc (mg)
Copper (mg)Vitamin content per liter
Vitamin A (IU)Vitamin D (IU)
Vitamin E (IU)
Vitamin K (mg)
Thiamin (mg)
Riboflavin (mg)
Niacin (mg)
Pyridoxine (mg)
Fohic acid (mg)
Pantothenic acid (mg)
Ascorbic acid (mg)
Biotin (mg)
Choline (mg)
Sulfur-containing amino acids
(mg/g protein)Methionine 1 1.5�
Cystine l2.0�
(, Typical values for EdiPro A (F. H. Steinke, personal
communication, 1978).
ration, St. Louis, Mo., 0.25 ml daily) (0.5 mg of fluoride
from sodium fluoride) served as the sole source of nutri-
ents. After 28 days of age, the infants were permitted toreceive, in addition to the above, commercially prepared
beikost (foods other than formula or milk) from onemanufacturer (Gerber Products Company, Fremont,
Mich.) according to the following schedule: from age 28
days, oatmeal with applesauce and bananas; from 56
days, pears; and from 84 days (two foods), applesauce,
and bananas with tapioca. The proximate composition
and density of each strained food has been presented
previously (9). Caloric densities of the four foods were
75, 69, 81, and 88 kcal/lOO g, respectively. Parents were
advised that addition of such foods to the diet was
optional and that the formula was a complete food.
Empty (or partially empty) jars of strained food were
collected at 3- or 4-day intervals and weighed. From theweight of strained food consumed and its density, volume
of intake of each of these strained foods was calculated.
For reasons discussed previously (10), wastage of
strained foods (amounts remaining in feeding dish,wiped from infant’s face, etc.) were considered relatively
unimportant in estimating total food intake.
FOMON ET AL.
Procedures
_______ Body weight was determined to the nearest 5 g as
described previously (7-9) and length was determined as
68 described by Fomon (1 1). Measurements were made
between 6 and 9 days of age, within 2 days of each of the1.53 fellowing ages: 14, 28, 42, and 56 days; and within 4 days3.68 of ages 86 and 1 12 days. A detailed description of the7.20 intervals of study and of the data analysis has been
presented previously (7-9). Venous blood was obtained
as previously described (7-9).Metabolic balance studies of 72 hr duration were
carried out in the manner previously described (1 1).
Each subject had at least one balance study (subjects
2281 and 2262 had two balance studies) performed with
the unsupplemented formula and one while receiving the
methionine supplement. The formula and, where appli-
cable, the methionine supplement were fed for at least
1 1 days before a balance study.
Methods used in analyses ofserum, foods, and excreta
were those described previously (7). Plasma concentra-
tions of amino acids were determined with a Technicon
NC- I amino acid analyzer (Technicon Instruments, Tar-rytown, N. Y.) using the buffer system of Efron (12).
Results of the present study will be compared with
data from other observations of infants studied in similar
fashion: “breast-fed infants” refers to 1 17 male breast-
fed infants (13); “infants fed milk-based formulas” refers
to 203 male infants fed various formulas based on cow
milk (9; 5. J. Fomon, unpublished data); and “infants
fed soy isolate-based formulas” refers to 63 male infants
fed various formulas based on methionine-fortified soy
protein isolates (7; 5. J. Fomon, unpublished data). These
formulas provided approximately 2.1 to 2.6 g of soy
protein isolate per 67 kcal and were supplemented with
3.6 to 8.0 mg of methioninc per gram of protein.
Results
Detailed data concerning each of the 21infants enrolled in the study are presented inAppendix Tables 1 to 5. Ten infants were fedthe unsupplemented formula and 1 1 received
the supplement of L-methionine. All but oneinfant (subject 2240� fed the unsupplementedformula) completed the planned period of
study to 1 12 days of age. This infant gainedfrom 3 1 10 to 3540 g (2 1 .5 g/day) between 8and 28 days of age (Appendix Table I), again slightly greater than the 5th percentilevalue for breast-fed infants (13). The infanthad had diarrhea during the 2 days precedingthe 28-day visit and was withdrawn fromstudy on the advice of his physician a day or
two after that visit.One infant (subject 2227) who completed
the planned period of observation to 112 daysof age had been noted at birth to have a heartmurmur and was briefly hospitalized at 98days of age for treatment of diarrhea. It isapparent from data included in Appendix
by guest on Septem
ber 23, 2011w
ww
.ajcn.orgD
ownloaded from
Appendix G Page G3

TABLE 2Summary of data on food intake
Age interval (days)
8-41 42-Ill 8-Ill
mean SD mean Sd mean SD
4004 400 5617 577 5090 498
737
501
145
99
792
539
130
88
774
526
127
86
1
1
2
2
67
56
54
45
46
38
36
30
739
502
125
145
99
20
859
594
106
99
64
4
820
564
113
112
74
8
11.30
2.81
2.25
2.22
0.45
0.00
12.83
2.30
2.16
1.69
0.12
0.08
12.33
2.47
2.18
1.81
0.19
0.06
4537 382 6262 627 5698 523
753
512
83
56
847
576
92
63
816
555
72
49
10
8
10
8
72
58
45
37
52
42
31
26
918
634
102
119
85
9
868
597
106
86
60
6
763
520
115
11.67
2.58
2.24
80
54
7
1.22
0.16
0.01
13.70 1.65
2.20 .17
2.16 0.05
13.04 1.22
2.33 0.11
2.19 0.04
SOY PROTEIN FORMULA FOR INFANTS 2463
Formula 1-501 unsupplemented-
9 infants
Average body wt (g)
Food consumption
Formula
(mI/day)
(kcal/day)
Beikost
(mh/day)
(kcah/day)
Total
(mi/day)
(kcal/day)
(kcah/kg/day)
Protein intake
(g/day)
(g/kg/day)
(g/l00 kcal)
Formula 1-501 supplemented
with methionine-lO infants
Average body wt (g)
Food consumption
Formula
(mh/day)
(kcal/day)
Beikost
(mI/day)
(kcal/day)
Total
(mi/day)
(kcal/day)
(kcal/kg/day
Protein intake
(g/day)
(g/kg/day)
(g/l00 kcal)
Table 1 that weight gain of this infant was
exceedingly slow (more than 3 SD below themean for breast-fed infants between 8 and1 12 days) and that caloric intake was cx-tremely low. The infant subsequently devel-oped congestive cardiac failure and was
found to have coarctation of the aorta. The
abnormality was corrected surgically at 19months of age. Data for this infant are in-cluded in the Appendix Tables but have beenexcluded from data analysis. Data analysis,therefore, concerns 19 infants (nine fed theunsupplemented and 10 fed the supple-mented formula) who completed the planned1 12 days of study.
Subject 2237 developed vomiting on the25th day of life, was admitted to the hospital
and had pyloromyotomy for pyloric stenosis
on the 26th day of life. Fluids were adminis-tered intravenously for 24 hr. By the 27th
day, formula feedings were resumed. Theinfant was, therefore, permitted to continue
in the study.
Intake offormula and beikost
Data concerning volume of formula con-sumed by each infant during each age interval
are presented in Appendix Table 3. Similardata for items of beikost permitted at variousages are presented in Appendix Table 4. Four
by guest on Septem
ber 23, 2011w
ww
.ajcn.orgD
ownloaded from
Appendix G Page G4

2464 FOMON ET AL.
infants received some intake of foods other
than those included in the protocol. Thesefoods are identified in Appendix Table 5.Data on food intake are summarized in Table2.
Energy intake
Despite the lesser mean body size of infantsin the group receiving the unsupplemented
formula (see “Weight and length” section),
mean energy intake (kilocalories per day)during the age interval 8 to 41 days wasnearly the same for this group as for the
group receiving the methionine supplement
(Table 2). Therefore, energy intake per unitof body weight by infants receiving the un-
supplemented formula (1 25 kcal/kg per day)
was somewhat greater than that by infants
receiving the supplement (1 15 kcal/kg perday) but the difference was not statistically
significant (P = 0. 160). Mean energy intake
by 203 previously studied male infants fedmilk-based formulas was 1 18 kca!/kg per dayand that by 63 infants fed L-methiomne-sup-plemented soy isolate-based formulas was1 20 kcal/kg per day.
In the interval 42 to 1 1 1 days, mean energyintake was 106 kcal/kg per day by the infantsreceiving the unsupplemented formula and
102 kcal/kg per day by those receiving themethionine supplement. Corresponding val-
ues for the larger groups of male infants fed
milk-based and soy isolate-based formulaswere 100 and 105 kcal/kg per day, respec-
lively. These differences in energy intakewere not statistically significant. Similarly,
differences in energy intakes during the entireage interval 8 to 112 days were not statisti-cally significant.
As may be seen from Table 2, mean energyintake from beikost was relatively low in eachage interval.
Intake of protein and methionine
Because intake of protein from beikost ac-counted for a relatively small percentage oftotal protein intake, protein intake per 100kcal (Table 2) differed only slightly, or not atall, from the protein: energy ratio of the
formula (2.25 g of protein per 100 kcal). Asa consequence of the greater formula con-sumption per unit of body weight by infantsfed the unsupplemented than by those receiv-
ing the supplemented formula, intake of pro-
tein per unit of body weight was also some-
what greater by infants fed the unsupple-mented formula.
For reasons discussed previously (7), it wasassumed that the ratio ofamino acids: protein
in beikost was the same as that of the soyprotein isolate (Table 1). Mean methionineintake by infants receiving the unsupple-mented formula was 25.9 mg/l00 kcal (32.4mg/kg per day) in the age interval 8 through41 days and 24.9 mg/I#{174} kcal (26.4 mg/kg
per day) in the age interval 42 through 111days. Corresponding mean intakes of methi-
onine by infants receiving the supplemented
formula were 33.0 and 31.6 mg/lOO kcal (38.0and 32.2 mg/kg per day), respectively, in thetwo age intervals.
The lesser formula consumption per unitof body weight by infants receiving the me-
thionine supplement resulted in a lesser in-take of cystine per unit of body weight thanby infants receiving the unsupplemented for-
mula, especially during the age interval 8
through 41 days. Therefore, the intake oftotal sulfur-containing amino acids per unit
of body weight was only slightly greater inthe methionine supplemented than in the Un-supplemented group. Of course, intake of
sulfur-containing amino acids expressed perunit of energy intake was greater in the sup-plemented than in the unsupplemented group(60.0 versus 52.9 mg/lOO kcal in the ageinterval 8 through 41 days and 57.6 versus50.7 mg/ 100 kcal in the age interval 42through 1 1 1 days of age).
Weight and length
As already noted, the two groups of infants
were different in body size. Mean weight atbirth and mean length at age 8 days of infantsfed the unsupplemented formula were similarto those ofa larger group ofbreast-fed infantsstudied previously (13). Mean weight at birth
and mean length at age 8 days of infants fedthe supplemented formula were greater (P <
0.01) than corresponding values for infantsfed the unsupplemented formula or for theseries of breast-fed infants. The greaterweights and lengths of infants fed the supple-mented formula persisted throughout the
study (Table 2).Mean daily gains in weight and length and
by guest on Septem
ber 23, 2011w
ww
.ajcn.orgD
ownloaded from
Appendix G Page G5

SOY PROTEIN FORMULA FOR INFANTS 2465
gains in weight per unit of energy intake areindicated in Table 3. Included in Table 3 arecorresponding data for breast-fed infants andinfants fed milk-based and soy isolated-based
formulas. During each age interval meandaily weight gain by infants fed the unsup-
plemented formula was less than that by in-
fants receiving the supplemented formula.Furthermore, mean weight gain ofthe unsup-plemented group was less than that of all
other groups of infants studied previouslywith the exception ofbreast-fed infants in theage interval 42 to 1 12 days. None of the
differences was statistically significant.
Mean weight gain per unit ofenergy intake
was less by infants fed the unsupplementedformula than by infants fed the supplementedformula, but the difference was not statisti-
cally significant. Because birth weight is in-versely related to rate ofgain in weight duringearly infancy, the relatively high birth weights
of the infants receiving the supplementedformula may have diminished the apparenteffect of methionine supplementation. Dur-ing the age interval 8 to 42 days gain inweight per unit of energy intake by infants
fed the unsupplemented formula was signifi-
cantly less (P < 0.05) than that by previously
studied infants fed milk-based or soy isolate-
based formulas (Table 3), and during theinterval 8 to 1 12 days it was significantly less(P < 0.05) than that ofinfants fed milk-basedformulas.
Mean gains in length were quite similar for
the two feeding groups and were similar to
those for other groups of infants (Table 3). Infact, mean gain in length of infants fed thesupplemented formula was significantly
greater (P < 0.05) than that of the breast-fedinfants during the age interval 42 to I 12 days.
As may be calculated from data presentedelsewhere (13), gains in weight and length offullterm infants tend to be negatively corre-lated with size at birth. Therefore, the greatersize at birth of infants fed the supplementedformula than ofthose receiving the unsupple-
mented formula may be assumed to have hadthe effect of diminishing differences in ratesof gain between the two groups. Analysis ofcovariance was therefore performed on datafrom the present study and from our previous
study of breast-fed infants (13). However,even when rates of gain in weight and lengthwere corrected for birth weight, differences in
TABLE 3Summary of data on growth from present studyand male infants receiving various feedings
Age interval (days)
8-42 42-112 8-112
Mean SD Mean SD Mew, SD
Gain in WI (g/day)
1-501 unsupplemented (9)” 34.2 1 1 . I 26.7 4. 1 29. 1 5.9
1-501 with methionine (10) 38.0 9.0 29.3 8.8 32.1 6.8
Breastfed ( 1 17)b 38.7 9.6 25.8 6. 1 30. 1 5.6
Milk-based formulas (203)C 39.5 7.5 28.4 6.3 32.0 5.5
Soy-based formulas (63)” 38.7 6.8 29.6 7.0 32.6 5.3
Gain in wt (g/l00 kcal)
1-501 unsupplemented 6.7V” 1.24 4.49 0.53 5.14� 0.63
1-501 with methionine 7.25 1.42 4.55 0.72 5.35 0.70
Milk-based formulas 8.0(Y 1.20 4.76 0.79 5.70w 0.71
Soy-based formulas 7.7I’� 1.26 4.69 0.66 5.55 0.58
Gain in length (mm/day)
1-501 unsupphemented
1-501 with methionine
1.20
1.18
0.22
0.32
1.07
1.l0’�
0.07
0.15
1. 1 11.12
0.070.14
Breastfed 1.30 0.23 098h 0.13 1.09 0.10
Milk-based formulas 1.33 0.20 1 .02 0. 13 1 . 12 0.11
Soy-based formulas 1.35 0.21 1.09 0.1 1 1.18 0.10
a Values in parentheses indicate number of infants. b Fomon et al. (13). � Fomon et al. (9) and unpublished
data. d Fomon Ct al. (7) and unpublished data. � Values with the same superscript differ significantly (P <
0.05) from one another.
by guest on Septem
ber 23, 2011w
ww
.ajcn.orgD
ownloaded from
Appendix G Page G6

AgeNo of determina. Urea nttrogen Total protein Ablumin Methionine Cystine
tionsMean SD Mean SD Mean SD Mean SD Mean SD
nig/dl g/dl g�mole/dl
28 days
1-501 unsupplemented
1-501 with methionine8
8
11.5”
95(�1.3
1.7
5.01
5.21
0.51
0.383.40
3.56
0.32
0.25
3.4
3.31.10.9
3.6
4.9
1.1
1.556 days
1-501 unsupplemented
1-501 with methionine8 (9)” 10.1”
8.6w’
1.3
1.4
5.34
5.49
0.65
0.23
3.53
3.88
0.47
0.25
3.4
3.2
1.3
1.0
3.8e
5.Y0.8
1.184 days
1-501 unsupplemented
1-501 with methionine
7 (6)
9
10.1’
8.1”
1.7
1.3
5.59
5.76
0.29
0.22
3.95
3.92
0.21
0.24
3.2
2.9
0.7
0.7
5.1
5.4
0.6
1.31 12 days
1-501 unsupplemented
1-501 with methionine
9 (8)
8
9.4’
7.5’
1.6
1.6
5.62
5.90
0.32
0.27
4.03
4.07
0.26
0.20
3.3
3.5
1.5
0.8
4.5�
6.6�
1.5
0.8a Values differ significantly ( P < 0.05) from each other within the same age group. I) Nos. in parentheses refer
to plasma methionine and cystine where the number of determinations were not the same as for the other
determinations. � Values differ significantly with P < 0.01.
2466 FOMON ET AL.
gains between the unsupplemented and the
supplemented groups were not statistically
significant.
Blood chemical parameters
As may be seen from Table 4 and Figure1 , mean serum concentrations of urea nitro-
gen of infants receiving the unsupplemented
formula were generally greater than those ofinfants receiving the supplemented formula.
The difference was statistically significant (P< 0.05) at each of the four ages.
Although serum concentrations of total
protein and albumin of infants receiving theunsupplemented formula tended to be lessthan those observed in breast-fed infants atall ages, only the albumin concentrations at28 days of age were significantly (F test,Duncan’s multiple range test;P < 0.05) lessthan those of breast-fed infants (Fig. 2). Al-though slightly higher concentrations were
generally observed in infants receiving the
supplemented than in those receiving the un-supplemented formula (Table 4), the differ-ences were not statistically significant.
As indicated in Table 4, plasma concentra-tions of methionine were similar, whereas
plasma concentrations of cystine were
greater, especially at 56 and 1 12 days, ininfants receiving the supplemented than inthose receiving the unsupplemented formula.
Because of the lower volumes of intake by
infants fed the supplemented formula, intakesof cystine were slightly lower by this group
than by infants fed the unsupplemer�ted for-mula. The greater plasma concentrations of
cystine in infants fed the supplemented for-
mula may, therefore, reflect the conversion ofmethionine to cystine. With the exception of
a significantly higher glutamine concentra-
tion in the unsupplemented group at 84 daysof age, no differences in plasma amino acidconcentrations were present. In particular, no
statistically significant differences were seen
in concentrations of taurine and of total non-essential amino acids.
Metabolic balance studies
As indicated in Table 5, 14 metabolic bal-ance studies were carried out with five in-fants-seven studies with the unsupple-mented formula and seven studies with the
methionine-supplemented formula. Each in-
fant received the supplemented and unsup-
plemented formula on an alternating basis.Mean intakes of nitrogen were almost iden-tical whether the formula was or was not
supplemented with methionine. Mean un-nary and mean fecal excretions of nitrogenwere slightly less and mean retention of ni-trogen was slightly greater when the formula
was supplemented with methionine than
when it was not. However, none of thesedifferences was statistically significant. The
TABLE 4Serum concentrations of urea nitrogen, total protein, and albumin
and plasma concentrations of methionine and cystine
by guest on Septem
ber 23, 2011w
ww
.ajcn.orgD
ownloaded from
Appendix G Page G7

E
zUi00
I-
z
Ui
UiU)
4.0
3.0
2.0 �a
a
11.0 #{149}#{149}
a
10.0
9.0 a a
:: ! 1*
6.0
5.0
4.0
:$
4.5
40
3.5
3.0
a
Ia
a
I
a
a
a z
a
*5 UiU)
S 6
#{149}1S
S
S
S
PS
16
1�S
S
a
I
S6a
SIa
S
S
I
SOY PROTEIN FORMULA FOR INFANTS 2467
28 56 84 112
AGE (days)
FIG. I . Serum concentrations of urea nitrogen of
infants fed formula 1-501 unsupplemented (#{149})or supple-
mented with L-methionine (X). At each age the differ-
ence was statistically significant (t test, P < 0.05).
relation of retention of nitrogen to intake ofnitrogen (Fig. 3) was similar whether or notthe diet was supplemented with methionine.
Discussion
In several other studies of human subjects
fed soy proteins, methionine supplementationhas been found to improve nitrogen balance.These studies have concerned infants re-
covering from malnutrition fed a soy proteinisolate (6), girls 8 to 9 years old fed soy flour(14), adolescent boys 13 to 17 years old fed a
soybean textured product (15), and men fed
a soybean textured product (16) or a soyprotein isolate (17). Improvement in nitrogenbalance with methionine supplementation inthese studies was observed only at relativelylow intakes of protein. The formula used in
the present study provided 2.25 g of proteinper 100 kca!, or about 9% of energy intakefrom protein. This protein intake is well
above that of fully breast-fed infants and wellabove the estimated requirement (approxi-mately 7% of energy in the form of protein)
for infants fed high quality protein (11). Thepresent study failed to demonstrate an effect
2.5
28 - 56 64 112
AGE (days)
FIG. 2. Serum concentrations of albumin of infants
fed formula 1-501 unsupplemented (#{149})or supplementedwith L-methiOnine (X). The shaded area indicates values
(mean ± 2 SD) ofnormal breast-fed infants (13). Values
of infants fed the unsupplemented formula at 28 days of
age are significantly (P < 0.05) lower than those of
breast-fed infants; all other differences are not statisti-
cally significant.
of methionine supplementation on absorp-tion and retention of nitrogen. At this inter-
mediate level of protein intake, protein qual-ity may be better evaluated by longer term
observations of weight gain and of serumconcentrations of albumin and urea nitrogen
than by nitrogen balance studies.
Data from such longer term observations
in the present study suggest that normal maleinfants fed a formula providing the interme-
diate level of protein intake from the soyprotein isolate not supplemented with methi-
onine performed less well, particularly during
the first 6 weeks of life, than did previouslystudied breast-fed infants and infants fedmilk-based or methionine-fortified soy iso-late-based formulas. Weight gain per unit of
energy intake and serum concentrations of
albumin were relatively low. Absolute weightgain (grams per day) was also less than that
of infants fed other formulas; however, thislatter difference was not statistically signifi-
cant.
The inadequacy of the experimental for-mula was unanticipated. According to our
by guest on Septem
ber 23, 2011w
ww
.ajcn.orgD
ownloaded from
Appendix G Page G8

z0
I-z‘Li
‘Li
z‘Li(20
I-
z
200
I00
0
2468 FOMON ET AL.
TABLE 5
Balances of nitrogen and fat in relation to methionine supplementation
Subject Age Wetght Length Energy intake
Nitrogen Fat
Escretion
Intake Retention Intake Excretion
Urine Feces
days g cm kcal/kg/dav mg/kg/day g/kg/dav
Formula 1-501 unsupplemented
2281 81 6225 59.2 134 483 223 104 156(32%) 7.27 0.69
109 6855 60.1 126 454 198 85 170(38%) 6.84 0.34
2262 138 6740 63.2 97 346 150 69 127(37%) 4.40 0.18
180 7530 65.5 85 285 142 59 84(30%) 3.80 0.35
2179 252 8050 66.6 106 361 180 62 119(33%) 4.53 0.16
2159 272 6555 64.8 116 397 168 68 161 (41%) 4.91 0.21
2151 293 9250 72.0 85 293 205 63 24(8%) 3.56 0.47
Mean 374 181 73 120(31%) 5.04 0.34
SD 76 30 16 52(11%) 1.45 0.19
Formula 1-501 supplemented with L-methionine
2281 67 5630 56.4 128 461 214 100 147(32%) 6.94 3.06
95 6490 59.6 118 426 183 70 173(41%) 6.41 0.47
2262 124 6610 62.1 112 383 132 48 203(53%) 5.20 0.17
152 7005 63.5 89 305 142 58 105(34%) 3.81 0.15
2179 231 7865 65.9 102 346 158 78 110(32%) 4.23 0.19
2159 293 6685 66.4 108 368 206 75 87(24%) 4.85 0.17
2151 307 9320 72.0 115 366 171 63 132(36%) 4.14 0.15
Mean 380 173 70 137 (36%) 5.08 0.62
SD 51 31 17 41 (9%) 1.19 1.08
�cn �n 400 500
NITROGEN INTAKE (mg/kg/day)
FIG. 3. Retention of nitrogen in relation to intake of
nitrogen by five normal infants. Each point refers to theresult ofone 3-day metabolic balance study with formula
1-501 unsupplemented (#{149})or supplemented with L-me-
thionine (X).
calculations7 the methionine content per 100kcal of formula was similar to that of a for-mula studied previously in female infants and
judged to be adequate (7). In each case, thesoy protein isolate, EdiPro A, was the sourceof protein. In the earlier study, a formulawith relatively low protein content was forti-fled with L-methiOfllne. In the present study,a formula of greater protein content was un-
fortified with methionine.
It seems to us unlikely that the differencesin results of the two studies reflect either agreater bioavailability of added than of nat-
S urally occurring L-methiOnine or a greater
methionine requirement per unit of energy
intake for males than for females. It is some-what more likely that the differences in re-sults of the two studies reflect differences inprotein quality of the different batches ofEdiPro A or that differences in protein qua!-ity resulted from preparation of the formula
by the manufacturer.An additional possibility is that poor per-
formance of the infants fed the soy protein
isolate unfortified with methionine resulted
from amino acid imbalance. An analogousfinding was reported by Wethli et a!. (18) in
studies of growing chickens. Diets based on
corn and soybean meal unsupplemented withmethionine gave lesser growth rates than didthe same diets supplemented with methionine
7 Calculation of the methionine content of formula I-
501 was based on the assumption that the ratio of
methionine to protein was the average ratio reported by
the manufacturer. This assumption seems reasonablebecause analytic errors in determining methionine con-
tent may be as great as batch to batch variation.
by guest on Septem
ber 23, 2011w
ww
.ajcn.orgD
ownloaded from
Appendix G Page G9

SOY PROTEIN FORMULA FOR INFANTS 2469
even though the protein level in the unsup-plemented diets was sufficient to meet the
assumed methionine requirements. In thecase of human infants, it seems likely thatsuch amino acid imbalance is more readily
detected by the growth response than by ni-trogen balance studies.
Of particular interest in the present studywas a definite reduction in concentrations ofserum urea nitrogen observed at all ageswhen the formula was supplemented withmethionine. The lesser serum concentrationsof urea nitrogen may be interpreted in the
light of studies summarized by Bodwell (19).Both in experimental animals and in human
subjects, serum concentrations of urea nitro-
gen are less when proteins of higher qualityare fed than when equal intakes of nitrogenare provided from proteins of lesser quality.
Thus, the evidence presented suggests thatthe quality of protein in the particular soyprotein isolate-based formula used in thepresent study was improved by the additionof L-methiOnine. El
Dr. Lewis D. Stegink, Professor, Departments of Bio-
chemistry and Pediatrics, kindly provided the plasma
amino acid analyses.
References
1. FOMON, S. J. What are infants fed in the United
States? Pediatrics 56: 350, 1975.
2. LIENER, I. E. Nutritional value of food protein prod-
ucts. In: Soybeans: Chemistry and Technology. Vol.1, Proteins, edited by A. K. Smith and S. J. Circle.
Westport, Conn: AVI, 1972, p. 203.
3. HUGE, W. E. Present and potential uses of soybean
flour, grits, and protein concentrates in foods. Proc.Conf. Soybean Products for Protein in Human
Foods. Peoria, Ill.: USDA, 1961.
4. HARKINS, R. W., AND H. P. SARE1-r. Methods of
comparing protein quality of soybean infant formu-
las in the rat. J. Nutr. 91: 213, 1967.
5. Office of the Federal Register, General Service Ad-
ministration. Code of Federal Regulations. Title 21:Food and Drugs, Part 105.65. Washington, D.C.:
United States Government Printing Office, 1977.
6. GRAHAM, G. 0. Methionine or lysine fortification of
dietary protein for infants and small children. In:
Amino Acid Fortification of Protein Foods, edited
by N. S. Scrimshaw and A. M. Altschul. Cambridge,Mass.: MIT Press, 1971, p. 222.
7. FOMON, S. J., L. N. THOMAS, L. J. FILER, JR., T. A.ANDERSON AND K. E. BERGMANN. Requirements for
protein and essential amino acids in early infancy.
Studies with a soy-isolate formula. Acta Paediat.
Scand. 62: 33, 1973.
8. FOMON, S. J., L. J. FILER, JR., L. N. THOMAS AND R.R. ROGERS. Growth and serum chemical values of
normal breastfed infants. Acta Paediat. Scand.
Suppl. 202, 1970.
9. FOMON, S. J., L. N. THOMAS, L. J. FILER, JR., E. E.ZIEGLER AND M. T. LEONARD. Food consumption
and growth of normal infants fed milk-based for-
mulas. Acta Paediat. Scand. Suppl. 223, 1971.
10. FOMON, S. J., L. J. FILER, JR., L. N. THOMAS, T. A.ANDERSON AND S. E. NELSON. Influence of formula
concentration on caloric intake and growth of nor-
mal infants. Acta Paediat. Scand. 64: 172, 1975.
1 1. FOMON, S. J. Infant Nutrition (2nd ed.) Philadelphia:
Saunders, 1974.
12. EFRON, M. L. Quantitative estimation ofamino acids
in physiological fluids using a Technicon amino acid
analyzer. In: Automation in Analytical Chemistry,edited by L. T. Skeggs, Jr. New York: Mediad, 1966,
p. 637.
13. FOMON, S. J., E. E. ZIEGLER, L. J. FILER, JR., T. A.ANDERSON, B. B. EDWARDS AND S. E. NELSON.
Growth and serum chemical values of normal
breastfed infants. Acta Paediat. Scand. Suppl. 273,
1978.
14. PARTHASARATHY, H. N., T. R. DORAISWAMY, M.PANEMANGALORE, M. N. RAO, B. S. CHANDRASEK-
HAR, M. SWAMINATHAN, A. SREENIVASAN AND V.SUBRAHMANYAN. The effect of fortification of proc-
essed soya flour with dl-methionine hydroxy ana-
logue or dl-methionine on the digestibility, biological
value, and net protein utilization of the proteins as
studied in children. Can. J. Biochem. 42: 377, 1964.
15. KORSLUND, M., C. KIss AND H. M. Fox. Compari-
son of the protein nutritional value of TVP, methi-
onine-enriched TVP and beef for adolescent boys. J.
Food Sci. 38: 637, 1973.
16. KIE5, C., AND H. M. Fox. Comparison ofthe protein
nutritional value of TVP, methionine enriched TVP
and beef at two levels of intake for human adults. J.
Food Sci. 36: 841, 1971.
17. ZEZULKA, A. Y., AND D. H. CALLOWAY. Nitrogen
retention in men fed varying levels of amino acids
from soy protein with or without added L-methio-
nine. J. Nutr. 106: 212, 1976.
18. WETHLI, E., T. R. MORRIS AND T. P. SHRESTA. Theeffect of feeding high levels of low-quality proteins
to growing chickens. Brit. J. Nutr. 34: 363, 1975.19. BODWELL, C. E. Biochemical indices in humans. In:
Evaluation of Proteins for Humans, edited by C. E.
Bodwell. Westport, Conn.: AVI, 1977, p. 119.
by guest on Septem
ber 23, 2011w
ww
.ajcn.orgD
ownloaded from
Appendix G Page G10

2470 FOMON ET AL.
Appendix
TABLE 1
Lengths of individual infants fed formula 1-501
Subject Birth 8 4date
#{149}28 42 56 84 112
-S
Unsupplemented2221 6.23.75 49.8 50.0 52.1 52.7 54.4 57.8 60.7
2222 6.24.75 49.2 49.8 52. 1 52.9 55.5 58.0 60.8
2223 6.25.75 49.9 50.5 52.7 54.6 56.3 58.5 61.7
2224 8.31.75 51.1 51.8 53.8 55.0 55.6 58.9 61.7
2226 1.26.76 52.5 53.4 55.7 57.1 57.9 61.5 65.2
2230 1 1.23.75 52.0 53.2 55.3 57.2 59.2 61.7 64.2
2233 12.13.75 49.1 49.7 52.6 53.7 56.3 58.8 61.12235 1. 3.76 49.8 50.6 52.0 53.2 55.6 58.1 60.8
2238 1.15.76 51.7 51.8 54.0 55.3 57.1 59.7 62.6
2240 2. 9.76 52.8 53.0 54.1
Supplemented with methionine
2220 2.25.76 52.0 52.8 54.4 54.8 57.3 60.2 62.4
2225 10.27.75 53.8 54.3 56.3 58.4 60.0 63.3 65.9
2227 11.14.75 53.4 54.0 55.4 57.1 58.2 59.8 61.42228 11.19.75 52.5 53.7 55.5 57.7 59.5 62.9 65.4
2229 1 1.20.75 49.9 50.6 52.2 53.9 54.7 57.7 61.0
2231 12.12.75 53.3 53.7 56.0 57.1 58.4 61.3 65.0
2232 12.16.75 51.9 52.4 54.6 55.8 56.6 59.9 62.4
2234 12.31.75 52.7 54.4 56.2 58.6 60.1 63.9 65.5
2236 1.13.76 51.4 52.6 53.5 54.8 56.9 58.7 62.3
2237 1.12.76 53.5 54.4 55.8 57.7 60.1 63.1 68.1
2239 2. 4.76 54.5 56.9 54.9 56.7 58.5 61.6 64.5
TABLE 2Weights of individual infants fed formula 1-501
Subject Birth 8 14weight
28 42 56 84 112
days
Unsupplemented
2221 3050 3065 3190 3552 4055 4535 5285 6025
2222 3145 3218 3355 4036 4661 5037 5743 6341
2223 3035 2997 3096 3525 4116 4771 5671 6322
2224 3375 3457 3566 3847 4057 4354 4949 5425
2226 3800 3721 3985 4730 5350 5849 6645 7365
2230 4000 4079 4199 4719 4914 5331 6101 6659
2233 3460 3489 3639 4488 5242 5798 6893 7542
2235 3345 3468 3624 4143 4560 5105 5853 6396
2238 3655 3510 3600 4058 4521 4803 5550 6207
2240 3260 3110 3360 3540
Supplemented with methionine
2220 3855 3669 3726 4064 4328 4949 5557 6174
2225 3800 4038 4230 4830 5335 5825 6595 7270
2227 4140 4004 3970 4237 4332 4700 5240 5300
2228 4000 3964 4075 4740 5176 5605 6070 6618
2229 3230 3431 3808 4422 4846 5343 6180 7015
2231 3740 3825 3919 4392 4876 5234 5631 6363
2232 3815 3750 4020 4661 5047 5531 6241 6861
2234 3970 4105 4325 5110 5805 6130 6885 7605
2236 3600 3662 4002 4815 5381 5673 6402 7200
2237 3925 3710 3953 4227 5072 5978 7500 8530
2239 4735 4730 4847 5485 5923 6564 7771 8664
by guest on Septem
ber 23, 2011w
ww
.ajcn.orgD
ownloaded from
Appendix G Page G11

SOY PROTEIN FORMULA FOR INFANTS 2471
aMissing values indicate that the infant did not consume the designated food in that age interval.
TABLE 3Average daily volume (ml) of formula consumed by
individual infants
Age inte
Subject
8-13 14-27 28-41
real (days)
42-55 56-83 84-Ill
Unsupplemented
2221 410 568 692 786 716 728
2222 565 734 766 761 731 688
2223 537 707 822 776 780 686
2224 429 499 550 569 642 615
2226 783 880 943 948 879 993
2230 570 655 805 892 928 950
2233 729 991 1116 1046 948 855
2235 657 806 835 877 883 886
2238 657 730 731 633 662 606
2240 493 585
Supplemented with methionine
2220 549 623 603 727 737 798
2225 747 816 782 843 863 839
2227 385 488 449 660 496 522
2228 689 801 698 719 742 845
2229 748 855 751 787 818 806
2231 659 663 737 769 798 889
2232 690 742 775 821 746 747
2234 740 823 920 886 856 866
2236 726 789 760 776 778 869
2237 571 506 877 1135 1072 1002
2239 801 907 886 951 966 923
TABLE 4
TABLE 5
Average daily weight (g) of beikost consumed
by individual infants (foods not permitted)
Subject
Age
inter�
val
Food
designationQuantity
2224
days
56-83 Bananas
g/day
81
2226 56-83 Similac 35
2238 42-55 Pears 1 I
2239 56-83 Applesauce 13
Average daily weight (g) of beikost consumed by individual infants�’
Age Oatm
Subject interval
(days) 28-41
cal with appl esauce and bananas Pears Applesauce
84-Ill
Bananas
84-Ill42-55 65-83 84-Ill 56-83 84-Ill
Unsupplemented
2221 4 31 44 43 5 4 8 4
2222 9 52 18 70 18 92 20
2223 14 12 67 42 41 33 23 37
2224 27 44 65
2226
2230
2233 73 55 69 26 8 22 18
2235 28 27
2238 52 158 136 5 14 4 110
Supplemented with methionine
2220 44 32 49 68 52 21 25 61
2225 18 27 22 45 23
2227 143 50 75 38 51 34
2228 60 68 65 55 24 9 13 7
2229 57 46 73 72 37 23 14 30
2231 22 13
2232 22 32 59 30 20 31 162234 23 30 7 9 9 18
2236 50 9 8 3 5 6
2237 41 66 75 79 82 38 10 56
2239 110 82 40 27 32 13
by guest on Septem
ber 23, 2011w
ww
.ajcn.orgD
ownloaded from
Appendix G Page G12

Requirement for Sulfur-ContainingAmino Acids in Infancy
SAMUEL J. FOMON, ERHARD E. ZIEGLER, STEVENE. NELSON AND BARBARAB. EDWARDS
Department of Pediatrics, College of Medicine, Universityof Iowa, Iowa City, IA 52242
ABSTRACT A series of studies designed to define the requirement of normalinfants for sulfur-containing amino acids (methionine, cystine) was conductedwith formulas providing 3.0, 2.8, 2.6, 2.2 or 1.8 g of isolated soy protein per 100kcal. The formulas were fed with or without a methionine supplement. Adequacyof the diet was determined by measurement of growth, serum chemical indicesand nitrogen balance. Nitrogen balance demonstrated a beneficial effect of methionine supplementation only at the lowest protein concentration (1.8 g/100 kcal).However, measurement of weight gain and/or serum concentrations of urea nitrogen and albumin clearly showed a beneficial effect of methionine supplementation at protein concentrations of 2.2 and 2.6 g/100 kcal. Intakes of sulfur-containing amino acids of 435 and 495 p.mol/100 kcal therefore appear inadequate.At higher intakes of protein (2.8 and 3.0 g/100 kcal) there was no beneficial effectof methionine supplementation. Possible exceptions were male infants providedwith 3.0 g protein per 100 kcal, in whom weight gain between 8 and 56 d of agewas significantly (P < 0.05) greater with than without a methionine supplement.Based on intakes of sulfur-containing amino acids from the formula providing 2.8g of isolated soy protein per 100 kcal without methionine supplementation, weconclude that for male infants older than 56 d the requirement for sulfur-containing amino acids is no more than 588 (jimol/100kcal when intake of methionine is264 n.mol/100 kcal. However, it seems possible that such intakes fail to meet therequirement in male infants less than 56 d of age. For female infants, regardlessof age, 533 (xmol/100 of sulfur-containing amino acids per 100 kcal meet therequirement when intake of methionine is 239 ji.mol/100 kcal. J. Nutr. 116:1405-1422, 1986.
INDEXING KEY WORDS sulfur-containing amino acids •methionine •isolated soy protein •normal infants
Requirements of infants for methionine kcal. It was concluded that requirementswere estimated by Snyderman et al. (1) for methionine of individual infants rangedwith diets containing mixtures of 18 crys- from 210 to 322 p.mol/100 kcal. Under thetalune L-amino acids. Seven male infants, circumstances of the studies, intake of totalincluding three preterm infants, were sulfur-containing amino acids was 740-studied. Total nitrogen intakes were 852 u,mol/100 kcal. For 4 of the 7 infantsapproximately 480 mg/100 kcal, equiva- (2 full term infants under 2 mo of age andlent to a protein intake of 3.0 g/100 kcal.Cystine comprised 2.14% by weight of theamino acid mixture (2), resulting in cys- ~T7ZT!~
, _ i ,-o,r> ©1986 American Institute of Nutrition. Received for publication:tine intake Ol approximately 530 (Jimol/lOO 2 December lOSS. Accepted for publication: 14 March 1986.
1405
by guest on Septem
ber 23, 2011jn.nutrition.org
Dow
nloaded from
Appendix G Page G13

1406 FOMON ET AL.
2 preterm infants over 2 mo of age) methi-onine intakes of 210-224 u.mol/100 kcal(total sulfur-containing amino acid intakesof 740-754 n.mol/100 kcal) were deemedinadequate.
The requirement for methionine estimated by Snyderman et al. is considerablygreater than the intake by breast-fedinfants. Mean protein intakes of breastfed infants have been estimated to be 1.86g/100 kcal during the first 2 mo of life, and1.39 g/100 kcal between 2 and 4 mo of age(3). With concentration of methionine 114|imol/g of human milk protein (4), intakesof methionine average 212 ^mol/100 kcalduring the first 2 mo of life and 159 n,mol/100 kcal between 2 and 4 mo of age. Thecystine concentration of human milk is223 jxmol/g protein (4) (i.e., 415 nmol/100kcal during the first 2 mo of life and 310|junol/100 kcal from 2 to 4 mo of age), andthe concentration of taurine is about 45p.mol/100 kcal (5). Thus, the intake of totalsulfur-containing amino acids of breastfed infants is estimated to be 672 fimol/100 kcal in the first 2 mo of life and 513u.mol/100 kcal between 2 and 4 mo of age.
The conclusion of Snyderman et al. (1)that intakes of sulfur-containing aminoacids of 740-754 u.mol/100 kcal failed tomeet the requirements of several infantsmay be a result of the study design. Evaluation of performance was based on nitrogen balance and weight gain. However,in most instances in which methionineintakes of 224 u.mol/100 kcal or less werefed, nitrogen balance appeared satisfactory and the conclusion regarding inadequacy of methionine intake was basedsolely on weight gain over brief intervals(generally 5-13 d). For such intervals, thedistinction between adequate and inadequate growth of an individual infant isdifficult. Moreover, in some instances,infants were fed diets devoid of methionine, followed by a diet providing 151urnol of methione per 100 kcal before beingfed the diet providing 210-224 (¿molofmethionine per 100 kcal. Thus, somemethionine depletion may have precededthe evaluation of the diet providing 740to 754 (jLiimlof sulfur-containing aminoacids per 100 kcal.
Because of the uncertainties of the Snyderman et al. (1) conclusion about the
requirement for methionine, we decidedto conduct further studies. Isolated soyproteins are attractive for studies ofrequirements for sulfur-containing aminoacids because concentrations of methionine and cystine per unit of protein arelow in relation to concentrations of non-sulfur-containing essential amino acids. In1979 we (6) reported a study of two groupsof infants fed a formula in which proteinwas supplied in the form of isolated soyprotein unfortified with methionine. Theformula provided 2.24 g protein (354 mgof nitrogen) per 100 kcal, an amount wellabove the requirement when cow milk-based formulas are fed and, as alreadynoted, greater than amounts consumed bybreast-fed infants. One group of infantswas given a supplement of L-methioninein drop form with each feeding. The findings were inconclusive. Although therewas no significant difference in rates ofgrowth of infants in the two feeding groups,mean serum concentration of urea nitrogen was significantly less in the supplemented infants. Bodwell (7) has summarized evidence indicating that when proteins of different quality are fed at similarintakes of nitrogen, animals consuming theprotein of lesser quality demonstrategreater serum concentrations of ureanitrogen and our results therefore suggested that the addition of L-methionineimproved protein quality. In addition,although not statistically significant,nitrogen retention was slightly greaterwhen infants were given the L-methionine supplement. We now report additional studies in which infant formulasprepared from isolated soy protein withno added methionine were fed with orwithout a methionine supplement. Theadequacy of the diet was judged by observations of food intake, growth, serumchemical indices and nitrogen balance. Webelieve that the results provide betterestimates of the infant's requirement forsulfur-containing amino acids than do thosepreviously available.
SUBJECTS
Normal term infants with birth weightsof 2500 g or more (appendix 1) were studied. The study protocols were reviewed
by guest on Septem
ber 23, 2011jn.nutrition.org
Dow
nloaded from
Appendix G Page G14

SULFUR-CONTAINING AMINO ACIDS IN INFANCY 1407
and approved by the University of IowaCommittee on Research Involving HumanSubjects. At the time an infant was enrolledin the study, at least one of the parentswas interviewed by B. B. Edwards. Theprogram was described in detail, writtenpermission was obtained and writteninstructions were provided. Two types ofstudy were conducted: 1) "growth studies," consisting of determination of food
intake, growth and serum chemical values, and 2) metabolic balance studies.
Infants serving as subjects for the growthstudies were enrolled between 6 and 9 dof age, and the majority completed theplanned 112 d of observation. Until thetime of enrollment, most of these infantshad been fed commercially prepared milk-based formulas. Infants serving as subjects for the metabolic balance studiesdescribed here had generally served previously as subjects for other metabolicbalance studies. These infants did not participate in the growth studies.
FEEDINGS
The experimental formulas were prepared for us by two manufacturers: WyethLaboratories, Radnor, PA, prepared formula 2.6; the other formulas were prepared by Ross Laboratories, Columbus,OH. Except for differences in protein concentration and omission of the usual supplement of L-methionine, the formulaswere similar to commercially availableisolated soy protein formulas. The formulas were supplied to us ready to feed,approximately 67 kcal/dL, in 240-mL glassbottles to which a nipple assembly couldbe attached. Each formula was preparedby the manufacturer as a single batch. Protein was provided from Edipro A (RalstonPurina Co., St. Louis, MO), an isolated soyprotein that provides 87 (jimol of methio-nine and 107 n-mol of cystine per gram ofprotein (8). We have designated the formulas in relation to the approximate protein concentration (g/100 kcal) as indicated in table 1: formulas 3.0, 2.8, 2.6, 2.2and 1.8. Fat was provided as a mixture ofvegetable oils: formulas 3.0, 2.8, 2.2 and1.8 contained 60% soy oil and 40% cornoil; formula 2.6 contained 33% oleo oil,27% coconut oil, 25% high oleic safflower
oil and 15% soy oil. Carbohydrate consisted of 70% corn syrup solids and 30%sucrose in formulas 3.0, 2.8, 2.2 and 1.8,and 100% sucrose in formula 2.6. Furtherinformation regarding the composition ofthe formulas is presented in table 1.
A supply of formula sufficient for 7 dwas weighed and delivered to the family.When a new supply was delivered 7 dlater, the bottles from the previous supply, including any unconsumed amountsof formula, were collected and againweighed. Bottles for each 24-h period wereweighed separately. In addition to the formula, each infant received a daily supplement of 0.25 mg of fluoride (Karidium Liquid, Lorvic Corporation, St. Louis, Missouri). When the experimental designcalled for the addition of methionine, onedropperful of the methionine solution,approximately 82 p,mol of methionine, wasadded to each 240 mL (163 kcal) of formula (i.e., 50 n.mol/100 kcal) shortly beforefeeding. The L-methionine was dissolvedin distilled water, 82 (i,mol/mL, and wasprovided in 120-mL glass bottles with adropper that delivered approximately 1mL.
In contrast to feeding practices in theearlier study (6), the parents wereinstructed not to feed beikost ("solid"
foods) and, except for minor infractionsthat are noted in appendix 2, the formulaserved as sole source of food.
PROCEDURES
Growth studies
Infants were studied from the time ofenrollment (between 6 and 9 d of age) to112 d of age. Body weight and length weredetermined as described previously (9).Measurements were made between 6 and9 d of age, within 2 d of ages 14, 28, 42and 56 d and within 4 d of ages 84 and 112d. A detailed description of the intervalsof study and the way in which they areapplied to data analysis has been presented (10). The methods for obtainingvenous blood and for analyses of serum,foods and excreta were the same as in previous studies (10). Serum concentrationsof urea nitrogen and albumin were performed as described previously (11).
by guest on Septem
ber 23, 2011jn.nutrition.org
Dow
nloaded from
Appendix G Page G15

1408 FOMON ET AL.
TABLE 1
Composition of feedings1
Major constituents, g/100kcal2Protein3Fat4-5Carbohydrate4'6Minerals,
perLCalcium,mgPhosphorus,mgMagnesium,mgSodium,meqChloride,meqPotassium,meqIron,mgZinc,mgCopper,mgManganese,
mg73.03.035.4410.0011638297519.322.832.520.18.51.090.742.82.755.2910.0010717348524.020.321.518.27.81.350.44Formula2.«2.555.2710.6996162811013.918.126.724.68.80.700.842.22.245.4110.599475997521.322.824.723.78.81.87-1.81.755.2910.597065408517.532.935.629.07.11.010.54
'Formulas 3.0, 2.8, 2.2 and 1.8 were supplemented as follows (weight/liter): iodine, 100 (i.g; vitamin A,2000 IU; vitamin D, 400 IU; vitamin E, 20 IU; vitamin K, 0.1 mg; vitamin C, 55 mg; thiamin, 0.40 mg;riboflavin, 0.60 mg; vitamin B-6,0.40 mg; vitamin B-12,3.0 p.g; niacin, 9 mg; folie acid, 100 (ig; pantothenicacid, 5 mg; biotin, 30 (ig; choline, 53 mg; inositol, 32 mg. Formula 2.8 was supplemented as follows: iodine,65 (ig; vitamin A, 2500 IU; vitamin D, 400 IU; vitamin E, 9 IU; vitamin K, 0.1 mg; vitamin C, 55 mg; thiamin,0.67 mg; riboflavin, 1 mg; vitamin B-6, 0.4 mg; vitamin B-12, 2 jig; niacin, 9.5 mg; folie acid, 50 (ig;pantothenic acid, 3 mg; biotin, 35 jig; choline, 85 mg; inositol, 26 mg. Calculated metabolizable energyof each formula was 67 or 68 kcal/dL. 3Edipro A. 4Manufacturer's analysis. Other values are thosedetermined by authors. 560% soy oil and 40% corn oil except for formula 2.6, where fat was 33% oleooil, 27% coconut oil, 25% high oleic safflower oil and 15% soy oil. 6Sucrose in formula 2.6; in all otherformulas 70% corn syrup solids and 30% sucrose. 7 Manganese concentration of formula 2.2 was not
determined.
Two different study designs were used,referred to subsequently as longitudinaland balanced crossover. In studies usinga longitudinal design (those with formulas3.0 and 2.2) the same formula with or without the methionine supplement was fedfrom the time of enrollment through 112d of age. In studies using a balanced crossover design (those with formulas 2.8 and2.6), each infant was fed the unsupple-mented formula at some times and thesupplemented formula at other times.Subjects in group A received no supplement from 8-27 d and from 56-83 d ofage; they received the supplement from28-55 d and from 84-111 d of age. Subjects in group B were given the supplement in the opposite sequence, beginningwith the supplement in the interval 8-27d ofage.
Formula 3.0. Male and female infantswere studied using a longitudinal design.Seventeen male infants were enrolled,nine in the group that did not receive the
methionine supplement (group 3.0) andeight in the group that received the supplement (group 3.0m). One infant in group3.0 was withdrawn from the study soonafter the visit at 14 d of age because thefamily was away from Iowa City for several weeks. Data on this infant are includedin appendices 1 and 2. Nineteen femaleinfants were enrolled. Initially, nine wereentered into group 3.0 and eight into group3.0m. Twins were then enrolled and,through an error, both rather than one wereassigned to group 3.0. All 19 infants completed the planned period of observation.
Formula 2.8. Female infants were studied using a balanced crossover design.Eighteen infants were enrolled and 16completed the planned period of observation, 8 in group A and 8 in group B. Oneinfant was withdrawn from the growthstudy at 22 d of age to be enrolled in metabolic balance studies, and one infant waswithdrawn from the study at 42 d of agebecause of constipation attributed to the
by guest on Septem
ber 23, 2011jn.nutrition.org
Dow
nloaded from
Appendix G Page G16

SULFUR-CONTAINING AMINO ACIDS IN INFANCY 1409
formula. Data on the two infants who failedto complete the study are included inappendices 1 and 2.
Formula 2.6. Male infants were studiedwith a balanced crossover design. Eighteen male infants were enrolled, and 15completed the planned period of observation, 7 in group A and 8 in group B. Oneinfant was withdrawn from the study afterthe visit at 84 d of age because the familymoved from the city. Two other infantswere withdrawn from the study after thevisit at 14 d of age, one because of fussi-ness and spitting up and one because ofblood in the stools. Data on these infantsare included in appendices 1 and 2.
Formula 2.2. Male infants were studiedusing a longitudinal design. As reportedearlier (6), 19 male infants completed thestudy from 8 to 112 d of age while consuming an isolated soy protein formula thatprovided 2.2 g protein/100 kcal (designated in this report as formula 2.2).
Reference data. To aid the reader inevaluating the performance of infants fedthe various levels of isolated soy proteinwith and without methionine supplementation, data from infants fed cow milk-basedformulas are included. The data concern81 male and 63 female infants studied witha longitudinal design. Dates of birth ofthese infants spanned the period fromSeptember 1974 through March 1984.Dates of birth of infants in the methioninesupplementation studies, including thepreviously reported one (6), ranged fromJune 1975 through January 1984. The milk-based formulas were either commerciallyavailable or similar to commercially available milk-based formulas. Protein concentrations ranged from 2.09 to 2.69 g/100kcal (1.4. to 1.8 g/dL), and hence intakesof sulfur-containing amino acids (12)ranged from 533 to 686 fimol/100 kcal. Dataon energy intake and growth of theseinfants are presented in table 2.
Metabolic balance studies
Metabolic balance studies were carriedout with each of the five formulas in abalanced crossover design whereby eachinfant received the formula without supplement during some balance studies andwith supplement during other balance
studies. The formula under study, with orwithout the supplement, was fed for atleast lid before beginning a balance study.Balance studies of 72 h duration were performed as described previously (9) withthree infants fed formula 3.0, four infantsfed formula 2.8, three infants fed formula2.6, four infants fed formula 2.2 and fiveinfants fed formula 1.8. The number ofinfants studied was determined to a majorextent by the number available to us atthe time.
Data analysis
The analyses of data pertain only toinfants who completed the planned periodof observation from 8 to 112 d of age. Dataon length, weight and formula intake ofthe other infants are included in appendices 1 and 2.
For growth studies with longitudinaldesign, one-way analysis of variance wasused to compare energy intakes and growthfor the various age intervals. For the studies with a crossover design (those withformulas 2.8 and 2.6), the age intervals 8—27, 28-55, 56-83 and 84-111 d were analyzed separately. Linear contrasts (13) wereused to compare performance during periods with supplementation with that during periods without supplementation andfor comparison with performance of infantsfed milk-based formulas. Serum concentrations of urea nitrogen and albumin wereanalyzed by a repeated-measures analysisof covariance. Data from the metabolicbalance studies were analyzed by a randomized block, mixed effects model. Allstatistical analyses were performed by thegeneral linear models procedure of theSAS statistics program (SAS Institute, Inc.Cary, NC).
RESULTS
Growth studies
It will be helpful to the reader to knowthat performance (i.e., growth, serumchemical values and/or nitrogen balance)of infants fed formulas 3.0 and 2.8 withoutsupplemental methionine was considered adequate, with the possible exception of male infants less than 56 d of age.On the other hand, performance of infants
by guest on Septem
ber 23, 2011jn.nutrition.org
Dow
nloaded from
Appendix G Page G17
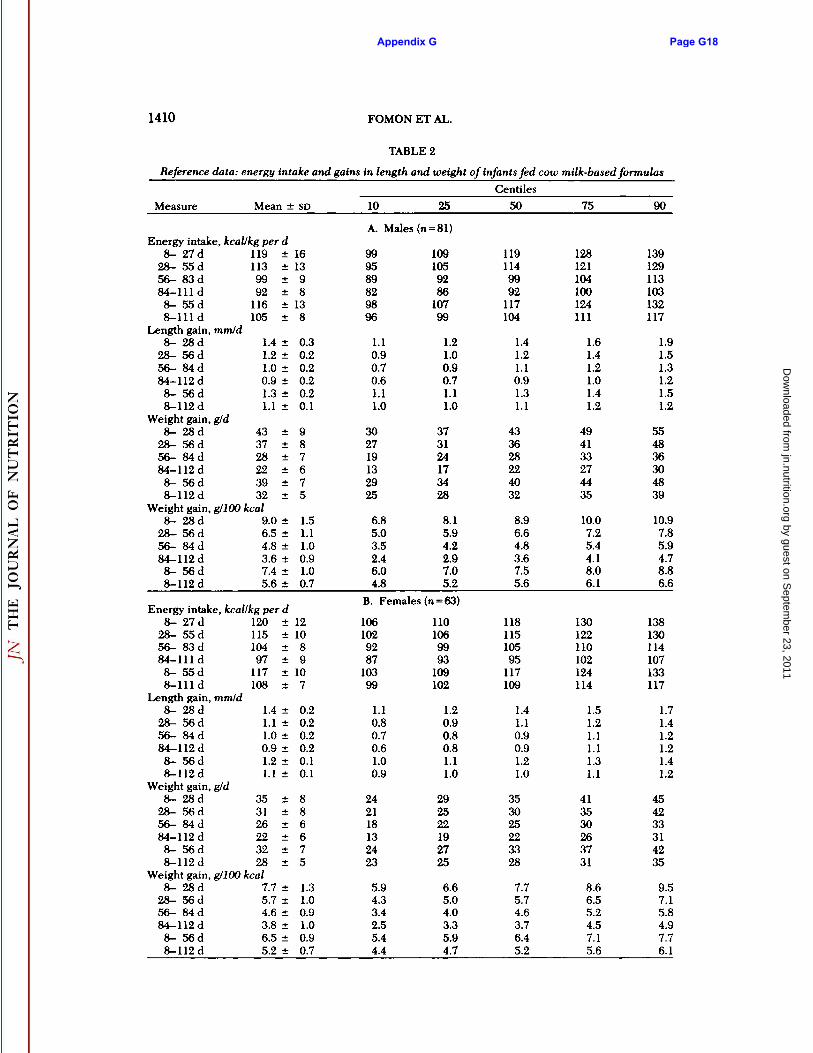
1410 FOMON ET AL.
TABLE 2
Reference data: energy intake and gains in length and weight of infants fed cow milk-based formulas
MeasureMean ±SD10A.
Males (i251=81)Gentiles507590Energyintake, kcal/kg perd8-
27d28-55d56-
83d84-111d8-
55d8-111dLength
gain,8-28d28-
56d56-84d84-1
12d8-56d8-112
d119
±113±99±92
±116±105
±mmld1.4
±1.2±1.0±0.9±1.3±1.1
±1613981380.30.20.20.20.20.19995898298961.10.90.70.61.11.01091059286107991.21.00.90.71.11.011911499921171041.41.21.10.91.31.11281211041001241111.61.41.21.01.41.21391291131031321171.91.51.31.21.51.2Weightgain,g/d8-
28d28-56d56-84d84-112d8-
56d8-112dWeight
gain,8-28d28-56d56-84d84-112d8-
56d8-112d43
±37±28±22±39±32
±g/100kcal9.0
±6.5±4.8±3.6±7.4±5.6
±9876751.51.11.00.91.00.7Energy
intake, kcal/kg perd8-27d28-55d56-
83d84-111d8-
55d8-111dLength
gain,8-28d28-56d56-84d84-112
d8-56d8-112dWeight
gain,8-28d28-56d56-84d84-112d8-
56d8-112dWeight
gain,8-28d28-56d56-84d84-112d8-
56d8-112d120
±115±104±97
±117±108
±mmld1.4
±1.1±1.0±0.9±1.2±1.1
±g/d35
±31±26±22±32±28
±g/100kcal7.7
±5.7±4.6±3.8±6.5±5.2
±1210891070.20.20.20.20.10.18866751.31.00.91.00.90.73027191329256.85.03.52.46.04.8B.
Females1061029287103991.10.80.70.61.00.92421181324235.94.33.42.55.44.43731241734288.15.94.22.97.05.2(n=63)11010699931091021.20.90.80.81.11.02925221927256.65.04.03.35.94.74336282240328.96.64.83.67.55.6118115105951171091.41.10.90.91.21.03530252233287.75.74.63.76.45.249413327443510.07.25.44.18.06.11301221101021241141.51.21.11.11.31.14135302637318.66.55.24.57.15.655483630483910.97.85.94.78.86.61381301141071331171.71.41.21.21.41.24542333142359.57.15.84.97.76.1
by guest on Septem
ber 23, 2011jn.nutrition.org
Dow
nloaded from
Appendix G Page G18

SULFUR-CONTAINING AMINO ACIDS IN INFANCY 1411
fed formulas 2.6 and 2.2 was consideredadequate only with supplemental methi-onine. Data on length, weight and formulaintake of individual infants are presentedin appendices 1 and 2, except for previously reported data (6) for infants fed formula 2.2.
Formula 3.0. Data on energy intake, gainin length and gain in weight by infants fedformula 3.0 are presented in table 3. Amongmale infants, energy intake and gain inlength in groups 3.0 and 3.0m during allage intervals were similar to those of maleinfants fed milk-based formulas (table 2A).For the age interval 8—112d, gain in weight(g/d) by group 3.0 was somewhat lower
than that by group 3.0m or by the milk-based formula group. However, the differences were not statistically significant(P = 0.051 and 0.324, respectively). Similarly, gain in weight (g/100 kcal) was notsignificantly different in groups 3.0, 3.0mand the milk-based formula group. However, for the age interval 8-55 d gain inweight (g/d) of male infants was significantly less by group 3.0 than by group3.0m (P = 0.025) or by the milk-basedformula group (P = 0.043), whereas energyintake and gain in length were not significantly different by infants in group 3.0,group 3.0m and the milk-based formulagroup. Gains in weight per unit of energy
TABLE 3
Food intake and growth by infants fed formula 3.0'
Males Females
Measure 3.0 (8) 3.0m2 (8) 3.0(11) 3.0m (8)
Size at age 8 d3
Length, mmWeight, g
5093517
± 22 511 ±12 504 ± 18 513 ± 12±420 3570 ±413 3379 ±359 3593 ±230
Energy intake, kcal/kg per d8- 27d28-
55d56-83d84-111
d8-55d8-111
dLengthgain,8-
28d28-56d56-
84d84-112d8-
56d8-112dWeight
gain,8-28d28-56d56-84d84-112d8-56d8-112
dWeightgain,8-
28d28-56d56-84d84-112d8-
56d8-112d11611110293113105mm/d1.271.190.970.951.231.08g/d37.331.228.724.133.8--*29.8g/100
kcal8.145.975.074.116.835.56±±±±+±±-f.±+±-t-±±•+-±±±±±±-+•-i-+1211871050.220.210.210.180.130.0911.68.16.54.57.12.21.721.481.040.661.020.39125
±116±100±90
±120±107
±1.23
±1.27±1.22±0.78±1.25±1.12
±45.4
±40.0±33.4±24.6±42.3±35.1±8.99
±6.74±5.26±3.84±7.61±5.90
±16111481280.400.280.210.300.160.139.510.913.010.19.59.31.111.121.471.151.041.02124
±115±98±91
±118±106
±1.28
±1.260.940.831.271.0638.734.126.9
±20.0±36.0±29.3±8.356.374.983.617.14*5.547777660.360.170.210.190.210.119.66.35.56.05.44.61.920.840.781.090.870.76111
±111±96±91
±111±102f
±1.26
±1.20±0.99±0.89±1.23±1.07
±37.2
±34.0±24.1±22.2±35.3±28.8±8.43
±6.31±4.33±3.81±7.08±5.42
±159127860.300.160.220.310.120.159.24.29.49.05.04.21.420.491.461.360.610.50
'Superscripts indicate statistical significances, with letters (", P < 0.05) referring to comparisons betweensupplemented and unsupplemented formulas within same sex and same age interval, and symbols (*, P <0.05; tP < 0.01) referring to comparisons with reference data (table 2) within same sex and same age interval;(n), number of subjects. zAn m indicates that a supplement of methionine was given. 3Values are
means ±so.
by guest on Septem
ber 23, 2011jn.nutrition.org
Dow
nloaded from
Appendix G Page G19

1412 FOMON ET AL.
intake by the three groups were not significantly different.
In the case of females (table 3), therewere no significant differences in comparisons of the three groups of infantsexcept that from 8-111 d of age energyintake was less by group 3.0m than by themilk-based formula group (P = 0.006) andthat from 8-55 d of age gain in weight perunit of energy intake was greater by group3.0 than by the milk-based formula group(P = 0.044). We have observed a significant difference in energy intake betweenfeeding groups in a number of our studiesand do not have a satisfactory explanation,especially when it occurs as an isolateddifference between groups. It seemsunsound to conclude that inadequatecomposition of the diet was responsiblefor greater food consumption because thedifference in energy intake between feeding groups was at times in the oppositedirection (see results with formulas 2.6and 2.6m).
Data on serum concentrations of ureanitrogen and albumin of infants fed formula 3.0 are summarized (sexes combined) in table 4. No effect of methioninesupplementation on serum concentrationof urea nitrogen was noted (analysis ofcovariance with age as covariate). Becauseserum concentration of urea nitrogen isinfluenced by protein intake (7) andbecause the range of protein intakes waslower from milk-based than from soy-basedformulas, values for urea nitrogen of infantsfed the former have not been included.Similar analysis failed to reveal statistically significant differences in serum concentration of albumin between group 3.0,group 3.0m and the milk-based formulagroup.
Formula 2.8. Data on energy intake andgrowth by females fed formula 2.8 are presented in table 5. Energy intake, gain inlength and gain in weight were similar forinfants in a specified age interval whetherthey were being fed formula 2.8, formula
TABLE 4
Scrum fonrentrations of urea nitrogen and albumin in relation to methionine l'Afri) supplementation'
Measure Formula 3.0 Formula 2.8 Formula 2.6 Formula 2.2 Milk-based
Urea nitrogen,mg/dl*Without
Met28d(14)56d(16)84d(16)112d
(15)WithMet28
d(10)56d(13)84d(14)112d(14)Albumin,
g/dlWithoutMet28
d(14)56d(16)84d(17)112d(15)With
Met28d(10)56d(13)84d(14)112d
(14)14.213.412.512.615.113.913.912.92.8
(4)2.9(6)2.0(8)1.5(6)3.0
(5)2.4(5)2.1(6)2.0
(5)3.72
±0.27(4)4.07±0.27(6)4.18±0.38(8)4.23±0.29(6)3.94
±0.24(5)4.01±0.16(5)4.23±0.17(6)4.30±0.32 (5)15.613.813.211.314.614.312.212.63.683.994.074.163.904.014.204.13±
2.2±1.3±2.2±0.4±
2.1±2.8±2.7±1.4±
0.18±0.17±0.18±
0.18±
0.12±0.33±0.22±
0.34(5)(7)(6)(7)(7)(5)(7)(5)(5)(7)(6)(7)(7)(5)(7)(5)11.811.310.111.611.210.711.39.7
-3.53"-*
:4.01
d3.90b-f:4.29
d3.94
:3.92d4.27d4.03
d0.51.42.22.52.11.61.6t
0.8:
0.22:0.42:0.21:0.19;
0.23:0.08:0.15:
0.33(8)(8)(7)(9)(8)(8)(9)(8)(8)(8)(7)(9)(8)(8)(9)(8)11.5»
±1.310.2»±1.310.1»±1.79.4»±1.69.5
±1.78.6±1.48.1±1.37.5±1.63.40*3.53»-*3.98*4.03*3.56*3.883.92f0.32
(129)0.47(124)0.22(118)0.26
(122)0.250.250.244.07*
0.203.80
±0.284.00±0.284.16±0.244.25±0.26
'Superscripts indicate statistical significances, with letters (•P < 0.05; hP< 0.01) referring to comparisonsbetween supplemented and unsupplemented formulas within same age interval, and symbols (* P < 0.05;t P < 0.01; t P < 0.001) referring to comparisons with reference data within same age interval. 2Valuesare means ±SD; (n), number of subjects.
by guest on Septem
ber 23, 2011jn.nutrition.org
Dow
nloaded from
Appendix G Page G20

SULFUR-CONTAINING AMINO ACIDS IN INFANCY 1413
TABLE 5
Food intake and growth by infants fed formulas 2.8 and 2.6 in studies using a crossover design1
Formula 2.8(females)MeasureSize
at age 8Group
A(8)d2Length,
mm 496±Weight,g3160 ±13393Group
B(8)5043542±
11±373Formula
2.6(males)Group
A(7)5113397±
15±407Group
B5083449+±(8)20315Energy
intake, kcal/kg perd8-27d28-55d56-
83d84-111dLength
gain,8-28d28-56d56-84d84-112dWeight
gain,8-28d28-56d56-84d84-112dWeight
gain,8-28d28-56d56-84d84-112 d122
±109-±106±91"
±mmld1.21
±1.16"1±0.99
±0.95m±g/d32.3
±30.1-±22.222.4™g/100
kcal7.795.93-4.223.74-17101250.410.300.190.165.88.58.55.50.941.231.380.97116-11299-102"1.43"1.030.94-0.9632.8-27.723.0-21.57.37"5.894.27-4.04±
10±14±7±10±
0.18±0.26±0.13±0.20±
8.4±6.5±5.5±7.1±
1.88±1.13±0.70±
0.68127132-.*114Õ111-*1.20"-*1.04-1.020.87-27.0»-*33.0-27.627.7™*5.79^*5.76m4.574.25-±
25±22±21±18±
0.40±0.21±0.16±0.30±
12.2±8.9±10.1±11.5±
2.29±1.49±1.67±
1.73123"'123nlm.t99«1.51-1.001.14-1.0137.4™31.230.6m24.57.89-5.50*4.97-3.95-t-±±±-t--t-^.¿^¿+±±^j;±91510100.280.170.080.2110.88.77.18.31.791.480.891.10
'Superscripts indicate statistical significances, with letters (",P < 0.05) referring to comparisons betweensupplemented and unsupplemented formulas within same sex and same age interval, and symbols (*P <0.05; tP < 0.01; ÕP< 0.001) referring to comparisons with reference data (table 2) within same sex andsame age interval. "'Period in which L-methionine supplement was given. 2Valuesare means ±SD;(n),number of subjects.
2.8m (table 5) or the milk-based formulas(table 2B). An exception concerned energyintake from 84-111 d of age. In this interval infants of group A, who were receivingthe supplement, demonstrated less energyintake than did those of group B (not supplemented) (P = 0.029) or those fed milk-based formulas (not significant, P = 0.195).As already mentioned, we do not considerthis difference between groups A and Bto suggest inadequacy of formula 2.8 without methionine.
Serum concentrations of urea nitrogenand albumin (table 4) were similar duringperiods in which the supplement was givenand periods in which no supplement wasgiven. Changes in serum albumin from 28to 56, 56 to 84 and 84 to 112 d failed todemonstrate an effect of methionine supplementation.
Formula 2.6. In each age interval, energyintake by infants fed formula 2.6 or for
mula 2.6m (table 5) was greater than thatby infants fed the milk-based formulas(table 2A) and for several of the intervalsthe difference was significant. For theentire interval 8-111 d ofage, energy intakeby group A was 120 kcal/kg per d and thatby group B was 114 kcal/kg per d. Theseintakes are greater than the 105 kcal/kgper d of the milk-based formula group (P< 0.001, P = 0.022, respectively). Thegreater intakes by infants fed formula 2.6may be related to the carbohydrate used(all sucrose). We have demonstrated thatunder circumstances of ad libitum feeding infants consume greater amounts of aformula in which all of the carbohydrateis sucrose than of an otherwise similar formula in which all of the carbohydrate is acorn starch hydrolysate of minimal sweetness (14). In the age interval 84-111 denergy intake was significantly greater (P= 0.012) by infants fed formula 2.6m than
by guest on Septem
ber 23, 2011jn.nutrition.org
Dow
nloaded from
Appendix G Page G21

1414 FOMON ET AL.
by infants fed formula 2.6.Asalready noted,there seems to be no reason to concludethat methionine supplementation wouldresult in increased food consumption, andwe are inclined to ignore the finding.
Gain in length from 8 to 28 d of age wasless by infants fed formula 2.6 than byinfants fed formula 2.6m (P = 0.042) or byinfants fed the milk-based formulas (P =0.035). In each of the other age intervals,gains in length were similar by infants fedformula 2.6, formula 2.6m and by the groupfed milk-based formula.
Gain in weight in each age intervaltended to be less by infants fed formula2.6 than by those fed formula 2.6m, butthe difference was statistically significantonly for the age interval 8-28 d (P = 0.034).In this age interval mean gain in weightby the unsupplemented infants was alsoless than that by the milk-based formulagroup (P < 0.001).
Gain in weight per unit of energy intakein each age interval tended to be less byinfants fed formula 2.6 than by those fedformula 2.6m but, as in the case of gainexpressed as grams per day, the differencewas statistically significant only for theage interval 8-28 d (P = 0.012). Both inthis age interval and in the age interval28—56d gain in weight per unit of energyintake (g/100 kcal) was less by infants fedformula 2.6 than by those fed the milk-based formulas (P < 0.001, P = 0.018,respectively).
Serum concentrations of urea nitrogenand albumin are presented in table 4. Noeffect of methionine supplementation onserum concentration of urea nitrogen wasnoted. Serum concentrations of albuminat ages 28 and 84 d were significantly lessfor the infants fed formula 2.6 than forthose fed formula 2.6m or for those fedmilk-based formulas (table 4). Althoughnot indicated in table 4, within each group(groups A and B) the change in serum concentration of albumin in the successiveage intervals, 28-56, 56-84 and 84-112 din each instance tended to be greater during periods of supplementation than during periods without supplementation.Although the difference was statisticallysignificant for the age interval 28-56 d (P= 0.041), it was not significant for the age
intervals 56-84 d (P = 0.051), or 84-112d (P = 0.801).
Based on the lower gain in length andweight and on the difference in serumalbumin concentration, the performanceof male infants fed formula 2.6 withoutmethionine supplementation was considered inadequate.
Formula 2.2. A summary of data onenergy intake and growth of male infantsfed formula 2.2 is presented in table 6.For the age interval 8-111 d, energy intakewas greater by group 2.2 than by group2.2m (not significant, P = 0.057) or by themilk-based formula group (P = 0.006).Gainin length was similar for groups 2.2 and2.2m and the milk-based formula group.Differences in gain in weight (g/d and g/100 kcal) between groups 2.2 and 2.2mand the milk-based formula group werenot statistically significant.
In the age interval 8-55 d, energy intakeby group 2.2 was not significantly different from that by group 2.2m or by the milk-based formula group. Gain in weight bygroup 2.2 tended to be slightly less thanthat by group 2.2m (P = 0.284) but wassignificantly (P = 0.030) less than that bythe milk-based formula group. Similarly,gain in weight per unit of energy intaketended to be less by group 2.2 than bygroup 2.2m (not significant, P = 0.281)and was significantly (P = 0.003) less thanthat by the milk-based formula group.
Data on serum concentrations of ureanitrogen and albumin are summarized intable 4. Concentration of urea nitrogenwas significantly greater in group 2.2 thanin group 2.2m (P = 0.009). Analysis ofcovariance with age as the covariate failedto reveal a significant difference in serumconcentration of albumin between groups2.2 and 2.2m. Concentration of albuminin group 2.2 was significantly less than inthe milk-based formula group (P = 0.001).Concentration of albumin was not significantly less in group 2.2m than in the milk-based formula group (P = 0.058).
Although we initially were uncertainabout the interpretation of our results fromstudies of formulas 2.2 and 2.2m (6), rean-alysis of the data with the additional reference group of infants fed milk-basedformulas now leads us to conclude that
by guest on Septem
ber 23, 2011jn.nutrition.org
Dow
nloaded from
Appendix G Page G22

SULFUR-CONTAINING AMINO ACIDS IN INFANCY 1415
TABLE 6
Food intake and growth by males fed formula 2.2'
MeasureFormula 2.2 (9) Formula 2.2m (10)Size
at age 8 d2Length, mm 506 13 525 ± 13Weight, g 3445 332 3888 ±357
Energy intake, kcal/kg p rd8- 27 d 124 24 116 ±1428-
55d56-83d84-111d8-
55d8-111dLength
gain,8- 27d28-
55d56-83d84-111
d8-55d8-111
dWeightgain,
8- 27d28-55d56-
83d84-111d8-
55d8-111d122
15108699
512317113h
8mm/d
1.40 ±0.241.101.001.021.221.11e/d33.933.728.222.233.7"29.1Weight
gain, g/100 kcal8- 27 d7.1928-
55d56-83d84-111
d8-55d8-111
d5.964.773.650.270.180.140.210.0711.19.85.03.19.35.91.191.230.470.576.39'1±0.925.14
± 0.63110
±102±98
±113±106
±1.20
±1.17±1.09±1.06±1.18±1.12
±39.3
±36.0±28.6±26.7±37.4±32.1
±7.80
±6.24±4.45±3.99±6.88±5.35
±12119660.410.280.190.340.230.4112.09.712.05.26.16.81.770.891.140.560.770.70
'Superscripts indicate statistical significances; "P< 0.05; hP< 0.01 referring to comparisons with reference data (table 2) within same sex and same ageinterval. 2VaIuesare means ±SD;(n), number ofsubjects.
the addition of methionine increased thenutritional quality of the formula.
Metabolic balance studiesResults of the balance studies are sum
marized in table 7, and data from individual balance studies, except for those withformula 2.2 [previously reported (6)], aregiven in appendix 3.
When infants are fed the same formulaunder similar conditions, as in consecutively performed metabolic balance studies in our unit, intakes of nitrogen are generally quite similar. This similarity in
intakes, which was observed in the pairedbalance studies with and without the L-methionine supplement, permits the useof nitrogen retention as an indication ofthe advantage of supplementation. Withformulas 3.0, 2.8, 2.6 and 2.2 no statistically significant effect of methionine supplementation on retention of nitrogen wasdemonstrated. However, at the lowestnitrogen concentration (formula 1.8) aneffect of methionine supplementation onretention of nitrogen was observed. Thiseffect was statistically significant (P =0.001). Individual values for studies withformula 1.8 are presented in figure 1.
DISCUSSION
Some years ago we attempted to estimate the requirements of infants for sulfur-containing amino acids on the basis ofgrowth and nitrogen balance of infants fedformulas with cow milk protein or withmethionine-supplemented isolated soyprotein (15). Data from other investigators(16-22) and from our laboratory (23) concerning growth of infants fed soy formulascan also be used for estimating requirements for sulfur-containing amino acids,although in most instances the intakes offormula were not precisely measured. Webelieve that the estimates we made in 1973are less reliable than those now presentedfrom studies of infants fed isolated soyprotein formulas with and without a supplement of L-methionine. A similarapproach has been used in studies of adultsubjects (24—26).Interpretation of data fromthe studies presented here is facilitatedby the inclusion of a reference group ofinfants observed concurrently while beingfed cow milk-based formulas.
In the metabolic balance studiesreported here, a beneficial effect of methionine supplementation on nitrogen balance was demonstrated only when isolated soy protein was fed at a low level ofprotein intake—1.75 g/100 kcal (formula1.8)—providing 340 jimol of sulfur-containing amino acids per 100 kcal. Similarfindings have been reported by Graham(27) in studies of children convalescingfrom malnutrition. Eight children 6—23moof age were fed soy flour or isolated soy
by guest on Septem
ber 23, 2011jn.nutrition.org
Dow
nloaded from
Appendix G Page G23

1416 FOMON ET AL.
TABLE 7
Effect of methionine supplementation on nitrogen balance of infants less than 210 d of age
Nitrogen balance
Intake ExcretionFeeding1 No. Subjects No. Studies Urine Feces
Retention
3.03.0m2.82.8m2.62.6m2.22.2m1.81.8m33443344556563(125)268855771010551592586444467374380318318(92)(34)(43)(83)(77)(76)(51)(39)(52)mg/kgperd240
(33)248(31)268
(49)287(43)227(21)212
(23)181
(30)173(31)136(14)117(16)93
(32)104(28)99(20)101(23)96(15)100
(27)73(16)70(17)59(15)52(14)230199225197121155120137122*149*(72)(69)(53)(39)(55)(46)(52)(41)(22)(47)
'An m indicates that the supplement of L-methionine was given. "Values in parentheses are standarddeviations. 2Difference in retention with and without the supplement is statistically significant (P <
0.01).
protein with or without a supplement ofmethionine. The studies were carried outat low protein intakes: 1.0 g/100 kcal inthree children and 1.25 to 1.75 g/100 kcalin the others. In each instance a beneficialeffect of methionine supplementation wasdemonstrated. Assuming that soy flourprovides 94 (xmol of methionine and 132H-mol of cystine per gram of protein andthat isolated soy protein provides 87 p-molof methionine and 107 jimol of cystine pergram of protein (8) the unsupplementeddiets of the eight children provided 87 to165 n-mol of methionine and 107 to 231H-mol of cystine g/100 kcal. Thus we conclude that intakes of methionine of 87 to165 M-mol/100kcal with intake of total sulfur-containing amino acids of 194 to 396^.mol/100 kcal were inadequate for youngchildren during convalescence from malnutrition.
From our studies and those of Graham(27), we conclude that a beneficial effectof methionine supplementation on nitrogen balance can be demonstrated whenthe intake of sulfur-containing amino acidsis 396 p.mol/100 kcal or less. However,with greater intakes of sulfur-containingamino acids (e.g., 435 to 495 n.mol/100 kcal,as with formulas 2.2 and 2.6), nitrogen bal
ance appears to be an insensitive index ofprotein quality.
Contrary to nitrogen balances, gain inweight and/or serum concentrations of ureanitrogen and albumin demonstrated abeneficial effect of methionine supplementation with intakes of sulfur-containing amino acids of 435 |j,mol/100 kcal (formula 2.2) and 495 (xmol/100 kcal (formula2.6). Such intakes therefore appear to beinadequate.
No evidence of a beneficial effect ofmethionine supplementation was evidentin female infants fed isolated soy proteinat a level of 2.8 or 3.0 g/100 kcal. Theindices evaluated were gain in length, gainin weight, serum concentrations of ureanitrogen and albumin, and nitrogen balance studies. From these observations weconclude that the intakes of isolated soyprotein were adequate to meet therequirements of females for protein andfor essential amino acids. An intake of 2.75g of protein per 100 kcal resulted in anintake of 239 \Lmol of methionine and 294H-molof cystine per 100 kcal. We concludethat for female infants, 533 fimol of totalsulfur-containing amino acids per 100 kcalmeet the requirement when intake ofmethionine is 239 n.mol/100 kcal.
by guest on Septem
ber 23, 2011jn.nutrition.org
Dow
nloaded from
Appendix G Page G24
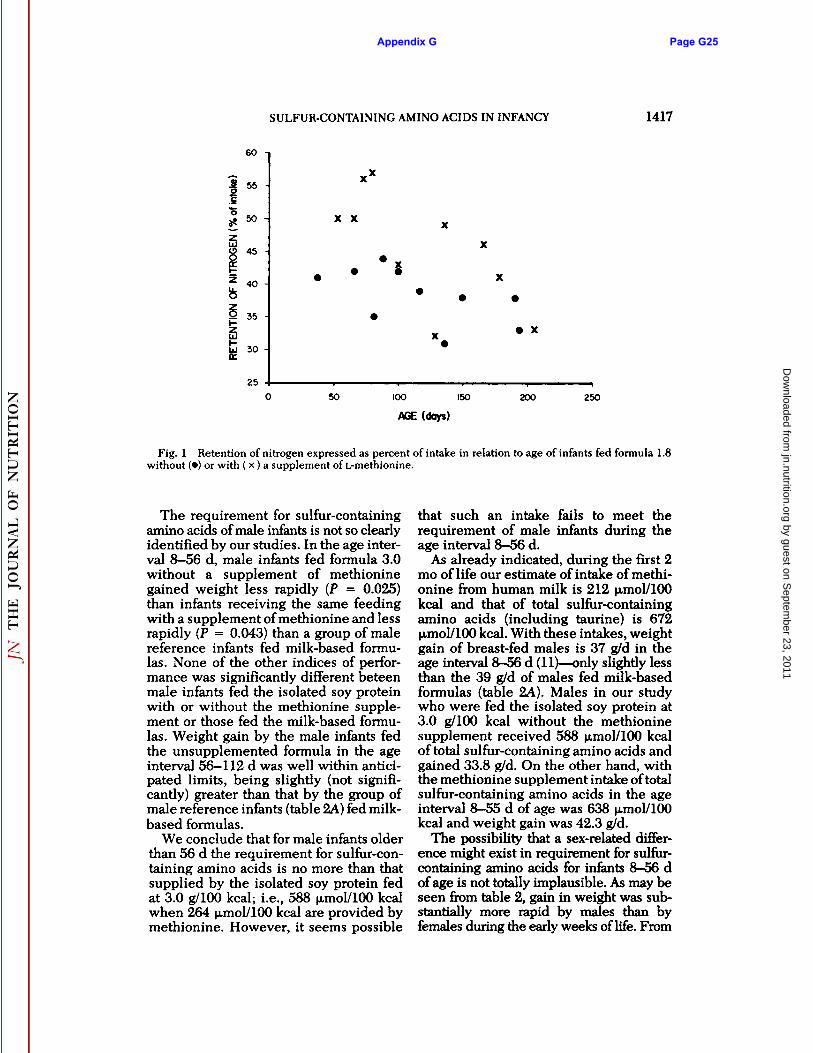
SULFUR-CONTAINING AMINO ACIDS IN INFANCY 1417
60 n
55
45
«M
35-
25
X X
50 100 150
AGE (days)
200 250
Fig. 1 Retention of nitrogen expressed as percent of intake in relation to age of infants fed formula 1.8without (•)or with ( x ) a supplement of L-methionine.
The requirement for sulfur-containingamino acids of male infants is not so clearlyidentified by our studies. In the age interval 8-56 d, male infants fed formula 3.0without a supplement of methioninegained weight less rapidly (P = 0.025)than infants receiving the same feedingwith a supplement of methionine and lessrapidly (P = 0.043) than a group of malereference infants fed milk-based formulas. None of the other indices of performance was significantly different beteenmale infants fed the isolated soy proteinwith or without the methionine supplement or those fed the milk-based formulas. Weight gain by the male infants fedthe unsupplemented formula in the ageinterval 56-112 d was well within anticipated limits, being slightly (not significantly) greater than that by the group ofmale reference infants (table 2A)fed milk-based formulas.
We conclude that for male infants olderthan 56 d the requirement for sulfur-containing amino acids is no more than thatsupplied by the isolated soy protein fedat 3.0 g/100 kcal; i.e., 588 n.mol/100 kcalwhen 264 jimol/100 kcal are provided bymethionine. However, it seems possible
that such an intake fails to meet therequirement of male infants during theage interval 8-56 d.
As already indicated, during the first 2mo of life our estimate of intake of methionine from human milk is 212 |j,mol/100kcal and that of total sulfur-containingamino acids (including taurine) is 672jxmol/100kcal. With these intakes, weightgain of breast-fed males is 37 g/d in theage interval 8-56 d (11)—onlyslightly lessthan the 39 g/d of males fed milk-basedformulas (table 2A). Males in our studywho were fed the isolated soy protein at3.0 g/100 kcal without the methioninesupplement received 588 nmol/100 kcalof total sulfur-containing amino acids andgained 33.8 g/d. On the other hand, withthe methionine supplement intake of totalsulfur-containing amino acids in the ageinterval 8-55 d of age was 638 n.mol/100kcal and weight gain was 42.3 g/d.
The possibility that a sex-related difference might exist in requirement for sulfur-containing amino acids for infants 8—56dof age is not totally implausible. As may beseen from table 2, gain in weight was substantially more rapid by males than byfemales during the early weeks of life. From
by guest on Septem
ber 23, 2011jn.nutrition.org
Dow
nloaded from
Appendix G Page G25

1418 FOMON ET AL.
TABLE 8
Methionine (Met) intake and weight gain by male infants receiving various formulas;age 8-56 d
Weightgain1Milk-based
SCAA2eldWithout
addedMet39 ±7 (81)435With
addedMet- 485Formula
2.2SCAA2aid33.7
±9.3 (9)58837.4
±6.1 (10) 638Formula
3.0gld33.8
+ 7.1(8)42.3
±9.3 (8)
'Values are means ±SD; (n), number of subjects. 2Intake of sulfur-containing amino acids (SCAA)
expressed as (j.mol/100 kcal.
8 to 56 d of age mean gain by male infantsfed milk-based formulas was 39 g/d (table2A). The corresponding gain by femaleinfants was 32 g/d (table 2B). Assuming thatat this age 11.2% of the gain is protein (28),protein accretion may be estimated at 4.37g/d for males and 3.58 g/d for females. Thisdifference was not eliminated by expressing protein accretion per unit of body weightor per unit of energy intake. With a greaterrate of protein accretion by males than byfemales, one would anticipate greaterrequirements for protein and essential aminoacids. After 56 d of age, the difference inrate of protein accretion by male and femaleinfants is much less than in the youngerinfant. For example, estimated proteinaccretion from 56 to 112 d of age was 2.80g/d for males and 2.58 g/d for females.
Nevertheless, we are not convinced thatformula 3.0 unsupplemented with methi-onine was inadequate for male infants inthe age interval 8-56 d. There was no difference in length gain. The relatively lowweight gain may have been a chanceoccurrence, a possibility that is difficultto ignore in view of the small number ofinfants (8) in the feeding group. In supportof this interpretation are comparisons presented in table 8 concerning weight gainsby male infants fed milk-based formulasand formulas 2.2 and 3.0. For formulas 2.2and 3.0 the intakes of sulfur-containingamino acids per unit of energy intake aregiven without the methionine supplement and with the supplement of 50 (jumol/100 kcal. When formula 3.0 was fed without the methionine supplement, the intake
of sulfur-containing amino acids was 588H.mol/100 kcal and weight gain in the ageinterval 8-56 d was, as previously discussed, significantly less than that byinfants fed the same formula supplemented with methionine or by infants fedmilk-based formulas. If this relatively lowrate of weight gain were the result of inadequate intake of sulfur-containing aminoacids, one would anticipate that a furtherdecrease in intake of sulfur-containingamino acids per unit of energy intake wouldresult in more dramatic effects on weightgain. Actually, with an intake of sulfur-containing amino acids of 485 ^mol/100kcal by infants fed formula 2.2 with themethionine supplement, weight gain wasnot significantly different from that ofinfants fed milk-based formulas. Wetherefore consider it unlikely that the slowrate of gain of infants fed formula 3.0 without the methionine supplement was aconsequence of inadequate intake of sulfur-containing amino acids.
Because rate of body protein accretiondecreases with increasing age (28),requirements for sulfur-containing aminoacids per unit of energy intake will be lessfor older than for younger infants. We conclude that throughout infancy the requirement for sulfur-containing amino acids isno more than 588 ^mol/100 kcal undercircumstances in which 264 (o-mol/lOOkcalis methionine (as supplied by formula 3.0unsupplemented with methionine). However, this conclusion is somewhat less wellsupported for males during the first 56 dof life than for older males or for females.
by guest on Septem
ber 23, 2011jn.nutrition.org
Dow
nloaded from
Appendix G Page G26

SULFUR-CONTAINING AMINO ACIDS IN INFANCY
APPENDIX 1
Lengths and weights of infants
1419
Length,mmSubject
Birthno.dateFormula
3.0Males266104/29/80266305/09/80266506/27/80266708/01/80267109/29/80267311/22/80267512/16/80267612/19/80267801/29/81Formula
3.0mMales266205/06/80266405/16/80266607/18/80266809/02/80267009/17/80267211/15/80267411/27/80267701/25/81Formula
3.0Females264112/01/79264312/15/79264501/04/80264702/11/80264902/24/80265103/07/80265304/01/80265505/28/80265807/27/80265908*2/80266008/02/80Formula
3.0mFemales264212/03/79264412/17/79264602108180264802/16/80265003/05/80265203/23/80265404/03/80265606/07/80Formula
2.8Females291111/15/81291311/29/81291512/16/81291701/07/82291901/24/82292102/07/82292302/14/82292503/25/82292703/29/82Formula
2.8mFemales291211/19/81291412/12/81291612/22/81291801/25/82292001/28/82292202/17/82292403/22/82292603/26/82292804/03/82Formula
2.6Males306704/07/83307107/07/83307507/26/83307608/09/83307808/29/83307909/10/83308110/13/83308311/04/83308511/27/83Formula
2.6mMales306603/26/83306804/16/83307007/04/83307207/17/83307408/07/83307708/27/83308009/13/83308210/20/833084
11/07/83850750250754049451348548554149950753950950650351650949650652151751853«4904934794954875165094925245225255175025144824954775085104874955074894954825095155135105005074845034985155235035055255255305204944875175304775124771452051151954250152048949655750151854451451651052551150951552952152554850050849151150352552449«53«524531526509514491502489516513495.50251449849849151453152151551052049451150152652550851252854454252950249852454348152450228533_526570526540510506564517534572537540524527534517532549529537556516522514530519552537511552544541542529521506523511537_50951853452453050453954554053553253350952452054554.5523_537557564542520520546557_542522Age.d
42545_551582536555536526579542551592541554539564563541549558540566588529537530552539565558527567560565560543539530540527551_537525552534540523548568553543540556527539537557563533_553570575559531532559567_56253556561_56960056057255153959155256.3614560571562574573554568582564574.58«5425535535725605855725415865785845715595515495«2.5455«2_550538561_561533564582564557554574545553545562575553_5685875945745415515715X0_57755084589_Sfifi617591598573576619596602650585600594605611583603609590598608577576567603586618599558611607605606593571575597571593_575.562596_588.564593611588582573601570579584598605577_595619623608570581604612_612582112613_625638622629595598654623607671604632623622635604618636618625623598603598626610652620579638622627646612598602618594623_598598622_6075916246406106036)0630599591_627631589_621655662635592602«29«41_645613Birth370035703035385535153345309030054280309035703915397036853260374033152975303537703230351539403800312030903090289034853400329041103740377035153415397025203090300536303770283531753315374034603190371537703940411033453175280529502905351536553120336038303940348535003545348534604240297534304365835403590335638163548335231013065436031533526431939113635311836783220294331893895328935654067361032293080321330873575334232863968366537813684344438412635313130403390391026703289328538463557299235503735389640973393311927103297301533573744310333553736383037363589342731343250398630103425304614368039253660403036903533320231804574348337254560406139143437392434683175345441703425381042303795339032543611327038603560346140823950391738573774400927693370326135963945275434813516405637013175376137934065423037303312288733583005353739373106342037054042404135723595332534234138294035623325WciKht.
KAge,
284115_428549154245406039863405509643414365534545684767395244054078377540664925387043214522426538953737423040844245426037924756449544484223448243373219400036«)4053_323840353905459742243667424342134400456042504030342536513462408(144553406_39754618450840354030411339435135_40973815d424641_490552854905466746583690523351294880588549505399416548295082429144575547413550535212477545554321473845034760482541765249495550975051503846653635458542544360_363843184311494948074063464048254730486044554714408640873893450350203845_43295078493744594315462043365423_461642.55565111_528057905130504050504265543557615220647054206131489652125680463648295935472054975681510050604396529750535125519545735687534555465292555350313925511046704688_398646634585_52134432494753305165510049055244444044194358484955054253_46306033499952564615510249725887_51114765846184_59406253600059565820508562876959577573656459709559505522715354145752685053656093628157655935491161315994571551«
KI54035819600062286356628851994428.588(155755180_464255275209_59874767553461465835564056275949552046925556567360804993_55007072589259935575594057717108_602253201126789_655071006673653563385950697980626130802574407785647358528021597163417515593567366370628466805460671166386455640056106720638067767190714056294613661063735824_528762475876__669453766093Hi
150672061246113644463795371_621669875246_64708303681468006175625468127706_66816042
by guest on Septem
ber 23, 2011jn.nutrition.org
Dow
nloaded from
Appendix G Page G27
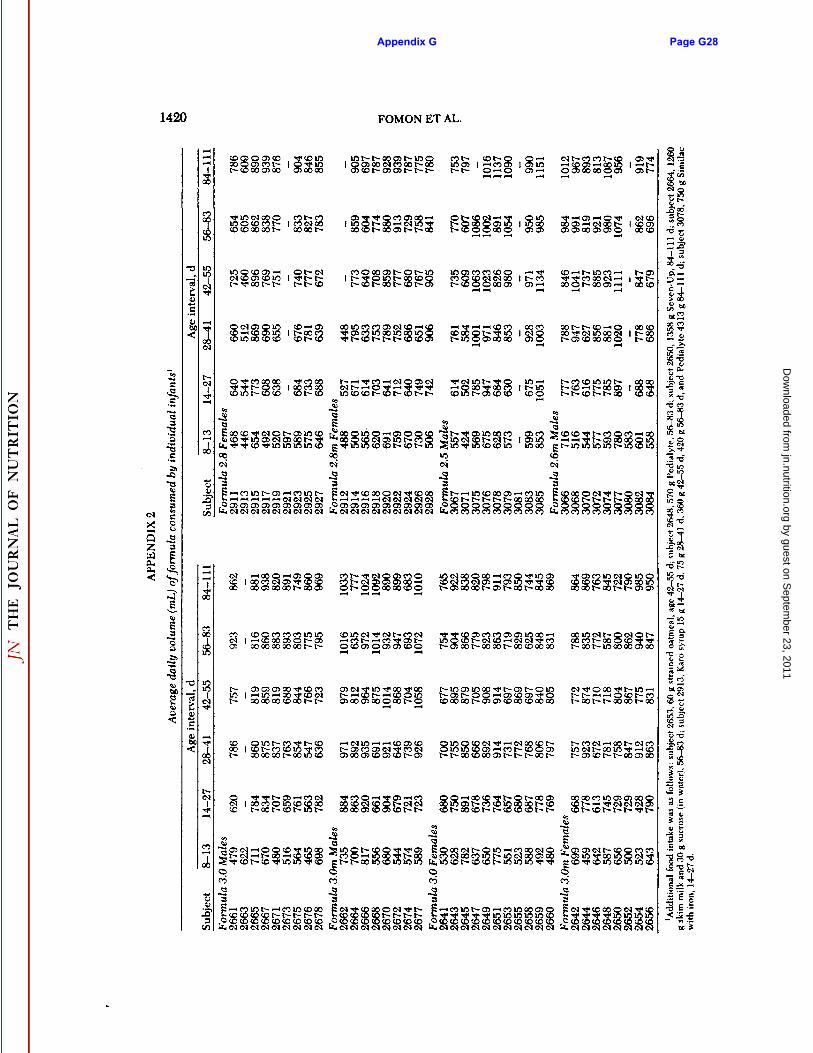
1420 FOMON ET AL.
XI—I
2Xu
I
a
S
COO5OOXOooooîcoi— it"~ CO 00 CJ5 OO
"so in50000
SO50OC5 IDI—C
icooot—oo>O5t—I—I— t-t- O-HC
O-H cNi-cocot-tol oslo -HtDCTì—I
5 ^H OODIO i -HI—
00 OO O O5 O> t—
r 100)000 coi—co3COOOOOI— OOOOt-
BCM
5CM32OI5-H co 351JlOOOtO«
t—t—CO
I t—oococot— CO
O5 ^ ^î1O CO O5 00 '
00 CO t— 00 O5 t— t~ C
cooooo5t— o t-iol i—foiot—oocoo
t-toi—ooi—tot-oì
I-OCt-<o<
ICM-H-* O»O§O5io i loco
OOO OÕOS
•*—HO5 -H O -V <Mtf)00 35-H <N OO f- I CDO>C75 O5 OO C75 Ci O 00 <ß
coio-io e^DC
(O:I-I
30)0100 I t-co5OOOO5 o>—H
-H CO CO 00 Ct-^lO I <M<O50OOO O5<
•*•»co co <ooot-oooî-
it-c
i
-2-Õ!
oÃTT
o-^cooooo •«•cooo•*Tff~c5co l ob co oo(OlOt-ÌO(O «31—CO
t~ -H TJ>CO -H o) o O> <N<Mf~ -H O •*—H•*•*•*io œco t~-co t~ co t—1~-
_C3•JÌ
iS 05 CO 10 O) O 10 O!O CO •fCM O5 X IO
OO 00 CO O t—O500 OO t—O5t—00t—0000 OO 00 I—OO t—t—O5 O3
sIIO*?oq
M
t-
2•*
co œocococoioioCM I -H (£>00 O5 O t—O5O5 OO 00 00 00 OO t^ t^"
t- O5 O5 O) OO Tf (O COIO I -H IO *H OO •*(O (Mt- OO OO 00 (D OO t~ t-
> IO t—COf t—(>t—cocoio-vc300001—00 IO«
CM I 00 CO O IO «D(O 00œ t-cot—(Dt-iot—
—HCO t——HCO ^" O5 r™t—O500t—00001—OOCDOOOO
O30OO50OOOOI—O1—(O5CD
5O5CDOOÕ
CMM-OOO-t—t--H-H(t—oot-t-c
't-ÌO-H) CO t— CO)00t— 00
I—t-00(DOOC35t-t-t-OOt-
t—COCM-H 00 t—CMCIO CMl—OOIO •>}•rt (t- ai cor-1—ocO5c
3 O -H3 CMSO3 O5 «D
O5 -H COt- <N <M
> CDt- t—inrot-cocò ioooooœiDio
300 CO IO O5 O5 » O" 4CM O5J t- -H TJI CMCMC
_!,~sSQC
Ioo
u oï;O5 CM-H O O CO "^ IO 00 5! IO O t—COO ^ ^f O5 C O OO CM t—O IO "-*CO OC CM O2 i—CM-HI—00-HCO CO O5 *= CO O-H IO OO •*t—OO »CO CM OO CO IO t—IO CM OO 3~.ao5^COt— CDM'IOIO^Ì'CO fft—t—OOIOCOIOIOIO Ct,lOCOt—COCDt—lOlOlO^^
o o qco co co•2 -2 .2"s "3 "a
_J;"5
sr> O5O5O! t~~COO COCO
gCDI-SlOCOlOlOCO
qco
I_£'3'S¡ ticCMCMCMCMCMCMCMO)
by guest on Septem
ber 23, 2011jn.nutrition.org
Dow
nloaded from
Appendix G Page G28
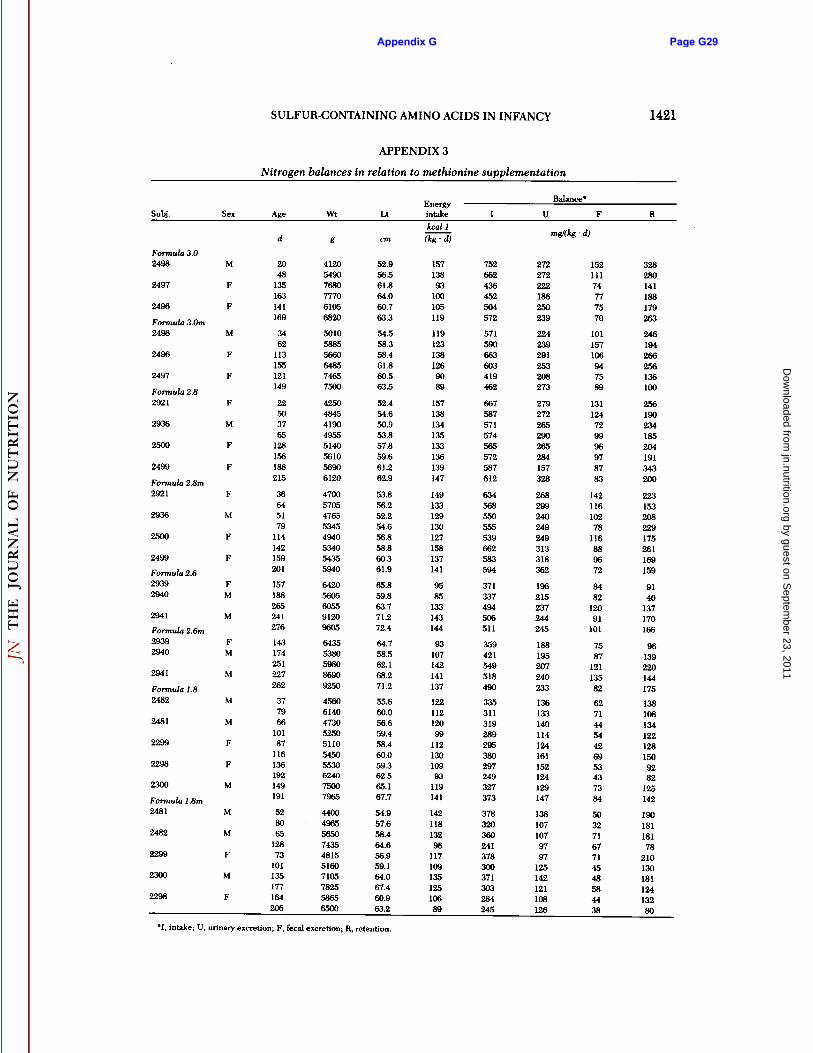
SULFUR-CONTAINING AMINO ACIDS IN INFANCY
APPENDIX 3
Nitrogen balances in relation to methionine supplementation
1421
Subj.Formula
3.0249824972496Formula
3.0m249824962497Formula
2.82921293625002499Formula
2.8m2921293625002499Formula
2.6293929402941Formula
2.6m293929402941Formula
1.824822481229922982300Formula
1.8m24812482229923002298SexMFFMFF.
FMFFFMFFFMMFMMMMFFMMMFMFAged2048135163141169346211315512114922503765128156188215366451791141421592011571882652412761431742512272623779661018711613619214919152806512873101135177164206Wtg4120549076807770610568205010588556606485746575004250484541904955514056105690612047005705476553454940534054355940642056056055912096056435538059808690925045606140473052505110545055306240750079654400496556507435481551607105782558656500Ltcm52.956.561.864.060.763.354.558.358.461.860.563.552.454.650.953.857.859.661.262.953.856.252.254.656.858.860.361.965.859.863.771.272.464.758.562.168.271.255.660.056.659.458.460.059.362.565.167.754.957.658.464.656.959.164.067.460.963.2Energy
intakekcal
l(kg•d)15713893100105119119123138126908915713813413513313613914714913312913012715813714195851331431449310714214113712211212099112130109931191411421181329611710913512510689Balance*I752662436452504572571590663603419462667587571574565572587612634568550555539662583594371337494506511359421549518490335311319289295380297249327373378320360241378300371303284245Umg/(kg2722722221862502392242392912532082732792722652902652841573282682992402492493133183621962152372442451881952072402331361331401141241611521241291471381071079797125142121108126Fj\•a)15211174777570101157106947589131124729996978783142116102781168896728482120911017587121135826271445442695343738450327167714548584438R32828014118817926324619426625613610025619023418B20419134320022315320822917526116915991401371701669613922014417513810813412212815092821251421901811817821013018112413280
*I, intake; U, urinary excretion; F, fecal excretion; R, retention.
by guest on Septem
ber 23, 2011jn.nutrition.org
Dow
nloaded from
Appendix G Page G29
1422 FOMON ET AL.
LITERATURE CITED
1. Snyderman, S. E., Boyer, A., Norton, P. M., Roit-man, E. & Holt, L. E. (1964) The essentialamino acid requirements of infants. X. Methio-nine. Am. J. Clin. Nutr. 15, 322-330.
2. Pratt, E. L. (1957) Amino acid and proteinrequirements of infants. J. Am. Med. Assoc. 164,408-411.
3. Fomon, S. J. (1986) Protein requirements ofterm infants. In: Energy and Protein Needs During Infancy (Fomon, S. J. & Heird, W. C., eds.),pp. 55-68, Academic Press, New York.
4. Nayman, R., Thomson, M. E., Scriver, C. R. &Clow, C. L. (1979) Observations on the composition of milk-substitute products for treatment of inborn errors of amino acid metabolism.Comparisons with human milk. A proposal torationalize nutrient content of treatment products. Am. J. Clin. Nutr. 32, 1279-1289.
5. Rassin, D. K., Sturman, J. A. & Cauli, G. E.(1978) Taurine and other free amino acids inmilk of man and other mammals. Early Hum.Dev. 2, 1-13.
6. Fomon, S. J., Ziegler, E. E., Filer, L. J., Jr.,Nelson, S. E. OcEdwards, B. B. (1979) Methi-onine fortification of a soy protein formula fedto infants. Am. J. Clin. Nutr. 32, 2460-2471.
7. Bodwell, C. E. (1977) Biochemical indices inhumans. In: Evaluation of Proteins for Humans(Bodwell, C. E., éd.),pp. 119-148, AVI, West-port, CT.
8. Waggle, D. H. & Kolar, C. W. (1979) Typesof soy protein products. In: Soy Protein andHuman Nutrition (Wilcke, H. L., Hopkins, D. T.& Waggle, D H., eds.), pp. 19-51, AcademicPress, New York.
9. Fomon, S. J. (1974) Infant Nutrition, pp. 34-35, pp. 549-553, W. B. Saunders, Philadelphia.
10. Fomon, S. J., Thomas, L. N., Filer, L. J., Jr.,Ziegler, E. E. & Leonard, M. T. (1971) Foodconsumption and growth of normal infants fedmilk-based formulas. Acta Paediatr. Scand. Suppl.223, 1-36.
11. Fomon, S. J., Ziegler, E. E., Filer, L. J., Jr.,Anderson, T. A., Edwards, B. B. & Nelson, S. E.(1978) Growth and serum chemical values ofnormal breastfed infants. Acta Paediatr. Scand.Suppl. 273, 1-29.
12. Renner, E. (1983) Milk and Dairy Productsin Human Nutrition, pp. 90-101, Volkswirtschaftlicher Verlag, Munich, Federal Republicof Germany.
13. Neter, J. & Wasserman, W. (1974) AppliedLinear Statistical Models, pp. 468-471, RichardD. Irwin Inc., Homewood, 111.
14. Fomon, S. J., Ziegler, E. E., Nelson, S. E. &Edwards, B. B. (1983) Sweetness of diet andfood consumption by infants. Proc. Soc. Exp.Biol. Med. 173, 190-193.
15. Fomon, S. J., Thomas, L. N., Filer, L. J., Jr.,Anderson, T. A. & Bergmann, K. E. (1973)
Requirements for protein and essential aminoacids in early infancy. Studies with a soy isolateformula. Acta Paediatr. Scand. 62, 33-45.
16. Bates, R. D., Barrett, W. W., Anderson, D. W.,Jr. & Saperstein, S. (1968) Milk and soy formulas: a comparative growth study. Ann. Allergy26, 577-583.
17. Cowan, C. C., Jr., Brownlee, R. C., Jr., DeLoache,W. R.Jackson, H. P. & Matthews, J. P., Jr. (1969)A soy protein isolate formula in the managementof allergy in infants and children. South. Med.J. 62, 389-393.
18. Andrews, B. F. & Cook, L. N. (1969) Lowbirth-weight infants fed a new carbohydrate-freeformula with different sugars. Am. J. Clin. Nutr.22, 845-850.
19. Graham, G. G., Placko, R. P., Morales, E., Acev-edo, G. & Cordano, A. (1970) Dietary proteinquality in infants and children. Am. J. Dis. Child.120, 419-423.
20. Wiseman, H. J. (1971) Comparison of twosoy-protein isolate infant formulas. Ann. Allergy29, 209-213.
21. Sellars, W. A., Halpern, S. R., Johnson, R. B.,Anderson, D. W., Jr., Saperstein, S. & Shannon,B. S., Jr. (1971) New growth charts: soy, cow,and breast milk comparison. Ann. Allergy 29,126-134.
22. Dean, M. E. (1973) A study of normal infantsfed a soy protein isolate formula. Med. J. Aust.60(pt. 1), 1289-1293.
23. Fomon, S. J. & Ziegler, E. E. (1979) Soy protein isolates in infant feeding. In: Soy Proteinand Human Nutrition (Wilcke, H. L., Hopkins,D. T. & Waggle, D. H., eds.), pp. 79-99, Academic Press, New York.
24. Zezulka, A. Y. & Galloway, D. H. (1976)Nitrogen retention in men fed varying levels ofamino acids from soy protein with or withoutadded L-methionine. J. Nutr. ¡06,212-221.
25. Young, V. R., Wayler, A., Garza, C., Steinke, F.H., Murray, E., Rand, W. M. & Scrimshaw, N. S.(1984) A long-term metabolic balance study inyoung men to assess the nutritional quality ofan isolated soy protein and beef proteins. Am.J. Clin. Nutr. 39, 8-15.
26. Young, V. R., Puig, M., Queiroz, E., Scrimshaw,N. S. &Rand,W. M. (1984) Evaluation of theprotein quality of an isolated soy protein in youngmen: relative nitrogen requirements and effectof methionine supplementation. Am. J. Clin. Nutr.39, 16-24.
27. Graham, G. G. (1971) Methionine or lysinefortification of dietary protein for infants andsmall children. In: Amino Acid Fortification ofProtein Foods (Scrimshaw, N. E. & Altschul, A.M., eds.), pp. 222-236, MIT Press, Cambridge,MA.
28. Fomon, S. J., Haschke, F., Ziegler, E. E. & Nelson, S. E. (1982) Body composition of reference children from birth to age 10 years. Am. J.Clin. Nutr. 35, 1169-1175.
by guest on Septem
ber 23, 2011jn.nutrition.org
Dow
nloaded from
Appendix G Page G30
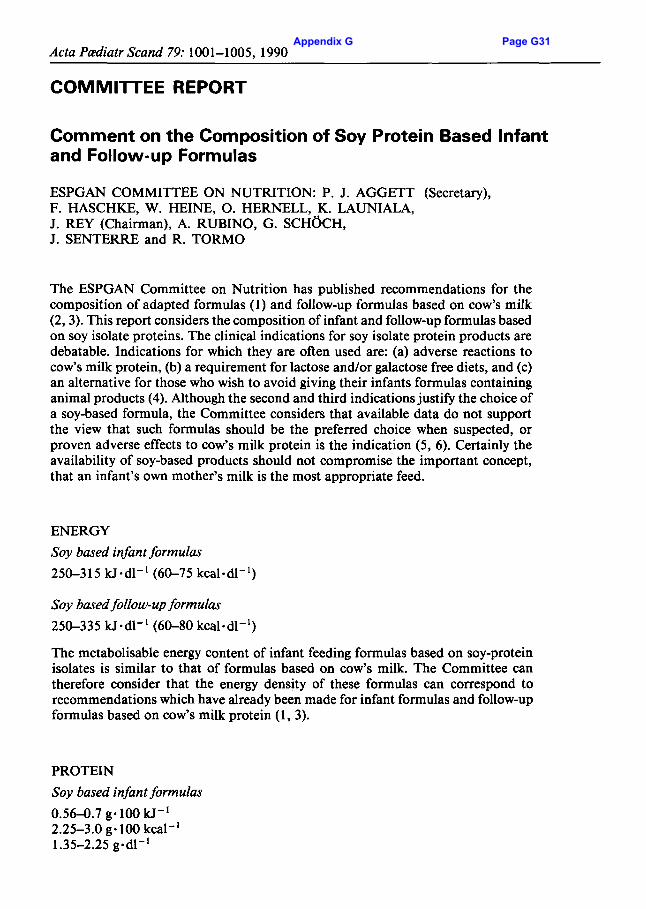
Acta Padiatr Scand 79: 1001-1005, 1990
COMMITTEE REPORT
Comment on the Composition of Soy Protein Based Infant and Follow-up Formulas
ESPGAN COMMITTEE ON NUTRITION: P. J. AGGETT (Secretary), F. HASCHKE, W. HEINE, 0. HERNELL, K. LAUNIALA, J. REY (Chairman), A. RUBINO, G. SCHOCH, J. SENTERRE and R. TORMO
The ESPGAN Committee on Nutrition has published recommendations for the composition of adapted formulas (1) and follow-up formulas based on cow’s milk (2,3). This report considers the composition of infant and follow-up formulas based on soy isolate proteins. The clinical indications for soy isolate protein products are debatable. Indications for which they are often used are: (a) adverse reactions to cow’s milk protein, (b) a requirement for lactose and/or galactose free diets, and (c) an alternative for those who wish to avoid giving their infants formulas containing animal products (4). Although the second and third indications justify the choice of a soy-based formula, the Committee considers that available data do not support the view that such formulas should be the preferred choice when suspected, or proven adverse effects to cow’s milk protein is the indication (5, 6). Certainly the availability of soy-based products should not compromise the important concept, that an infant’s own mother’s milk is the most appropriate feed.
ENERGY Soy based infant formulas 250-315 kJ-dl-’ (60-75 kcal-dl-’)
Soy based follow-up formulas 250-335 kJ.dl-’ (60-80 kcal-dl-’)
The metabolisable energy content of ..ifant feeding formulas based on soy-prote In isolates is similar to that of formulas based on cow’s milk. The Committee can therefore consider that the energy density of these formulas can correspond to recommendations which have already been made for infant formulas and follow-up formulas based on cow’s milk protein (1 , 3).
PROTEIN Soy based infant formulas 0.564.7 g* 100 kJ-’ 2.25-3.0 g. 100 kcal-I 1.35-2.25 gsdl-’
Appendix G Page G31

1002 P. J. Aggett et al. Acta Paediatr Scand 79
NB.: Minimum methionine content of 7.3 mg (50 pmol). 100 kJ-', i.e. 30 mg (200 pmol).100 kcal-'. Minimum L-carnitine content of 0.3 mg (1.8 pmol).100 kJ-', i.e. 1.2 mg (7.5 pmol). 100 kcal-'.
Soy based follow-up formulas
3.0-4.5 g. 100 kcal-' 0.7-1.1 g.100 kJ-'
1.8-3.6 gmd1-l
NB.: Minimum methionine content of 7.3 mg (50 pmol). 100 kJ-', i.e. 30 mg (200 pmol)-100 kcal-'. L-carnitine content of 0.3 mg (1.8 pmol).100 kJ-', i.e. 1.2 mg (7.5 pmol).100 kcal-'.
Unmodified soy based milks are considered unsuitable for infants because of side effects caused by raffinose and stachyose (7). Isolated soy protein if appropriately processed is a good vegetable protein source for children (7). It has a high nutrition- al value and its amino acid composition rating is 96 Yo that of casein, and even after allowance has been made for digestibility, the amino acid score is 89 96 overall and still remains above 80% when the least available amino acid, methionine, is considered, but nevertheless this is limiting (8). Thus even when protein intake is not marginal methionine supplements are needed to ensure growth, and to maintain nitrogen balance and circulating plasma albumin concentrations (9). The Commit- tee considers therefore, that soy protein isolate based infant and follow-up formulas should contain at least 30 mg (200 pmol) of methionine.100 kcal-' (50 pmol(7.3 mg). 100 kJ-'), approximating to the amount in human breast milk.
In contrast to human breast milk and formulas based on cow's milk protein, soy based products contain no intrinsic L-carnitine (lo), the function of which is to transfer fatty acids into the mitochondria. The newborn infant has a finite store of carnitine which, in the absence of an exogenous supply, could be depleted by two and a halfmonths (1 1-14). Therefore, although there is, with one possible exception (1 5 ) , no conclusive evidence that infants fed soy based products are at serious risk of developing carnitine deficiency (1 l), the Committee consider it prudent to support the view that soy based products should be supplemented to a level approximating that in human breast milk.
FAT Soy based infant formulas and soy based follow-up formulas 0.9-1.4 g-100 kJ-' 4.0-6.0 g. 100 kcal-'
Since soy protein isolates are lipid-free, fat needs to be added. This is done by manufacturers using varying proportions of vegetable oils such as sunflower, saf- flower, coconut, palm, corn (maize) and occasionally oleo oils, thereby offering considerable opportunity to manipulate the lipid composition of the products. The Committee, at present, is not aware of any metabolic indications for using vegetable fats to the complete exclusion of animal fats though they appreciate that in some circumstances this may be preferred on cultural grounds. We see no reason at
Appendix G Page G32

Acta Paediatr Sand 79 Soy protein based infant 1003
present to have different recommendations on the lipid content from those recom- mended for infant formulas and follow-up formulas based on cow's milk protein (3). The lipid composition of infant formulas will be reviewed by the Committee in the future.
CARBOHYDRATE Soy based infant formulas and soy based follow-up formulas 2.CL3.0 g.100 kJ-' 8.CL12.0 g. 100 kcal-'
The absence of lactose from soy protein isolates has enabled the use of alternative carbohydrate sources and, thereby, the therapeutic use of soy based products in the management of children who need to avoid either lactose or galactose or both. Additionally since the facilitative effects of lactose on mineral absorption could be achieved also by glucose polymers the Committee discourages the specific supple- mentation of soy based products with lactose. If however lactose is present in such formulas the Committee recommends that the products should be labelled as "lactose containing".
Starch is sometimes added to my based infant formulas, in which case it should be gluten free and starch should not exceed 3 g. 100 kcal-'. The addition of sucrose should be discouraged, but the Committee agrees that the amount of sucrose and, in the case of follow-up should not exceed 20
and honey added separately or as a whole content (1 6).
MINERALS Calcium and phosphorus Soy based infant formulas Calcium: minimum 14 mg. 100 kJ-'
60 mg. 100 kcal-' 40 mgndl-'
3CL50 mg- 100 kcal-' 2CL35 mg-dl-'
Phosphorus: 7.2-12 mg. 100 kJ-'
Ca: P ratio: not less than 1.2 and not more than 2.0. Soy based followup formulas Calcium: minimum 22 mg. 100 U-'
90 mg- 100 kcal-' 60 mg-dl-'
Phosphorus: 14 mg. 100 kJ-' minimum 60 mg. 100 kcal-'
Ca: P ratio: not less than 1 .O and not more than 2.0. 40 mg-dl-'
Soy based products, which have not been designed specifically for infants, are poor in calcium but rich in phosphorus, and infants fed these products have developed overt rickets (1 7). Poorer mineralisation of bone has also been observed
Appendix G Page G33

1004 P. J. Aggett et al. Acta Paediatr S a n d 79
in infants receiving a soy protein isolate based infant formula, when compared with those fed infant formulas based on cow’s milk protein (18, 19). However, these differences which were present at 3 months of age had disappeared at 6 months of age, and infants followed up until 1 year of age had bone mineralisation similar to those of breast fed and vitamin D supplemented infants (18, 19). Therefore the Committee recommends that the calcium and phosphorus content of soy based infant formulas and follow-up formulas should be similar to those for cow’s milk based formulas ( 1 , 3).
Iron and zinc Iron 0.24-0.48 mg (4.3-8.6 pmol).100 kJ-’ i.e. 1.0-2.0 mg (18.0-36
pmol) - 1 0 0 kcal - ’ . Zinc Minimum 0.18 mg (2.8 pmol).100 H-’, i.e. 0.75 mg (11.5 pmol).100
kcal-’, with a maximum iron : zinc molar ratio of 2.5 : 1 . Native soy protein has a high (1-1.5Yo) content of phytate (inositol hexaphos-
phate) which is a potent chelator and inhibitor of the absorption of trace elements such as iron (20-23) and zinc (24-27). Evidently the ideal solution to the limited availability of iron and zinc from soy based formulas would be to remove all their phytate content. In the absence of achieving this the Committee feels that there is a need to enrich these products with both iron and zinc.
Interactions which limit intestinal uptake and transfer of some trace metals also occur between inorganic elements, thus iron may interfere with the utilisation of zinc and vice versa (28). Hence, it is important to consider the relative proportions of these metals in infant fonnulas and follow-up formulas. Although, in the future, it may be necessary to comment on the amount of copper, for the moment we make a recommendation only for iron and zinc in that we feel that the iron : zinc molar ratio should not exceed 2.5. The Committee proposes that, in contrast to the provision for cow’s milk based formulas, soya protein isolate based products should be enriched with iron at 1 .O-2.0 mg ( 1 8.0-36 pmol). 100 kcal-’.
VITAMINS The Committee considered that there was no reason to deviate from the Codex recommendations on vitamins which have been provided for cow’s milk based infant formulas and follow-up formulas.
REFERENCES 1.
2.
3.
4.
5.
6.
ESPGAN Committee on Nutrition. Guidelines on infant nutrition. I. Recommendations for the composition of an adapted formula. Acta Paediatr Scand 1977; Suppl262. ESPGAN Committee on Nutrition. Guidelines on infant nutrition. 11. Recommendations for the composition of follow-up formula and Beikost. Acta Paediatr Scand 1981; Suppl 287. ESPGAN Committee on Nutrition. Comment on the composition of cow’s milk based follow-up formulas. Acta Paediatr Scand 1990; 79: 250-54. American Academy of Pediatrics, Committee on Nutrition. Soy protein formulas: recom- mendations for use in infant feeding. Pediatrics 1983; 72: 359-63. Kjellman NI, Johansson SGO. Soy versus cow’s milk in infants with biparental history of atopic disease: development of atopic disease and immunoglobulins from birth to 4 years of age. Clin Allergy 1979; 9: 347-58. Chandra RK, Sin& G, Shridhara B. Effect of feeding whey hydrolysate, soy and
Appendix G Page G34

Acta Paediatr Sand 79 Soy protein based infant 1005
7.
8.
9.
10.
11.
12. 13.
14.
15.
16.
17.
18.
19.
20.
21.
22.
23.
24.
25.
26.
27.
28.
conventional cow milk formulas on incidence of atopic disease in high risk infants. Ann Allergy 1989; 63: 10246. Torun B. Nutritional quality of soy bean protein isolates: studies in children of preschool age. In: Wilcke HL, Hopkins DT, Waggle DH, eds. Soy protein and human nutrition. New York: Academic Press, 1979: 101-19. Sarwar G, Peace RW. Comparisons between true digestibility of total nitrogen and limiting amino acids in vegetable proteins fed to rats. J Nutr 1986; 116: 11 72-84. Fomon SJ, Ziegler EE, Filer LJ Jr et al. Methionine fortification of a soy protein formula fed to infants. Am J Clin Nutr 1979; 32: 2460-71. Ohtani Y, Higashi A, Matsuda I. Carnitine concentration of formulas. J Pediatr Gas- troenterol Nutr 1985; 4 84546. Borum PR. Possible carnitine requirement of the newborn and the effect of genetic disease on the carnitine requirement. Nutr Rev 1981; 39: 385-90. Borum PR. Carnitine. Annu Rev Nutr 1983; 3: 233-59. Penn D, Schmidt-Sommerfeld E, Pascu F. Decreased tissue carnitine concentrations in newborn infants receiving total parented nutrition. J Pediatr 198 1; 98: 976-78. Lalau Keraly J, Bougneres PF. Apports alimentaires, concentrations circulantes et excrk- tion de la carnitine en fonction de l’lge chez l’enfant normal. Arch Fr Pediatr 1984; 41:
Slonim AE, Borum PR, Tanaka K et al. Dietary-dependent carnitine deficiency as a cause of nonketotic hypoglycemia in an infant. J Pediatr 1981; 99: 551-56. Scientific Committee for Food. First report of the scientific committee for food on the essential requirements of infant formulae and follow-up milks based on cow’s milk proteins. Food science and techniques. Commission of the European Communities, Luxembourg 14 Series EUR 8752EN, p. 33. Legius E, Proesmans W, Eggermont E, Vandamme-Lobaerts R, Bouillon R, Smet M. Rickets due to dietary calcium deficiency. Eur J Pediatr 1989; 148: 78685. Steichen JJ, Tsang RC. Bone mineralization and growth in term infants fed soy-based or cow milk-based formula. J Pediatr 1987; 110 687-92. Kohler L, Meeuwisse G, Mortensson W. Food intake and growth of infants between six and twenty-six weeks of age on breast milk, cow’s milk formula, or soy formula. Acta Paediatr Scand 1984; 73: 4048. Cook JD, Morck TA, Lynch SR. The inhibitory effect of soy products on nonheme iron absorption in man. Am J Clin Nutr 1981; 34: 2622-29. Hallberg L, Rossander L, Skanberg A. Phytates and the inhibitory effect of bran on iron absorption in man. Am J Clin Nutr 1987; 45: 988-96. Gillooly M, Torrance JD, Bothwell TH et al. The relative effect of ascorbic acid on iron absorption from soy-based and milk-based infant formulas. Am J Clin Nutr 1984; 40:
Hertrampf E, Gayazzo M, Pizarro F, Stekel A. Bioavailability of iron in soy based formula and its effect on iron nutriture in infancy. Pediatrics 1986; 76: 64045. ODell BL. Effect of soy protein on trace mineral availability. In: Wilcke HL, Hopkins DT, Waggle DH, eds. Soy protein and human nutrition. New York Academic Press,
Craig WJ, Balbach L, Vyhmeister N. Zinc bioavailability and infant formulas. Am J Clin Nutr 1984; 39: 981-82. Liinnerdal B, Cederblad A, Davidson L, Sandstrom B. The effect of individual compo- nents of soy formula and cow’s milk formula on zinc bioavailability. Am J Clin Nutr 1984; 4 0 106670. Sandstrom B, Keen CL, Liinnerdal B. An experimental model for studies of zinc bioavail- ability from milk and infant formulas using extrinsic labelling. Am J Clin Nutr 1983; 38: 420-28. Solomons NW. Competitive interaction of iron and zinc in the diet: consequences for human nutrition. J Nutr 1986; 116: 927-35.
715-19.
522-27.
1979: 187-207.
Submitted March 15, 1990
(0. H.) Department of Pediatrics University of UmeA S-90185 UmeA Sweden
Appendix G Page G35

Journal of Pediatric Gastroenterology and Nutrition42:352Y361 � April 2006 Lippincott Williams & Wilkins, Philadelphia
Medical Position Paper
Soy Protein Infant Formulae and Follow-On Formulae: ACommentary by the ESPGHAN Committee on Nutrition
ESPGHAN Committee on Nutrition: *Carlo Agostoni, †Irene Axelsson, ‡Olivier Goulet,§Berthold Koletzko,1 ||Kim Fleischer Michaelsen, ¶John Puntis, #Daniel Rieu,3 **Jacques Rigo,
..Raanan Shamir, ‡‡Hania Szajewska,2 and §§Dominique Turck
*University of Milano, Milano, Italy; †University of Lund, Malmo, Sweden; ‡Hopital Necker Enfants-Malades, Paris, France;§Ludwig-Maximilians-University, Munich, Germany; ||The Royal Veterinary and Agricultural University, Frederiksberg, Denmark;¶The General Infirmary, Leeds, United Kingdom; #University of Montpellier, Montpellier, France; **University of Liege, Liege,
Belgium; ††Meyer Children’s Hospital of Haifa, Haifa, Israel; ‡‡The Medical University of Warsaw, Warsaw, Poland;§§University of Lille, Lille, France. 1Committee Chair; 2Committee Secretary; 3Guest
ABSTRACT: This comment by the European Society forPaediatric Gastroenterology Hepatology and Nutrition(ESPGHAN) Committee on Nutrition summarizes availableinformation on the composition and use of soy protein formulaeas substitutes for breastfeeding and cows_ milk protein formulae aswell as on their suitability and safety for supporting adequategrowth and development in infants. Soy is a source of proteinthat is inferior to cows_ milk, with a lower digestibility andbioavailability as well as a lower methionine content. For soyprotein infant formulae, only protein isolates can be used, andminimum protein content required in the current European Unionlegislation is higher than that of cows_ milk protein infant formulae(2.25 g/100 kcal vs. 1.8 g/100 kcal). Soy protein formulae can beused for feeding term infants, but they have no nutritionaladvantage over cows_ milk protein formulae and contain highconcentrations of phytate, aluminum, and phytoestrogens (isofla-
vones), which might have untoward effects. There are no data tosupport the use of soy protein formulae in preterm infants.Indications for soy protein formulae include severe persistentlactose intolerance, galactosemia, and ethical considerations (e.g.,vegan concepts). Soy protein formulae have no role in theprevention of allergic diseases and should not be used in infantswith food allergy during the first 6 months of life. If soy proteinformulae are considered for therapeutic use in food allergy afterthe age of 6 months because of their lower cost and betteracceptance, tolerance to soy protein should first be establishedby clinical challenge. There is no evidence supporting the useof soy protein formulae for the prevention or management ofinfantile colic, regurgitation, or prolonged crying. JPGN42:352Y361, 2006. Key Words: soyVinfant formulaVfollow-on formulaVfood allergyVphytoestrogens. � 2006 LippincottWilliams & Wilkins
INTRODUCTION
Soy formula was first introduced in the United Statesfor feeding young infants in the early 1900s (1). In 1929,soy formula was proposed as a cows_ milk substitute forbabies with cows_ milk intolerance (2). Soy protein for-mulae are given at some time during the first year of lifeto approximately 25% of infants in the United States,
13% in New Zealand, 7% in the United Kingdom, 5% inItaly, and 2% in France (3Y6).
During the past few years, concerns have been raisedover potential risks of soy protein formulae, in particularwith regard to high phytoestrogen contents. Authoritiesor pediatric societies from Australia, Canada, France, Ireland,New Zealand, Switzerland, and the United Kingdomhave recently advised health professionals and caregiversthat because of concerns raised and limited availability ofdata, the use of soy protein formulae in infants should berestricted to specific cases (7Y9).
The purpose of this comment by the Committee is toreview available information on the composition and useof soy protein formulae as substitutes for breastfeedingand cows_ milk protein formulae as well as on theirsuitability and safety for supporting adequate growth and
Received October 18, 2005; accepted October 18, 2005.Berthold Koletzko is Committee Chair, Hania Szajewska is
Committee Secretary, and Daniel Rieu is a guest of the ESPGHANCommittee on Nutrition.
Address correspondence and reprint requests to Dominique Turck,Unite de Gastro-enterologie, Hepatologie et Nutrition, Clinique dePediatrie, Hopital Jeanne de Flandre, 2, avenue Oscar Lambret, 59037Lille cedex, France. (e-mail: [email protected]).
352
Copyr ight © Lippincott Williams & Wilkins. Unauthorized reproduction of this article is prohibited.
Appendix G Page G36

development of infants. In preparing this comment, theCommittee reviewed expert consensus documents on theuse of soy protein formulae in dietetic products for infants(5,7Y13). Products that do not meet the standards of in-fant and follow-on formulae or foods for medical pur-poses designed for infants, such as soy Bmilks[ or juicesand fermented soy products, that do not fulfill nutritionalrequirements of infants are beyond the scope of this review.
FROM SOYBEANS TO SOY PROTEIN
ISOLATE FORMULAE
Soybeans comprise approximately 40% proteins, 35%carbohydrates, 20% fat, and 5% minerals (percent dryweight). Soybean products include oil and soy flour ob-tained from roasted soybeans ground into a fine powder.Soy protein isolates are derived from delipidated soyflour (90Y95%) by elimination of soluble carbohydratesand mineral salts (5). Soy protein has a lower biologicvalue than cows_ milk protein. The nitrogen conversionfactor, which allows us to calculate the protein contentfrom the total nitrogen content, is lower for soy proteinisolate than for cows_ milk protein. Soy and cows_ milkproteins have a different amino acid pattern (i.e., soyprotein contains lower amounts of methionine, branchedchain amino acids lysine, and proline and higher quan-tities of aspartate, glycine, arginine, and cystine thancows_ milk protein) (14). To ensure adequate growth,nitrogen balance, and plasma albumin concentrations,methionine supplements have been recommended (15,16).Because soy based products have a very low content ofL-carnitine that may induce low plasma carnitine con-centrations in infants (17), the addition of carnitine tosoy formulae has also been recommended (7,18).
COMPOSITION OF SOY PROTEIN INFANT AND
FOLLOW-ON FORMULAE
Recommendations and Regulations
The ESPGHAN Committee on Nutrition publishedrecommendations on the composition of soy protein
infant and follow-on formulae in 1990 (16). Soy proteininfant and follow-on formulae marketed in the EuropeanUnion must meet the compositional criteria defined byEU directives (19,20). For soy protein infant formulae,only protein isolates should be used, and the minimumprotein content required by European legislation is higherthan that of cows_ milk protein infant formulae (2.25 g/100 kcal vs. 1.8 g/100 kcal) to account for potentiallylower digestibility and therefore lower bioavailablility ofsoy protein compared with intact cows_ milk protein. Themain differences in compositional criteria between soyprotein and cows_ milk protein infant formulae, andbetween soy protein and cows_ milk protein follow-onformulae, are listed in Table 1.
Nutritional Adequacy of Soy Protein Formulae
In the 1970s, Fomon et al. (21) studied infants fed, asdesired, an infant formula based on methionine supple-mented soy protein isolate with a protein content of 1.64 g/100 kcal and an energy content of 67 kcal/100 mL.Infants were fed the formula exclusively for 28 days andthereafter combined with complementary feeding untilthe age of 112 days. The infants had a similar growthpattern and similar normal markers of plasma proteinmetabolism as breast-fed infants. However, energy in-takes were slightly higher than in infants fed a cows_milk formula with a protein content of 1.77 g/100 kcal.In a study designed to estimate the requirement ofsulfur amino acids of infants up to the age of 112 days,a beneficial effect of L-methionine supplementation(7.5 mg/100 kcal) on nitrogen balance was only seenwith a concomitant soy protein content of 1.8 g/100 kcal.A beneficial effect of methionine supplementation onweight gain or serum concentrations of urea nitrogen andalbumin was only demonstrated at soy protein concen-trations of 2.2 and 2.6 g/100 kcal, respectively (22).
Fomon et al. and other investigators demonstrated thatinfants exclusively fed methionine-supplemented soyprotein formulae during the first 4 to 12 months of lifeshowed weight gain and linear growth similar to that ofinfants fed conventional cows_ milk protein formulae
TABLE 1. Compositional criteria of soy protein isolate infant and follow-on formulae, alone or mixed with cows_ milk protein,according to the Commission Directive 91/321/EEC of May 14, 1991 on infant formulae and follow-on formulae (19)
Soy protein infant formulae Soy protein follow-on formulae
Minimum (/100 kcal) Maximum (/100 kcal) Minimum (/100kcal) Maximum (/100 kcal)
Protein (g)* 2.25 3.0 2.25 4.5Methionine (mg) 29 Y 29 YL-carnitine (Hmoles) 7.5 Y Y YLactose (g)† 3.5 Y 1.8 YIron (mg) 1 2 1 2Zinc (mg) 0.75 2.4 0.75 Y
*Soy protein isolate has to have a minimal chemical index of at least 80% in comparison with human milk protein for infant formulae and incomparison with human milk or casein for follow-on formulae.†There is no minimal content for lactose when soy protein represents more than 50% of total protein.
J Pediatr Gastroenterol Nutr, Vol. 42, No. 4, April 2006
SOY PROTEIN AND FOLLOW-ON FORMULAE 353
Copyr ight © Lippincott Williams & Wilkins. Unauthorized reproduction of this article is prohibited.
Appendix G Page G37

(23,24). Studies were generally less than 1 year in dura-tion, with exclusive soy protein formula feeding frombirth to 4 months. Blood markers of protein metabolismin children fed soy protein formulae were not signifi-cantly different from those of infants fed cows_ milkformulae. Healthy term infants fed a soy protein for-mula during their first year of life achieved a bone den-sity similar to breast-fed or cows_ milk formula fed infants(25,26). Outcome parameters included serum calcium,magnesium, phosphorus, alkaline phosphatase, parathy-roid and 1,25-dihydroxyvitamin D concentrations, andbone mineral content measured with absorptiometry. Thesedata indicate that soy protein formulae can be used forfeeding term infants but have no nutritional advantageover cows_ milk protein formulae.
In a randomized, controlled study performed in verylow birthweight infants from 3 to 8 weeks of age, Hallet al. (27) compared a soy protein infant formula sup-plemented with calcium, phosphorus, and vitamin D(n = 17) with a whey-predominant premature infantformula (n = 15). Birth weight (1,206 T 178 g) andgestational age (30 T 1.9 weeks) of the soy formula-fedgroup were not significantly different from the wheyformula-fed group (1,143 T 158 g and 30 T 1.8 weeks,respectively). The energy content of the whey formulawas higher than that of the soy formula (81 kcal/100 mLvs. 67 kcal/100 mL), whereas the protein/energy ratiowas identical in both formulae (3 g/100 kcal). Thecaloric (kcal/kg/day) and protein (g/kg/day) intake wasnot significantly different between each group because agreater volume of feed was consumed in the soyformula-fed infants. Those fed soy formula had lowerweight gain (11.3 T 2.3 g/kg/day) than infants fed whey-predominant formula (15.3 T 2.5 g/kg/day) as well aslower protein and albumin blood concentrations. Bonemineralization pattern was the same in both groups.Although no more information is available in this popu-lation, the Committee concludes that soy protein formulaeshould not be used in preterm infants.
Phytate
Soy protein isolate contains some 1% to 2% phytate,which may impair the absorption of minerals and traceelements. In experimental animals and in human adults,phytate has a negative effect on intestinal zinc and ironabsorption (28). A reduction in phytate contents of soyprotein formulae can be achieved by precipitation meth-ods or treatment with phytase. Reduction of the phytatecontent of soy formula increased the absorption andavailability of zinc and copper in infant rhesus monkeysand rat pups and of iron in infants (29,30). Using stableisotope techniques in infants fed a soy protein isolateformula with low contents of phytate (G6 mg/kg liquidformula) or a conventional content (300 mg/kg liquid for-mula), Davidsson et al. (31) showed that zinc absorptionwas significantly greater with dephytinized formula
(22.6% vs. 16.7%, P = 0.03), whereas no significantdifference was observed for calcium, iron, copper, and man-ganese absorption.
Phytate may also interfere with iodine metabolism.Before the supplementation of soy formulae with iodineand the use of isolated soy protein instead of high-fibersoy flour in the mid-1960s, cases of goiter and hypo-thyroidism were described in infants fed soy formulae(32,33). The persistence of thyroid insufficiency despitethe use of a high dose of levothyroxine has also been ob-served more recently in infants with congenital hypo-thyroidism fed soy protein formulae (34,35). A recentstudy showed that infants with congenital hypothy-roidism fed soy protein formulae had a prolonged in-crease of thyroid stimulating hormone (TSH) whencompared with infants fed nonsoy formulae. Theseinfants need close monitoring of free thyroxine andTSH measurements and may need increased levothyrox-ine doses to achieve normal thyroid function (36). Themechanism of the prolonged increase in TSH blood con-centrations is not clear. Malabsorption and increased fecalloss of the supplemented levothyroxine have been shownin animal studies performed before the use of isolated soyprotein. Soy protein may also act as a goitrogen. A gly-copeptide isolated from soy that blocks iodine uptake anddecreases its organification has been described.
Information on the phytate contents of soy protein for-mulae used in Europe is not publically available. Suchinformation should be disclosed by manufacturers. Inview of the considerations discussed above, the Com-mittee strongly recommends that phytate contents in soyprotein infant formulae should be effectively reduced, forexample, by precipitation methods or phytase treatment.
Nucleotides
The nucleotide content of soy protein formulae ismuch higher (approximately 310 mg/L) than that ofhuman milk (68Y72 mg/L) or cows_ milk infant formulae(8Y72 mg/L) (37). The Commission Directive 1991/321/EEC has approved the addition of nucleotides to infantand follow-on formulae with a total concentration of upto 5 mg/100 kcal, which is similar to reported data forfree ribonucleotides in human milk (approximately 4Y6 mg/100 kcal) (19). Because there is no adequate scien-tific basis at present to conclude that the addition ofnucleotides in higher concentrations would provide addi-tional benefits, the Committee discourages the furtheraddition of nucleotides to formulae based on soy proteinisolates given their high natural contents.
Aluminum
In 1996, the Committee on Nutrition of the AmericanAcademy of Pediatrics (AAP) highlighted the potentialrisk of aluminum toxicity in infants and children relatedto the use of soy protein formula contaminated with
J Pediatr Gastroenterol Nutr, Vol. 42, No. 4, April 2006
354 AGOSTONI ET AL.
Copyr ight © Lippincott Williams & Wilkins. Unauthorized reproduction of this article is prohibited.
Appendix G Page G38

aluminum (38). The source of the aluminum is thoughtto be the aluminum equipment used during the produc-tion of soy protein isolates and the nature of mineralsalts used in formula production (3). Much higherconcentrations of aluminum were found in soy proteinformulae (500Y2,400 Kg/L) than in cow’s milk proteinformulae (15Y400 Kg/L) and breast milk (4Y65 Kg/L).However, daily aluminum intake remained less than1 mg/kg, which the Joint Food and Agriculture Organi-zation/World Health Organization Expert Committee onFood Additives in 1989 considered as the tolerableintake of aluminum (39). Infants fed formulae with thehighest contents of aluminum (2.35 mg/L) at the time ofthe publication would receive an aluminum dose lessthan 0.5 mg/kg per day at feed intakes up to 200 mL/kgper day. There is inadequate information on thealuminum content of soy protein formulae. Suchinformation should be made available by manufacturers.Although long-term consequences of higher levels ofaluminum observed in soy formulae are unknown,continued efforts should be made by manufacturers toreduce the aluminum content of soy protein formula.
Phytoestrogens
Phytoestrogens represent a broad group of plant-derived compounds of nonsteroidal structure that areubiquitous within the plant kingdom and have weak es-trogen activity (9,40). They are present in beans ingeneral and soybeans in particular. Lignanes and isofla-vones are the major classes of phytoestrogens of interestfrom a nutritional and health perspective. The maincompounds contained in soy protein-based foods are theisoflavones genistein and daidzein (41). Isoflavones canbind to estrogen receptors, interact with enzyme systemsinfluencing estrogenic activity, and exert weak estro-genic activity (42). It has been suggested that isofla-vones may have anticancer properties in animals (43,44)and in human adults (45,46). Isoflavones may contrib-ute to the prevention of cardiovascular disease, breastcancer, osteoporosis, and menopausal disorders (47), andthey have been proposed to slow progression of renaldisease in adults (48).
Infant formulae based on soy protein isolates containrelatively high concentrations of isoflavones (49). Iso-flavone content found in soy formulae commerciallyavailable in the United States, United Kingdom, NewZealand, and France ranges from 17.5 to 47 Kg/mLand from 123 to 281 Kg/g of milk powder, with a higherproportion of genistein than of daidzein (8,50Y53).Concentrations of isoflavones were much lower in cows_milk and breast milk samples, ranging from 0.1 to 5 Kg/Lin cows_ milk (54) and from 1.6 to 13.6 Kg/L (U.S.) andfrom 0 to 32 Kg/kg (U.K.) in breast milk, respectively(8,41). Isoflavone content of breast milk varies withmother’s diet. Setchell et al. (41) estimated that infantsaged 1 to 4 months would receive 6 to 12 mg/kg body-
weight per day of total isoflavones, whereas an adultconsuming 57 to 85 g of soy-based products may receive50 to 100 mg of total isoflavones (i.e., 0.7 to 1.4 mg/kg/d).
Glycosidic conjugates of isoflavones present in soyprotein formulae are hydrolyzed by intestinal glucosi-dases to their aglucon form, then are absorbed, metabo-lized in the liver to glucuronide and sulphate conjugates,and subsequently excreted in urine. Short-term studieshave shown that no more than 30% of the ingested doseof isoflavones are recovered in urine and feces (41).Knowledge on the bioavailability of isoflavones is stillincomplete in young infants (41,52). In 4-month-oldinfants exclusively fed soy protein isolate formula,Setchell et al. found plasma total isoflavone concentra-tions ranging from 552 to 1,775 Kg/L, with a mean con-centration of 980 Kg/L. Mean (SD) plasma concentrationwas 684 (443) Kg/L for genistein and 295 (60) Kg/L fordaidzein. These values were significantly higher (P G0.001) than the mean values for plasma total isoflavoneconcentrations in infants fed either cows_ milk formula(9.4 T 1.2 Kg/L) or breast milk (4.7 T 1.3 Kg/L) (41,50).On a molar basis, isoflavones demonstrated weak es-trogenic activity relative to physiologic estrogens, pos-sessing between 1 � 10j4 and 1 � 10j3 of the activityof 17 A-estradiol (55).
Phytoestrogens given at the high dosage contained insoy-based formulae adversely affected development andneuroendocrine function in different animal species(7,41,56). Isoflavones were found to cause infertility insheep, known as Bclover disease[ (57). In utero expo-sure of rats to high doses of genistein impairs the pitui-tary secretion of luteinizing hormone (58).
It has been hypothesized that phytoestrogens have thepotential to increase thyroid binding globulin (8). Anysuch increase could transiently increase the binding ca-pacity for thyroxine, thus lowering free thyroxine con-centrations. However, there are no data to suggest thatphytoestrogens acting by this mechanism produce clini-cal effects. A retrospective telephone recall epidemio-logic study found that children with autoimmunethyroid disease were significantly more likely to havebeen fed soy formula in infancy (31% vs. 13% in infantswithout autoimmune thyroid disease) (59). There was nogroup difference in the frequency and duration of breastfeeding. The aglucons of genistein and daidzein weredemonstrated to inhibit the activity of thyroid peroxi-dase purified from porcine thyroid glands when presentat concentrations of 1 to 10 KM, resulting in iodinatedisoflavone compounds. The presence of at least 150 KMof iodine per liter in the incubation mixture completelyprotected against the isoflavone-mediated thyroid per-oxidase inactivation (60).
Few data are available on the potential consequencesof exposure to high doses of phytoestrogens in humaninfants on the later sexual and reproductive development.A three-fold increase in the number of patients with pre-mature thelarche seen between 1978 and 1981 in Puerto
J Pediatr Gastroenterol Nutr, Vol. 42, No. 4, April 2006
SOY PROTEIN AND FOLLOW-ON FORMULAE 355
Copyr ight © Lippincott Williams & Wilkins. Unauthorized reproduction of this article is prohibited.
Appendix G Page G39

Rico led to further investigation in a case-control study(61). Onset of thelarche before 2 years of age was sig-nificantly associated with consumption of soy proteinisolate based infant formula and of various meats. How-ever, less than 20% of cases were soy formula fed, whichpoints to the importance of additional causative factors.
Strom et al. (62) conducted telephone interviews in811 adults aged 20 to 34 years who had participated asinfants during the years 1965 to 1978 in comparative butnot randomized feeding trials with soy protein basedinfant formula (n = 248; 120 males) or cows_ milk pro-tein formula (n = 563; 295 males). Outcome measureswere self-reported: pubertal maturation, menstrual andreproductive history, height, weight, and educationlevels. The study did not include any direct measure-ments of hormone levels. Females previously fed on soyformulae had a lower prevalence of sedentary activities(8.9 T 3.4 hours/wk vs. 9.6 T 3.5 hours/wk, P = 0.05),whereas there was no difference for males. No statisti-cally significant differences were observed betweengroups in either men or women for adult height, weight,pubertal development, and incidence of thyroid disease.Women fed soy formula in infancy experienced aslightly but significantly longer duration of menstrualbleeding (by 0.37 days; 95% confidence interval [CI]:0.06Y0.68), with no difference in self-assessed intensityof menstrual flow. They also reported greater discom-fort with menstruation (unadjusted relative risk for ex-treme discomfort vs no or mild pain, 1.77; 95% CI,1.04Y3.00). Pregnancies were reported by 42% ofwomen fed soy-formulae and 48% of women fed cows_milk formulae (NS). Outcomes of pregnancies were notdifferent, and neither were there differences between thegroups in the prevalence of cancer, hormonal disorders,sexual orientation, or birth defects in the offspring. Noconclusions can be drawn on possible effects on fertilityin men previously exposed to soy-based formulae,considering their relatively young age at the time ofthe follow-up study. Although exposure to soy formulaein this study did not appear to be responsible for majorhealth or reproductive problems, more information isneeded on potential long-term effects of phytoestrogens.
Yellayi et al. (56) showed that subcutaneous genisteininjections in ovariectomized adult mice produced doseresponsive decreases in thymic weight of up to 80%.Genistein injection caused decreases in relative percentagesof thymic CD4+CD8j and double positive CD4+CD8+thymocytes, providing evidence that genistein may affectearly thymocyte maturation and the maturation ofCD4+CD8j helper T-cell lineage. Dietary genistein atconcentrations that produced serum genistein levelssubstantially less than those found in soy proteinformula-fed infants produced marked thymic atrophy.
In infants fed soy protein formula from birth to 4 months,Ostrom et al. and Cordle et al. (63,64) did not finddifferences compared with a control group that wasbreastfed for 2 months or more at 6 and 12 months of
age for the level of immunoglobulins (Ig)G and A, thetitre of antibodies against diphtheria, tetanus, poliovirus,and Hemophilus influenzae b, as well as the count oflymphocytes B, T, and NK. The only significant dif-ference was the higher percentage of CD57+ NK cells inthe control group at 12 months.
Information on the phytoestrogen content of soy pro-tein formulae should be made available by manufac-turers. Although studies in humans are lacking, on thebasis of available data in animal models, the Committeerecommends that the content of phytoestrogens in soyprotein formulae be reduced because of uncertaintiesregarding safety in infants and young children.
COMMENTS ON POSSIBLE INDICATIONS FOR
SOY FORMULAE
Severe persistent lactose intolerance
and galactosemia
Severe persistent lactose intolerance, including severemucosal damage and the rare cases of hereditary lactasedeficiency (McKusick 223000) and classic galactosemia(galactose-1-phosphate uridyltransferase deficiency)(McKusick 230400), are indications for the use of lactosefree soy formulae (65). It should be noted that some soyprotein formulae contain raffinose and stachyose thatare cleaved in the digestive tract under the action ofbacterial galactosidases, leading to the liberation of 1,4galactose that may contribute to elevated galactose-1-Pvalues in erythrocytes of galactosemic patients (66).
Acute gastroenteritis
A meta-analysis of clinical trials on the use offormulae in the management of acute gastroenteritisconcluded that lactose-containing diets do not need to bewithdrawn in the vast majority of cases, whereas lactosefree diets were beneficial in a limited number of caseswith severe dehydration (67). An ESPGHAN multi-centric study has shown that the early use of lactose con-taining cows_ milk formula after oral rehydration doesnot aggravate or prolong diarrhea in well-nourishedinfants presenting with acute gastroenteritis and mild tomoderate dehydration and has the advantage of prevent-ing malnutrition (68). Therefore, switching from lac-tose-containing formula to lactose free formula such assoy formulae is not routinely recommended in acutegastroenteritis (10). Moreover, there are theoreticalconcerns regarding the introduction of a new proteinsource in the presence of increased mucosal perme-ability, with a potential increased risk of allergicsensitization (69,70).
J Pediatr Gastroenterol Nutr, Vol. 42, No. 4, April 2006
356 AGOSTONI ET AL.
Copyr ight © Lippincott Williams & Wilkins. Unauthorized reproduction of this article is prohibited.
Appendix G Page G40

Cows_ milk allergy
Before the availability of therapeutic formulae basedon cows_ milk protein hydrolysates, soy formula was theonly dietetic product available for feeding infants withcows_ milk protein allergy. However, soy protein is also acommon allergen. The identification and characterizationof soybean allergens have identified fractions containingconglycinin (molecular weight 180,000 d) and glycinin(molecular weight 320,000 d) as probably the majorallergens and trypsin inhibitor as the minor allergen res-ponsible for soy protein allergy (71). Patients with soyprotein allergy present with either acute symptomswithin a few hours after soy ingestion (i.e., urticaria,angioedema, vomiting, diarrhea, or anaphylactic shock)or with chronic symptoms (i.e. chronic diarrhea andfailure to thrive, malabsorption, and villous atrophy)(72,73). Symptoms usually resolve after elimination ofsoy from the diet.
Among infants with cows_ milk allergy fed soy proteinbased formulae, some 30% to 50% were reported to pre-sent with concomitant soy protein allergy, with a higherfrequency reported in nonIgE-mediated enterocolitis-enteropathy syndrome (71,74Y76). A review of 2,108infants with cows_ milk protein allergy followed at 33Italian pediatric gastroenterology units reported that50% of these infants had received soy protein-basedformulae as the substitute for milk containing formulae.Soy protein formulae were discontinued in 47% of casesoverall, ranging from 53% of infants younger than3 months of age to 35% of children older than 1 year ofage (4). The reasons for this discontinuation were notgiven in the publication.
In 1983, the AAP Committee on Nutrition discouragedthe use of soy formulae in the dietary management ofinfants with documented allergy to cows_ milk protein(77). The AAP Nutrition Committee concluded in 1998that infants with documented cows_ milk protein-induced enteropathy or enterocolitis are frequentlysensitive to soy protein and should not be given soyprotein formula routinely, whereas it emphasized thatmost infants with documented IgE-mediated cows_ milk
protein allergy will do well when fed soy formula (3). In1990, the ESPGHAN Committee on Nutrition consid-ered that available data did not support the view that soyformula should be the preferred choice in case of sus-pected or proven adverse effects to cows_ milk protein(16). A joint statement of the ESPGHAN Committee onNutrition and the European Society for Pediatric Aller-gology and Clinical Immunology stipulated that, in gen-eral, formulae based on intact soy protein isolates arenot recommended for the initial treatment of food al-lergy in infants, although a proportion of infants withcows_ milk protein allergy tolerate soy formula (11).The AAP Nutrition Committee stated in 2000 that in-fants with IgE-associated symptoms of allergy may be-nefit from a soy formula, either as the initial treatmentor instituted after 6 months of age after use of a thera-peutic hydrolysate formula (12).
The exclusion of soy protein from the diet of infantswith IgE-mediated cows_ milk protein allergy has been acontroversial issue for a long time. In 93 children aged 3to 41 months with IgE-mediated cows_ milk protein al-lergy, Zeiger et al. (78) found a prevalence of concomi-tant soy allergy of only 14% (Table 2); 3% of the cohortwere under 6 months of age at the time of evaluationand challenge. Diagnosis of soy protein allergy in thisstudy was assessed by double-blind, placebo-controlledfood challenge response to soy, open challenge responseunder the direction of a physician, or history of morethan one immediate anaphylactic reaction to an isolatedingestion of soy. These investigators regard soy formulaas a safe alternative to cows’ milk formula for the vastmajority of children with IgE-mediated cows_ milk al-lergy, particularly those shown to have negative re-sponses to soy challenge at the time of introduction ofsoy formula (78).
Klemola et al. (79) recently reported that the presenceof concomitant soy allergy in infants with cows_ milkallergy is less frequent than previously thought (Table 2).They conducted a prospective, randomized study to evalu-ate the cumulative incidence of allergy or other adversereactions to soy formula compared with extensively hy-drolyzed formula up to the age of 2 years in infants with
TABLE 2. Studies on prevalence of soy allergy in immunoglobulin (Ig)E-associated cows_ milk allergy (CMA) (78) and incidenceof allergy to soy formula (SF) and extensively hydrolyzed formula (EHF) in cow’s milk allergy (79)
ReferenceStudydesign
Allocationconcealment Blinding
Intention-to-treat analysis
Completeness tofollow-up Participants
Klemola et al.,2002 (79)
RCT No Single-blinded
Yes Yes n = 170 (with CMA confirmed byDBPCFC or history of an anaphylactic
reaction)
Zeiger et al.,1999 (78)
Cohortstudy
NA NA NA NA n = 93, with IgE-mediated CMA
DBPCFC, double-blind, placebo-controlled food challenge; NA, not applicable RCT, randomized clinical trial; RR, relative risk; CI, confidence interval.
J Pediatr Gastroenterol Nutr, Vol. 42, No. 4, April 2006
SOY PROTEIN AND FOLLOW-ON FORMULAE 357
Copyr ight © Lippincott Williams & Wilkins. Unauthorized reproduction of this article is prohibited.
Appendix G Page G41

confirmed cows_ milk allergy. The parents suspectedadverse reactions significantly more often in infants ran-domly assigned to the soy formula than in infants ran-domly assigned to the extensively hydrolyzed formula(28%; 95% CI 18Y39% vs. 11%; 95% CI 5Y19%,respectively; relative risk [RR], 2.48; P = 0.006).Physicians diagnosed adverse reactions more often withsoy than with the extensively hydrolyzed formula (10%;95% CI 4.4%Y18.8% vs. 2.2%; 95% CI 0.3%Y7.8%,respectively; RR, 4.50; P = 0.031). Adverse reactions tosoy were similar in IgE-associated and nonIgE-associatedcow’s milk allergy (11% and 9%, respectively). Adversereactions were more common in younger (G6 months)than in older (6 to 12 months) infants (5 of 20 vs. 3 of 60,respectively, P = 0.01).
The use of soy formulae may play a role in the etiologyof peanut allergy. Evaluating data from the Avon longi-tudinal study, a geographic-defined cohort study of13,971 preschool children, Lack et al. (80) showed thatpeanut allergy was independently associated with intakeof soy milk or soy infant formula during the first 2 yearsof life (odds ratio 2.6; 95% CI 1.4Y5.0), suggesting thepossibility of cross-sensitization through common epi-topes. Soy protein fractions have been shown to behomologous to major peanut proteins (81). It is likelythat children with allergy to cows_ milk are at increasedrisk for food allergies, and soy consumption in infancyis increased in response to these atopic disorders.Indeed, a history of allergy to cows_ milk (reportedprospectively at 6 months) was significantly associatedwith peanut allergy (P = 0.03). In their study assessingthe long-term effects of soy protein formulae, Stromet al. (62) showed that, as adults, females who hadreceived soy formula in infancy more frequently usedantiallergic and antiasthmatic drugs (18.8% vs. 10.1%,P = 0.047), whereas males showed a similar but nonsig-nificant trend (15.8% vs. 10.2%, P = 0.08).
The Committee concludes that for treatment of cows_milk protein allergy, the use of therapeutic formulaebased on extensively hydrolyzed proteins (or amino acidpreparations if hydrolysates are not tolerated) should bepreferred to that of soy protein formulae. Given thelimited number of infants studied (78,79) and the higherreported rate of adverse reactions to soy protein in in-
fants under 6 months of age (79), the Committee recom-mends that soy protein formulae should not be used ininfants with food allergy during the first 6 months oflife. If soy protein formulae are used for therapeutic useafter the age of 6 months because of their lower cost andbetter acceptance, tolerance to soy protein should firstbe established by clinical challenge.
Prevention of Atopic Disease
The role of soy protein formulae for the prevention ofallergic disease in healthy and at-risk infants has beencontroversial (76,82) and is not supported by evidencefrom controlled trials (83Y87). A recent meta-analysis offive randomized and quasi-randomized clinical trials withappropriate methodology concluded that soy formulaedo not prevent food allergy in high-risk infants (13). Thejoint statement of the European Society for PaediatricAllergology and Clinical Immunology Committee on Hypo-allergenic Formulas and the ESPGHAN Committee onNutrition did not support the use of soy protein formulaefor the prevention of allergy in at-risk infants (11).
Infantile Colic and Regurgitation
Soy protein formulae have been widely used in the in-dustrialized countries for symptoms such as infantilecolic, regurgitation, or prolonged crying without anyconvincing evidence for efficacy (23). Controversial dataon the use of soy formulae have been obtained in infantswith severe infantile colic attributed to cows_ milk pro-tein allergy (88,89). One randomized clinical trial showeda mean weekly duration of colic symptoms of 8.7 hoursduring treatment with soy formula, as compared with18.8 hours during the control periods (mean difference =10.1; 95% CI 3.8Y16.5) (90). If persisting colic is de-fined as weeks in which there were 9 or more hours ofcolic symptoms, then colic persisted in only 31.6% ofinfants during the soy formula periods as opposed to94.7% during the control periods (RR 0.33; 95% CI0.017Y0.65). The other randomized clinical trial ofsoy protein formulae did not allow firm conclusionsto be drawn because of methodologic drawbacks (91).The meta-analysis of Lucassen et al. (92) collected 27
TABLE 2. (continued).
Age(mo)
Interventiongroup
Controlgroup Outcomes Results RR (95% CI)
2Y11 SF (n = 80) EHF (n = 90) Parents suspected adverse reaction tothe study formula
SF vs. EHF: 28% (95% CI 18Y39)vs. 11% (95% CI 5Y19)
2.5 (CI notgiven)
DBPCFC confirmed adverse reactionto the study formula
SF vs. EHF: 10%; (95% CI 4.4Y18.8)vs. 2.2%; (95% 0.3Y7.8)
4.5 (1.1Y18.4)
3Y 41 NA NA Soy allergy 14% (95% CI 7.7Y22.7)
J Pediatr Gastroenterol Nutr, Vol. 42, No. 4, April 2006
358 AGOSTONI ET AL.
Copyr ight © Lippincott Williams & Wilkins. Unauthorized reproduction of this article is prohibited.
Appendix G Page G42

controlled trials on the effectiveness of diets, drugtreatment, and behavioral interventions on infantile colic.Soy protein formulae were not effective when only trials ofgood methodologic quality were considered.
Ethical and Religious Considerations
Some parents (e.g., vegans) seek to avoid cows_ milkbased formulae for their infants for religious, philosophi-cal, or ethical reasons. Soy protein infant formulae is anacceptable alternative for these families.
CONCLUSIONS
1. Cows_ milk-based formulae should be preferred as thefirst choice for feeding healthy infants that are notfully breast fed.
2. Soy protein based formulae should only be used inspecified circumstances because they may have nutri-tional disadvantages and contain high concentrationsof phytate, aluminum, and phytooestrogens, the long-term effects of which are unknown.
3. Indications for soy formulae include severe persistentlactose intolerance, galactosemia, religious, ethical, orother considerations that stipulate the avoidance ofcows_ milk based formulae and treatment of somecases of cows_ milk protein allergy.
4. The Committee recommends that the use of thera-peutic formulae based on extensively hydrolyzedproteins (or amino acid preparations if hydrolysatesare not tolerated) should be preferred to that of soyprotein formula in the treatment of cows_ milk proteinallergy. Soy protein formula should not be used ininfants with food allergy during the first 6 months oflife. If soy protein formulae are considered fortherapeutic use after the age of 6 months because oftheir lower cost and better acceptance, tolerance to soyprotein should first be established by clinical challenge.
5. Soy protein formulae have no role in the prevention ofallergic diseases.
6. There is no evidence supporting the use of soy proteinformulae for the prevention or management of infan-tile colic, regurgitation, or prolonged crying.
7. Manufacturers should aim to reduce the concentra-tions of trypsin inhibitors, lectins, goitrogenic sub-stances, phytate, aluminum, and phytoestrogens in soyprotein formulae.
REFERENCES
1. Ruhrah J. The soy bean in infant feeding: preliminary report. ArchPediatr 1909;26:494Y501.
2. Hill LW, Stuart HC. A soy bean food preparation for feedinginfants with milk idiosyncrasy. JAMA 1929;93:985Y7.
3. American Academy of Pediatrics. Committee on Nutrition. Soyprotein-based formulas: recommendations for use in infantsfeeding. Pediatrics 1998;101:148Y53.
4. Zoppi G, Guandalini S. The story of soy formula feeding in infants:a road paved with good intentions. J Pediatr Gastroenterol Nutr1999;5:541Y3.
5. Comite de nutrition de la Societe fran0aise de pediatrie. Bocquet A,Bresson JL, Briend A, et al. Soy bean-based formulas in infantnutrition [French]. Arch Pediatr 2001;8:1226Y33.
6. Miniello VL, Moro GL, Tarantinon M, et al. Soy-based formulasand phyto-oestrogens: a safety profile. Acta Paediatr Suppl 2003;441:93Y100.
7. Scientific Committee on Food. Report on the revision of essentialrequirements of infant formulae and follow-up formulae (adoptedon 4 April 2003). SCF/CS/NUT/IF/65, Final May 18, 2003.
8. Committee on Toxicity. Committee on Toxicity of Chemicals inFood, Consumer Products and the Environment. Phytoestrogensand health. London: Food Standard Agency, 2003.
9. Agence Fran0aise de Securite Sanitaire des Aliments (FrenchFood Safety Agency). Report of the working group on phytoestro-gens [French], 2005. Available at: www.afssa.fr.
10. Walker-Smith JA, Sandhu BK, Isolauri E, and the ESPGHANworking group on acute diarrhoea. Recommendations for feedingin childhood gastroenteritis. J Pediatr Gastroenterol Nutr 1997;24:619Y20.
11. Host A, Koletzko B, Dreborg S, et al. Dietary products usedin infants for treatment and prevention of food allergy. JointStatement of the European Society for Paediatric Allergology andClinical Immunology (ESPACI) Committee on HypoallergenicFormulas and the European Society for Paediatric Gastroenterol-ogy, Hepatology and Nutrition (ESPGHAN) Committee onNutrition. Arch Dis Child 1999;81:80Y4.
12. American Academy of Pediatrics. Committee on Nutrition.Hypoallergenic infant formulas. Pediatrics 2000;106:346Y9.
13. Osborn DA, Sinn J. Soy formula in the prevention of allergyand food intolerance in infants. Cochrane Database Syst Rev2004:CD003741.
14. Bos C, Metges CC, Gaudichon C, et al. Postprandial kinetics ofdietary amino acids are the main determinant of their metabolismafter soy or milk protein ingestion in humans. J Nutr 2003;133:1308Y15.
15. Fomon SJ, Ziegler EE, Filer LJ, Nelson SE, Edwards B.Methionine fortification of a soy protein formula fed to infants.Am J Clin Nutr 1979;32:2460Y71.
16. ESPGAN Committee on Nutrition. Comment on the compositionof soy protein based infant and follow-up formulas. Acta PaediatrScand 1990;79:1001Y5.
17. Olson AL, Nelson SE, Rebouche CJ. Low carnitine intake andaltered lipid metabolism in infants. Am. J Clin Nutr 1989;49:624Y8.
18. Life Sciences Research Office. American Society for NutritionalSciences. Assessment of nutrient requirements for infant formulas.J Nutr 1998;128(Suppl 11):2059SY298S.
19. Commission Directive 91/321/EEC of 14 May 1991 on infantformulae and follow-on formulae. Official J European Communities04.07.1991, L 175, 35.
20. Commission Directive 96/4/EC of 16 February 1996 amendingDirective 91/321/EEC on infant formulae and follow-on formulae.Official J European Communities 28.02.1996, L 49.
21. Fomon SJ, Thomas LN, Filer LJ Jr, Anderson TA, Bergmann KE.Requirements for protein and essential amino acids in earlyinfancy. Studies with a soy-isolate formula. Acta Paediatr Scand1973;62:33Y45.
22. Fomon SJ, Ziegler EE, Nelson SE, Edwards BB. Requirementfor sulfur-containing amino acids in infancy. J Nutr 1986;116:1405Y22.
23. Fomon SJ. Infant formulas. In: Fomon SJ, ed. Nutrition of NormalInfants. St. Louis: Mosby; 1993: 424Y42.
24. Mendez MA, Anthony MS, Arab L. Soy-based formulae and infantgrowth and development: a review. J Nutr 2002;132:2127Y30.
25. Venkataraman PS, Luhar H, Neylan MJ. Bone mineral metabolismin full-term infants fed human milk, cow milk-based, and soy-based formulas. Am J Dis Child 1992;146:1302Y5.
J Pediatr Gastroenterol Nutr, Vol. 42, No. 4, April 2006
SOY PROTEIN AND FOLLOW-ON FORMULAE 359
Copyr ight © Lippincott Williams & Wilkins. Unauthorized reproduction of this article is prohibited.
Appendix G Page G43
26. Mimouni F, Campaigne B, Neylan M, Tsang RC. Bone mineral-ization in the first year of life in infants fed human milk, cow-milkformula, or soy-based formula. J Pediatr 1993;122:348Y54.
27. Hall RT, Callenbach JC, Sheehan MB, et al. Comparison ofcalcium- and phosphorus-supplemented soy isolate formula withwhey-predominant premature formula in very-low-birth-weightinfants. J Pediatr Gastroenterol Nutr 1984;3:571Y6.
28. Hurrell RF, Juillerat MA, Reddy MB, et al. Soy protein, phytateand iron absorption in humans. Am J Clin Nutr 1992;56:573Y8.
29. Davidsson L, Galan P, Kastenmayer P, et al. Iron bioavailabi-lity studied in infants: the influence of phytic acid and ascorbicacid in infant formulas based on soy isolate. Pediatr Res 1994;36:816Y22.
30. Lonnerdal BO, Jayawickrama L, Lien EL. Effect of reducing thephytate content and of partially hydrolyzing the protein in soyformula on zinc and copper absorption and status in infant rhesusmonkeys and rat pups. Am J Clin Nutr 1999;69:490Y6.
31. Davidsson L, Ziegler EE, Kastenmayer P, van Dael P, Barclay D.Dephytinisation of soyabean protein isolate with low native phyticacid content has limited impact on mineral and trace elementabsorption in healthy infants. Br J Nutr 2004;91:287Y94.
32. Hydrovitz JD. Occurrence of goiter in an infant on a soy diet.N Engl J Med 1960;262:351Y3.
33. Shepard TH, Pyne GE, Kirschvink JF, Mc Lean M. Soy beangoiter: report of three cases. N Engl J Med 1960;262:1099Y103.
34. Chorazy PA, Himelhoch S, Hopwood NJ, Greger NG, PostellonDC. Persistent hypothyroidism in an infant receiving a soy formula:case report and review of the literature. Pediatrics 1995;96:148Y50.
35. Jabbar MA, Larrea J, Shaw RA. Abnormal thyroid function testsin infants with congenital hypothyroidism: the influence of soy-based formula. J Am Coll Nutr 1997;16:280Y2.
36. Conrad SC, Chiu H, Silverman BL. Soy formula complicatesmanagement of congenital hypothyroidism. Arch Dis Child 2004;89:37Y40.
37. Kuchan MJ, Ostrom KM, Smith C, Hu PE. Influence of purineintake on uric acid excretion in infants fed soy infant formula.J Am Coll Nutr 2000;19:16Y22.
38. American Academy of Pediatrics. Committee on Nutrition.Aluminium toxicity in infants and children. Pediatrics 1996;97:413Y6.
39. World Health Organization. Evaluation of certain food additivesand contaminants. Thirty-third report of the Joint FAO/WHOExpert Committee on Food Additives. WHO Tech Rep Ser 1989;776:1Y64.
40. Zung A, Reifen R, Kerem Z, Zadik Z. Phytoestrogens: the pediatricperspective. J Pediatr Gastroenterol Nutr 2001;33:112Y8.
41. Setchell KD, Zimmer-Nechemias L, Cai J, Heubi JE. Isoflavonecontent of infant formulas and the metabolic fate of these phyto-estrogens in early life. Am J Clin Nutr 1998;68(Suppl):1453sY61s.
42. Setchell KD. Soy isoflavones: benefits and risks from nature’sselective estrogen receptor modulators (SERMs). J Am Coll Nutr2001;20:354sY62s.
43. Hawrylewicz EJ, Huang HH, Blair WH. Dietary soybean isolateand methionine supplementation affect mammary tumor progres-sion in rats. J Nutr 1991;121:1693Y8.
44. Naik HR, Lehr JE, Pienta KJ. An in vitro and in vivo study ofantitumor effects of genistein on hormone refractory prostatecancer. Anticancer Res 1994;14:2617Y20.
45. Barnes S, Peterson G, Grubbs C, et al. Potential role of dietaryisoflavones in the prevention of cancer. Adv Exp Med Biol 1994;354:135Y47.
46. Birt DF, Shull JD, Yaktine AL. Chemoprevention of cancer. In:Shils ME, Olson JA, Shike M, et al, eds. Modern Nutrition in Healthand Disease. Baltimore, MD: Williams and Wilkins; 1998: 1263Y95.
47. Anderson JW, Smith BM, Washnock CS. Cardiovascular andrenal benefits of dry bean and soybean intake. Am J Clin Nutr1999;70(Suppl):464sY74s.
48. Velasquez MT, Bhathena SJ. Dietary phytoestrogens: a possiblerole in renal disease protection. Am J Kidney Dis 2001;37:1056Y68.
49. Setchell KDR, Welsh MB, Lim CK. HPLC analysis of phytoes-trogens in soy preparations with ultraviolet, electrochemical andthermospray mass spectrometric detection. J Chromatograph1987;368:315Y23.
50. Setchell KD, Zimmer-Nechemias L, Cai J, Heubi JE. Exposure ofinfants to phytoestrogens from soy-based infant formula. Lancet1997;350:23Y7.
51. Franke AA, Custer LJ, Tanaka Y. Isoflavones in human breastmilk and other biological fluids. Am J Clin Nutr 1998;68(Suppl):1466sY73s.
52. Irvine CH, Shand N, Fitzpatrick MG, Alexander SL. Daily intakeand urinary excretion of genistein and daidzein by infants fed soy-or dairy-based infant formulas. Am J Clin Nutr 1998;68(Suppl):1462sY5s.
53. Benneteau-Pelissero C, Sauvant P, Peltre G, et al. Soy phytoes-trogens: problems raised in infants with cow’s milk protein allergyfed soy formulae [French]. Cah Nutr Dietet 2004;39:24Y32.
54. Antignac JP, Cariou R, Le Bizec B, Andre F. New data regardingphytoestrogens content in bovine milk. Food Chem 2004;87:275Y81.
55. Markiewicz L, Garey J, Adlercreutz H, Gurpide E. In vitrobioassays of non-steroidal phytoestrogens. J Steroid Biochem MolBiol 1993;45:399Y405.
56. Yellayi S, Naaz A, Szewczykowski MA, et al. The phytoestrogengenistein induces thymic and immune changes: a human healthconcern? Proc Natl Acad Sci U S A 2002;99:7616Y21.
57. Bennetts HW, Underwood EJ, Shier FL. A specific breedingproblem of sheep on subterranean clover pastures in WesternAustralia. Aust J Agric Res 1946;22:131Y8.
58. Levy JR, Faber KA, Ayyash L, Hughes CL Jr. The effect ofprenatal exposure to the phytoestrogen genistein on sexualdifferentiation in rats. Proc Soc Exp Biol Med 1995;208:60Y6.
59. Fort P, Moses N, Fasano M, Goldberg T, Lifshitz F. Breast andsoy-formula feedings in early infancy and the prevalence ofautoimmune thyroid disease in children. J Am Coll Nutr 1990;9:164Y7.
60. Divi RL, Chang HC, Doerge DR. Anti-thyroid isoflavones fromsoybean. Biochem Pharmacol 1997;54:1087Y96.
61. Freni-Titulaer LW, Cordero JF, Haddock L, et al. Prematurethelarche in Puerto Rico. A search for environmental factors. Am JDis Child 1986;140:1263Y7.
62. Strom BL, Schinnar R, Ziegler EE, et al. Exposure to soy-basedformula in infancy and endocrinological and reproductive out-comes in young adulthood. JAMA 2001;286:807Y14.
63. Ostrom KM, Cordle CT, Schaller JP, et al. Immune status ofinfants fed soy-based formulas with or without added nucleotidesfor 1 year. I. Vaccine responses, and morbidity. J PediatrGastroenterol Nutr 2002;34:137Y44.
64. Cordle CT, Winship TR, Schaller JP, et al. Immune status ofinfants fed soy-based formulas with or without added nucleotides.II. Immune cell populations. J Pediatr Gastroenterol Nutr 2002;34:145Y53.
65. Walter JH, Collins JE, Leonard JV. on behalf of the UKGalactosaemia Steering Group. Recommendations for the man-agement of galactosaemia. Arch Dis Child 1999;80:93Y6.
66. Wiesmann UN, Rose-Beutler B, Schluchter R. Leguminosae in thediet: the raffinose-stachyose question. Eur J Pediatr 1995;154(Suppl 2):93Y6.
67. Brown KH, Peerson JM, Fontaine O. Use of nonhuman milks inthe dietary management of young children with acute diarrhoea: ameta-analysis of clinical trials. Pediatrics 1994;93:17Y27.
68. Sandhu BK, Isolauri E, Walker-Smith JA, et al. Early feeding inchildhood gastroenteritis. A multicentre study on behalf of theEuropean Society of Paediatric Gastroenterology and NutritionWorking Group on Acute Diarrhoea. J Pediatr Gastroenterol Nutr1997;24:522Y7.
69. Darmon N, Abdoul E, Roucayrol AM, et al. Sensitization to cow’smilk proteins during refeeding of guinea pigs recovering frompolydeficient malnutrition. Pediatr Res 1998;44:931Y8.
J Pediatr Gastroenterol Nutr, Vol. 42, No. 4, April 2006
360 AGOSTONI ET AL.
Copyr ight © Lippincott Williams & Wilkins. Unauthorized reproduction of this article is prohibited.
Appendix G Page G44

70. Li XM, Schofield BH, Huang CK, Kleiner GI, Sampson HA. Amurine model of IgE-mediated cow’s milk hypersensitivity.J Allergy Clin Immunol 1999;103:206Y14.
71. Zeiger RS. Dietary aspects of food allergy prevention in infantsand children. J Pediatr Gastroenterol Nutr 2000;30(Suppl 1):77Y86.
72. Perkkio M, Savilahti E, Kuitunen P. Morphometric and immuno-histochemical study of jejunal biopsies from children with intes-tinal soy allergy. Eur J Pediatr 1981;137:63Y9.
73. Sicherer SH. Food protein-induced enterocolitis syndrome: clin-ical perspectives. J Pediatr Gastroenterol Nutr 2000;30(Suppl 1):45Y9.
74. Powell GK. Enterocolitis in low-birth-weight infants associatedwith milk and soy protein intolerance. J Pediatr 1976;88:840Y4.
75. Halpin TC, Byrne WJ, Ament ME. Colitis, persistent diarrhea andsoy protein intolerance. J Pediatr 1977;91:404Y7.
76. Kerner JA Jr. Use of infant formulas in preventing or postponingatopic manifestations. J Pediatr Gastroenterol Nutr 1997;24:442Y6.
77. American Academy of Pediatrics; Committee on Nutrition. Soy-protein formulas: recommendations for use in infants. Pediatrics1983;72:359Y63.
78. Zeiger RS, Sampson HA, Bock SA, et al. Soy allergy in infantsand children with IgE-associated cow’s milk allergy. J Pediatr1999;134:614Y22.
79. Klemola T, Vanto T, Juntunen-Backman K, et al. Allergy to soyformula and to extensively hydrolyzed whey formula in infantswith cow’s milk allergy: a prospective, randomized study with afollow-up to the age of 2 years. J Pediatr 2002;140:219Y24.
80. Lack G, Fox D, Northstone K, Golding J. Factors associated withthe development of peanut allergy in childhood. N Engl J Med2003;348:977Y85.
81. Sicherer SH, Sampson HA, Burks AW. Peanut and soy allergy: aclinical and therapeutic dilemma. Allergy 2000;55:515Y21.
82. Businco L, Bruno G, Giampietro PG. Soy protein for the preventionand treatment of children with cow-milk allergy. Am J Clin Nutr1998;68(Suppl):1447sY52s.
83. Kjellman NI, Johansson SG. Soy versus cow’s milk in infants withbi-parental history of atopic disease: development of atopicdisease and immunoglobulins from birth to 4 years of age. ClinAllergy 1979;9:347Y58.
84. Gruskay FL. Comparison of breast, cow and soy feedings in theprevention of onset of allergic disease: a 15-year prospectivestudy. Clin Pediatr 1982;21:486Y91.
85. Moore WJ, Midwinter RE, Morris AF, Colley JR, Soothill JF.Infant feeding and subsequent risk of atopic eczema. Arch DisChild 1985;60:722Y6.
86. Merrett TG, Burr ML, Butland BK, et al. Infant feeding andallergy: 12-month prospective study of 500 babies born intoallergic families. Ann Allergy 1988;61:13Y20.
87. Chandra RK. Five-year follow-up of high-risk infants with familyhistory of allergy who were exclusively breast-fed or fed partialwhey hydrolysate, soy, and conventional cow’ milk formulas.J Pediatr Gastroenterol Nutr 1997;24:380Y8.
88. Iacono G, Carrocio A, Montalto G, et al. Severe infantile colic andfood intolerance: a long-term prospective study. J PediatrGastroenterol Nutr 1991;12:332Y5.
89. Garrisson MM, Christakis DA. Early childhood: colic, child de-velopment, and poisoning prevention. A systematic review oftreatments of infant colic. Pediatrics 2000;106:184Y90.
90. Campbell JP. Dietary treatment of infant colic: a double-blindstudy. J R Coll Gen Pract 1989;39:11Y4.
91. Lothe L, Lindberg T, Jakobsson I. Cow’s milk formula as a causeof infantile colic: a double-blind study. Pediatrics 1982;70:7Y10.
92. Lucassen PL, Assendelft WJ, Gubbels JW, et al. Effectiveness oftreatments for infantile colic: systematic review. BMJ 1998;316:1563Y9.
J Pediatr Gastroenterol Nutr, Vol. 42, No. 4, April 2006
SOY PROTEIN AND FOLLOW-ON FORMULAE 361
Copyr ight © Lippincott Williams & Wilkins. Unauthorized reproduction of this article is prohibited.
Appendix G Page G45