October 2020 Partnership Turnaround: Year Two Report
262
October 2020 Partnership Turnaround: Year Two Report EPIC Education Policy Innovation Collaborative
Transcript of October 2020 Partnership Turnaround: Year Two Report

October 2020
Partnership Turnaround: Year Two Report
EPICEducation Policy Innovation Collaborative
DISCLAIMER The Education Policy Innovation Collaborative (EPIC) at Michigan State University is an independent, non-partisan research center that operates as the strategic research partner to the Michigan Department of Education (MDE) and the Center for Educational Performance and Information (CEPI). EPIC conducts original research using a variety of methods that include advanced statistical modeling, representative surveys, interviews, and case study approaches.
This research result used data structured and maintained by the MERI-Michigan Education Data Center (MEDC). MEDC data is modified for analysis purposes using rules governed by MEDC and are not identical to those data collected and maintained by the Michigan Department of Education(MDE) and/or Michigan’s Center for Educational Performance and Information (CEPI). Results, information and opinions solely represent the analysis, information and opinions of the author(s) and are not endorsed by, or reflect the views or positions of, grantors, MDE and CEPI or any employee thereof. All errors are our own.

AUTHORSKatharine O. Strunk, EPIC Faculty Director; Professor of Education Policy, MSU
Jason Burns, EPIC Faculty Affiliate; Assistant Professor of Education, Seton Hall University
Chris Torres, EPIC Faculty Affiliate; Associate Professor of Education, MSU
Aliyah Mcilwain, EPIC Research Assistant, MSU
Sandy Frost Waldron, EPIC Research Assistant, MSU
Erica Harbatkin, EPIC Postdoctoral Research Associate, MSU
ACKNOWLEDGMENTSThe authors wish to acknowledge the many people who graciously gave of their time in support of this effort. We are grateful to the nearly 3,500 educators who participated in our survey of teachers and principals in Partnership districts during the Fall of 2019, to the Partnership district superintendents who spoke with us, and to the educators who participated in our case studies.
We are also indebted to a number of individuals who provided technical and research support for this study. From the Michigan Department of Education, we would like to thank Dr. William Pearson, Dr. Venessa Keesler, Sheila Alles, Dr. Michael Rice, Dr. Paula Daniels, Dan LaDue, and the entire staff of the Office of Partnership Districts for their support and thoughtful feedback. We would also like to thank the many staff from the Center for Educational Performance and Information who assisted us with obtaining and understanding the administrative data, and in particular Tom Howell, Trina Anderson, Mike McGroarty, and Rod Bernosky. At Michigan State University, we thank Dr. Tara Kilbride, Emily Hatch, Meg Turner, and Chayse Hurley for their assistance in analyzing data for this report as well as Emily Mohr for her coordination and thoughtful suggestions on the report and Michelle Huhn for her work in formatting the text and graphics for this report.
Lastly, the authors are grateful to Arnold Ventures, the Smith Richardson Foundation, the Michigan Department of Education, and Michigan State University’s College of Education for their generous financial support of the Education Policy Innovation Collaborative and this study.
OCTOBER 2020
PARTNERSHIP TURNAROUND:YEAR TWO REPORT

ContentsPARTNERSHIP TURNAROUND YEAR TWO REPORT: EXECUTIVE SUMMARY i
Main Findings ............................................................................................................................... iiPolicy Implications .................................................................................................................... iv
SECTION ONE: INTRODUCTION 1Purpose of this Report ................................................................................................................1Michigan’s Partnership Model of School and District Turnaround ................................1Michigan’s Partnership Districts: A Snapshot of Economic and Social Inequality ....2Focus of the Second Annual Report .......................................................................................6Summary .......................................................................................................................................7
SECTION TWO: DATA AND METHODS 9Introduction ..................................................................................................................................9Description of Data and Methods ........................................................................................10State Administrative Records on Students and Teachers ............................................. 12Interviews With Partnership District Leaders .................................................................. 22Case Studies .............................................................................................................................. 23Brief Background of Case Study Districts .......................................................................... 24Review of Goal Attainment Observations ......................................................................... 26Summary .................................................................................................................................... 26
SECTION THREE: HOW HAS THE PARTNERSHIP MODEL CHANGED OVER TIME? 30
How the Partnership Model Was Intended to Work ......................................................30Changes Made to the Partnership Model ..........................................................................33
LIAISONS: Providing Information, Navigating Compliance, and Listening and Providing Feedback ................................................................................ 42Special Section A: Awareness and Understanding of the Partnership Model ................................................................................................48
Changes in Educators’ Awareness of Partnership Agreements ..................................48Partnership Educators Report Greater Understanding of Their Agreements Than do Non-Partnership Educators .......................................................... 49Teachers’ Lack of Understanding and Why it May Not be a Cause for Concern.... 52Summary .................................................................................................................................... 53
SECTION FOUR: HOW HAS PARTNERSHIP CHANGED EDUCATION? 55
How Has Partnership Changed Education in Partnership Schools and Districts, and How is the Model Being Implemented? .................................................. 55Partnership Impacts on Student Outcomes...................................................................... 56Partnership Model Implementation and How Educators Perceive its Benefits ........67
Special Section B: Bridging and Buffering ................................................................... 68Districts Continue to Show Variation in Responses to the Partnership Model ....... 68
Case Study Vignette 01: Stars and Flames Used the Reform as a Framework for Improvement and to Transition Leadership ...................................76Special Section C: How Leaders Viewed Partnership in Traditional Public Schools and Public School Academies ................................................. 86
Why Partnership Leaders in Charter Schools Viewed the Partnership Model More Positively Than Their TPS Peers .................................................................. 86Additional Partnership Model Funding Went Farther in Charter Organizations .... 87Enhanced Communication in Partnership Charter Schools Led to Greater Acceptance, Awareness, and Understanding of the Partnership Model .................. 87Partnership May be Particularly Beneficial to Charter Schools Because it Brings New Partners to Assist Charters With Their Improvement .............................91Charter School Educators Expressed Fewer Fears Related to Potential High-Stakes Consequences of Partnership ....................................................................... 93Charter Schools Were More Likely to Use a Bridging Response, Whereas TPS Districts Were More Likely to Symbolically Adopt or Buffer Against the Reform ................................................................................................................................94Summary .................................................................................................................................... 95
Case Study Vignette 02: Educators Felt That Improving Culture and Climate Was Foundational to Meeting Partnership Goals ................................... 113
Educators Perceptions of Improvements in Partnership Schools and Districts .....118Summary ...................................................................................................................................126
SECTION FIVE: WHAT HUMAN CAPITAL CHALLENGES FACE PARTNERSHIP SCHOOLS AND DISTRICTS? 128
What Human Capital Challenges Face Partnership Schools and Districts, and How Are Educators in These Districts Addressing Them? ............................... 128An Overview of Educators in Partnership Schools and Districts .............................. 129Teacher Recruitment and Retention .................................................................................. 131Recruitment and Hiring Challenges May be Easing in Partnership Schools and Districts ............................................................................................................................ 139
Case Study Vignette 03: Blues Combined Creative Teacher Recruitment and Retention Efforts to Enable Complex Instructional Work ... 144
Difficulties Persist With Retention in Partnership Schools ......................................... 147Reports From Partnership Teachers Suggest a Potential Increase in Work Force Stability ........................................................................................................................... 151Partnership Districts Implemented New Strategies to Improve Teacher Retention .................................................................................................................................. 158

Case Study Vignette 04: Case Study Districts Improved Teacher Retention in Different Ways Despite Financial Disadvantages and Teacher Pay Disparities in Competing Districts ...................................................... 161Case Study Vignette 05: ISD Partners Provided Strong Teacher Development and Coaching Supports, Which were Viewed as Critical for Improvement Efforts ................................................................................................ 166
Partnership Schools Similarly Faced Challenges With Retaining Principals .......... 170Summary ...................................................................................................................................174
SECTION SIX: WHAT CONDITIONS MEDIATE PARTNERSHIP TURNAROUND EFFORTS? 176
School Leadership ...................................................................................................................176Financial Resources ................................................................................................................181Partnership Systems and Processes ................................................................................. 182
Special Section D: Partnership Districts and COVID-19 ...................................... 190Differences in COVID Responses Between Partnership and Non-Partnership Districts .............................................................................................................. 191Continued Implications of COVID for Partnership Districts .....................................200Implications of COVID for EPIC's Evaluation of the Partnership Model .................202Summary ..................................................................................................................................203
SECTION SEVEN: KEY TAKEAWAYS AND POLICY IMPLICATIONS 205
Key Takeaways ....................................................................................................................... 205Policy Implications .................................................................................................................207
KEY TERMS, REFERENCES AND APPENDICES 209Key Terms ................................................................................................................................ 209References ................................................................................................................................ 211Appendix A. Table of Partnership Schools and Districts by Round and Current Status ................................................................................................... 214Appendix B. Full Results for Report Tables ...................................................................... 219

LIST OF FIGURESFIGURE 1. Partnership Cohort Effect Sizes Relative to Similar Interventions .............. iiFIGURE 1.1. The Proportion of Students in Partnership Districts, by Race/Ethnicity .........................................................................................................................................6FIGURE 2.2. Cohort Year Identification ............................................................................... 17FIGURE 3.1. Original Partnership Model Theory of Change (2017-2018) .................. 31FIGURE 3.2. Updated Partnership Model (2019-2020) ................................................ 34FIGURE 3.3. Educators’ Perceived Likelihood of Consequences for Failing to Improve .................................................................................................................................. 35FIGURE A1. Partnership Educators’ Awareness of Different Improvement Plans, 2018-2019 and 2019-2020 .......................................................................................48FIGURE A2. Principals’ Understanding of Their Partnership Agreements ...............50FIGURE A3. Teachers’ Understanding of Their Partnership Agreements ................. 51FIGURE 4.1. Educators’ Perceptions That Their Schools’ Improvement Goals Will Improve Student Outcomes ..............................................................................57FIGURE 4.2. Event Study Estimates of the Effect of Partnership on Cohort 1 Student Gains in Math and ELA......................................................................................... 58FIGURE 4.3. Event Study Estimates of the Effect of Partnership on Cohort 2 Student Gains in Math and ELA .........................................................................................61FIGURE 4.4. Year One Effect Size Interpretation ............................................................. 65FIGURE 4.5. Year Two Effect Size Interpretation ............................................................ 66FIGURE B1. Visualization of Districts’ Year Two Bridging and Buffering Responses .................................................................................................................................. 69FIGURE 4.6. Educators’ Perceptions of Alignment Between Their Partnership Agreement and School Improvement Plan ...............................................80FIGURE 4.7.1. Principals’ Evaluations of Their School Goals ........................................ 82FIGURE 4.7.2. Teachers’ Evaluations of Their School Goals ......................................... 83FIGURE C1. Educators’ Awareness of Improvement Plans, by Charter and TPS Respondents .....................................................................................................................88FIGURE C2. Principals’ Understanding of Their Partnership Agreements, by Charter and TPS Respondents ........................................................................................ 89FIGURE C3. Teachers’ Understanding of Their Partnership Agreements, by Charter and TPS Respondents ........................................................................................90FIGURE C4. Educators’ Perceived Likelihood of Improvement, by Charter and TPS Educators ................................................................................................................... 93FIGURE C5. Principals’ Perceptions of Accountability, by Charter and TPS Respondents ..............................................................................................................................94FIGURE 4.8. Partnership and Non-Partnership Teachers Reported Data Use ......100FIGURE 4.9. Educators’ Change in Focus — Academic Performance .......................101FIGURE 4.10. Potential Benefit From Increased Assistance — Academic Performance ............................................................................................................................ 103FIGURE 4.11. Educators’ Change in Focus — Family and Student Engagement .....104
Figures and Tables

FIGURE 4.12. Educators’ Change in Focus — Operations, Climate, and Culture ... 105FIGURE 4.13.1. Principals Report Change in Culture and Climate in Partnership and Non-Partnership Schools .......................................................................110FIGURE 4.13.2. Teachers Report Change in Culture and Climate in Partnership and Non-Partnership Schools ........................................................................111FIGURE 4.14. Potential Benefit From Increased Assistance — Family and Student Engagement .............................................................................................................. 117FIGURE 4.15. Potential Benefit From Increased Assistance — School Culture and Climate ...............................................................................................................118FIGURE 4.16. Educators’ Overall Job Satisfaction ........................................................... 119FIGURE 4.17.1. Principals’ Grades in Partnership and Non-Partnership Schools .... 121FIGURE 4.17.2. Teachers’ Grades in Partnership and Non-Partnership Schools ....122FIGURE 4.18.1. Principals’ Reported Change Since the Prior Year ............................. 124FIGURE 4.18.2. Teachers’ Reported Change Since the Prior Year ..............................125FIGURE 5.1.1. Trends in Teachers’ School Exit Rates by School Type ........................132FIGURE 5.1.2. Trends in Teachers’ District Exit Rates by School Type .......................132FIGURE 5.2. Educators’ Change in Focus — Human Capital ...................................... 134FIGURE 5.3. Potential Benefit from Increased Assistance — Human Capital ........135FIGURE 5.4. Principals’ Reports of Hiring Difficulties .................................................. 136FIGURE 5.5 Principals’ Reports of Hiring Difficulties ................................................... 139FIGURE 5.6. Teachers’ Professional Plans for Next School Year — Partnership and Non-Partnership Schools 2018-2019 and 2019-2020 School Years .............................................................................................................................153FIGURE 5.7. Importance of Factors Driving Partnership School Teachers’ Future Plans — Teachers Staying in the District 2019-2020 School Year .............. 154FIGURE 5.8. Importance of Factors Driving Non-Partnership School Teachers’ Future Plans — Teachers Staying in the District 2019-2020 School Year .............................................................................................................................. 154FIGURE 5.9. Importance of Factors Driving Partnership School Teachers’ Future Plans — Teachers to Leave the District 2019-2020 School Year ..................157FIGURE 5.10. Importance of Factors Driving Non-Partnership School Teachers’ Future Plans — Teachers to Leave the District 2019-2020 School Year ...............................................................................................................................157FIGURE 5.11. Partnership Educators’ Satisfaction with Their Salaries ......................160FIGURE 5.12.1. Principal School Exit Rates by School Type .......................................... 170FIGURE 5.12.2. Principal District Exit Rates by School Type ........................................ 171FIGURE 5.13. Principals’ Professional Plans for Next School Year — Partnership and Non-Partnership Schools 2018-2019 and 2019-2020 School Years .............................................................................................................................172FIGURE 5.14. Importance of Factors Driving Partnership and Non-Partnership Principals’ Plans to Stay or Leave After the 2019-2020 School Year .173FIGURE 6.1. Teachers’ Evaluations of Their Principals’ Effectiveness .......................178FIGURE D1. Reported Challenges Faced in Transitioning to Remote Learning ........192FIGURE D2. Percent of Districts by Primary Mode of Instruction and Partnership Status ..................................................................................................................193FIGURE D3. Percent of District COL Plans and Instructional Modalities, by Partnership Status ................................................................................................................. 194

Figure D4. Teachers’ Reported Steps Taken to Engage Virtually with Students During COVID-19, by Partnership Status ....................................................... 195FIGURE D5. Percent of Districts that Provide Electronic Devices and Internet Access to Students, by Partnership Status ..................................................... 195FIGURE D6. Professional Development and Training on Distance Learning, by Partnership Status ............................................................................................................ 196FIGURE D7. Purposes of Non-Instructional Meetings with Students .......................197FIGURE D8. Accommodations Provided for Subgroups of Students ....................... 198FIGURE D9. Reported Concerns Over Impact of COVID-19, by Partnership Status ........................................................................................................................................ 199
LIST OF TABLESTABLE 1.1. Community and Descriptive Characteristics by Partnership District Status, 2013-2017 ........................................................................................................3TABLE 1.1. (continued) Community and Descriptive Characteristics by Partnership District Status, 2013-2017 .................................................................................4TABLE 1.2. Demographic Concentration of Students in Partnership Schools and Districts .................................................................................................................5TABLE 2.1. Data Sources ..........................................................................................................10TABLE 2.1. (continued) Data Sources....................................................................................11TABLE 2.2. Research Questions With Corresponding Data Sources .......................... 12TABLE 2.3. Descriptive Statistics for Students in Cohort 1, Cohort 2, Their Comparison Groups, and the Remainder of the State ....................................................15TABLE 2.4. Number of Educators Invited to Participate in Partnership Surveys and Response Rates..................................................................................................19TABLE 2.5. Response Rate by Cohort .................................................................................20TABLE 4.1. Partnership Effects on Cohort 1 Student Outcomes (Partnership Compared With Cohort 1 Comparison Schools) ................................... 59TABLE 4.2. Partnership Effects on Cohort 1 Students Outcomes DPSCD (Partnership Compared With Cohort 1 Comparison Schools) ...................................60TABLE 4.3. Partnership Effects on Cohort 2 Student Outcomes (Partnership Compared With Cohort 2 Comparison Schools) ................................... 62TABLE B1. Change in Bridging/Buffering Characterization from 2018-2019 to 2019-2020 ............................................................................................................................. 71TABLE 5.1.1. Description of Educators in Cohort 1 Partnership Districts and Schools, 2018-19 ..................................................................................................................... 129TABLE 5.1.2. Description of Educators in Cohort 2 Partnership Districts and Schools, 2018-19 ............................................................................................................. 130TABLE 5.2.1. Cohort 1 Partnership Effects on Teacher Outcomes(Partnership Relative to Comparison Schools) ......................................... 148TABLE 5.2.2. Cohort 1 Partnership Effects on Teacher Outcomes in DPCSD(Partnership Relative to Comparison Schools) ............................................... 149TABLE 5.2.3. Cohort 2 Partnership Effects on Teacher Outcomes in DPCSD(Partnership Relative to Comparison Schools) ............................................... 150TABLE D1. Instructional Modality for Fall 2020 School Reopening, by Partnership Status ................................................................................................................. 201

EPIC | Education Policy Innovation Collaborative — Michigan State University
J
Partnership Turnaround: Year Two Report
EXECUTIVE SUMMARY
EPICEducation Policy Innovation Collaborative

OverviewThis interim report is part of a multi-year evaluation of the implementation and efficacy of Michigan’s Partnership Model of school and district turnaround. The Partnership Model aims to build district capacity to improve outcomes in chronically low-performing schools and districts by fostering a coalition of partners from the Michigan Department of Education (MDE), Intermediate School Districts (ISDs), and local communities. Identified Partnership districts and charter organizations crafted three-year Partnership Agreements that highlighted districts’ specific needs, established strategies to address those needs, and detailed measurable achievement and process goals. If these goals were not met by the end of the three-year period, schools would be subject to high-stakes accountability consequences, including the potential for reconstitution or closure. The state also allocated roughly $6 million in each year of the reform to date in the form of 21h grants to support districts’ efforts to meet their goals.
This is the second of four annual reports that will be released as part of our evaluation of the Partnership Model. These reports are different and separate from the Review of Goal Attainment (RGA) process the Office of Partnership Districts conducts with Partnership districts. The Education Policy Innovation Collaborative (EPIC) is the strategic research partner to MDE, and although MDE requested the analysis documented here, our evaluation and its results are independent of MDE and the conclusions and recommendations are EPIC’s own.
The purpose of this report is to provide an update on the implementation of the Partnership Model in the third year of the reform (2019-20) and to assess the efficacy of the reform in improving teacher and student outcomes by the end of the second year of the reform (2018-19). To do so, we use an event study design that leverages longitudinal data on students and educators throughout the state, combined with analysis of data from Partnership teacher and principal surveys, interviews with Partnership leaders, and case studies of three Partnership districts. This
Partnership Turnaround Year Two Report: Executive Summary
EPIC Education Policy Innovation CollaborativeRESEARCH WITH CONSEQUENCE
October 2020

EPIC | Education Policy Innovation Collaborative — Michigan State University
ii
multi-method approach allowed us to answer questions not only about the impact of the reform, but also how the model was implemented, how educators perceived implementation, and how and why implementation varied depending on different contexts.
MAIN FINDINGSAfter an Initial Year of Student Achievement Growth in Cohort 1, Progress Was Evident but UnevenStudents in the first cohort of Partnership schools made significant achievement gains in third- through eighth-grade math and English language arts (ELA) in their first year of implementation relative to the year they were identified as Partnership schools. These ELA gains continued into the second year, and high school students in Partnership schools fared significantly better on the ELA SAT test in the second year of implementation. Math scores did not continue to increase in the second year of Partnership. Relative to similar turnaround interventions, math and ELA gains for Cohort 1 schools were moderate to large in magnitude.
FIGURE 1. Partnership Cohort Effect Sizes Relative to Similar Interventions
*Cohort 2, Yr. 1 - Tennessee's iZone3
*Cohort 1, Yr. 1 - Tennessee's iZone3
*Partnership Schools Cohort 1
*Cohort 2, Yr. 1 - L.A.'s Public School Choice Initiative4
Michigan’s SIG Schools1
Partnership Schools Cohort 2
Cohort 1, Yr. 1 - L.A.'s Public School Choice Initiative4
School Closure in Michigan2
Cohort 2, Yr. 1 -Tennessee's Achievement School District3
*School Closure in Michigan2
*Cohort 2, Yr. 1 - Tennessee's iZone3
*Cohort 1, Yr. 1 - Tennessee's
iZone3
*Partnership Schools Cohort 1
Partnership Schools Cohort 2Cohort 1, Yr. 1 - Tennessee's
Achievement School District3Cohort 2, Yr. 1 - L.A.'s Public School Choice Initiative4Cohort 1, Yr. 1 - L.A.'s Public
School Choice Initiative4
Michigan's SIG Schools1
Medium
Large Large
Small Small
-.20
0-.05
.20
.05
Medium
Cohort 1, Yr. 1 - Tennessee's Achievement School District3
*Estimated effect was statistically significant
*Cohort 2, Yr. 1 - Tennessee's Achievement School District3
ELA MATH
NEGATIVENEGATIVE POSITIVEPOSITIVE
Notes: 1Rice, Bojorquez, Diaz, Wendt & Nakamoto (2014); 2Brummet (2014); 3Zimmer, Henry & Kho (2017); 4Strunk, Marsh, Hashim, Bush-Mecenas & Weinstein (2016).
Students in the second cohort of schools experienced no significant achievement gains in the first year of Partnership implementation in either math or ELA. While the overall outcomes were less positive for Cohort 2 than for Cohort 1, the Cohort 2 effects are comparable in size to similar turnaround interventions. Figure 1 places these results in the context of other turnaround interventions studied nationally.

Partnership Turnaround: Year Two Report Executive Summary | October 2020
iii
Partnership Did Not Significantly Affect On-Time High School Graduation, High School Drop-Out, or Grade Retention in Either CohortDetroit Public Schools Community District (DPSCD), the school district with the largest number of Partnership schools, fared better with continued dramatic decreases in high school drop-out rates beginning in the first year and continuing into the second year of implementation in Cohort 1 schools. Students in Cohort 1 DPSCD Partnership schools also saw a small decrease in grade retention in the first year of implementation, though this dip returned to pre-intervention levels the following year.
Human Capital Continued to be a Formidable Challenge, Though Leaders Were Optimistic That Their Efforts to Recruit and Retain Highly Effective Educators Were Beginning to Pay OffEducators in Partnership schools and districts reported that human capital was critical to successful turnaround. In particular, they highlighted the importance of high quality leaders and an effective and stable teaching staff. However, challenges related to low compensation and the stigma associated with the low-performing label impeded recruitment and retention efforts in Partnership schools and districts. Partnership districts implemented a variety of initiatives to mitigate challenges associated with recruiting and retaining educators in low-performing schools. Strategies included initiatives to make teacher compensation more competitive, “grow-your-own” programs to certify local teachers, implementing hiring practices to attract teachers who were viewed as “good fits” with the school context, improving culture and climate, and offering opportunities for professional development. Partnership leaders were increasingly optimistic that their efforts to stabilize the teacher work force would yield positive results, and teachers reported that they were more likely to remain in their schools.
Partnership Schools Focused on Several Areas of School Operations to Improve Student and School OutcomesPartnership school teachers were more likely than their non-Partnership school counterparts to report increasing focus on data use and increased principal effectiveness in making data-driven decisions. Similarly, Partnership leaders reported that Partnership schools and districts focused heavily on the use of data to guide improvement efforts. In addition, Partnership schools and districts focused on family and student engagement and implemented strategies to improve culture and climate.
The Partnership Model’s Strategic Planning Process Provided a Useful Framework for School ImprovementPartnership leaders said this planning process helped them to identify the most critical goals for improvement, use data to inform instruction and continuous improvement, and enhance communication within and outside of their districts.
EPIC | Education Policy Innovation Collaborative — Michigan State University
iv
Challenges Associated With the COVID-19 Pandemic Were Exacerbated in Partnership Districts The communities in which Partnership districts reside already face obstacles related to higher poverty and lower educational attainment than other communities in the state. In addition to implementing Partnership Agreements, Partnership districts were more likely than non-Partnership districts to have to address remote learning challenges related to technology, reliable internet access, and remote learning in general.
POLICY IMPLICATIONS
Patience is Warranted Early evidence suggests that the Partnership Model is helping schools implement systems for school improvement and Partnership schools and districts are improving in some student and teacher outcomes. School and district reform take time, and a growing literature suggests a need to continue supporting low-performing schools and districts over multiple years.
Improving Education in Partnership Districts is Central to Any Goal of Equalizing Educational Opportunities for Traditionally Underserved Students in MichiganPartnership districts are home to a disproportionate number of students who are economically disadvantaged, Black and Hispanic, and households in these districts have significantly lower incomes and educational attainment than those in non-Partnership districts.
Partnership Districts Continue to Need Assistance to Improve Their Supply of High Quality EducatorsHuman capital remained among the greatest impediments to school improvement efforts in Partnership schools and districts. Policymakers aiming to improve low-performing schools should bolster local initiatives to recruit and retain highly effective educators and develop the existing educator work force.
Additional Funding is Critical for Improvement EffortsWhile state funding for Partnership has supported turnaround efforts, many district leaders shared that the level of funding was not sufficient to finance the resources necessary to achieve turnaround. There is a strong evidence base that shows money matters in education—and in particular for underserved and under-resourced schools and districts like those in Partnership. Investing in these low-performing schools, even and especially in a time of particularly scarce resources, will be critical to advancing the turnaround process.
Partnership Turnaround: Year Two Report Executive Summary | October 2020
v
Partnership Turnaround: Year Two Report
SECTION ONE: INTRODUCTION
EPICEducation Policy Innovation Collaborative

EPIC | Education Policy Innovation Collaborative — Michigan State University
1
PURPOSE OF THIS REPORTIn the spring of 2018, the Education Policy Innovation Collaborative (EPIC) at Michigan State University began a four-year evaluation of the implementation and efficacy of Michigan’s Partnership Model of school and district turnaround. This evaluation includes analyses of student academic outcomes, surveys of teachers and principals in Partnership districts (in both Partnership and non-Partnership schools), interviews with Partnership district system leaders, and case studies of Partnership districts.
The purpose of this report is to provide an overview of Partnership Model implementation across the state, as well as an analysis of student academic and teacher work force outcomes, through the second full year of Partnership implementation. This report is the second of three intermediate reports that EPIC will release as the evaluation continues through the 2021-2022 academic year, followed by a final report scheduled tentatively for fall 2022.
MICHIGAN’S PARTNERSHIP MODEL OF SCHOOL AND DISTRICT TURNAROUNDIn this section, we outline the development of the Partnership Model through the summer of 2020 with a focus on developments related to the Partnership Model between the summer of 2019 and the summer of 2020.1
Section One: Introduction

Partnership Turnaround: Year Two Report Section One | October 2020
2
The Partnership Model emerged in spring 2017 under the leadership of then-State Superintendent Brian Whiston. Political developments in Michigan, along with the implementation of the federal Every Student Succeeds Act (ESSA), provided an opportunity for Superintendent Whiston to take a new tack in turning around the state’s lowest-performing schools. Superintendent Whiston’s vision was centered on an approach to turnaround that emphasized school districts working to increase their capacity to improve student outcomes via support from the Michigan Department of Education (MDE) as well as a constellation of stakeholders within the community the district served.
Under the Partnership Model, the state’s lowest-performing schools were labeled “Partnership schools” and their districts, which were charged with developing and leading improvement efforts in identified schools, were labeled “Partnership districts.” Partnership districts then worked with school and district leadership, a liaison from the Office of Partnership Districts (OPD) at MDE, and community stakeholders to develop a Partnership Agreement that analyzes the district’s strengths and weaknesses, identified improvement goals to be met over 18- and 36-month timeframes, outlined strategies and reforms to meet those goals, and prescribed consequences for failing to meet those goals. After local stakeholders and the MDE approved a Partnership district’s Partnership Agreement, the district then implemented the Agreement over the ensuing three academic years with support from its Intermediate School District (ISD) or Regional Educational Services Agency (RESA), identified partners in its community, and OPD.2
To date, the state has identified three rounds of Partnership schools — one each in the spring of 2017, the fall of 2017, and the spring of 2018. However, because the implementation and evaluation timelines for schools identified in rounds 2 and 3 are the same, we consider them together as Cohort 2, and label schools identified in round 1 as Cohort 1. In total, 123 schools across 36 districts have been identified for Partnership.
Approximately half of Michigan’s Partnership districts are public school academies (PSAs), though traditional public school (TPS) districts operate the majority of Partnership schools. A list of identified schools and their district for each round and cohort of Partnership can be found in Appendix A.
MICHIGAN’S PARTNERSHIP DISTRICTS: A SNAPSHOT OF ECONOMIC AND SOCIAL INEQUALITYIn our Year One Report, we described the contexts in which Michigan’s Partnership schools and districts were working. As we discussed in that report, stakeholders interviewed in the 2018-19 school year repeatedly surfaced concerns related to community poverty, transiency, economic instability, and violence and the ways these out-of-school factors impede students’ abilities to learn and educators’ abilities to teach. A look at community characteristics by Partnership district status in Table 1.1 tells the story.

EPIC | Education Policy Innovation Collaborative — Michigan State University
3
TABLE 1.1. Community and Descriptive Characteristics by Partnership District Status, 2013-2017
Community Characteristics Partnership Districts
Non-Partnership Districts Differences
RACE
White 40.4% 86.1% -45.7%***
Black 50.7% 6.7% 44.0%***
American Indian or Native Alaskan 0.4% 0.5% -0.1%+
Asian 1.8% 3.1% -1.4%**
Native Hawaiian or Pacific Islander 0.0% 0.0% 0.0%
Other Race 2.7% 0.9% 1.9%***
Two Plus Races 3.9% 2.6% 1.3%
Hispanic of Any Race 8.9% 4.1% 4.8%***
HOUSEHOLD TYPE
Children Living in Two-Parent Households 47.4% 77.4% -30.0%***
Children Living in One-Parent Households 52.6% 22.6% 30.0%***
Children Living with Male Head of Household 11.3% 6.7% 4.7%***
Children Living with Female Head of Household 41.3% 15.9% 25.4%***
EDUCATIONAL ATTAINMENT (ADULTS 25+)
Less than High School Degree 16.7% 8.5% 8.2%***
High School Diploma 25.1% 25.1% 0.0%
GED/Alternative High School Completion 5.7% 3.7% 2.1%***
Some College (less than Bachelor's degree) 33.5% 32.6% 0.8%
Bachelor's Degree 11.8% 18.1% -6.3%***
Greater than Bachelor's Degree 7.2% 11.9% -4.8%***
INCOME AND LABOR FORCE PARTICIPATION
Median Household Income $33,433.97 $60,471.90 -$27,037.93***
Median Household Income (Families) $40,692.97 $74,402.23 -$33,709.26***
Median Household Income (Non-Families) $24,227.67 $34,806.59 -$10,578.92***
Per Capita Income $19,017.95 $30,861.82 -$11,843.87***
Labor Force Participation (Ages 16+) 58.2% 61.9% -3.7%***
POVERTY RATE - BELOW POVERTY LINE
All Residents 32.0% 12.5% 19.5%***
Individuals in Family Households 30.2% 10.3% 19.9%***
Individuals in Married Family Households 16.0% 5.8% 10.2%***
Individuals in One-Parent Family Households 53.8% 25.5% 28.3%***
Individuals in Households – Male Head of Household 33.2% 17.9% 15.3%***
Individuals in Households – Female Head of Household 45.5% 26.9% 18.6%***
Individuals in Non-Family Households 37.3% 21.7% 15.6%***
Households with Children 26.3% 8.7% 17.6%***

Partnership Turnaround: Year Two Report Section One | October 2020
4
TABLE 1.1. (continued) Community and Descriptive Characteristics by Partnership District Status, 2013-2017
Community Characteristics Partnership Districts
Non-Partnership Districts Differences
HEALTH INSURANCE AND OTHER BENEFITS
Children Without Health Insurance 3.7% 2.3% 1.3%***
All Residents Without Health Insurance 10.7% 11.5% -0.9%***
Households Receiving Public Assistance 5.0% 2.3% 2.6%***
Households Receiving Food Stamps/SNAP 32.5% 11.5% 21.0%***
HOME VALUES/OWNERSHIP
Median Home Value $65,062.12 $149,148.70 -$84086.58***
Median Monthly Rent $777.95 $819.40 -$41.45***
Homes Occupied by Owner 58.2% 76.4% -18.2%***
TOTAL POPULATION 1,612,526 8,313,042
Districts with at Least One Urban School (2017-18) 69.4% 19.8% 49.6%***
Average District Enrollment (2017-18) 4,123 1,608 2,515***
Notes: + p<.10, * p<.05, ** p<.01, *** p<.001. American Community Survey data are weighted by community population.
Sources: Community characteristics come from American Community Survey data, 2013-17. District characteristics come from data from the Michigan Department of Education and the Center for Educational Performance and Information.
Table 1.1 sheds light on several patterns in Michigan Local Education Agencies (LEAs). Most Michigan school districts have very few residents of color – nearly nine of 10 residents who live in the average Michigan district are white. Partnership districts, however, reside in majority-minority communities, with more than half of residents either Black or Hispanic. Residents in Partnership districts are also considerably poorer than those in the rest of Michigan, with median income, income-per-capita, and home values far lower compared to those who live outside the communities Partnership districts serve. Families in Partnership districts also differ from those in non-Partnership districts. Fewer than half of children in Partnership districts live in homes with two parents present, and in Partnership districts, adults are nearly twice as likely to have dropped out of high school and are far less likely to complete college or graduate school. Families in Partnership districts are more than three times as likely to be receiving nutrition assistance through the federal Supplemental Nutrition Assistance Program (SNAP). The rates of violent crime in these cities are among the highest in the state (US Department of Justice, 2019).
In last year’s report, we provided a detailed description of the students enrolled in Partnership districts relative to non-Partnership districts. We showed that students enrolled in Partnership districts are majority Black or Hispanic and were classified as economically disadvantaged under the state’s designation. There are also high rates of students who were English Language Learners and who had disabilities. Students in Partnership districts scored far lower than their peers in non-Partnership districts on both math and ELA achievement tests. These patterns are accentuated for students in Partnership schools within Partnership districts, shown both in the Year One Report and in Table 2.3 in Section Two3 of this year's report.

EPIC | Education Policy Innovation Collaborative — Michigan State University
5
It is clear from these statistics that Partnership schools and districts were both the lowest performing educational entities in the state and serve the greatest proportions of students who were traditionally disadvantaged in the educational system. To accentuate this point, Table 1.2 provides the proportions of the state’s populations of Black, Hispanic, and economically disadvantaged students enrolled in Partnership districts and schools. It shows that Michigan’s students of color are concentrated in the state’s lowest-performing districts and schools. While 9.6% of Michigan’s K-12 students are enrolled in Partnership districts and 3.5% in Partnership schools, students of color are enrolled in Partnership districts and schools at far higher rates.
TABLE 1.2. Demographic Concentration of Students in Partnership Schools and Districts
2018-2019 School Year % of Michigan’s Student Body in Partnership Districts
% of Michigan’s Student Body in Partnership Schools
STATEWIDE 9.6% 3.5%
RACE
Black 33.1% 16.3%
American Indian or Alaska Native 3.9% 0.9%
Asian 4.7% 0.9%
Hispanic 18.2% 3%
Native Hawaiian or Pacific Islander 11.8% 4.2%
Two or More Races 10.1% 1.8%
White 2.4% 0.3%
Source: Data from the Michigan Department of Education (MDE) and the Center for Educational Performance and Information (CEPI).
As this table indicates, and we show in Figure 1.1, approximately one-third of Michigan’s Black students and more than 18% of Hispanic students were enrolled in Partnership districts in the 2018-2019 school year while over 16% of the state’s Black students attended a Partnership school. Comparatively, less than three percent of Michigan’s white students were enrolled in a Partnership district and 0.3% attended a Partnership school. In other words, Michigan’s Black students are 13.8 times more likely than white students to be enrolled in a Partnership district and over 54 times more likely than white students to attend a Partnership school. Similarly, Michigan’s Hispanic students are 4.9 times more likely than white students to be in a Partnership district and 10 times more likely to attend a Partnership school. To be clear, the far majority of Black and poor students are enrolled in the state’s lowest-performing districts, which themselves are clustered within the states’ most historically disadvantaged communities.
These statistics underscore that the Partnership Model of School and District Turnaround — as the first-order intervention intended to improve educational outcomes for students in identified schools and districts — is critically important to the state’s larger efforts to reduce inequality of opportunity for the most traditionally underserved students in Michigan. Partnership schools and districts are exactly those that need the greatest assistance and the most support to improve the outcomes of the students they serve.

Partnership Turnaround: Year Two Report Section One | October 2020
6
FIGURE 1.1. The Proportion of Students in Partnership Districts, by Race/Ethnicity
While roughly 10% of students statewide are in Partnership districts, 1/3 of Michigan's Black students and about 20% of Michigan’s Hispanic students are in these districts, and only 2% of the white students.
ALL STUDENTS BLACK STUDENTS HISPANIC STUDENTS WHITE STUDENTS
Students in Partnership Districts:A Breakdown by the Numbers
9.6%
1 IN 10STUDENTS
33.1%
3 IN 10STUDENTS
18.1%
2 IN 10STUDENTS
2.4%
1 IN 50STUDENTS
- OR -
Black Students Are... Hispanic Students Are...
4.9xtimes
more likely than white students to
be enrolled in a Partnership district
10xtimes
more likely than white students
to attend a Partnership school
What Does This Mean?
•vs• &13.8xtimes
more likely than white students to
be enrolled in a Partnership district
54xtimes
more likely than white students
to attend a Partnership school
&
- OR -- OR -- OR -
FOCUS OF THE SECOND ANNUAL REPORTIn this, EPIC’s second annual report on Michigan’s Partnership Model of School and District Turnaround, we combined longitudinal administrative data on students, teachers, and school leaders with evidence from surveys and interviews of educators in Partnership districts and

from case studies of three Partnership districts in their second or third year of the reform. We examined the third year of Partnership implementation for Cohort 1 Partnership schools, which were identified in the 2016-2017 school year, and the second year of implementation for Cohort 2 Partnership schools, which were identified in the 2017-2018 school year. We also explored the efficacy of the intervention in improving student and educator outcomes for the first two years of Partnership implementation in Cohort 1 schools and the first year of implementation for Cohort 2 schools.
Because in the 2019-20 school year both cohorts were already past the Partnership Agreement planning stage and well into implementation, we focused our implementation study this year on better understanding sustained enactment of the reform, as well as changes over time between the 2018-19 and 2019-20 school years. Because human capital challenges surfaced as a strong theme in Year One of our study, we focused more of our survey, interview, and case study data collection to better understand these human capital challenges in Partnership schools and districts, and strategies administrators were using to address them.
SUMMARYPartnership schools and districts are not only the lowest performing in the state, but also serve far greater proportions of poor and minority students than do other Michigan school districts. The Partnership Model was implemented to help turn around these districts and improve student outcomes. In this second year interim report, we shed light on the continued implementation of the Partnership Model and its early-stage outcomes.
SECTION ONE NOTES1. For a more thorough discussion of the inception and early implementation of the Partnership
Model, we refer readers to the Introduction of EPIC’s Year One Report, which can be found online at https://epicedpolicy.org/partnership-model/.
2. For additional information on how Partnership Schools and Districts are identified and on the development, implementation, and evaluation of Partnership Agreements, please see Section Three of the Year One Report.
3. Strunk, K., Cowen J., Torres, C., Burns, J., Waldron, S., & Auletto, A. (2019). Partnership Turnaround: Year One Report. Available at: https://epicedpolicy.org/partnership-model/. See Table 1.4 on page 9.

Partnership Turnaround: Year Two Report Section One | October 2020
8
Partnership Turnaround: Year Two Report
SECTION TWO: DATA & METHODS
EPICEducation Policy Innovation Collaborative

EPIC | Education Policy Innovation Collaborative — Michigan State University
9
INTRODUCTIONTo evaluate the implementation and efficacy of the Partnership Model, we used a mixed-methods triangulation design (Creswell & Clark, 2017) that included multiple types of data and methods of analyses. A triangulation design was well-suited to an evaluation of an intervention as complex as the Partnership Model because it allowed researchers to assess results through multiple sources of data and methodological strategies. By integrating analyses of varied sources of qualitative and quantitative data, we were able to paint a rich picture of how this reform has been implemented across Michigan’s Partnership schools and districts, and the effectiveness of the reform along multiple intended outcomes. We were able to ask not only whether the intervention improved relevant outcomes, but also how the intervention was implemented, and for whom, when, and where.
As shown in Table 2.1, we used seven main data sources in the second year of our evaluation of the Partnership Model:
• Student administrative data records,
• Educator administrative data records,
• Surveys of teachers working in Partnership schools and districts,
• Surveys of principals working in Partnership schools and districts,
• Interviews with Partnership district and charter leaders,
• Case studies of three Partnership districts, and
• Observations of three Partnership districts’ Reviews of Goal Attainment (RGA).
Section Two: Data and Methods

Partnership Turnaround: Year Two Report Section Two | October 2020
10
The analyses for this report focused on data from interviews conducted with district leaders and case studies collected in the 2019-20 school year (the third year of the reform) and educators’ responses to surveys administered in the fall of the 2019-20 school year, at times comparing responses to survey data collected in fall of the 2018-19 school year. Our analysis that relied on Michigan’s longitudinal datasets included student and educator administrative data records that tracked student and educator outcomes through the 2018-19 school year (Cohort 1’s second implementation year and Cohort 2’s first implementation year). While in total there have been 36 Partnership districts and 123 Partnership schools, several schools and districts exited the model, leaving 29 districts and 104 schools in the 2019-20 school year.1
The remainder of this section outlines each data source and the analytic methods used to examine the implementation and effects of the Partnership Model.
DESCRIPTION OF DATA AND METHODSWe asked five main research questions about the implementation and early outcomes of the Partnership Model, using various sources of data described in Table 2.1 to answer each question. Table 2.2 identifies the research questions and the data sources used to answer each one.
TABLE 2.1. Data SourcesData Outcomes of Interest Source Year(s) Sample Size (N) Subgroups
Student administrative records
Math and ELA MEAP/M-STEP scores (gr. 3-8) Math and ELA ACT/SAT scores Grade retention Attendance and chronic absenteeism Mobility High school graduation and dropout rates
Michigan Department of Education (MDE) and the Center for Educational Performance and Information (CEPI)
2013-14 through 2018-19
Full Panel: 9,014,665 student-year observationsEvent study analysis: 870,872 student-year observations
Cohort 1: Round 1 Partnership schools (treatment) and 2016 Priority schools that are not part of Cohort 2 (comparison) Cohort 2: Cohort 2 Partnership schools (treatment) and other schools that are in the 1st-10th percentile of the Michigan Index System (comparison)
Educator administrative records
Mobility and exit from professionLow effectiveness ratings
MDE and CEPI 2013-14 through Fall 2019
Full panel: 573,875 teacher-year observationsEvent study analysis: 49,840 teacher-year-observations Full panel: 52,447 principal/assistant principal-year observations
Cohort 1 and Cohort 2 treatment and comparison schools
Teacher surveys
Perceptions and experiences related to working conditions and school improvement
EPIC-developed survey
Fall 2018Fall 2019
Fall 2018: 2,718 participants (38% response rate)Fall 2019: 3224 participants (49% response rate)
Partnership schools and non-Partnership schools in Partnership districtsCohorts 1 and 2 Partnership schoolsTraditional public schools and charter schools
Principal surveys
Perceptions and experiences related to working conditions and school improvement
EPIC-developed survey
Fall 2018Fall 2019
Fall 2018: 81 participants(29% response rate)
Fall 2019: 88 participants (38% response rate)
Partnership schools and non-Partnership schools in Partnership districtsCohorts 1 and 2 Partnership schoolsTraditional public schools and charter schools

EPIC | Education Policy Innovation Collaborative — Michigan State University
11
TABLE 2.1. (continued) Data SourcesData Outcomes of Interest Source Year(s) Sample Size (N) Subgroups
District leadership interviews
Perceptions about implementation of Partnership
Interviews conducted by EPIC researchers
2018-2019 and 2019-2020 school years
2018-201922 interviews (76% response rate)By TPS vs. PSA:- 71% TPS response
rate (N=10)- 80% PSA response
rate (N=12)By Cohort:- 89% Round 1
(Cohort 1)- 43% Round 2
(Cohort 2)- 56% Round 3
(Cohort 2)2019-202022 interviews (76% response rate)By TPS vs. PSA: - 71% TPS response
rate (N=10)- 80% PSA response
rate (N=12)By Cohort: • 67% Cohort 1 • 80% Cohort 2
TPS/district superintendents or leaders coordinating Partnership work PSA/charter school superintendent, principals, or leaders coordinating Partnership work
Case studies Perceptions about implementation of Partnership
Interviews conducted by EPIC researchers
2019-2020
Three sites:28 total interviewsBlues (PSA) - 13 interviewsFlames (PSA) - 8 interviewsStars (TPS) - 7 interviews
Across all three case study sites:9 teachers: 2 Blues, 5 Flames, 2 Stars5 school leaders: 2 Blues, 2 Flames, 1 Stars7 district leaders: 4 Blues, 1 Flames, 2 Stars 2 instructional coaches: 1 Blues, 1 Stars2 PALS: 1 Blues, 1 Stars 3 Other administrative support: 3 Blues
RGA observations
Events during Partnership districts’ Review of Goal Attainment meetings.
Meetings observed by EPIC researchers.
2019-2020
3 RGA meetings were observed
Continuity of Learning (COL) Plans
Districts’ plans to continue student learning in Spring 2020 during the COVID-19 pandemic
Districts’ plans to continue student learning in Spring 2020 during the COVID-19 pandemic
Spring 2020
813 COL plans (100%)
RBG3 Survey items relevant to COVID response
K-8 teachers’ and principals’ perceptions of how they were engaging with students, the challenges they were facing, the resources and supports they were using, and their concerns about the impacts of COVID-19.
EPIC-developed survey
Spring 2020
Total: 8,881 K-8 educators from 752 (90%) Michigan school districts.Response rates: - 16% for teachers- 12% for principalsPartnership: 938 K-8 educators from 27 (93%) Michigan Partnership districts.Response rates: - 19% for teachers- 12% for principals

Partnership Turnaround: Year Two Report Section Two | October 2020
12
TABLE 2.2. Research Questions With Corresponding Data Sources
Research Question Report Section
Source
How has the Partnership Model changed over time?
3 • Case studies of three Partnership districts
• Interviews with Partnership district leaders
How has Partnership changed education in Partnership schools and districts?
4 • Student administrative records
• Surveys of teachers working in Partnership schools and districts
• Surveys of principals working in Partnership schools and districts
• Case studies of three Partnership districts
• Interviews with Partnership district leaders
How are educators and leaders in Partnership schools and districts implementing the reform as it matures?
4 • Surveys of teachers working in Partnership schools and districts
• Surveys of principals working in Partnership schools and districts
• Case studies of three Partnership districts
• Interviews with Partnership district leaders
What human capital challenges face Partnership schools and districts and how are educators in these districts addressing them?
5 • Educator administrative records
• Surveys of teachers working in Partnership schools and districts
• Surveys of principals working in Partnership schools and districts
• Case studies of three Partnership districts
• Interviews with Partnership district leaders
What conditions (other than human capital) mediate Partnership turnaround efforts?
6 • Surveys of teachers working in Partnership schools and districts
• Case studies of three Partnership districts
• Interviews with Partnership district leaders
STATE ADMINISTRATIVE RECORDS ON STUDENTS AND TEACHERS
Data Sources To identify the impact of the Partnership Model on student and teacher outcomes, researchers used administrative data records on Michigan K-12 students and public school teachers provided by the Michigan Department of Education (MDE) and the Center for Educational Performance and Information (CEPI) for the school years 2013-14 through the fall of 2019. We defined public school teachers as those individuals whose primary position is as a teacher.2 Both student and teacher datasets included general demographic information, such as race, ethnicity, gender, and school placement. Student data also included state standardized test scores, SAT scores, and information related to special education status, English Language Learner status, socioeconomic status, attendance, grade retention, and high school graduation/dropout status when applicable. Teacher data include credential information, educational attainment, years of experience, final evaluation score, and assignment descriptions.

EPIC | Education Policy Innovation Collaborative — Michigan State University
13
The report focuses specifically on teachers and students observed in Cohort 1 Partnership or non-Partnership 2016 Priority schools separately from those observed in Cohort 2 Partnership with non-Partnership schools below the tenth percentile on the Michigan School Index System list. We considered individuals in Cohort 1 Partnership schools as the first group “treated” by the intervention (Round 1 Partnership schools), and those in 2016 Priority schools that never entered Partnership in later Rounds as the comparison group of individuals in very similar schools that were not part of the Partnership intervention. We chose this comparison group because Cohort 1 Partnership schools were drawn from Priority schools, and so Priority schools that were not selected for Partnership represented the closest comparison based on academic outcomes. Collectively, data used for analyses of Cohort 1 included approximately 329,905 student-year observations (65,969 unique students) and 30,930 teacher-year observations (7,920 unique teachers). We considered individuals in Cohort 2 Partnership schools as the second group “treated” by the intervention (folding in Rounds 2 and 3 together given their timelines for identification and implementation). All individuals in schools below the tenth percentile on the Michigan School Index System list that had not been selected for Partnership served as the comparison group for Cohort 2. We selected this Cohort 2 comparison group because the Index System was the consequential accountability metric in the year that Cohort 2 Partnership schools were identified. In the 2017-2018 school year, the bottom five percent of schools on the Index System were identified as Comprehensive Support and Improvement (CSI) under the Every Student Succeeds Act (ESSA) and then automatically identified for Partnership. Thus, the schools selected for the comparison group for Cohort 2 are the next lowest-performing schools in the state. Cohort 2 data included approximately 633,888 student-year observations (165,354 unique students) and 33,700 teacher-year observations (9,082 unique teachers). For purposes of interpretation, these panels of data can be considered the full population of students and teachers in Partnership and comparison schools.
Student DataWe identified the effects of Partnership on several student outcomes. Of primary interest was student performance on state standardized tests in mathematics and English language arts (ELA). We considered student achievement scores on standardized math and ELA assessments given to all third through eighth and 11th grade students each year. There have been multiple changes to the state assessment program between the 2013-14 and 2018-19 school years; to address this, we standardized scores within grade, year, and subject.3 Michigan districts administered all these tests annually for accountability purposes. In the case of third through eighth grade performance, which was analyzed at the individual student level, we considered both achievement and growth outcomes, referred to in our results as levels and gains models.4 Our discussion of these results in Section Four focuses on student growth as this best captures year-over-year changes in students’ relative achievement. Since students take the SAT only once in grade 11 for accountability purposes, we did not consider growth for this test. We standardized these testing outcomes by subject, grade, and year.
In addition to examining the effects of Partnership on academic performance, we also estimated its effects on grade retention, student mobility, four-year (on-time) high school graduation rates,5 and high school drop-out rates. We inferred grade retention when a student appeared in the same grade level for two consecutive years. We generated mobility indicators to reflect changes in

Partnership Turnaround: Year Two Report Section Two | October 2020
14
placement from year to year that could not be attributed to being enrolled in the terminal grade offered6 in a school or graduating from high school. High school graduation and drop-out indicators were calculated based on the exit status of a student at the end of their expected graduation year. We were unable to estimate the effect of Partnership on daily attendance or absenteeism because our approach required multiple years of comparable data on each outcome over time, but in the year Partnership began, the Michigan Department of Education (MDE) adopted a new definition of absences, which in turn affected measures of chronic absenteeism. In all analyses using student data, we included grade level, socio-economic status, English Language Learner status, and status as a student with a disability to adjust our estimates of the Partnership effect by each of these categories. We also controlled for school-level demographics of the student body, including race/ethnicity, economic disadvantage, English Language Learner status, special education status, and student enrollment.
Teacher DataOur primary outcomes of interest for teachers were recruitment and retention. Specifically, we considered whether a teacher transferred within district, transferred out of district, or was no longer employed as a Michigan public school teacher. We also considered whether a teacher was new to a particular school or district, where “new” was defined as not observed in that particular school or district the prior year. To determine whether the Partnership reform has differential effects on these teacher mobility indicators based on experience or education level, we examined mobility outcomes for the following subsets of teachers: first-year teachers; teachers with one to five years of experience, six to ten years of experience, 11 to 15 years of experience, or 16 or more years of experience; teachers with less than Master’s degree or with a Master’s degree or higher. In addition to mobility, we also considered teachers’ evaluation ratings. Specifically, we generated an indicator for whether a teacher received a low effectiveness rating on their state-required annual evaluation, defined as being rated either “ineffective” or “minimally effective” (as opposed to the other potential ratings of “effective” or “highly effective”). We also adjusted all teacher-level models for school composition (student race/ethnicity, economic disadvantage, English Learner status, special education status, and enrollment) and teacher gender, race/ethnicity, experience, and educational attainment.
Research DesignEvent study models. To calculate the effect of Michigan’s Partnership reform on a variety of student and teacher outcomes, we used a statistical technique known as event study modeling. Intuitively, this approach allows for the comparison over time of a treatment group — in this case, students, teachers, and schools under Partnership — with a comparison group that ideally shares many of the same characteristics. The use of comparison groups whose outcomes are observed before and after treatment — regardless, in this case, of whether groups did or did not actually undergo Partnership — allowed us to attribute post-Partnership differences to the Partnership reform itself.
In early 2017, Cohort 1 Partnership schools were identified as a subset of particularly low-performing 2016 Priority schools (schools identified with academic achievement levels in the bottom five percent of the state). As such, 2016 Priority schools are an appropriate comparison

EPIC | Education Policy Innovation Collaborative — Michigan State University
15
group to identify the effects of the Partnership reform. This comparison group continued with “business-as-usual” while Cohort 1 Partnership schools underwent their first year of intervention in 2017-18. Similarly, Cohort 2 Partnership schools were identified in the 2017-18 school year across two rounds: one in the fall of 2017 and one in the spring of 2018. These two rounds are grouped together as Cohort 2 because they share a common implementation and evaluation timeline. Round 2 Partnership schools were selected based on their Priority status in 2016 and how their academic performance changed from that time to 2017. Round 3 Partnership schools were selected because they were identified as a Comprehensive Support and Improvement school in 2017-18, meaning that they were in the bottom five percent of schools statewide based on their performance as measured by Michigan’s School Index System. Given this, we used non-Partnership schools below the 10th percentile on the School Index System list as the comparison group for Cohort 2 Partnership schools. As in Cohort 1, schools in the Cohort 2 comparison group continued as before, without the Partnership intervention, while Cohort 2 schools began “treatment” under the Partnership Model in the 2018-19 school year. Because the comparison sets of schools that were not selected for the Partnership reform were otherwise quite similar to Partnership schools in terms of academic achievement and other observable characteristics (see Table 2.3) — and because the event study models consider Partnership and comparison schools over time — the event studies should be able to isolate and causally attribute any changes in student or teacher outcomes in Partnership schools to the Partnership reform.
TABLE 2.3. Descriptive Statistics for Students in Cohort 1, Cohort 2, Their Comparison Groups, and the Remainder of the State
Cohort 1 Partnership
Schools
Cohort 1 Comparison
Cohort 2 Partnership
Schools
Cohort 2 Comparison
Never Partnership
School in Partnership
Districts
Non-Partnership
Districts
N 16,441 36,321 35,147 54,008 88,959 1,331,556
Standardized Math 3-8 M-STEP -1.104 -0.702 -1.015 -0.806 -0.545 0.075
Standardized ELA 3-8 M-STEP -1.024 -0.641 -0.955 -0.743 -0.498 0.070
Standardized Math SAT -0.103 -0.052 -0.070 -0.080 -0.056 0.006
Standardized ELA SAT -0.100 -0.049 -0.066 -0.077 -0.046 0.005
Daily Attendance Rate 80.6% 87.4% 83.5% 86.3% 89.1% 93.6%
Chronically Absent 66.2% 40.9% 58.3% 45.0% 36.3% 16.3%
White 2.8% 17.8% 7.8% 17.4% 22.1% 70.9%
Black 89.0% 63.5% 80.8% 67.6% 49.2% 13.2%
Hispanic 5.7% 13.6% 7.6% 10.8% 20.4% 7.3%
Other Non-White 2.4% 5.0% 3.8% 4.2% 8.3% 8.6%
Economically Disadvantaged 90.2% 86.3% 91.4% 88.4% 78.8% 49.5%
English Learners 3.5% 11.4% 7.1% 11.8% 15.8% 6.5%
Special Education 18.9% 16.3% 17.9% 14.5% 14.7% 13.5%
Source: Data from the Michigan Department of Education (MDE) and the Center for Educational Performance and Information (CEPI).

Partnership Turnaround: Year Two Report Section Two | October 2020
16
Our event study models of student outcomes used a time-invariant treatment status in which students remained in either the treated or comparison group, based on the school they attended in the year of Partnership identification, throughout the years we examined. For example, a student might attend a non-Partnership, non-Priority school in 2015-16, transfer to a Cohort 1 Partnership school in 2016-17, and then transfer to a Priority school in 2017-18. In this instance, because the student attended a school that was identified for Partnership in the identification year (2016-17), the student would be included in the treated group. This approach resembles that of an “intent-to-treat” analysis in a randomized control trial. A limitation to this approach is that it may underestimate the effects of the reform if students who transferred into Partnership schools after the first year of Partnership benefited from the model or students who transferred out lose ground in non-Partnership schools. However, we consider it the more conservative approach to estimating the effects of the reform itself because these estimates would not be confounded by factors such as higher performing students transferring into Partnership schools as a result of the intervention.
As a first step in implementing this design, we created a series of lead and lag Partnership “treatment” indicators in the data beginning in 2013-14 and extending through 2018-19, where, for Cohort 1 schools, 2016-17 is their identification year, 2017-18 is the first year of Partnership Model implementation, 2018-19 is the second year of implementation, and 2013-14 through 2015-16 are pre-treatment years. For Cohort 2 schools, 2017-18 is their identification year, 2018-19 is the first year of implementation and 2013-14 through 2016-17 are pre-treatment years. In our student-level models, we defined treatment and comparison groups based on the schools students attended in the relevant identification year, the 2016-17 school year for Cohort 1 and the 2017-18 school year for Cohort 2. Students who were attending a Cohort 1 Partnership school in 2016-17 were designated as “treated” while students who were attending an untreated 2016 Priority school that was not later selected for Partnership treatment were designated as “comparison” in analyses of Cohort 1 outcomes. Students attending a Cohort 2 Partnership school in 2017-18 are labeled as “treated” and students attending an untreated school in the lowest 10% of the state School Index System list serve as the comparison group.7
We estimated some student outcomes at the school level. SAT scores, four-year on-time high school graduation, and high school drop-out status are one-time occurrences and therefore we cannot observe these measures for individual students over time. Instead, for these outcomes, we aggregated to the school-level for each observed cohort of students. In these models, the treatment status of individual students is time-variant and based on the school students attended in the year in which the outcomes of interest occurred. Similarly, we assigned time-variant treatment status to teachers in our models. A teacher’s treatment status can vary over time, based on whether they were working in a Partnership school, a comparison school, or neither. These modeling decisions had implications for how our results were interpreted. Models that use time-variant identification can be interpreted as estimating the effect of Partnership on outcomes for the teachers (students) who worked in (attended) Partnership schools in that year. In other words, these results show the impact of Partnership on those who directly experienced Partnership-related reforms. Models that use time-invariant identification, on the other hand, can be interpreted as estimating the effect of Partnership on outcomes for the students who attended Partnership schools when those schools were identified for Partnership, regardless of whether they remained in that Partnership school in future years. By examining outcomes for the same groups of students over time, these results show the impact of Partnership in the aggregate, which is important for understanding the overall changes that the Partnership Model may induce.

EPIC | Education Policy Innovation Collaborative — Michigan State University
17
In an event study, a reference year is used as a baseline for the difference in outcomes between the treatment and comparison groups which then allowed us to interpret the change in the effect of Partnership relative to another timepoint. Here we omitted the school year prior to each cohort’s identification as a Partnership school, which allowed us to estimate the effect of Partnership relative to the year immediately before designation as a Partnership school. In our main models for Cohort 1, 2015-16 is the omitted reference year because it is the last pre-Partnership year, with the first round of schools identified in the spring of the 2016-17 academic year. For Cohort 2, 2016-17 is the omitted reference year as this cohort of schools were identified in 2017-18. We show how we identified these years for both Cohorts 1 and 2 in Figure 2.2.
FIGURE 2.2. Cohort Year Identification
TIMELINE
Cohort Identification Year2013-14 to 2018-19
2017-2018: Partnership identification year
2017-2018: Partnership implementation YEAR ONE
2013-2014: Pre-Partnership year
2013-2014: Pre-Partnership year
COHORT 2
2014-2015: Pre-Partnership year 2014-2015:
Pre-Partnership year
2015-2016: Pre-Partnership year – Omitted reference year
2015-2016: Pre-Partnership year
2016-2017: Pre-Partnership year – Omitted reference year
2016-2017: Partnership identification year
2018-2019: Partnership implementation YEAR ONE
2018-2019: Partnership implementation YEAR TWO
COHORT 1
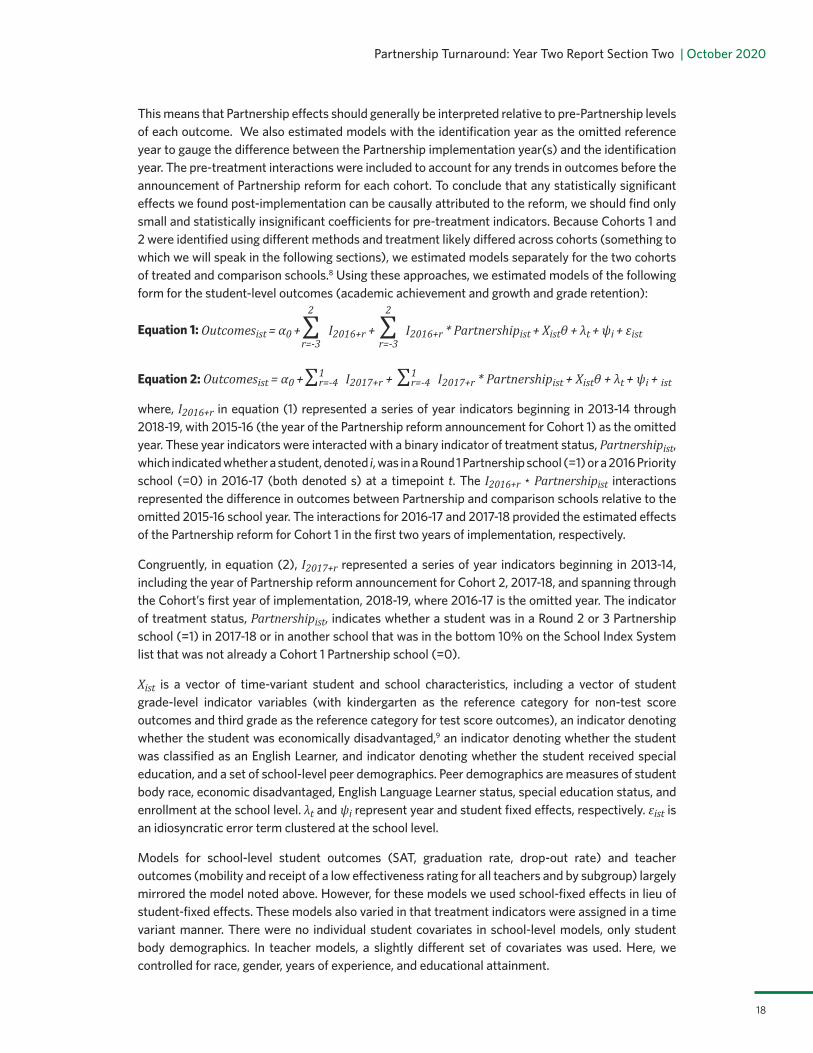
Partnership Turnaround: Year Two Report Section Two | October 2020
18
This means that Partnership effects should generally be interpreted relative to pre-Partnership levels of each outcome. We also estimated models with the identification year as the omitted reference year to gauge the difference between the Partnership implementation year(s) and the identification year. The pre-treatment interactions were included to account for any trends in outcomes before the announcement of Partnership reform for each cohort. To conclude that any statistically significant effects we found post-implementation can be causally attributed to the reform, we should find only small and statistically insignificant coefficients for pre-treatment indicators. Because Cohorts 1 and 2 were identified using different methods and treatment likely differed across cohorts (something to which we will speak in the following sections), we estimated models separately for the two cohorts of treated and comparison schools.8 Using these approaches, we estimated models of the following form for the student-level outcomes (academic achievement and growth and grade retention):
Equation 1: Outcomesist = α0 +∑ I2016+r + ∑ I2016+r * Partnershipist + Xistθ + λt + ψi + εistr=-3
2
r=-3
2
Equation 2: Outcomesist = α0 +∑ I2017+r + ∑ I2017+r * Partnershipist + Xistθ + λt + ψi + istr=-41
r=-41
where, I2016+r in equation (1) represented a series of year indicators beginning in 2013-14 through 2018-19, with 2015-16 (the year of the Partnership reform announcement for Cohort 1) as the omitted year. These year indicators were interacted with a binary indicator of treatment status, Partnershipist, which indicated whether a student, denoted i, was in a Round 1 Partnership school (=1) or a 2016 Priority school (=0) in 2016-17 (both denoted s) at a timepoint t. The I2016+r * Partnershipist interactions represented the difference in outcomes between Partnership and comparison schools relative to the omitted 2015-16 school year. The interactions for 2016-17 and 2017-18 provided the estimated effects of the Partnership reform for Cohort 1 in the first two years of implementation, respectively.
Congruently, in equation (2), I2017+r represented a series of year indicators beginning in 2013-14, including the year of Partnership reform announcement for Cohort 2, 2017-18, and spanning through the Cohort’s first year of implementation, 2018-19, where 2016-17 is the omitted year. The indicator of treatment status, Partnershipist, indicates whether a student was in a Round 2 or 3 Partnership school (=1) in 2017-18 or in another school that was in the bottom 10% on the School Index System list that was not already a Cohort 1 Partnership school (=0).
Xist is a vector of time-variant student and school characteristics, including a vector of student grade-level indicator variables (with kindergarten as the reference category for non-test score outcomes and third grade as the reference category for test score outcomes), an indicator denoting whether the student was economically disadvantaged,9 an indicator denoting whether the student was classified as an English Learner, and indicator denoting whether the student received special education, and a set of school-level peer demographics. Peer demographics are measures of student body race, economic disadvantaged, English Language Learner status, special education status, and enrollment at the school level. λt and ψi represent year and student fixed effects, respectively. εist is an idiosyncratic error term clustered at the school level.
Models for school-level student outcomes (SAT, graduation rate, drop-out rate) and teacher outcomes (mobility and receipt of a low effectiveness rating for all teachers and by subgroup) largely mirrored the model noted above. However, for these models we used school-fixed effects in lieu of student-fixed effects. These models also varied in that treatment indicators were assigned in a time variant manner. There were no individual student covariates in school-level models, only student body demographics. In teacher models, a slightly different set of covariates was used. Here, we controlled for race, gender, years of experience, and educational attainment.

EPIC | Education Policy Innovation Collaborative — Michigan State University
19
Finally, we conducted sub-analyses where we limited our sample in various ways. We considered models that focused on, or excluded, Detroit Public Schools Community District (DPSCD) — a particularly large district that accounts for a substantial proportion of those treated with the Partnership reform. More details on these sub-analyses appear in this report’s appendices.
Survey administration. A key component of the Education Policy Innovation Collaborative’s (EPIC) multi-year study of the Partnership Model is an annual survey of teachers and principals in Michigan’s Partnership districts. Currently, we have conducted two waves of educator surveys: the first in the fall of 2018 and the second in the fall of 2019. In each of these two waves (as well as in future years), the aim is to survey all teachers and principals in Partnership districts about their experiences, perspectives, and opinions on what is happening in their schools and districts. Being that an aim of the Partnership Model is for districts to direct their efforts and resources toward their lowest performing schools (that is, their Partnership schools), it is important to survey those who work in identified Partnership schools as well as those who do not. This approach allows us to gain insight into the different experiences educators have in Partnership and non-Partnership schools both within a given year and over time.
To conduct the educator survey, EPIC researchers worked with the Michigan Department of Education and with the leadership of Partnership districts to identify the population of teachers and principals in Partnership districts and to obtain the contact information for them that was used to administer the survey. The survey was then administered between late October and early January in both waves. In the first wave of the survey, educators had the option to complete the survey electronically or in paper-and-pencil format, though the overwhelming majority opted to participate electronically. The second wave of the survey was administered exclusively in an electronic format.10 In both years, teachers and principals in Cohorts 1 and 2 Partnership districts received the surveys. As shown in Table 2.4, nearly 2,800 educators responded to the survey in wave one (overall response rate 37.9%) and over 3,200 responded in wave two (overall response rate 48.5%). The population of educators in Partnership districts decreased between waves one and two because several Partnership districts closed or were released from Partnership status over the summer of 2019.11 Table 2.4 breaks down response rates by Cohort of Partnership identification.
TABLE 2.4. Number of Educators Invited to Participate in Partnership Surveys and Response Rates
Overall TPS PSA
PRINCIPAL TEACHER PRINCIPAL TEACHER PRINCIPAL TEACHER
Wave 1 (2018-19)
Partnership School
99(28.3%)
2641(42.3%)
87(21.8%)
2381(41.7%)
12(75%)
260(47.3%)
Non-Partnership School
184(28.8%)
4462(35.9%)
177(27.7%)
4411(35.9%)
7(57.1%)
51(33.3%)
TOTAL WAVE 1 283(28.6%)
7103(38.3%)
264(25.8%)
6792(38%)
19(68.4%)
311(45%)
Wave 2 (2019-20)
Partnership School
85(50.6%)
2424(57.1%)
80(47.9%)
2198(57.5%)
5(100%)
226(53.3%)
Non-Partnership School
166(31.4%)
4459(44.8%)
155(29.5%)
4388(44.8%)
11(60%)
71(50%)
TOTAL WAVE 2 251(37.8%)
6883(49.2%)
235(35.6%)
6586(49%)
16(71.4%)
297(53.4%)
Note: When calculating response rates, educators who opted out of participation were not included in either the numerator or denominator.
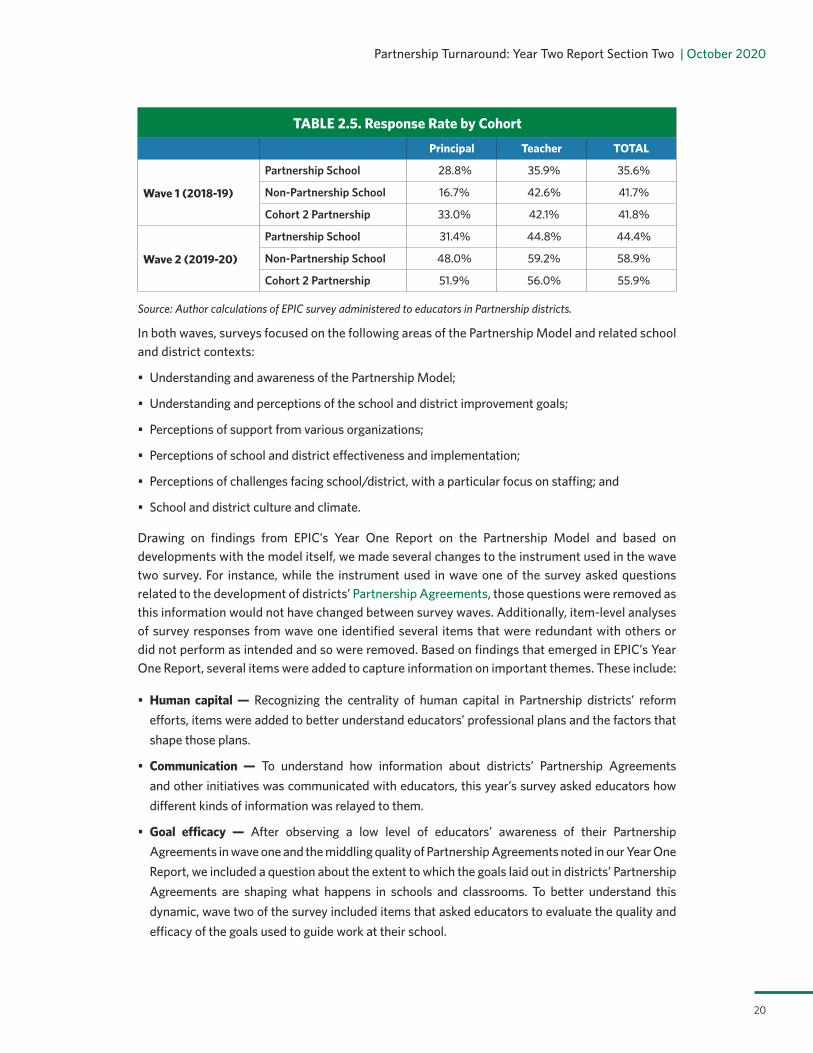
Partnership Turnaround: Year Two Report Section Two | October 2020
20
TABLE 2.5. Response Rate by Cohort
Principal Teacher TOTAL
Wave 1 (2018-19)
Partnership School 28.8% 35.9% 35.6%
Non-Partnership School 16.7% 42.6% 41.7%
Cohort 2 Partnership 33.0% 42.1% 41.8%
Wave 2 (2019-20)
Partnership School 31.4% 44.8% 44.4%
Non-Partnership School 48.0% 59.2% 58.9%
Cohort 2 Partnership 51.9% 56.0% 55.9%
Source: Author calculations of EPIC survey administered to educators in Partnership districts.
In both waves, surveys focused on the following areas of the Partnership Model and related school and district contexts:
• Understanding and awareness of the Partnership Model;
• Understanding and perceptions of the school and district improvement goals;
• Perceptions of support from various organizations;
• Perceptions of school and district effectiveness and implementation;
• Perceptions of challenges facing school/district, with a particular focus on staffing; and
• School and district culture and climate.
Drawing on findings from EPIC’s Year One Report on the Partnership Model and based on developments with the model itself, we made several changes to the instrument used in the wave two survey. For instance, while the instrument used in wave one of the survey asked questions related to the development of districts’ Partnership Agreements, those questions were removed as this information would not have changed between survey waves. Additionally, item-level analyses of survey responses from wave one identified several items that were redundant with others or did not perform as intended and so were removed. Based on findings that emerged in EPIC’s Year One Report, several items were added to capture information on important themes. These include:
• Human capital — Recognizing the centrality of human capital in Partnership districts’ reform efforts, items were added to better understand educators’ professional plans and the factors that shape those plans.
• Communication — To understand how information about districts’ Partnership Agreements and other initiatives was communicated with educators, this year’s survey asked educators how different kinds of information was relayed to them.
• Goal efficacy — After observing a low level of educators’ awareness of their Partnership Agreements in wave one and the middling quality of Partnership Agreements noted in our Year One Report, we included a question about the extent to which the goals laid out in districts’ Partnership Agreements are shaping what happens in schools and classrooms. To better understand this dynamic, wave two of the survey included items that asked educators to evaluate the quality and efficacy of the goals used to guide work at their school.

EPIC | Education Policy Innovation Collaborative — Michigan State University
21
The last way in which the survey instrument was revised between waves one and two is that the teacher and principal versions of the instrument were made more uniform. To reduce response burden in wave one, some items were asked only to either teachers or principals. Given the items that were eliminated in the wave two instrument, we were able to more consistently use the same items in both the teacher and principal versions of the instrument without increasing response burden, which enabled additional comparisons between teachers and principals.
Survey analysis. In this report, we performed descriptive analyses that compared the average responses of different groups of educators and how responses changed over time within groups. Given the response rates noted above and to make our survey findings generalizable to the broader population of educators in Partnership districts, we used inverse probability weights in all calculations to report findings that were representative of the full population of teachers and principals in Partnership districts.12
Between-group analyses focused on the differences between:
• Teachers in Partnership schools relative to teachers in non-Partnership schools in Partnership districts;
• Principals in Partnership schools relative to principals in non-Partnership schools in Partnership districts;
• Teachers in Partnership schools relative to principals in Partnership schools;
• Teachers in non-Partnership schools in Partnership districts relative to principals in non-Partnership schools in Partnership districts;
• Partnership school teachers and principals in traditional public school districts relative to their counterparts in public school academies (PSAs); and
• Teachers and principals in Cohort 1 Partnership schools relative to their counterparts in Cohort 2 Partnership schools.
The majority of our findings focused on the first four of these comparisons to examine how teachers and principals in Partnership schools differed in their understanding and implementation of their Partnership Agreement compared with other teachers and principals in their districts. It is important to note that the comparison groups used are not the same comparison groups that are used in our analyses of administrative data, which compared educators in Partnership schools against those in similarly low-performing schools that may or may not be in Partnership districts. This difference was because the goal of our survey analyses was to better understand how the context may have differed between identified Partnership schools and non-Partnership schools within Partnership districts and how districts are implementing change and reform differently between these sets of schools. In future reports, we will conduct analyses that draw on merged survey and administrative data to examine how differences in Partnership implementation may help to mediate or explain differences in how Partnership affects students and teachers.
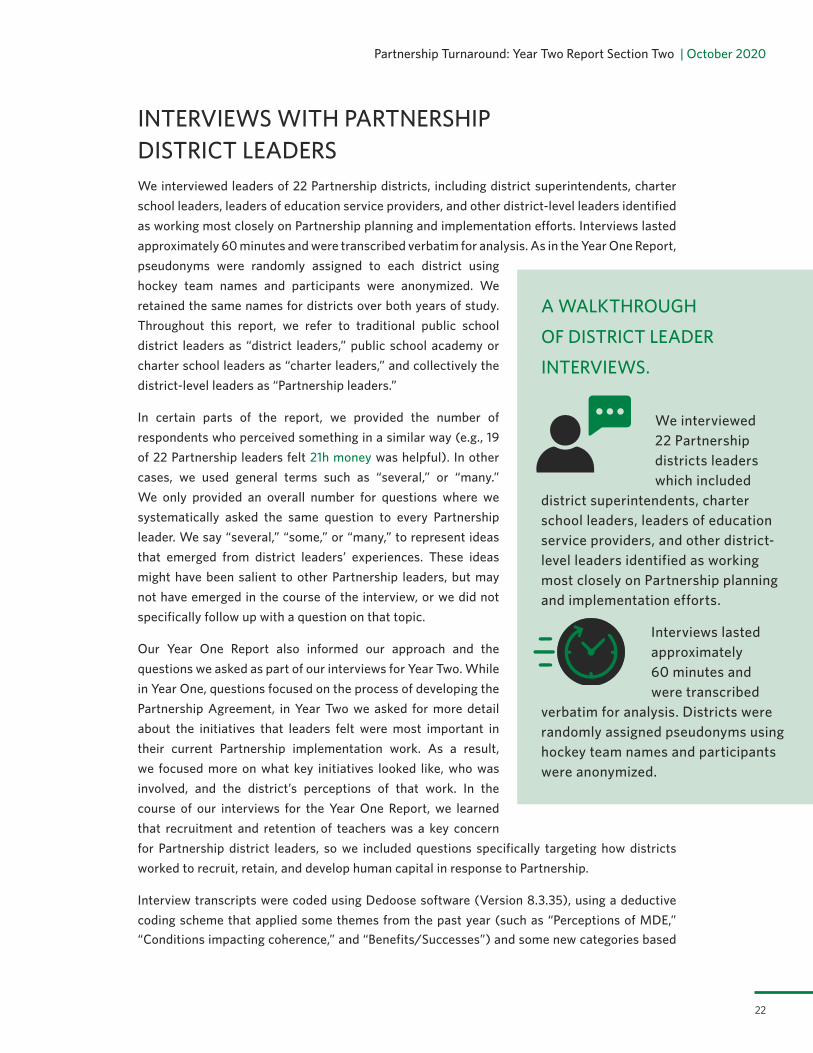
Partnership Turnaround: Year Two Report Section Two | October 2020
22
INTERVIEWS WITH PARTNERSHIP DISTRICT LEADERSWe interviewed leaders of 22 Partnership districts, including district superintendents, charter school leaders, leaders of education service providers, and other district-level leaders identified as working most closely on Partnership planning and implementation efforts. Interviews lasted approximately 60 minutes and were transcribed verbatim for analysis. As in the Year One Report, pseudonyms were randomly assigned to each district using hockey team names and participants were anonymized. We retained the same names for districts over both years of study. Throughout this report, we refer to traditional public school district leaders as “district leaders,” public school academy or charter school leaders as “charter leaders,” and collectively the district-level leaders as “Partnership leaders.”
In certain parts of the report, we provided the number of respondents who perceived something in a similar way (e.g., 19 of 22 Partnership leaders felt 21h money was helpful). In other cases, we used general terms such as “several,” or “many.” We only provided an overall number for questions where we systematically asked the same question to every Partnership leader. We say “several,” “some,” or “many,” to represent ideas that emerged from district leaders’ experiences. These ideas might have been salient to other Partnership leaders, but may not have emerged in the course of the interview, or we did not specifically follow up with a question on that topic.
Our Year One Report also informed our approach and the questions we asked as part of our interviews for Year Two. While in Year One, questions focused on the process of developing the Partnership Agreement, in Year Two we asked for more detail about the initiatives that leaders felt were most important in their current Partnership implementation work. As a result, we focused more on what key initiatives looked like, who was involved, and the district’s perceptions of that work. In the course of our interviews for the Year One Report, we learned that recruitment and retention of teachers was a key concern for Partnership district leaders, so we included questions specifically targeting how districts worked to recruit, retain, and develop human capital in response to Partnership.
Interview transcripts were coded using Dedoose software (Version 8.3.35), using a deductive coding scheme that applied some themes from the past year (such as “Perceptions of MDE,” “Conditions impacting coherence,” and “Benefits/Successes”) and some new categories based
A WALKTHROUGH
OF DISTRICT LEADER
INTERVIEWS.
We interviewed 22 Partnership districts leaders which included
district superintendents, charter school leaders, leaders of education service providers, and other district-level leaders identified as working most closely on Partnership planning and implementation efforts.
Interviews lasted approximately 60 minutes and were transcribed
verbatim for analysis. Districts were randomly assigned pseudonyms using hockey team names and participants were anonymized.

EPIC | Education Policy Innovation Collaborative — Michigan State University
23
on the interview protocols, including a typology of initiatives. For example, “Curriculum/Instruction initiatives” included new programs or approaches to curriculum, pedagogy, or interventions, “whole-child initiatives” included new efforts related to social-emotional learning, physical health and well-being, and working with students who have experienced trauma, and “Human capital initiatives” included recruitment and retention efforts. Key themes were identified, such as the use of data in districts’ approaches to Partnership work, and quotes from each interview related to those themes were included in Excel spreadsheets to help understand the scope and variation within those identified themes.
CASE STUDIESAs in our Year One Report analysis, we employed a multiple case study design of three districts to understand some of the variation in how districts were implementing their Partnership Agreements. Because we were looking to understand how districts were implementing initiatives on the ground, we purposefully selected three districts in which the district leaders indicated during their interviews that they had a number of promising initiatives, and then conducted additional interviews to gain multiple perspectives of that implementation work. Those additional interviews included district and school leaders, teachers, instructional coaches, ISD partners, and MDE liaisons. The three districts selected represented a variety of sizes (a district with one school, a small multi-school district, and a large district) and governance structures. Stars is a traditional public school (TPS) district and Blues and Flames are both public school academies (PSAs), or charter, districts. This variation is intentional, as we hoped to capture and compare differences in implementation. For instance, we noted in the Year One Report that charter schools and organizational size seemed important in terms of how Partnership was enacted and perceived.13
Notably, these case schools/districts were generally positive about the Partnership reform and their Partnership efforts, and were on track to meet their goals. Thus, our cases do not reflect the experiences of districts and leaders who were struggling or may feel more negatively about the reform. With that said, we found that the majority of Partnership leaders we interviewed felt moderately positive about the Partnership reform and their efforts to meet Partnership goals, so our cases may provide a reasonable representation of some relatively common experiences in Partnership districts/schools.
Case study interviews were typically 30 minutes (teacher interviews) to 60 minutes (all others) and used a semi-structured interview format to focus on specific initiatives the district had in place to meet Partnership goals. We anonymized interviews by using both district pseudonyms and labeling the participants’ roles as broad categories (e.g., instructional coach). We used a similar approach to analyze case study data as we did with the superintendent interviews. We holistically analyzed interview transcripts for themes within and across case studies, with the cases providing rich examples to complement the findings from the district leader interviews.
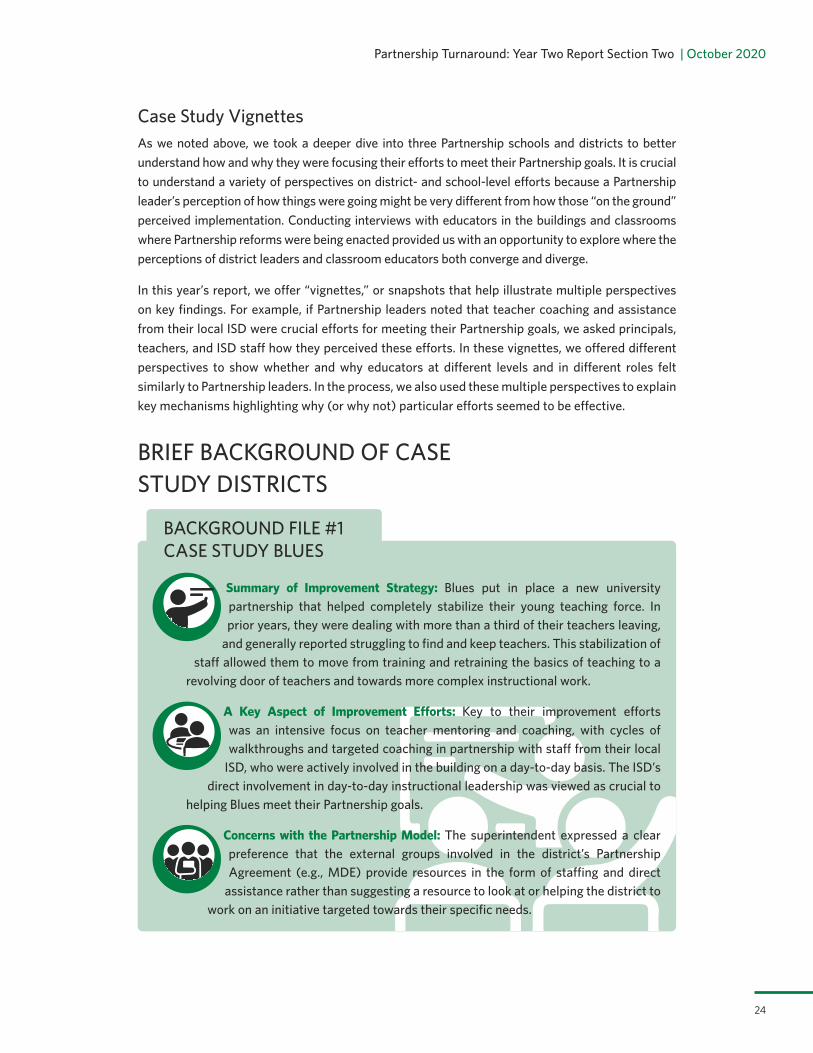
Partnership Turnaround: Year Two Report Section Two | October 2020
24
Case Study VignettesAs we noted above, we took a deeper dive into three Partnership schools and districts to better understand how and why they were focusing their efforts to meet their Partnership goals. It is crucial to understand a variety of perspectives on district- and school-level efforts because a Partnership leader’s perception of how things were going might be very different from how those “on the ground” perceived implementation. Conducting interviews with educators in the buildings and classrooms where Partnership reforms were being enacted provided us with an opportunity to explore where the perceptions of district leaders and classroom educators both converge and diverge.
In this year’s report, we offer “vignettes,” or snapshots that help illustrate multiple perspectives on key findings. For example, if Partnership leaders noted that teacher coaching and assistance from their local ISD were crucial efforts for meeting their Partnership goals, we asked principals, teachers, and ISD staff how they perceived these efforts. In these vignettes, we offered different perspectives to show whether and why educators at different levels and in different roles felt similarly to Partnership leaders. In the process, we also used these multiple perspectives to explain key mechanisms highlighting why (or why not) particular efforts seemed to be effective.
BRIEF BACKGROUND OF CASE STUDY DISTRICTS
BACKGROUND FILE #1 CASE STUDY BLUES
Summary of Improvement Strategy: Blues put in place a new university partnership that helped completely stabilize their young teaching force. In prior years, they were dealing with more than a third of their teachers leaving,
and generally reported struggling to find and keep teachers. This stabilization of staff allowed them to move from training and retraining the basics of teaching to a
revolving door of teachers and towards more complex instructional work.
A Key Aspect of Improvement Efforts: Key to their improvement efforts was an intensive focus on teacher mentoring and coaching, with cycles of walkthroughs and targeted coaching in partnership with staff from their local
ISD, who were actively involved in the building on a day-to-day basis. The ISD’s direct involvement in day-to-day instructional leadership was viewed as crucial to
helping Blues meet their Partnership goals.
Concerns with the Partnership Model: The superintendent expressed a clear preference that the external groups involved in the district’s Partnership Agreement (e.g., MDE) provide resources in the form of staffing and direct
assistance rather than suggesting a resource to look at or helping the district to work on an initiative targeted towards their specific needs.

EPIC | Education Policy Innovation Collaborative — Michigan State University
25
BACKGROUND FILE #2 CASE STUDY STARS
Summary of Improvement Strategy: After the departure of a superintendent, a new district-level Partnership leader was tasked with understanding the agreement and navigating the negotiation of goals and implementation of
initiatives. This leader, along with Partnership school teachers and leaders, felt that the Partnership Model provided helpful resources in the form of the MDE liaison,
21h funds, and by providing a framework and process for continuous improvement.
A Key Aspect of Improvement Efforts: Key to their improvement efforts were the implementation of teacher development initiatives (funded in part by 21h) such as instructional rounds, the acquisition of a new curriculum and an inclusive
process to choose and pilot this curriculum, and professional development for curriculum implementation. Notably, district- and school-level leaders were
receptive to the suggestions and assistance from their liaison, and felt they were able to stabilize their teaching force through the negotiation of a new teacher contract which raised the level of teacher pay.
Concerns with the Partnership Model: School leaders had little control over how 21h funds could be used to meet their Partnership goals (the district made these decisions), which they felt was problematic. For example, the principal explained
that she/he had to look for their own funding to maintain programs that teachers and leaders felt were extremely helpful for improving the overall school culture. School
leaders would have preferred greater control over 21h funds.
BACKGROUND FILE #3 CASE STUDY FLAMES
Summary of Improvement Strategy: Flames’ Educational Service Provider (ESP) made the decision to let go of a leader in the prior year and hired a new principal who was already familiar with the school and had worked with teachers
in a leadership capacity in the past. This new leader said that the Partnership Agreement helped him/her to strategically plan. It helped him/her to understand that
the school needed to immediately refine the number of initiatives occurring so that there was a stronger and more strategic focus on a manageable number.
A Key Aspect of Improvement Efforts: Like Stars, Flames went through an inclusive and iterative process to choose and pilot a new reading curriculum. To meet their goals, the Partnership leader felt it was critical to improve the culture and climate
of the school and therefore put in place various strategies to increase parent and student engagement. These efforts helped the school feel like a “family” — a word nearly
all teachers and leaders at the school used to describe the culture and climate.
Concerns with the Partnership Model: Teachers appreciated the leadership and working conditions at Flames, but many still cited compensation as an issue for teacher recruitment and retention.

Partnership Turnaround: Year Two Report Section Two | October 2020
26
REVIEW OF GOAL ATTAINMENT OBSERVATIONSPartnership districts are evaluated after they have implemented their Partnership Agreement for 18 months, a process referred to as the Review of Goal Attainment (RGA). The culmination of this process is a meeting that involves representatives from the district, MDE, the district’s ISD, and community partners the district invites. The aim of this process is to evaluate the district’s progress toward the 18-month benchmarks spelled out in its Partnership Agreement and determine whether it may need additional monitoring and/or support to meet its 36-month goals. During the 2019-20 school year, EPIC researchers attended three RGA meetings to observe the kind(s) of information that was shared, how different stakeholders interacted, and the formal process by which Partnership districts were rated at this juncture. We purposely selected the RGA meetings that were observed to obtain variation in the degree of challenge and success that districts had experienced up to that time.
SUMMARYIn all, this report relied on a mixed-methods triangulation design to evaluate the implementation and efficacy of the Partnership Model, including a variety of methods of data collection and analysis. Through the integration and analysis of these qualitative and quantitative data sources and methods, we were able to consider the extent to which the Partnership Model improved outcomes, as well as how the reform was implemented and how implementation and outcomes varied across settings. In the remainder of the report, we bring these multiple data sources to bear to paint a rich picture of how this reform has been experienced and how it has affected Partnership schools and districts across the state.

EPIC | Education Policy Innovation Collaborative — Michigan State University
27
SECTION TWO NOTES1. Of the seven districts that exited Partnership, five closed: El Hajj Malik El-Shabazz Academy,
Southwest Detroit Community School, and GEE Edmonson Academy in the summer of 2019; Detroit Delta Prep Academy in the fall of 2018; and Frederick Douglass International Academy in the summer of 2018. The remaining two districts that exited Partnership are the Lansing School District, which was released in summer 2019 at the request of the district because its lone CSI school was closed and its remaining Partnership schools were optionally identified, and Benton Harbor Area Schools, which exited Partnership in the summer of 2018 to enter into a cooperative agreement with MDE in which a CEO manages the district. Since the end of the 2019-20 school year, two more districts, Eastpointe and Kalamazoo, were released from Partnership status as they had only Cohort 1 Partnership schools, meaning that their Partnership Agreement officially ended at the conclusion of that school year, and were deemed to have made adequate progress toward their Partnership Agreement goals.
2. Districts report all employees to CEPI along with an assignment code that identifies the type of work they perform for the district. To identify teachers from this larger set of employees, we relied on a set of assignment codes considered by MDE’s Office of Educator Excellence to indicate that an individual is a teacher. For the portion of the report using the state’s administrative data records, this classification may exclude school personnel who teach on a limited basis but whose primary appointment is in another capacity (e.g. librarians or social workers). We excluded long-term substitute teachers from our analyses. We defined “long-term substitutes” as individuals with teaching assignments whose only credential is a substitute teaching permit. Similarly, principals and assistant principals were identified using an indicator MDE developed to identify school leaders in these categories in the Record of Educational Personnel.
3. The state assessment for grades three through eight changed from the Michigan Educational Assessment Program (MEAP) exam to the Michigan Student Test of Educational Progress (M-STEP) beginning in the 2014-15 school year. The 11th grade assessment changed from the ACT to the SAT beginning in the 2015-16 school year. Beginning in the 2018-19 school year, eighth grade students began taking the PSAT 8/9 instead of the M-STEP assessment. We accounted for these assessment program changes by standardizing MEAP/M-STEP/PSAT and ACT/SAT scores within subject, grade, and year, so all assessment outcomes are on a common scale.
4. We calculated student growth as the difference in achievement in two consecutive years. Given this, we cannot calculate a growth rate for third graders since the first M-STEP is given in third grade. Our first year of growth data is for fourth graders.
5. We calculated “on time” four-year graduates following the classification CEPI uses. The graduation cohort year is based on the year a student was first reported as a ninth grader in any school in the state system. The cohort year is four years after the student’s first appearance in the data as a ninth grader, except for students enrolled at an Early/Middle College, in which case it’s five years after their first appearance as a nonth grader. We use the same definitions outlined in CEPI’s Overview of Michigan’s Cohort Graduation and Dropout Rates to identify graduates and dropouts based on a student’s exit status at the end of their cohort year. Students with the status “On-Track Graduated” were classified as graduates. Students with the status “Dropout” or “Missing Expected Record” were classified as dropouts. Students with any of the following exit statuses were neither classified as graduates nor dropouts: “GED Completer,” “Off-Track Continuing,” “Off-Track Graduated,” and “Other Completers.”
6. This means that the subsequent grade was not offered at the student’s school in the following year, such as when an eighth grader moves from a middle school in one year to a high school the following year.

Partnership Turnaround: Year Two Report Section Two | October 2020
28
SECTION TWO NOTES (continued)7. In keeping with the intent-to-treat approach in our event study analyses, students in the
treated and comparison groups retain their status even if their school exits Partnership status. As of the end of the 2018-19 school year, the last academic year for which we have complete data, two Partnership districts had closed (ceased operations) while one other was released from Partnership status to enter into a Cooperative Agreement with MDE.
8. For our Cohort 1 analyses, students in Cohort 1 Partnership schools were identified as the treatment group while students in schools that were on the state’s Priority list at that time, that were not subsequently identified for Partnership in Cohort 2, were identified as the comparison group. This differs slightly from how treated and comparison groups were identified for analyses shown in our Year One Report, which identified all students in Priority schools as being in the comparison group regardless of whether that school was subsequently identified for Partnership. This change was made because students in schools that were eventually identified for Partnership in Cohort 2 had not yet experienced Partnership-related reforms in the 2017-18 school year, the last year of outcomes examined in our Year One Report. However, as we examine outcomes beyond the 2017-18 school year, estimates may be biased if those students experienced gains from Partnership, but were identified as being in the comparison group for Cohort 1. This change does not affect the interpretation of the results presented in our Year One Report. For Cohort 2 analyses, students in Cohort 2 Partnership schools were identified as the treatment group while students who attended schools that were in the bottom 10% of schools statewide based on their Michigan School Index System score, that had not already been identified for Partnership in Cohort 1, were identified as the comparison group.
9. Students who were determined to be eligible for free or reduced-price meals via locally gathered and approved family applications under the National School Lunch program, are in households receiving food (SNAP) or cash (TANF) assistance, are homeless, are migrant, or are in foster care are considered Economically Disadvantaged.
10. This survey was the second in a series of four surveys that will occur during approximately the same window in the following years (2020-21 and 2021-22).
11. Unlike with our econometric specifications, we ceased surveying educators in districts that were released from Partnership status. As a result, our population of treated Partnership schools remains constant in our event study models but shifts in our survey analysis to reflect current Partnership status.
12. Survey responses were weighted using an inverse probability method that incorporates a base sampling weight and a nonresponse weight. The base weight was calculated using the school-level coverage of our sampling frame. The nonresponse weight was generated by using logistic regression to model each individual’s probability of responding based on their demographic characteristics and a school fixed effect. Weights were calculated separately for teachers and principals and separately by wave. We considered several different weighting procedures including class adjustments and weighting only for non-response and compared findings based on each with those based on unweighted responses, observing few differences between them. This inverse probability weighting scheme was selected because it maximizes generalizability and also facilitates more sophisticated analyses that combine survey and administrative data.
13. Of the three case studies in the Year Two Report, one represents a district also included in the Year One Report. The other two are new cases this year.

EPIC | Education Policy Innovation Collaborative — Michigan State University
29
Partnership Turnaround: Year Two Report
SECTION THREE:HOW HAS THE PARTNERSHIP MODEL CHANGED OVER TIME?
EPICEducation Policy Innovation Collaborative

Partnership Turnaround: Year Two Report Section Three | October 2020
30
HOW THE PARTNERSHIP MODEL WAS INTENDED TO WORKIn the first year of the study, the research team worked in collaboration with Michigan Department of Education (MDE) and other state-level stakeholders critical to the design and implementation of the Partnership Model to develop a Theory of Change (ToC) that reflected the logic model upon which intervention was based. A thorough description of the original ToC can be found in our Year One Report. In this section, we briefly review the ToC and highlight how it has evolved over time as MDE has received feedback from the field and the intervention has adapted to shifting state and local contexts.
The ToC upon which the reform was initially based, shown in Figure 3.1 , was grounded in several beliefs expressed by then-Superintendent Whiston and his team. First among them was the conviction that the district was the key unit of change. Individual schools’ low performance reflected more than just difficulties at the school site but also larger systemic issues within their districts. In addition, the creators of the intervention believed that districts and their low-performing Partnership schools needed to set realistic goals for improvement and have clear timelines to achieve those goals. Individual and holistic goals about academic and non-academic outcomes were written into Partnership Agreements, which were intended to highlight the areas in which Partnership districts expected to improve and the degree to which they were to be held accountable for doing so, and to clarify the main strategies for achieving these goals. Local needs and the local contexts in which the schools and districts operate were to drive these goals and strategies.
Section Three: How Has the Partnership Model Changed Over Time?

EPIC | Education Policy Innovation Collaborative — Michigan State University
31
FIGURE 3.1. Original Partnership Model Theory of Change (2017-2018)
NEAR-TERM OUTCOMES
DISTRICTImproved systems with great-
er capacity to support core district functions
Human resources Curriculum Instructional systems (e.g., professional development)
Operations Data use
SCHOOLImproved functioning of
instructional core
Improved instruction
Goals aligned with turnaround strategies & interventions
Use of data & metrics to inform & evaluate improvement
INTERMEDIATE OUTCOMES
LONG-TERM OUTCOMES
Increased educator retention
Consistent, high-quality instruction
More efficient use of
resources
IMPROVED ACADEMIC OUTCOMES
Higher achievement Reduced dropout
IMPROVED WHOLE-CHILD OUTCOMES
Attendance Behavior
DISTRICT-DETERMINED CONSEQUENCES FOR FAILURE TO IMPROVE:
Reconstitution Restart ISD takeover CEO appointed
STATE CONTEXTLOCAL CONTEXT
PARTNERSHIP AGREEMENT DEVELOPMENT &
IMPLEMENTATION District as driver of change
Comprehensive needs assessment
Draft 18- & 36-month goals - Academic - Non-academic
Develop turnaround strategies - Aligned with district/school context - Aligned with 18- & 36-month goals - Align with supports from MDE & ISD
Identify community partners - Solicit input on reform strategies - Align supports with turnaround
strategies & goals
MDE/OPD Liaison Teacher & Leader Instruction Support Grant 21h Grant Referrals to other offices’ departments
Regional Assistance Grant to ISD
ISD Professional development Training Coaching
COMMUNITY Advice & expertise
Additional resources
PARTNERS
IDENTIFIED BY MDE AS LOW-PERFORMING

Partnership Turnaround: Year Two Report Section Three | October 2020
32
Importantly, in the original logic of the Model, MDE expressed the principle that various and multiple partners should be included in efforts to turn around low-performing schools and districts. Superintendent Whiston and his team believed that communities and community-based organizations needed to commit to education improvement efforts to help students and their schools and districts raise academic outcomes. Districts and schools could and should bring together state, district, and local community partners to improve the capacity of the local districts to assist low-performing school sites to improve. Each of these partners would play a different role in building district capacity. From the state and local government side, MDE would provide assistance through its Office of Partnership Districts (OPD), which employed Partnership Agreement liaisons (PALs). PALs were tasked with acting as a concierge between the Department and the individual districts and providing support to Partnership districts as they worked to implement their turnaround plans. Intermediate School Districts (ISDs) also served an important role for Partnership districts, with staff dedicated to supporting their work and offering professional development, training, and coaching services.
The intervention was supported through 21h funding, a grant funded by legislative appropriation to support Partnership districts’ turnaround work. Funding for 21h was approximately $6 million in the first year of Partnership implementation (2017-18), $7 million in the second implementation year (2018-29), and $6 million in year three (2019-20). Each year, these funds were allocated on a competitive basis across all Partnership districts to purchase new materials, create positions to support Partnership work, and to provide professional development. In addition, Partnership districts received additional support from MDE through Regional Assistance Grants (RAGs), which were given to ISDs to increase their capacity to support their Partnership districts.1 The funding for the Partnership Model was intentionally thin given the original belief by Superintendent Whiston and then-Governor Rick Snyder that the majority of resources for school improvement should be locally based either by district funding reallocations or fiscal support and in-kind services from community partners.
In the near term, these efforts were intended to drive improvements in district systems and enable districts to have greater capacity to support core functions, which would in turn enable them to support their schools in their efforts to improve the functioning of the instructional core and other school operations. This in turn would lead to at least three predicted intermediate outcomes: 1) increased educator retention; 2) consistent, high-quality instruction; and 3) more efficient use of resources. These would in turn facilitate the eventual long-term student outcomes expected of the Partnership schools after 36 months: improved academic outcomes, reduced student drop-out rates, and improved whole-child outcomes.
High stakes accountability measures were put in place if districts failed to show progress towards their goals at the 18-month mark and/or failed to meet their goals at the end of 36 months. These ranged from taking over failing districts to closing schools that failed to improve. Fairly quickly, however, the role of high stakes accountability was diminished in the Partnership Model. Rather, the reform has evolved from one that was intended to give schools a last chance before being closed to one that is focused on supporting schools and districts to turn around struggling schools, and the consequences for failure to improve have become less and less central to the intervention.
All school and district reforms are necessarily nested within their broader contexts, which the figure shows by locating the ToC within the larger local and state contexts. This is particularly

EPIC | Education Policy Innovation Collaborative — Michigan State University
33
relevant for turnaround reforms, and especially for the Partnership Model which was originally intended to rely on both local and state partners to enable reform. In particular, the engagement of local community partners in the Partnership Model was intentional and stems from the understanding that problems within schools often reflect difficulties experienced by communities, such as those we highlighted in the introduction to this report. The Partnership Model’s focus on locally-defined needs, improvement strategies and partnerships explicitly brought together traditional education resources with those from outside the school system to work to improve student achievement in the state’s lowest-performing schools, which by default often existed within the state’s lowest-income and most disadvantaged communities. Moreover, the Michigan state context of heavy local control, an active state legislature, and relatively low levels of funding for K-12 education compared to other states (see Arsen, Delpier & Nagel, 2019) was relevant to the use of the Partnership Turnaround Model for school improvement.
CHANGES MADE TO THE PARTNERSHIP MODELPrograms and interventions change over time — the Theory of Change that is presumed in the design of the program shifts over the course of implementation and feedback (Kingdon & Stano, 1984; McDonnell, 2013). This shifting occurs for several reasons. First, policymakers can intentionally adapt educational interventions to reflect what they learn from school and district leaders’ implementation experiences, successes, and challenges (Bleiberg & Harbatkin, 2020; McLaughlin, 1987; Russell, Correnti, Stein, Bill, Hannan, Schwartz, Booker, Pratt, Matthis, 2020). This process of continuous improvement is especially strengthened in reforms that are implemented in parallel to evaluations that can provide formative and fast feedback to policymakers (Gallagher & Cottingham, 2019; Hough, Willis, Grunow, Krausen, Kwon, Mulfinger, & Park, 2017). Second, as practitioners and actors at the local level implement reforms they naturally adapt the intervention to their own needs and contexts (see our Year One Report for evidence of such bridging activities). If enough local actors adapt programming in similar ways, the eventual result can be somewhat de facto changes to the intervention itself (Arnold, 2015; Cohen & Klenk, 2019; Frisch-Aviram, Cohen, & Beeri, 2018). Third, education reforms are frequently susceptible to shifts enacted by policymakers at the state level, such as legislators and governors.
In the case of the Partnership Model, the intervention shifted over time because of all three of the reasons stated above. MDE actively worked to learn from district and school leaders’ experiences in the early years of the Partnership Model and made changes in response. In addition, new legislation executed during the implementation period caused shifts in the program structure. And district and school personnel made implicit changes to the model in ways that helped them to align the Partnership Model with their own needs and contexts.
In this section, we review some of the main changes made to the Partnership Model in the years since its original implementation. We also provide a revised Theory of Change (Figure 3.2), which highlights how these shifts can be viewed in relation to the original intentions behind the logic model.

Partnership Turnaround: Year Two Report Section Three | October 2020
34
FIGURE 3.2. Updated Partnership Model (2019-2020)
NEAR-TERM OUTCOMES
DISTRICTImproved systems with greater
capacity to support core district functions
Human resources Curriculum Instructional systems (e.g., professional development)
Operations Data use
SCHOOLImproved functioning of
instructional core Improved instruction Goals aligned with turnaround strategies & interventions
Use of data & metrics to inform & evaluate improvement
INTERMEDIATE OUTCOMES
LONG-TERM OUTCOMES
Increased educator retention
Consistent, high-quality instruction
More efficient use of resources
IMPROVED ACADEMIC OUTCOMES
Higher achievement Reduced dropout
IMPROVED WHOLE-CHILD OUTCOMES
Attendance Behavior
DISTRICT-DETERMINED CONSEQUENCES FOR FAILURE TO IMPROVE:
Reconstitution Restart ISD takeover CEO appointed
STATE CONTEXTLOCAL CONTEXT
PARTNERS
IDENTIFIED BY MDE AS LOW-PERFORMING
COMMUNITY Advice & expertise Additional resources
ISD Professional development Training Coaching
MDE/OPD LIAISON- navigators- communication brokers- neutral facilitators
Teacher & Leader Instruction Support Grant 21h Grant Referrals to other offices departments Regional Assistance Grant to ISD
EVALUATION PROCESS Review of Goal Attainment at 18/mo. Evaluation of Partnership Agreement at 36/mo.
AMENDMENT OF THE PARTNERSHIP AGREEMENTIf the district or MDE sees a
deficiency in the PA, its 18-month benchmarks may be amended
PARTNERSHIP AGREEMENT DEVELOPMENT & IMPLEMENTATION District as driver of change Comprehensive needs assessment Draft academic and non-academic 18- & 36-month goals
Develop turnaround strategies - Aligned with district/school context - Aligned with 18- & 36-month goals - Align with supports from MDE & ISD
Identify community partners

EPIC | Education Policy Innovation Collaborative — Michigan State University
35
Diminished Authority for MDE to Intervene in Schools and the Further De-emphasis of High Stakes AccountabilityIn the summer of 2019, legislative changes reduced the authority of MDE to intervene in schools. From 2010 until that time, the State of Michigan had a School Reform Officer (SRO) who had the legal authority to intervene in low-performing schools, including the ability to close schools. Beginning in 2018, the director of the OPD also served as the State’s SRO to implement the next-level accountability measures included in Partnership Agreements. However, Public Act 601 of 2018, which took effect July 1, 2019, repealed the legislation that created the SRO, thus diminishing the legal tools available to the OPD to take action in Partnership districts not meeting the goals outlined in their Partnership Agreements.
Though no policy changes were made regarding the next-level accountability element of Partnership districts’ Partnership Agreements, decreased authority on the part of OPD may nevertheless have affected how educators perceived the accountability element of the Partnership Model. To that end, survey data showed that both teachers and principals in Partnership schools perceived consequences for failing to meet their Partnership Agreement goals as less likely than they did a year ago. This is shown in Figure 3.3; teachers and principals in Partnership schools saw it as less likely that failing to meet their school’s Partnership Agreement goals would result in a low accountability rating, that the school would lose students, or that their school would be closed. Notably, however, it is unclear whether this pattern is the result of policy changes that ostensibly lessen the accountability threat or if failing to improve student outcomes was less salient as both groups of educators also saw improvement over their school’s 36-month Partnership Agreement cycle as “somewhat” to “very” likely. (See Figure 4.1.)
FIGURE 3.3. Educators’ Perceived Likelihood of Consequences for Failing to Improve
Partnership Principals Partnership Teachers
Increase Since 2018 Decrease Since 2018
Very Unlikely
Neither Likely nor Unlikely
Very Likely
Somewhat Unlikely
Somewhat Likely
Your school will lose students if your improvement
goals are not met
Your school will face staff/leader removal if your
improvement goals are not met
Your school will receive a low accountability rating if your
improvement goals are not met
Your school will be closed if your improvement goals are
not met
Nothing will happen if your improvement goals are not
met
Note: Educators’ were asked, “If your [Partnership Agreement/school improvement] goals are not met, to what extent do you believe that your school will face the following consequences:”
Partnership Turnaround: Year Two Report Section Three | October 2020
36
Increased Clarity About the Role of Different PartnersOne of the ways in which the Partnership Model changed over the course of implementation was in the shifting emphasis on the roles of various partners. In particular, Partnership district leaders reflected on MDE/OPD’s relaxed emphasis on community partners in the reform and increased focus on the support role ISDs played in helping turn around Partnership schools and districts.
The de-emphasized role of community partners. When districts originally crafted Partnership Agreements, they were asked to identify community partners that could help them reach their goals, including local community service and philanthropic organizations, businesses, health and childcare providers, and educational organizations. Over time, however, Partnership districts appeared to place less emphasis on collaboration with community partners.
In our interviews with Partnership leaders for this report, some expressed confusion about what it meant to partner with community organizations and local businesses. For example, the district leader of Capitals was unclear what types of relationships between the district and local entities should be officially part of a Partnership Agreement. She/he said, “What are the partners—what’s the purpose of it? That’s tough. The [nearby gas station], they provided funds for the athletes, and then gave all the staff gas cards, and those are nice things, but is it partnering? I don’t know.” Other Partnership leaders indicated that they had always had a relationship with local businesses but did not create new partnerships as a result of the intervention. The Black Hawks district leader shared, “[T]he partners who we’ve had, we’ve had already.”
Partnership Turnaround: Year Two Report | October 2020
A NOTE ON HOW TO INTERPRET PARTNERSHIP REPORT FIGURES.
In the Year Two Report, we are providing information on results from this year’s survey (administered in the fall/winter of the 2019-20 school year) and comparing it to results from last year’s survey (administered in the fall/winter of the 2018-19 school year). In addition, we want to compare Partnership principals’ responses to Partnership teachers’ answers, and in many cases we also want to compare Partnership educators’ responses to those from educators in non-Partnership schools in Partnership districts.
We do this throughout the report by marking 2019-20 survey results with colored circles and showing the 2018-19 results with the black triangles. We note the difference between the two years with the grey bars spanning between the black triangles and the circle markers, and the direction of the shift is demarcated by the direction of the triangle.
When we include educators in both Partnership schools and non-Partnership schools in Partnership districts, we use a lighter shade of blue (principals) and green (teachers). Thus, the figures show the average responses for Partnership school and non-Partnership school teachers and principals in the 2019-20 survey relative to the same groups’ responses in the 2018-19 survey. If a question was not asked in the earlier year’s survey, then there is no black triangle or grey bar noting an earlier average response or any change over time.

EPIC | Education Policy Innovation Collaborative — Michigan State University
37
Some leaders shared that cultivating and maintaining relationships with community partners was time consuming and other initiatives took precedence in their turnaround work. The charter leader of Hurricanes discussed how working with community partners could be particularly challenging to balance with the other work of leaders:
It requires a lot. I see the benefit in it, but it requires a lot of time and energy invested. When you’re a school, for example, a small school like us where you don’t have a significant amount of human capital, you’re trying to be an instructional leader, as I try to be, but you also have these outside entities that you’re trying to navigate a relationship with in time, and maintaining that, and all of that. It has been challenging. Now, it’s been worth it, I will say. It is a worthy challenge, but it has been a challenge, nonetheless.
The charter leader of Maple Leafs shared that they had mentored a Partnership school leader to be selective regarding which partners to engage with:
I would say one of the tricky parts about support—once we took over the management of the school, as we were having our Partnership meeting, I would often have to say, “Help isn’t always helpful.” […] There’s all of these things being thrown
at the school leader. We were saying, “Hey, there’s a level of support that we can now provide assisting them all. Let us get in here, get going, and then see where some of the gaps are. Then we can select the core based on need.” I had to say to the school leader in the beginning, “It is okay to say no even if they’re offering it because the worst thing in the world is to have too many cooks in the kitchen and you’re all cooking a different recipe.” Then you’re compromising your support.
This leader highlighted that using too many partners can affect the coherence of turnaround activities, and that strategically aligning initiatives is more important than accepting any and all help.
The exception to this was the use of university partners to create grow-your-own teacher programs and to lead professional development. Districts worked with universities to provide training and professional development for new and current teachers, provided alternative certification options, and encouraged interns from university teaching programs to work in the districts (for more on this, see Section Five).
Districts worked with universities to provide training and professional development for teachers, provided alternative certification options, and encouraged interns from teaching programs to work in the districts.

Partnership Turnaround: Year Two Report Section Three | October 2020
38
The enhanced role of ISDs.While local community partnerships were de-emphasized by Partnership leaders, they did talk about ISD partners, MDE liaisons, and, in the case of charter schools, authorizers and Educational Service Providers (ESPs), as important contributors to the district’s Partnership work. ISD partners were particularly helpful with technical supports, providing instructional coaches, professional development, and financial resources to help build their teachers’ instructional capacity. Sixteen of 22 Partnership leaders considered partnering with their local ISD to be a positive aspect of Partnership. Hurricanes’ charter leader described their ISD as “the professional development support arm of this [partnership].” The district leader of Black Hawks shared that the ISD/RESA was able to help the district coordinate and align their curricula with their goals:
From [ISD], the partners who have been allocated for our building have done a phenomenal job at aligning the curriculum, [so that the curriculum] also helps us to meet the social and emotional needs of our children. They’ve just done a really good job in helping us with resource—I won’t even say resource allocation—with finding the resources to support the professional development around [the curricula].
The charter leader of Flames echoed the sentiment that the ISD provided important supports that they felt were not present as a charter district before Partnership:
[ISD] has really stepped up tremendously. They’re providing coaching support, and they’re providing so many PDs [professional development opportunities] and all of these things. It would have been helpful to have this initially, when we saw the scores dropping as opposed to once we reached that level. Now, we’re getting the support we need, and we’re going back up.
More supports for Partnership charter schools from ISDs, ESPs, and liaisons. Charter schools also indicated that ESPs or authorizers can be a source of technical supports in addition to ISDs and liaisons. As noted above, the leader of Hurricanes explained that their ISD was the “professional development arm” of their Partnership work and the ESP functioned as their “academic support team,” which was described as “helping us with walk-throughs, professional development as well, looking at analyzing data, going through that school improvement process, all of that, and planning, and things of that sort.” Similarly, the charter leader of Lightning shared that their ESP provided consultants to provide more of this boots-on-the-ground technical support: “Not only are they doing your traditional professional development, but they’re also doing job-embedded professional development, where they’re able to have a scenario where the coach is in there, and then they talk about what happened.” The leader of Hurricanes noted that the ESP “always
72.7%
PARTNERSHIP LEADERS
CONSIDER PARTNERING
WITH THEIR LOCAL
ISD A POSITIVE
ASPECT OF PARTNERSHIP
One leader described their ISD as “the professional development
support arm of this [partnership].”
The district leader of Black Hawks shared that the ISD/RESA was able to help the district coordinate and align
their curricula with their goals.

EPIC | Education Policy Innovation Collaborative — Michigan State University
39
functioned this way,” suggesting that ESPs may not be taking on a new role in Partnership Agreements but rather a new focus or support coordination function.
Like other Partnership leaders, some charter leaders also mentioned that MDE support continued to be helpful as they implemented their Partnership goals (more on this below). Blue Jackets’ charter leader, for example, said:
[O]ur liaison has been fantastic in terms of saying, “Hey, [Blue Jackets]. You might want to take a look at this…” Out of those conversations, we had to really take a look at our tier one instruction and say, “We need to address this.” We decided to move into having a new curriculum for ELA and math.
Together, these datapoints exemplified how charters had three institutional partners available for technical supports because of identification as a Partnership district: the ISD, their MDE liaison, and either or both their ESP or authorizer.
The level of support provided by these technical partners may in part explain why there were fewer partnerships with outside community groups. The charter leader of Predators shared how these technical partners plus their Blueprint facilitator (a support Partnership Agreement liaisons frequently refer to districts) were a robust team for addressing their Partnership Agreement goals without needing additional entities:
I have an MDE rep [Partnership Agreement liaison] who was extremely influential who I would meet with once a month. I have partners from my [ISD]. I have partners from my management company [ESP]. I have partners from our authorizer. I am also installing the Blueprint here. […] Between my Blueprint facilitator, my MDE facilitator, myself, my curriculum coach from the [ISD], we sit at the table and we make these decisions collectively as a team.
Overall, the partnerships Partnership leaders discussed most were with these technical partners — ISDs, liaisons, and ESPs — who provided professional development, coaching, and data analysis. This highlights the important role of MDE, ISDs, authorizers, and ESPs as signers of Partnership Agreements. These technical partnerships helped districts, and especially charter districts, focus on activities and initiatives to improve the instructional core, and, by extension, improve student outcomes that are the focus of Partnership goals.
Increased Standardization of Partnership Model Systems and ProcessesThe Partnership Model shifted over time due to efforts the OPD and MDE made. After assuming the role of Director of the Office of Partnership Districts at MDE in the fall of 2018, Dr. William Pearson launched an effort to standardize the systems and processes that undergirded the reform implementation to clarify the roles and responsibilities of all parties to the Partnership Model.
Technical partnerships helped districts focus on activities and initiatives to improve the instructional core.

Partnership Turnaround: Year Two Report Section Three | October 2020
40
In particular, OPD made efforts to clarify and standardize how Partnership districts could use 21h funds, the role of Partnership Agreement liaisons, how Partnership Agreements were developed and amended, and how Partnership districts were evaluated.
Standardization of the liaison role: liaisons as navigators, communication brokers, and neutral facilitators. As we noted in our Year One Report, in the early implementation of the Partnership Model, liaisons varied greatly in terms of the types and quality of assistance and support they gave to their schools and districts. In this last year, OPD worked to reduce the variation in both the breadth and depth of liaison activities, standardizing expectations about how they were to support the districts and schools with which they worked. In particular, the liaison role was clarified so that they served as a “navigator” that connected districts to relevant resources, and as a “communications broker” and “neutral facilitator” who could help facilitate collaborative conversations as needed. In addition, liaisons were to provide a limited amount of direct technical assistance to districts that were also working to install the Blueprint to aid in their turnaround efforts (Michigan Department of Education, 2019).
The restructured role of liaisons was viewed as a balance between holding districts accountable for their decisions and performance and supporting them in their efforts. Two liaisons we interviewed explained their roles as facilitators, connectors, and communicators. One of them said, “The current role is primarily to break down barriers, and we’re a facilitator, a communications broker, and I like that portion of it.” A second liaison affirmed this, giving as an example his/her role connecting Partnership districts with contacts both within and outside of MDE and across the state:
What we do is we can provide them with the contact person of the different resources that would help. Whatever technical assistance they need, whatever department they need to collaborate with, we can get them in touch with that person, give them the information, or even set up a meeting for them… The decisions are made through the district, but we can give them our knowledge about it. We can have a conversation with them about it, but the final decision is made on the district level.
Both liaisons emphasized that it was not their job to directly intervene or prescribe solutions, rather, their approach was to provide information, ask questions, and provide feedback when leaders were open to it. In their role as “brokers,” liaisons helped district leaders navigate compliance structures at MDE and provided suggestions for resources or partners that might help districts build their capacity around a particular area.
This shift in liaison role came across clearly to Partnership leaders, and it was evident in our interviews that the balance largely had tilted from some of the top-down authoritative activities reported about liaisons as noted in our Year One Report to a more universally supportive role. Indeed, nearly all district leaders (21 of 22) noted that liaisons were helpful as communication and resource brokers.
Some district leaders were more enthusiastic than others about the nature and helpfulness of this assistance. In addition, some superintendents noted the difficulty in this duality between complying with MDE policies and taking recommendations for improvement. The Rangers charter leader highlighted this tension:

EPIC | Education Policy Innovation Collaborative — Michigan State University
41
What I wish at times is you make that compliance piece, sometimes some things aren’t compliance, they’re just things that our liaison recommends. I get nervous, because I feel like we’re being pulled into too many different directions, and we must focus on academics.
Several other Partnership leaders noted the difficulty trying to remain focused and coherent when considering liaison suggestions but noted that liaisons were understanding when leaders did not take their direct suggestions. This again indicated that liaisons understood their role as “navigators” who might provide suggestions but had no expectations for districts to actually use all of them.
The limited role for liaisons as providers of technical assistance was also clear to many Partnership leaders with whom we spoke, although there remained some uncertainty around liaisons’ roles in providing suggestions and technical assistance. The quote above from the Rangers reflects this tension, and it was also felt by some of the liaisons. One liaison with considerable leadership background noted that it was difficult at times not to take on more of a technical assistance orientation when she/he knew it could be helpful to his/her district. This liaison also believed it was critical to assist at the building level, especially when it came to working with principals and not just central office staff. She/he explained: “We’re all talented enough that we could coach principals. I think if you want to get the scores up, you got to get to the principal. That’s my own opinion.”
Partnership leaders were mixed when it came to this level of technical assistance. Some, like the leader of Stars, appreciated how his/her liaison worked with principals. Others, like the Bruins district leader, explained why liaisons trying to coach principals and become active in school buildings might be an overreach:
Our liaison person at the State is very nice, and it’s good to touch base with him/her, but she/he thinks she/he wants to come in and coach our principals. They have plenty of people on them. They already feel the pressure of that. I know she/he’s just trying to do his/her job and be in there, but she/he’s never been a principal in an urban district. She/he doesn’t know what it’s like to face 200, 250 kids coming on your doorstep with mental health issues, their parents yelling at you, and then you’re trying to tell them that if they just do A, B, and C, they’ll make it? It doesn’t work. That part doesn’t work.
21 OUT OF 22
DISTRICT LEADERS NOTED
LIAISONS WERE
HELPFUL COMMUNICATION
AND RESOURCE BROKERS
This shift in liaison role came across clearly to
Partnership leaders, and it was evident in our interviews that
the balance largely had tilted from some of the top-down
authoritative activities reported about liaisons as noted in
our Year One Report to a more universally supportive role.

Partnership Turnaround: Year Two Report Section Three | October 2020
42
LIAISONS: Providing Information, Navigating Compliance, and Listening and Providing Feedback
LIAISONS: PROVIDING INFORMATION, NAVIGATING COMPLIANCE, AND LISTENING AND PROVIDING FEEDBACK
Partnership leaders indicated that they received support from liaisons most often through communications about financial or technical resources, assistance navigating policy compliance and the use of 21h funds, facilitating interactions between districts and the state, and serving as a thought partner when considering new problems or solutions.
PROVIDING INFORMATION ABOUT AVAILABLE RESOURCES.The charter leader of Oilers explained:
[Liaison’s] been here every month with us. Even on his/her off week, or off times when she/he’s not here, she/he sends regular emails with resources and stuff to all of his/her Partnership districts, but I’m included on that email. The 21h grant, I know she/he helped us — just kind of walked, talked through it and what resources we were asking for. Helped us to kind of brainstorm ways of explaining our needs and those kinds of things.
Despite the majority of Partnership leaders citing email communications as an example of how liaisons were assisting them, when asked if they actually used the resources contained within, few district leaders said that something was actually initiated or put in place from this resource. The superintendent of Blues went further and suggested that the email be more tailored and specific to their context, otherwise it just added more time to their jobs. She/he said:
Don’t send me the same communication you’ve sent everybody else. I get a weekly email from my liaison that takes the six other emails that I got from MDE and then puts them together. I try to read those emails as they come through, and I have to because I don’t know if I’m gonna get everything summarized in his/her email. […] If you wanna help me, make my life easier. Because otherwise, I’m gonna read those six emails, and then I’m gonna read your email that has those six snippets in it. Then maybe there’s somethin’ important that you actually have to tell me that’s buried in there that nobody else told me. Just find a way to communicate with me better so that I can use my time better.
42
Partnership Turnaround: Year Two Report | October 2020

EPIC | Education Policy Innovation Collaborative — Michigan State University
43
EPIC | Education Policy Innovation Collaborative — Michigan State University
So, although the liaison’s efforts to provide resources and information to Partnership districts were generally appreciated, as were the email communications through which some of these resources were shared, the emails in some cases contributed to confusion or added time to the work.
SMOOTHING COMMUNICATION.Liaisons were often cited as helpful in navigating compliance demands from MDE or the state. The district leader of Avalanche explained:
I feel like our liaison has also been able to help us navigate some of the unknown or sometimes roadblocks or barriers that show up in Michigan—in MDE that that person has kind of—for example, if we—when we send our consolidated application in, sometimes, we’re not hearing anything. We’re not hearing anything. We’ll make a call to the PAL, who will walk across the hall and go talk to somebody and say, “Hey, where are we at on this—on their consolidated app?” Miraculously, within a day or two or sometimes hours, we have answers that, had we not been able to reach out to them, they wouldn’t—we might not necessarily have that same kind of response.
ACTING AS THOUGHT PARTNERS AND NEUTRAL FACILITATORS.Finally, most felt it was helpful to have liaisons at the proverbial table, either because it helped the liaison understand their district/school context or because they were able to be thought partners and provide feedback. The charter leader of Maple Leafs put it this way:
I definitely will say that our liaisons have been very gracious in giving us feedback about what we’re doing and validating like, “You’re on the right path with systems that you’re putting in place.” They come to our schools. They sit in data meetings. It’s not just sit down and look at the paper. They’re really looking at is what they’re saying they’re doing, is it really translating to action? It’s been a very good experience on that end in that it’s felt more partnered than it has oversight. The reality of it is that it is oversight, but it just felt more of a partnership.
Although there were some exceptions (e.g. the charter leader of Senators said “MDE [hasn’t] done anything to make us successful”), most leaders agreed that having liaisons helped to build trust between districts and MDE, either because they felt listened to or because their insights were valuable.
LIAISONS: PROVIDING INFORMATION, NAVIGATING COMPLIANCE, AND LISTENING AND PROVIDING FEEDBACK
43

Partnership Turnaround: Year Two Report Section Three | October 2020
44
Standardization of the Partnership Agreement development and refinement process.After their development, Partnership Agreements can be amended to address unmet needs. The amendment process initially emerged in the summer and fall of 2018 when legislation required Partnership Agreements to meet certain criteria in their benchmarks, goals, and Next Level of Accountability (NLA).2 Initially, Agreements were amended in an ad hoc manner. However, along with a number of other elements of the Partnership Model, the Agreement amendment process was codified in the Partnership Model Comprehensive Guide, which was distributed to Partnership districts via their liaison in May of 2019 and released publicly on OPD’s website in August of that year.3 As the Guide describes, Partnership Agreements can be amended if either the district or MDE “identifies an area of need not addressed in the original Partnership Agreement.” Once the need for an amendment was identified, the district and OPD developed the amendment collaboratively with the district’s liaison providing a template, technical assistance, and feedback on behalf of OPD. Before being formally included as part of the district’s Partnership Agreement, the amendment must be signed by representatives of the partners who signed the original Agreement and approved by the Director of the Office of Partnership Districts.
Standardization of Partnership district evaluations.An important development between the summers of 2019 and 2020 was the codification of the processes that were used to evaluate the progress and improvements being made in Partnership schools. These details had not been developed at the outset of the Partnership Model. Partnership districts undergo a midpoint evaluation 18 months into the implementation of their Partnership Agreement, called the Review of Goal Attainment (RGA), and a summative evaluation at 36 months, called the Evaluation of Partnership Agreement (EPA), to gauge their progress toward achieving the benchmarks and goals laid out in their Partnership Agreement. The districts that operated Cohort 1 Partnership schools had their RGA in the winter of 2018-19 while those that operated Cohort 2 Partnership schools had theirs in the winter/spring of 2019-20. Districts that operated Partnership schools from both cohorts underwent separate RGA processes for each round. Originally, Cohort 1 Partnership schools were scheduled to have their EPA in the fall of 2020 with Cohort 2 EPAs slated for fall 2021. However, due to the effects of the COVID-19 pandemic on Michigan’s schools and the cancellation of the state’s program of standardized testing in the spring of 2020, OPD has delayed EPAs for Cohort 1 Partnership schools until the fall of 2021, meaning that all Partnership schools and districts will be evaluated at the same time. In the case of districts that operated Partnership schools from both cohorts, they will undergo a single EPA that evaluates the progress in all their schools toward their respective 36-month goals.
Formalization of the review of Goal Attainment Process.As noted in our Year One Report and echoed in this year’s, some Partnership district leaders described that, especially early on, they were not entirely clear about how the Office of Partnership Districts (OPD) would evaluate them and experienced changes in this process, sometimes as they were preparing their evaluation materials. They also relayed that this lack of clarity, which they often referred to as “building the plane while flying it,” created stress and frustration for them and their staff. Through the early months of 2019, OPD formalized these processes so that Partnership district leaders better knew how they would be evaluated and could adjust the implementation of their reforms as needed. This process was completed with the release of OPD’s Comprehensive Guide, which outlined the RGA and EPA evaluation procedures along with other elements of the Partnership Model, such as the role of liaisons, 21h funding, and the process of drafting the Partnership Agreement.

EPIC | Education Policy Innovation Collaborative — Michigan State University
45
After 18 months of Partnership implementation, the RGA process provided an opportunity for Partnership districts to showcase their turnaround efforts, as well as the early fruits of those efforts, to stakeholders in the OPD and to receive feedback on their progress. The RGA unfolds in three stages: the collection of evidence, structured conference, and status determination.
Collection of evidence. The collection of evidence takes place over a period of one-and-a-half to two months, during which the district collects and submits evidence related to its progress toward the 18-month benchmarks identified in its Partnership Agreement. These benchmarks can focus on processes, the implementation of systems and/or routines the district identified as central to its turnaround reforms, or outcomes such as student achievement on assessments (locally administered assessments or assessments the State of Michigan requires) and non-academic outcomes such as discipline rates. When drafting its Partnership Agreement, the district has significant latitude over the metrics and levels used to set and measure benchmarks, though at least one must be based on state-required assessments.
Through the collection of evidence, the district assembles data that demonstrate its progress toward those benchmarks. Once that evidence is submitted, the district, its ISD, and OPD review it and complete an “assessment of benchmark attainment,” on which each entity rates the district’s progress toward each of its benchmarks as “not met” or “met,” and submits its assessment to OPD.
Structured conference. The districts host the structured conference portion of the RGA process on site. This conference is attended by at minimum representatives of the district, OPD, and the ISD, though districts are encouraged to also invite the other signatories of its Partnership Agreement such as members of its board and community partners. During the conference itself, a facilitator outlines the purpose and timeline for the meeting and directs participants through the event’s main components, which are a district presentation, collaborative conversation, and review summary. During the district presentation, district representatives present the strategies they have implemented as part of their turnaround efforts along with data that illustrates the improvement(s) they are seeing. During the collaborative conversation, the stakeholders present and discuss the district’s progress toward its 18-month benchmarks, guided by the assessments of benchmark attainment that were completed during the collection of evidence phase. Through this conversation, a final rating for each of the district’s goals is agreed upon.
Status determination. The status determination, the final phase of the RGA, involves using the agreed-upon ratings from the status determination to reach a summative rating of the district’s progress toward its 18-month benchmarks. There are three possible ratings: on-track, off-track with progress, and off-track with limited progress. To earn a rating of on-track, a district must be meeting most of its benchmarks or demonstrate progress toward doing so. A district that meets some of its benchmarks or is making progress toward some of them earns a status of off-track with progress. Finally, a district that meets few of its benchmarks and shows little progress in doing so earns the status of off-track with limited progress. For additional information on these ratings, see page 19 of the Office of Partnership Districts’ Comprehensive Guide.
If a district earns a final status of off-track with progress or off-track with limited progress, it must reconvene another RGA at 24 months. In the interim, it must work to implement strategies to make greater progress toward its 18-month benchmarks. At a 24-month RGA, only the statuses of on-track or off-track can be earned. Districts rated as off-track after a 24-month RGA must share the results of this process with its board and subsequently hold regular community meetings, open to all stakeholders, through the remainder of its Partnership Agreement implementation to discuss progress, strategies, and supports for the identified schools.

Partnership Turnaround: Year Two Report Section Three | October 2020
46
Formalization of the Evaluation of Partnership Agreement.The Evaluation of Partnership Agreement takes place at the end of Partnership district’s 36-month improvement window and represents the culmination of the district’s Partnership Agreement. The EPA process generally parallels that of the RGA in that it is a three-part process that involves the collection and evaluation of evidence, conversation among stakeholders about the district’s progress, and a consequential rating.
Collection and evaluation of evidence. The first of these, called the evidence of goal attainment, involves the district compiling and submitting evidence on its progress toward the 36-month goals included in its Partnership Agreement, which takes place over a period of one-and-a-half to two months. This evidence may address both process and outcome goals, though evidence of improved student outcomes is more heavily emphasized during the EPA process. Once these data are assembled, the Partnership district and OPD evaluate it.
Conversation among stakeholders. The EPA, like the RGA, includes a structured conference that allows stakeholders to collectively review the district’s progress toward its 36-month goals. The structured conference for an EPA unfolds in a similar manner in that it involves a presentation of data from the district and a collaborative conversation afterward. However, this involves all signatories of the district’s Partnership Agreement, including community partners and the board, who may not have participated in the district’s earlier RGA. Following the district’s presentation, the structured conference involves stakeholders collectively evaluating the extent to which each 36-month goal is met.
Rating of progress. The Partnership district’s progress toward each of its goals is next used to assign a final determination. Here, two outcomes are possible. If the district met all, or nearly all, of its outcome goals, successfully implemented its identified improvement strategies, and the index value4 of any identified schools increased from the identification year, the district receives a rating of successful completion, meaning that it is released from Partnership status and its liaison will work with the district on that transition.5 If a district does not successfully complete its Partnership Agreement and at least one of its schools is identified for Comprehensive Support and Improvement,6 then the Next Level of Accountability (NLA) described in its Partnership Agreement is implemented. The district identified this NLA when it created its Partnership Agreement and may include staff replacement, reconstitution, programmatic changes, or even closure.
A Little Bit Like “Building the Plane While Flying It”After three years of implementation, Partnership continues to be an evolving policy. As MDE refined processes and systems to bring greater clarity and organization to the model, Partnership districts needed to adjust — often in real time — to changes the MDE made. This was reflected in ten of the Partnership leaders’ perceptions that the changes MDE made to procedures felt like “building the plane while flying it.” This was the case with critical elements of the Model, including amending the Partnership Agreements and the RGA process.
Almost all Partnership districts amended their Partnership Agreements, and many leaders said they did so to align their goals with the newly established metrics for the RGA process. The leader of Ducks explained that it was disruptive because the district spent considerable time both to initially write their Agreement and later to amend it — time that could have been spent doing the actual work of turnaround:

EPIC | Education Policy Innovation Collaborative — Michigan State University
47
The most important thing that is frustrating is I feel like they’re building the plane while we’re flying it. What was most frustrating to us is to have written that Partnership Agreement. We came up with goals. All of that was approved, and then they decided that that wasn’t how they were going to monitor or measure. All of a sudden, we’re trying to rewrite goals that fit a new scoring system that wasn’t [worked] out in advance.
Other leaders explicitly referenced MDE’s changes to the RGA process, especially those with RGA meetings that fell earlier in the school year, meaning that they had less time to adjust to the new RGA requirements. For instance, the charter leader of Blues shared that the confusion around the new processes made being successful in the RGA process more difficult than it needed to be:
It was stressful from my perspective because they were creating the process while we were going through it and I’m not the kind of person that’s going to be comfortable with a 90 percent. I wanted to know what did I need to do to get over that mark at 100 percent. We didn’t necessarily know that until a couple weeks before the — before the meeting. […] I get they’re building the plane while we’re flying it, but that makes it stressful. I would say, also, that although we met them [the benchmarks] all, it wasn’t without a whole lot of extra hours and effort in proving that we met them.
However, while some leaders expressed frustration with the shifting requirements, others also believed that the changes brought clarity to what had been vague aspects of the policy. Capturing this optimism moving forward, the district leader of Avalanche shared:
It’s kind of like the rules have changed along the way, which, again, is fine because there really weren’t a lot of rules to start. Now that it’s starting to become clearer—if anybody were to come into this now, they’d have much more than we ever had when it started.
The leaders of future Partnership schools and districts may have a different and more streamlined experience because of MDE’s efforts to more clearly outline and document the policies and procedures related to the reform. Bruins amended their Partnership Agreement to include additional goals using multiple measures to reflect MDE’s clarifications regarding how districts would be evaluated on benchmarks at RGA meetings and goals at EPA meetings. The district leader from Bruins appreciated the clarified policies and procedures:
Now, the amendment should help tremendously for the end of it [exiting the Partnership Agreement], but it’s still—I thought some things were good in the business rules, so they—it’s obvious MDE listened to us. That was pretty clear. They are going count a lot of things like you just used the term “local”—the County and the State—they’re going to count those areas too so that they’ll be a part of this final evaluation piece. Everybody has some onus to it.
The leader of Bruins, like the leader of Avalanche, expressed that the new business rules made expectations more explicit and evaluation more transparent for districts. Bruins also appreciated that the rules allowed districts to show growth via multiple measures, rather than only through M-STEP scores. While these seem to be positive changes, they created some confusion and frustration during the process that was reflected in leaders’ comments.

Partnership Turnaround: Year Two Report | October 2020
48
Special Section A:
Awareness and Understanding of the Partnership ModelIn our Year One Report, we showed that in the 2018-19 school year, educators in Partnership districts expressed relatively little understanding or awareness of their Partnership Agreements or of the Partnership Model. This raised questions about how educators could implement the Partnership Model without being aware of its main tenets. To follow up on these questions, we again asked principals and teachers in both Partnership and non-Partnership schools in Partnership districts about their awareness and understanding of the overall model and about its main elements. In what follows, we discuss how Partnership educators’ understanding and awareness of the Model have evolved over time.
CHANGES IN EDUCATORS’ AWARENESS OF PARTNERSHIP AGREEMENTSFigure A1 shows both Partnership and non-Partnership school teachers’ and principals’ reported awareness of three sets of improvement planning documents: Partnership Agreements, School Improvement Plans (SIPs), and District Improvement Plans (DIPs). We compared these three because results from our Year One Report suggested that educators may be more likely to be aware of their SIPs and DIPs than of the Agreements that structure their Partnership goals and activities.
FIGURE A1. Partnership Educators’ Awareness of Different Improvement Plans, 2018-2019 and 2019-2020
0%
40%
100%
20%
60%
School Improvement Plan
2019-2020
District Improvement Plan
Partnership Agreement
2018-2019
District Improvement
Plan
Partnership Agreement
80%
Perc
enta
ge o
f edu
cato
rs w
ho re
port
bei
ng
awar
e of
impr
ovem
ent p
lans
Partnership Principals Non-Partnership Principals
Partnership Teachers Non-Partnership Teachers
School Improvement
Plan
Note: Educators were asked whether they were aware of the Partnership Agreement, School Improvement Plan, and District Improvement Plan. In 2019-20, we asked both principals and teachers about all three plans. In 2018-19, we asked only teachers about their SIPs and only principals about their DIPs.
Special Section A:

EPIC | Education Policy Innovation Collaborative — Michigan State University
49
Three main findings emerged from these analyses. First, we found that principals were more aware of their Partnership Agreements than they were last year, with 92% and 60% of Partnership and non-Partnership school principals, respectively, expressing awareness of their Partnership Agreement, up from 65% and 39% in the 2018-19 school year. Conversely, principals reported far less awareness of their DIP (down from 94% to 68% from 2018-19 for both Partnership and non-Partnership
principals). Second, as we found last year, principals tended to be more aware of most plans than were teachers. We show that teachers were very aware of SIPs, but less aware of district plans, and only marginally aware of their Partnership Agreements. Only 52 percent of Partnership school teachers and 24 percent of non-Partnership school teachers reported being aware of their Partnership Agreement. This was approximately the same as last year. Third, as in 2018-19, Partnership school educators were more aware of their Agreements than were non-Partnership school educators; for both principals and teachers, slightly more than 30% of Partnership school educators, compared to non-Partnership school educators, reported being aware of their district’s Agreement.
PARTNERSHIP EDUCATORS REPORT GREATER UNDERSTANDING OF THEIR AGREEMENTS THAN DO NON-PARTNERSHIP EDUCATORSWe then asked the educators who responded that they were aware of their district’s Partnership Agreement about the extent of their understanding of its central tenets, shown in
Figures A2 and A3. Two findings remained consistent with last year’s results: for both teachers and principals, we found again that Partnership school educators expressed greater understanding of the elements of the Agreements than did non-Partnership school educators, and principals for the most part reported greater understanding than teachers. Notably, when we compared educators’ understanding of Partnership elements across years, we found that principals mostly reported lower levels of understanding of these aspects of Partnership whereas teachers’ understanding increased or remained stable over time.1 Both Partnership principals and teachers expressed the greatest understanding of the reasons their districts were identified for Partnership and the least understanding of the role of various partners in their district’s Partnership work.
Partnership Agreement Awareness:
Principals were more aware of their Partnership Agreements than they were last year, with 92% of Partnership and 60% non-Partnership school principals expressing awareness of their Partnership Agreement, up from 65% and 39% in the 2018-19 school year.
80%
60%
40%
20%
0%
100%
92% Partnership principals are aware of their Partnership Agreement
60% Non-Partnership
principals are aware of their Partnership
Agreement
80%
60%
40%
20%
0%
100%
•vs•
SPECIAL SECTION A: AWARENESS AND UNDERSTANDING OF THE PARTNERSHIP MODEL

Partnership Turnaround: Year Two Report | October 2020
50
FIGURE A2. Principals’ Understanding of Their Partnership Agreements
Partnership Principals Non-Partnership Principals
Increase Since 2018 Decrease Since 2018
Not at All
Moderately Well
Extremely Well
The role of community partners in your Partnership
Agreement
Slightly Very Well
The role of MDE in your Partnership Agreement
The role of the school board in your Partnership
Agreement
The role of the ISD/RESA in your Partnership
Agreement
Consequences of not meeting your
improvement goals
The role of district leadership in your
Partnership Agreement
Strategies to reach your non-academic goals and
benchmarks
Strategies to reach your academic goals and
benchmarks
18−mo. academic benchmarks and 36−
mo. academic goals for improvement
18−mo. non-academic benchmarks and 36−mo.
non-academic goals for improvement
Your role in your Partnership Agreement
Why your district was identified for Partnership
Note: Principals were asked, “How well do you understand the following aspects of your district’s Partnership Agreement?”
SPECIAL SECTION A: AWARENESS AND UNDERSTANDING OF THE PARTNERSHIP MODEL
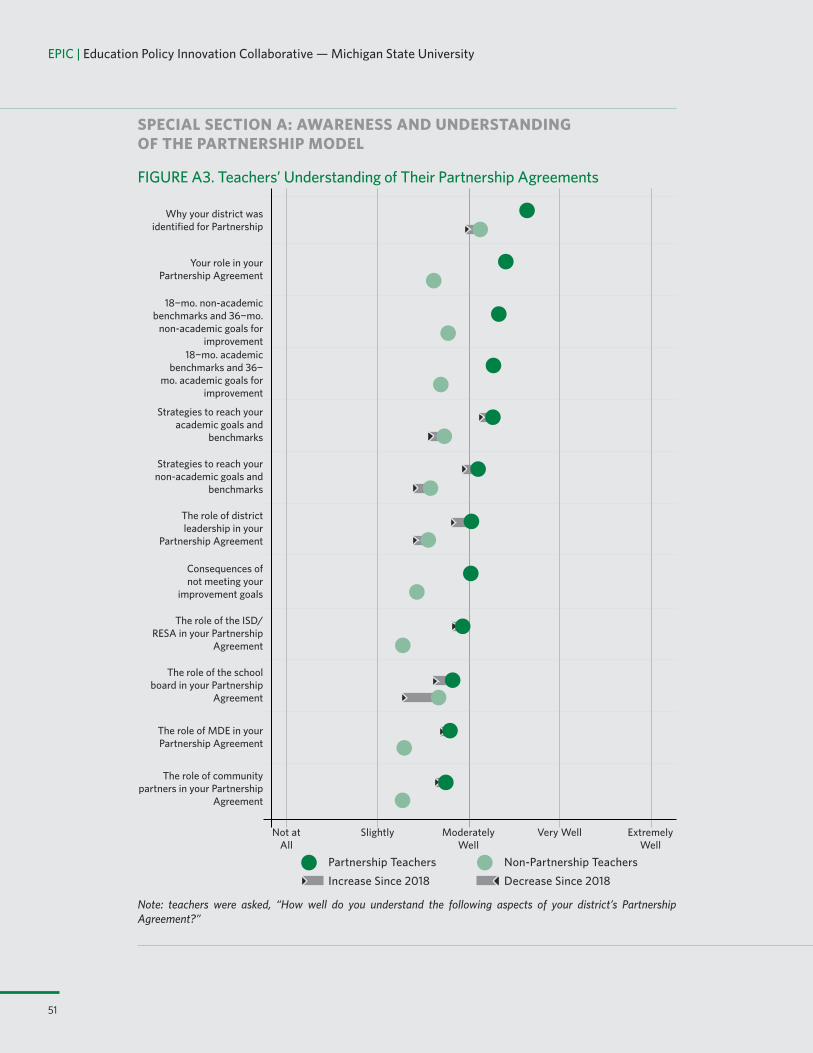
EPIC | Education Policy Innovation Collaborative — Michigan State University
51
FIGURE A3. Teachers’ Understanding of Their Partnership Agreements
Partnership Teachers Non-Partnership TeachersIncrease Since 2018 Decrease Since 2018
Not at All
Moderately Well
Extremely Well
The role of community partners in your Partnership
Agreement
Slightly Very Well
The role of MDE in your Partnership Agreement
The role of the school board in your Partnership
Agreement
The role of the ISD/RESA in your Partnership
Agreement
Consequences of not meeting your
improvement goals
The role of district leadership in your
Partnership Agreement
Strategies to reach your non-academic goals and
benchmarks
Strategies to reach your academic goals and
benchmarks
18−mo. academic benchmarks and 36−
mo. academic goals for improvement
18−mo. non-academic benchmarks and 36−mo.
non-academic goals for improvement
Your role in your Partnership Agreement
Why your district was identified for Partnership
Note: teachers were asked, “How well do you understand the following aspects of your district’s Partnership Agreement?”
SPECIAL SECTION A: AWARENESS AND UNDERSTANDING OF THE PARTNERSHIP MODEL

Partnership Turnaround: Year Two Report | October 2020
52
TEACHERS’ LACK OF UNDERSTANDING AND WHY IT MAY NOT BE A CAUSE FOR CONCERNAlthough the Michigan Department of Education (MDE) encouraged Partnership leaders to involve and incorporate principals and teachers in the planning and implementation of Partnership activities and reforms, survey results still suggested that relatively few teachers were aware of their Partnership Agreement and they expressed lower levels of understanding than principals. However, it is unclear if and why this is problematic. As we discussed in the Year One Report, leaders presented and implemented reforms in different ways; they may not label something as resulting from a specific reform or initiative, but rather discussed the details of the work itself. This happened in cases in which leaders expressly worked to selectively engage with policy demands to strategically inform or enhance their existing organizational goals (described as “bridging,”) or when they linked new demands to pre-existing efforts and goals to use Partnership as a way to achieve their extant efforts (described as “symbolic adoption”) (see Year One Report, page 54).
Given this, a reported lack of awareness or understanding does not necessarily mean that teachers (or principals) were not implementing the reform. Several leaders reflected this in their conversations about Partnership implementation. For instance, the charter leader of Blues told us:
I feel like it would maybe be a bog down to my teachers to have that level of understanding. I just really want them to be able to do the work. We try to connect it back and say, “This is part of our Partnership Agreement or our strategic plans,” but I don’t care if they can quote it.
Similarly, the charter leader of Flames said, “They may call it the school improvement goals as well because we use them interchangeably, but, yes, they should all be aware of them.”
Regardless of what teachers and principals call the Partnership Agreement and its goals and strategies, it is more important that they understand where they are going and how they are trying to get there.
Leaders presented and implemented reforms in different ways; they may not label something as resulting from a specific reform or initiative, but rather discuss details of the work itself.
SPECIAL SECTION A: AWARENESS AND UNDERSTANDING OF THE PARTNERSHIP MODEL

EPIC | Education Policy Innovation Collaborative — Michigan State University
53
SECTION THREE NOTES1. The Regional Assistance Grants program predates the Partnership Model to fund ISDs’ work
with their constituent districts. However, beginning with the 2017-18 school year, a portion of this funding was earmarked to support ISDs’ work with schools identified for Comprehensive Support and Improvement (CSI). Schools can be identified as CSI in two ways: by being in the bottom five percent of schools statewide on Michigan’s School Index System or by being a high school with a graduation rate lower than 67%. Schools identified based on their Index score are then automatically identified for Partnership while high schools identified based on their graduation rate only become Partnership schools if their district is a Partnership district and their district chooses to include them in its Partnership Agreement.
2. See pages 3 to 6 of our Year One Report for additional information on this change.
3. OPD’s Comprehensive Guide can be found here: https://www.michigan.gov/documents/mde/ Final_OPD_Comprehensive_Guide.2019.05.02_654285_7.pdf
4. Michigan’s Academic Index is a composite measure of school performance that compares the performance of schools. The bottom five percent of schools on the Index are identified as Comprehensive Support and Improvement (CSI).
5. If a district operates schools in later Partnership cohorts, then only the school(s) from the relevant cohort are released from Partnership status. The district would then be released from Partnership status once all of its Partnership schools successfully complete their Partnership Agreement.
6. The identified CSI school need not be one of the schools that led to the district’s original Partnership identification.
SUMMARYThis section highlights the ways in which the Partnership Model changed in its third year of implementation — both because of strategic decision-making on the part of MDE and the OPD, and because Partnership districts and schools made grass-roots changes to the model to make it work with their own turnaround goals and activities. For the most part, these shifts in the model — planned and de facto — fit well with districts’ needs and local context. For example, Partnership leaders expressed general satisfaction with liaisons and their clarified role, and Partnership districts and schools relied more on their local ISDs for help meeting Partnership goals. However, there were also notable challenges as Partnership schools and districts worked to adapt to changing expectations and the time it took to meet new requirements.
SPECIAL SECTION A NOTES1. In last year’s survey, we asked all educator respondents about their understanding of the
elements of the Partnership Agreements. However, in 2019-20, we asked only those educators who responded first that they were aware of their Partnership Agreement. This suggests that respondents this year should be more familiar with the reform, and might explain why we see increases in teachers’ reported understanding. It is surprising, therefore, that we find that principals report lower levels of understanding across most elements of the Agreements.
Partnership Turnaround: Year Two Report Section Three | October 2020
54
Partnership Turnaround: Year Two Report
SECTION FOUR:HOW HAS PARTNERSHIP CHANGED EDUCATION?
EPICEducation Policy Innovation Collaborative
EPIC | Education Policy Innovation Collaborative — Michigan State University
55
HOW HAS PARTNERSHIP CHANGED EDUCATION IN PARTNERSHIP SCHOOLS AND DISTRICTS, AND HOW IS THE MODEL BEING IMPLEMENTED?This section addresses two major research questions: 1) How has Partnership changed education in Partnership schools and districts? and 2) How are educators and leaders in Partnership schools and districts implementing the reform as it matures? To address these questions, we relied on four main sources of data and analyses: econometric models that used the state’s longitudinal administrative data to assess the impact of participating in the reform on student and educator outcomes; surveys of teachers and school leaders in both Partnership and non-Partnership schools in Partnership districts; Partnership leader interviews; and data collected from leaders and educators in case study districts. Our intention was to paint a holistic picture of the ways in which Partnership changed education in affected schools and districts — not just whether it affected achievement, but also how educators perceived and implemented the reform.
Section Four: How Has Partnership Changed Education?

Partnership Turnaround: Year Two Report Section Four | October 2020
56
PARTNERSHIP IMPACTS ON STUDENT OUTCOMESUltimately, Partnership schools were identified because their students’ achievement was far below the rest of the state. Though slightly different mechanisms were used to identify each round of Partnership schools (detailed in Section Two of this report), the key criterion used to identify Partnership schools was that their overall performance was far below average, falling into the bottom five percent of schools statewide. Recognizing this, each Partnership Agreement included district and school commitments to improved achievement and, as described in Section Three, Partnership districts and schools are held accountable for these improved outcomes at 18- and 36-month intervals of Partnership Model implementation.
In what follows, we reviewed educators’ perceptions of improvements in student outcomes as well as evidence from our event studies that examined how various student outcomes changed for both Cohort 1 and Cohort 2 students and schools in the Partnership identification year and in the year (Cohort 2) or two years (Cohort 1) that followed. In Michigan during this time, the M-STEP (grades three to seven), the PSAT (grade eight), and the SAT (grade 11) remain the primary accountability exams used to assess individual student, school, and district progress. However, because there are several ways to measure student achievement in addition to test scores that are included in Michigan’s Parent Dashboard, we also considered how Partnership impacted measures of student graduation, drop-out, and retention.
Partnership Principals Are Increasingly Optimistic About Student Outcome ImprovementsBefore delving into the estimated effects of the Partnership Model on student outcomes, we first reviewed Partnership district educators’ beliefs about the likely efficacy of the reform. Educators’ beliefs are often a precursor to estimated impacts, as they are on the ground living the interventions and seeing first-hand how students are responding. We asked principals and teachers in Partnership and non-Partnership schools in Partnership districts about the extent to which they agreed that their Partnership goals would lead to improved student outcomes. Educators in our surveys, and in particular Partnership school principals, expressed optimism that the Partnership Model would positively affect student achievement and school performance.
Figure 4.1 shows responses from both principals (in blue) and teachers (in green) in Partnership schools (darker shaded) and non-Partnership schools (lighter shaded) in Partnership districts. These are taken from surveys administered during the 2019-20 school year and compared to those administered in the 2018-19 school year. The circles show average responses by group in the 2019-20 survey and the black arrows are located at the average response by group in the 2018-19 survey results. For comparison, the arrows indicate the direction of the change over time and the grey bars show the magnitude of the change between years.
Educators expressed optimism that the Partnership Model would positively affect student achievement.

EPIC | Education Policy Innovation Collaborative — Michigan State University
57
FIGURE 4.1. Educators’ Perceptions That Their Schools’ Improvement Goals Will Improve Student Outcomes
Very Unlikely
Neither Likely nor Unlikely
Very Likely
Somewhat Unlikely
Somewhat Likely
Your school’s improvement goals will improve student
outcomes this year
Your schools’ improvement goals will improve student
outcomes over the next three years
Partnership Principals Non-Partnership PrincipalsIncrease Since 2018 Decrease Since 2018
Partnership Teachers Non-Partnership Teachers
Note: Educators were asked, “Please indicate the extent to which you agree or disagree with the following statements about your [Partnership Agreement/school improvement] goals.”
We see that last year, in 2018-19, Partnership and non-Partnership teachers and principals believed, on average, that the likelihood of academic improvement in their schools in the current year or over the next three years due to their improvement goals was somewhere between “neither likely nor unlikely” and “somewhat likely,” with only non-Partnership principals suggesting that three-year improvement was closer to “very likely.” Whereas teachers’ beliefs remained, on average, relatively constant over the two years these questions were asked of them, in 2019-20 principals in non-Partnership schools were less likely to believe that their schools would improve over time as a result of their district being in Partnership. However, principals in Partnership schools exhibited substantially increased optimism about both current-year improvement in 2019-20 relative to 2018-19, and about the likelihood of improvement over the coming three years, on average responding that improvement was well over “somewhat likely” this year and closer to “very likely” over the three-year time span.
Cohort 1 School Students Exhibited Gradual Improvement in Test ScoresThis optimism of Partnership school principals appeared to be at least somewhat aligned with evidence of improvements in academic outcomes shown in our econometric analyses. Figures 4.2 and 4.3 and Tables 4.1, 4.2, and 4.3 provide results from the event study analyses described in Section Two. The numbers in these tables are regression coefficients calculated by estimating the models outlined in Equations 1 and 2 in Section Two, with full results provided in Appendix B. Tables 4.1 and 4.2 provide comparisons between the identification year (2016-17) and the first and second implementation years (2017-18 and 2018-19, respectively) for Cohort 1 relative to the last pre-Partnership year (2015-16) as well as comparisons between the implementation and identification years. Similarly, Table 4.3 provides the same coefficients from our analyses of
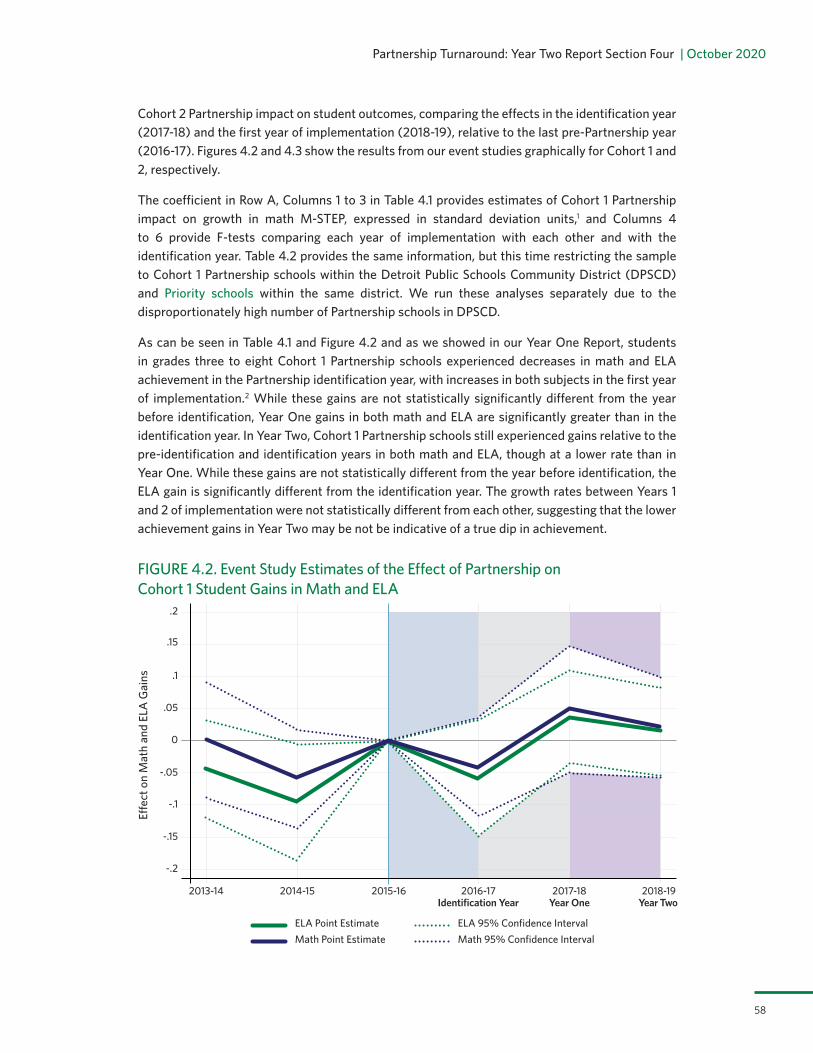
Partnership Turnaround: Year Two Report Section Four | October 2020
58
Cohort 2 Partnership impact on student outcomes, comparing the effects in the identification year (2017-18) and the first year of implementation (2018-19), relative to the last pre-Partnership year (2016-17). Figures 4.2 and 4.3 show the results from our event studies graphically for Cohort 1 and 2, respectively.
The coefficient in Row A, Columns 1 to 3 in Table 4.1 provides estimates of Cohort 1 Partnership impact on growth in math M-STEP, expressed in standard deviation units,1 and Columns 4 to 6 provide F-tests comparing each year of implementation with each other and with the identification year. Table 4.2 provides the same information, but this time restricting the sample to Cohort 1 Partnership schools within the Detroit Public Schools Community District (DPSCD) and Priority schools within the same district. We run these analyses separately due to the disproportionately high number of Partnership schools in DPSCD.
As can be seen in Table 4.1 and Figure 4.2 and as we showed in our Year One Report, students in grades three to eight Cohort 1 Partnership schools experienced decreases in math and ELA achievement in the Partnership identification year, with increases in both subjects in the first year of implementation.2 While these gains are not statistically significantly different from the year before identification, Year One gains in both math and ELA are significantly greater than in the identification year. In Year Two, Cohort 1 Partnership schools still experienced gains relative to the pre-identification and identification years in both math and ELA, though at a lower rate than in Year One. While these gains are not statistically different from the year before identification, the ELA gain is significantly different from the identification year. The growth rates between Years 1 and 2 of implementation were not statistically different from each other, suggesting that the lower achievement gains in Year Two may be not be indicative of a true dip in achievement.
FIGURE 4.2. Event Study Estimates of the Effect of Partnership on Cohort 1 Student Gains in Math and ELA
Effe
ct o
n M
ath
and
ELA
Gai
ns
-.2
-.15
-.1
-.05
0
.05
.1
.15
.2
2013-14 2014-15 2015-16 2016-17 2017-18 2018-19
ELA Point EstimateMath Point Estimate
ELA 95% Confidence IntervalMath 95% Confidence Interval
Identification Year Year One Year Two

EPIC | Education Policy Innovation Collaborative — Michigan State University
59
TABLE 4.1. Partnership Effects on Cohort 1 Student Outcomes (Partnership Compared With Cohort 1 Comparison Schools)
Identification on
(2016-2017)
Year One Implementation
(2017-2018)
Year Two Implementation
(2018-2019)
Implementation on Year One
vs. Identification
Implementation on Year Two
vs. Identification
Implementation on Year One vs. Implementation
Year Two
(1) (2) (3) (4) (5) (6)
A. Math 3-8 Achievement (Gains)
-0.04(0.04)
0.05(0.05)
0.02(0.04) +
B. ELA 3-8 Achievement (Gains)
-0.06(0.05)
0.04(0.04)
0.02(0.03) * +
C. Math SAT Scores 0.02(0.05)
0.02(0.07)
0.01(0.08)
D. ELA SAT scores 0.03(0.06)
0.08(0.06)
0.12(0.07) +
E. On-Time High School Graduation
-0.01(0.04)
0.03(0.06)
0.04(0.06)
F. High School Drop- Out Rates
-0.01(0.03)
-0.03(0.05)
-0.02(0.04)
G. Grade Retention 0.00(0.00)
-0.00(0.01)
0.01(0.00) +
p<.10 +, p<.05 *, p<.01 **, p<.001 ***
Note: Cells contain coefficients from full models with standard errors in parentheses. Full models included the covariates described in Section Two. Models contained year indicators, year x treatment indicators, time-variant student characteristics (economic disadvantaged status, disability status, English Learner status, grade level), school-level student demographics, and student fixed effects for models shown in rows A, B, and G. Models in rows C, D, E, and F included school fixed effects rather than student fixed effects, with robust standard errors clustered by school. See Appendix B or full model results and additional robustness checks and sample restrictions. Columns 4 to 6 showed results from F-tests and denoted whether the coefficients in Columns 1 to 3 were significantly different from the identification year (Columns 4 and 5) and implementation year (Column 6). A blank cell indicates that the coefficients are not statistically different. A cell with “+” or “*” indicates that the coefficients are significantly different at the significance level specified by the symbol.
Table 4.1 also shows that ELA SAT scores increased in Cohort 1 Partnership schools in the first two years of implementation, though these increases were not statistically significant. In this case, we did not see dips in the identification year, and we saw sustained achievement outcomes over time in ELA, although these were not statistically significant relative to the year before identification. Relative to the identification year, Cohort 1 Partnership schools increased ELA SAT scores by 11% of a standard deviation in the second year of implementation, as shown in Appendix B.
With analyses like these, researchers often worry that other factors are occurring at the same time as a particular reform, and that the results we observed are driven by those factors instead of the reform we are considering. In this case, for example, 2017-2018 also coincided with the arrival of Dr. Nikolai Vitti as the superintendent of the Detroit Public Schools Community District (DPSCD), so a comparison of DPSCD schools to other schools in the state could be affected by other changes the new superintendent made. However, focusing on the within-DPSCD results allowed us to hold constant district-wide reforms and policies because comparison schools were also exposed to any of these factors, and instead estimate differences due specifically to Partnership. In addition, given the size and importance of DPSCD in the state and in the Partnership Model itself, examining

Partnership Turnaround: Year Two Report Section Four | October 2020
60
DPSCD on its own held substantive interest. Table 4.2 shows our results for DPSCD Cohort 1 Partnership schools relative to comparison DPSCD schools.
TABLE 4.2. Partnership Effects on Cohort 1 Students Outcomes DPSCD (Partnership Compared With Cohort 1 Comparison Schools)
Identification on
(2016-2017)
Year One Implementation
(2017-2018)
Year Two Implementation
(2018-2019)
Implementation on Year One
vs. Identification
Implementation on YearTwo
vs. Identification
Implementation on Year One vs. Implementation
Year Two
(1) (2) (3) (4) (5) (6)
A. Math 3-8 Achievement (Gains)
-0.07(0.06)
0.06(0.09)
0.06(0.06)
B. ELA 3-8 Achievement (Gains)
-0.11(0.07)
0.05(0.08)
0.03(0.06) + +
C. Math SAT Scores 0.04(0.04)
0.06(0.09)
0.09*(0.03)
D. ELA SAT scores -0.07(0.04)
-0.00(0.11)
0.08(0.06) *
E. On-Time High School Graduation
-0.07(0.04)
0.05(0.09)
0.16*(0.05) ***
F. High School Drop-Out Rates
0.01(0.03)
-0.16**(0.04)
-0.12+(0.06) ** *
G. Grade Retention 0.00(0.01)
-0.01(0.01)
-0.00(0.01) * *
p<.10 +, p<.05 *, p<.01 **, p<.001 ***
Note: Cells contain coefficients from full models with standard errors in parentheses. Full models included the covariates described in Section Two. Models contained year indicators, year x treatment indicators, time-variant student characteristics (economic disadvantaged status, disability status, English Learner status, grade level), school-level student demographics, and student fixed effects for models shown in rows A, B, and G. Models in rows C, D, E, and F included school fixed effects rather than student fixed effects, with robust standard errors clustered by school. See Appendix B for full model results and additional robustness checks and sample restrictions. Columns 4 to 6 showed results from F-tests and denoted whether the coefficients in Column 1 to 3 were significantly different from the identification year (Columns 4 and 5) and implementation year (Column 6). A blank cell indicates that the coefficients were not statistically different. A cell with “+” or “*” indicated that the coefficients were significantly different at the significance level specified by the symbol.
In DPSCD, Cohort 1 third through eighth grade students also experienced decreases in both math and ELA achievement in the identification year, with a positive rebound in the first and second years of Partnership implementation. Although again, these coefficients are not statistically significant when compared to the year before identification. As we showed in our Year One Report, DPSCD Partnership schools’ ELA gains in the first implementation year are significantly greater (and quite large) relative to the identification year. These ELA gains continued in the second year of implementation. DPSCD’s second-year math gain was also significantly positive (and again quite large) relative to the identification year.
Similar to the rest of Michigan’s Cohort 1 Partnership schools, there was no identification year dip in math SAT scores for DPSCD students and there were consistent and increasing improvements in math SAT scores over both years of the intervention that were significant in the second year

EPIC | Education Policy Innovation Collaborative — Michigan State University
61
of implementation. It is important to note, however, that math SAT scores had been improving in DPSCD Partnership schools relative to other Priority schools before the reform implementation. This trend suggests that it may not have been the Partnership Model driving the gains in math SAT as much as the trajectory of improvement that existed before the reform. ELA SAT scores dropped in the identification year in DPSCD. However, by Year Two of implementation ELA SAT scores had significantly rebounded above the initial year dip.
Cohort 2 Schools Fared Similarly to Their Comparison Group Peers in the First Year of Partnership ImplementationThe results for Cohort 2 student achievement gains were not quite as positive as for Cohort 1. On average, Cohort 2 schools and students did not perform differently in the first year of Partnership than their peers in comparison schools. Descriptively, Figure 4.3 and Columns A and B in
Table 4.3 show that, relative to students in comparison schools, Partnership school students in grades three through eight experienced an achievement dip in the identification year followed by positive grades three through eight math achievement gains in the first implementation year, though these differences were not statistically significant. These patterns were not substantially different in DPSCD.
FIGURE 4.3. Event Study Estimates of the Effect of Partnership on Cohort 2 Student Gains in Math and ELA
Effe
ct o
n M
ath
and
ELA
Gai
ns
-.2
-.15
-.1
-.05
0
.05
.1
.15
.2
2013-14 2014-15 2015-16 2016-17 2017-18 2018-19
ELA Point EstimateMath Point Estimate
ELA 95% Confidence IntervalMath 95% Confidence Interval
Identification Year Year One
Cohort 1 students improved in both math and ELA M-STEP achievement.

Partnership Turnaround: Year Two Report Section Four | October 2020
62
While students in Cohort 2 schools, on average, performed similarly to students in comparison schools on the math and ELA SAT relative to the year prior to identification, Cohort 2 high schools in DPSCD did appear to fare better than in pre-Partnership years. Cohort 2 DPSCD Partnership school student math SAT scores improved by a large and significant amount relative to the identification year, as shown in Appendix B.
TABLE 4.3. Partnership Effects on Cohort 2 Student Outcomes (Partnership Compared With Cohort 2 Comparison Schools)
Identification on
(2017-2018)
Year One Implementation
(2018-2019)
Implementation on Year One
vs. Identification
Identification on
(2017-2018)
Year One Implementation
(2018-2019)
Implementation on Year One
vs. Identification
(1) (2) (3) (4) (5) (6)
Cohort 2 Partnership Schools Compared to CSI Cohort 2 Comparison
DPSCD Cohort 2 Partnership Schools Compared to DPSCD CSI Cohort 2 Comparison
A. Math 3-8 Achievement (Gains)
-0.04(0.04)
0.01(0.03)
-0.02 (0.05)
0.04(0.06)
B. ELA 3-8 Achievement (Gains)
-0.03(0.04)
-0.01(0.03)
0.03(0.04)
0.01(0.04)
C. Math SAT Scores 0.04(0.05)
-0.03(0.06)
-0.12(0.07)
0.06(0.13) +
D. ELA SAT scores 0.07(0.05)
-0.02(0.06) + 0.08
(0.08)0.07
(0.04)
E. On-Time High School Graduation
0.00(0.02)
-0.02(0.04)
0.02(0.04)
0.07(0.06)
F. High School Drop- Out Rates
0.03(0.03)
-0.02(0.04)
0.00(0.09)
0.01(0.07)
G. Grade Retention 0.00(0.00)
0.00(0.00)
-0.00(0.00)
0.00(0.00)
p<.10 +, p<.05 *, p<.01 **, p<.001 ***
Note: Cells contain coefficients from full models with standard errors in parentheses. Full models included the covariates described in Section Two. Models contain year indicators, year x treatment indicators, time-variant student characteristics (economic disadvantaged status, disability status, English Learner status, grade level), school-level student demographics, and student fixed effects for models shown in rows A, B, and G. Models in rows C, D, E, and F included school fixed effects rather than student fixed effects, with robust standard errors clustered by school. See Appendix B for full model results and additional robustness checks and sample restrictions. Columns 4 to 6 show results from F-tests that compared coefficients from given years against each other to test for significant differences over time. Columns 3 and 6 show results from F-tests and denote whether the coefficients in Columns 2 and 5 were significantly different from the identification year (Columns 1 and 4). A cell with “+” or “*” indicates that the coefficients are significantly different at the significance level specified by the symbol.
Cohort 1 Students in DPCSD Partnership Schools Had Higher On-Time Graduation Rates and Lower Drop-Out RatesWhile achievement scores were important, they were not the only way to assess the efficacy of an educational intervention. Of particular interest in turnaround reforms is the effect of the reform on on-time high school graduation and drop-out rates and grade retention. Rows E, F,

EPIC | Education Policy Innovation Collaborative — Michigan State University
63
and G in Tables 4.1 and 4.2 show the results for these outcomes for Cohort 1 Partnership school students relative to comparison students. We found no effect on any of the outcomes for Cohort 1 high school students (rows E and F) or students overall (row G) relative to the year before identification. There was a substantively small but statistically significant decrease in grade retention in the first year of implementation for Cohort 1 Partnership schools relative to the identification year that was followed by a small uptick the second year.
In DPSCD, we found compelling evidence that Cohort 1 Partnership, relative to Priority, schools saw large improvements in on-time graduation rates across both years of implementation, and especially large and significant improvements in the second year of implementation, as well as large and significant decreases in high school drop-out rates in both years. However, these results were not replicated by Cohort 2 Partnership schools in DPSCD. When we examined drop-out and on-time graduation rates in the overall sample and in DPSCD, we did not find evidence of any impact of Partnership on these outcomes.
An important consideration when evaluating the efficacy of turnaround or any school or district improvement effort is the critical element of time. School and district improvement takes time — some research suggests that comprehensive school reform can be a seven-year process and that establishing the school-level infrastructure needed to sustain improvements can take even longer (Borman, Hewes, Overman, & Brown, 2003; Peurach & Neumerski, 2015). In the case of the Partnership Model, positive effects for on-time high school completion for Cohort 1 did not emerge until the second year of implementation, suggesting that improvement related to this longer-term outcome may take more than a year to materialize.
Interpreting the Effects of Partnership on Student Achievement Because it is hard to interpret the magnitude and significance of the effects of Partnership on student math and ELA achievement shown above, we placed the effect sizes from our models along a continuum of other similar school and district turnaround reforms studied across the country. In this section, to be comparable to other studies and to capture the impacts of Partnership on student achievement in the first and second years of the reform relative to the year in which they were identified, we based our comparison estimates on coefficients from models shown in Appendix B, which used the identification year as the reference year.
Figure 4.4 shows the second-year effects of Cohort 1 Partnership on math and ELA achievement relative to other studies of similar interventions. It shows that the second-year effects were similar to those in the turnaround study using the most analogous estimation strategy — specifically, an evaluation of School Improvement Grant interventions in San Francisco Unified School District found insignificant effects of turnaround implementation on students’ math achievement in the second year of the intervention and a .09 SD increase in ELA achievement (Sun, Penner, & Loeb, 2017). Studies of other turnaround initiatives found larger effects — as high as .35 in math and .27 in ELA (in Massachusetts and Tennessee, respectively), though these in some cases used less

Partnership Turnaround: Year Two Report Section Four | October 2020
64
conservative identification strategies. In Massachusetts, a statewide turnaround intervention produced large positive effects of .19 in math and .17 in ELA achievement in the second year of the intervention (Papay & Hannon, 2018), while a state takeover of a school district also yielded large second-year effects of .30 in math and .10 in reading (Schueler, Goodman, & Deming, 2017).
While the estimated second-year effects were smaller than those in Massachusetts, Tennessee’s local Innovation Zones, and Ohio’s SIGs (Carlson & Lavertu 2018; Papay & Hannon, 2018; Zimmer, Henry, & Kho, 2017), the continued growth into the second year of reforms (for Cohort 1) placed the Partnership Model ahead of many other turnaround interventions that yielded null or even negative effects in Rhode Island, Michigan (Priority Schools), North Carolina, the Los Angeles Unified School District, and Tennessee (state-run Achievement School District schools) (Dougherty & Weiner, 2019; Hemelt & Jacob, 2017; Henry & Harbatkin, 2019a; Strunk, Marsh, Hashim, Bush-Mecenas, & Weinstein, 2016; Zimmer, Henry, & Kho, 2017).
The Year One effects for Cohort 2 (shown in Figure 4.5) were somewhat smaller than the first-year effects of SIG in San Francisco, where achievement increased significantly by .11 in math and .06 in ELA. However, Cohort 2 schools fared near the middle of the distribution of effect sizes for other turnaround interventions. First-year math effects of other interventions have ranged from -.50 in Tennessee’s Achievement School District to .20 in Massachusetts’ takeover of Lawrence Public Schools (Schueler, Goodman, & Deming, 2017; Zimmer, Henry, & Kho, 2017). First-year ELA effects ranged from -.17 in Rhode Island No Child Left Behind waiver Focus reforms (Schueler, Goodman, & Deming, 2017) to .18 in Tennessee’s iZones (Zimmer, Henry, & Kho, 2017).
A NOTE ON EFFECT SIZE INTERPRETATION.
To interpret how “large” an effect size is, we drew on Kraft’s (2020) schema of suggested effect size interpretations. In this framework, effect sizes with an absolute value between 0 and .05 are considered “small” while effect sizes with absolute values of .05 up to .2 and .2 or greater are considered “medium” and “large,” respectively.
An important consideration in the evaluation of the Partnership Model is the critical element of time. Some research suggests that comprehensive school reform can be a seven-year process or longer.
64

EPIC | Education Policy Innovation Collaborative — Michigan State University
65
FIGURE 4.4. Year One Effect Size Interpretation
ELA SCORES
Medium
Large Large
Small Small
-.20
0-.05
.20
.05
Medium
POSITIVENEGATIVE
*Cohort 2, Yr. 1 - Tennessee's iZone3
*Cohort 1, Yr. 1 - Tennessee's iZone3
*Partnership Schools Cohort 1
*Cohort 2, Yr. 1 - L.A.'s Public School Choice Initiative4
Michigan’s SIG Schools1Partnership Schools Cohort 2Cohort 1, Yr. 1 - L.A.'s Public
School Choice Initiative4
School Closure in Michigan2
Cohort 2, Yr. 1 -Tennessee's Achievement School District3
MATH SCORES
*Cohort 2, Yr. 1 - Tennessee's Achievement School District3
*School Closure in Michigan2
*Cohort 2, Yr. 1 - Tennessee's iZone3
*Cohort 1, Yr. 1 - Tennessee's iZone3
*Partnership Schools Cohort 1
Partnership Schools Cohort 2
Cohort 1, Yr. 1 - Tennessee's Achievement School District3
Cohort 2, Yr. 1 - L.A.'s Public School Choice Initiative4
Cohort 1, Yr. 1 - L.A.'s Public School Choice Initiative4
Michigan's SIG Schools1
Medium
Large Large
Small Small
-.20
0-.05
.20
.05
Medium
POSITIVENEGATIVE
Cohort 1, Yr. 1 - Tennessee's Achievement School District3
*Estimated effect was statistically significant
*Estimated effect was statistically significant
Source: 1Rice, Bojorquez, Diaz, Wendt & Nakamoto (2014); 2Brummet (2014); 3Zimmer, Henry & Kho (2017); 4Strunk, Marsh, Hashim, Bush-Mecenas & Weinstein (2016)Note: The effects shown reflect the change in achievement from the identification year to the relevant implementation year of outcomes. For simplicity, whether or not estimates are significant is denoted with a single asterisk regardless of level of significance. To allow for more straightforward comparison across studies, the coefficients for the Partnership estimates are from the models using the identification year as the reference year. These results are shown in column 4 of appendix tables B-1 (math) and B-2 (ELA) for Cohort 1 (row Partnership school 2017-18), and B-10 and B-11 for Cohort 2 (row Partnership school 2018-19).

Partnership Turnaround: Year Two Report Section Four | October 2020
66
FIGURE 4.5. Year Two Effect Size Interpretation
ELA SCORES
Medium
Large Large
Small Small
-.20
0-.05
.20
.05
Medium
POSITIVENEGATIVE
*Cohort 1, Yr. 2 - Tennessee's iZone3
*Partnership Schools Cohort 1
Michigan’s SIG Schools1
Cohort 1, Yr. 2 - L.A.'s Public School Choice Initiative4
School Closure in Michigan2
MATH SCORES
School Closure in Michigan2 *Cohort 1, Yr. 2 -
Tennessee's iZone3
Partnership Schools Cohort 1
Cohort 1, Yr. 2 - Tennessee's Achievement School District3
Cohort 1, Yr. 2 - L.A.'s Public School Choice Initiative4
Michigan's SIG Schools1
Medium
Large Large
Small Small
-.20
0-.05
.20
.05
Medium
POSITIVENEGATIVE
Cohort 1, Yr.2 - Tennessee's Achievement School District3
*Estimated effect was statistically significant
*Estimated effect was statistically significant
Source: 1Rice, Bojorquez, Diaz, Wendt & Nakamoto (2014); 2Brummet (2014); 3Zimmer, Henry & Kho (2017); 4Strunk, Marsh, Hashim, Bush-Mecenas & Weinstein (2016)
Note: The effects shown reflect the change in achievement from the identification year to the relevant implementation year of outcomes. For simplicity, whether or not estimates are significant is denoted with a single asterisk regardless of level of significance. To allow for more straightforward comparison across studies, the coefficients for the Partnership estimates are from the models using the identification year as the reference year. These results are shown in column 4 of appendix tables B-1 (math) and B-2 (ELA) (row Partnership school 2018-19). While Partnership schools fared descriptively better than turnaround schools in this subset of interventions, the ELA effect size was qualitatively similar to other interventions with small-to-medium effects, and the math estimate was not significantly different from zero.

EPIC | Education Policy Innovation Collaborative — Michigan State University
67
PARTNERSHIP MODEL IMPLEMENTATION AND HOW EDUCATORS PERCEIVE ITS BENEFITSThe results detailed above suggest that the Partnership Model and especially the first cohort have been moderately successful in improving student achievement in Partnership schools relative to similar schools not treated by the reform. In what follows, we dive further into the data from our educator surveys, Partnership leader interviews, and case studies to highlight some of the ways education changed in schools and districts because of the Partnership Model. In particular, we discuss evidence of improvements in the implementation of the Partnership Model, including the role of the planning and goal-setting process with a focus on several central components of school reform: core instructional supports, data use to guide improvement, teacher supports, whole-child initiatives, family and community engagement,
and school and district culture and climate. We also provide evidence that educators were growing more positive in their perceptions of the reform and their ability to implement it in ways that are beneficial to their schools and districts.
Partnership Facilitates Improvement by Offering a Strategic Planning FrameworkCongruent with the literature that highlights the importance of strategic planning for successful school and district turnaround (e.g., Henry & Harbatkin, 2019a; Strunk, Marsh, Bush-Mecenas, & Duque, 2016; Sun, Liu, Zhu, & LeClair, 2019; Sun, Penner, & Loeb, 2017), we
found that the Partnership Model’s focus on building a strategic and coherent framework for turnaround helped many — at least 13 — Partnership leaders to focus and align their efforts and goals. This aspect of the Partnership structure was most helpful for districts and schools that did not already have strong, coherent strategic plans in place.
Partnership leaders provided several reasons why the Partnership Model’s reliance on a strategic framework helped them to build capacity to deliver high quality instruction. In particular, many explained that the Partnership Model helped them to identify the most important efforts and goals to pursue, focus their efforts in a more targeted manner, and refine their processes in collaboration with various stakeholders.
The Partnership Model and especially the first cohort have been moderately successful in improving student achievement.

Partnership Turnaround: Year Two Report | October 2020
68
Special Section B:
Bridging and BufferingDISTRICTS CONTINUE TO SHOW VARIATION IN RESPONSES TO THE PARTNERSHIP MODELIn our Year One Report, we applied Honig & Hatch’s (2004) conceptualization of crafting coherence to categorize and understand the variation in district leaders’ responses to the Partnership Model. According to this theory, district and school leadership respond to new reforms along a scale from bridging to buffering. Bridging includes district efforts to pull in outside entities and engage proactively to new initiatives as part of their response to external demands or a new policy. Buffering refers to activities intended to disengage from the reform or minimize engagement, such as turning down funding or minimizing the number of meetings related to Partnership. In our Year One Report analysis, we labeled hybrid bridging-buffering responses that fell somewhere between these categories as symbolic adoption. These responses included continuing to work with previously established strategic plans (e.g. largely doing what they were already going to do anyway to meet Partnership goals) or creating separate offices or positions to manage Partnership work. One category of response is not inherently better than others. Rather, the coherence of the response depends on the context. Our intent is to describe differing ways that districts worked within the parameters and intent of Partnership to best fit their unique district needs.
As in our Year One Report, our analysis of the district leader interviews included deductive codes that characterize leader responses as bridging, buffering, or symbolic adoption. After an initial round of coding, we grouped these codes by type of response and interview, then counted to see how many times a particular response was mentioned. Then, based on the number of examples of each code category, an analytic and holistic reading of each interview, and our interpretation of the overall orientation of the district, we identified districts as having primarily bridging, bridging with symbolic adoption, primarily symbolic adoption, symbolic adoption with some buffering, or a blend of all three categories of responses (Figure B1).
As in our Year One Report, there continues to be variation in how districts respond to the reform. In the 2019-20 school year, nine out of 22 districts had a bridging or bridging/symbolic adoption response, and nine out of 22 districts had a symbolic adoption or buffer/symbolic adoption response. Four of the districts had a more blended response, incorporating a balance of bridging and buffering activities. This speaks to the importance of the flexibility and local nature of this reform, as different districts approached this work in distinct ways. Regardless of their response to the reform, all schools and districts had active turnaround initiatives and a sense of urgency to meet their Partnership goals.
Special Section B:

EPIC | Education Policy Innovation Collaborative — Michigan State University
69
FIGURE B1. Visualization of Districts’ Year Two Bridging and Buffering Responses
White Pseudonym – Charter School/DistrictBlack Pseudonym – Traditional Public Schools
FlyersSenators
AvalancheAvalancheCapitalsCapitalsDevilsDevils
Red WingsRed WingsBlues
PredatorsBlue JacketsBlue Jackets
StarsStars
SYMBOLIC ADOPTION
BUFFERINGBRIDGING
Maple LeafsSabres
WildBruinsBruins
FlamesHurricanesLightning
OilersBlack HawksBlack Hawks
RangersDucksDucks
IslandersIslanders
BridgingIn 2019-20, we found more evidence of bridging responses. Many bridging responses included incorporating new curricula and social-emotional initiatives, supported by increased professional development and instructional coaching. These initiatives often incorporated what Honig & Hatch (2004) refer to as “pull in” activities, or activities where outside entities are engaged in the work. Typically, districts “pulled in” MDE liaisons, the local ISD, and in the case of charter districts, authorizers and Educational Service Providers (ESP). Outside partners frequently provided technical supports such as professional development or assistance with curricular resources. Overall, more charter districts were engaged in bridging activities, which seems to be a product of governance as well as size (see Special Section C).
Symbolic AdoptionSymbolic adoption (hybrid bridging-buffering activities) were common in almost every district. One frequent manifestation of this response included amending Partnership Agreements to reflect activities already in progress. This seems to be primarily a response to the guidelines provided by
SPECIAL SECTION B: BRIDGING AND BUFFERING

Partnership Turnaround: Year Two Report | October 2020
70
OPD for the Review of Goal Attainment (RGA) process; districts amended goals to make sure that they received credit for “process” and “local” goals they were working towards that may not have been explicitly outlined in their original Partnership Agreements. For example, the charter leader of Sabres shared, “Some of the process goals we were absolutely already doing, so that allowed us, again, to get credit for some of the — like the school-wide positive behavior, intervention, and support work that was already being done.” This revision of Partnership Agreements seemed to allow districts and schools to adapt their plans and goals to be more feasible or clear or to fit with existing initiatives and activities. Additionally, as the Sabres leader put it, districts viewed these changes as ways to give them “credit” for actions that were underway regarding their processes and procedures.
Districts also symbolically adopted demands of the reform by aligning district improvement goals with Partnership goals and creating positions or offices to help coordinate Partnership work. Aligning goals allowed districts to narrow the scope and increase the focus on key initiatives. As the charter leader of Oilers said, “Oh, we’ve aligned everything,” highlighting how one district used one set of goals for all their improvement efforts. In some cases, districts used previously written goals or initiatives for their turnaround work.
Similarly, some districts found it helpful to hire a Partnership coordinator to facilitate the implementation of their Partnership Agreements. Five districts mentioned dedicating a particular role or office to at least some of the Partnership or turnaround work to help facilitate activities and lighten the management load. In Stars, the district leader we spoke to was not the superintendent but had taken the lead on coordinating Partnership work. The leader felt strongly that it would be difficult to effectively manage the Partnership work without someone other than the superintendent to lead and track it:
If you do it right, you have to have a designated person. It consumed a lot of what I do, and I have a very broad brush in my job. I don’t think anyone really realizes how much time you invest in the connecting. […] You got to have someone who can really have a comprehensive oversight of this and have some leverage to do that.
While both aligning goals and assigning Partnership coordination to a specific person may in some ways decentralize or compartmentalize the work, in other ways these tactics allowed districts to effectively manage the increased workload associated with implementing and complying with the Partnership Model. These districts seemed to use symbolic adoption tactics to manage time and other human resources to strategically engage in turnaround work, rather than to minimize engagement.
BufferingThose districts that engaged in buffering activities tried to be discerning about which initiatives fit the district’s needs well and the district had the capacity to implement. The MI Excel Blueprint program was a common example of a program some districts used to guide much of their turnaround work while others strategically chose not to use this technical resource. Those that did not use the
SPECIAL SECTION B: BRIDGING AND BUFFERING

EPIC | Education Policy Innovation Collaborative — Michigan State University
71
Blueprint model typically saw it as duplicating other efforts already in place or believed it was beyond the district’s most immediate focus and would therefore divert capacity away from other initiatives. Other districts buffered by minimizing meetings or electing to not implement some suggestions from their MDE liaison.
Not all districts’ responses remained consistent over time.We interviewed 16 districts in both the 2018-19 and 2019-20 school years. Of those, Table B1 shows that nine had similar bridging/buffering responses from one year to the next while seven had responses that shifted among our categorization. If a district was characterized as one response (e.g., bridging) in the first year, it was no more likely than chance to continue in that response this year.
TABLE B1. Change in Bridging/Buffering Characterization from 2018-2019 to 2019-2020
District 2018-2019 Category 2019-2020 Category
Black Hawks (TPS) Bridging
Flames (Charter) Bridging
Oilers (Charter) Bridging
Blue Jackets (TPS) Bridging/Symbolic Adoption
Blues (Charter) Bridging/Symbolic Adoption
Capitals (TPS) Symbolic Adoption
Devils (TPS) Symbolic Adoption
Avalanche (TPS) Symbolic Adoption
Ducks (TPS) Buffer/Symbolic Adoption
MOVED TOWARDS BRIDGING
Hurricanes (Charter) Bridging/Symbolic Adoption Bridging
Bruins (TPS) Symbolic Adoption Blend (all 3)
Flyers (TPS) Buffer/Symbolic Adoption Symbolic Adoption
MOVED TOWARDS BUFFERING
Sabres (Charter) Bridging Blend (all 3)
Red Wings (TPS) Bridging/Symbolic Adoption Symbolic Adoption
Senators (Charter) Bridging Symbolic Adoption
Islanders (TPS) Symbolic Adoption Buffer/Symbolic Adoption
Similar Responses Over TimeThe nine organizations that continued to have a similar bridging/buffering response were those that have continued to coordinate several reform initiatives or those that continued to use either Blueprint or a previous strategic plan to guide their work. Six of these nine districts referenced aligning their strategic goals with Partnership goals, which suggests that those schools or districts that focus on one plan for their turnaround work (be it originating with or before their Partnership Agreement) felt comfortable continuing to focus on that plan. As Flames’ charter leader shared:
SPECIAL SECTION B: BRIDGING AND BUFFERING

Partnership Turnaround: Year Two Report | October 2020
72
SPECIAL SECTION B: BRIDGING AND BUFFERING
I’ve really tried to pull everything together so that it’s not constantly different initiatives, different language, different focus, different priorities but really try to pull it together. […] I try to put it under one umbrella, so it’s not different initiatives all over the place.
Leaders tried to align turnaround activities and refine priorities to focus on high-impact initiatives and manage the scope of their work.
Increased BridgingThree Partnership leaders seemed to increase their amount of bridging. These three districts vary in size, governance structure, cohort, and 2018-19 response category, suggesting that these characteristics may not explain why these districts increased bridging activities. However, these districts were similar in that their leaders discussed more initiatives in detail and fewer efforts to buffer against compliance activities compared to the previous year. Interviews suggested that this might stem from feeling they had more support from MDE in the 2019-20 school year than in previous years. For example, in 2018-19, the leader of Hurricanes indicated that writing the initial plan was “a bit off-putting because there was not a lot of support with the development of the plan.” However, as the reform had progressed, She/he grew to appreciate the guidance of the MDE liaison and felt better able to tailor reform requirements to fit his/her district needs:
What I will say is I think that that’s [the suggestions from MDE] been the most beneficial thing about this process […] [T]heir offerings and what they’ve exposed us to has been tailored to us and our specific needs. There really hasn’t been anything that they’ve brought to us that we haven’t taken advantage of. Because it has been uniquely tied to what our needs are.
Similarly, Flyers amended their agreement to reflect feedback from their liaison. These examples point to how feedback from liaisons was useful.
Additionally, now that these districts implemented some initiatives, they saw some success that they attributed to their Partnership work. For example, one success that the district leader of Bruins shared was that “summer slide” in student academic achievement was reduced in their Partnership school(s). The leader attributed this to a change in the school’s academic calendar, which the district was able to implement by leveraging the label of Partnership to indicate the urgency for change. Likewise, the leader of Flyers’ shared how embracing the Partnership Model pushed them to implement changes strategically, saying, “I think [Partnership] both streamlined our focus as well as put the urgency behind it in a slightly different way,” and she/he noted that 21h funds had been particularly helpful to his/her turnaround efforts:
In terms of 21h, it has definitely been a resource that has allowed us to move forward with some strategies that again, we’ve had our sights set on, but didn’t have necessarily a way to make it come to fruition because there just wasn’t funding available behind it in the school’s budget.

EPIC | Education Policy Innovation Collaborative — Michigan State University
73
SPECIAL SECTION B: BRIDGING AND BUFFERING
For this district, the 21h funds were crucial to implementing new initiatives, and a possible reason they engaged in more of a bridging response; the additional resources provided incentive and means to make changes and engage in the Partnership Model.
In addition to discussing new turnaround initiatives, all three districts had made efforts to explicitly include and inform teachers of their Partnership work. Including teachers explicitly in the discussion of Partnership activities is a bridging response as it reflects a coordinated and intentional focus on the Partnership Agreements and goals.
Increased BufferingFour Partnership leaders seemed to increase their buffering activities, which appeared to be related to changes in leadership or perceptions of the reform as primarily compliance-oriented. Three of these districts experienced a leadership change at either the district or school level either in the past year or just before being identified for Partnership. In two of these, the new leaders were trying to figure out the goals or initiatives already in place. This suggests that there may need to be additional supports to assist districts as they transition leadership to help them become familiar with the Partnership Agreement, the initiatives already in place, and ways to potentially make new changes. For example, Red Wings had handled changes in leadership by delegating Partnership work to other district leaders and school staff while new leadership got established in their roles. As a result, the Red Wings’ district leader felt “understanding what those goals were that someone else wrote for us and really honing in on who’s the person responsible to complete some of those actions” was one of the most important things they were working on this year. One district that changed leadership just before writing their Agreement felt that a lot of the changes they implemented as part of Partnership were more a response to the shift in leadership than to Partnership itself. This also underscores the importance of leaders in school turnaround work.
Three of the four districts that had more buffering responses in the 2019-20 school year also seemed less connected to their MDE liaisons. These districts elected to buffer some of the input from MDE while working more closely with another partner, some of whom they were engaging with before the Partnership Agreement. This potentially points to buffering from having “too many cooks in the kitchen” (as the leader of Maple Leafs noted), and may be one way districts can focus their responses. The fourth district spoke positively of their experience with their MDE liaison but also noted that they wanted to see what feedback they received as they moved forward before they would comment on their impression of the reform itself. This, in addition to the increased bridging activity from some districts that found MDE resources useful, is evidence that the MDE liaison and other interactions with MDE can have an impact on how districts interact with the reform.
Overall, districts craft coherence in a variety of ways. This underscores the importance of the flexibility and local discretion imbedded in the Partnership Model. Also, we saw district engagement linked in part to their perceptions of support from MDE and to their ability to align multiple school improvement and turnaround goals into a coherent effort.

Partnership Turnaround: Year Two Report Section Four | October 2020
74
Identifying the most critical goals. Leaders believed that one of the most helpful aspects of Partnership was its usefulness in identifying and articulating a district’s most important goals. As the Blue Jackets district leader explained:
What the Partnership Agreement does for you is it says, “Hey, make sure you know what you’re here to do, and that’s increase student achievement and make certain that the organization is functioning as such so that you have systems in place that will yield increased student achievement.” […] It refocuses a school district or a school system in terms of making certain you know what you’re there for and what’s important and that your organization is aligned to reach those goals.
Similarly, an ESP leader described this idea as “narrowing the scope to a set of power standards:”
[It’s] the idea of narrowing the scope to a set of priority standards. We talked about it as a network, and even went as far as to identify power standards. This process helped us to narrow those power standards a little bit more because there’s something to going deep to improve practice. If we can focus our steps as teachers, as leaders, as support from the management team on a smaller set of standards, they can help generalize strong practice across all of them. That was really that “aha” moment.
As is clear from these conversations with Partnership leaders, Partnership enabled schools and districts to home in on central goals and standards that needed to be met to foster improvement. This was especially helpful for organizations that did not yet have a clear or coherent strategic planning process in place. In this way, Partnership helped these districts to focus their efforts on the most critical ways to improve student achievement.
Data-driven instruction and a continuous improvement cycle. Importantly, Partnership leaders described a continuous improvement process emerging from the strategic planning element of the Partnership Model. This was not a static, one-time event but rather an effort to learn from their experiences, successes, and challenges. The charter leader of Hurricanes explained:
I believe that what [Partnership] has done is it has allowed us a framework to look at the specific needs of the school and across multiple metrics and measures to be able to figure out the particular, specific needs of the school. Because of that, it is literally data-driven instruction. We are, our instruction, our practices in the classroom is being
“What [Partnership] has done is it has allowed us a framework to look at the specific needs of the school and across multiple metrics and measures to be able to figure out the particular, specific needs of the school.”

EPIC | Education Policy Innovation Collaborative — Michigan State University
75
driven by what we’re seeing through these metrics. I think the encouraging thing is it’s not just academic metrics. It’s looking at behavior. It’s looking at [trauma indicators]. It’s looking at all of these things and how they are communicating together and what trends we are seeing. Subsequently, what we need to do to change it.
By describing the Partnership process as “data-driven instruction,” this leader captured leaders’ sentiments that ongoing evaluation of goals helped them to make necessary changes within the framework of the Partnership Agreement.
Improved communication both within the internal leadership team and with external partners. In addition to this idea of evaluating and refining goals and processes to meet them, others felt the process allowed for greater transparency and communication about those goals across teams. Sabres’ charter leader said:
I do think [the strategic planning process] probably shifted the way [Sabre]’s team as a whole has started to look at some of these pieces... I think helping them all understand the elements that get us to the point of academic increases, whether it’s on quarterly benchmarks or the NWEA MAP growth targets or the M-STEP. Looking at all of these factors along the way that lead to that final outcome and how it’s critical that we do have fidelity in these various areas to get us to where we need to go.
Here, the leader of Sabres expressed how communicating as part of the Partnership process might have changed team members’ beliefs about the potential collective efficacy of their efforts. In addition, some felt that their notion of who is on “the team” expanded as they looked to help from external partners. The Predators’ charter leader explained:
I think oftentimes schools or school districts are leery to look outside their own school and realize how many potential partners they could have. Meaning without this [Partnership Agreement]... [it] would be, me, running the school and us in our own little boat on our own little ship and we’re sailing our ship… All of these people that are here, that we build the relationships, it’s those layers on top of the school, it’s your school board, your management company [ESP], your authorizer, the MDE, your ISD, they’re all there to help. You just have to know that and be willing to think outside of the walls of your own school and realize how much help there is.
In sum, many superintendents and charter leaders reported that Partnership helped them to build their capacity to deliver higher quality instruction. Importantly, the mechanism for this improvement appeared to be that the Partnership Model asked organizations to undergo a strategic planning and continuous improvement process while being deliberate about integrating different stakeholders.
In the Case Study Vignette 1, we highlight two of our case study districts to showcase how the Stars and Flames districts were able to leverage Partnership to strategically focus on critical improvement efforts.

76
Case Study Vignette 01: Stars and Flames Used the Reform as a Framework for Improvement and to Transition Leadership
01/Case Study
Vignette
Stars and Flames Used the Reform as a Framework for Improvement and to Transition Leadership
The case studies of Stars and Flames illustrated how the Partnership Agreement could help new leaders strategically focus on critical areas for improvement and align their systems and strategies.
The leader of Stars transitioned from an existing role in the district to take over the Partnership process once the superintendent left. She/he explained how the Partnership Agreement provided a helpful lens to validate and check that the work they were doing was properly focused and aligned. When asked if there were examples of positive changes and successes that resulted from the Partnership Agreement, she/he answered:
I would say probably going through the transition of having a superintendent leaving and us transitioning to obtaining one, this gave us a natural purpose to making sure everything was aligned and our systems were intact and strong. By being in the Partnership, an unintended result was we were basically forced to prove that we were a solid institution. RGA [Review of Goal Attainment] was a good check and balance to make sure that we were who we said we were. It was a good way to validate all the hard work we’re doing. It was a good way to validate that our processes and systems are strong, and they are comprehensive, and with proof, with evidence we were moving in the right direction.

77
This leader noted that the Agreement gave him/her one lens to ensure alignment and later elaborated how it helped them refine what they were doing as a district, as she/he explained how they decided to pull away from a large initiative they had previously been engaged in:
[Our decision to opt out] was through the transition of [the former superintendent] leaving… we had so many initiatives. If you would go through what we’re doing now, it was so many initiatives. To take on another huge component and understand it really well and do it right, we decided to slow our engines and pause.
In addition to helping the district focus on a manageable number of initiatives, Partnership also offered them political traction to implement instructional initiatives that might have faced resistance otherwise:
I think it was easier to push through an initiative like the instructional rounds because we were in a Partnership versus if we weren’t. It almost provided urgency to allow that to move forward through the barriers, union, things like that that were—have always been good checks and balances for a school system. Yet this created urgency to move these things forward.
One important reason we conducted case studies was to better understand perceptions of Partnership at the school level, as in our Year One Report we noted some discrepancies between the generally positive perception of the Model at the district level and the experiences of those on the ground. However, this year, the Partnership teachers and school leaders that we interviewed largely echoed the positive beliefs about the influence of Partnership. One school leader explained in response to a question about what was going well:
To be honest, this district is notorious for throwing 15 different initiatives, doing each one of them [not well], and then wondering why the teachers don’t wanna have more initiatives. Now, because of the amount of investment in [our targeted initiatives], they realize, especially when they see teachers doing well, they realize that this is not an optional thing, and this is the road to success.
01/Case Study
VignetteSTARS AND FLAMES USED THE REFORM AS A FRAMEWORK FOR IMPROVEMENT AND TO TRANSITION LEADERSHIP

78
STARS AND FLAMES USED THE REFORM AS A FRAMEWORK FOR IMPROVEMENT AND TO TRANSITION LEADERSHIP
01/Case Study
Vignette
This school leader’s experience supported the district Partnership leader’s assertion that initiatives felt more focused and aligned. One teacher also noted that the district leader was “doing a great job” while another teacher explained why they felt positively about Partnership:
[Partnership goals] really went hand in hand with our school improvement plan with the school and with the district… Maybe [the Agreement] made it a little more focused for us like thinking, “We now have a partnership with the state. Okay, now we have to”—I don’t know. It’s more important or something.
Altogether, the teachers we interviewed generally agreed with leaders at all levels in Stars that the Partnership Agreement and the evaluation process provided them with a framework to prioritize initiatives, to reflect on continuous improvement, and to have a sense of urgency. This sentiment was shared by the leader of Flames, who explained:
Because of [Partnership] I noticed that we had so much support, so many resources, so many initiatives, so many things going on, but it was that mile-high, inch-deep scenario. So this year we really honed in on specific skills for the teachers; we’re doing [a new curriculum], which is a reading component; we’re focused on technology and building those structures; and also parent engagement, because that’s definitely an important piece if we can get the parents involved… I had to make a decision to kind of wipe out a lot of the other initiatives and PDs and things that had nothing to do with these three items and really hone-in and be laser-focused on those.
As the experiences of case study participants show, and consistent with research that highlights how turnaround efforts require strategic planning and additional support (Strunk, Marsh, Bush-Mecenas, & Duque, 2016; Sun, Penner, & Loeb, 2017; VanGronigen & Meyers, 2017), one important mechanism for improvement from Partnership was that leaders were asked to simplify and align efforts.

EPIC | Education Policy Innovation Collaborative — Michigan State University
79
Partnership Agreements Strategically Focused on Critical Improvement Areas and Aligned to Existing School Improvement PlansAs is clear from above, several Partnership leaders reported that the Partnership Model — the process of developing the Agreement and then enacting it — helped them to focus their work on the most critical elements for improving student achievement. In addition, both our survey and qualitative data suggested that these Agreements were well-aligned with the School Improvement Plans (SIPs) of Partnership schools within Partnership districts.
Educators reported substantial and increasing alignment between Partnership Agreements and School Improvement Plans.Figure 4.6 shows results from educator surveys administered in the 2019-20 school year that asked educators about the degree of alignment between their Partnership Agreements and their School Improvement Plans (SIP). Educators expressed that there was a relatively high degree of alignment between their Partnership Agreements and their SIPs across five aspects of the plans: goals, improvement strategies, strengths, weaknesses, and resources.4 Both principals and teachers in Partnership and non-Partnership schools also reported greater alignment between the first and second survey wave across all areas of the two sets of plans.5
As one may expect, educators in identified Partnership schools reported greater alignment between their SIP and Partnership Agreement than educators in non-Partnership schools, implying that the Agreements are being tailored to Partnership schools, as intended. However, that educators in non-Partnership schools also reported a significant degree of alignment, suggests that similar improvement efforts may be found throughout
Partnership districts, though these data do not allow us to determine whether districts are drawing on their Partnership Agreements for guidance in improving outcomes at their other non-Partnership schools or whether the district used pre-existing improvement plans to craft their Agreements.
Educators expressed that there was a high degree of alignment between their Partnership Agreements and their School Improvement Plans across five aspects: goals, improvement strategies, strengths, weaknesses, and resources.

Partnership Turnaround: Year Two Report Section Four | October 2020
80
FIGURE 4.6. Educators’ Perceptions of Alignment Between Their Partnership Agreement and School Improvement Plan
Strongly Disagree
Neither Disagree nor Agree
Strongly Agree
Disagree Agree
Resources
Weaknesses
Partnership Principals Non-Partnership PrincipalsIncrease Since 2018 Decrease Since 2018
Partnership Teachers Non-Partnership Teachers
Improvement strategies
Strengths
Goals
Note: Educators were asked to rate their Agreement with statements about the alignment between their school improvement plan and Partnership Agreement. The prompt was “My school improvement plan and Partnership Agreement identify similar…” The question about resources was asked for the first time in the 2019-20 survey. In 2018-19 we asked about strengths and weaknesses together. Here we show the response compared to both strengths and weaknesses individually.
Partnership leaders intentionally and strategically aligned improvement goals across planning documents. Partnership leaders we spoke to acknowledged their efforts to align the goals expressed in their Partnership Agreements with SIPs, noting that they worked to make sure Partnership goals and other strategic or improvement goals were similar or the same. As we found in the Year One Report, some Partnership leaders used a long-range strategic plan to craft both the Partnership Agreement and school improvement goals. The charter leader of Blues shared the district’s goal writing process, “We first built a strategic plan. Then, from our strategic plan, we built the Partnership Agreement. [...]That Partnership Agreement is still a subset of our strategic plan.”

EPIC | Education Policy Innovation Collaborative — Michigan State University
81
However, others used the Partnership Agreement to guide and even rework their yearly school improvement goals, using Partnership as a framework to help them strategically plan. The charter leader of Sabres told us:
Our School Improvement Plan and the Partnership Agreement, once we went through that process for school improvement last spring, those are now completely aligned. […] The Partnership Agreement set that expectation because that is not necessarily easily changed. That served as a foundation. We did make some adjustments to that plan over the course of the summer, but then, we completely reworked the school improvement plan so that it aligned with the Partnership Agreement and everything was talking the same language.
The district leader from Red Wings shared that Partnership Agreements and School Improvement Plans both focus on
academic outcomes, so it made sense for the different plans and goals to mirror each other with additional specificity around actions that focused on students in Partnership schools:
Our district and our School Improvement Plans all have math achievement; they all have reading achievement; they all have college and career ready, so it isn’t that it’s new; it’s already incorporated in it. It’s the action steps that we take specifically for [Partnership school] students that are there.
The charter leader of Flyers also described a thoughtful process of finding the pieces of policies that work together to create an overarching approach to their work:
I have found that the best way is to not treat them as if they’re separate, but to find the common thread of those things and work from that end. […] When setting those goals, what goals do we need to set that speak specifically to the needs of the school, but also take into consideration the fact that we need to grow. […] Our goals then are shaped by those [the policy requirements and school needs] mixed together, so that as we accomplish those goals, we’re meeting the requirements of the accountability system, but we’re also meeting the needs of the school at the same time. […] How can they work together as an organism to inform what you’re doing, as opposed to treating them separately; [that] has been our approach. I think that it has worked well for us, because the honest to God truth is I probably would have lost my mind by now if we’ve had to treat those things as being separate entities.
Leaders perceived that goal alignment allowed for a more coherent and manageable school improvement process for districts that are balancing multiple policy demands. Partnership
Partnership leaders viewed the alignment between Partnership Agreements and School Improvement Plans as a strategic management choice to guide and focus turnaround work.

Partnership Turnaround: Year Two Report Section Four | October 2020
82
leaders viewed the alignment between Partnership Agreements and School Improvement Plans as a strategic management choice to guide and focus school improvement and turnaround work. Because districts’ Partnership goals focused on the most important initiatives and outcomes for school turnaround, it was reasonable and likely advantageous to school and district improvement efforts to align other school improvement goals to the Partnership Agreement. This helped to focus stakeholders and ensure that they were not pulled in multiple competing directions.
Educators in Partnership districts viewed school improvement goals favorably. Given the efforts described above, perhaps it is not surprising that educators’ — and particularly Partnership teachers’ — evaluations of their school improvement goals improved in this year’s survey relative to last year’s. Although on the whole, educators rated their school goals as somewhat middling, this was an improvement over last year, with the responses of Partnership teachers and principals increasing in almost all areas, as can be seen in Figures 4.7.1 and 4.7.2.
FIGURE 4.7.1. Principals’ Evaluations of Their School Goals
Partnership Principals Non-Partnership Principals
Increase Since 2018 Decrease Since 2018
Strongly Agree
Neither Disagree nor Agree
Strongly Agree
We have the resources we need to accomplish
our goals
Disagree Agree
Too much time is spent on our school goals
My school’s goals are feasible
Community partners will help us achieve our
school goals
We focus on clear and concrete steps to improve
student outcomes
My school’s goals focus on the most important issues
facing my school
My school’s goals help meet the needs of students
My school’s goals will help us improve student
outcomes
I am aware of and understand my
school’s goals
Our efforts align with our school goals
Note: Principals were asked, “Please indicate the extent to which you agree or disagree with the following statements about your Partnership Agreement/School Improvement goals.” The question “My school’s goals will help us improve student outcomes” was asked for the first time in the 2019-20 survey.

EPIC | Education Policy Innovation Collaborative — Michigan State University
83
FIGURE 4.7.2. Teachers’ Evaluations of Their School Goals
Partnership Teachers Non-Partnership Teachers
Increase Since 2018 Decrease Since 2018
Strongly Agree
Neither Disagree nor Agree
Strongly Agree
We have the resources we need to accomplish
our goals
Disagree Agree
Too much time is spent on our school goals
My school’s goals are feasible
Community partners will help us achieve our
school goals
We focus on clear and concrete steps to improve
student outcomes
My school’s goals focus on the most important issues
facing my school
My school’s goals help meet the needs of students
My school’s goals will help us improve student
outcomes
I am aware of and understand my
school’s goals
Our efforts align with our school goals
Note: Teachers were asked, “Please indicate the extent to which you agree or disagree with the following statements about your Partnership Agreement/School Improvement goals.” The question “My school’s goals will help us improve student outcomes” was asked for the first time in the 2019-20 survey.
In addition, we found that educators in Partnership schools tended to rate their school’s goals more favorably than their colleagues in non-Partnership schools, though differences are greater amongst principals, reflecting the alignment between Partnership Agreements at the district level and Partnership school’s improvement plans. In particular, relative to educators in non-Partnership schools, both principals and teachers in Partnership schools were more likely to report that they had the resources needed to achieve their school goals and that their goals focus on clear and concrete steps to improve student outcomes. In addition, on average, Partnership school principals agreed more strongly than non-Partnership principals that their school goals focused on their school’s most important issues.

Partnership Turnaround: Year Two Report Section Four | October 2020
84
Partnership leaders explicitly communicated goals to educators and worked to keep the goals central to improvement efforts. One possible explanation for Partnership educators rating their goals higher relative to those in non-Partnership schools was that district leaders explicitly discussed Partnership goals with Partnership school teachers and principals and worked to make sure educators understood and kept them central to their improvement efforts. Thirteen of 22 leaders indicated that Partnership goals and initiatives were discussed in meetings, newsletters, or professional development. This trend was especially evident for charter schools; three-quarters of the charter leaders interviewed mentioned explicit communication, which is possibly because most charter districts consist of one school. In contrast, most traditional public schools TPS districts include multiple schools which may not all be a part of their Partnership Agreement.
The charter leader of Hurricanes shared how the teachers were continually informed of progress on the Partnership goals:
At the beginning of the year, we have a professional development session that is specific to the Partnership Agreement, the Partnership goals. Then, throughout the course of the year, we have checks where we talk about our progress, where we are. For example, we did a fidelity check in July to see where the school is performing in reference to the 14 goals that [were] set [in] the Partnership Agreement. Then, we subsequently shared that with the staff. Let them know where we were in our progress towards those goals. We’re actually getting ready for another staff informational, if you will, this coming week, because we’re getting ready for our RGA, which is the following week. We’ll have our presentation together and all that, so the staff will get that. I will go over that with them to keep them informed. On a pretty regular basis, they’re able to get information about the Partnership Agreement and where we are. Then, of course, in staff meetings and things of that sort, I will address where we are and give an update to them in that regard.
Similarly, Lightning’s charter leader ensured teachers were aware of the Agreement and could communicate key aspects:
They’re [the teachers] absolutely a part of it. We’re living and breathing them. The beginning of each year—well, the last two years, but that’s how we start each year is we get them out. We look at it. […] Anyone who’s been here for a year or since the beginning of the year could—especially those that have been with us for a year and a half, which is 80 percent of the staff or 90 percent of the staff—they could intelligently articulate and have a discussion on what’s up with the whole Partnership Agreement. They could have it in front of them, and they could explain it to pretty much anyone as far as the purpose of it, what we’re doing, how are all these things connected.
59%
13 OUT OF 22 PARTNERSHIP LEADERS
indicated that Partnership goals and initiatives were discussed
in meetings, newsletters, or professional development.

EPIC | Education Policy Innovation Collaborative — Michigan State University
85
Both examples highlight not only how Partnership leaders communicated their Partnership improvement goals to their faculties, but also how they worked to ensure understanding of their import and centrality to improvement efforts. It is possible and even likely that these efforts would result in greater buy-in from Partnership school principals and teachers, which could then be reflected in more positive views of improvement goals and plans.
However, some districts felt that it was more important for teachers to be aware of school improvement initiatives and related policies than it was for them to be made explicitly aware that such programs were connected to a Partnership Agreement. For example, the charter leader of Blues explained his/her view on the importance of teacher familiarity with the Partnership Agreement:
I feel like it would maybe be a bog down to my teachers to have that level of understanding. I just really want them to be able to do the work. We try to connect it back and say, “This is part of our Partnership Agreement or our strategic plans,” but I don’t care if they can quote it.
This indicated that while some districts were explicit about communication around Partnership goals, others felt that it was more important for teachers to be embedded in and understand the work to reach the goals, rather than the specifics of the goals and policy itself. In this way, the import of the goals and strategies embodied in the Partnership Agreement and improvement plans was still conveyed to educators, but the mere fact of where these goals were codified was less relevant.
Districts maintained a consistent approach to addressing Partnership goals. Given that Partnership leaders and educators reported optimism that their Partnership goals were useful in productively orienting them towards improving student outcomes, it is not surprising that Partnership leaders reported that they were continuing to work through the plans laid out in their Partnership Agreements and that implementation efforts to achieve goals remained mostly stable from 2018-19 to 2019-20. The charter leader of Oilers said:
So I think the last two years since the Partnership Agreement, we’ve actually been able to be more focused on, these are the things that we’ve identified that are going to make a difference in student education and show on the index what we’re doing for our families. So, it’s actually added a little more consistency in an odd way.
This consistency may have also contributed to educators positively rating goals. While 15 district leaders mentioned that they amended their Partnership Agreements, many of them indicated that the amendments did not reflect a change in their work around Partnership. Bruins’ leader explained how their amendments tried to capture work already in progress by teachers and school leaders, “We’re going to have to add in this including things you’re already doing, but we need to put them in writing in this amendment. If we’re doing X at the beginning of the Partnership Agreement, we’re going to continue that out.” Amending Partnership Agreements so goals reflect work in progress may also result in favorable rating of the goals.
While 15 leaders mentioned amending their Partnership Agreements, many indicated those changes didn’t reflect a shift in their work around Partnership.

Partnership Turnaround: Year Two Report | October 2020
86
Special Section C:
How Leaders Viewed Partnership in Traditional Public Schools and Public School Academies
WHY PARTNERSHIP LEADERS IN CHARTER SCHOOLS VIEWED THE PARTNERSHIP MODEL MORE POSITIVELY THAN THEIR TPS PEERSThe Partnership Model is somewhat unique amongst similar turnaround programs nationally because it treats traditional public schools (TPSs) and public school academies (PSAs), the label for charter schools in Michigan, the same. Both TPSs and PSAs were identified for intervention using the same method of selection and were given the same resources, supports, and eventual accountability mechanisms regardless of governance model.
Even as they were treated the same, we found some differences in the ways that Partnership played out in TPSs relative to charter schools and districts. In particular, we found that leaders and educators in charter organizations generally held more positive perceptions of turnaround than did their colleagues in traditional public school districts. In what follows, we examine four potential reasons why this might be the case:
1. the additional 21h funds and Regional Assistance Grants (RAGs) that were allocated to Partnership schools and districts as part of the intervention;
2. enhanced communication between Partnership charter leaders and educators that resulted in educators’ increased awareness and understanding of the Partnership Model and associated interventions;
3. closer ties to external partners, especially the ISDs; and
4. reduced fears of high-stakes consequences related to the Partnership Model.
We then discuss how these ways that Partnership played out in charter organizations were interrelated with Partnership charters’ propensities to use a bridging response in implementing the Model.
Charter organizations generally held more positive perceptions of turnaround.
Special Section C:

EPIC | Education Policy Innovation Collaborative — Michigan State University
87
SPECIAL SECTION C: HOW LEADERS VIEWED PARTNERSHIP IN TRADITIONAL PUBLIC SCHOOLS AND PUBLIC SCHOOL ACADEMIES
ADDITIONAL PARTNERSHIP MODEL FUNDING WENT FARTHER IN CHARTER ORGANIZATIONSAs we noted in Section Four, because charter organizations were generally smaller, the new funding often went farther in helping them purchase new materials or implement new initiatives to help them achieve their Partnership goals. For more details on this, please see pages 98-99.
ENHANCED COMMUNICATION IN PARTNERSHIP CHARTER SCHOOLS LED TO GREATER ACCEPTANCE, AWARENESS, AND UNDERSTANDING OF THE PARTNERSHIP MODELCharter schools in Partnership may have also benefited from their generally leaner organizational structure. At least one level of communication is removed when charter principals or leaders were the main designers of the Partnership Agreement (as opposed to the superintendent and district staff). Thus, charter principals and teachers might be more aware and potentially more involved in constructing the Partnership Agreements or knowledgeable about its content. The charter leader of Hurricanes’ provided an example that represented what she/he and other charter Partnership leaders told us:
At the beginning of the year, we have a professional development session that is specific to the Partnership Agreement, the Partnership goals. Then, throughout the course of the year, we have checks where we talk about our progress, where we are. For example, we did a fidelity check in July to see where the school is performing in reference to the 14 goals that was [sic] set at the Partnership Agreement. Then, we subsequently shared that with the staff. Let them know where we were in our progress towards those goals. We’re actually getting ready for another staff informational, if you will, this coming week, because we’re getting ready for our RGA, which is the following week. We’ll have our presentation together and all that, so the staff will get that.
In this example, as in other charters, Partnership goals were discussed explicitly at the beginning of the year and progress was revisited throughout the year. Although several traditional school districts also took a more hands-on approach to involving teachers and communicating with them, the lines of communication between the district and the school were often less clear.
Survey results confirmed that charter school educators were more aware of and better understood the Partnership Model and associated interventions. Figure C1 shows principals’ and teachers’ reported awareness of their Partnership Agreements, District Improvement Plans (DIPs) and

Partnership Turnaround: Year Two Report | October 2020
88
SPECIAL SECTION C: HOW LEADERS VIEWED PARTNERSHIP IN TRADITIONAL PUBLIC SCHOOLS AND PUBLIC SCHOOL ACADEMIES
School Improvement Plans (SIPs), splitting the sample by educators in charters relative to TPSs. We found that greater proportions of charter than TPS educators reported knowledge of their Partnership Agreements; 89 percent of charter principals expressed awareness of their Agreement relative to 69 percent of TPS principals and PSA (41 percent) than TPS (33 percent) teachers said they had knowledge of their Agreement. This continued a pattern from the first year of the survey in which charter school teachers indicated greater awareness of their Partnership Agreement than TPS teachers, though awareness among charter teachers decreased over time.
FIGURE C1. Educators’ Awareness of Improvement Plans, by Charter and TPS Respondents
0%
40%
100%
20%
60%
School Improvement Plan
District Improvement Plan
Partnership Agreement
2018-2019
School Improvement
Plan
80%
Perc
enta
ge o
f edu
cato
rs w
ho re
port
bei
ng
awar
e of
impr
ovem
ent p
lans
Charter Principals TPS Principals
Charter Teachers TPS Teachers
Partnership Agreement
2019-20202019-2020
Note: Educators were asked whether they were aware of the Partnership Agreement, School Improvement Plan, and District Improvement Plan.
Similarly, charter school principals reported greater understanding than their TPS peers of all elements of their Partnership Agreements. This is shown in Figures C2 and C3. Whereas charter teachers in most cases only exhibited marginally greater understanding, and teachers as a whole reported less certainty about many elements of their Agreements than did their principals (especially for charter educators), the gaps between charter and TPS principals’ reported understanding of their Agreements was often quite substantial. Whereas TPS principals in Partnership districts acknowledged understanding many aspects of their Agreements only “moderately well” or slightly above, on average, charter school principals believed they understood most elements of their Agreements “very well” nearing “extremely well.” However, although charter principals reported a strong understanding of their Partnership Agreement and the reform generally, their perceived understanding was decreased from the first year to the second year of

EPIC | Education Policy Innovation Collaborative — Michigan State University
89
SPECIAL SECTION C: HOW LEADERS VIEWED PARTNERSHIP IN TRADITIONAL PUBLIC SCHOOLS AND PUBLIC SCHOOL ACADEMIES
survey administration. Charter principals were unique in this regard, as they were the only group that reported decreased understanding over time, as TPS teachers and principals, along with charter teachers, all reported large and statistically significant increases in their understanding.
FIGURE C2. Principals’ Understanding of Their Partnership Agreements, by Charter and TPS Respondents
Charter Principals TPS PrincipalsIncrease Since 2018 Decrease Since 2018
Not at All
Moderately Well
Extremely Well
The role of community partners in your Partnership
Agreement
Slightly Very Well
The role of the ISD/RESA in your Partnership
Agreement
The role of MDE in your Partnership Agreement
Consequences of not meeting your
improvement goals
Strategies to reach your non-academic goals and
benchmarks
18−mo. non-academic benchmarks and 36−mo.
non-academic goals for improvement
Strategies to reach your academic goals and
benchmarks
Your role in your Partnership Agreement
18−mo. academic benchmarks and 36−
mo. academic goals for improvement
Why your district was identified for Partnership
The role of district leadership in your
Partnership Agreement
Note: Principals were asked, “How well do you understand the following aspects of your district’s Partnership Agreement?”

Partnership Turnaround: Year Two Report | October 2020
90
SPECIAL SECTION C: HOW LEADERS VIEWED PARTNERSHIP IN TRADITIONAL PUBLIC SCHOOLS AND PUBLIC SCHOOL ACADEMIES
FIGURE C3. Teachers’ Understanding of Their Partnership Agreements, by Charter and TPS Respondents
Charter Teachers TPS TeachersIncrease Since 2018 Decrease Since 2018
Not at All
Moderately Well
Extremely Well
The role of community partners in your Partnership
Agreement
Slightly Very Well
The role of the ISD/RESA in your Partnership
Agreement
The role of MDE in your Partnership Agreement
Consequences of not meeting your
improvement goals
Strategies to reach your non-academic goals and
benchmarks
18−mo. non-academic benchmarks and 36−mo.
non-academic goals for improvement
Strategies to reach your academic goals and
benchmarks
Your role in your Partnership Agreement
18−mo. academic benchmarks and 36−
mo. academic goals for improvement
Why your district was identified for Partnership
The role of district leadership in your
Partnership Agreement
Note: Teachers were asked, “How well do you understand the following aspects of your district’s Partnership Agreement?”
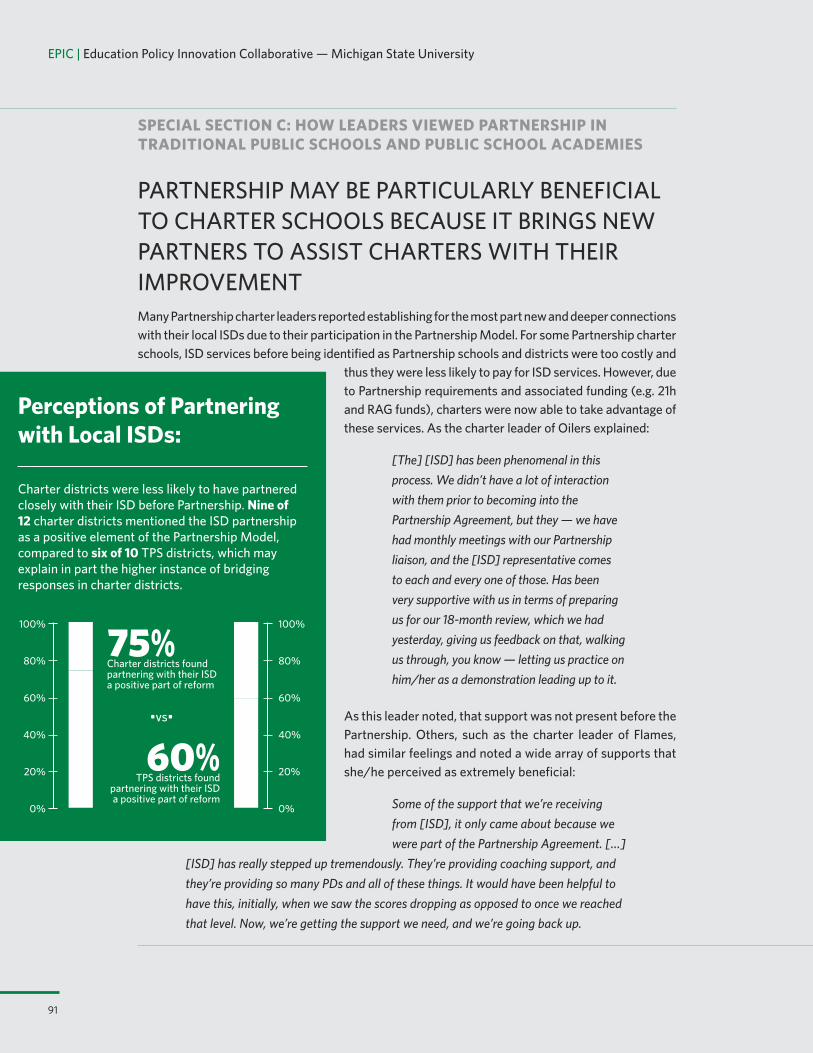
EPIC | Education Policy Innovation Collaborative — Michigan State University
91
SPECIAL SECTION C: HOW LEADERS VIEWED PARTNERSHIP IN TRADITIONAL PUBLIC SCHOOLS AND PUBLIC SCHOOL ACADEMIES
PARTNERSHIP MAY BE PARTICULARLY BENEFICIAL TO CHARTER SCHOOLS BECAUSE IT BRINGS NEW PARTNERS TO ASSIST CHARTERS WITH THEIR IMPROVEMENTMany Partnership charter leaders reported establishing for the most part new and deeper connections with their local ISDs due to their participation in the Partnership Model. For some Partnership charter schools, ISD services before being identified as Partnership schools and districts were too costly and
thus they were less likely to pay for ISD services. However, due to Partnership requirements and associated funding (e.g. 21h and RAG funds), charters were now able to take advantage of these services. As the charter leader of Oilers explained:
[The] [ISD] has been phenomenal in this process. We didn’t have a lot of interaction with them prior to becoming into the Partnership Agreement, but they — we have had monthly meetings with our Partnership liaison, and the [ISD] representative comes to each and every one of those. Has been very supportive with us in terms of preparing us for our 18-month review, which we had yesterday, giving us feedback on that, walking us through, you know — letting us practice on him/her as a demonstration leading up to it.
As this leader noted, that support was not present before the Partnership. Others, such as the charter leader of Flames, had similar feelings and noted a wide array of supports that she/he perceived as extremely beneficial:
Some of the support that we’re receiving from [ISD], it only came about because we were part of the Partnership Agreement. […]
[ISD] has really stepped up tremendously. They’re providing coaching support, and they’re providing so many PDs and all of these things. It would have been helpful to have this, initially, when we saw the scores dropping as opposed to once we reached that level. Now, we’re getting the support we need, and we’re going back up.
Perceptions of Partnering with Local ISDs:
Charter districts were less likely to have partnered closely with their ISD before Partnership. Nine of 12 charter districts mentioned the ISD partnership as a positive element of the Partnership Model, compared to six of 10 TPS districts, which may explain in part the higher instance of bridging responses in charter districts.
80%
60%
40%
20%
0%
100%
75% Charter districts found partnering with their ISD a positive part of reform
60% TPS districts found
partnering with their ISD a positive part of reform
80%
60%
40%
20%
0%
100%
•vs•

Partnership Turnaround: Year Two Report | October 2020
92
SPECIAL SECTION C: HOW LEADERS VIEWED PARTNERSHIP IN TRADITIONAL PUBLIC SCHOOLS AND PUBLIC SCHOOL ACADEMIES
Discussions with Partnership leaders suggested that charters were less likely to have close relationships with their ISDs or with external community organizations before the Partnership Model. In particular, charter districts were less likely to have partnered closely with their ISD before Partnership. As the charter leader of Predators noted, “It’s almost like I don’t know that the school had any relationship with the ISD without the Partnership Agreement.” Nine of 12 charter districts mentioned the ISD partnership as a positive element of the Partnership Model, compared to six of 10 TPS districts, which may explain in part the higher instance of bridging responses in charter districts. The charter leader of Rangers explained how ISD supports changed after their district was identified for Partnership:
[P]rior to being identified, we had a lot of positive behavior [training] and events to support training, but it was the same thing every year. They are still doing that type of training, but they’re digging deeper. They’ve also done different — some various academic trainings with the teachers, and […] the principal found them to be extremely helpful.
Similarly, all 12 charter districts portrayed outside partners as positive while only four of 10 TPS districts did. For some charter districts, engaging with community partners was new to them because of Partnership; the leader of Lightning said, “These [partnerships] are 100 percent brand new.” Such partnerships may be more impactful for districts that were not already using a wide variety of community partners to support their educational goals.
Although they may have had fewer relationships with community organizations and with the ISD before Partnership, because charter districts all have an authorizer and many have an Educational Service Provider (ESP), these districts had additional partners beyond MDE and their local ISD. The charter leader of Predators told us:
I mean for the charter school system it’s your school board, your authorizer, your management company [ESP], your ISD, the MDE and in Blueprint installing schools, the MI Excel statewide field team. You have to know that these people are not here to point blame or point fingers, they’re here to help, so create those relationships, use—they all have experience in different elements of education and being open to
Perceptions of Working with Outside Partners:
All 12 charter districts portrayed outside partners as positive while only four of 10 TPS districts did. For some charter districts, engaging with community partners was new to them because of Partnership. Such partnerships may be more impactful for districts that were not already using a wide variety of community partners to support their educational goals.
80%
60%
40%
20%
0%
100%
100% Charter districts portrayed outside partners as positive.
40% TPS districts
portrayed outside partners as positive.
80%
60%
40%
20%
0%
100%
•vs•

EPIC | Education Policy Innovation Collaborative — Michigan State University
93
SPECIAL SECTION C: HOW LEADERS VIEWED PARTNERSHIP IN TRADITIONAL PUBLIC SCHOOLS AND PUBLIC SCHOOL ACADEMIES
say, “Hey, I’m in this with you.” Listening to their ideas, listening to what they have to say and not coming across—not taking as if anyone is being critical.
This leader highlighted that through differences in governance structure, charters have more technical partners with explicit background in education coming to the table under Partnership. The interaction of more and new technical partners and their smaller size may have made the partnerships required under the Partnership Model more effective for charter schools.
CHARTER SCHOOL EDUCATORS EXPRESSED FEWER FEARS RELATED TO POTENTIAL HIGH-STAKES CONSEQUENCES OF PARTNERSHIPCharter leaders and educators may have had rosier impressions of the model this past year because they believed that their schools were improving as a result of Partnership, and as such, they were less concerned about what would happen to them if they failed to meet their Partnership goals.
First, Figure C4 shows that both charter and TPS principals are somewhat confident that participation will improve student outcomes this year and over the next three years.
FIGURE C4. Educators’ Perceived Likelihood of Improvement, by Charter and TPS Educators
Very Unlikely
2019-20202018-2019
Likelihood of improvement this
year
Somewhat Unlikely
Neither Likely nor
Unlikely
Somewhat Likely
Very Likely
Charter Teachers TPS Teachers
Charter Principals TPS Principals
Likelihood of improvement over
the next three years
Likelihood of improvement this
year
Likelihood of improvement over
the next three years
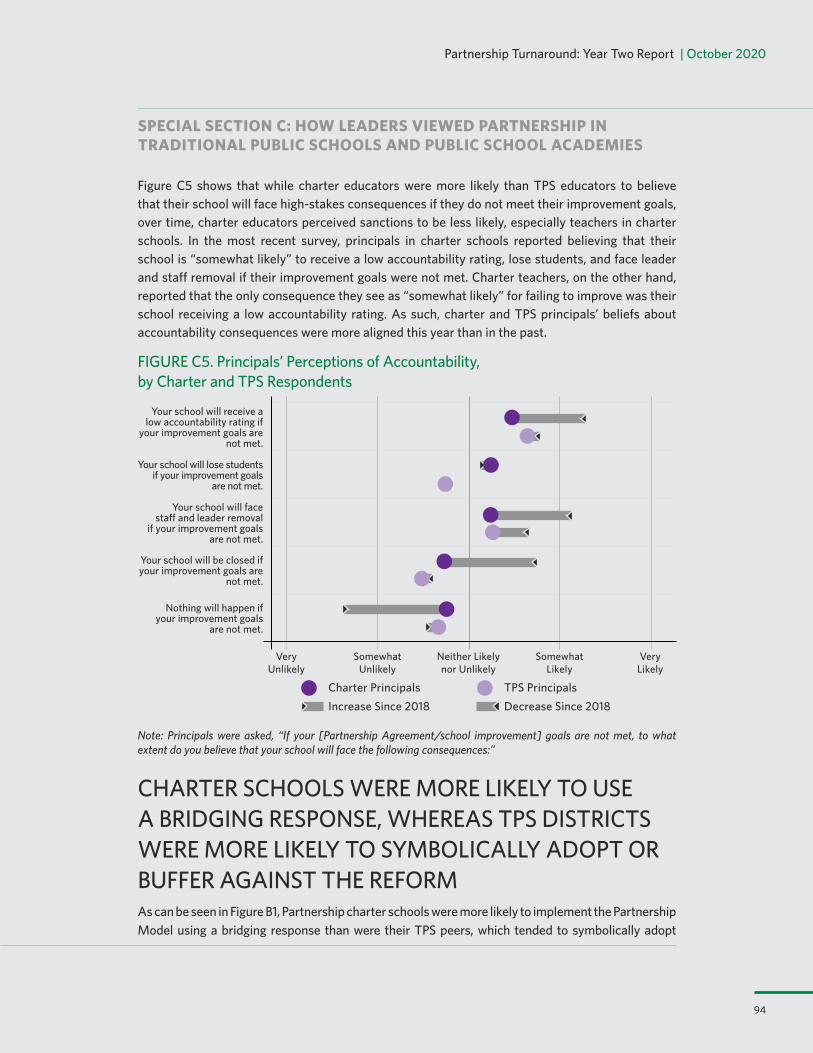
Partnership Turnaround: Year Two Report | October 2020
94
SPECIAL SECTION C: HOW LEADERS VIEWED PARTNERSHIP IN TRADITIONAL PUBLIC SCHOOLS AND PUBLIC SCHOOL ACADEMIES
Figure C5 shows that while charter educators were more likely than TPS educators to believe that their school will face high-stakes consequences if they do not meet their improvement goals, over time, charter educators perceived sanctions to be less likely, especially teachers in charter schools. In the most recent survey, principals in charter schools reported believing that their school is “somewhat likely” to receive a low accountability rating, lose students, and face leader and staff removal if their improvement goals were not met. Charter teachers, on the other hand, reported that the only consequence they see as “somewhat likely” for failing to improve was their school receiving a low accountability rating. As such, charter and TPS principals’ beliefs about accountability consequences were more aligned this year than in the past.
FIGURE C5. Principals’ Perceptions of Accountability, by Charter and TPS Respondents
Charter Principals TPS PrincipalsIncrease Since 2018 Decrease Since 2018
Very Unlikely
Neither Likely nor Unlikely
Very Likely
Nothing will happen if your improvement goals
are not met.
Somewhat Unlikely
Somewhat Likely
Your school will be closed if your improvement goals are
not met.
Your school will face staff and leader removal
if your improvement goals are not met.
Your school will lose students if your improvement goals
are not met.
Your school will receive a low accountability rating if
your improvement goals are not met.
Note: Principals were asked, “If your [Partnership Agreement/school improvement] goals are not met, to what extent do you believe that your school will face the following consequences:”
CHARTER SCHOOLS WERE MORE LIKELY TO USE A BRIDGING RESPONSE, WHEREAS TPS DISTRICTS WERE MORE LIKELY TO SYMBOLICALLY ADOPT OR BUFFER AGAINST THE REFORM As can be seen in Figure B1, Partnership charter schools were more likely to implement the Partnership Model using a bridging response than were their TPS peers, which tended to symbolically adopt

EPIC | Education Policy Innovation Collaborative — Michigan State University
95
SPECIAL SECTION C: HOW LEADERS VIEWED PARTNERSHIP IN TRADITIONAL PUBLIC SCHOOLS AND PUBLIC SCHOOL ACADEMIES
or buffer against the reform. Four charter districts were characterized as using bridging responses, compared to only one TPS. Nine of 12 charter districts implemented a blended response located between bridging and symbolically adopting, compared to four of the 10 TPS districts. Four TPS districts were characterized as symbolically adopting and two as buffering/symbolically adopting, relative to two charter districts symbolically adopting and one charter with this buffering blend.
As we explained in our Year One Report and reviewed in Special Section B, a bridging response entailed school and district leaders working to incorporate the Partnership Model with other ongoing improvement efforts. Bridging responses involved adopting and adapting the Partnership intervention in ways that school- and district-level actors believed would benefit their students, educators, and schools — but bridging also entailed investing significant additional time and effort that may or may not lead to productive change. It may be that such bridging efforts in charter schools
were interrelated with the reasons charter educators and leaders felt more positively about the Partnership Model.
We might think that the size of the organization (e.g. small organizations like charters) made it more likely that they used a bridging response because they might be more likely to easily mobilize their school-level staff or 21h funds might make a larger impact on their overall efforts. However, size does not appear to be associated with bridging, symbolic adoption, or buffering responses. Small districts (defined as those with five or fewer schools within their jurisdiction) made up seven of nine districts
that had either a bridging or a bridging/symbolic adoption response. However, small districts were also six of the nine whose responses were categorized on the other end of the spectrum as either symbolic adoption or buffering/symbolic adoption. The remaining two districts identified as showing a bridging or bridging/symbolic adoption response were larger districts with more than 15 schools in their jurisdiction. This suggests that something about the school culture of charters or their governance structure may play a role beyond size in the types of responses from districts.
SUMMARYIn sum, the majority of charter schools engaged in “bridging” behavior and these efforts were generally perceived positively. Partnership charter leaders’ and educators’ positive perceptions of the Partnership Model may be explained by money being more impactful to overall budgets in charters as smaller organizations; potentially clearer lines of communication about Partnership in charters that led to enhanced acceptance, awareness, and understanding of the Partnership Model; new supports from external partners and in particular from ISDs; and fewer fears about the potential for high-stakes accountability.
Nine of 12 charter districts implemented a blended response, compared to four of the 10 TPS districts.

Partnership Turnaround: Year Two Report Section Four | October 2020
96
Additional Money to Accomplish Goals is Crucial, but Often Not EnoughOnce plans were refined and in place and districts had worked to align their goals across strategic plans, Partnership leaders overwhelmingly told us that extra funding from 21h and Regional Assistance Grants (RAG) were helpful for them to actually execute these plans and meet their goals. This is not surprising; there is a strong and growing research base that proves the importance of sufficient funding for student achievement, and especially for low-income students in high-poverty schools and districts — districts like those in Partnership (e.g., Hendren & Sprung-Keyser, 2020; Jackson, Johnson, & Persico, 2016; Johnson & Jackson, 2019).
As noted in Section Three, in the 2019-20 school year, the legislature allocated fewer 21h funds to support Partnership districts than they had the prior year. Even this relatively small amount of money ($6 million in 2019-20 available for all 29 districts), alongside RAGs, was valued by Partnership leaders. However, as we found in the 2018-19 school year, many Partnership leaders felt that the total dollars were insufficient to help them accomplish their goals.
Nonetheless, several leaders emphasized how financially stretched they were, and noted that they would be hard pressed to meet their goals without the additional money provided through 21h or RAG funds. As the district leader of Black Hawks explained:
We were already very ambitious because we felt that, as an organization, we — from a capacity standpoint, we didn’t write anything that was unattainable. We believed that it was doable. What the Partnership really helped do was provide us with additional resources, and that resource integration was desperately needed because it covered areas that we were deficient in from a talent standpoint or financial. If we had a plan that we were gonna execute but didn’t have the funding or needed some additional support, the Partnership has been phenomenal in addressing that.
The districts used the funding in different ways, aligning these funds with Partnership goals. For instance, Flames used the 21h funds to implement a new reading curriculum. The charter leader of Flames said:
I think even with the [curriculum] we had to find something to really hone-in on reading. We were using some other curriculum resources previously. Yeah. I’m not sure without the Partnership if we would’ve determined if they need help. Then, with the 21h grant, that allowed us to be able to afford to implement a new curriculum and get all the resources we needed, whereas we may not have had the funding to do that at once.
As we explain in Section Six, this money was often perceived as inadequate for larger organizations/districts. Even though Partnership leaders acknowledged the additional money was helpful, they felt it was not enough. When asked whether the 21h and RAG funding was sufficient, the Black Hawks district leader responded, “Yes and no. Yes, because you’re thankful for anything that you get. The additional support has been—yes. I [will] say we would like more.”
The district leader of Stars, who was generally extremely positive about the Partnership reform and the additional financial resources, at the same time noted that the extra funding was a “drop in the bucket:”

EPIC | Education Policy Innovation Collaborative — Michigan State University
97
I guess I would say a good way to look at it is as far as budgets go, so far, we’ve budgeted [around half a million from outside money]. That’s a drop in the bucket compared to the amount of resources we need to sustain what we’re doing. I’d say no, it’s not enough.
Moreover, regulations around the use of the funds made it harder for Partnership leaders to efficiently expend them. The leader of Stars noted that it took substantial extra work to figure out how they were or were not able to use the 21h money. Although she/he noted that the process of figuring out the funding constraints allowed them to be strategic about how to use the money in ways that would adhere to state policy, it took more additional time than might be necessary if funding were more flexible.
Partnership Improved Districts’ Use of Data to Inform Instruction and PracticePartnership educators believed that their schools and districts had increased their focus on using data to inform practice (see Figures 4.8 and 4.9). When asked about the ways they were working to meet goals and how Partnership was helping them to improve instruction, leaders often discussed building capacity across the district and school to regularly analyze and the act on assessment data aligned to their Partnership goals. In fact, 17 of 22 district leaders discussed the importance of using data to drive decisions, adjust instruction, and as a tool in their Partnership work.
For instance, Predators’ charter leader noted that reviewing data was a central component to any major decisions the district made in response to Partnership:
For example, any time we’re going to change or do anything, it’s always looking at data. Right, so we follow a PLC process and every time we look at data. We’re pulling our data. We’re saying, “Okay, let’s see, what do we predict it’s going to say?” We look at the actual data. Looking at the actual data, were our predictions correct or incorrect? What does this
actual data tell us? Then we create a list of what are things that we can control that this data shows us, inspect everything across the board. If we’re looking at possibly making an amendment to a local assessment goal or a state assessment goal, we’re doing that based off of looking at the data, analyzing the data and creating an action plan based off what that data tells us, so that we’re aligning everything together.
Three main themes emerged from Partnership leaders’ discussions of data use. We discuss these below.
17 OUT OF 22
DISTRICT LEADERS
NOTED THE IMPORTANCE
OF DATA USE
Leaders often discussed building capacity across the district and
school to regularly analyze and act on assessment data aligned to their
Partnership goals. In fact, 17 of 22 district leaders discussed
the importance of using data to drive decisions, adjust instruction, and as a
tool in their Partnership work.

Partnership Turnaround: Year Two Report Section Four | October 2020
98
The Partnership goal-setting and evaluation process led to increased data use. First, for many districts, the process of setting goals through the construction of the Partnership Agreements and then of being required to show progress towards those goals caused Partnership districts and schools to rely on and understand data about their status and progress. In particular, Partnership leaders discussed how Partnership caused schools and districts to look even more closely and regularly at assessment scores and put supports in place. For example, the Rangers’ charter leader elaborated about the Partnership process: “It really was a benefit, because it did make us really—we had all the data, we didn’t have to aggregate data, we had it. Putting it together in one place I think was a really good part—a really good thing.”
Multiple Partnership leaders noted that the process of putting together Partnership goals and assessing progress towards them forced them to increase their data use capacity and generated a sense of urgency at the school level to meet them. For example, the Stars’ district leader said of a Partnership school in his/her district:
I think the sensitivity to the data in [that Partnership] school has increased tenfold. I think the understanding of the data component of [Partnership school] and their staff, they’ll walk away with a really strong understanding of not only just — not panic urgency — but healthy urgency to address things and know that this affects their kids.
By requiring districts to carefully consider their own needs and contexts and use evidence from their own districts and schools to generate Partnership goals, and then further requiring districts to provide evidence about their progress towards those goals, the Partnership Model helped orient districts around the use of data to help them strategically plan for improvement.
Partnership schools and districts used data conversations to improve communication and align instruction with Partnership goals. Second, many districts used conversations about their data to foster communication and collaboration between educators to align instruction with the Partnership goals. The charter leader from Senators showcased how, in his/her district, discussing data is a key part of the district- or school-level communication about the Partnership Agreement:
[O]ne of our staff meetings, we talked about it. They presented the goals. I bring them up constantly. We’re talking about data pull. We have one of our teachers who is over the data, so she/he’s always digging and showing the teachers and we’re communicating that information to them.
Similarly, the Red Wings’ district leader said:
Well, I think the other piece has been really forcing us to look at the reading and math scores and then the classroom teachers working with [a coach] to bridge the gap of where kids might not be understanding algebra or geometry and then giving those additional supports. That has been very helpful.
The Partnership Model helped orient districts around the use of data to help them strategically plan for improvement.
EPIC | Education Policy Innovation Collaborative — Michigan State University
99
Partnership leaders implemented new or revised processes to act on and make adjustments based on data, and this strategic use of data was credited with improving instruction. Blue Jackets’ district leader described monthly “building networks” that were put in place to analyze, discuss, and respond to data:
We’re focused on what we call our building networks. What they do is they, on a monthly basis, they meet and look at the data, non-instructional data and instructional data, again, to give a sense of how that building is functioning. Then they make adjustments based upon what goals they’ve set for themselves in each of those respective areas so that they put themselves on a path to reach their goals or their outcomes. Then, as a district, we look at all the buildings’ data, and we look to see if the district is on pace to reach its goals. We’re really focused on process this year and making certain we are attentive to our processes, that we’re monitoring them effectively, that we’re maintaining them effectively, and that we’re making real-
time adjustments based on the data that these processes are showing us.
Notably, this collaborative process generated discussions and integrated processes to analyze data between the school and the district. Ducks’ district leader also described a similar review cycle happening on a “quarterly basis.” Finally, the district leader of Capitals discussed a “collaborative learning-cycle process” as one important way they were working to meet their goals:
The two things I’m hanging my hat on are engaging classroom lessons — so student engagement — and formative assessment, so that we have a clear understanding where the kids are at every day, every hour, and we plan accordingly. We just took the NWEA, the fall NWEA test, a couple weeks ago. We’ve been disaggregating the data along with staff in our collaborative learning-cycle process and, ultimately, what we’re learning is flexibility and being able to be fluid in the course of a school year.
All these individual examples from different Partnership leaders underscore the importance districts placed on data use. In the implementation of the Partnership Model, data are a decision-making tool, a motivator for change, as well as evidence of progress. The process of being asked to look more closely at assessment data helped some districts get better at using those data strategically to improve instruction. In particular, leaders felt that collaborative processes integrating stakeholders at the school and district levels were particularly important.
Partnership educators reported an increased focus on the use of data for improvement. These instances of data use and reflection shown in our interviews with Partnership leaders were echoed by Partnership principals and teachers in our 2019-20 surveys. In these surveys, we asked about data use in multiple different ways, including in questions related to principal effectiveness, educators’ grades of their own schools and districts, changes in focus in the schools as a result of Partnership, and areas in which educators believed they would benefit from additional assistance. As is shown in Figure 4.8, across all these areas, we saw a strong focus on data use for improvement.
Data are a decision-making tool, a motivator for change, as well as evidence of progress.
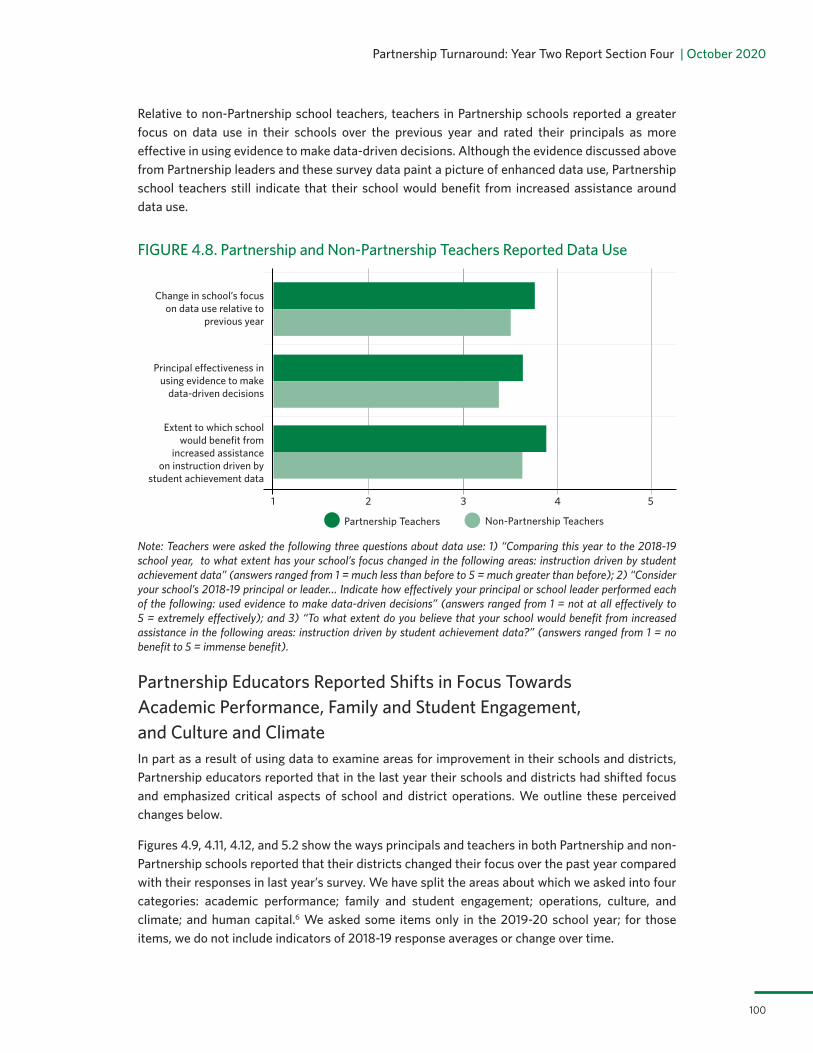
Partnership Turnaround: Year Two Report Section Four | October 2020
100
Relative to non-Partnership school teachers, teachers in Partnership schools reported a greater focus on data use in their schools over the previous year and rated their principals as more effective in using evidence to make data-driven decisions. Although the evidence discussed above from Partnership leaders and these survey data paint a picture of enhanced data use, Partnership school teachers still indicate that their school would benefit from increased assistance around data use.
FIGURE 4.8. Partnership and Non-Partnership Teachers Reported Data Use
1 3 52 4
Extent to which school would benefit from
increased assistance on instruction driven by
student achievement data
Partnership Teachers Non-Partnership Teachers
Principal effectiveness in using evidence to make
data-driven decisions
Change in school’s focus on data use relative to
previous year
Note: Teachers were asked the following three questions about data use: 1) “Comparing this year to the 2018-19 school year, to what extent has your school’s focus changed in the following areas: instruction driven by student achievement data” (answers ranged from 1 = much less than before to 5 = much greater than before); 2) “Consider your school’s 2018-19 principal or leader… Indicate how effectively your principal or school leader performed each of the following: used evidence to make data-driven decisions” (answers ranged from 1 = not at all effectively to 5 = extremely effectively); and 3) “To what extent do you believe that your school would benefit from increased assistance in the following areas: instruction driven by student achievement data?” (answers ranged from 1 = no benefit to 5 = immense benefit).
Partnership Educators Reported Shifts in Focus Towards Academic Performance, Family and Student Engagement, and Culture and ClimateIn part as a result of using data to examine areas for improvement in their schools and districts, Partnership educators reported that in the last year their schools and districts had shifted focus and emphasized critical aspects of school and district operations. We outline these perceived changes below.
Figures 4.9, 4.11, 4.12, and 5.2 show the ways principals and teachers in both Partnership and non-Partnership schools reported that their districts changed their focus over the past year compared with their responses in last year’s survey. We have split the areas about which we asked into four categories: academic performance; family and student engagement; operations, culture, and climate; and human capital.6 We asked some items only in the 2019-20 school year; for those items, we do not include indicators of 2018-19 response averages or change over time.

EPIC | Education Policy Innovation Collaborative — Michigan State University
101
Across all four areas, some familiar themes emerge. First, on average, educators reported that their schools pay about the same attention as they did in the previous year to each area, or that they have changed a little bit, to “slightly” more than before. There are no outlier areas in which educators believed that their schools have shifted focus such that they pay “much greater attention than before.” Second, for the most part, principals in both Partnership and non-Partnership schools were more optimistic about changes than were teachers in Partnership districts. Third, educators in Partnership schools tended to be more positive about changes in the past year than were educators in non-Partnership schools.
FIGURE 4.9. Educators’ Change in Focus — Academic Performance
Much Less than Before
About the Same as Before
Much Greater than Before
Slightly Less than Before
Slightly More than Before
Instruction driven by data
Assessments
Partnership Principals Non-Partnership PrincipalsIncrease Since 2018 Decrease Since 2018
Partnership Teachers Non-Partnership Teachers
Curriculum and instruction
Academic achievement for special student populations
Academic improvement for students on the cusp of
state test levels
School-wide academic performance
Note: Educators were asked, “Comparing this year to last year, to what extent has your school’s focus changed in the following areas?” We asked about school-wide academic performance for the first time in the 2019-20 survey.

Partnership Turnaround: Year Two Report Section Four | October 2020
102
Partnership educators reported increased attention to academic performance, with specific emphasis on curriculum and instruction-focused initiatives. Although there were common themes across the four areas, specific patterns emerged within each different element of school operations. The first clear takeaway from Figure 4.9 was that educators reported that their schools had placed greater focus — at least to some degree — on all elements related to academic performance. Partnership school educators reported slightly greater increases in focus on academic performance areas than did non-Partnership school educators. This was particularly the case for reports of increased focus for students on the cusp of state test levels and assessments, where Partnership school principals indicated the greatest increase in focus on this year’s relative to last year’s survey. Partnership principals reported a shift in focus towards data-driven instruction and curriculum and instruction, as well as school-wide academic performance.
Interviews with Partnership leaders affirmed an increased focus on academic performance in the 2019-20 school year, with particular attention paid to high-leverage instruction-oriented strategies. To that end, 17 of 22 district leaders interviewed reported that to achieve their Partnership Agreement goals, they increased focus on initiatives targeting the instructional core, including changing curricula, working to build teachers’ instructional capacities, and enhancing teacher recruitment and retention.
In particular, several districts decided to update curricula, particularly ELA materials. For instance, the charter leader of Wild explained:
We did purchase a new reading curriculum. After looking through our needs assessment, the reading curriculum actually stood out: a lack of resources and/or alignment, pacing, scope, sequence and organization, unification. We decide to purchase an all-inclusive reading curriculum, which we purchased with 21h funds.
Similarly, the district leader of Stars discussed how the district changed curricula in core academic areas (ELA and math) and focused on improving instruction as a central part of achieving their goals:
A lot of our process goals circled around English language arts and math, both new curriculums and counted assessments. […] Within those process goals, all that was embedded in addition to instructional rounds — which was a new process component that started with our Partnership — which is where teachers and staff travel within their school to observe kind of like a medical doctor would do. They go do rounds to help understand about patients. This would be teachers walk around to different classrooms in a structured format, not to evaluate the teacher but to review processes and then go back and reflect on what they’ve learned and what things they could take away from it.
In addition to the instructional rounds described by Stars’ leader, 13 leaders raised instructional coaching initiatives that their districts implemented to further develop their pedagogical skill sets. We discuss these initiatives in greater detail in Section Five.
Altogether, these leaders highlighted not only the central importance of core curricula in districts’ approaches to school turnaround work, but also the need to build teachers’ instructional capacity to use those materials to improve instruction. The Partnership Model — both through its focus on needs assessment and goal-setting and the infusion of 21h funds — enabled Partnership schools and districts to develop what leaders reported to be more robust curricula and aligned capacity building for educators to improve instruction.

EPIC | Education Policy Innovation Collaborative — Michigan State University
103
FIGURE 4.10. Potential Benefit From Increased Assistance — Academic Performance
No Benefit Moderate Benefit
Immense Benefit
Slight Benefit Significant Benefit
Assessments
Instruction driven by data
Partnership Principals Non-Partnership PrincipalsIncrease Since 2018 Decrease Since 2018
Partnership Teachers Non-Partnership Teachers
Curriculum and instruction
Supporting special populations of students
Improving academic outcomes for students on
the cusp of state test levels
Improving school-wide academic performance
Note: Educators were asked, “To what extent do you believe that your school would benefit from increased assistance in the following areas?” The question about school-wide academic performance was asked for the first time in 2019-20.
Yet even with this increased focus, Partnership educators reported that their schools would benefit from additional assistance in academic performance areas. In particular, principals and teachers in both Partnership and non-Partnership schools noted that their schools would significantly benefit from assistance in improving school-wide academic performance, improving academic outcomes for students on the cusp of state test levels, and supporting academic improvement for special populations of students. In particular, Partnership school principals reported a greater need for assistance in the latter two areas in the 2019-20 school year than they had in the year previous.
Notably, however, in the areas discussed thus far in this report, Partnership educators reported the need for less assistance than they had in the previous year. In particular, survey responses from Partnership educators indicated greater comfort with curriculum, instruction, and data-driven instruction.

Partnership Turnaround: Year Two Report Section Four | October 2020
104
Partnership leaders and educators reported increased attention to family and student engagement and to school culture and climate.Partnership leaders and educators looked beyond curriculum and instruction and initiatives focused directly on enhancing academic performance to focus more broadly on students, their families, and their schools. In particular, educators emphasized reforms that would orient schools around broader concerns relating to the whole child, to parents and the larger community, and to Partnership schools’ and districts’ own culture and climate.
Figure 4.11 shows that educators in Partnership schools reported paying more attention to family and student engagement activities in the 2019-20 school year than in the past. As is the trend, principals reported greater positive shifts in focus than did teachers, on average, and educators in Partnership schools believed their schools were changing their focus more than did educators in non-Partnership schools in Partnership districts. Figure 4.11 shows that Partnership principals in particular had increased attention to behavioral and attendance interventions. In addition, they reported that, on average, their schools had given slightly more attention to family and community engagement activities and to socio-emotional outcomes for students.
FIGURE 4.11. Educators’ Change in Focus — Family and Student Engagement
Much Less than Before
About the Same as Before
Much Greater than Before
Slightly Less than Before
Slightly More than Before
Afterschool programs
Attendance interventions
Partnership Principals Non-Partnership Principals
Increase Since 2018
Decrease Since 2018
Partnership Teachers Non-Partnership Teachers
Student behavioral interventions
Socio-emotional outcomes for students
Family and community engagement
Note: Educators were asked, “Comparing this year to the 2018-2019 school year, to what extent has your school’s focus changed in the following areas?”
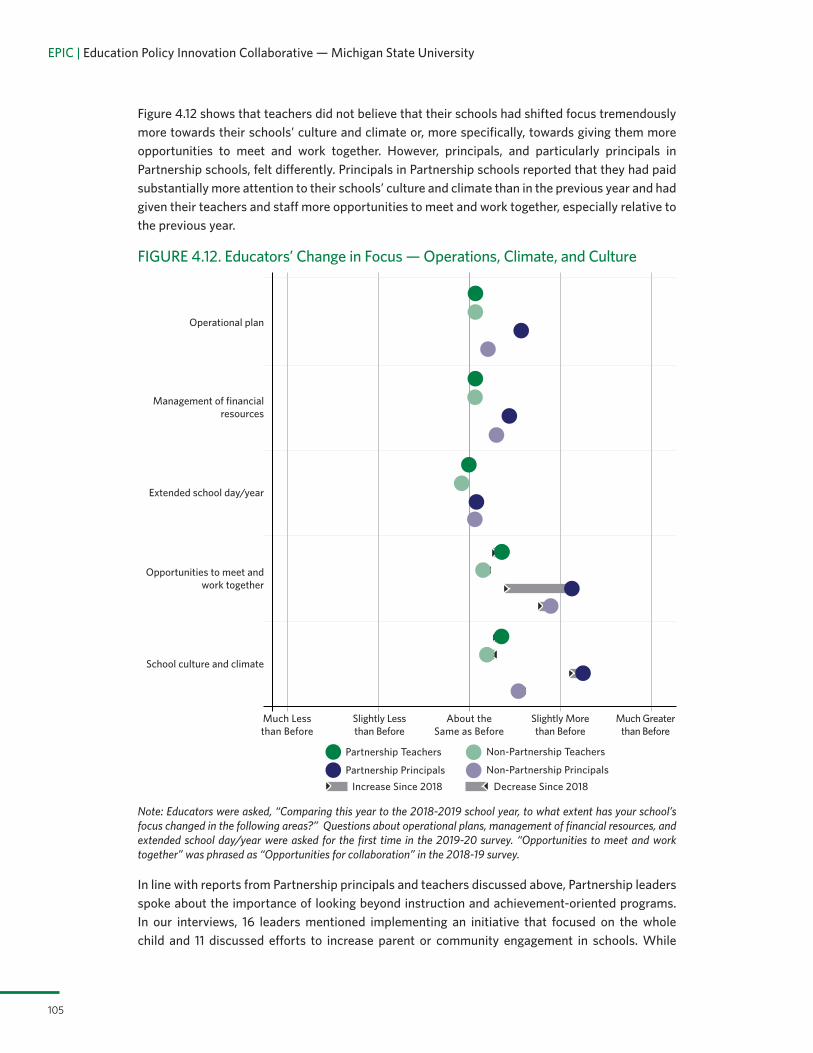
EPIC | Education Policy Innovation Collaborative — Michigan State University
105
Figure 4.12 shows that teachers did not believe that their schools had shifted focus tremendously more towards their schools’ culture and climate or, more specifically, towards giving them more opportunities to meet and work together. However, principals, and particularly principals in Partnership schools, felt differently. Principals in Partnership schools reported that they had paid substantially more attention to their schools’ culture and climate than in the previous year and had given their teachers and staff more opportunities to meet and work together, especially relative to the previous year.
FIGURE 4.12. Educators’ Change in Focus — Operations, Climate, and Culture
Much Less than Before
About the Same as Before
Much Greater than Before
Slightly Less than Before
Slightly More than Before
School culture and climate
Opportunities to meet and work together
Partnership Principals Non-Partnership PrincipalsIncrease Since 2018 Decrease Since 2018
Partnership Teachers Non-Partnership Teachers
Extended school day/year
Management of financial resources
Operational plan
Note: Educators were asked, “Comparing this year to the 2018-2019 school year, to what extent has your school’s focus changed in the following areas?” Questions about operational plans, management of financial resources, and extended school day/year were asked for the first time in the 2019-20 survey. “Opportunities to meet and work together” was phrased as “Opportunities for collaboration” in the 2018-19 survey.
In line with reports from Partnership principals and teachers discussed above, Partnership leaders spoke about the importance of looking beyond instruction and achievement-oriented programs. In our interviews, 16 leaders mentioned implementing an initiative that focused on the whole child and 11 discussed efforts to increase parent or community engagement in schools. While

Partnership Turnaround: Year Two Report Section Four | October 2020
106
curriculum and instruction initiatives were most often discussed as examples of how districts were working to meet their Partnership goals, districts also highlighted their efforts to enhance school culture and climate as worth the expenditure of time, money, and human capital. This increased focus on whole-child and non-instructional elements of schooling echoed Partnership teachers and principals’ reports of their schools’ and districts’ increased focus on just these activities. Moreover, interviews with Partnership leaders suggested that these initiatives frequently arose from a close look at their data and strategic planning around how to address what they found in their internal needs assessments.
Partnership districts implemented whole-child initiatives as a necessary complement to improvements to the instructional core. Whole-child initiatives included implementing or enhancing Positive Behavior Interventions Supports (PBIS), Multi-Tier System of Supports (MTSS), trauma-informed practices, and student healthcare resources. These efforts were wide-ranging, from using PBIS and MTSS to improve behavior management systems and decrease suspensions, to working with attendance agents to combat chronic absenteeism, and to adding a greenhouse as both a STEM learning tool and potential source for fresh produce for families. District leaders emphasized that social-emotional learning and trauma-informed practices were important to help address some of the non-academic reasons student outcomes may not be at desired levels. The charter leader of Flyers was particularly proud of reducing their suspension rates, and credits training in trauma-informed practices with this change:
I would say two of the key things that we’ve done that are really helping with that are one, every summer we bring together our entire organization for two weeks of pre-school year learning and development, focused only on the strategies that we’ve used and outlined in our Partnership Agreement, both instructionally, culturally, systemically essentially. We made the decision this school year to have 100 percent of our staff, from our lunch ladies to our janitors to our teachers, our principals, everybody trained in ACEs, Adverse Childhood Experiences, to start the conversation about how childhood traumas impact student’s day-to-day interactions and experiences within our classrooms and our schools to start to help people have a lens for separating behavior from the person and looking at student behavior as the visible result of a prior trauma and actually starting to inform and equip our folks with tools to address the trauma as opposed to just the behavior. That has made a significant impact in the way in which adults interact with kids, talk with kids, address student — what
16 LEADERSmentioned implementing an initiative
that focused on the whole child.
and
11 LEADERSdiscussed efforts to increase
parent or community engagement in schools.
EPIC | Education Policy Innovation Collaborative — Michigan State University
107
they perceive to be misbehaviors and the extent to which they’re willing to build what some may say are unconventional relationships with kids that extend into a land of like true empathy, but actually caring for kids, not just caring about kids.
The charter leader of Hurricanes also shared how effective it was to be able to better understand the barriers his/her students faced. She/he discussed how Hurricanes employed interventionists and attendance supports to help students:
A large part of the issue was that students weren’t coming to school. It’s hard to get students to perform and reach proficiency when they’re not at school. What we noticed was that there were barriers at times. Whether it was lack of access to healthcare, because the student is sick, or lack of transportation, or clothing, things of that sort were barriers to where if they arise—that when they were to arise, students were deciding to stay home from school. Being able to have someone who can work as a liaison between home and school to try to cover those needs so those kids are in school is important.
These leaders highlighted that for students to benefit from improved curricula and instruction, students needed to have other non-academic needs met first so that they could attend and focus on classes. While these whole-child approaches were varied, they were often data-driven and considered an important part of districts’ Partnership work.
Partnership leaders expressed the need to focus more on parent and community involvement initiatives. Relatedly, half the Partnership leaders interviewed felt that parent or community involvement in school was critical to enable them to reach their Partnership goals. The Senators’ charter leader noted that families often get left out of improvement efforts and explained how they have tried to include parents and families in their school community:
We’re also being pushed far as [building] community. […]In order to increase
enrollment, we have to meet all the needs of the students, so making sure we have a social worker in place, making sure we have busses to pick up families when we have parent-teacher conferences or Black history or holiday programs. All of the things above.
Likewise, one Partnership leader talked about how schools can address the needs of the community, using as an example, their inclusion of swimming in their programming while also focusing on academic achievement:
While whole-child approaches were varied, they were often data-driven and considered an important part of districts’ Partnership work.

Partnership Turnaround: Year Two Report Section Four | October 2020
108
When we talk about community involvement and community buy-in and community belief, it’s critical that we show some really substantial things that matter to our community. Right now, in [our] county, there’s 40,000 students and there is one high school pool at [Neighboring District]. Then, one pool that’s part of a community athletic association that you have to pay a fee to get into. Drowning is a big issue. We’re surrounded by water. Black children drown at a rate of 5.5 times a white child. […] I mean, it does relate back to all these other goals, including achievement, when you can illustrate stability and have the community really rally around you. Those are all related things, right?
As is clear from these two examples, family engagement efforts were valued and considered an important part of many districts’ Partnership work. For instance, the Flames district leader listed parent engagement as one of their three main goals towards improvement. Ducks, a district that has an extensive network of community partners involved in their work, explained that community engagement “has been critical for us in terms of moving the needle for kids and eliminating the barriers that were getting in the way of families accessing additional supports.”
Although districts like the Senators and Blues discussed these specific ways that they were working with community groups, as a whole there were fewer concrete examples of parent and community engagement, and instead more of an acknowledgement that these are important goals. This was reflected in survey responses (shown in Figure 4.13.1) that show only marked increased attention to family and community engagement by Partnership school principals. The charter leader of Lightning provided some insight into why this may be the case, highlighting that engagement efforts might be a next step:
Last year, we had minimal—we had minimal time, honestly, to put into building those [community] partnerships. Even though it was there, it was weak, but it existed, and we knew we needed to expand on that. We knew that going into this year we needed to really work on that.
Many Partnership leaders viewed community and parent engagement as key to addressing some of the non-academic challenges that students face as a whole. Partnership districts were still determining the best ways to engage with and include families and parents in their work.
Partnership leaders and educators worked to improve school and district culture and climate.There is a growing evidence base from the turnaround literature that places the culture and climate of schools and districts at the center of turnaround efforts. For instance, in one
Family engagement efforts were valued and considered an important part of many districts’ Partnership work.

EPIC | Education Policy Innovation Collaborative — Michigan State University
109
study of school turnaround in a large urban district, Cucchiara, Rooney, and Robertson-Kraft (2013) found that teachers’ perceptions of their schools’ culture and working conditions are associated with their support for turnaround reforms. In another, Mette (2014) examined two rural schools undergoing a turnaround reform and described how cultural and community conditions supported school turnaround efforts.
Both principals and teachers in Partnership districts reported that they believed their schools and districts were focusing more on culture and climate (see Figure 4.12). They also expressed somewhat positive views of their schools’ culture and climate, while citing a few areas in which they believed that their culture and climate excelled. Comparisons over time and between Partnership and non-Partnership school educators suggested that Partnership schools might struggle with culture and climate.
Figure 4.13.1 shows that principals in Partnership districts believed that their schools had a safe and orderly environment and administrators consistently enforced behavioral standards. They also believed, on average, that staff had shared beliefs and values about the mission of the
school and about their schools’ greatest challenges, and reported that their school met student socio-emotional needs. Teachers in both Partnership and non-Partnership schools believed that staff had shared beliefs about their schools’ greatest challenges and that teachers had high expectations for students. As we saw in other areas of our work, and similar to last year, we found that principals reported better impressions of school culture and climate than did teachers.
Across both principals and teachers, Partnership school educators reported a more challenging culture and climate than did their counterparts in non-Partnership schools. Though the differences between Partnership and non-Partnership principals were descriptively larger, they were not always statistically significant given the much smaller population
of principals in our survey sample. In the case of teachers, however, the challenges in culture and climate reported by those in Partnership schools were comparatively less acute but were more frequently statistically significant. These indicated perhaps small but real differences between the environments experienced by Partnership and non-Partnership schools.
Moreover, Partnership principals’ reports of culture and climate, on average, became less positive since last year, whereas non-Partnership principals often reported increases in indicators of culture and climate. Neither Partnership nor non-Partnership teachers’ views of their schools’ culture and climate changed substantially over the past year.
Partnership leaders viewed community and parent engagement as key to addressing some of the non-academic challenges that students face as a whole.

Partnership Turnaround: Year Two Report Section Four | October 2020
110
FIGURE 4.13.1. Principals Report Change in Culture and Climate in Partnership and Non-Partnership Schools
Partnership Principals Non-Partnership PrincipalsIncrease Since 2018 Decrease Since 2018
Strongly Disagree
Fights are common at this school
There is a high degree of staff turnover
There is a high degree of student mobility
Students are excited and enthusiastic to come to
school
Students listen to staff
Staff work to build trusting relationships with parents
Staff have shared beliefs and values about the mission of the school
Teachers consistently enforce behavioral
standards
Teachers effectively manage student behavior
Teachers have strong rapport with students
Teachers have high expectations for students
Administrators consistently enforce behavioral
standards
This school meets students’ socio−emotional needs
This school does a great job of meeting students’
academic needs
Our school has a safe and orderly environment
Disagree Neither Disagree nor Agree
Agree Strongly Agree
Staff have shared beliefs about this school’s greatest
challenges
Note: Principals were asked, “Please indicate the extent to which you agree or disagree with the following statements about your school.” The question about “Staff have shared beliefs about this school’s greatest challenges” was only asked of principals in 2019-20.

EPIC | Education Policy Innovation Collaborative — Michigan State University
111
FIGURE 4.13.2. Teachers Report Change in Culture and Climate in Partnership and Non-Partnership Schools
Partnership Teachers Non-Partnership TeachersIncrease Since 2018 Decrease Since 2018
Strongly Disagree
Fights are common at this school
There is a high degree of staff turnover
There is a high degree of student mobility
Students are excited and enthusiastic to come to
school
Students listen to staff
Staff work to build trusting relationships with parents
Staff have shared beliefs and values about the mission of the school
Teachers consistently enforce behavioral
standards
Teachers effectively manage student behavior
Teachers have strong rapport with students
Teachers have high expectations for students
Administrators consistently enforce behavioral
standards
This school meets students’ socio−emotional needs
This school does a great job of meeting students’
academic needs
Our school has a safe and orderly environment
Disagree Neither Disagree nor Agree
Agree Strongly Agree
Staff have shared beliefs about this school’s greatest
challenges
Note: Teachers were asked, “Please indicate the extent to which you agree or disagree with the following statements about your school.”

Partnership Turnaround: Year Two Report Section Four | October 2020
112
Together, this survey evidence paints a picture of Partnership schools that are struggling with culture and climate and working conditions. However, school and district leaders reported improvements in these critical areas. Figure 4.13.1 shows how principals in particular were optimistic that their schools were making improvements to culture and climate. Partnership district and charter leaders also recounted active steps to improve how students, families, and educators experienced schooling in Partnership districts. Nine of the 22 Partnership leaders with whom we spoke noted that they were placing an emphasis on culture and climate. In line with their colleagues in these other districts, when discussing what had been important for their work to turn around their schools, the charter leader of Wild told us:
I would say PBIS. I would say a climate and culture coach. I would say staff retention. I would say student retention. I would say consistency, predictability as far as in the classroom, and just procedures and protocols throughout the building. There’s so many pieces to that. I have a behavior team of a few individuals that have different certifications and expertise that build relationships. I would say professional development on relationship building, administration, promoting a “relationship first” mentality. I could go on and on I feel like.
Although she/he discussed several factors in addition to a “climate and culture coach,” all of the elements she/he listed in this excerpt were central to an organization’s culture and the working and learning conditions for educators and students.
These multiple sets of data suggest that administrators acknowledged their schools’ challenges with culture and climate and were intentionally working to improve working and learning conditions in their schools and districts. In Section Five, we return to the important role of improvements in culture and climate to recruit and retain educators in Partnership districts. In the vignette below, we highlight efforts in all three of our case sites toward improving culture and climate.
As is clear from the case study vignettes, Partnership educators and leaders understood the importance of increased attention to family and student engagement and culture and climate. Although they were working to improve their efforts in these areas, they still faced challenges in doing so. Figures 4.14 and 4.15 highlight principals’ and teachers’ expressed need for greater assistance in addressing these challenging and complex shifts in engagement and culture.
9 OUT OF 22 PARTNERSHIP LEADERS
Partnership leaders with whom we spoke noted that they
were placing an emphasis on culture and climate.
Principals in particular were optimistic that their schools
were making improvements to culture and climate.

113
Case Study Vignette 02: Educators Felt That Improving Culture and Climate Was Foundational to Meeting Partnership Goals
02/Case Study
Vignette
Educators Felt That Improving Culture and Climate Was Foundational to Meeting Partnership Goals
All the case study sites noted that improving the culture and climate of Partnership schools was crucial and put in place initiatives to do so. Flames focused on increasing student and parent engagement, Stars focused a great deal on improving chronic absenteeism and improving their disciplinary methods, and Blues focused on the instructional climate — specifically, providing increasingly rigorous and meaningful instruction. All these initiatives were viewed as critical ways to improve the culture and climate of Partnership schools. For example, leaders felt that increasing student and parent engagement and reducing student absenteeism would improve students’ and teachers’ feelings of success, which could, in turn, lead to an increase in teacher satisfaction and student achievement.
Partnership leaders at each site felt that the focus of their efforts were well-matched to their unique issues [see Case Vignette #01]. Flames’ principal explained that they were focused on parent and student engagement and trying new things to increase engagement. For example, Flames’ leader reported:
Everyone understands the importance of engaging the parents, so we’re speaking the same language in school and out of school and continuing that learning environment. We were doing normal things, parent-teacher conferences and different things, but some of the parents just weren’t coming to those types of events. So what we’ve tried to do is roll in some exciting

114
EDUCATORS FELT THAT IMPROVING CULTURE AND CLIMATE WAS FOUNDATIONAL TO MEETING PARTNERSHIP GOALS
02/Case Study
Vignette
events [and] also give them information. So, for example, last week we had [an information session]. Well, you know, they come and do trick or treating around the cars. Well, while they were going to each stop, they had to stop at stations and get information about the third-grade reading bill and about [our new reading curriculum]. So we’re still having that engagement, still having fun, but it’s in an environment where they’ll show up. And the line was out the door for them to come in. So we consider that a success, whereas before it would have just been trick or treat and kids would have came and got candy and that was it.
Nearly all the teachers we spoke to felt that this renewed focus on parents and students contributed to a “family-oriented culture,” as one teacher put it. They explained further: “We’re very supportive to the families that come into the door. We want their kids to make it to school and to be a part of our culture here at Flames, so we make sure we reach out to them and if there’s any issues that they’re having, we try to resolve it.”
Although the increased focus on family and community engagement appeared important to the school’s improvement efforts, some Flames teachers attributed the positive changes in culture and climate more to the new principal’s leadership than to any specific initiatives. One teacher noted:
She/he’s very knowledgeable about what’s expected in the classroom and the reality of the classroom. I feel like she/he has an open-door policy. I can always come and ask questions. She/he does listen. She/he’s very open and she/he listens to everything that we have to say and she/he’ll give you suggestions on how to resolve any issues that you have and she/he’ll support you.
Another teacher agreed and said of the new leader and his/her contribution to the culture, “She/he’s more visible, and she/he’s really friendly. Not to say that the other one wasn’t, because she/he was friendly too… So that helps change the culture because a lot of people look up to him/her and like him/her and she/he has a relationship with the teachers, so I think that helps.”

115
EDUCATORS FELT THAT IMPROVING CULTURE AND CLIMATE WAS FOUNDATIONAL TO MEETING PARTNERSHIP GOALS
Still, despite feeling “family-oriented,” two other teachers explained that culture remained a struggle that they were “working on” — specifically, they noted that student behavior was challenging and stressful.
Similarly, the principal of Stars discussed elements of culture and climate as the school’s first priority. In particular, Stars focused on efforts the principal believed would improve student engagement and attendance: getting all students to consistently attend school, improving teacher-student relationships, and reducing suspensions. She/he explained:
I think there’s a lot more focus on [culture and climate] now, and we just have a better understanding of how they fit into the turnaround of the building… we want to reduce our suspension numbers, increase attendance because it doesn’t matter how well we do as a staff. If the instruction is excellent and only 75 percent of our students are in those classrooms, it’s not going to make a difference, so we work on culture and climate, we work on attendance, we work on truancy, and that’s been our focus. From research I’ve done, that’s pretty much the starting point of any big turnaround is to make sure that the students come in, they feel like they’re engaged, they don’t want to miss school, and we make it a priority for parents as well.
Nearly everyone we interviewed at Stars saw improvement in terms of reducing suspensions and improving student behavior, due largely to a new staff member who was implementing a play-based, grant-funded program (the grant dollars did not come from the school’s 21h or RAG funds). Even with this added attention to culture and climate and increasing attendance, some teachers still felt that there was not enough in place to fully address the challenge:
Attendance is challenging. I understand in the past, I think they used to do some kind of incentive, but we haven’t done anything this year. That’s definitely very challenging. A lot of the kids will also come in late, and so even though they are not absent, if they come in an hour late, they may miss my whole math lesson. We really don’t have a lot in place for attendance and
02/Case Study
Vignette

116
EDUCATORS FELT THAT IMPROVING CULTURE AND CLIMATE WAS FOUNDATIONAL TO MEETING PARTNERSHIP GOALS
02/Case Study
Vignette
tardiness. Behavior I think compared to the schools I have been in the past; we are really strong with behavior.
By contrast, educators at Blues reported less of a focus on managing student behavior and put more emphasis on instructional efforts. Still, two Partnership principals in the district agreed that school culture and climate were foundational to their instructional efforts. One principal said of the culture, “it’s a family feel” and another noted that relationship building was foundational to teaching and learning:
It’s just to settle that tone to get those relationships established and built so that students feel this is a place that they wanna be at and as well as stuff and that connection of course when those things happen. It takes time, but when it happens, then you do get a climate that is conducive to teaching and learning.
The Blues teachers with whom we spoke felt optimistic about the instructional efforts and the culture of their school, yet one noted how challenging it was to maintain these efforts:
I think the hardest thing is time. You’re always — I’ll give you today. I’m trying to do a project that has to be in. You’re like, do I have PBIS? Do I have CHAMPS [a classroom management program]? Do I have band? Am I in this? Do I have an after-school meeting? Time hits everyone. To me, the biggest challenge is time. There just doesn’t seem to be enough of it.
This teacher’s concern about the amount of time required reflects how difficult the work of school turnaround can be, even when those doing it feel it is going well.
Together, these efforts across all three case sites illustrated how challenging and important it was to improve the culture and climate of each Partnership school, the varied strategies educators used, and how school culture was foundational to any effort at school improvement.

EPIC | Education Policy Innovation Collaborative — Michigan State University
117
FIGURE 4.14. Potential Benefit From Increased Assistance — Family and Student Engagement
No Benefit
Moderate Benefit
Immense Benefit
Slight Benefit
Significant Benefit
Afterschool programs
Attendance interventions
Partnership Principals Non-Partnership PrincipalsIncrease Since 2018 Decrease Since 2018
Partnership Teachers Non-Partnership Teachers
Student behavioral interventions
Socio-emotional outcomes for students
Family and community engagement
Note: Educators were asked, “To what extent do you believe that your school would benefit from increased assistance in the following areas?”
In particular, Figure 4.14 makes clear that Partnership principals believed they required substantial and increasing assistance in all five areas of our survey. In contrast, teachers seemed to have been already more aware of the need for help in these areas, with little change between 2018-19 and 2019-20 in their beliefs about the benefits their schools would receive from increased assistance.
Figure 4.15 highlights the school culture and climate areas in which Partnership teachers and principals reported the need for increased assistance. School culture and climate and opportunities to meet and work together — exactly the areas on which educators reported increased focus —topped the list, with Partnership school principals in particular reporting a substantial increase in the perceived need for assistance since last year.

Partnership Turnaround: Year Two Report Section Four | October 2020
118
FIGURE 4.15. Potential Benefit From Increased Assistance — School Culture and Climate
No Benefit
Moderate Benefit
Immense Benefit
Slight Benefit
Significant Benefit
School culture and climate
Opportunities to meet and work together
Partnership Principals Non-Partnership PrincipalsIncrease Since 2018 Decrease Since 2018
Partnership Teachers Non-Partnership Teachers
Extended school day/year
Management of financial resources
Operational plan
Note: Educators were asked, “To what extent do you believe that your school would benefit from increased assistance in the following areas?” Questions about opportunities to meet and work together were only asked in 2019-20, and the question about extended school day and year was only asked of principals in 2018-19.
EDUCATORS PERCEPTIONS OF IMPROVEMENTS IN PARTNERSHIP SCHOOLS AND DISTRICTSThis section has reviewed evidence that Partnership schools are improving in some areas relative to similar schools not selected for Partnership, and delved into potential reasons that we may see positive signals of improvement. However, as the Partnership Model itself recognizes, there is more to school and district improvement than can be easily measured by test scores or rates of graduation, drop-out, or retention. Here we again turn to the voices of the Partnership educators — the teachers and principals on the ground — to understand how they view their schools and their jobs two or three years into Partnership implementation.

EPIC | Education Policy Innovation Collaborative — Michigan State University
119
Educators in Partnership Schools Are Increasingly Satisfied With Their JobsOne key indicator of Partnership Model success is simply educators’ satisfaction with their jobs. Overall, this section has highlighted substantial and substantive areas of alignment in reports from Partnership leaders, principals, and teachers about ways that Partnership schools and districts implemented the Partnership reform to improve both academic and non-academic outcomes for students. This may translate into Partnership district educators’ increased satisfaction with their jobs.
As we show in Figure 4.16, both teachers and principals in Partnership schools reported increased satisfaction with their jobs relative to their responses on last year’s survey. In 2018-19, Partnership school teachers were less satisfied with their jobs than were non-Partnership school teachers. However, in 2019-20, Partnership and non-Partnership school teachers reported a similar level of overall job satisfaction. Similarly, Partnership principals reported lower levels of job satisfaction in 2018-19, but Partnership principals reported a greater sense of satisfaction in 2019-20. While both sets of teachers and principals were neutral to leaning positive in their responses to the question about job satisfaction, the movement of Partnership educators toward increased job satisfaction signaled improvements in their perceptions of their working conditions and their schools.
FIGURE 4.16. Educators’ Overall Job Satisfaction
Strongly Disagree
Partnership Principals Non-Partnership Principals
Partnership Teachers Non-Partnership Teachers
Disagree Neither Agree nor Disagree
Agree Strongly Agree
Overall job satisfaction 2019
Overall job satisfaction 2018
Note: Educators were asked, “To what extent do you agree with the following statement? I am satisfied with my job.”

Partnership Turnaround: Year Two Report Section Four | October 2020
120
Grading Themselves: Partnership Educators Give Themselves Higher Grades in 2019-20 Than in 2018-19Another way to assess how educators perceived their schools and districts is by simply asking them to grade several elements of their schools and districts. Figure 4.17.1 and Figure 4.17.2 shows educators’ responses to survey questions that asked them to grade their schools across 22 different areas. The markers show educators’ beliefs in the 2019-20 school year, with the lines conveying how these perceptions have shifted since they were asked the same question in 2018-19. There are four main takeaways from these figures.
First, we found that educators in Partnership schools gave their schools between a B and a C overall and on nearly every element about which we asked. Principals and teachers gave their schools the highest marks for many of the same elements: schools’ reliance on substitute teachers, professional development and support for teachers, access to technology, and curriculum. They also largely converged on their schools’ low points: availability and quality of substitute teachers and student attendance.
Second, Figure 4.17.1 and Figure 4.17.2 make clear that educators in Partnership schools believed that their schools were performing better overall and in many areas in 2019-20 than they did in 2018-19. Notably, while Partnership principals gave their schools lower grades in the areas of student attendance, academic achievement, and the availability of substitute teachers, their grades in these areas increased significantly between the first and second year of the survey. Partnership teachers gave their schools higher grades across the board this year in all areas except finance and student enrollment, which decreased only slightly. This suggests that teachers in Partnership schools were experiencing improvements within their schools over time.
This brings us to the third important takeaway from these data: In 2019-20, Partnership school teachers’ grades were nearly as high as those given by principals in many areas (although still notably lower in their “overall” grade. This is different from last year’s findings, in which Partnership school teachers felt less positively than did their principals in nearly every area.
Principals and teachers gave their schools the highest marks for many of the same elements: schools’ reliance on substitute teachers, professional development and support for teachers, access to technology, and curriculum.

EPIC | Education Policy Innovation Collaborative — Michigan State University
121
FIGURE 4.17.1. Principals’ Grades in Partnership and Non-Partnership Schools
Partnership Principals Non-Partnership PrincipalsIncrease Since 2018 Decrease Since 2018
F
Availability of subs
Quality of substitutes
Student discipline
Student attendance
Culture and climate
Ability to support student subgroups
Staff retention
Academic achievement
Teacher recruitment
Teacher retention
Collaboration within the district
Family and community engagement
Management of financial resources
Student attendance
Literacy practice and instruction
Collaboration within the school
Curriculum
Professional development and support for teachers
Teacher attendance
D C B A
OVERALL
Access to technology
Note: Principals were asked to grade their schools in each of these areas. Questions about teacher recruitment and quality of substitutes were only asked in 2019-20.

Partnership Turnaround: Year Two Report Section Four | October 2020
122
FIGURE 4.17.2. Teachers’ Grades in Partnership and Non-Partnership Schools
Partnership Teachers Non-Partnership TeachersIncrease Since 2018 Decrease Since 2018
F
Availability of subs
Quality of substitutes
Student discipline
Student attendance
Culture and climate
Ability to support student subgroups
Staff retention
Academic achievement
Teacher recruitment
Teacher retention
Collaboration within the district
Family and community engagement
Management of financial resources
Student attendance
Literacy practice and instruction
Collaboration within the school
Curriculum
Professional development and support for teachers
Teacher attendance
D C B A
OVERALL
Access to technology
Note: Teachers were asked to grade their schools in each of these areas. Questions about teacher recruitment, quality of substitutes, and collaboration within the district were only asked in 2019-20.

EPIC | Education Policy Innovation Collaborative — Michigan State University
123
Fourth, we found again that educators in non-Partnership schools gave their schools slightly higher grades than did educators in Partnership schools. However, these differences were often not large, especially for teachers. The greatest differences reported by principals were in student attendance, student enrollment, family and community engagement, teacher attendance, staff retention, quality of substitute teachers, and overall. The areas where non-Partnership teachers gave their school higher grades included student enrollment and teacher retention. However, both Partnership teachers and Partnership principals gave their schools higher grades for professional development for teachers than did their counterparts in non-Partnership schools, suggesting that Partnership leaders were making some meaningful improvements.
Educators Recognized Improvements in Areas Partnership Districts and Schools Targeted for ReformWhile these overlapping sources of data pointed to a predominantly positive view of Partnership implementation and efforts in the 2019-20 school year, they did come with certain caveats. In particular, not all educators reported that Partnership schools and districts improved over time. For instance, as is clear from Figure 4.18.1 and Figure 4.18.2, when we asked teachers and principals in Partnership districts about
the degree to which different features of their school had changed over the previous year, the average response for both landed in the middle, citing “no change” as opposed to “changed for the better” or “changed for the worse.” This suggests that the changes educators experienced may be modest, on average.7 At the same time, there are areas in which Partnership educators reported more positive change than their non-Partnership peers, such as culture and climate, the quality of facilities, the quality of professional development provided to teachers, academic expectations of students at their school, teachers’ willingness to collaborate, morale at the school, and staff participation in decision-making.
Additionally, comparing the responses of Partnership school educators this year to last year reveals educators’ beliefs that important areas of Partnership school operations did change for the better. In particular, Figure 4.18.1 and Figure 4.18.2 show that Partnership school educators reported more positive change over time in many of the areas discussed earlier as foci of school and district improvement efforts. In particular, Partnership school principals reported substantial improvements in the quality of professional development, facilities and the physical environment of their schools, and staff morale.
PARTNERSHIP EDUCATORS
REPORTED MORE
POSITIVE CHANGE IN
SEVERAL AREAS.
There are areas in which Partnership educators reported more positive change than their non-Partnership peers, such as culture and climate, the quality of facilities, the quality of professional development provided to teachers, academic expectations of students at their school, teachers’ willingness to collaborate, morale at the school, and staff participation in decision-making.

Partnership Turnaround: Year Two Report Section Four | October 2020
124
FIGURE 4.18.1. Principals’ Reported Change Since the Prior Year
Partnership Principals Non-Partnership PrincipalsIncrease Since 2018 Decrease Since 2018
Significantly for the Worse
Staff morale
Parental engagement/support
Staff participation in decision−making
Culture and climate
Facilities/physical environment
Community/external partnerships
Socio−emotional supports for students
Ability to try new practices
Quality of professional development
Quality of teaching staff
Academic expectations
Willingness to collaborate
Focus on student learning
Ability to allocate funds to meet school goals
Ability to select staff to meet goals
Slightly for the Worse
No Change Slightly for the Better
Significantly for the Better
Note: Principals were asked, “To what extent have the following features of your school changed since last school year?”

EPIC | Education Policy Innovation Collaborative — Michigan State University
125
FIGURE 4.18.2. Teachers’ Reported Change Since the Prior Year
Partnership Teachers Non-Partnership TeachersIncrease Since 2018 Decrease Since 2018
Significantly for the Worse
Staff morale
Parental engagement/support
Staff participation in decision−making
Culture and climate
Facilities/physical environment
Community/external partnerships
Socio−emotional supports for students
Ability to try new practices
Quality of professional development
Quality of teaching staff
Academic expectations
Willingness to collaborate
Focus on student learning
Slightly for the Worse
No Change Slightly for the Better
Significantly for the Better
Note: Teachers were asked, “To what extent have the following features of your school changed since last school year?”

Partnership Turnaround: Year Two Report Section Four | October 2020
126
SUMMARYThis section has described how Partnership has changed education in Partnership schools and districts. In terms of students’ growth in performance on third through eighth grade achievement tests, we found that in the second year of implementation, Cohort 1 schools continued to improve relative to the pre-identification and identification years, but that growth rate slowed down such that only achievement on the ELA M-STEP was significantly different from performance in the identification year. High school students in Partnership districts also performed well in ELA, as measured by the SAT, in the second year of implementation. Students in Cohort 2 Partnership schools fared slightly less well in their first year than their Cohort 1 counterparts had the year before, but they still saw marginal improvements in both math and ELA in grades three to eight. However, students in Cohort 2 Partnership had lower achievement growth in the first year of Partnership implementation. Matching these positive but muted results, Partnership educators reported being somewhat optimistic about improvements in student outcomes over the next year to three years, and in particular Partnership school principals grew increasingly certain that Partnership would positively affect student outcomes in the coming years.
We then turned to our qualitative and survey data to help us understand why we might be seeing these results. We found that Partnership principals reported that their districts were increasing focus on several important areas of operation. In particular, our data suggested that the Partnership Model facilitated improvements by enabling schools and districts to access and use data to help them identify areas for improvement and strategically plan how to address aspects of operations and schooling that needed attention. Critically, Partnership schools and districts turned their attention to curriculum and instructional capacity-building initiatives while at the same time underscoring the importance of focusing on whole-child and broader reforms to improve student learning and well-being.
SECTION FOUR NOTES1. A standard deviation is a common way to calculate changes in a test score relative to its average.
2. We note that in the Cohort 1 ELA three through eight achievement model, there was some evidence of a downward trend in achievement for students in Partnership schools relative to those in Priority schools even before identification. This is not particularly surprising given that Partnership schools were chosen in part as a result of their pre-year performance. This downward trend might help to explain the negative result in the identification year but would suggest that the gain in year of implementation is a true effect of the reform.
3. The increase in graduation rates and decrease in drop-out rates could conceivably be the product of policies that send lower-performing kids out of the district. We are pursuing additional analyses to test this hypothesis.
4. We only asked this question of educators who reported that they were aware of their Partnership Agreements.
5. We added questions about alignment in the areas of strengths, weaknesses, and resources for the 2019-20 survey.
6. We also asked about educators’ perceived shifts in focus on human capital initiatives. We show these responses in Figure 5.2 and discuss them in the accompanying text in Section Five.
7. The average reflects that most educators responded “no change;” there were few educators who responded strongly one way or the other.

EPIC | Education Policy Innovation Collaborative — Michigan State University
127
Partnership Turnaround: Year Two Report
SECTION FIVE:WHAT HUMAN CAPITAL CHALLENGES FACE PARTNERSHIP SCHOOLS AND DISTRICTS?
EPICEducation Policy Innovation Collaborative

Partnership Turnaround: Year Two Report Section Five | October 2020
128
Section Five: What Human Capital Challenges Face Partnership Schools and Districts?
WHAT HUMAN CAPITAL CHALLENGES FACE PARTNERSHIP SCHOOLS AND DISTRICTS, AND HOW ARE EDUCATORS IN THESE DISTRICTS ADDRESSING THEM? We devote a section in this report to human capital, and in particular to the challenges Partnership schools and districts face related to educator recruitment, retention, and development and to the ways that their leaders are working to address these difficulties. We chose to focus on human capital for several reasons. First, the literature on school and district turnaround has identified human capital concerns as one of the most fundamental areas that must be addressed in turnaround reforms (see Henry, Pham, Kho, & Zimmer, 2020; Malen & Rice, 2016; Papay & Hannon, 2018; Strunk, Marsh, Hashim, Bush-Mecenas, & Weinstein, 2016; Sun, Penner, & Loeb, 2017; Zimmer, Henry, & Kho, 2017). Second, this general finding in the national turnaround literature is playing out in Michigan; our Year One Report surfaced shared attention to issues of human capital amongst Partnership schools and districts, and it is important to follow up. Third, districts across the country are discussing human capital shortages and they are particularly acute in the nation’s most traditionally disadvantaged districts. Understanding what Michigan’s Partnership schools and districts are doing to address this challenge may provide insights not only for Michigan policymakers but also for educators across the country.

EPIC | Education Policy Innovation Collaborative — Michigan State University
129
AN OVERVIEW OF EDUCATORS IN PARTNERSHIP SCHOOLS AND DISTRICTSBefore delving into the human capital challenges and successes Partnership schools and districts experienced in the 2019-20 school year, we provide a brief overview of the educators in Partnership schools and districts relative to those in other districts across Michigan. Here we discuss the educator work force in Partnership schools in the 2018-19 school year, the most recent year for which administrative data were available at the time of this report.1
Tables 5.1.1 and 5.1.2 provide descriptive characteristics of educators in Partnership schools and districts, in non-Partnership comparison districts and schools, and statewide in Michigan, all in the 2018-19 school year.
TABLE 5.1.1. Description of Educators in Cohort 1 Partnership Districts and Schools, 2018-19
Cohort 1 Partnership
Schools
Cohort 1 Partnership
Districts
Cohort 1 comparison (Priority schools never
Partnership)
Non-Partnership Districts
TEACHERS
N 887 4,350 3,111 73,795
% White 37.3% 47.5% 59.5% 93.2%
Black 49.4% 42.1% 32.9% 2.8%
Hispanic 1.4% 2.8% 3.0% 1.2%
Other Non-White 12.0% 7.6% 4.7% 2.7%
Mean Years of Experience in MI 12.4 13.5 11.2 13.1
First-Year 8.2% 9.3% 11.5% 5.8%
Second-Year 1.2% 1.0% 1.8% 0.9%
% Long-Term Substitutes 2.0% 2.2% 3.8% 1.4%
With Master's Degree or Higher 61.8% 63.4% 51.7% 58.9%
Rated Ineffective or Minimally Effective 4.2% 3.2% 4.5% 1.3%
Exiting the District* 15.7% 8.9% 12.5% 4.0%
PRINCIPALS AND ASSISTANT PRINCIPALS
N 61 320 190 3,410
% White 8.2% 17.2% 28.9% 88.8%
Black 86.9% 74.4% 62.1% 8.4%
Hispanic 1.6% 4.4% 6.3% 1.1%
Other Non-White 3.3% 4.1% 2.6% 1.7%
Mean Years of Experience in MI 15.9 18.6 16.6 15.1
With Master's Degree or Higher 95.1% 94.0% 79.4% 83.6%
Exiting the District* 6.6% 3.8% 6.3% 3.0%
Notes: Teachers are defined as individuals whose greatest full-time equivalent assignment is as a teacher. Principals and assistant principals are defined as those whose greatest full-time equivalent is in an assignment code as “principal” or “assistant principal” per state reporting. “Other non-white” includes personnel with any of the following ethnicities: American Indian or Alaska Native, Asian, Native Hawaiian or Pacific Islander, and Two or More Races. *Exiting the district is defined as either transferring to a new district or no longer appearing in the data. Source: Data from the Michigan Department of Education and the Center for Educational Performance and Information.

Partnership Turnaround: Year Two Report Section Five | October 2020
130
TABLE 5.1.2. Description of Educators in Cohort 2 Partnership Districts and Schools, 2018-19
Cohort 2 Partnership
Schools
Cohort 2 Partnership
Districts
Cohort 2 comparison (Priority schools never
Partnership)
TEACHERS
N 1,730 6,546 2,623
% White 48.3% 60.0% 67.2%
Black 44.5% 31.5% 26.0%
Hispanic 1.5% 2.9% 2.3%
Other Non-White 5.7% 6.6% 4.5%
Mean Years of Experience in Michigan 12.7 13.0 9.5
First-Year 12.5% 10.2% 14.3%
Second-Year 1.3% 1.5% 2.0%
% Long-Term Substitutes 4.1% 2.9% 6.4%
With Master's Degree or Higher 55.4% 57.3% 48.8%
Rated Ineffective or Minimally Effective 5.3% 3.4% 4.7%
Exiting the District* 13.1% 9.3% 11.5%
PRINCIPALS AND ASSISTANT PRINCIPALS
N 128 486 157
% White 15.6% 29.8% 37.6%
Black 78.1% 61.7% 55.4%
Hispanic 3.9% 5.1% 3.2%
Other Non-White 2.3% 3.3% 3.8%
Mean Years of Experience in Michigan 17.1 17.0 14.0
With Master's Degree or Higher 79.5% 84.1% 81.5%
Exiting the District* 3.1% 4.1% 3.8%
Notes: Teachers are defined as individuals whose greatest full-time equivalent assignment is as a teacher. Principals and assistant principals are defined as those whose greatest full-time equivalent is in an assignment code as “principal” or “assistant principal” per state reporting. “Other non-white” includes personnel with any of the following ethnicities: American Indian or Alaska Native, Asian, Native Hawaiian or Pacific Islander, and Two or More Races. If a district has a Partnership school in both Cohorts 1 and 2, we consider them a Cohort 1 district. *Exiting the District is defined as either transferring to a new district or no longer appearing in the data. ** The Cohort 2 comparison group are non-Partnership schools that are in the 1st-10th percentile of the Michigan School Index System as referenced in Section Two. Source: Data from the Michigan Department of Education and the Center for Educational Performance and Information.
As Tables 5.1.1 and 5.1.2 indicated, the make-up of teachers in Partnership schools and districts differed remarkably from the state average. Less than half of the teachers in either cohort of Partnership schools were white, compared with 90 percent of teachers statewide. Correspondingly, 49.2 percent of Cohort 1 and 44.5 percent of Cohort 2 teachers were black, relative to just 2.8 percent of teachers in non-Partnership districts across the state. Partnership districts employed higher rates of first-year teachers than non-Partnership districts statewide, with nine percent of teachers in Cohort 1 districts and 10.5 percent in Cohort 2 districts in their first year of teaching in Michigan, relative to six percent of teachers outside of Partnership districts. Partnership school teachers were rated ineffective at higher rates than teachers in the rest of the state. Finally, teachers in Partnership schools and districts exited their respective districts at far higher rates than teachers in non-Partnership districts.
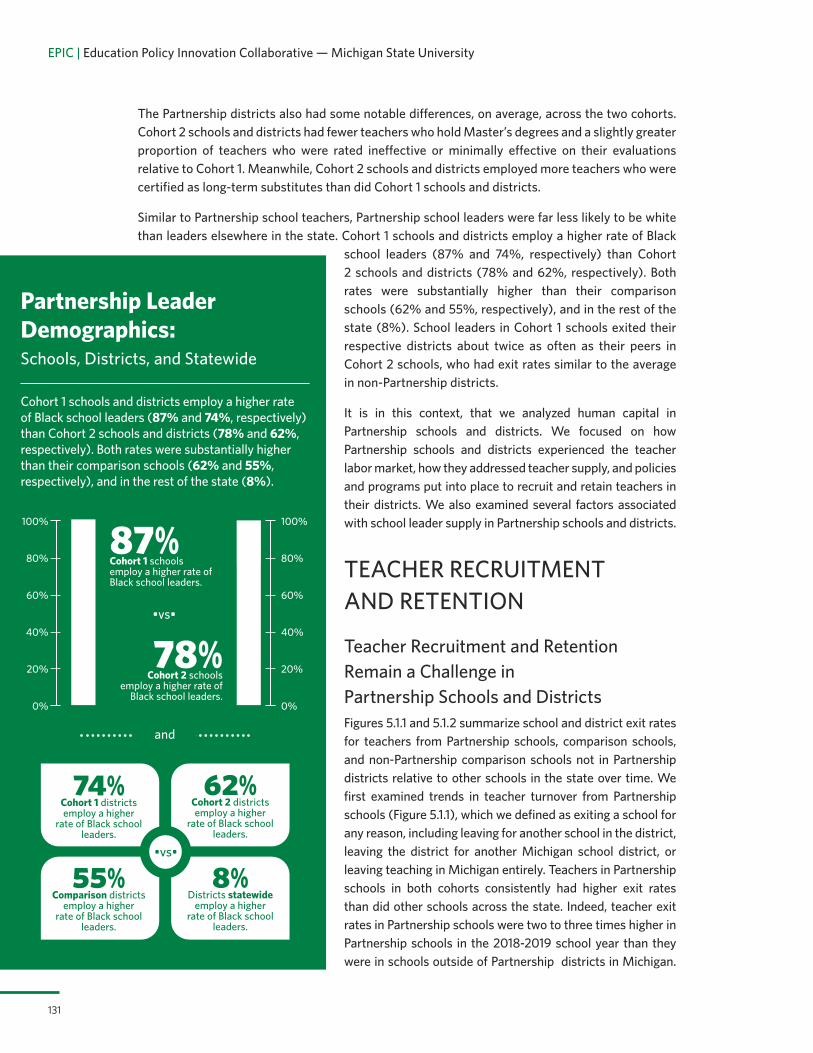
EPIC | Education Policy Innovation Collaborative — Michigan State University
131
The Partnership districts also had some notable differences, on average, across the two cohorts. Cohort 2 schools and districts had fewer teachers who hold Master’s degrees and a slightly greater proportion of teachers who were rated ineffective or minimally effective on their evaluations relative to Cohort 1. Meanwhile, Cohort 2 schools and districts employed more teachers who were certified as long-term substitutes than did Cohort 1 schools and districts.
Similar to Partnership school teachers, Partnership school leaders were far less likely to be white than leaders elsewhere in the state. Cohort 1 schools and districts employ a higher rate of Black
school leaders (87% and 74%, respectively) than Cohort 2 schools and districts (78% and 62%, respectively). Both rates were substantially higher than their comparison schools (62% and 55%, respectively), and in the rest of the state (8%). School leaders in Cohort 1 schools exited their respective districts about twice as often as their peers in Cohort 2 schools, who had exit rates similar to the average in non-Partnership districts.
It is in this context, that we analyzed human capital in Partnership schools and districts. We focused on how Partnership schools and districts experienced the teacher labor market, how they addressed teacher supply, and policies and programs put into place to recruit and retain teachers in their districts. We also examined several factors associated with school leader supply in Partnership schools and districts.
TEACHER RECRUITMENT AND RETENTION
Teacher Recruitment and Retention Remain a Challenge in Partnership Schools and DistrictsFigures 5.1.1 and 5.1.2 summarize school and district exit rates for teachers from Partnership schools, comparison schools, and non-Partnership comparison schools not in Partnership districts relative to other schools in the state over time. We first examined trends in teacher turnover from Partnership schools (Figure 5.1.1), which we defined as exiting a school for any reason, including leaving for another school in the district, leaving the district for another Michigan school district, or leaving teaching in Michigan entirely. Teachers in Partnership schools in both cohorts consistently had higher exit rates than did other schools across the state. Indeed, teacher exit rates in Partnership schools were two to three times higher in Partnership schools in the 2018-2019 school year than they were in schools outside of Partnership districts in Michigan.
Partnership Leader Demographics: Schools, Districts, and Statewide
Cohort 1 schools and districts employ a higher rate of Black school leaders (87% and 74%, respectively) than Cohort 2 schools and districts (78% and 62%, respectively). Both rates were substantially higher than their comparison schools (62% and 55%, respectively), and in the rest of the state (8%).
80%
60%
40%
20%
0%
100%
87% Cohort 1 schools employ a higher rate of Black school leaders.
78% Cohort 2 schools
employ a higher rate of Black school leaders.
80%
60%
40%
20%
0%
100%
•vs•
and
•vs•
74% Cohort 1 districts employ a higher
rate of Black school leaders.
62% Cohort 2 districts employ a higher
rate of Black school leaders.
55% Comparison districts
employ a higher rate of Black school
leaders.
8% Districts statewide
employ a higher rate of Black school
leaders.

Partnership Turnaround: Year Two Report Section Five | October 2020
132
In 2018-19, nearly 30 percent of teachers were exiting Partnership schools, relative to only 15 percent in non-Partnership schools in Partnership districts and the state average of less than 10 percent. Although Cohort 1 exit rates were trending down through 2017-18, they bounced back up in 2018-19. This is dissimilar to Cohort 2, in which exit rates have been climbing over the last several years but declined in the most recent year.
FIGURE 5.1.1. Trends in Teachers’ School Exit Rates by School Type
Scho
ol E
xit R
ates
0
.05
.1
.15
.2
.25
2013-14 2014-15 2015-16 2016-17 2017-18 2018-19
Cohort 1 Partnership SchoolsCohort 2 Partnership Schools
Non-Partnership Schools in Partnership DistrictsState Average
Identification YearCohort 1
.3
.35
Identification YearCohort 2
Figure 5.1.2 shows that these exit rates were largely driven by teachers’ exits from Partnership districts altogether. Teachers in each category exhibited the same general trends over time, with district exit rates nearly four times as high in Partnership schools as they were in the rest of the state.
FIGURE 5.1.2. Trends in Teachers’ District Exit Rates by School Type
Dis
tric
t Exi
t Rat
es
0
.05
.1
.15
.2
.25
2013-14 2014-15 2015-16 2016-17 2017-18 2018-19Identification Year
Cohort 1
.3
.35
Identification YearCohort 2
Cohort 1 Partnership SchoolsCohort 2 Partnership Schools
Non-Partnership Schools in Partnership DistrictsState Average

EPIC | Education Policy Innovation Collaborative — Michigan State University
133
Given these high and persistent rates of turnover, it was not surprising that Partnership leaders told us that recruitment and retention issues were a central concern to their districts, echoing a familiar refrain from our interviews last year. Indeed, 20 of 22 Partnership leaders raised teacher supply as a major concern in the 2019-20 school year. In particular, many Partnership leaders expressed that it was difficult to find teachers — and particularly high-quality teachers — in the current market. This included the Rangers’ charter leader, who succinctly stated, “The problem is the pool is just small.” Similarly, the district leader from Devils recounted:
For every opening, you used to get 40 applicants, 10 of whom were very hirable, 5 of whom were probably great. I’m talking up till about 5 years ago. Now, you are lucky to get one, extremely lucky to get two or three, and incredibly lucky if one of them is really a hirable candidate.
While Partnership district leaders consistently reported challenges in recruiting effective teachers, the responses of principals and teachers in our survey suggested some nuance to this issue. As noted in Section Four, Partnership school teachers gave their schools lower grades (a “C”) for teacher recruitment and teacher retention than for many other factors (see Figure 4.17.2.), illustrating that building- and classroom-level educators also perceived human capital challenges. At the same time, however, principals and teachers in Partnership schools did not raise alarms about their schools’ and districts’ capacities to recruit and retain teachers. Both teachers and principals in Partnership schools tended to respond that they “neither disagree nor agree” with the statement, “There is a high degree of staff turnover at my school.” Additionally, as shown in Figure 5.5, principals in Partnership schools reported that they experienced slightly less than “some difficulties” in hiring teachers at their schools, which was a decrease in hiring difficulty relative to the responses Partnership principals gave on last year’s survey.
Survey responses also indicated that teachers and principals did not see their schools placing greater focus on human capital concerns in the 2019-20 school year. Figure 5.2 shows educators’ responses to questions asked about changes in school focus in 2019-20, relative to the same items asked in 2018-19. Neither teachers nor principals in Partnership districts reported many changes in focus on areas related to human capital. The only areas Partnership principals believed had been paid even slightly more attention were professional development for teachers and, to some extent, teacher recruitment and hiring and salary and compensation for teachers.
While these results suggested some variation in how teachers, principals, and district leaders perceived human capital challenges in their schools, this does not mean that some respondents were more correct in their perceptions than others. Rather, different roles may shape the information they have on, and perceptions of, these human capital challenges. Moreover, minimal changes in focus on teacher supply and development in 2019-20 may reflect more on an already strong focus on issues related to teacher recruitment, retention, and development rather than a lack of concern. Indeed, Partnership district principals and teachers expressed the need for increased assistance with resources that would aid in teacher recruitment and retention. Figure 5.3 shows the human capital-related factors with which Partnership district principals and teachers said their schools and districts would benefit from additional assistance. Crucial areas such as salary/compensation for teachers and incentives to retain teachers topped the list for both principals and teachers, with all parties noting that assistance in these areas would be significantly to immensely beneficial.

Partnership Turnaround: Year Two Report Section Five | October 2020
134
FIGURE 5.2. Educators’ Change in Focus — Human Capital
Much Less than Before
About the Same as Before
Much Greater than Before
Slightly Less than Before
Slightly More than Before
Administrator dismissal
Salary/compensation for administrators
Partnership Principals Non-Partnership PrincipalsIncrease Since 2018 Decrease Since 2018
Partnership Teachers Non-Partnership Teachers
Administrator recruitment/hiring
Teacher dismissal/reassignment
Incentives to recruit and retain teachers
Salary/compensation for teachers
Teacher recruitment/hiring
*Teacher evaluation
Professional development
Note: Educators were asked, “Comparing this year to the 2018-2019 school year, to what extent has your school’s focus changed in the following areas?” Questions about salary/compensation for teachers and administrators and monetary incentives to recruit and retain teachers were asked for the first time in the 2019-20 survey. *Teacher evaluation (Partnership and non-Partnership) was asked both years but the means are exactly the same.

EPIC | Education Policy Innovation Collaborative — Michigan State University
135
FIGURE 5.3. Potential Benefit from Increased Assistance — Human Capital
No Benefit Moderate Benefit
Immense Benefit
Slight Benefit Significant Benefit
Partnership Principals Non-Partnership PrincipalsIncrease Since 2018 Decrease Since 2018
Partnership Teachers Non-Partnership Teachers
Administrator dismissal
Teacher dismissal
Administrator hiring
Teacher evaluation
Teacher professional development
Teacher hiring and recruitment
Incentives to recruit teachers
Incentives to retain teachers
Salary/compensation for teachers
Pay incentives for administrators
Note: Educators were asked, “To what extent do you believe that your school would benefit from increased assistance in the following areas?” Questions about incentives to recruit and retain teachers and salary/compensation for teachers were asked for the first time in 2019-20.

Partnership Turnaround: Year Two Report Section Five | October 2020
136
Several Factors Impede Teacher Hiring and RecruitmentPrincipals reported that there were several factors contributing to hiring challenges. Figure 5.4 shows how Partnership district principals in both Partnership and non-Partnership schools rated the impact of 10 different school features on their ability to recruit and hire teachers. Partnership school principals reported that all 10 factors had a more negative impact on their ability to hire teachers than did principals in non-Partnership schools in Partnership districts. Partnership school principals believed that teachers’ salaries were a substantial impediment to teacher hiring, and that this had become more the case over time. They also reported that students’ family backgrounds, the school’s culture and climate, the academic performance of the student body, the school’s Partnership status, student attendance, the socio-economic status of the community, student discipline, and the school’s location play roles in making it difficult to hire new teachers, although not particularly large ones. These principal perceptions align with expressed preferences of teachers in low-performing schools in Tennessee, where a recent study found teachers value consistent enforcement of discipline policies, school safety, and salary in their employment decisions (Viano, Pham, Henry, Kho, & Zimmer, 2020). Principals in non-Partnership schools, by contrast, reported far fewer elements as contributors to difficulties with hiring, and even suggested that several may slightly positively impact recruiting efforts.
FIGURE 5.4. Principals’ Reports of Hiring Difficulties
Partnership Principals Non-Partnership PrincipalsIncrease Since 2018 Decrease Since 2018
Very Negatively Impacts
Does Not Impact
Very Positively Impacts
Teacher salaries
Somewhat Negatively Impacts
Somewhat Positively Impacts
School/district geographical location
Student discipline
Socio-economic status of the community
Student attendance
School/district Partnership status
Academic performance of the student body
Climate and culture
Student family background
Ability to offer PD and support to teachers
Note: Principals were asked, “To what extent do the following factors affect your ability to recruit and hire teachers in your school?”

EPIC | Education Policy Innovation Collaborative — Michigan State University
137
Partnership leaders in their interviews also mentioned several of these areas as drivers of their districts’ recruitment challenges. Here we highlight two areas that contributed to many districts hiring difficulties: teacher compensation and Partnership status itself.
Teacher compensation.Like principals in Partnership schools, Partnership leaders also believed that compensation was a challenge for Partnership districts. The district leader of Avalanche told us, “we still have people who get job offers for 15 or 20 thousand dollars more a year, and they can’t afford not to go.” She/he went on:
The teachers during that deficit and prior to that took a 25 percent pay cut. […] we’ve not been able to bring that salary back up to or even close to where it was at one time, which means if a teacher goes a half-mile east, west, north, or south, they’re getting—they’re going to end up getting more money. When I say $20,000 more, I’ve got some teachers who are making $30,000 more if they could leave here and go other places, depending on if those other places will give them steps. Some places are offering signing bonuses and all of those pieces. Salary tends to still play a role in our retention.
The pay disparity between Partnership districts and their neighbors was common across districts. As we noted in our Year One Report, the average salary of teachers in Partnership districts falls in the bottom third of districts within the same ISD. Indeed, 12 out of the 22 district leaders with whom we spoke, mentioned compensation as a persistent challenge with teacher recruitment or discussed using compensation strategically for recruitment (more on this below).
Partnership school or district status. In our survey data, we found that Partnership principals reported that Partnership status had a slight negative effect on their ability to hire, whereas principals in non-Partnership schools within Partnership districts did not perceive much impact of the label on their ability to recruit teachers. Five Partnership leaders noted that Partnership status at times negatively influenced their ability to recruit and retain teachers, especially relative to other districts in the state. For instance, the charter leader of Flames shared that the label of “Partnership” contributed to their hiring challenges, recalling that job candidates had asked about the school’s Partnership status in interviews:
Some of them have done their research, and they say, “Yeah. I see that you’re a Partnership school. What does that mean? Is the school going to close?” They have literally asked those types of questions. I think there’s an uncertainty with Partnership schools. Because we know what it means and the support that’s in place, but with that label, I guess it’s more like how it used to be with the Reform Schools
54.5%
PARTNERSHIP LEADERS NOTED COMPENSATION AS
A HIRING CHALLENGE
The pay disparity between Partnership districts and their neighbors was common across
districts. Indeed, 12 out of 22 district leaders mentioned compensation
as a persistent challenge with teacher recruitment or discussed
using compensation strategically for recruitment.

Partnership Turnaround: Year Two Report Section Five | October 2020
138
where a lot of them were closed. With that, they don’t know. They’re not educated to what it all means. A lot of times, we are explaining to them. It may be a hindrance.
The charter leader of Hurricanes also felt that the label of “Partnership” hindered their recruiting efforts:
The overarching belief is that once we receive this label that there’s a strong possibility and probability we’re going to close. It becomes very difficult to recruit teachers with that label. We have been looking at how to create messaging that speaks to the reality of what being a Partnership school means, but also that speaks to the success that we’re having to build confidence in teachers that this will be a place for them to be able to work and be secure.
Similarly, the charter leader of Sabres shared that it can be difficult to attract teachers to what can be perceived as a more challenging work environment, both due to the needs of their student population and because of the label of being a Partnership school. She/he summarized their experience:
It’s been tricky. I think a large portion of that is simply because of the shortage in Michigan overall. […] Then, when you’re serving a high-need population — then to top it off, we’re a Partnership school. I mean, we don’t necessarily look like the shiniest buck on the street.
Partnership leaders similarly reported that the stigma of being a Partnership district had consequences not only for recruitment but also retention. The charter leader of Sabres shared that the negative connotation of the label affected teacher morale, “Just the morale component for the staff alone is really challenging because these words do matter. […] It’s about a label that continues to denigrate the work that the team is attempting to do.” Those leaders who felt the label negatively affected their teacher supply talked about how the uncertainty around job stability and the accountability pressure took a toll. The district leader of Capitals summarized, “[M]entally, I think it has had an effect on people staying in the [Partnership] school, […] and people that may be interested in a job but not interested in that job. There’s a lot of pressure.”
These leaders expressed that teachers were concerned about the school potentially closing and other factors associated with Partnership and discussed trying to carefully message how participating in the Partnership Model provided supports for improvement. Two leaders shared how they worked to frame the Partnership label as an opportunity. For example, the charter leader of Oilers said:
We’ve talked about the Partnership as being a positive initiative in terms of not being — like, nobody’s out to get us, but that the Partnership design itself through the state is really set up to assist schools to make the adjustments that they need to make for — to make better results for students in the end.
Thus, for teacher recruitment, it seemed important to combat the perception of Partnership as a negative accountability label with targeted messaging that Partnership entailed enhanced supports and advantages rather than negative consequences and stigma.

EPIC | Education Policy Innovation Collaborative — Michigan State University
139
Interestingly, among teachers already working in Partnership schools, Partnership status appeared to matter little in how they thought about their future. As shown in Figure 5.8, relatively few teachers identified their school’s Partnership status as a factor in their plans to stay in or leave their school and ranked it lower than other factors when they did.
RECRUITMENT AND HIRING CHALLENGES MAY BE EASING IN PARTNERSHIP SCHOOLS AND DISTRICTSAlthough there were challenges with teacher supply in Partnership schools and districts, educators’ reports in our survey data from the fall/winter of 2019-20 suggest that Partnership schools were seeing improvements in teacher recruitment and hiring. Figure 5.5 shows that, on average, principals in Partnership districts reported between minimal and some difficulty hiring teachers in their schools during 2019-20, and less difficulty than in 2018-19. Notably, Partnership school principals reported slightly less challenge hiring teachers into their schools than did principals in non-Partnership schools, who experienced an average increase in hiring difficulties this year relative to last. While both sets of principals believed that hiring teachers into their districts was more challenging than into their own schools (possibly suggesting a belief that their schools were relatively attractive compared to others in their districts), Partnership school principals also reported that their districts faced only “some” difficulty with hiring relative to non-Partnership districts, who expressed that their districts experienced “moderate” difficulty. Both Partnership and non-Partnership school principals believed that it was more difficult for their districts to hire teachers this year relative to the last.
FIGURE 5.5 Principals’ Reports of Hiring Difficulties
2018-2019No Difficulties
Partnership Principals Non-Partnership Principals
Minimal Difficulties
Some Difficulties
Moderate Difficulties
Substantial Difficulties
Hiring difficulty at school this year Hiring difficulty in the district this year2019-2020 2018-2019 2019-2020
Note: Principals were asked, “To what extent did your school and district experience difficulties in recruiting and hiring teachers this year (2019-2020)?”

Partnership Turnaround: Year Two Report Section Five | October 2020
140
Districts Implemented New Strategies to Address Persistent Recruitment Challenges This reported improvement in teacher recruitment didn’t just happen on its own. Partnership leaders at the district/charter and school levels worked hard to implement programs and policies to bring new and high-quality teachers to their schools and districts. Even though teachers and principals did not perceive a substantially increased focus on human capital-related initiatives (see Figure 5.2), a majority of Partnership leaders (13 out of 22) discussed their efforts to implement new initiatives to improve teacher recruitment and retention. These leaders shared a variety of creative endeavors to attract teachers, including offering financial incentives, implementing “grow-your-own” programs, and changing other hiring practices to find teachers who would be more likely to stay in their schools and districts.
Teacher compensation. Partnership district and school leaders believed that compensation was a critical driver of their challenges with teacher recruitment. Accordingly, Partnership leaders perceived salary to be among the most important levers for recruiting and retaining teachers in their districts.
Partnership leaders worked to implement programs to improve compensation and become more attractive to potential teachers. To that end, a full half of the Partnership leaders interviewed indicated that they were using pay incentives, through either salary increases, signing bonuses, or other financial incentives, to help recruit teachers. For instance, the charter leader of Flyers — who noted that their district had difficulty attracting experienced teachers with the necessary skills to meet their students’ needs—instituted a pay bump to attract more experienced teachers. The charter leader of Wild told us that they needed to offer competitive salaries — and likely higher salaries — to overcome recruitment and retention challenges associated with being a struggling district. She/he said:
We have been able to give teachers raises. We have been able to be competitive. Do I think failing school districts, should they be able to be even more competitive financially? I think that would be a huge benefit, so looking at the 21h and the funds being able to incentivize teachers to stay that probably would help more than anything. If you want to draw teachers to the actual school districts that need them, they should be incentivized. That would help more than anything.
The leader of Wild was not alone in his/her perception; many Partnership leaders specifically talked about the need to ensure that their pay was competitive relative to other districts. Even then, having a competitive salary was not always enough when neighboring districts had more resources
13 OUT OF 22
PARTNERSHIP LEADERS discussed their efforts to implement
new initiatives to improve teacher recruitment and retention.
They shared a variety of creative endeavors to attract teachers,
including offering financial incentives, implementing “grow-your-own” programs, and changing other
hiring practices.

EPIC | Education Policy Innovation Collaborative — Michigan State University
141
to up the ante. The district leader of Black Hawks shared that while they felt their salaries were competitive, they experienced some attrition when a neighboring district increased their pay scale across levels, “They were offering teachers even more money if they weren’t at the top of the scale. We actually lost maybe four teachers who were able to get significant raises because they became coaches in
[neighboring district].” Given these experiences, Partnership leaders felt salaries that were at least comparable to and ideally higher than those in neighboring districts were critical to being able to attract teachers to their district.
“Grow-your-own” programs. When districts were unable to find teachers through traditional recruitment strategies, several created “grow-your-own” programs to help substitute teachers become credentialed full-time educators, to attract new teaching interns into the district with the hopes that they stay on and become full-time certified teachers, or to mentor and develop teachers already in the district. Across Partnership districts, “grow-your-own” programs were at varying stages of program development and implementation.
Several of the districts that pursued such programs developed new partnerships with nearby universities,
and others enhanced already existing partnerships. University partners provided mentoring, professional development, and student career training opportunities. Ducks’ district leader shared some of their model:
It’s a multifaceted partnership. [...] They’re also helping us implement a teacher pipeline […] program. We also have another piece where we’re partnering with them to bring intern teachers to the district so that we can cultivate a relationship with them and get them to come back and teach in the district, as well as providing us with supports for our teachers who are in their first three years. That’s another piece of it. Then, they’re also offering summer camps for students to expand their experience with teacher STEM programs and our teacher pipeline program.
Devils conceptualized a program with a university partner where the university offered teacher training, placed interns within the district, and provided opportunities for high school students to take college courses. Blues structured theirs slightly differently by working with a university partner to mentor and train substitutes or instructional assistants in the district to become fully certified teachers.
One district shared a unique partnership they were exploring to help their recruitment efforts:
MDE came to us with a possible partnership with the Michigan Veterans Association. What they’re doing is they’re putting retired veterans through the teaching certification program, and then working to place them in schools to teach. They brought that to us as an option, because both of our — us being a [Partnership
Partnership leaders showed creativity in developing sources for new teachers who could be trained in pedagogy while working in the classroom.

Partnership Turnaround: Year Two Report Section Five | October 2020
142
district] and because of this program trying to get these veterans into schools as a possible means to assist with our issue of recruiting teachers.
This program, if effective, could offer several benefits and provide an interesting model for “grow-your-own” programs. It is intended to increase the supply of teachers, and particularly individuals with an array of other professional experiences who are more stable in their life trajectories rather than relying on substitutes or young, novice teachers who might be exit risks.
These examples are just some of the kinds of “grow-your-own” programs Partnership leaders offered that showed creativity in developing sources for new teachers who could be trained in pedagogy while they were working in these districts’ classrooms. These programs would enable districts to meet immediate staffing needs while working to improve less experienced teachers’ instructional capacity.
Districts and schools also paired financial incentives with teacher training and professional development. The district leader of Devils discussed working with a university partner to bring more interns into their district and incentivizing interns with payment similar to substitute teachers. In Ducks, the district paid teachers a stipend to attend professional development courses.
Notably, these “grow-your-own” programs required financial resources. No Partnership leaders told us they used 21h or RAG funding towards these programs, although some mentioned using other grants to support “grow-your-own” initiatives, or using the 21h/RAG funds in ways that freed up dollars for other district priorities such as “grow-your-own” programs. However, Partnership leaders expressed the need for additional funds beyond current levels to improve their abilities to recruit teachers. For instance, the Rangers’ charter leader discussed trying to find grants or other funding to offer discounts to substitutes seeking certification, and the Senators’ charter leader was similarly looking into ways to financially support candidates with bachelor’s degrees seeking alternative certification.
Changing hiring practices to reach “good fit” teachers. While the efforts described above would ideally enable districts to hire teachers with the experience, cultural awareness, and passion to drive complex or difficult change in Partnership districts, Partnership leaders still struggled to find such individuals and were sometimes forced to hire teachers who did not meet all of their needs. In particular, districts noted that it was difficult to find teachers who were perceived to be a good fit for the transformative work their schools were attempting. As the district leader of Devils noted, sometimes districts hired teachers who they suspected would not be fully aligned with their district needs simply because they needed someone to fill the position:
What you end up doing, is, you hire a person to fill a teaching job. They are qualified to be a teacher. They are certified, they can teach, but they are not passionate about being a teacher. […] We have hired a couple of folks who are people filling teaching jobs. They are not going to set the world on fire, they’re not going to make relationships and connections with kids, but they’re going to show up and allegedly teach. I’m not saying that’s all of them. We’ve hired some great people. I’m not saying that every one of them is like that, but we have been put in the situation where

EPIC | Education Policy Innovation Collaborative — Michigan State University
143
it’s not really any red flags, you just know that this person is not going to set the world on fire, and that’s what we need is people who are going to set the world on fire. Or have the willingness to learn how to do that, and that is unfortunate.
Some districts made changes to their hiring practices to reach teachers they felt would be the right fit for their districts, specifically looking for teachers who would mesh well with their district’s culture and climate and be less likely to leave. For example, the district leader of Avalanche shared how the district shifted its approach to hiring teachers:
First of all, we changed what we’re looking for when we hire.[…] We are very blunt about what they can expect working here—and really, the good, bad, and the ugly because we give a tremendous amount of support to teachers. […] Instead of getting [new-hire teachers] into the classroom and then figuring out, oh, my gosh.
I don’t really like serving the students of [Avalanche], or I don’t really like working for a principal that’s going to give me feedback, or I don’t really like to be expected to have to collaborate with my teacher colleagues, we’re just really straightforward about that up front.
Similarly, the charter leader of Flyers talked about how hiring for fit was important for both attracting the right teachers and sustaining their work force, and described some of the changes they made to their recruitment approach to find those best-fit teachers:
In the past we’ve had partnerships with certain organizations that are nationwide,
or regional, or even locally based that would filter us all of the first-year teachers that were looking to serve in an urban environment and it just wasn’t working out for our [school] in particular, especially [because] being a first-year teacher is hard enough, but also being sound at culturally responsive practices, how to deal with students that have trauma. We really focused on hiring people who have been in education serving this type of population for more than, you know, we were looking for at least three years of experience. As a result of that, our retention has been much higher this year too.
These examples showcase the importance of not only filling teaching positions with good teachers, but also with teachers who are good for the specific district.
Districts noted that it was difficult to find teachers who were perceived to be a good fit for the transformative work their schools were attempting.

144
Case Study Vignette 03: Blues Combined Creative Teacher Recruitment and Retention Efforts to Enable Complex Instructional Work
03/Case Study
Vignette
Blues Combined Creative Teacher Recruitment and Retention Efforts to Enable Complex Instructional Work
Educators in Blues reported that the district had faced substantial challenges with teacher retention, and that these difficulties affected not only school operations but also students’ abilities to learn. One ISD employee offered an example of Blues’ historical difficulty with teacher turnover:
There was one class one year that had five or six teachers by the end of the year and that class was out of control. There was — and rightfully so, the students really felt that this person was going to abandon them, there was a lack of trust. Every time someone walked in, they actually — we dug into it a little bit later and found out the students had a competition to see how long the person would stay. Like, “How quickly can we get this one to leave?”
As a result, educators in Blues reported that in previous years they needed to devote a large share of their time and effort to hire, train, and retrain a revolving door of new teachers who, in some cases, had never set foot in a classroom before.
In response to these challenges with retention and the resulting need to continuously recruit and develop teachers, in 2019-2020, Blues established a “grow-your-own” program, which was a partnership with a local university that gave new teachers or substitutes access to mentoring, tuition remission, and a full-time teaching job at Blues

145
BLUES COMBINED CREATIVE TEACHER RECRUITMENT AND RETENTION EFFORTS TO ENABLE COMPLEX INSTRUCTIONAL WORK
03/Case Study
Vignette
in exchange for a commitment to stay in their school for several years. Partnership leaders were purposeful in their partnership with the local university to create the “grow-your-own” program and believed that it was successful in stabilizing the teaching work force in the district during the 2019-20 school year. The Partnership coordinator and others explained, “[Human resources] and the superintendent sat down together and worked on [this university partnership]… Now that we have teachers in place, we don’t have so much turnover.”
The resulting work force stability allowed district and school leaders to focus their efforts less on training and then retraining brand new teachers and more on other district priorities, in particular on moving to “Tier Two” of their Positive Behavior Intervention System (PBIS) work. One district leader said:
Blues has been working on getting PBIS up and running, they’ve been doing Tier One for the past three years. They’ve really been growing in that and stabilizing their Tier One practices. Because they’ve had this stability in staff, they’ve been able to push forward this year further. We’re working on Tier Two. That’s huge progress and quite honestly countywide we have schools that are not Partnership status that struggle to get into that Tier Two and dig in the way that they have. I do think that a lot of that is because they’ve had stability in staff.
Tier One supports involved identifying expectations and expected behavior and establishing routines, while Tier Two work indicated a solid foundation wherein teachers and students could focus more deeply on academic instruction.2 The superintendent echoed the importance of having stability to move to Tier Two:
I don’t think we move to Tier Two until you have a solid Tier One, and the research would tell you that. We were struggling to get a solid Tier One because of our continued turnover. A lot of that comes even from the leadership aspects. Because you could get a teacher or two ramped up, but to get 50 percent of your staff up to speed and a principal is just not going to happen.

146
BLUES COMBINED CREATIVE TEACHER RECRUITMENT AND RETENTION EFFORTS TO ENABLE COMPLEX INSTRUCTIONAL WORK
03/Case Study
Vignette
While district staff were overwhelmingly positive about the “grow-your-own” program, we also wanted to understand how teachers themselves felt about it, to see whether there were discrepancies in how the program might be perceived. Teachers reported feeling positive about the “grow-your-own” program, and in particular the mentoring experience and the opportunity:
There’s a commitment to four or five years to stay. I think it’s individualized, depending on who you are. Yeah. You have to stay and commit to it. I feel like it’s a — that’s a great way. Because I’ve always wanted to be a teacher, and this is a small price to pay, I think, to get my degree and help out around here. Because I’m from [this area], so I think it’s cool.
From his/her perspective, there were several incentives to stay, including the mentoring support and being able to acquire a subsidized teaching degree. However, while an improvement from their days of chronic turnover, it is worth noting that Blues still had to largely take on the burden of developing brand-new teachers that had no prior training. As an ISD employee explained, to make the program attractive to prospective candidates, they often had to rely on recruiting substitute teachers:
Instead of getting the pay of what a certified teacher was getting, [substitute teachers] were getting, I don’t know [a small amount of money] a day… it was quite low. Now, they’re able to be paid as if they’re a certified staff member because they’re enrolled in the program and they’re being given emergency certification status until they’re able to get their full status of certified.
From this perspective, Blues remained at a disadvantage compared to other districts that might be able to offer higher pay and less difficult working conditions, therefore attracting more experienced teachers who did not need to be coached intensively about the basics of teaching. While Blues’ solution was creative and entrepreneurial, this reality underscored a persistent inequity between high poverty districts and surrounding districts.

EPIC | Education Policy Innovation Collaborative — Michigan State University
147
DIFFICULTIES PERSIST WITH RETENTION IN PARTNERSHIP SCHOOLSEven though there are cases like Blues, highlighted above, in which Partnership leaders noted improvements in teacher retention, our econometric models suggested that this was not the case in Partnership schools generally in the 2018-19 school year. We did not find a significant improvement in teacher retention for Cohort 1 Partnership schools, and models show a small increase in the probability that teachers leave Cohort 2 Partnership schools for other districts, relative to teachers in comparison schools.
Partnership Had Little Effect on Teacher Turnover for Cohort 1Tables 5.2.1 and 5.2.3 show the proportion of Partnership school teachers who left teaching in Michigan (row A) or left their districts for another Michigan school district (row B), relative to teachers in the appropriate comparison schools. In Table 5.2.1, Column 1 compares Cohort 1 Partnership schools relative to comparison schools in the year of identification and Columns 2 and 3 provide these results for teachers in each of the first two years of implementation. Table 5.2.2 provides the same results for Partnership and comparison schools just in Detroit Public Schools Community District (DPSCD). In both tables, Columns 4 through 6 provide results comparing the outcomes in the first implementation year relative to the identification year, the second year of implementation relative to the identification year, and the two implementation years against each other.
In Row A of Table 5.2.1, we see that in the identification year and the first year of implementation (2017-18), Cohort 1 Partnership teachers were three to four percentage points less likely to exit teaching in Michigan than were teachers in comparison schools. In the second year of implementation (2018-19), this effect lessens to only a one percentage point decrease in the probability of exit and is no longer statistically significant. While the coefficient indicating the probability that Cohort 1 Partnership school teachers exited for other Michigan districts (row B) was negative but statistically insignificant in the identification year, this reversed and became positive (but remained insignificant) in both implementation years. This suggests that there is no impact of Partnership on teachers’ propensities to transfer out of Partnership districts relative to their colleagues in similar schools.
When we examined these patterns just for early career teachers (in their first through fifth years of experience, shown in rows D through F), we found suggestive evidence that early career teachers in Partnership schools were less likely to exit teaching in Michigan in the identification year (five percentage points less likely to exit teaching in Michigan), although this trend reversed course over implementation and in Year Two of implementation they were significantly more likely to exit teaching relative to the identification year. This pattern was accentuated in DPSCD, where DPSCD Partnership school teachers experienced a substantial dip in their propensity to exit teaching in the identification year, after which point the trend also reversed course and early career teachers were significantly more likely to exit teaching in both years of implementation relative to the identification year.

Partnership Turnaround: Year Two Report Section Five | October 2020
148
TABLE 5.2.1. Cohort 1 Partnership Effects on Teacher Outcomes (Partnership Relative to Comparison Schools)
Identification on
(2016-2017)
Year One Implementation
(2017-2018)
Year Two Implementation
(2018-2019)
Implementation Year One
vs. Identification
Implementation Year Two
vs. Identification
Implementation Year One vs.
Implementation Year Two
(1) (2) (3) (4) (5) (6)
A. Probability of Leaving Teaching (all teachers)
-0.03*(0.01)
-0.04**(0.01)
-0.01(0.01)
+ *
B. Probability of Out-of-District Transfer (all teachers)
-0.02(0.03)
0.02(0.02)
0.02(0.02)
C. Probability of Within-District Transfer (all teachers)
0.02(0.03)
0.00(0.03)
0.01(0.04)
D. Probability of Leaving Teaching (1st-5th yr. teachers)
-0.05+(0.03)
-0.01(0.02)
0.03(0.02)
**
E. Probability of Out-of-District Transfer (1st-5th yr. teachers)
-0.03(0.05)
0.03(0.03)
0.04(0.04)
F. Probability of Within-District Transfer (1st-5th yr. teachers)
0.05(0.03)
0.06(0.04)
0.05(0.04)
G. Probability of Low Effectiveness Rating (all teachers)
-0.02(0.02)
-0.03(0.02)
-0.05*(0.02)
p<.10 +, p<.05 *, p<.01 **, p<.001 ***
Note: Cells show estimated changes in the probability of each type of outcome, with standard errors in parentheses. Full models include the covariates described in Section Four. Models contain year indicators, year x treatment indicators, teacher characteristics (race, gender, years of experience, education level), school-level student demographics, and school fixed effects with robust standard errors clustered by school. Coefficients in columns 1 to3 are relative to the year before identification. Columns 4 to 6 denote whether the coefficients in Column 1 to 3 are significantly different from the identification year (Columns 4 and 5) and implementation year (Column 6). A blank cell indicates that the coefficients are not statistically different. A cell with “+” or “*” indicates that the coefficients are significantly different at the significance level specified by the symbol. For example, the blank cell in Column 4, Row A, indicates that the change in the probability of leaving teaching in Partnership schools relative to non-Partnership schools from the identification year to Year One was not significantly different. The “+” in Column 5, Row A, indicates that the change in the probability of leaving teaching in Partnership schools relative to non-Partnership schools from the identification year to Year Two was different (p<.10). See Appendix B for full-model results and additional robustness checks and sample restrictions. Source: Author calculations using data retrieved from the Michigan Department of Education (MDE) and the Center for Educational Performance and Information (CEPI).
Similarly, in DPSCD (Table 5.2.2), we found that Partnership school teachers were four to five percentage points less likely to leave teaching in Michigan in the identification year and the first year of implementation, relative to other teachers in DPSCD comparison schools. Although the coefficient remained negative in Year Two of implementation, it lost magnitude and significance. DPSCD Partnership school teachers were five percentage points less likely to exit their districts for other Michigan districts in Year One of implementation. This trend remained in Year Two although it lost significance.
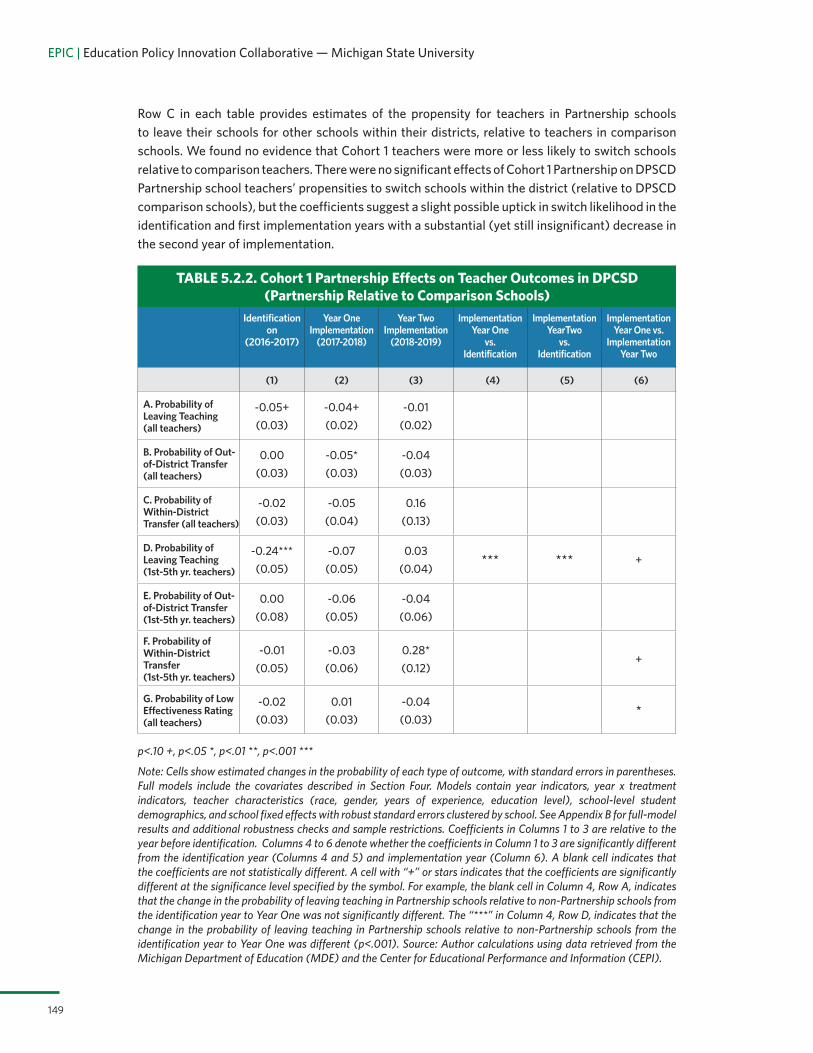
EPIC | Education Policy Innovation Collaborative — Michigan State University
149
Row C in each table provides estimates of the propensity for teachers in Partnership schools to leave their schools for other schools within their districts, relative to teachers in comparison schools. We found no evidence that Cohort 1 teachers were more or less likely to switch schools relative to comparison teachers. There were no significant effects of Cohort 1 Partnership on DPSCD Partnership school teachers’ propensities to switch schools within the district (relative to DPSCD comparison schools), but the coefficients suggest a slight possible uptick in switch likelihood in the identification and first implementation years with a substantial (yet still insignificant) decrease in the second year of implementation.
TABLE 5.2.2. Cohort 1 Partnership Effects on Teacher Outcomes in DPCSD (Partnership Relative to Comparison Schools)
Identification on
(2016-2017)
Year One Implementation
(2017-2018)
Year Two Implementation
(2018-2019)
Implementation Year One
vs. Identification
Implementation YearTwo
vs. Identification
Implementation Year One vs.
Implementation Year Two
(1) (2) (3) (4) (5) (6)
A. Probability of Leaving Teaching (all teachers)
-0.05+(0.03)
-0.04+(0.02)
-0.01(0.02)
B. Probability of Out-of-District Transfer (all teachers)
0.00(0.03)
-0.05*(0.03)
-0.04(0.03)
C. Probability of Within-District Transfer (all teachers)
-0.02(0.03)
-0.05(0.04)
0.16(0.13)
D. Probability of Leaving Teaching (1st-5th yr. teachers)
-0.24***(0.05)
-0.07(0.05)
0.03(0.04)
*** *** +
E. Probability of Out-of-District Transfer (1st-5th yr. teachers)
0.00(0.08)
-0.06(0.05)
-0.04(0.06)
F. Probability of Within-District Transfer (1st-5th yr. teachers)
-0.01(0.05)
-0.03(0.06)
0.28*(0.12)
+
G. Probability of Low Effectiveness Rating (all teachers)
-0.02(0.03)
0.01(0.03)
-0.04(0.03)
*
p<.10 +, p<.05 *, p<.01 **, p<.001 ***
Note: Cells show estimated changes in the probability of each type of outcome, with standard errors in parentheses. Full models include the covariates described in Section Four. Models contain year indicators, year x treatment indicators, teacher characteristics (race, gender, years of experience, education level), school-level student demographics, and school fixed effects with robust standard errors clustered by school. See Appendix B for full-model results and additional robustness checks and sample restrictions. Coefficients in Columns 1 to 3 are relative to the year before identification. Columns 4 to 6 denote whether the coefficients in Column 1 to 3 are significantly different from the identification year (Columns 4 and 5) and implementation year (Column 6). A blank cell indicates that the coefficients are not statistically different. A cell with “+” or stars indicates that the coefficients are significantly different at the significance level specified by the symbol. For example, the blank cell in Column 4, Row A, indicates that the change in the probability of leaving teaching in Partnership schools relative to non-Partnership schools from the identification year to Year One was not significantly different. The “***” in Column 4, Row D, indicates that the change in the probability of leaving teaching in Partnership schools relative to non-Partnership schools from the identification year to Year One was different (p<.001). Source: Author calculations using data retrieved from the Michigan Department of Education (MDE) and the Center for Educational Performance and Information (CEPI).

Partnership Turnaround: Year Two Report Section Five | October 2020
150
Cohort 2 Partnership School Teachers Are More Likely to Exit Partnership Districts in Their First Year of ImplementationTable 5.2.3 shows results from the analyses for teachers in Cohort 2 Partnership schools relative to those in comparison schools, both overall (Panel 1) and just in DPSCD (Panel 2). Columns 1 and 4 provide estimates for the identification year and Columns 2 and 5 for the first year of implementation (2018-19). Here we see no effect in either year of being in a Partnership relative to a comparison school on teachers’ propensities to leave teaching in the state. However, teachers in Cohort 2 Partnership schools were five percentage points more likely to exit their districts for other Michigan school districts after the first year of Partnership implementation relative to the year before identification. We saw no effects of Cohort 2 Partnership on Partnership teachers’ propensities to exit either the state or the district in DPSCD.
TABLE 5.2.3. Cohort 2 Partnership Effects on Teacher Outcomes in DPCSD (Partnership Relative to Comparison Schools)
Identification (2017-2018)
Implementation(2018-2019)
Implementation vs.
Identification
Identification (2017-2018)
Implementation(2018-2019)
Implementation vs.
Identification
(1) (2) (3) (4) (5) (6)
Cohort 2 Partnership Schools Compared to Comparison Schools
DPSCD Cohort 2 Partnership Schools Compared to DPSCD Comparison Schools
A. Probability of Leaving Teaching (all teachers)
0.00(0.01)
0.02(0.01)
-0.02(0.02)
0.00(0.02)
B. Probability of Out-of-District Transfer (all teachers)
0.02(0.02)
0.05**(0.02)
0.00(0.02)
0.00(0.02)
C. Probability of Within-District Transfer (all teachers)
0.04+(0.02)
0.03(0.03)
0.04+(0.02)
-0.04(0.10)
D. Probability of Leaving Teaching (1st-5th yr. teachers)
0.03(0.02)
0.04+(0.02)
0.08(0.06)
0.06(0.05)
E. Probability of Out-of-District Transfer (1st-5th yr. teachers)
0.05(0.03)
0.07(0.04)
0.03(0.06)
0.00(0.06)
F. Probability of Within-District Transfer (1st-5th yr. teachers)
0.01(0.02)
0.05(0.03)
0.01(0.07)
0.03(0.13)
G. Probability of Low Effectiveness Rating (all teachers)
0.01(0.01)
0.00(0.01)
0.01(0.03)
-0.01(0.02)
p<.10 +, p<.05 *, p<.01 **, p<.001 ***Note: Full models include the covariates described in Section Two. Models contain year indicators, year x treatment indicators, time variant student characteristics (economic disadvantage status, disability status, English Learner status, grade level), school-level student demographics, and school fixed effects with robust standard errors clustered by school. See Appendix B for full-model results and additional robustness checks and sample restrictions. Coefficients in columns 1 to 3 are relative to the year before identification. Columns 3 and 6 denote whether the coefficients in Column 1 and 2 and 3 and 4 are significantly different from the identification year (Columns 1 and 4). A blank cell indicates that the coefficients are not statistically different. A cell with “+” or “*” would indicate that the coefficients are significantly different at the significance level specified by the symbol. For example, the blank cell in Column 4, Row A, indicates that the change in the probability of leaving teaching in Partnership schools relative to non-Partnership schools from the identification year to Year One was not significantly different. Source: Author calculations using data retrieved from the Michigan Department of Education (MDE) and the Center for Educational Performance and Information (CEPI).

EPIC | Education Policy Innovation Collaborative — Michigan State University
151
Partnership Cohort 2 teachers were four percentage points more likely to switch schools after the identification year, and this effect remained positive but became smaller and not statistically significant in the first year of implementation. Similarly, for DPSCD, Cohort 2 Partnership school teachers were more likely to transfer to other DPSCD schools in the identification year, but this trend reversed itself in the implementation year (although the decrease in the implementation year was not statistically significant).
When we examined these patterns just for early career teachers (in their first through fifth years of experience, shown in rows D through F), it appeared that these teachers were significantly more likely to leave teaching. The coefficient showing the propensity of Partnership teachers relative to comparison teachers to change districts was relatively large and positive, but not statistically significant.
In sum, the results presented in Tables 5.2.1 through 5.2.3 and discussed above suggested that, while retention challenges appeared to have eased in the earlier years of Partnership Model identification and implementation, results from the 2018-19 year suggested that retention remained an intractable issue facing Partnership schools. Notably, however, these results can only take us through 2018-19. As we see below, while Partnership educators believed that retention was a persistent challenge for their schools and districts, they saw improvements in the coming years.
REPORTS FROM PARTNERSHIP TEACHERS SUGGEST A POTENTIAL INCREASE IN WORK FORCE STABILITYThe econometric analyses described above focused on patterns in teacher retention in the 2018-19 school year — the last year for which we have administrative data. Although we found only suggestive negative effects of Partnership on teacher retention in the first year (Cohort 2) or second year (Cohort 1) of implementation, the shift in direction of the results from previous years hints at the potential for increasing challenges with retention. However, the surveys administered to Partnership educators in late fall 2019 and our interviews with Partnership leaders during the 2019-20 school year provided us with a different sense of what we might expect of teacher retention in the current year.3
Partnership Leaders Believed That Teacher Retention Was Improving and Having Positive Impacts on Work Force DevelopmentSeveral district leaders indicated that their retention rates had improved this past year compared to the previous year, and leaders often considered their improved retention to be one of their greatest successes. As we learned in the first year of our study, teacher work force stability

Partnership Turnaround: Year Two Report Section Five | October 2020
152
is important for training and implementing initiatives. To that end, the charter leader of Blues noted, “We had common planning time scheduled last year; we just couldn’t implement because of the [teacher turnover] but we’re in much better shape there to do more systems and small-group coaching. That’s been a big help.” The leader of Flyers also emphasized that retaining teachers was effective to their turnaround work:
We started with a higher caliber of staff, and with the exception of one or two small resignations from the start of this school year, mostly due to personal reasons on behalf of those teachers, we’ve maintained the same staff so far this school year. That’s a huge improvement because mid-year staff turnover and leadership turnover, specifically at the high school has been a significant struggle the last several years. That’s been, from my perspective, one of the main reasons we just have not been able to make traction at that school in the past and one of the reasons we’re seeing so much movement and progress over the course of this year already.
These positive signs — while not universal in the data — suggest that even though the econometric analyses indicated that Partnership schools may have struggled more with retention in the 2018-19 school year than in the previous year, things have been turning around in the 2019-20 school year. We turn to our survey and interview data to help us predict how retention and work force stability may fare in Partnership districts in the current school year.
Teachers in Partnership Districts Reported They Were More Likely to Stay in Their Same Schools and Positions Than They Were in 2018-19Figure 5.6 shows teachers’ reported plans for the end of the 2019-20 school year separately for Partnership and non-Partnership schools. The far majority of teachers in both Partnership and non-Partnership schools said they planned to stay in their same position in their same school in 2020-21, although this was slightly higher for non-Partnership school teachers in Partnership districts (77% vs. 72%). This was an increase over reports from the 2018-19 school year, when 69% of non-Partnership school teachers said they would stay in the same position relative to 60% of Partnership school teachers. Approximately 14% of teachers in Partnership schools and 13% of teachers in non-Partnership schools suggested that they might exit for a different district or leave teaching altogether (down from approximately 15% last year), and approximately three percent said they planned to retire.
A majority of teachers in both Partnership and non-Partnership schools said they planned to stay in their same position and school in 2020-21.

EPIC | Education Policy Innovation Collaborative — Michigan State University
153
FIGURE 5.6. Teachers’ Professional Plans for Next School Year — Partnership and Non-Partnership Schools 2018-2019 and 2019-2020 School Years
Same position, same school 60% Different position, same school 7% Different school 12% Different district 8% Leave education 7% Retire 6%
PARTNERSHIP TEACHERS
•vs•2019 2018
Same position, same school 72% Different position, same school 3% Different school 8% Different district 9% Leave education 5% Retire 3%
Same position, same school 69% Different position, same school 5% Different school 11% Different district 3% Leave education 5% Retire 5%
NON-PARTNERSHIP TEACHERS
•vs•2019 2018
Same position, same school 77% Different position, same school 2% Different school 5% Different district 9% Leave education 4% Retire 2%
Note: Teachers were asked, “Which of the following best describes your plans for next school year?”

Partnership Turnaround: Year Two Report Section Five | October 2020
154
Partnership Teachers Cited School Leadership, Culture and Climate, and Their Students as the Reasons They Wanted to StayPartnership teachers attributed their plans to remain in Partnership schools and districts to several factors, shown in Figure 5.7. Partnership school teachers ranked school leadership as the most important factor in their decisions to stay in their same positions, same schools, and same districts. Non-Partnership school teachers (shown in Figure 5.8) similarly ranked leadership as the most important reason to stay in their district, and among the most important factors for remaining in their positions and schools.
FIGURE 5.7. Importance of Factors Driving Partnership School Teachers’ Future Plans — Teachers Staying in the District 2019-2020 School Year
Least Important
Most Important
Same position, same school
Different position, same school
New school, same district
Workload PayLeadership The students with whom I work
Commute Accountability designationCulture and climate
Note: Teachers were asked, “Which of the following factored into your decision to [insert plan] next year?”
FIGURE 5.8. Importance of Factors Driving Non-Partnership School Teachers’ Future Plans — Teachers Staying in the District 2019-2020 School Year
Least Important
Most Important
Same position, same school
Different position, same school
New school, same district
Workload PayLeadership The students with whom I work
Commute Accountability designationCulture and climate
Note: Teachers were asked, “Which of the following factored into your decision to [insert plan] next year?”

EPIC | Education Policy Innovation Collaborative — Michigan State University
155
Culture and climate and the students in teachers’ schools and districts also ranked high as important factors contributing to all teachers’ plans to remain in their positions, schools, and districts. The important role of school culture and climate in school turnaround has been discussed in the national research literature (e.g., Finnigan & Stewart, 2009; Huberman, Parrish, Hannan, Arellanes, & Shambaugh, 2011; Leithwood & Jantzi, 1990), and Partnership school
teachers’ focus on school culture, climate, and leadership echoed the preferences of teachers in low-performing schools across the country. In particular, these factors can have important impacts on teacher (and leader) recruitment and retention. Low-performing schools and those with high levels of traditionally underrepresented students struggle more with teacher recruitment and retention than do more affluent schools (e.g., Guin, 2004; Loeb, Darling-Hammond, & Luczak, 2005). However, a growing body of research suggests factors related to school climate, culture, working conditions, and leadership play an outsized role in teacher employment decisions — over and above school performance and demographics (Guin, 2004; Horng, 2009; Johnson, Kraft,
& Papay, 2012; Loeb et al., 2005; Viano et al., 2020). Because recruiting and retaining highly effective teachers is so central to successful school turnaround (Henry et al., 2020; Papay & Hannon, 2018; Sun et al., 2017), these malleable factors may be a mechanism for improving the quality and stability of the teacher work force and ultimately student achievement in low-performing schools.
School leadership also appears to be a critical component of turnaround for two key reasons. First, principal turnover — which is higher in low-performing schools — is associated with higher levels of teacher turnover, which can hinder turnaround (Bartanen, Grissom, & Rogers, 2019; Henry & Harbatkin, 2019b; Miller, 2013). Second, the multidimensional challenge of leading a turnaround school — setting and maintaining a turnaround vision and strategy, building capacity, and shaping school culture while navigating accountability pressures — may require a leader with a unique set of skills (Dodman, 2014; Finnigan & Stewart, 2009; Harris, 2002; Jacobson, Giles, Ylimaki, & Johnson, 2005; Meyers & Hambrick Hitt, 2017).
Partnership leaders also believed that leadership and improvements in culture and climate were critical factors in teacher retention. For instance, the charter leader of Maple Leafs shared, “We believe that relationships with leaders and teachers is ground zero for retention. Next is really salary, compensation, benefits, things like that.” She/he gave this example:
We had a teacher who was entertaining going to another district. She/he was going to get more money. Our [leader], went to talk with him/her, and all she/he talked about was how happy she/he was at [our school]. Then she/he came to the conclusion that it wouldn’t make sense for him/her to leave. It’s just that that idea of, because we’re in a marketplace that’s a buyer’s market, just because it’s a possibility
Partnership leaders also believed that leadership and improvements in culture and climate were critical factors in teacher retention.

Partnership Turnaround: Year Two Report Section Five | October 2020
156
that — you have to really look at how is this environment really benefitting me holistically. [The school leader’s] teachers just report a high level of like, “You’re with me for the long haul.”
The charter leader of Wild discussed the importance of the climate and culture of a school in the ability to retain teachers, also ranking it above compensation. She/he said:
If your organization of your school day is not predictable, if you have chaos, if you have multiple disruptions, if you can’t predict what’s next, if you don’t have a procedure or protocols, you don’t feel safe. You don’t feel organized. You got high anxiety, and that will definitely turn teachers off. Of course, it would turn anybody off. […] I would say climate and culture would be first to retain teachers, creating that predictability, organizing those procedures and protocols. Then making sure that teachers feel supported and appreciated. I think that would be before actual pay.
Similarly, the district leader of Avalanche told us:
We’re seeing what makes a difference, and it’s when people can trust and have stable leadership and when they have a support structure and colleagues that they care about with a like-mindedness of serving kids. That has seemed to be the recipe that seems to have — to work to stabilize that. Now, knowing that and maintaining that are two totally different things because — as an example, we just — one of our upper elementary schools, we had a situation where we had a principal who just resigned. Last week was his/her last day.
Both teachers and district leaders reported that working conditions were the most important factor for retaining teachers. As is clear from the research literature cited above, this is not unique to Michigan turnaround schools. School leadership contributes to working conditions by establishing the procedures, protocols, support, and appreciation to lead to a positive culture and climate.
Teachers Who Planned to Exit Partnership Schools and Districts Cited Leadership, Workload, and Compensation as the CulpritsFigures 5.9 and 5.10 show how teachers who reported they were planning on leaving the district ranked different reasons for their exit. Teachers in Partnership schools rated pay as the most important reason, followed closely by workload, leadership, and the students with whom they work. Teachers in non-Partnership schools ranked leadership as most important, followed by workload and pay. The fact that these were so highly aligned with the reasons teachers gave for
Teachers and district leaders reported that working conditions were the most important factor for retaining teachers.
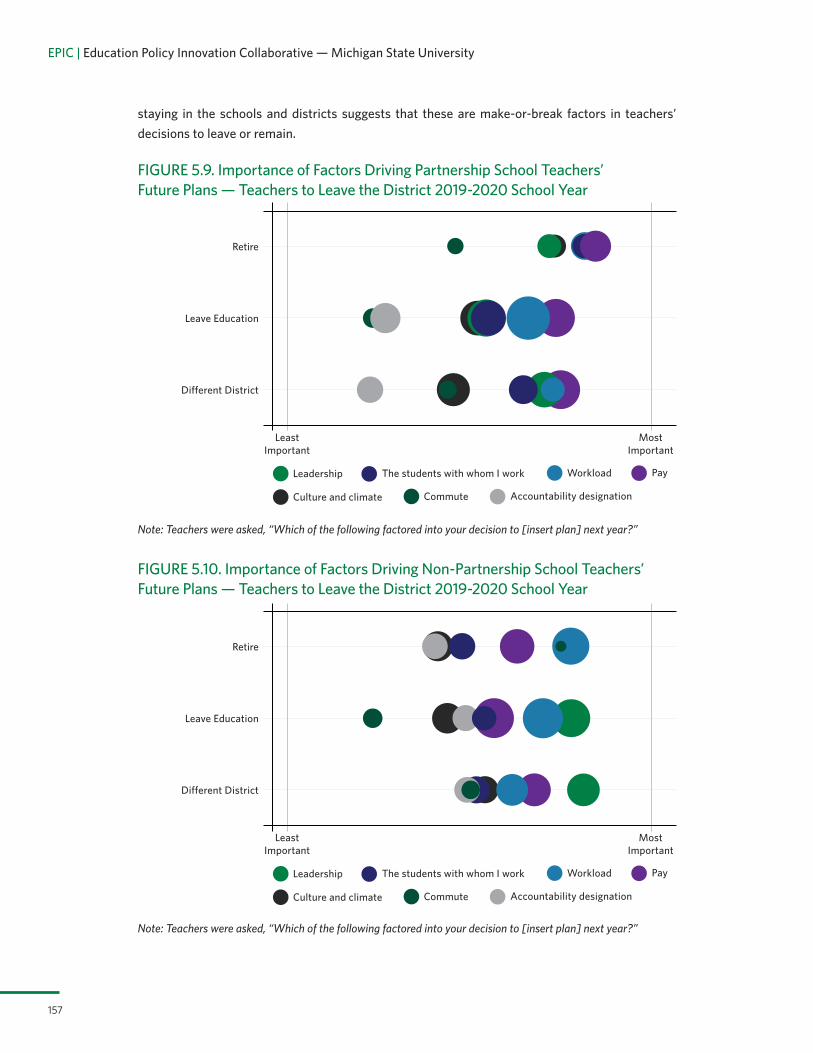
EPIC | Education Policy Innovation Collaborative — Michigan State University
157
staying in the schools and districts suggests that these are make-or-break factors in teachers’ decisions to leave or remain.
FIGURE 5.9. Importance of Factors Driving Partnership School Teachers’ Future Plans — Teachers to Leave the District 2019-2020 School Year
Least Important
Most Important
Different District
Leave Education
Retire
Workload PayLeadership The students with whom I work
Commute Accountability designationCulture and climate
Note: Teachers were asked, “Which of the following factored into your decision to [insert plan] next year?”
FIGURE 5.10. Importance of Factors Driving Non-Partnership School Teachers’ Future Plans — Teachers to Leave the District 2019-2020 School Year
Least Important
Most Important
Different District
Leave Education
Retire
Workload PayLeadership The students with whom I work
Commute Accountability designationCulture and climate
Note: Teachers were asked, “Which of the following factored into your decision to [insert plan] next year?”

Partnership Turnaround: Year Two Report Section Five | October 2020
158
PARTNERSHIP DISTRICTS IMPLEMENTED NEW STRATEGIES TO IMPROVE TEACHER RETENTIONAs we discussed in our Year One Report, teacher turnover can be particularly challenging for Partnership districts, as several districts found that they invested in teacher training related to instructional initiatives, only to have teachers leave the district. This created a cycle of retraining and reinvestment in similar professional development for staff who regularly turned over. In this year’s data collection, Partnership leaders continued to bring up challenges due to educator turnover and lack of stability in the teaching force. The district leader of Avalanche shared:
All of this is great except that with that turnover, we’re constantly starting over with new people. If I offer a professional development today, tomorrow, I’m going to have three new teachers. That’s an exaggeration, but tomorrow, I may have three more teachers that weren’t here today that still need to know what the professional learning was today.
To combat some of these challenges, and to acknowledge the important role teachers play in improving student outcomes, districts implemented several teacher recruitment and retention initiatives to help grow, maintain, and develop their work force. Thirteen of 22 district leaders discussed recruitment and retention initiatives, including increasing salary and compensation, partnering with local universities to institute “grow-your-own” programs (discussed above), and investing in instructional coaching and professional development. Given the reported importance of working conditions in teacher retention, it is unsurprising that Partnership districts also worked to implement new approaches to improving culture and climate. These included trying to decrease extra responsibilities for teachers, building trust, and changing leadership when necessary.
Partnership Leaders Worked to Remove Additional Responsibilities from TeachersAs we discussed in Section One, Partnership districts are often in communities with high rates of economic instability and other factors that can make it particularly important for teachers to focus on instruction and whole-child wellness as opposed to other duties that may be less central to their core goals. Some Partnership districts tried to improve teachers’ working conditions by lessening the load for teachers when possible. The charter leader of Flyers discussed counseling teachers not to take on too many additional responsibilities, like clubs or coaching, so teachers —and especially new teachers — could focus on their instruction. Capitals’ district leader also noted the potential for burnout to decrease teacher retention, so they tried to cut back on meetings that teachers felt were unimportant or not related to their core work:
There was a time where there was a lot of meetings, and so we looked at that last year as we got through the year, and just overall attendance for teaching staff at the meetings was relatively low. […] When staff is rocking and rolling and excited, they’ll put that time in. When they’re tired and they feel like we’re doing a lot of talking, a lot of information, and “I don’t have the time to plan or take care of my kids,” then we start to see backing away.

EPIC | Education Policy Innovation Collaborative — Michigan State University
159
These districts recognized that teachers have finite time they can spend on their work-related tasks and the district must set priorities for the most critical tasks to avoid teachers feeling overworked or stressed. They tried to buffer teachers, especially those newer to the profession, from too many demands on their time to help improve both their work conditions and the quality of their instruction.
Partnership Districts Emphasized Building Trust and a Sense of Belonging Many Partnership districts worked to build trust with their teachers and improve camaraderie. A few districts did this by recognizing teachers’ hard work, planning social activities, working to have substantive and challenging conversation in productive ways, and distributing leadership. These activities were intended to create the trust and team culture that was important for retention. As the charter leader of Predators discussed:
The retention standpoint is definitely more of that righting the culture of the school. We do a lot of staff outings, staff events, a lot of training in how to have difficult conversations […] You have to be able to share that leadership and share that responsibility, but it’s all based on trust. That’s as I was saying, last year a huge focus for me was righting the culture, creating the trust, focusing on the process of how things were happening. Because if you can’t do that and you don’t have a team behind you, you’re not going to be able to move forward.
As is evidenced in this quote from the leader of Predators, districts found leadership key to shifting their school culture and climate. Islanders’ district leader shared that for the first time their Partnership school was completely staffed with certified teachers in all core subjects. The leader attributed this success to changes in school leadership:
We have a new principal. She/he was very good at being able to get other people to come over and stuff like that. She/he tried to create a good work environment for people, so we just lucked up because, the first two years, we would have people leave in the middle of the year and create vacancies and things of that nature. Luckily, we haven’t had that this year.
Partnership leaders told us that effective school leaders were willing to facilitate transformative change by supporting their teachers and building a sense of loyalty and trust that in turn leads teachers to be less likely to leave.
Compensation Emerged as an Important Retention Tool Although teachers and many Partnership leaders reported that pay was less important for retention than leadership, students, and the school and district culture and climate, other leaders believed that compensation was equally if not more important than other factors. Indeed, as is shown in Figure 5.11, teachers in Partnership districts reported being relatively dissatisfied with their salaries. When asked if they agreed or disagreed with the statement “I am satisfied with my salary,” teachers in both Partnership and non-Partnership schools responded negatively, scaling more towards “disagree,” especially for teachers in Partnership schools. (Partnership principals were also dissatisfied with their salaries, a point we come back to later in this section.)

Partnership Turnaround: Year Two Report Section Five | October 2020
160
Several district leaders mentioned providing retention bonuses as a next step once they had successfully recruited teachers who were perceived to be a good fit. As the district leader of Blue Jackets shared, compensation can be used across the spectrum of teacher experience to improve teacher recruitment and retention:
Our initial phase one of it was to attract teachers to our district, so we worked on our starting salaries and a signing bonus. This last round was designed to retain our staff, and so there is a middle tier of staff members that we made whole, so to speak. Those individuals had been frozen at a particular step for quite some time. We restored all of their steps to where they should have been, and then we extended our salary scale out to about 30 years where, before, we had a cap at 12 years. We extended it out to 30 years to help our individuals that were at the top of the scale, in order to retain them. Because of that, we’ve seen some increases in our retention rates.
The charter leader of Lightning also discussed first increasing starting salaries to attract new teachers and then adding retention bonuses. This approach was coupled with a focus on developing early career teachers:
I will say that originally, I marketed, I tailored our whole appeal, that recruitment piece on first, second, and third-year teachers who are newer to the profession because we can pay them more than others. Also, everything was centered around professional development. We provided extensive, extensive, extensive professional development for our teachers, which has really served us well. That’s appealing for new teachers, I think, and we’re paying them for that extra professional development, providing them both financial and professional growth opportunities. That really worked out for us.
This helps illustrate how pay increases can be an important aspect of a larger recruitment and retention plan that considers how to provide training, support, and a positive culture and climate for teachers to work in.
FIGURE 5.11. Partnership Educators’ Satisfaction with Their Salaries
Partnership Teachers
Non-Partnership Teachers
SALARY SATISFACTIONStrongly
Disagree
Disagree
Neither Disagree
nor Agree
Agree
Strongly Agree
Note: Educators were asked, “To what extent do you agree with the following statement?: I am satisfied with my salary.”
Partnership Principals
Non-Partnership Principals

161
Case Study Vignette 04: Case Study Districts Improved Teacher Retention in Different Ways Despite Financial Disadvantages and Teacher Pay Disparities in Competing Districts
04/Case Study
Vignette
Case Study Districts Improved Teacher Retention Despite Financial Disadvantages and Pay Disparities
Blues, Flames, and Stars all made significant strides towards improving teacher retention. They accomplished these improvements in different ways, with Blues creating a “grow-your-own” program [see Case Vignette #03], Stars negotiating a teacher contract to pay teachers more to keep them from leaving for higher paying nearby districts, and Flames attempting to keep teachers by creating a “family-oriented” culture and strong, supportive leadership. Yet despite these improvements, evidence from leaders and teachers across our cases suggested that compensation was a “make or break” issue for their efforts to sustainably improve teacher retention.
Importantly, each viewed these efforts as necessary but insufficient for being able to meet their Partnership goals. Partnership leaders in all three cases explained how, in one way or another, they lost more experienced teachers to nearby schools or districts that were able to offer better salaries. For example, Stars’ principal explained how they had problems in recent years retaining teachers because surrounding districts were attracting their teachers with higher pay:
For the first few years I was here, we had very little turnover, but then we went into a salary freeze for our teachers, so then we lost a number of teachers to different districts where they pay more. Now teachers got a nice bump in pay

162
with this [last contract], so we haven’t had a lot of turnover. The rumor is that we have no money, so when this contract is up, we’re going to either take a cut or a freeze again, and we’re going to lose some of our best teachers.
This retention was viewed as potentially temporary not just by the principal, but by district leaders and teachers, who all saw the need to raise additional revenue by increasing student enrollment. One teacher confirmed, “many other districts were paying better.” When teachers were asked about their potential career decisions, they provided some credence to the principal’s views that teachers might indeed leave if their pay could not be sustained, as a different teacher explained, “There were rumors going around though that this is not going to last, so people are a little worried about that.” Although Stars felt able to maintain a stable staff for the time being, these improvements were not viewed as sustainable over the long-term.
While Flames’ leader also reported teachers leaving for better pay, she/he noted that working conditions may be more important than compensation for some teachers:
[Some] teachers left because they were like, “Hey, we’ll give you a signing bonus of this,” and so they took it. But now they’re calling us saying, “Hi, do you still have space? Do you still ... “ So it was great for the money, but all the other factors didn’t meet their needs, so they’re trying to come back… we try to provide an environment that they can thrive in. We want to have, like, that family atmosphere and do those little things that just helps make their day. We know we can’t compete all the time with the salaries of the other schools, so we try to [focus on working conditions].
Flames school leaders and teachers alike noted that working conditions and leadership were key reasons they were attracted to and stayed in Flames despite perceptions of low pay. Teachers we interviewed largely confirmed this, citing the “family” atmosphere and appreciation for working with their colleagues. Despite this, some of them still considered leaving because of pay, as one Flames teacher explained:
04/Case Study
Vignette
CASE STUDY DISTRICTS IMPROVED TEACHER RETENTION DESPITE FINANCIAL DISADVANTAGES AND PAY DISPARITIES

EPIC | Education Policy Innovation Collaborative — Michigan State University
163
CASE STUDY DISTRICTS IMPROVED TEACHER RETENTION DESPITE FINANCIAL DISADVANTAGES AND PAY DISPARITIES
04/Case Study
Vignette
I have considered looking for another position, but it will only be based on salary. I wouldn’t move if they would pay me more money. I really like the people here. And I like the setup, I like the school, I love, even though the building is old, it really isn’t about the building, it’s about the parents that are here, the staff that’s here. I really do enjoy working with them.
This highlights the difficulty in retaining teachers who are unsatisfied with their compensation, even when the school has good working conditions. A teacher at Blues expressed a similar sentiment:
I like it here and that’s why I’m here. I do. I like the staff. I like administration. I like the students … but say what you will, but the public schools, the money there is just so far ahead of ours. It’s really hard to keep people.
Across our cases, teachers serving disadvantaged students at charter and traditional public school districts alike all noted that they enjoyed their work, but still emphasized the importance of pay in terms of retaining teachers.
Recruitment and Retention Plans Included a Focus on Teacher DevelopmentA key component of Partnership districts’ recruitment and retention strategies was building teachers’ capacities to implement new initiatives and improve the instructional core. First, Partnership leaders viewed teacher development as a recruiting tool to show support for early career teachers and teachers in “grow-your-own” programs. In addition, leaders noted that in districts like theirs where recruiting experienced and aligned teachers was a challenge, it was crucial to build the skill sets of their current teaching staff. Districts spent significant time and resources to develop their current teachers, so they were keen to retain those teachers they had invested in training. District leaders used instructional coaching and professional development to augment their other human resources efforts.

Partnership Turnaround: Year Two Report Section Five | October 2020
164
Instructional coaching.Instructional coaching initiatives consisted of teachers, administrators, and/or instructional coaches from either the district or ISD providing feedback on classroom work. Thirteen of the 22 district leaders interviewed indicated that instructional coaching was an important part of their Partnership turnaround work. The district leader of Avalanche explained what coaching can look like and why it was an important supplement to professional development:
They’ll learn about it, and then a coach comes in and can model it and will work side by side with them and/or will sit and watch and then provide feedback about, “This part, you did really well. Next time, why don’t you try this?” Then that’s kind of an ongoing relationship between the coaches and the teachers that kind of keeps pushing that. What we’ve seen, if we don’t do that particular level […] what would happen is — I can think about many, many times where, as a teacher, I sat in a professional development, was sent on my way back to go to my classroom on my own to just, “Give it a try. Let us know how it turns out.” When you first try doing something, you’re not good at it. You try it. It doesn’t work, or maybe you’re not — you kind of think you get it, but you don’t really get it, or you get the main part, but there’s some nuances that you’re not as familiar with. What happens over time, if that’s the model, is that teachers end up going back, and eventually, within a short period of time, even days to a few weeks, teachers are right back doing the same old thing they’ve always been doing without actually moving and changing what they do in the classroom over time.
Many of the districts that discussed instructional coaching indicated that their ISD was helpful in implementing these practices or providing coaches. As the charter leader from Lightning noted:
We now have what I would consider two trusted consultants that are really a part of our team now. […] The ISD really is making that happen, making them available and finding the quality people really to help us to do what we need to do there.
Coaching was seen as particularly valuable because of the real-time feedback and the ability for districts to target the areas of instruction they feel are most important for implementing curriculum initiatives and improving student outcomes. Predators’ charter leader explained how crucial the coaching was for their teachers’ development:
Coaching was seen as particularly valuable because of the real-time feedback and the ability for districts to target the areas of instruction they feel are most important for implementing curriculum initiatives and improving student outcomes.
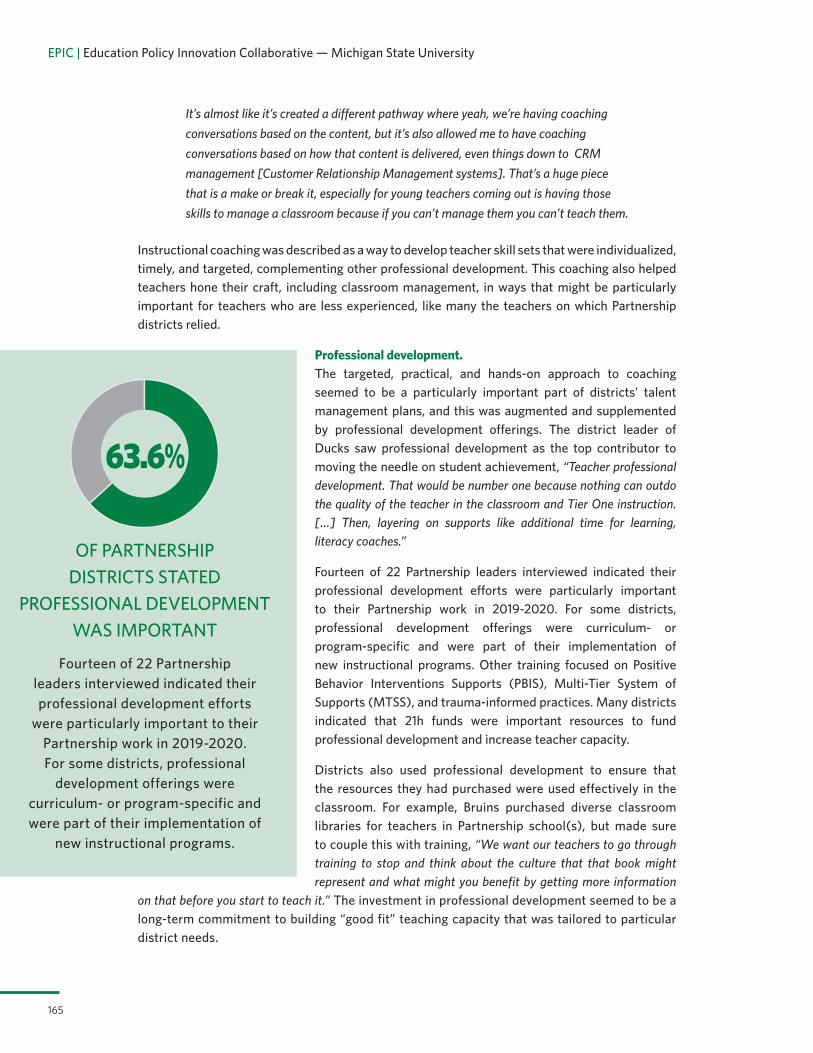
EPIC | Education Policy Innovation Collaborative — Michigan State University
165
It’s almost like it’s created a different pathway where yeah, we’re having coaching conversations based on the content, but it’s also allowed me to have coaching conversations based on how that content is delivered, even things down to CRM management [Customer Relationship Management systems]. That’s a huge piece that is a make or break it, especially for young teachers coming out is having those skills to manage a classroom because if you can’t manage them you can’t teach them.
Instructional coaching was described as a way to develop teacher skill sets that were individualized, timely, and targeted, complementing other professional development. This coaching also helped teachers hone their craft, including classroom management, in ways that might be particularly important for teachers who are less experienced, like many the teachers on which Partnership districts relied.
Professional development.The targeted, practical, and hands-on approach to coaching seemed to be a particularly important part of districts’ talent management plans, and this was augmented and supplemented by professional development offerings. The district leader of Ducks saw professional development as the top contributor to moving the needle on student achievement, “Teacher professional development. That would be number one because nothing can outdo the quality of the teacher in the classroom and Tier One instruction. […] Then, layering on supports like additional time for learning, literacy coaches.”
Fourteen of 22 Partnership leaders interviewed indicated their professional development efforts were particularly important to their Partnership work in 2019-2020. For some districts, professional development offerings were curriculum- or program-specific and were part of their implementation of new instructional programs. Other training focused on Positive Behavior Interventions Supports (PBIS), Multi-Tier System of Supports (MTSS), and trauma-informed practices. Many districts indicated that 21h funds were important resources to fund professional development and increase teacher capacity.
Districts also used professional development to ensure that the resources they had purchased were used effectively in the classroom. For example, Bruins purchased diverse classroom libraries for teachers in Partnership school(s), but made sure to couple this with training, “We want our teachers to go through training to stop and think about the culture that that book might represent and what might you benefit by getting more information
on that before you start to teach it.” The investment in professional development seemed to be a long-term commitment to building “good fit” teaching capacity that was tailored to particular district needs.
63.6%
OF PARTNERSHIP DISTRICTS STATED
PROFESSIONAL DEVELOPMENT WAS IMPORTANT
Fourteen of 22 Partnership leaders interviewed indicated their professional development efforts
were particularly important to their Partnership work in 2019-2020. For some districts, professional
development offerings were curriculum- or program-specific and were part of their implementation of
new instructional programs.
166
Case Study Vignette 05: ISD Partners Provided Strong Teacher Development and Coaching Supports, Which were Viewed as Critical for Improvement Efforts
05/Case Study
Vignette
ISD Partners Provided Strong Teacher Development and Coaching Supports, Which Were Viewed as Critical for Improvement Efforts
Across our cases, Partnership leaders put in place robust systems for teacher development that were informed by the ISD in the form of teacher coaching and thought partnering on various instructional efforts. They viewed these systems as crucial to accelerating the instructional growth of teachers and, by extension, students. Blues developed a system of walkthroughs to check on the quality of teaching, as one district leader explained:
For coaching and instruction, we’ve identified three or four key components. We spent the first two weeks and we would be the administrative team, [ISD] coaches, building principals, central office — everybody. Walking through classrooms and just doing observation, based on those really foundational skills of the classroom environment. Are we teaching what we’re supposed to be teaching? Is math instruction happening? If it’s math time, is the math instruction that’s happening actually the curriculum that we purchased to be taught or is it something from Pinterest or Teachers Pay Teachers?
The superintendent explained that, based on the results of these walkthroughs, the team developed individualized teacher coaching targeted to their specific needs. This team

167
ISD PARTNERS PROVIDED STRONG TEACHER DEVELOPMENT AND COACHING SUPPORTS, WHICH WERE VIEWED AS CRITICAL FOR IMPROVEMENT EFFORTS
05/Case Study
Vignette
included several ISD employees who were doing — in the words of the superintendent — the “boots on the ground” work of coaching. At least one teacher mentioned being nervous about all the observations, citing being observed by up to eight people on an ongoing basis, but in the end “felt like [she/he] was doing a good job.”
The principal of Flames relied heavily on coaches from the ISD to provide support for ongoing teacher development. She/he explained:
Some of the support that we’re receiving from [the ISD], it only came about because we were part of the Partnership Agreement. Last week, [MDE employee] came here. I explained to him/her when she/he interviewed me that it really would have — the ISD has really stepped up tremendously. They’re providing coaching support, and they’re providing so many PDs and all of these things. It would have been helpful to have this, initially, when we saw the scores dropping as opposed to once we reached that level. Now, we’re getting the support we need, and we’re going back up.
It is worth highlighting that the Flames principal viewed the ISD support so positively that she/he directly connected this to their improvement. She/he even went on to say in response to a question about their biggest success related to the Partnership Agreement process, “I would say the biggest success would be just a deeper relationship with [the ISD] and the resources and training and people that they’ve provided. I definitely think that has been very, very helpful, one of our most helpful areas for us.”
District staff and the principal at Stars had similar support from their local ISD. The district’s curriculum director explained how useful the ISD was as a thought partner when working on adopting the new curriculum, which was a key component of the district’s plan to meet their Partnership goals, “For the curriculum adoption, I worked side by side with one of the ELA consultants at [the ISD]… We were each other’s thought partners all throughout.”
Similarly, the principal noted that professional developers from the ISD were responsible for developing teachers’ capacity around new math techniques that became “a strength for everybody in the building.” She/he explained:

168
05/Case Study
VignetteISD PARTNERS PROVIDED STRONG TEACHER DEVELOPMENT AND COACHING SUPPORTS, WHICH WERE VIEWED AS CRITICAL FOR IMPROVEMENT EFFORTS
When you talk about building capacity and everything, there’s teachers in this building that I never thought would really get into that, you know, adopt those methods and so forth. When you see that kind of success — ‘cause we had [the ISD] come in, and they did a whole video of [a teacher] doing a number talk, and they’re making it available across the county, so people can see how it should work based on the coaching and [how well students did].
She/he added that this video was made in coordination with their district/school’s instructional coach, further illustrating the collaborative nature of the relationship between Partnership schools and local ISDs, particularly around instructional issues that were tightly aligned to Partnership goals. Additionally, the district supported the principal’s efforts to get teachers observing each other so that they could continuously learn and improve on these new math methods that the ISD was supporting.
When teachers were asked about these capacity building efforts that were linked to the ISD, they were as positive as the district staff and the principal had been. For example, when asked for an example of whether these efforts were changing the way they teach, one Stars teacher responded:
I was doing math stations when they came into my room. I noticed that some of — I had one station. The kids were working independently on an application problem, now my students really aren’t having that collaborative student talk that I saw in the other classrooms. It made me think the next time that I plan a station, I’m going to tweak it so it’s on a higher level. The kids are doing more sharing of their strategies, and more student talk. It helps me realize, I just need to tweak some things a little bit so the kids are thinking at a higher level.
This example illustrates how, when done well, close and collaborative partnerships with ISDs have the potential to enhance instruction and change teacher practice. In particular, the experiences highlighted across these cases demonstrated how schools and districts may need additional partners and staff devoted to supporting teacher instruction, which strongly suggested the importance of additional financial resources being allocated to Partnership schools and districts.

EPIC | Education Policy Innovation Collaborative — Michigan State University
169
Professional Development Was Key to Implementing Partnership Reforms and Necessary Given the High Rates of TurnoverProfessional development and coaching were also necessary interventions in Partnership districts because of the high rates of teacher turnover as experienced teachers left Partnership districts for districts with higher salaries or other working conditions. For instance, the charter leader of Hurricanes told us:
That leaves us our — for example, teachers that have been with us going into their fourth year, so they were out of that one to three year. That would’ve been their fourth year with us. We’re now back to recruiting teachers who are in that first to three-year span of their career. We’re having to train them all over again instead of having the benefit of having trained others.
This theme was also surfaced in our Year One Report, in which Partnership leaders and principals highlighted the challenges of undertaking difficult turnaround work while trying to improve the instructional capacities of less experienced teachers. Again, Partnership leaders spent significant time and financial resources to train novice teachers, to then need to repeat that effort the next school year with a new group of teachers.
For instance, referring to the need to develop the teachers they have rather than being able to hire inexperienced teachers, the charter leader of Sabres said that, “Sometimes it’s a matter of really growing what you got.” As Partnership leaders explained, it is difficult to move forward with more complex tasks to make improvements to a school’s instructional core when the district is continually needing to retrain the teachers who are the drivers of these reforms.
Partnership Gave Districts Leverage to Implement Professional Development InitiativesInterestingly, being labeled a Partnership district provided leverage for school district leaders to implement some of the human capital initiatives discussed previously. In particular, two district leaders indicated the label of Partnership was helpful in facilitating otherwise contentious reforms. The district leader of Ducks said that being in Partnership helped them negotiate with the teachers’ union:
I think what it has done is allowed me to make some agreements with the union for additional opportunities to provide professional development for staff. That Partnership label has afforded me the opportunity to do some contract negotiation that I might not otherwise have to. Those teachers who are in Partnership schools [are] required to do more professional development than those who are not in a Partnership school. I was able to require that rather than just suggest it.
Similarly, the district leader of Stars felt that the label of Partnership allowed them to implement new teacher development programs with less resistance:
I think it was easier to push through an initiative like the instructional rounds because we were in a Partnership versus if we weren’t. It almost provided urgency to allow

Partnership Turnaround: Year Two Report Section Five | October 2020
170
that to move forward through the barriers, union, things like that that have always been good checks and balances for a school system. Yet this created urgency to move these things forward.
In sum, Partnership school and district leaders were able to leverage their status into improvements in human capital initiatives through the use of 21h and other grant funds, improved relationships with their ISDs, adherence to Partnership Agreements, and as a result of the increased urgency that comes with the label of Partnership itself.
PARTNERSHIP SCHOOLS SIMILARLY FACED CHALLENGES WITH RETAINING PRINCIPALSAs was discussed in our Year One Report and is evidenced in Table 5.1, Partnership districts struggled with retaining Partnership school leaders. Principal exit rates in Partnership schools have historically been higher than those of other schools across the state. However, as can be seen in Figures 5.12.1 and 5.12.2 below, there has been a decline in principal exit rates in recent years, such that Partnership principals have exit rates much closer to those of other principals across the state. Nonetheless, in the most recent school year available in our administrative data (2018-19), principals in Cohort 1 Partnership schools saw a marked uptick in their propensities to exit both their schools and their districts. Ultimately, at the end of the 2018-19 school year, 27.8% of Cohort 1 Partnership school principals exited their schools and 6.5% exited their districts altogether, as did 20.3% and 3.9% of Cohort 2 Partnership school principals, respectively. This was compared to principal school and district exit rates of 8.5% and three percent for principals in schools not located in Partnership districts.
FIGURE 5.12.1. Principal School Exit Rates by School Type
Scho
ol E
xit R
ates
0
.05
.1
.15
.2
.25
2013-14 2014-15 2015-16 2016-17 2017-18 2018-19
Cohort 1 Partnership SchoolsCohort 2 Partnership Schools
Non-Partnership Schools in Partnership DistrictsState Average
Identification YearCohort 1
.3
.35
Identification YearCohort 2
Source: Data retrieved from the Michigan Department of Education (MDE) and the Center for Educational Performance and Information (CEPI).

EPIC | Education Policy Innovation Collaborative — Michigan State University
171
FIGURE 5.12.2. Principal District Exit Rates by School TypeD
istr
ict E
xit R
ates
0
.05
.1
.15
.2
.25
2013-14 2014-15 2015-16 2016-17 2017-18 2018-19Identification Year
Cohort 1
.3
.35
Identification YearCohort 2
Cohort 1 Partnership SchoolsCohort 2 Partnership Schools
Non-Partnership Schools in Partnership DistrictsState Average
Source: Data retrieved from the Michigan Department of Education (MDE) and the Center for Educational Performance and Information (CEPI).
Most Partnership Principals Planned to Stay in Their Positions, but an Increased Number Intended to Leave Relative to Last YearThese descriptive trends align with principals’ reported intentions in our 2019-20 surveys. While the far majority of Partnership district principals planned to stay in their positions in
2020-21, there was a slight increase over last year’s survey responses in Partnership school principals’ intentions to exit their districts altogether. In last year’s report, we found that well over 80% of principals planned on staying in their positions for this year, and five percent and 13% of principals (Partnership and non-Partnership schools, respectively) reported that they were going to leave the district for any reason. In this year’s survey, as shown in Figure 5.13, principals reported similar expectations; greater than 80% of principals said they
would stay in their positions. However, a full 15% of Partnership school principals said they plan to change districts, retire, or leave education altogether relative to only four percent in non-Partnership schools.
Greater than 80% of principals planned on staying in their positions this year.

Partnership Turnaround: Year Two Report Section Five | October 2020
172
FIGURE 5.13. Principals’ Professional Plans for Next School Year — Partnership and Non-Partnership Schools 2018-2019 and 2019-2020 School Years
Same position, same school 86% Different position, same school 6% Different school 3% Different district 0% Leave education 2% Retire 3%
PARTNERSHIP PRINCIPALS
•vs•2019 2018
Same position, same school 85% Different position, same school 8% Different school 4% Different district 0% Leave education 0% Retire 3%
Same position, same school 84% Different position, same school 0% Different school 3% Different district 3% Leave education 5% Retire 5%
NON-PARTNERSHIP PRINCIPALS
•vs•2019 2018
Same position, same school 91% Different position, same school 2% Different school 3% Different district 2% Leave education 2% Retire 0%
Note: Principals were asked, “Which of the following best describes your plans for next school year?”

EPIC | Education Policy Innovation Collaborative — Michigan State University
173
Principals Stay Because of Students and District Leadership While Workload Drove ExitsFigure 5.14 shows the reasons principals gave for remaining in and exiting their schools. We found that the main factor driving principals’ reported retention, across both Partnership and non-Partnership principals, was their students. Non-Partnership school principals also reported that the school’s culture and climate were determining factors with the district’s leadership as the next most important reasons. Partnership school principals also said that district leadership mattered in their decision to stay, although their commute was an important reason, as well (though less frequently considered). Non-Partnership principals similarly ranked their students and district leadership as critical reasons that they would stay in their schools, but did not cite commute as an important driver for retention. They did, however, report that their schools’ culture and climate contributed to their decisions to stay.
FIGURE 5.14. Importance of Factors Driving Partnership and Non-Partnership Principals’ Plans to Stay or Leave After the 2019-2020 School Year
Least Important
Most Important
Non-Partnership Principals: Exit
Partnership Principals: Exit
Non-Partnership Principals: Stay in same
position
Partnership Principals: Stay in same position
Workload PayLeadership The students with whom I work
Commute Accountability designationCulture and climate
Note: Principals were asked, “Please rank how the following factored into your decision to [insert plan] next year.” Each circle’s center indicates the relative importance of that factor. A larger circle indicates that the factor was more frequently identified as relevant to principals’ plans. This graph includes the responses from all principals.
We also asked principals about the factors that drove their decisions to exit the district or to retire. However, only enough Partnership school principals answered the question pertaining to leaving the district, and only enough non-Partnership school principals responded about leaving education altogether. As such, we interpreted these figures cautiously.

Partnership Turnaround: Year Two Report Section Five | October 2020
174
Nonetheless, it is clear that both Partnership and non-Partnership school principals cited workload as the primary reason they thought they would leave their districts or education altogether. Partnership school principals who planned on exiting cited district leadership and culture and climate as the next most important rationales, whereas culture and climate did not play a role in non-Partnership school principals’ decisions to leave education (but leadership did).
These results make clear that Partnership schools and district not only need to worry about retaining their teaching work force, but also their school leaders.
SUMMARYA high quality and well-aligned educator work force is central to the success of turnaround schools and districts, and is reflected not only in the research literature on the topic but also in Michigan’s own theory of change that underlies the Partnership Model. Partnership schools and districts are facing steep challenges with the recruitment and retention of both teachers and school leaders. However, many districts are taking advantage of the resources stemming from the Partnership Model to enact initiatives intended to improve the supply of human capital and to support and develop teachers so that they can tailor their instruction and practice to the specific contexts and students they teach. Some of these initiatives may be paying off, as reflected in teachers’ stated intentions for coming years. It will be important to follow the human capital strategies in Partnership districts to understand their challenges and assess their successes.
SECTION FIVE NOTES1. The composition of the educator work force changed little from the 2017-18 school year. We
refer the interested reader to Section One of our Year One Report for information on the makeup of the educator work force during that year.
2. For more information, see pbis.org.
3. Of course, with disruptions to schooling and the economy resulting from COVID-19, educators’ plans for retention reported in late 2019 may not hold in this new context. In later years, we will examine how educators’ plans for retention are associated with their observed retention both before and during the time periods affected by the pandemic.

EPIC | Education Policy Innovation Collaborative — Michigan State University
175
Partnership Turnaround: Year Two Report
SECTION SIX:WHAT CONDITIONS MEDIATE PARTNERSHIP TURNAROUND EFFORTS?
EPICEducation Policy Innovation Collaborative

Partnership Turnaround: Year Two Report Section Six | October 2020
176
There were several factors that appeared to be critical in mediating turnaround efforts — for better or worse. In Section Five, we discussed the ways in which the supply of quality educators and administrators was affecting the implementation of the Partnership Model. In this section, we turn our attention to three other factors that emerged as central to turnaround efforts during the 2019-20 school year: leadership, funding, and Partnership processes and systems.
SCHOOL LEADERSHIPAs we noted in Section Five, both Partnership and non-Partnership school teachers ranked school leadership as the most or among the most important factors in their decisions to stay in their same positions, same schools, and same districts. Similarly, they ranked leadership as a key reason they may have planned to leave their jobs. This evidence made clear that leadership was critical to the state’s efforts to turn around low-performing schools; a good leader can help convince teachers to stay in their schools and work to improve education, whereas a bad leader can drive teachers away and make the difficult work of turnaround even more challenging.
Here we highlight how Partnership leaders and respondents from our case sites viewed leadership as a central component in Partnership turnaround.
Section Six: What Conditions Mediate Partnership Turnaround Efforts?

EPIC | Education Policy Innovation Collaborative — Michigan State University
177
High-Quality School Leaders Were Seen as a Key Component to Effective School TurnaroundMany Partnership leaders reflected on the importance of leadership in setting school culture and climate, which they believed helped to stabilize the teacher work force in Partnership schools and allowed them to navigate through the complex challenges facing turnaround schools. For
instance, the charter leader of Maple Leafs felt quality school-level leadership was crucial for teacher retention. She/he said, “We talk about, ‘People don’t quit the job, they quit their boss.’ We believe that relationships with leaders and teachers is ground zero for retention.” Partnership leaders reported that teacher retention was particularly important for improving instruction and working towards Partnership goals (see Section Five). Avalanche’s district leader provided an example of how principal leadership affected staff composition and retention:
One of the things we’ve learned that has been huge is that leadership makes a huge difference in terms of turnover and that stability tends to breed stability, and instability tends to breed instability. What we’ve experienced in the district is — when I first came, we had [a Partnership school],
and we had a situation there where the principal and the staff were kind of at odds with each other. As a whole, it was not a great learning environment for kids because you had adults that really were working against each other there and even to the point where I think we had some adults who didn’t even like kids, which obviously contributes to problems. We moved that principal on and we now have a solid principal who’s able to provide strong guidance and is well-liked by the staff. She/he’s done some of his/her own hiring that has — basically, she/he’s found like-minded people who have come to work there. What’s happened then in [that] school is that turnover has stabilized significantly because of that stable leader, and the team, it’s not — they’re not all just staying for him/her, but they’re staying for each other. They have a support structure that kind of has been developed within the school that has helped them to stabilize the work force.
This example highlights how effective principal leadership can significantly impact the culture and climate of a school, which the leader of Avalanche felt was critical to making positive changes in general for the Partnership school. In Section Five, we noted that both Rangers’ and Islanders’ leaders discussed changing principal leadership to improve school culture and staff retention. Overall, districts reported that having quality leaders with the right skill set for their contexts was important for retaining staff and guiding new initiatives.
Many Partnership leaders reflected on the importance of leadership in setting school culture and climate, which they believed helped to stabilize the teacher work force.

Partnership Turnaround: Year Two Report Section Six | October 2020
178
It appears that Partnership districts were at least somewhat successful in finding and supporting effective school leaders to work in Partnership schools and districts. Figure 6.1 shows how teachers in Partnership districts rated how effectively their principal performed eight different dimensions of their duties. In every single one, Partnership teachers rated their principals as leading their school at least “somewhat effectively,” closing in on “very effectively.” These increases were statistically significant in nearly every case. Moreover, teachers in Partnership schools rated their principals as more effective than did teachers in non-Partnership schools across all dimensions. This is a shift from last year, when teachers in both sets of schools rated their principals about the same.
FIGURE 6.1. Teachers’ Evaluations of Their Principals’ Effectiveness
Partnership Teachers Non-Partnership TeachersIncrease Since 2018 Decrease Since 2018
Not at All Effectively
Somewhat Effectively
Extremely Effectively
Establish clear discipline policies
Slightly Effectively
Very Effectively
Worked with community partners to provide support or resources for the school
Work with staff to meet curriculum standards
Encourage parental engagement
Facilitate and encourage professional development
Communicate improvement strategies and goals with
teachers
Use evidence to make data−driven decisions
Communicate the central mission of the school
Note: Teachers were asked, “Indicate how effectively your principal or school leader performed each of the following:”

179
06/Case Study
Vignette
Leadership Changes Were Crucial to Positive Change in All Case Sites
While stable leadership was indeed important, it was equally important for the right leader to be in place. This was not just for school leaders; our cases highlighted that changes in school- and also district-level leadership were seen as key drivers of improvement, helping to refine and sharpen Partnership Agreements and implementation efforts.
The Blues superintendent explained how their efforts to turn around the district started with new leadership:
We started really with that philosophy that we stabilize leadership first. My first year here I did some things to stabilize my central office. My whole team turned over except for my executive administrative assistant. Everybody else in my office turned over, so then getting that team to have that same common vision and standards, and expectations. The next year, we stabilized our principal team, and then this year, through the "grow-your-own program", I think that really accelerated us. I didn’t expect that type of stabilization, and it’s been a huge help.
According to the superintendent, it was crucial that the new leadership team could start with the same common vision as opposed to having to work with existing staff who may start with very different goals, expectations, and standards and which would take more time in terms of being able to develop the necessary relationships, trust, and capacity.

180
In Flames, a change in school-level leadership was viewed as necessary because test scores were decreasing under that leader’s watch. In response to a question about why the prior leader was replaced by the board, the current principal said:
The scores had lowered. The school had a great reputation and had won all these awards, and then we just noticed that the scores were going down. We had a conversation with [the prior leader] and just the passion wasn’t there and, in turn, it affected the management of the school and the students as well.
As noted in Case Vignette #2, Flames teachers all attributed a positive shift in culture and climate to the new principal’s leadership style. One teacher explained:
I think [the leadership change] helped with the culture a little bit just because I think the principal that’s here now, she/he’s more visible, [she/he] participates in a little more of what we do as teachers… So that helps change the culture because a lot of people look up to him/her and like him/her and she/he has a relationship with the teachers, so I think that helps.
Similarly, teachers at Stars felt positively (e.g., “I think she/he’s doing a good job”) about the district’s new Partnership leader after the prior superintendent left the district. Several expressed issues with transparency and fear under prior leadership, as one leader put it, “Under the old regime it was the ‘I gotcha’ mentality where there were days when… we would sit here thinking, ‘This is the day where they’re coming for me,’ and that’s not really a good way to run a district.”
Another leader noted, “The last superintendent had a habit of whatever money we had, just taking it and spending it as [they] saw fit, not based on what the needs of the building were.” By contrast, and while there were still some reported issues with how Partnership funds were being spent, the new Partnership leader was able to refocus their Partnership Agreement in ways that were better aligned and more strategically focused on accomplishing Partnership goals [see Case Vignette #01 for a description].
In sum, leadership change at both the district and school levels in our case sites were closely linked to what were largely seen as positive changes in culture, climate, and instruction in Partnership schools.
06/Case Study
Vignette
LEADERSHIP CHANGES WERE CRUCIAL TO POSITIVE CHANGE IN ALL CASE SITES

EPIC | Education Policy Innovation Collaborative — Michigan State University
181
FINANCIAL RESOURCESPartnership educators and leaders consistently reported that financial constraints hindered their abilities to turn around their schools and districts. As we noted in Section Four, Partnership educators believed that additional 21h and RAG funding was crucial in helping them to achieve their school improvement goals, but the funds provided were often insufficient. Given the pervasiveness of this belief among our study respondents and the strong research literature that confirms the importance of fiscal resources for school improvement and student outcomes, especially in low-
performing schools and districts (e.g., Candelaria & Shores, 2019; Hyman, 2017; Jackson, Johnson, & Persico, 2016; Johnson & Jackson, 2019), we revisit this important mediating condition here.
Partnership Leaders and Educators Felt They Needed More Financial Resources to Turn Around Their SchoolsIn interviews, Partnership leaders confirmed that available funding was insufficient for them to reach their turnaround goals. 21h funds were almost universally perceived as helpful but were most useful to organizations that were smaller and/or financially stretched. This was consistent with educators’ survey responses, where both teachers and principals, in Partnership as well as non-Partnership schools, rated financial constraints as a “moderate” hindrance and Partnership principals rated this issue as a greater hindrance to their improvement over time (see Section Five).
Nearly all leaders (19 out of 22) expressed some degree of positivity about 21h money. Districts varied in the ways they viewed and used the 21h funds. Larger districts tended to see the additional money as, in the words of Stars’ leader, “a drop in the bucket,” and used funds on one-time purchases such as curriculum, professional development, or other materials. Purchasing training or professional development was one of the most common uses of 21h funding, particularly for larger districts. For example, Bruins’ district leader explained, “We also used the money to receive training for our central office and coaches to be trained in some math interventions. We’ve used that two times.” She/he further elaborated that they could most easily use these funds for one-time expenses, noting, “It’s been very worthwhile to give yourself a shot in the arm to give you some more immunity to some things going on.”
Black Hawks’ district leader also primarily used 21h funds for training: “We train and cross-train people. You build capacity. Our hope is that those practices that the training has allowed will continue.” Other larger districts, such as Devils and Red Wings, gave examples of using their money for professional development on teaching children who had experienced trauma and purchasing a new assessment analysis system.
19 OUT OF 22 PARTNERSHIP LEADERS EXPRESSED POSITIVITY
ABOUT 21H MONEY
Districts varied in the ways they used 21h funds. Larger districts
tended to use funds on one-time purchases such as curriculum,
professional development, or other materials. Smaller organizations were able to creatively allocate
funds to address staffing (e.g., teacher salaries or incentives,
coaches, district staff).

Partnership Turnaround: Year Two Report Section Six | October 2020
182
While smaller organizations or individual charter schools used funds for one-time purchases as well, they viewed 21h as a meaningful amount of money because they had smaller budgets in general. As the charter leader of Rangers put it, “I don’t know how to quantify it. Very [helpful], yeah, it’s been, yeah. We’re talking several hundred thousand dollars, that makes a big difference in a small school.”
Additionally, smaller organizations were able to creatively allocate funds to address staffing (e.g., teacher salaries or incentives, coaches, district staff), which many felt was crucial for supporting teachers and ongoing capacity building efforts. For instance, Maple Leafs’ charter leader was able to hire an attendance agent and reading interventionists, who were perceived as “pivotal.” Flyers’ charter leader discussed reallocating funds to provide salary bumps for teachers and being able to hire an organization to focus on teacher training. The leader of Flyers explained that these were things they wanted, but did not have the financial flexibility, to do:
In terms of 21h, it has definitely been a resource that has allowed us to move forward with some strategies that again, we’ve had our sights set on, but didn’t have necessarily a way to make it come to fruition because there just wasn’t funding available behind it in the school’s budget. It has definitely been a really key resource in the work that we were doing and will play a really pivotal role in how we’re able to not just make the improvements but sustain the improvements and then grow on them over time.
Other small districts such as Blues hired reading interventionists to work with struggling students, and Wild hired a consultant to assist with strategic planning. Although many of these smaller organizations were able to hire new staff, some leaders worried that using 21h funds for hiring lessened their ability to recruit great people for these positions due to questions of funding sustainability. The leader of Predators explained:
There’s 21h funding, which goes along with your Partnership Agreement and in some situations, I’ve taken advantage of that, but it’s also very hard to find additional personnel that want to come on board, knowing that the position is in a way, grant funded. In education, people are very apprehensive to take grant-funded positions because at any point in time that grant funding can no longer be available.
Despite this, leaders generally felt positively about at least having the funds and flexibility to staff new positions. There were, of course, some exceptions. For instance, the district leader of Islanders felt like the compliance piece of 21h was more hassle than help — stating that she/he would rather give back 21h funding than go through all the time involved in compliance. Although not everyone felt so strongly, a few other leaders also suggested that accessing the 21h funds took time away from other activities.
PARTNERSHIP SYSTEMS AND PROCESSESThe team at the Office of Partnership Districts (OPD) at Michigan Department of Education (MDE) worked to improve and standardize Partnership systems and processes during and leading up to the 2019-20 school year. In particular, OPD tried to standardize the role of liaisons (discussed in Section Three, above), and to clarify reporting and monitoring of Partnership district progress through a new Review of Goal Attainment (RGA) process.

EPIC | Education Policy Innovation Collaborative — Michigan State University
183
Partnership Leaders Were Generally Supportive of the New RGA ProcessMany Partnership leaders indicated that the RGA process was useful to them and they found value in reflecting and in the feedback given. For example, the district leader of Stars shared they found the structure of the RGA process to be helpful:
By being in the Partnership, an unintended result was we were basically forced to prove that we were a solid institute. RGA was a good check and balance to make sure that we were who we said we were. It was a good way to validate all the hard work we’re doing. It was a good way to validate that our processes and systems are strong, and they are comprehensive, and with proof, with evidence we were moving in the right direction. […] I think if we weren’t in the Partnership Agreement, we would have continued moving forward and not pausing to look at and reflect on what we did like we did. The Review of Goal Attainment makes you stop and review and reflect in a structured process.
The midpoint check point was viewed as useful for districts to reflect on their work thus far and make changes. The district leader of Blue Jackets explained the RGA “validated the work through our ratings, and then we also received feedback on things that we were doing well and things that we can improve upon.” This feeling of validation was repeated by the district leader of Bruins, who shared some of the specific feedback their district was provided for moving forward:
There was validation of [the work in progress], and there was good feedback on what the principals should continue to do in working towards this and some helpful hints for them. […] One of [the suggestions from the RGA] was the professional learning communities and making sure that they’re tracking maybe a little deeper on how students are progress monitoring.
In addition to feeling that the RGA process was supportive, validating, and helpful, some district leaders also expressed that their MDE liaison made it easier to navigate the compliance components, as the charter leader of Oilers said:
I think also that was another thing that our liaison really helped prepare us for. She/he kind of, you know, encouraged us to do practice run throughs with him/her and [an ISD partner]. She/he gave us feedback on those practice run throughs. She/he kind of laid out the process for us ahead of time. She/he kind of told us how we would submit our evidence in November, so we knew what was coming up before we got that email about submitting things into the system. Told us when we would be getting feedback from that system, and kind of that we would have an idea of where everybody’s thoughts were going into that 18-month review. So, it wasn’t just scary, I think, as it could have been.
Districts used RGAs to tell their stories. Several Partnership leaders, in particular, appreciated that the revised RGA process enabled them to paint a more complete picture of their progress and challenges in their reporting to their partners

Partnership Turnaround: Year Two Report Section Six | October 2020
184
Partnership leaders appreciated that the revised RGA process enabled them to paint a more complete picture of their progress and challenges.
and to MDE.1 Leaders commented that the RGA process was an opportunity for them to tell their “story” to MDE in a way that data uploads alone could not. As the district leader of Devils shared:
It was helpful for MDE to hear our whole story, and for all of our partners to hear that story with MDE here. [Specifically,] the challenges that were faced. The big picture, not just the NWEA scores and those types of things. What’s the big picture say? We just were really able to share that data about all the [teacher] turnover and how that affects us. What that means long term and short term.
Although the Devils leader shared with us that she/he was uncertain about the purpose of the meeting if partners were in agreement on goal progress based on the data uploads, she/he felt the opportunity to sit together and talk during the RGA was beneficial, “After the meeting, I felt really good, because we really got to tell about what’s going on.”
The charter leader of Flyers also appreciated the opportunity to share details about how and why the district met or did not meet benchmarks:
I guess in my mind it’s nice to already have MDE’s feedback. You’re going into the RGA knowing this is about telling a strong story about the progress you’ve made, but what’s beneath the progress? Why are you making this progress and what’s next? As opposed to whether or not we’ve met the 18-month benchmarks is dependent upon the way in which this 18-month RGA goes. I just thought that was a smart way to set it up on MDE’s behalf. I think that allows you to focus on the story rather than being worried about the outcome.
This showcased how the RGA meeting can move beyond a check-the-box compliance activity and become an opportunity for partners and MDE to better understand the specific contexts of Partnership districts so they can provide advice and supports going forward. Similarly, the charter leader of Oilers shared that the RGA, like the Partnership Model in general, provided an opportunity for the district to build relationships with partners by educating them about the district’s needs:
I think others have really gotten to know us through the Partnership Agreement. And just through some of the Partnership networking meetings and things like that, in order to know who we are and kind of some of the unique challenges we face […] and to try to even help us in some of those areas, or at least acknowledge where we have difficulties.
In observing three RGA meetings, we also saw districts take the time to showcase their students, faculty, and turnaround work. For example, one district used a short video with student narration, teacher comments about new initiatives, and comments about why the students and teachers loved their school to set the stage for the review of their goals, with the Partnership leader emphasizing that the Partnership work was about the kids. This storytelling aspect humanized the focus on data that predominated the discussion of the goals.

EPIC | Education Policy Innovation Collaborative — Michigan State University
185
While some districts appreciated being able to tell their story in this way, liaisons and MDE were flexible and had candid conversations about districts having time or capacity to create videos or similar evidence to tell their story. The charter leader of Flyers, who is noted above as finding value in the RGA process, shared that they limited the “production” aspects:
[Our liaison] had mentioned something about a lot of this is about a show and really telling your story. You might consider having music and videos of kids and things that are really emotionally bound. You know, we laughed, but have had a really candid conversation about we don’t have or do those things because one, we’re not resourced in that we don’t have a production company. We don’t have a production department and two, we’re busy doing the work every day. The reason we’re making traction is because we’re focused on the things that matter. We’ll make sure there’s a good emotional telling the story component to this, but is not gonna be about […] music and production value and whatnot. Yeah, and she/he heard that and she/he took it and she/he didn’t take offense to it, and she/he understands.
This exemplified that while Partnership districts valued the storytelling aspect of RGAs, leaders also were strategic in how they spent time preparing for these meetings, acknowledging the resources involved.
Building the plane while flying it.The fact that OPD was rebuilding the RGA process as districts were going through it did not go unnoticed by Partnership leaders, and some reported that there was some sense of the state “building the plane while flying it.” For instance, some leaders found the data system for upload challenging and felt that they needed to adjust their presentations to meet guidelines that were finalized close to their meeting dates. The charter leader of Flames noted, “There are some pros and
cons to that part of it. We had some hiccups about how we were set up in [Grant Electronic Monitoring System] GEMS and the expectations. Overall, I think it’s going fine.”
Similarly, other district leaders discussed shifting expectations or processes for complying with the Partnership Model. Some of these difficulties seemed to result from the clarification of new processes. The charter leader of Maple Leafs shared:
I think, in terms of oversight, we had a little hiccup as we were preparing for our 18-month benchmark on business rules. That was an unforeseen — we thought we were on the same page for a year or so, and then suddenly we’re talking about how are we calculating things. That wasn’t good.[…] That was a bit of a, “Oh, I wish we had gotten that taken care or made it clear.”
Although there were these concerns about the RGA process, it appeared that some of these “hiccups” were ironed out over time. Partnership leaders who had later RGA meeting dates seemed to feel more comfortable with the process and expectations, suggesting that clarity had increased as the policy evolved.
RGA meetings have become an opportunity for partners and MDE to better understand the specific contexts of Partnership districts.

Partnership Turnaround: Year Two Report Section Six | October 2020
186
Despite Improvements, Some Still Find the Partnership Model to be Too Compliance Focused The RGA process and necessary tradeoffs due to limited time.Even though OPD modified the RGA process, some leaders reported that it was time consuming and compliance focused and took their attention from more pressing concerns. Oilers’ charter leader’s comment above, that the RGA process “wasn’t just scary as it could have been,” highlights that these meetings still carry some degree of stress for districts. The focus on accountability and compliance led some leaders to feel burdened by the RGA process requirements. The district leader of Ducks found the process cumbersome and time-consuming, and questioned the usefulness of the RGA:
What’s the point? What’s the purpose? All the Partnership districts are schools that serve predominantly vulnerable students. What are they hoping to gain by us uploading a lot of documents? Would it be more purposeful to be on the ground here, really trying to create or help us design a systems response to underachieving kids, or is it better to ask us to do a lot of paperwork?
Some leaders found that creating a presentation and gathering data in the required format took significant time and might not have been perceived as useful if the district was already collecting and reviewing the data in another way. This was particularly the case for districts with small central offices. As a charter leader in Blues said after reviewing Partnership reporting requirements:
That’s just going to be more time that we’re not going to be able to do the work we were going to be able to do. There’s work coming up that I’m going to have to do that’s going to take hours to put together. That’s […] just reporting on what’s already happened. It’s not moving us forward.
Similarly, the charter leader of Sabres told us:
It’s [The RGA process is] just time-consuming. […] Just the intentionality of putting together the presentation and the time to meet with your team to go over it in advance to let everyone get their nerves out because kindergarten teachers aren’t doing presentations like this all the time. Me, you could put me in front of a group of strangers, and I could not have anything in my hands and be fine for probably three hours, but that’s not necessarily the case with a kindergarten teacher in front of a bunch of grownups. They could do that with kids but not adults. The level of practice that’s required. I get the intention. It’s just cumbersome and this is money—this is time that I could be spending in classrooms, providing support for the principal, whatever the case may be.
As these quotes make clear, Partnership leaders felt that time was precious and that compliance activities can take away from more impactful work on initiatives. To handle what were viewed as competing priorities with limited time, some districts tried to use their work for their Partnership Agreements and RGAs to fulfill other reporting and accountability functions. For example, the district leader of Ducks tried to ensure reporting was not an additional task, but could be incorporated into or satisfied by already existing activities:

EPIC | Education Policy Innovation Collaborative — Michigan State University
187
When we report, I make sure that it’s aligned to a practice that we’re already doing to make sure that it’s not something new or added. An example is these 18-month reviews. Well, we’re going to do our cycle review. We’re already doing that work, so how can we make sure that it is aligned to something we’re already doing and not a new thing?
Required or expected professional development and meetings took educators’ time.In addition to the explicit compliance requirements, district leaders talked about additional meetings and professional development that Partnership districts were encouraged or perceived as expected to attend. Some districts tried to preserve employees’ time by limiting meetings. The charter leader of Flyers shared that they made strategic decisions about who participated in ISD-led meetings for Partnership schools:
These are all-day sessions that, quite frankly, we haven’t drawn significant value from, but it’s important to have representation there mostly from a political lens. […] They would prefer that the principals are there. Our principals don’t go. It is not a good use of their time. Their time is best spent coaching teachers and helping maintain the culture of the school, so they don’t go. […] That was kind of an initial agreement that we had made with them. They wanted their time protected.
While such professional development might not be an explicit compliance requirement of the Partnership Agreement, there was the perception that Partnership districts needed to participate to be perceived as actively engaging in the policy. The leader of Rangers also discussed protecting staff from attending professional development or meetings that duplicated efforts within their charter district, saying:
We’ll get a call or have a meeting and it’s all of these just different trainings. Trainings on culture and climate, trainings on trauma, trainings on cultural competency. […] Those things are important, and we actually do cover those things just as a company with our leaders and with social workers and teachers and the instructional coaches and all of those things. In terms of the school and the school being — even being a smaller school, you can only ask people to do so many things. [With these types of suggestions,] I try to respectfully say it’s not a priority.
The charter leader of Senators also expressed that meetings were a burden to implementing the Partnership Model:
I guess the amount of time that they take — you know, you meet. It’s a lot of meetings. A lot of meetings. Because we are a single building school and I don’t have an assistant principal yet, well, we’re constantly meeting, meeting, meeting. Sometimes
Partnership leaders felt that time was precious and that compliance activities took away from more impactful work on initiatives.
Partnership Turnaround: Year Two Report Section Six | October 2020
188
I think that these meetings can be Skyped. They can be, you know, they don’t always have to be a physical meeting because it’s just a lot of note taking and I haven’t seen a lot of progress. […] It’s never let’s spend some time in the classrooms. Let’s take a look at what we’re seeing — there’s no coaching, it’s just talking, talking, talking.
This suggests that some Partnership districts would like to have fewer meetings, and more (in the words of Blues’ superintendent) “boots-on-the-ground” support from partners. Because the initiatives and efforts to meet Partnership goals were perceived to be time and resource intensive, districts tried to strategically use their limited capacities in the most impactful ways. Much like how districts indicated that they could not implement all the initiatives they would like, it was important for some leaders to limit the impact of compliance activities on the time available for other work.
At Times, Liaisons and Changes in Assigned Liaisons Contributed to Misunderstandings and Inconsistent Expectations As we noted in our Year One Report, liaisons played a central and important role in the Partnership Model. And like in that report, many Partnership leaders expressed that their liaisons were valuable to their turnaround efforts. However, 11 Partnership leaders also shared that they attributed some of their frustrations with meeting Partnership Model expectations and adapting to new processes to changes in their assigned liaisons. For instance, the charter leader of Maple Leafs, who had expressed frustration with changing policies for reporting right before their RGA, noted, “We did have a change in our liaison too. That could be part of the [issue].”
The district leader of Islanders explained their experience working with MDE and OPD:
This is very laborious and, quite honestly, frustrating with the department because, depending on who you talk to, you get different answers. I think they’ve streamlined the process because, quite honestly, we had to recreate the plan because we didn’t know who [our] liaison was. The first liaison was horrible, and we have a better one now because it’s like — they didn’t have a clear plan. Now, it’s a lot better. I still think it’s too cumbersome. We’re a Partnership district. We need to be focusing on those kids. We don’t have time for meetings about nothing [and] that are not relevant. We work with our liaison, and that [should] be it.
Even though changing liaisons could disrupt the work, several districts expressed that their experience improved when their liaison changed. The charter leader of Rangers felt their first liaison gave inaccurate information that led to later confusion:
A Partnership liaison changed. I believe one of the reasons for some of the early-on confusion is our liaison. […] I think she/he told us some things that weren’t quite accurate. We had misinformation […] I think that that was the reason for some of the misunderstandings. We ended up with a new liaison, and I’m not sure why — we didn’t ask for one. We were just going to work through whatever we needed to work through. Maybe the system has just gotten better over time, I’m simply guessing, I don’t know.

EPIC | Education Policy Innovation Collaborative — Michigan State University
189
Again, we see a leader who felt they received inaccurate or changing information, but in this case a new liaison helped to clarify challenges and improve experiences. This highlights how districts relied on liaisons to navigate the policy and the importance of having the right liaison from the district leader perspective. Much like with the changes in policies, districts tended to have positive impressions of the new liaisons but noted the changes during implementation were challenging.
Partnership Leaders Appreciated the Ability to Adjust the Model to Their Specific ContextsOne of the perceived benefits of the Partnership Model is that district leaders can select initiatives that fit the unique context of their Partnership school(s). Too much standardization can constrain this flexibility, as not all initiatives meet districts’ needs well. For example, some district leaders strategically chose not to engage in some initiatives that their MDE liaison routinely recommended.
The most commonly mentioned example of a program or initiative that a district strategically turned down was the
MI Excel Blueprint program. While some districts have fully embraced this program and used much of the systems-building language to describe their approach to Partnership work, other districts found this initiative to be cumbersome or duplicative of other efforts already in place. For example, the charter leader of Flyers shared:
MDE, I won’t say pushed but has made the opportunity to take part in the Blueprint MI Excel Process, they made that an ongoing opportunity that we can get into and we’ve opted to not partake in that. We have our own school model around improvement that we leverage and use, so we’ve continued to opt out of [Blueprint].
Similarly, the charter leader of Wild felt that the Blueprint work would duplicate their work with a contracted Partnership facilitator, saying the district chose not to join Blueprint because, “It didn’t make sense. It was doing the same thing twice.” It seems both Blueprint and the Partnership Model take considerable dedicated time, so some districts either strategically engaged in Blueprint as the guide to their turnaround work or used other programs or resources to organize their work in a similar way. As some aspects of the Partnership Model were standardized, districts still valued the flexibility to select initiatives that met their unique needs and resource availability. Strategic buffering (see Special Section B) can be an important way districts manage their Partnership work to fit their capacities for implementation.
A perceived benefit of the Partnership Model is that district leaders can select initiatives that fit the unique context of their school(s).

Partnership Turnaround: Year Two Report | October 2020
190
Special Section D:
Partnership Districts and COVID-19
In the spring of 2020, communities across the United States and across the world were fundamentally impacted by the rapid spread of COVID-19. The pandemic affected public services of all types as the economy ground to a halt, citizens were asked and frequently mandated to stay home in order to stay safe, and policymakers across the country shuttered school buildings to slow the reach of the disease and lessen the mortality and health impacts ballooning across the country.
In response to the spread of COVID-19 across Michigan, on April 2, 2020 Governor Gretchen Whitmer issued Executive Order No. 2020-35, which suspended all in-person K-12 instruction for the remainder of the school year. Of course, some communities were hit harder by COVID-19, both in terms of the direct health and mortality outcomes of the disease and by the breakdown of economic security. As we highlighted in Section One of this report, Partnership districts are in Michigan’s most disadvantaged and underserved communities — exactly those areas that were more severely affected by the pandemic. To that end, as of April 10, 2020, the counties in which Partnership districts were located had, on average, 332.3 cumulative COVID-19 cases per 100,000 people. By contrast, the Michigan counties that did not house Partnership districts had only 63.5 cases per 100,000 people. In other words, the communities in which students attended and educators taught in Partnership districts were hit 5.2 times harder by the virus than others in Michigan. By August 10, 2020, cases per 100,000 were up to 1,234.3 and 491.3 cases in Partnership and non-Partnership district counties, respectively; the case incidence rate was 2.5 times greater in counties that housed Partnership districts than in those without (China Data Lab, 2020).
While school buildings across the state were closed, educators worked to provide students with instruction
COVID-19 In Michigan Communities:Partnership districts are located in Michigan’s most disadvantaged communities — exactly those areas that were more severely affected by the pandemic.
•vs•
332.3Average cumulative cases
per 100,000 people in
Partnership districts
In April, Partnership districts were hit
5.2xtimes
harder by the virus than others in Michigan.
APRIL 2020
63.5Average cumulative cases
per 100,000 people in
Non-Partnership districts
•vs•
1,234.3Average cumulative cases
per 100,000 people in
Partnership districts
AUGUST 2020
491.3Average cumulative cases
per 100,000 people in
Non-Partnership districts
What Does This Mean?
&Partnership district case
incident rates were
2.5xtimes
greater than other districts in August.
Special Section D:

EPIC | Education Policy Innovation Collaborative — Michigan State University
191
SPECIAL SECTION D: PARTNERSHIP DISTRICTS AND COVID-19
and other supports. To begin to understand how Michigan school districts continued to provide K-12 students with learning opportunities in the absence of traditional face-to-face instruction, EPIC researchers, in partnership with the Michigan Department of Education, analyzed every Michigan school district’s Continuity of Learning (COL) plan (N=813). The plans were written in April 2020 in response to Executive Order 2020-35; they outlined districts’ initial strategies across a range of issues related to K-12 schooling. In addition, EPIC conducted a survey of all K-8 teachers and principals in Michigan traditional public and charter schools. The survey asked educators about how they were engaging with students, the challenges they were facing, the resources and supports they were using, and their concerns about the impacts of COVID-19. In total, 8,565 teachers and 316 principals responded to the COVID-19 educator survey, a response rate of 16% and 12%, respectively.
In what follows, we examine these data to understand what, if any, differences existed between Partnership districts’ and non-Partnership districts’ planned responses to the suspension of face-to-face instruction. We also highlight differences in Partnership and non-Partnership teachers’ and principals’ perceptions of the impact of COVID-19 on their schools and students, and any variation in the concerns educators expressed in Partnership relative to non-Partnership districts. We then discuss implications of the pandemic and associated changes to schooling for Partnership districts moving forward, and for our own study of the Partnership Model.
DIFFERENCES IN COVID RESPONSES BETWEEN PARTNERSHIP AND NON-PARTNERSHIP DISTRICTS
Teachers in Partnership Districts Reported Greater Challenges in Transitioning to Remote LearningTeachers in both Partnership and non-Partnership districts reported substantial challenges in transitioning to remote instruction in spring 2020. Figure D1 shows the areas teachers found most to least difficult in the transition. Topping the list for both sets of teachers was student attendance, although this appeared to be a greater challenge for Partnership teachers than for those in non-Partnership districts. Partnership teachers also reported greater difficulties stemming from their students not having family members to assist them with learning activities, consistent internet access for their students, lack of available technology and technology training for their students, and continuing to provide supports for students with Individualized Education Plans (IEPs) or 504 plans and for English Learners (ELs), and the ability to provide services such as meals and counseling when school buildings were closed.

Partnership Turnaround: Year Two Report | October 2020
192
SPECIAL SECTION D: PARTNERSHIP DISTRICTS AND COVID-19
FIGURE D1. Reported Challenges Faced in Transitioning to Remote Learning
*Note: e.g., one-on-one or small group instruction beyond daily classroom instruction
0% 40% 100%20% 60%
Consistent internet access for me
80%
Percent saying “To a moderate extent” or “To a great extent”
Partnership Teachers Non-Partnership Teachers
Continuing to provide support/services to English
Learners (ELs)
Continuing to provide services/supports when school buildings are closed (e.g., free/
reduced meals, counseling)
Lack of technology training for e-learning tools
Finding instructional plans and materials that work
well in a virtual classroom
Continuing to provide support/services to students
with IEPs/504 plans
*Continuing to provide access to literacy intervention
services to students who receive extra literacy supports
Facilitating student-to-student interaction in a
virtual setting
Facilitating student participation in virtual class
activities
Lack of technology training for students
Lack of available technology for students
Consistent internet access for students
Keeping students engaged in schoolwork
Family members being unable to assist students
with learning activities
Student attendance

EPIC | Education Policy Innovation Collaborative — Michigan State University
193
SPECIAL SECTION D: PARTNERSHIP DISTRICTS AND COVID-19
Partnership Districts Planned to Offer Different Kinds of Instruction than Non-Partnership DistrictsExecutive Order 2020-35 required that districts specify the respective roles of virtual instruction and hard copy media in their COL plans. As is shown in Figure D2, Partnership districts were more likely to plan to use a hybrid model of instruction, where instruction is delivered both in virtual and hard-copy formats, than were non-Partnership districts; 50% of Partnership districts planned for this option relative to 38% of non-Partnership districts. Partnership districts were slightly less likely than non-Partnership districts to plan to rely on solely virtual or digital instruction as the primary format to deliver distance learning content (39% of Partnership districts relative to 43% of non-Partnership districts). They were also less likely to specify that hard copy media was their primary mode of instruction (seven percent compared to 11%).
FIGURE D2. Percent of Districts by Primary Mode of Instruction and Partnership Status
Virtual ........................................... 39%
Hybrid ...........................................50%
Hard Copy........................................7%
Varied by Grade ............................. 4%
Partnership Districts
Virtual ...........................................43%
Hybrid ........................................... 38%
Hard Copy...................................... 11%
Varied by Grade ............................. 5%
Non-Partnership Districts
Figure D3 shows that districts’ plans for instructional delivery — apart from just the virtual, hybrid, or hard-copy modality — varied substantially. Partnership district COL plans were far more likely than non-Partnership district plans to specify that they would offer both synchronous and asynchronous virtual instruction, and to note that they would provide students with feedback on

Partnership Turnaround: Year Two Report | October 2020
194
SPECIAL SECTION D: PARTNERSHIP DISTRICTS AND COVID-19
virtual learning activities. Indeed, 86% of Partnership districts’ COL plans specified that students would receive direct instruction (defined as instructional activities where students are learning directly from the teacher including both synchronous and asynchronous activities), relative to only 42% of non-Partnership districts.
FIGURE D3. Percent of District COL Plans and Instructional Modalities, by Partnership Status
0% 40% 100%20% 60%
Students will receive direct instruction
80%Percentage of COL Plans Indicate...
Students will receive feedback on virtual learning
activities
Asynchronous virtual instruction
Synchronous virtual instruction
All Districts Partnership Districts
Non-Partnership Districts
Survey responses from Partnership teachers also indicated that they worked to connect virtually with students in multiple ways. Figure D4 shows the proportion of Partnership relative to non-Partnership district teachers who reported holding various types of virtual interactions with their students. We found that more Partnership teachers reported holding virtual classes with their entire classrooms, virtual tutoring sessions with small groups or one-on-one, and virtual office hours relative to teachers in non-Partnership districts.

EPIC | Education Policy Innovation Collaborative — Michigan State University
195
SPECIAL SECTION D: PARTNERSHIP DISTRICTS AND COVID-19
Figure D4. Teachers’ Reported Steps Taken to Engage Virtually with Students During COVID-19, by Partnership Status
67%PARTNERSHIP
TEACHERS
64%NON-PARTNERSHIP
TEACHERS
•vs•
Held virtual class(es) with my entire classroom
(e.g., via Google Classroom, Zoom)
Held virtual office hours
Held virtual tutoring sessions with small groups
or one-on-one
77%PARTNERSHIP
TEACHERS
65%NON-PARTNERSHIP
TEACHERS
•vs•
43%PARTNERSHIP
TEACHERS
34%NON-PARTNERSHIP
TEACHERS
•vs•
Note: Percent who “Have done this once or a few times” or “Have done this regularly.”
Partnership Districts Are More Likely to Provide Students With Electronic Devices and Internet AccessTo provide this kind of direct virtual instruction, Partnership districts planned to provide their students with electronic devices and internet access. To that end, 86% of Partnership district plans noted that they would provide electronic devices (e.g., tablets, chromebooks) relative to 79% of non-Partnership districts, and 64% said that they would provide students with internet broadband access (e.g., via hotspots) relative to 52% of non-Partnership districts.
FIGURE D5. Percent of Districts that Provide Electronic Devices and Internet Access to Students, by Partnership Status
At least some students All students
0%
20%
40%
60%
80%
Perc
enta
ge o
f Dis
tric
ts
100%
Non-Partnership Districts Partnership Districts Non-Partnership Districts Partnership Districts
District-Provided Electronic Devices District-Provided Internet Access

Partnership Turnaround: Year Two Report | October 2020
196
SPECIAL SECTION D: PARTNERSHIP DISTRICTS AND COVID-19
More Partnership Districts Planned to Offer Teachers Professional Development to Aid in Distance EducationOf course, switching to distance education was not easy for educators. Few, if any, teachers had been adequately trained in remote instruction techniques, and especially not in how to seamlessly transition from face-to-face instruction to distance learning. In their COL plans, Partnership districts were more than twice as likely to state they would provide teachers with professional development to assist them in providing remote education, with 57% of Partnership districts outlining plans for professional development relative to 26% of non-Partnership districts. Figure D6 shows that 46% of Partnership districts planned to offer professional development on online or distance instructional strategies (relative to 10% of non-Partnership districts) and 18% planned to offer training in software applications used in distance or online instruction (compared to eight percent of non-Partnership districts).
FIGURE D6. Professional Development and Training on Distance Learning, by Partnership Status
57%PARTNERSHIP
DISTRICTS
26%NON-PARTNERSHIP
DISTRICTS
•vs•
Any PD on instructional technology and/or distance learning
PD on transitioning to distance or online instruction
Training in software/applications used for distance learning or online instruction
46%PARTNERSHIP
DISTRICTS
10%NON-PARTNERSHIP
DISTRICTS
•vs•
18%PARTNERSHIP
DISTRICTS
8%NON-PARTNERSHIP
DISTRICTS
•vs•
Partnership Districts Planned to Use Student Check-ins to Assess Students’ Socio-Emotional Health and Need for SupportIn our surveys, 81% of Partnership teachers reported contacting students individually to check in, as did 75% of non-Partnership teachers. Nearly all COL plans (96% of Partnership districts and 92% of non-Partnership districts) said that teachers were required to check in with students regularly for purposes other than instruction. Approximately two-thirds of district
Few, if any, teachers had been adequately trained in remote instruction techniques.

EPIC | Education Policy Innovation Collaborative — Michigan State University
197
SPECIAL SECTION D: PARTNERSHIP DISTRICTS AND COVID-19
plans specified the intent of these check-ins. As is shown in Figure D7, Partnership districts were far more likely to specify that student check-ins should cover students’ socio-emotional health and assess whether students needed additional support from their schools. By contrast, non-Partnership districts were more likely to use check-ins to provide feedback to students about their learning and to enable social interactions between students.
FIGURE D7. Purposes of Non-Instructional Meetings with Students
0%
Partnership Districts Non-Partnership Districts
20%
40%
60%
80%
Perc
enta
ge o
f Dis
tric
ts
100%
Socio-emotional/mental health check
Assess whether more support is needed
Provide feedback about student learning Social interaction
COL Plans in Partnership Relative to Non-Partnership Districts Addressed Modifications for Different Kinds of StudentsGiven the growing concern that the absence of face-to-face instruction might be more deleterious for some students than others, many districts outlined how they would specifically
accommodate certain subgroups of students. In particular, districts discussed whether, and in some cases how, they would accommodate students with Individualized Education Plans (IEPs) or 504 plans, English Learners, students enrolling in Career Technical Education (CTE), dual enrollment programs, or early-middle college students, and high school seniors who were forced to finish their high school experience remotely. Figure D8 highlights the differences in the groups of students singled out for modifications in Partnership relative to non-Partnership districts’ COL plans. We find that Partnership districts were more likely to flag modifications for students with IEPs or 504 plans and English Learners, whereas non-
Partnership district plans more often discussed accommodations for students enrolled in CTE, dual enrollment, or early-middle college programs.
Partnership districts were far more likely to specify that student check-ins should cover students’ socio-emotional health.

Partnership Turnaround: Year Two Report | October 2020
198
SPECIAL SECTION D: PARTNERSHIP DISTRICTS AND COVID-19
FIGURE D8. Accommodations Provided for Subgroups of Students
0%
Partnership Districts Non-Partnership Districts
20%
40%
60%
80%
Perc
enta
ge o
f Dis
tric
ts
100%
IEPs/504 plans English Learners CTE/Dual enrollment/Early-Middle College Programs
High school seniors
Partnership Educators Expressed Deep Concern About Students’ Learning and Wellness During the PandemicEven with all these plans for continued education, direct instruction, and check-ins to assess students’ mental health and needed supports, educators in Partnership districts were extremely concerned about the impact of COVID-19 on their students and their teachers. Figure D9 compares the concerns expressed by teachers and principals in Partnership districts with those in non-Partnership districts. We found that greater proportions of teachers in Partnership districts were concerned about the impact of COVID on student learning and wellness. In particular, more Partnership teachers expressed concern about supporting students through grief and trauma related to the pandemic (81% of Partnership teachers relative to 72% of non-Partnership teachers), barriers preventing students from accessing e-learning (85% and 77%, respectively), and teachers from providing virtual learning opportunities (51% and 45%, respectively).
The disparities between Partnership district principals and principals not in Partnership districts were even more consistent. Greater proportions of Partnership principals reported being concerned about supporting their teachers through grief and trauma related to COVID (85% of Partnership district principals relative to 78% percent of non-Partnership principals), students missing crucial services and supports when school buildings were closed (88% and 83%, respectively), barriers preventing access to materials for literacy learning (85% and 71%, respectively), barriers preventing teachers from providing virtual instruction (65% and 58%, respectively), and the long-term economic impacts for themselves (65% and 59%, respectively) their teachers (85% and 77%, respectively), and their non-instructional school staff (92% and 84% respectively). Fewer Partnership principals expressed concern about maintaining and building relationships with students despite distance and uncertainty (77% and 82% for Partnership relative to non-Partnership principals), and the long-term economic impacts for the school itself (81% and 89%).

EPIC | Education Policy Innovation Collaborative — Michigan State University
199
SPECIAL SECTION D: PARTNERSHIP DISTRICTS AND COVID-19
FIGURE D9. Reported Concerns Over Impact of COVID-19, by Partnership Status
0% 40% 100%20% 60%
The long-term economic impacts for the school itself
80%Percentage saying “Concerned” or “Extremely Concerned”
Partnership Teachers Non-Partnership TeachersPartnership Principals Non-Partnership Principals
Barriers preventing me/teachers from providing
e-learning (e.g., lack of internet access, technology problems)
Supporting teachers through grief and trauma related to COVID-19
The long-term economic impacts for my teachers
The long-term economic impacts for my non-
instructional school staff
The long-term economic impacts for myself
Adapting my/my school’s/my district’s curriculum for
at-home or e-learning
Maintaining and building relationships with students
in spite of distance and uncertainty
Barriers preventing access to materials for
literacy learning (e.g., paper, pencils, books)
Students missing crucial services/supports when school buildings are closed (e.g., free/
reduced meals, counseling)
Supporting students through grief and trauma
related to COVID-19
Barriers preventing students from accessing e-learning
(e.g., lack of internet access, technology problems)
Students returning to school behind in other
content areas
The long-term economic impacts for my students
Students returning to school behind in literacy
Students missing instructional time

Partnership Turnaround: Year Two Report | October 2020
200
SPECIAL SECTION D: PARTNERSHIP DISTRICTS AND COVID-19
The differences discussed here do not necessarily suggest that educators in Partnership districts care more about their students, or that Partnership schools and districts are working harder to meet students’ needs than are other districts across the state. Rather, these findings shed light on the particularly challenging contexts faced by the students who reside and attend schools in Partnership districts and their surrounding communities. These results highlight the dramatically inequitable realities facing students who attend schools in Partnership districts, which are exacerbated by COVID-19 and its accompanying economic fallout, and shed light on the many ways that educators must meet these students’ needs beyond just the four walls of their school buildings.
CONTINUED IMPLICATIONS OF COVID FOR PARTNERSHIP DISTRICTSIt is, of course, difficult to know how the pandemic will play out for students, educators, schools, and districts across the country and in Michigan. Table D1 shows the distribution of Partnership and non-Partnership districts reopening plans for Fall 2020 in terms of whether they are bringing students back into face-to-face classrooms in part or at all, as of August 19, 2020. Because districts were required to plan for operations in both Phase 4 (when businesses/schools were allowed to open, but with substantial caution) and Phase 5 (when businesses/schools were allowed to open with fewer precautions), we coded the plans according to which Phase the district was in. We see that substantially more Partnership districts opted to start the school year fully remote (31%) than did non-Partnership districts (11%) and far lower proportions of Partnership districts planned to return to school in-person either for all or even some students (35% relative to 59%, respectively). These patterns likely reflect both their location in areas with higher case rates and other difficulties associated with returning to school buildings.
Continuing Implications of COVID-19: Partnership and Non-Partnership Districts
Substantially more Partnership districts opted to start the school year fully remote (31%) than did non-Partnership districts (11%) and far lower proportions of Partnership districts planned to return to school in-person either for all or even some students (35% relative to 59%, respectively).
31% Partnership
districts opted to start the school year
fully remote.
•vs•
11% Non-Partnership
districts opted to start the school year
fully remote.
35% Partnership
districts planned to return to school
in-person either for all or even some
students.
59% Non-Partnership
districts planned to return to school
in-person either for all or even some
students.

EPIC | Education Policy Innovation Collaborative — Michigan State University
201
SPECIAL SECTION D: PARTNERSHIP DISTRICTS AND COVID-19
TABLE D1. Instructional Modality for Fall 2020 School Reopening, by Partnership StatusAll Districts Partnership Districts Non-Partnership
Districts
Total Number of Districts 823 29 794
Districts in Phase 4 Regions 84% 100% 83%
Districts in Phase 5 Regions 16% 0% 17%
MODE OF INSTRUCTION
Fully In-Person Only 16% 7% 16%
Fully In-Person Option 43% 28% 43%
Hybrid Only 10% 14% 10%
Hybrid Option 17% 17% 17%
Fully Remote Only 12% 31% 11%
Not Specified 3% 3% 3%
Notes: Columns may not sum to exactly 100% due to rounding. Although there are 831 districts/PSAs in Michigan, only 823 plans for Fall 2020 were available. The remaining 8 plans would be from schools that were already offering only virtual education before the start of the 2020-21 school year. Source: Data collected from school districts’ Return to School Plans and district websites through a collaboration between the Michigan Department of Education (MDE) and the Education Policy Innovation Collaborative (EPIC).
Beyond whether students and teachers returned to their physical classrooms, Partnership districts were likely to face particularly difficult challenges as a result of the ongoing pandemic. The entire state — like states across the country — is facing a substantial and still unknown budget shortfall for the coming fiscal year (Burnette II, 2020). With reduced state resources comes a possible reduction in K12 education funding. As we have discussed throughout the report, Partnership district leaders and educators believed that they needed more money, not less, to continue on their trajectories to turn around their schools and districts. In addition, there have been concerns raised about increased teacher attrition as teachers may opt for early retirement or choose to step back from the work force for fears of their own and their families’ health and as a result of the need to take care of their own children who may be learning remotely for the foreseeable future (Fearnow, 2020). Both this year’s and last year’s reports make clear that Partnership schools and districts already struggle — even more than do other districts across the state — with maintaining an adequate supply of teachers and school leaders. Diminished teacher capacity in Partnership schools and districts will make improvement efforts even more difficult.
We also cannot understate the economic and health impacts that will continue to be particularly acute in Partnership districts and the communities that house them. As we discussed in the

Partnership Turnaround: Year Two Report | October 2020
202
SPECIAL SECTION D: PARTNERSHIP DISTRICTS AND COVID-19
very beginning of this special section, Partnership districts’ larger communities have been hit harder than other areas by the disease itself. The already precarious economic conditions in which Partnership districts exits will likely be made even worse as adults may lose their jobs and businesses will suffer and/or close in the pandemic-driven recession. The trickle-down effects of increasing poverty will have further implications for the mental and physical health of families and students, including basic aspects such as shelter and nutrition.
IMPLICATIONS OF COVID FOR EPIC’S EVALUATION OF THE PARTNERSHIP MODELIn addition to the pandemic’s affect on students, it has also affected how researchers can study the implementation and effect of education policies and practices. As is clear from Table D1 and from media reports across the country, many school districts started the school year in virtual settings, and those that are able to meet in person are hesitant to allow any extraneous people into school and district buildings. Moreover, as educators and district leaders work to implement education in dramatically different circumstances this year, many are rightfully prioritizing instruction and student well-being over participating in research projects. This hampers researchers’ abilities to observe educational practice and to hear from educators and leaders. In addition, traditional quantitative metrics by which researchers measure implementation and efficacy were not available or in some instances reliable in the 2019-20 school year, including measures of student achievement as on the M-STEP or even measures of attendance and mobility. It is likely that these indicators will be similarly impacted in the 2020-21 school year, as well.
EPIC is working closely with state policymakers to continue providing evidence and information about Partnership Model implementation and efficacy, even during these dramatic changes to education practice and research. As always, our intent is to provide the most helpful evidence possible to inform state and local policymakers’ understanding of education in Michigan, and we will continue to follow the Partnership Model in the coming year, surveying educators, interviewing leaders, and tracking indicators as we are able. We imagine that our research questions will evolve to understand how Michigan’s Partnership schools and districts will continue to implement initiatives to improve educational and whole-child outcomes amid this global crisis. We look forward to supporting their efforts in any way we can.
Trickle-down effects of poverty will have further implications for the mental and physical health of families and students, including basic aspects such as shelter and nutrition.

EPIC | Education Policy Innovation Collaborative — Michigan State University
203
SUMMARYTurnaround reforms such as the Partnership Model are necessarily complex as districts and schools work to improve operations and the instructional core to better meet the needs of their educators and students. In the previous section, we highlighted the importance of human capital — both teachers and school leaders — to the success of turnaround. Our data also showed that three other — and related — factors can mediate the impacts of turnaround on student and school outcomes: school leadership, financial resources, and basic turnaround systems and processes. In Partnership schools and districts, we found evidence that school leadership is indeed a make-or-break for successful turnaround, and that the additional financial resources brought into Michigan’s Partnership schools through the allocation of 21h and sometimes RAG funds enabled districts to implement necessary interventions, but were often insufficient to allow them to do all that they wanted or felt they needed to improve student outcomes. In addition, Partnership leaders reported that the new processes and systems MDE put into place to help standardize the Model and to make it more useful to Partnership schools and districts were useful, but still needed fine-tuning and were heavily reliant on the quality of Partnership liaisons.
SECTION SIX NOTES1. For more information on the RGA process, see Section Three.
SPECIAL SECTION D NOTES1. Michigan Executive Order 2020-35 (April 2, 2020). On April 30, 2020, this order was replaced
by Executive Order No. 2020-65, which retained the same content regarding COL plans for K-12 students and incorporated additional requirements, particularly around providing pre-school through the Great Start Readiness Program (GSRP). This brief focuses on the K-12 aspects of districts’ plans for continuity of learning.
2. To learn more about these data and our overall findings for Michigan schools, please see Lovitz, M.; Kilbride, T.; Turner, M.; & Strunk K.O. (July, 2020). How did Michigan school districts plan to educate students during COVID-19? An analysis of district continuity of learning plans. EPIC Policy Brief. Available at: https://epicedpolicy.org/how-did-michigan-school-districts- plan-to-educate-students-during-covid-19/, and Cummings, A., Kilbride, T., Turner, M., Zhu, Q., & Strunk, K.O. (August, 2020). How did Michigan educators respond to the suspension of face-to-face instruction due to COVID-19? An analysis of educators’ responses to the 2020 EPIC COVID-19 survey. EPIC Policy Brief. Available at: https://epicedpolicy.org/how-did-michigan-educators-respond-to-the-suspension-of- face-to-face-instruction-due-to-covid-19/.
https://epicedpolicy.org/how-did-michigan-school-districts-plan-to-educate-students-during-covid-19/

Partnership Turnaround: Year Two Report Section Six | October 2020
204
Partnership Turnaround: Year Two Report
SECTION SEVEN:KEY TAKEAWAYS AND POLICY IMPLICATIONS
EPICEducation Policy Innovation Collaborative

EPIC | Education Policy Innovation Collaborative — Michigan State University
205
Section Seven: Key Takeaways and Policy Implications
This report is the second of four in our multi-year evaluation of the implementation and efficacy of the Partnership Model of school and district turnaround. This evaluation includes analyses of student academic and teacher mobility outcomes, surveys of teachers and principals in Partnership districts (in both Partnership and non-Partnership schools), interviews of Partnership district superintendents, case studies of three Partnership districts, and observations of three districts’ Reviews of Goal Attainment (RGAs). The objectives of this second report are to trace Partnership Model implementation as the reform matures and to understand how participation in the Partnership Model impacts student and teacher outcomes, including growth on Michigan’s standardized achievement tests, graduation and dropout rates, and teacher outcomes associated with retention and turnover. In this final section, we outline key takeaways and consider the implications of these results for future policymaking.
KEY TAKEAWAYS
Early Partnership Effects on Student Outcomes are Mixed but Remain Positive for Cohort 1 • Cohort 1 achievement gains in Year Two of implementation remain positive but smaller than in
Year One. In Year Two of implementation, students in Cohort 1 Partnership schools experienced continued but slowed gains in ELA relative to the identification year. The impact of Partnership participation on Cohort 1 students’ math achievement growth was positive but not statistically significant. The exception was in DPSCD, where students in Cohort 1 schools saw continued and strong positive growth in both M-STEP and math SAT scores.

Partnership Turnaround: Year Two Report Section Seven | October 2020
206
• Students in Cohort 2 Partnership schools experienced no significant achievement gains in the first year of Partnership implementation in either math or ELA. However, students in DPSCD Partnership high schools exhibited substantial increases in math SAT scores, on average.
• Overall, Partnership did not impact students’ rates of on-time high school graduation, high school drop-out, or grade retention for either Cohort 1 or 2. DPSCD was again an exception, with continued dramatic decreases in high school drop-out rates for Cohort 1 students.
Partnership Educators Leveraged the Partnership Model to Benefit Their Schools and Districts • Many Partnership leaders reported that participation in the Partnership Model provided them
with a framework to help with strategic planning for improvement. This included enabling them to identify the most critical goals for improvement, use data to inform instruction and continuous improvement, and enhance communication within and outside of their districts.
• Principals in Partnership districts believed that their districts were increasing focus on several important areas of operation, including academic performance, family and community engagement, and school culture and climate.
• Partnership leaders and educators reported an increased emphasis on curriculum and instruction-focused initiatives in the 2019-20 school year, alongside greater attention to whole-child and parent and community involvement efforts to complement improvements to the instructional core.
• 21h and RAG funding were crucial in helping Partnership districts achieve their Partnership goals, but Partnership leaders and educators reported the need for additional funds to aid in improvement efforts.
• Perhaps as a result of all of these efforts, Partnership leaders and educators believed their schools and districts had improved over time and they were more satisfied with their jobs.
Teacher Recruitment and Retention Remain a Challenge in Partnership Schools and Districts • Factors such as teacher compensation and Partnership status itself can impede Partnership
districts’ and schools’ efforts to hire new teachers. To combat these concerns, some Partnership districts implemented initiatives to make teacher compensation slightly more competitive. Others launched “grow-your-own” programs and changed hiring practices to attract teachers who are better fits with their unique contexts.
• Both Cohort 1 and Cohort 2 Partnership schools and districts continued to struggle with teacher retention. To address these challenges, Partnership districts implemented new strategies to improve teacher retention. These included streamlining teachers’ jobs, working on school and district culture and climate, improving teacher compensation, and focusing on teacher development.
• With these initiatives, Partnership leaders were increasingly optimistic that their efforts to stabilize the teacher work force would yield positive results, and teachers reported that they were more likely to stay in their schools and less likely to leave.

EPIC | Education Policy Innovation Collaborative — Michigan State University
207
There Are Several Mediating Factors That Are Critical to Successful Turnaround in Partnership Schools and Districts • Human capital, and in particular a high-quality and stable teaching force, were believed to be
crucial for schools and districts to effectively turn around.
• High quality school leaders were seen as critical to effective school turnaround.
• Partnership leaders credited the additional funds from Partnership with being crucial to their abilities to improve outcomes in their schools, and believed that they would need additional financial resources to continue making progress.
• Partnership leaders and educators reported that efforts to improve Partnership systems and processes were largely successful in improving the initiative and aiding districts with their turnaround work.
POLICY IMPLICATIONSThe Partnership Model Appears to be Helping to Improve Schools and Districts; Patience is WarrantedSchool and district turnaround takes time. Progress is expected to be slow and even inconsistent. A broad and growing literature tells us that school and district turnaround is neither easy nor fast, but that it can be effective when done right (see, for example, Schueler, Asher, Larned, Mehrotra, and Pollard, 2020). That we are seeing early gains in achievement in ELA for students in Cohort 1 schools should be taken as a positive signal about the potential for leaders to strategically leverage the benefits of the Partnership Model. Moreover, Partnership
leaders and educators remain positive about the reform, and cite several areas where they believe the Model is helping them to improve schools and schooling in their districts. It will be important to provide policy stability and continued support to Partnership schools and districts as they continue to focus on strategic areas for improvement.
Human Capital Remains a Persistent Challenge in Partnership Schools and DistrictsPartnership leaders and educators continue to name human capital management — teacher recruitment, retention, and development — as the greatest impediment to their success. This is not surprising; high quality teachers are the bedrock of successful schooling (see, for example,
It will be important to provide policy stability and continued support to Partnership schools and districts as they continue to focus on strategic areas for improvement.

Partnership Turnaround: Year Two Report Section Seven | October 2020
208
Chetty, Friedman, & Rockoff, 2014), and Partnership schools and districts face continued challenges in maintaining a supply of high quality teachers who understand the specific contexts in Michigan’s lowest-performing districts. State and local policymakers should work to augment and facilitate Partnership school and district leaders’ efforts to improve working conditions and focus on developing teachers’ instructional capacities.
Additional Funding is Critical for Improvement EffortsPartnership leaders and educators consistently noted the value of 21h and other funding sources allocated via Partnership to enable them to implement school and district improvement strategies. However, there was a shared belief that the existing funds are insufficient to fully allow them to attract, retain, and develop the necessary human capital to further improvements or to implement all of the initiatives necessary to turn around their schools and districts. It is a well-established fact that money matters for school and district improvement, and that this is particularly the case for traditionally low-performing and under-resourced schools and districts (e.g., Hendren & Sprung-Keyser, 2020; Jackson, Johnson, & Persico, 2016; Johnson & Jackson, 2019). As education funding remains constrained in Michigan, especially in the face of the COVID- induced recession, it will be critical to continue providing resources to Michigan’s Partnership districts and schools.
As education funding remains constrained in Michigan, it will be critical to continue providing resources to Partnership schools and districts.
EPIC | Education Policy Innovation Collaborative — Michigan State University
209
EPIC | Education Policy Innovation Collaborative — Michigan State University
Key Terms, References and Appendices
9. LEA (Local Education Agency): A local education agency is an entity that operates a public school. Local education agencies can be a traditional public school district or a charter school/network.
10. MDE (Michigan Department of Education): The Michigan Department of Education is Michigan’s state education agency.
11. MI Excel: MI Excel is a system of support available to low-performing schools and districts in Michigan.
12. M-STEP (Michigan Student Test of Educational Progress): A suite of assessments administered to Michigan’s students since Spring 2015. M-STEP is the assessment that the Michigan Department of Education uses for school and district accountability.
13. Non-Partnership School: Non-Partnership schools are schools within Partnership districts that have not been identified as Partnership schools themselves.
14. OPD (Office of Partnership Districts): The Office of Partnership Districts is a unit within the Michigan Department of Education that identifies, supports, and evaluates Partnership districts.
15. Partnership Agreement: After being identified as a Partnership district, a local education agency works to develop a Partnership Agreement that guides its turnaround reform. This document identifies the district’s strengths and weaknesses, sets 18- and 36-month improvement goals, outlines strategies to help the district achieve those goals, lays out consequences for failing to achieve improvement goals, and describes how a range of external partners will support the district to achieve these goals.
16. Partnership Agreement Liaison: Partnership Agreement liaisons are employed by the Office of Partnership Districts but work with Partnership districts themselves to support the implementation of their Partnership Agreement.
17. Partnership District: Local education agencies that operate a Partnership school automatically become a Partnership district and must develop a Partnership Agreement to improve student outcomes in the identified school(s).
18. Partnership Model: The Partnership Model is Michigan’s plan for accountability, support, and improvement under the Every Student Succeeds Act. Under the Partnership Model, districts that operate the state’s lowest-performing schools develop and implement a plan to turn them around over a three-year period.
19. Partnership School: A low-performing school that has been identified for Partnership.
KEY TERMS1. 21h Funding: 21h is a grant appropriated by the Michigan
Legislature and administered by the Office of Partnership Districts at the Michigan Department of Education. Partnership districts are eligible to apply for 21h funding to support the implementation of their Partnership Agreement.
2. Blueprint: Blueprint is a program MI Excel offers to aid districts in their work to build or revamp their systems to support high-quality instruction.
3. CEPI (Center for Educational Performance and Information): The Center for Educational Performance and Information collects and manages Michigan’s educational administrative data such as records on the state’s teachers, students, and facilities.
4. COL (Continuity of Learning) Plan: Per Michigan Executive Order 2020-35, all local education agencies (LEAs) in the state were required to develop a plan describing how they would meet student needs during the COVID-19 pandemic. Following the cessation of face-to-face instruction that resulted from the pandemic, the Executive Order required that all schools begin providing learning opportunities no later than April 28, 2020. The COL described how LEAs would carry out these learning opportunities.
5. CSI (Comprehensive Support and Improvement): The federal Every Student Succeeds Act (ESSA) requires that states designate their lowest performing schools as Comprehensive Support and Improvement, or CSI, schools. In Michigan, the schools designated as CSI in 2017 comprised Partnership Round 3.
6. DIP (District Improvement Plan): In Michigan, all school districts are required to develop an improvement plan that outlines goals and strategies for improving student outcomes.
7. ESSA (Every Student Succeeds Act): Passed in 2015, the federal Every Student Succeeds Act is the most recent reauthorization of the Elementary and Secondary Education Act, which outlines the federal government’s education policies.
8. ISD/RESA (Intermediate School District/Regional Educational Service Agency): In Michigan, ISDs/RESAs are educational entities that operate between the Michigan Department of Education and local education agencies, often serving the local education agencies within a given county. Local education agencies can receive a range of services through their ISD.

Partnership Turnaround: Year Two Report Key Terms | October 2020
210210
KEY TERMS (continued)20. Priority Schools: This designation applied to the lowest
five percent of schools statewide in terms of performance through the 2016-2017 school year.
21. PSA (Public School Academies): In Michigan, public school academies are publicly funded schools that operate independent of a traditional school district, often referred to as charter schools.
22. PSAT (Preliminary Scholastic Aptitude Test): The College Board’s Preliminary Scholastic Aptitude Test 8/9 is a baseline college readiness assessment that the state administers to eighth graders to meet the federal accountability requirement for ELA and math assessment.
23. RAG (Regional Assistance Grant): The state awards these formula grants to local education agencies with low-performing Title 1 schools (currently Comprehensive Support and Improvement schools and previously Priority schools) to support school improvement activities.
24. RGA (Review of Goal Attainment): A process that occurs after 18 months of Partnership implementation in which representatives from the local education agency (LEA), MDE, the intermediate school district (ISD), and community partners meet to evaluate progress toward the 18-month benchmarks spelled out in the Partnership Agreement and determine whether the LEA may need additional monitoring and/or support to meet its 36-month goals.
25. SAT (Scholastic Aptitude Test): The Scholastic Aptitude Test is an assessment of college readiness. In Michigan, all 11th graders take the SAT as part of the Michigan Merit Examination.
26. SIP (School Improvement Plan): In Michigan, all schools must develop a school improvement plan and update it annually to guide their continuous reform efforts.
27. SRO (School Reform Office): The School Reform Office was an office tasked with oversight of school accountability in Michigan from 2010 through 2019. The Office was housed with the Michigan Department of Education other than a period from 2015 through 2017 when it was relocated to the Department of Technology, Management, and Budget. The School Reform Office closed as a result of legislation signed in March 2019.
28. TPS (Traditional Public School Districts): Traditional Public School Districts are special-purpose districts with geographic boundaries and a publicly elected governing board that receive public funds to operate schools.

EPIC | Education Policy Innovation Collaborative — Michigan State University
211
EPIC | Education Policy Innovation Collaborative — Michigan State University
REFERENCESArnold, G. (2015). Street-level policy entrepreneurship. Public Management Review, 17(3), 307-327.
Arsen, D., Delpier, T. & Nagel, J. (2019). Michigan school finance at the crossroads: A quarter century of state control. Michigan State University Education Policy Report, January. Available at: http://education.msu.edu/ed-policy-phd/pdf/Michigan-School- Finance-at-the-Crossroads-A-Quarter-Center-of-State-Control.pdf
Bartanen, B., Grissom, J. A., & Rogers, L. K. (2019). The impacts of principal turnover. Educational Evaluation and Policy Analysis, 41(3), 350–374. https://doi.org/10.3102/0162373719855044
Bleiberg, J., & Harbatkin, E. (2020). Teacher evaluation reform: A convergence of federal and local forces. Educational Policy, 34(6), 918-952.
Borman, G. D., Hewes, G. M., Overman, L. T., & Brown, S. (2003). Comprehensive school reform and achievement: A meta-analysis. Review of Educational Research, 73(2), 125–230.
Brummet, Q. (2014). The effect of school closings on student achievement. Journal of Public Economics, 119, 108-124.
Burnette II, D. (2020, March 19). Districts brace for crash in state K-12 revenue due to Coronavirus. Education Week. https://www.edweek.org/ew/articles/2020/03/19/districts- states-brace-for-crash-in-k-12.html
Candelaria, C. A., & Shores, K. A. (2019). Court-ordered finance reforms in the adequacy era: Heterogeneous causal effects and sensitivity. Education Finance and Policy, 14(1), 31–60. https://doi.org/10.1162/edfp_a_00236
Chetty, R., Friedman, J. N., & Rockoff, J. E. (2014). Measuring the impacts of teachers II: Teacher value-added and student outcomes in adulthood. American Economic Review, 104(9), 2633-79.
China Data Lab, 2020, "US COVID-19 daily cases with basemap," https://doi.org/10.7910/DVN/HIDLTK, Harvard Dataverse, V38, UNF:6:qXYRA5fiwxjTyylWK+HmAg== [fileUNF]; retrieved on August 25, 2020 from https://dataverse. harvard.edu/dataset.xhtml?persistentId=doi:10.7910/DVN/ HIDLTK
Cohen, N., & Klenk, T. (2019). Policy re-design from the street level. In Research Handbook on Street-Level Bureaucracy. Edward Elgar Publishing.
Creswell, J. W., & Clark, V. L. P. (2017). Designing and conducting mixed methods research. Thousand Oaks, CA. Sage Publications.
Cucchiara, M. B., Rooney, E., & Robertson-Kraft, C. (2013). “I’ve never seen people work so hard!” Teachers’ working conditions in the early stages of school turnaround. Urban Education, 50(3), 259–287. https://doi.org/10.1177/0042085913501896
Dodman, S. (2014). A vivid illustration of leadership: Principal’s actions propel struggling school’s turnaround. Journal of Staff Development, 35(1), 56–58.
Dougherty, S. M., & Weiner, J. M. (2019). The Rhode to turnaround: The impact of waivers to no child left behind on school performance. Educational Policy, 33(4), 555–586. https://doi.org/10.1177/0895904817719520
Fearnow, B. (2020, August 29). Teachers resigning across U.S. cite remote learning frustrations, COVID-19 concerns. Newsweek. https://www.newsweek.com/teachers-resigning- across-us-cite-remote-learning-frustrations-covid-19- concerns-1528553
Finnigan, K. S., & Stewart, T. J. (2009). Leading change under pressure: An examination of principal leadership in low-performing schools. Journal of School Leadership, 19(5), 586–621. https://doi.org/10.1177/105268460901900504
Frisch-Aviram, N., Cohen, N., & Beeri, I. (2018). Low-level bureaucrats, local government regimes and policy entrepreneurship. Policy Sciences, 51(1), 39-57.
Gallagher, H. A., & Cottingham, B. W. (2019). Learning and practicing continuous improvement: Lessons from the CORE districts. Policy Analysis for California Education, PACE.
Guin, K. (2004). Chronic teacher turnover in urban elementary schools. Education Policy Analysis Archives, 12(0), 42. https://doi.org/10.14507/epaa.v12n42.2004
Harris, A. (2002). Effective leadership in schools facing challenging contexts. School Leadership & Management, 22(1), 15–26. https://doi.org/10.1080/13632430220143024a
Hemelt, S. W., & Jacob, B. (2017). Differentiated accountability and education production: Evidence from NCLB waivers (Working Paper No. 23461). National Bureau of Economic Research. https://doi.org/10.3386/w23461
Hendren, N., & Sprung-Keyser, B. (2020). A unified welfare analysis of government policies. The Quarterly Journal of Economics, 135(3), 1209–1318. https://doi.org/10.1093/qje/qjaa006

Partnership Turnaround: Year Two Report References | October 2020
212212
REFERENCES (continued)Henry, G. T., & Harbatkin, E. (2019a). The next generation of state reforms to improve their lowest performing schools: An evaluation of North Carolina’s school transformation initiative. In EdWorkingPapers.com. Annenberg Institute at Brown University. https://edworkingpapers.com/index.php/ai19-103
Henry, G. T., & Harbatkin, E. (2019b). Turnover at the top: Estimating the effects of principal turnover on student, teacher, and school outcomes. In EdWorkingPapers.com. Annenberg Institute at Brown University. https://edworkingpapers.com/ai19-95
Henry, G. T., Pham, L. D., Kho, A., & Zimmer, R. (2020). Peeking into the black box of school turnaround: A formal test of mediators and suppressors. Educational Evaluation and Policy Analysis, 42(2), 232–256. https://doi.org/10.3102/0162373720908600
Horng, E. L. (2009). Teacher tradeoffs: Disentangling teachers’ preferences for working conditions and student demographics. American Educational Research Journal, 46(3), 690–717. https://doi.org/10.3102/0002831208329599
Hough, H., Willis, J., Grunow, A., Krausen, K., Kwon, S., Mulfinger, L. S., & Park, S. (2017). Continuous improvement in practice. Policy Analysis for California Education.
Huberman, M., Parrish, T., Hannan, S., Arellanes, M., & Shambaugh, L. (2011). Turnaround schools in California: Who are they and what strategies do they use? California Comprehensive Center at WestEd. https://eric.ed.gov/?id=ED592859
Hyman, J. (2017). Does money matter in the long run? Effects of school spending on educational attainment. American Economic Journal: Economic Policy, 9(4), 256–280. https://doi.org/10.1257/pol.20150249
Jackson, C. K., Johnson, R. C., & Persico, C. (2016). The effects of school spending on educational and economic outcomes: Evidence from school finance reforms. The Quarterly Journal of Economics, 131(1), 157–218. https://doi.org/10.1093/qje/qjv036
Jacobson, S. L., Giles, C., Ylimaki, R., & Johnson, L. (2005). Successful leadership in challenging US schools: Enabling principles, enabling schools. Journal of Educational Administration, 43(6), 607–618. https://doi.org/10.1108/09578230510625700
Johnson, R. C., & Jackson, C. K. (2019). Reducing inequality through dynamic complementarity: Evidence from Head Start and public school spending. American Economic Journal: Economic Policy, 11(4), 310–349. https://doi.org/10.1257/pol.20180510
Johnson, S. M., Kraft, M. A., & Papay, J. P. (2012). How context matters in high-need schools: The effects of teachers’ working conditions on their professional satisfaction and their students’ achievement. Teachers College Record, 114(10), 1-39.
Kingdon, J. W., & Stano, E. (1984). Agendas, alternatives, and public policies. Boston: Little, Brown.
Leithwood, K., & Jantzi, D. (1990). Transformational leadership: How principals can help reform school cultures. School Effectiveness and School Improvement, 1(4), 249–280. https://doi.org/10.1080/0924345900010402
Loeb, S., Darling-Hammond, L., & Luczak, J. (2005). How teaching conditions predict teacher turnover in California schools. Peabody Journal of Education, 80(3), 44–70.
Malen, B. & Rice, J.K. (2016). School reconstitution as a turnaround strategy: An analysis of the evidence. In W.J. Mathis & T. Trujillo (Eds.) The Neo-Liberal Education Reforms: Lessons From a Failed Agenda (pp. 99-126). Greenwich, CT: Information Age Publishing.
McDonnell, L. M. (2013). Educational accountability and policy feedback. Educational Policy, 27(2), 170–189. https://doi.org/10.1177/0895904812465119
McLaughlin, M. (1987). Learning from experience: Lessons from policy implementation. Educational Evaluation and Policy Analysis, 9(2), 171-178. Retrieved July 22, 2020, from www.jstor.org/stable/1163728
Mette, I. (2014). Turnaround reform efforts in a rural context: How community and culture impart change. The Rural Educator, 35(3).
Meyers, C. V., & Hambrick Hitt, D. (2017). School turnaround principals: What does initial research literature suggest they are doing to be successful? Journal of Education for Students Placed at Risk (JESPAR), 22(1), 38–56. https://doi.org/10.1080/10824669.2016.1242070
Michigan Department of Education (2019). Maximizing your Partnership Agreement liaison (PAL). Retrieved July 26, 2020, from https://www.michigan.gov/documents/mde/PAL_Roles_ Final_Digital_631404_7.pdf
Miller, A. (2013). Principal turnover and student achievement. Economics of Education Review, 36, 60–72. https://doi.org/10.1016/j.econedurev.2013.05.004

EPIC | Education Policy Innovation Collaborative — Michigan State University
213
EPIC | Education Policy Innovation Collaborative — Michigan State University
REFERENCES (continued)Papay, J., & Hannon, M. (2018, November 8). The effects of school turnaround strategies in Massachusetts. 2018 APPAM Fall Research Conference: Evidence for Action: Encouraging Innovation and Improvement, Washington, D.C. https://appam.confex.com/ appam/2018/webprogram/Paper26237.html
Peurach, D. J., & Neumerski, C. M. (2015). Mixing metaphors: Building infrastructure for large scale school turnaround. Journal of Educational Change, 16(4), 379–420. https://doi.org/10.1007/s10833-015-9259-z
Rice, J., Bojorquez, J. C., Diaz, M., Wendt, S. & Nakamoto, J. (2014). Evaluation of Michigan’s school improvement grant: Outcomes after three years. Retrieved from: https://www. michigan.gov/documents/mde/Final_MDE_SIG_Outcome_ After_Three_Years_483504_7.pdf
Russell, J. L., Correnti, R., Stein, M. K., Bill, V., Hannan, M., Schwartz, N., Booker, L.N., Pratt, N. R., & Matthis, C. (2020). Learning from adaptation to support instructional improvement at scale: Understanding coach adaptation in the TN Mathematics Coaching Project. American Educational Research Journal, 57(1), 148–187. https://doi.org/10.3102/0002831219854050
Schueler, B.E., Asher, C.A., Larned, K.E., Mehrotra, S., & Pollard, C. (2020, August). Improving low-performing schools: A meta-analysis of impact evaluation studies. (EdWorkingPaper: 20-274). Retrieved from Annenberg Institute at Brown University: https://doi.org/10.26300/qxjk-yq91
Schueler, B. E., Goodman, J. S., & Deming, D. J. (2017). Can states take over and turn around school districts? Evidence from Lawrence, Massachusetts. Educational Evaluation and Policy Analysis, 39(2), 311–332. https://doi.org/10.3102/0162373716685824
Strunk, K. O., Marsh, J. A., Bush-Mecenas, S. C., & Duque, M. R. (2016). The best laid plans: An examination of school plan quality and implementation in a school improvement initiative. Educational Administration Quarterly, 52(2), 259–309. https://doi.org/10.1177/0013161X15616864
Strunk, K. O., Marsh, J. A., Hashim, A. K., & Bush-Mecenas, S. (2016). Innovation and a return to the status quo: A mixed-methods study of school reconstitution. Educational Evaluation and Policy Analysis, 38(3) 549-577. https://doi.org/10.3102/0162373716642517
Strunk, K. O., Marsh, J. A., Hashim, A. K., Bush-Mecenas, S., & Weinstein, T. (2016). The impact of turnaround reform on student outcomes: Evidence and insights from the Los Angeles Unified School District. Education Finance and Policy, 11(3), 251–282. https://doi.org/10.1162/EDFP_a_00188
Sun, M., Liu, J., Zhu, J., & LeClair, Z. (2019). Using a text-as-data approach to understand reform processes: A deep exploration of school improvement strategies. Educational Evaluation and Policy Analysis, 41(4), 510–536. https://doi.org/10.3102/0162373719869318
Sun, M., Penner, E. K., & Loeb, S. (2017). Resource- and approach-driven multidimensional change: Three-year effects of school improvement grants. American Educational Research Journal, 54(4), 607–643. https://doi.org/10.3102/0002831217695790
United States Department of Justice, Federal Bureau of Investigation. (2019, September). Crime in the United States, 2018. https://ucr.fbi.gov/crime-in-the-u.s/2018/crime-in- the-u.s.-2018
VanGronigen, B. A., & Meyers, C. V. (2017). Topics and trends in short-cycle planning: Are principals leading school turnaround efforts identifying the right priorities? Planning & Changing, 48, 26-42.
Viano, S., Pham, L. D., Henry, G. T., Kho, A., & Zimmer, R. (2020). What teachers want: School factors predicting teachers’ decisions to work in low-performing schools. American Educational Research Journal. Advance online publication. https://doi.org/10.3102/0002831220930199
Zimmer, R., Henry, G. T., & Kho, A. (2017). The effects of school turnaround in Tennessee’s Achievement School District and Innovation Zones. Educational Evaluation and Policy Analysis, 39(4), 670–696. https://doi.org/10.3102/0162373717705729
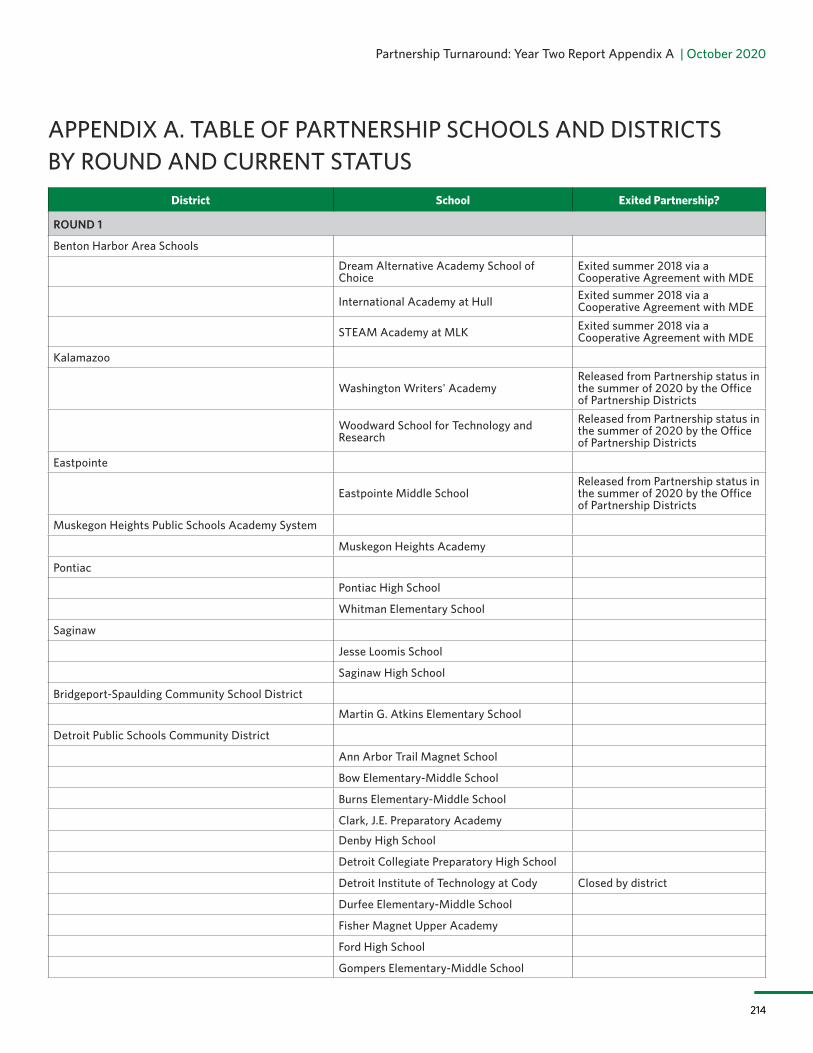
Partnership Turnaround: Year Two Report Appendix A | October 2020
214214
APPENDIX A. TABLE OF PARTNERSHIP SCHOOLS AND DISTRICTS BY ROUND AND CURRENT STATUS
District School Exited Partnership?
ROUND 1
Benton Harbor Area Schools
Dream Alternative Academy School of Choice
Exited summer 2018 via a Cooperative Agreement with MDE
International Academy at Hull Exited summer 2018 via a Cooperative Agreement with MDE
STEAM Academy at MLK Exited summer 2018 via a Cooperative Agreement with MDE
Kalamazoo
Washington Writers' AcademyReleased from Partnership status in the summer of 2020 by the Office of Partnership Districts
Woodward School for Technology and Research
Released from Partnership status in the summer of 2020 by the Office of Partnership Districts
Eastpointe
Eastpointe Middle SchoolReleased from Partnership status in the summer of 2020 by the Office of Partnership Districts
Muskegon Heights Public Schools Academy System
Muskegon Heights Academy
Pontiac
Pontiac High School
Whitman Elementary School
Saginaw
Jesse Loomis School
Saginaw High School
Bridgeport-Spaulding Community School District
Martin G. Atkins Elementary School
Detroit Public Schools Community District
Ann Arbor Trail Magnet School
Bow Elementary-Middle School
Burns Elementary-Middle School
Clark, J.E. Preparatory Academy
Denby High School
Detroit Collegiate Preparatory High School
Detroit Institute of Technology at Cody Closed by district
Durfee Elementary-Middle School
Fisher Magnet Upper Academy
Ford High School
Gompers Elementary-Middle School

EPIC | Education Policy Innovation Collaborative — Michigan State University
215
EPIC | Education Policy Innovation Collaborative — Michigan State University
District School Exited Partnership?
ROUND 1
Detroit Public Schools Community District (continued)
Henderson Academy
Law Elementary School
Marquette Elementary-Middle SchoolMary McLeod Bethune Elementary-Middle School
Mason Elementary School
Mumford High School
Osborn Academy of Mathematics
Osborn College Preparatory Academy Closed by districtOsborn Evergreen Academy of Design and Alternative Energy Closed by district
Pershing High School
Sampson Academy
Southeastern High School
Thirkell Elementary School
ROUND 2
Mildred C. Wells Preparatory Academy
Mildred C. Wells Preparatory Academy
Battle Creek Public Schools
Ann J. Kellogg School
Northwestern Middle School
Lansing
Attwood ElementaryReleased from Partnership status in the summer of 2020 by the Office of Partnership Districts
Gardner International AcademyReleased from Partnership status in the summer of 2020 by the Office of Partnership Districts
J.W. Sexton High SchoolReleased from Partnership status in the summer of 2020 by the Office of Partnership Districts
North SchoolReleased from Partnership status in the summer of 2020 by the Office of Partnership Districts
Woodcreek Achievement CenterReleased from Partnership status in the summer of 2020 by the Office of Partnership Districts
Muskegon Heights Public Schools Academy System
Dr. Martin Luther King Academy
Pontiac
Owens Elementary School
Pontiac Middle School
Saginaw
Jesse Rouse School

Partnership Turnaround: Year Two Report Appendix A | October 2020
216216
District School Exited Partnership?
ROUND 2
Detroit Public Schools Community District
Blackwell Institute
Brewer Elementary-Middle School
Carstens Elementary-Middle School
Central High School
Cody Academy of Public Leadership Closed by district
Detroit International Academy for Young Women
Dixon Elementary School
Dossin Elementary-Middle School
Earhart Elementary-Middle School
East English Village Preparatory Academy
Edward "Duke" Ellington @ Beckham
Emerson Elementary-Middle School
Greenfield Union Elementary-Middle School
King High School
King, John R. Academic and Performing Arts
Mackenzie Elementary-Middle School
Mann Elementary School
Marshall, Thurgood Elementary School
Neinas Dual Language Learning Academy
Noble Elementary-Middle School
Palmer Park Preparatory Academy
Pulaski Elementary-Middle School
Schulze Elementary-Middle School
Wayne Elementary School
Wayne-Westland Community School District
Hoover Elementary SchoolUniversity Preparatory Academy Art and Design (formerly Henry Ford Academy)
University Preparatory Art & Design – Elementary (formerly Henry Ford Academy: School for Creative Design)
American International Academy
American International Academy - Elementary
David Ellis Academy
David Ellis Academy
ROUND 3
Insight School of Michigan
Insight School of Michigan
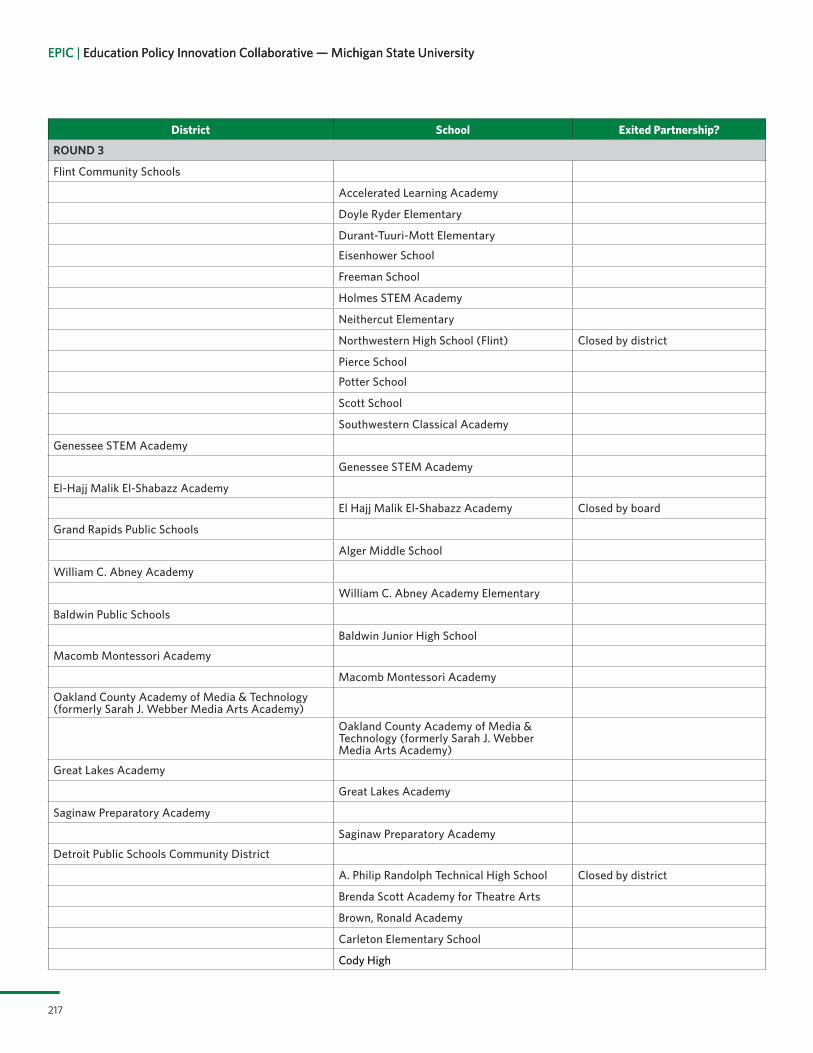
EPIC | Education Policy Innovation Collaborative — Michigan State University
217
EPIC | Education Policy Innovation Collaborative — Michigan State University
District School Exited Partnership?
ROUND 3
Flint Community Schools
Accelerated Learning Academy
Doyle Ryder Elementary
Durant-Tuuri-Mott Elementary
Eisenhower School
Freeman School
Holmes STEM Academy
Neithercut Elementary
Northwestern High School (Flint) Closed by district
Pierce School
Potter School
Scott School
Southwestern Classical Academy
Genessee STEM Academy
Genessee STEM Academy
El-Hajj Malik El-Shabazz Academy
El Hajj Malik El-Shabazz Academy Closed by board
Grand Rapids Public Schools
Alger Middle School
William C. Abney Academy
William C. Abney Academy Elementary
Baldwin Public Schools
Baldwin Junior High School
Macomb Montessori Academy
Macomb Montessori Academy
Oakland County Academy of Media & Technology (formerly Sarah J. Webber Media Arts Academy)
Oakland County Academy of Media & Technology (formerly Sarah J. Webber Media Arts Academy)
Great Lakes Academy
Great Lakes Academy
Saginaw Preparatory Academy
Saginaw Preparatory Academy
Detroit Public Schools Community District
A. Philip Randolph Technical High School Closed by district
Brenda Scott Academy for Theatre Arts
Brown, Ronald Academy
Carleton Elementary School
Cody High

Partnership Turnaround: Year Two Report Appendix A | October 2020
218218
District School Exited Partnership?
ROUND 3
Detroit Public Schools Community District (continued)
Douglass Academy for Young Men
Eastside Detroit Lions Academy
Fisher Magnet Lower Academy
Gardner Elementary School
Garvey Academy
Mark Twain Elementary-Middle School
Medicine and Community Health Academy
Nichols Elementary-Middle School
Robeson Academy, Malcolm X Academy
Ecorse Public Schools
Ecorse Community High School
Detroit Public Safety Academy
Detroit Public Safety Academy
Detroit Delta Preparatory Academy for Social Justice
Detroit Delta Preparatory Academy for Social Justice Closed by board
Detroit Leadership Academy
Detroit Leadership Academy Middle/High
GEE Edmonson Academy
GEE Edmonson Academy Closed by board
Joy Preparatory Academy
Joy Preparatory Academy
Frederick Douglass International Academy
Frederick Douglass International Academy Closed by board

EPIC | Education Policy Innovation Collaborative — Michigan State University
219
EPIC | Education Policy Innovation Collaborative — Michigan State University
APPENDIX B-1. FULL RESULTS FOR TABLES 4.1 AND 4.2, ROW A. COHORT 1 MATH 3-8 ACHIEVEMENT
Sample
All Students in Cohort 1 Partnership Schools and
2016-17 Priority Schools
All Students in Cohort 1 Partnership Schools and
2016-17 Priority Schools
All Students in Cohort 1 Partnership Schools and
2016-17 Priority Schools
All Students in Cohort 1 Partnership Schools and
2016-17 Priority Schools
All Students in DPSCD Cohort 1
Partnership Schools and
2016-17 DPSCD Priority
Schools
All Students in DPSCD Cohort 1
Partnership Schools and
2016-17 DPSCD Priority
Schools
(1) (2) (3) (4) (5) (6)
Outcome Math M-Step Levels Math M-STEP Growth/Gains
Reference Year in Event Study Model 15-16 16-17 15-16 16-17 15-16 16-17
Priority School 2013-14 -0.265*** -0.534*** -0.323*** -0.577*** -0.286*** -0.505***
(0.0343) (0.0523) (0.0548) (0.0782) (0.0856) (0.1270)
Priority School 2014-15 -0.193*** -0.462*** -0.282*** -0.536*** -0.366*** -0.585***
(0.0206) (0.0376) (0.0352) (0.0560) (0.0537) (0.0965)
Priority School 2015-16 -0.270*** -0.254*** -0.218***
(0.0229) (0.0341) (0.0561)
Priority School 2016-17 0.270*** 0.254*** 0.218***
(0.0229) (0.0341) (0.0561)
Priority School 2017-18 0.533*** 0.264*** 0.406*** 0.152*** 0.388*** 0.170**
(0.0372) (0.0223) (0.0589) (0.0377) (0.0938) (0.0611)
Priority School 2018-19 0.794*** 0.524*** 0.559*** 0.304*** 0.433*** 0.215*
(0.0514) (0.0351) (0.0819) (0.0591) (0.1250) (0.0840)
Partnership School 2013-14 0.021 0.063 0.0003 0.043 0.081 0.157*
(0.0307) (0.0407) (0.0459) (0.0470) (0.0542) (0.0624)
Partnership School 2014-15 -0.022 0.020 -0.060 -0.018 0.043 0.119+
(0.0229) (0.0381) (0.0393) (0.0441) (0.0467) (0.0616)
Partnership School 2015-16 0.042 0.042 0.076
(0.0296) (0.0388) (0.0494)
Partnership School 2016-17 -0.042 -0.042 -0.076
(0.0296) (0.0388) (0.0494)
Partnership School 2017-18 -0.021 0.021 0.048 0.091+ 0.013 0.089
(0.0310) (0.0361) (0.0502) (0.0525) (0.0688) (0.0750)
Partnership School 2018-19 -0.002 0.040 0.022 0.064 0.050 0.126*
(0.0351) (0.0420) (0.0405) (0.0435) (0.0492) (0.0570)
Economically Disadvantaged 0.008 0.008 -0.003 -0.003 0.027 0.027
(0.0084) (0.0084) (0.0133) (0.0133) (0.0244) (0.0244)
English Language Learner -0.016 -0.016 0.055 0.055 0.071 0.071
(0.0323) (0.0323) (0.0486) (0.0486) (0.0992) (0.0992)
Receives Special Education 0.050*** 0.050*** 0.071** 0.071** 0.063 0.063
(0.0132) (0.0132) (0.0239) (0.0239) (0.0457) (0.0457)

Partnership Turnaround: Year Two Report Appendix B | October 2020
220220
Sample
All Students in Cohort 1 Partnership Schools and
2016-17 Priority Schools
All Students in Cohort 1 Partnership Schools and
2016-17 Priority Schools
All Students in Cohort 1 Partnership Schools and
2016-17 Priority Schools
All Students in Cohort 1 Partnership Schools and
2016-17 Priority Schools
All Students in DPSCD Cohort 1
Partnership Schools and
2016-17 DPSCD Priority
Schools
All Students in DPSCD Cohort 1
Partnership Schools and
2016-17 DPSCD Priority
Schools
(1) (2) (3) (4) (5) (6)
Outcome Math M-Step Levels Math M-STEP Growth/Gains
Reference Year in Event Study Model 15-16 16-17 15-16 16-17 15-16 16-17
School-level: % Non-White Students 0.207 0.207 0.272+ 0.272+ 0.407 0.407
(0.1380) (0.1380) (0.1630) (0.1630) (0.2520) (0.2520)
School-level: % Black Students -0.087* -0.087* -0.121* -0.121* -0.006 -0.006
(0.0416) (0.0416) (0.0553) (0.0553) (0.0843) (0.0843)
School-level: % Hispanic Students -0.039 -0.039 -0.098 -0.098 0.151 0.151
(0.0866) (0.0866) (0.1050) (0.1050) (0.1640) (0.1640)
School-level: % Economically Disadvantaged Students
0.119 0.119 0.022 0.022 0.055 0.055
(0.0813) (0.0813) (0.0948) (0.0948) (0.1620) (0.1620)
School-level: % English Language Learner Students
0.005 0.005 0.026 0.026 -0.257 -0.257
(0.1000) (0.1000) (0.1010) (0.1010) (0.1770) (0.1770)
School-level: % Students Receiving Special Education Services
-0.532*** -0.532*** -0.453*** -0.453*** -0.627*** -0.627***
(0.0987) (0.0987) (0.1170) (0.1170) (0.1590) (0.1590)
Log of Student Enrollment -0.060*** -0.060*** -0.082*** -0.082*** -0.058** -0.058**
(0.0148) (0.0148) (0.0147) (0.0147) (0.0213) (0.0213)
4th Grade -0.327*** -0.327*** -0.889*** -0.889*** -0.863*** -0.863***
(0.0218) (0.0218) (0.0744) (0.0744) (0.1130) (0.1130)
5th Grade -0.535*** -0.535*** -0.942*** -0.942*** -0.879*** -0.879***
(0.0349) (0.0349) (0.0923) (0.0923) (0.1520) (0.1520)
6th Grade -0.791*** -0.791*** -1.150*** -1.150*** -0.973*** -0.973***
(0.0510) (0.0510) (0.1120) (0.1120) (0.1850) (0.1850)
7th Grade -0.982*** -0.982*** -1.272*** -1.272*** -1.090*** -1.090***
(0.0655) (0.0655) (0.1310) (0.1310) (0.2150) (0.2150)
8th Grade -1.170*** -1.170*** -1.428*** -1.428*** -1.186*** -1.186***
(0.0837) (0.0837) (0.1560) (0.1560) (0.2510) (0.2510)
Constant -0.054 0.205 1.616*** 1.859*** 1.316*** 1.496***
(0.1300) (0.1350) (0.1660) (0.1850) (0.2410) (0.2720)
Observations 139,818 139,818 106,611 106,611 35,471 35,471
R-squared 0.762 0.762 0.149 0.149 0.168 0.168
Adjusted R-squared 0.672 0.672 -0.216 -0.216 -0.198 -0.198
Note: Robust standard errors in parentheses. All models include student fixed effects. *** p<0.001, ** p<0.01, * p<0.05, + p<0.10

EPIC | Education Policy Innovation Collaborative — Michigan State University
221
EPIC | Education Policy Innovation Collaborative — Michigan State University
APPENDIX B-2. FULL RESULTS FOR TABLES 4.1 AND 4.2, ROW B. COHORT 1 ELA 3-8 ACHIEVEMENT
Sample
All Students in Cohort 1 Partnership Schools and
2016-17 Priority Schools
All Students in Cohort 1 Partnership Schools and
2016-17 Priority Schools
All Students in Cohort 1 Partnership Schools and
2016-17 Priority Schools
All Students in Cohort 1 Partnership Schools and
2016-17 Priority Schools
All Students in DPSCD Cohort 1
Partnership Schools and
2016-17 DPSCD Priority
Schools
All Students in DPSCD Cohort 1
Partnership Schools and
2016-17 DPSCD Priority
Schools
(1) (2) (3) (4) (5) (6)
Outcome ELA M-Step Levels ELA M-STEP Growth/Gains
Reference Year in Event Study Model 15-16 16-17 15-16 16-17 15-16 16-17
Priority School 2013-14 -0.292*** -0.546*** -0.447*** -0.716*** -0.514*** -0.788***
(0.0333) (0.0481) (0.0485) (0.0701) (0.0800) (0.1190)
Priority School 2014-15 -0.208*** -0.462*** -0.339*** -0.608*** -0.472*** -0.745***
(0.0195) (0.0342) (0.0332) (0.0508) (0.0553) (0.0897)
Priority School 2015-16 -0.255*** -0.269*** -0.274***
(0.0223) (0.0357) (0.0662)
Priority School 2016-17 0.255*** 0.269*** 0.274***
(0.0223) (0.0357) (0.0662)
Priority School 2017-18 0.516*** 0.261*** 0.491*** 0.222*** 0.516*** 0.242***
(0.0335) (0.0197) (0.0517) (0.0343) (0.0902) (0.0729)
Priority School 2018-19 0.768*** 0.513*** 0.689*** 0.420*** 0.661*** 0.388***
(0.0456) (0.0297) (0.0735) (0.0527) (0.1180) (0.0935)
Partnership School 2013-14 0.042 0.089* -0.043 0.015 0.022 0.126+
(0.0317) (0.0427) (0.0382) (0.0414) (0.0538) (0.0688)
Partnership School 2014-15 -0.022 0.025 -0.095* -0.037 -0.002 0.101+
(0.0241) (0.0357) (0.0463) (0.0380) (0.0537) (0.0585)
Partnership School 2015-16 0.047 0.058 0.103
(0.0296) (0.0457) (0.0706)
Partnership School 2016-17 -0.047 -0.058 -0.103
(0.0296) (0.0457) (0.0706)
Partnership School 2017-18 0.004 0.051* 0.037 0.095* 0.029 0.133+
(0.0273) (0.0261) (0.0370) (0.0397) (0.0591) (0.0738)
Partnership School 2018-19 0.023 0.070* 0.015 0.073+ 0.033 0.137+
(0.0288) (0.0304) (0.0347) (0.0403) (0.0473) (0.0730)
Economically Disadvantaged 0.012 0.012 -0.015 -0.015 -0.027 -0.027
(0.0087) (0.0087) (0.0138) (0.0138) (0.0307) (0.0307)
English Language Learner 0.017 0.017 0.114* 0.114* 0.115 0.115
(0.0386) (0.0386) (0.0529) (0.0529) (0.0774) (0.0774)
Receives Special Education 0.034** 0.034** 0.072** 0.072** 0.058 0.058
(0.0132) (0.0132) (0.0219) (0.0219) (0.0412) (0.0412)

Partnership Turnaround: Year Two Report Appendix B | October 2020
222222
Sample
All Students in Cohort 1 Partnership Schools and
2016-17 Priority Schools
All Students in Cohort 1 Partnership Schools and
2016-17 Priority Schools
All Students in Cohort 1 Partnership Schools and
2016-17 Priority Schools
All Students in Cohort 1 Partnership Schools and
2016-17 Priority Schools
All Students in DPSCD Cohort 1
Partnership Schools and
2016-17 DPSCD Priority
Schools
All Students in DPSCD Cohort 1
Partnership Schools and
2016-17 DPSCD Priority
Schools
(1) (2) (3) (4) (5) (6)
Outcome ELA M-Step Levels ELA M-STEP Growth/Gains
Reference Year in Event Study Model 15-16 16-17 15-16 16-17 15-16 16-17
School-level: % Non-White Students 0.209 0.209 0.298+ 0.298+ 0.582* 0.582*
(0.1430) (0.1430) (0.1590) (0.1590) (0.2900) (0.2900)
School-level: % Black Students -0.078+ -0.078+ -0.075 -0.075 -0.173* -0.173*
(0.0417) (0.0417) (0.0595) (0.0595) (0.0796) (0.0796)
School-level: % Hispanic Students -0.042 -0.042 -0.155 -0.155 -0.108 -0.108
(0.0812) (0.0812) (0.0976) (0.0976) (0.1640) (0.1640)
School-level: % Economically Disadvantaged Students
0.160* 0.160* 0.078 0.078 0.326* 0.326*
(0.0788) (0.0788) (0.1020) (0.1020) (0.1330) (0.1330)
School-level: % English Language Learner Students
0.0131 0.0131 0.180+ 0.180+ -0.115 -0.115
(0.0843) (0.0843) (0.0959) (0.0959) (0.1590) (0.1590)
School-level: % Students Receiving Special Education Services
-0.464*** -0.464*** -0.435*** -0.435*** -0.428* -0.428*
(0.0917) (0.0917) (0.1120) (0.1120) (0.1820) (0.1820)
Log of Student Enrollment -0.065*** -0.065*** -0.078*** -0.078*** -0.071** -0.071**
(0.0117) (0.0117) (0.0139) (0.0139) (0.0230) (0.0230)
4th Grade -0.270*** -0.270*** -0.651*** -0.651*** -0.640*** -0.640***
(0.0206) (0.0206) (0.0657) (0.0657) (0.1060) (0.1060)
5th Grade -0.499*** -0.499*** -0.827*** -0.827*** -0.818*** -0.818***
(0.0316) (0.0316) (0.0793) (0.0793) (0.1290) (0.1290)
6th Grade -0.688*** -0.688*** -1.005*** -1.005*** -0.943*** -0.943***
(0.0461) (0.0461) (0.0982) (0.0982) (0.1560) (0.1560)
7th Grade -0.917*** -0.917*** -1.269*** -1.269*** -1.242*** -1.242***
(0.0623) (0.0623) (0.1190) (0.1190) (0.1930) (0.1930)
8th Grade -1.086*** -1.086*** -1.426*** -1.426*** -1.406*** -1.406***
(0.0788) (0.0788) (0.1410) (0.1410) (0.2260) (0.2260)
Constant -0.056 0.187+ 1.405*** 1.658*** 1.356*** 1.576***
(0.1030) (0.1060) (0.1390) (0.1460) (0.2550) (0.2580)
Observations 139,944 139,944 107,058 107,058 35,784 35,784
R-squared 0.775 0.775 0.151 0.151 0.172 0.172
Adjusted R-squared 0.689 0.689 -0.211 -0.211 -0.190 -0.190
Note: Robust standard errors in parentheses. All models include student fixed effects. *** p<0.001, ** p<0.01, * p<0.05, + p<0.10
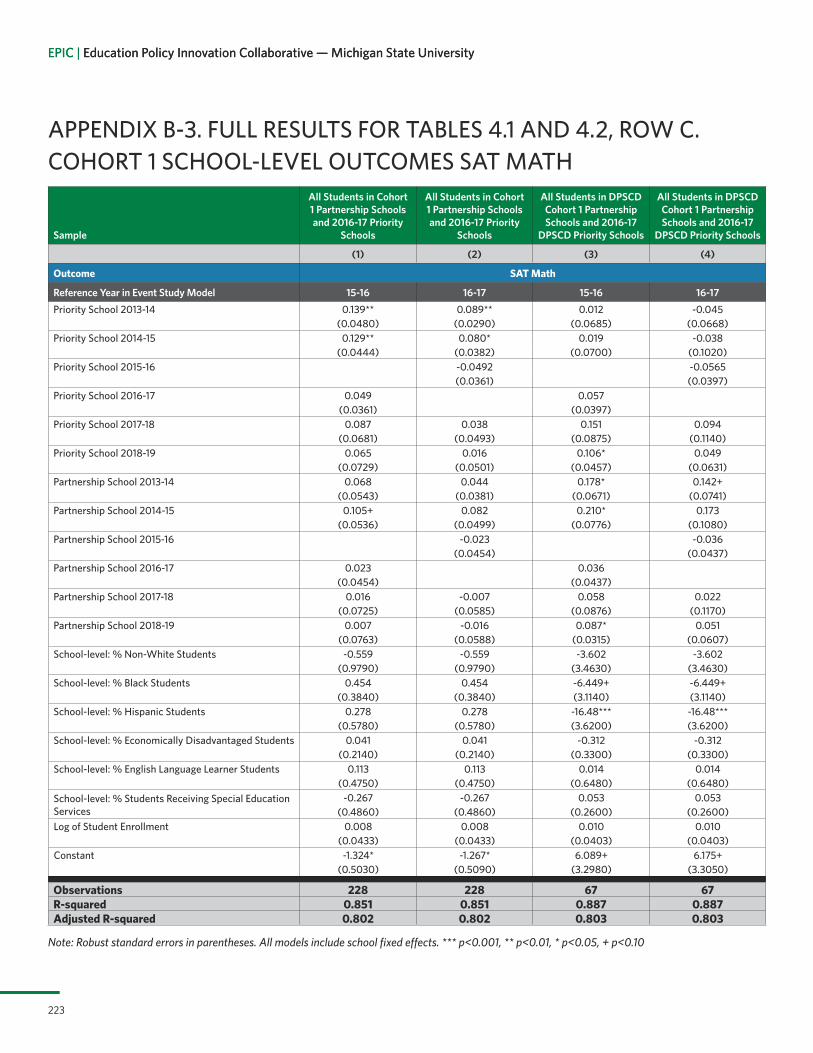
EPIC | Education Policy Innovation Collaborative — Michigan State University
223
EPIC | Education Policy Innovation Collaborative — Michigan State University
APPENDIX B-3. FULL RESULTS FOR TABLES 4.1 AND 4.2, ROW C. COHORT 1 SCHOOL-LEVEL OUTCOMES SAT MATH
Sample
All Students in Cohort 1 Partnership Schools and 2016-17 Priority
Schools
All Students in Cohort 1 Partnership Schools and 2016-17 Priority
Schools
All Students in DPSCD Cohort 1 Partnership Schools and 2016-17
DPSCD Priority Schools
All Students in DPSCD Cohort 1 Partnership Schools and 2016-17
DPSCD Priority Schools
(1) (2) (3) (4)
Outcome SAT Math
Reference Year in Event Study Model 15-16 16-17 15-16 16-17Priority School 2013-14 0.139** 0.089** 0.012 -0.045
(0.0480) (0.0290) (0.0685) (0.0668)Priority School 2014-15 0.129** 0.080* 0.019 -0.038
(0.0444) (0.0382) (0.0700) (0.1020)Priority School 2015-16 -0.0492 -0.0565
(0.0361) (0.0397)Priority School 2016-17 0.049 0.057
(0.0361) (0.0397)Priority School 2017-18 0.087 0.038 0.151 0.094
(0.0681) (0.0493) (0.0875) (0.1140)Priority School 2018-19 0.065 0.016 0.106* 0.049
(0.0729) (0.0501) (0.0457) (0.0631)Partnership School 2013-14 0.068 0.044 0.178* 0.142+
(0.0543) (0.0381) (0.0671) (0.0741)Partnership School 2014-15 0.105+ 0.082 0.210* 0.173
(0.0536) (0.0499) (0.0776) (0.1080)Partnership School 2015-16 -0.023 -0.036
(0.0454) (0.0437)Partnership School 2016-17 0.023 0.036
(0.0454) (0.0437) Partnership School 2017-18 0.016 -0.007 0.058 0.022
(0.0725) (0.0585) (0.0876) (0.1170)Partnership School 2018-19 0.007 -0.016 0.087* 0.051
(0.0763) (0.0588) (0.0315) (0.0607)School-level: % Non-White Students -0.559 -0.559 -3.602 -3.602
(0.9790) (0.9790) (3.4630) (3.4630)School-level: % Black Students 0.454 0.454 -6.449+ -6.449+
(0.3840) (0.3840) (3.1140) (3.1140)School-level: % Hispanic Students 0.278 0.278 -16.48*** -16.48***
(0.5780) (0.5780) (3.6200) (3.6200)School-level: % Economically Disadvantaged Students 0.041 0.041 -0.312 -0.312
(0.2140) (0.2140) (0.3300) (0.3300)School-level: % English Language Learner Students 0.113 0.113 0.014 0.014
(0.4750) (0.4750) (0.6480) (0.6480)School-level: % Students Receiving Special Education Services
-0.267 -0.267 0.053 0.053(0.4860) (0.4860) (0.2600) (0.2600)
Log of Student Enrollment 0.008 0.008 0.010 0.010(0.0433) (0.0433) (0.0403) (0.0403)
Constant -1.324* -1.267* 6.089+ 6.175+(0.5030) (0.5090) (3.2980) (3.3050)
Observations 228 228 67 67R-squared 0.851 0.851 0.887 0.887Adjusted R-squared 0.802 0.802 0.803 0.803
Note: Robust standard errors in parentheses. All models include school fixed effects. *** p<0.001, ** p<0.01, * p<0.05, + p<0.10

Partnership Turnaround: Year Two Report Appendix B | October 2020
224224
APPENDIX B-4. FULL RESULTS FOR TABLES 4.1 AND 4.2, ROW D. COHORT 1 SCHOOL-LEVEL OUTCOMES SAT EVIDENCE-BASED READING AND WRITING
Sample
All Students in Cohort 1 Partnership Schools and 2016-17 Priority
Schools
All Students in Cohort 1 Partnership Schools and 2016-17 Priority
Schools
All Students in DPSCD Cohort 1 Partnership Schools and 2016-17
DPSCD Priority Schools
All Students in DPSCD Cohort 1 Partnership Schools and 2016-17
DPSCD Priority Schools
(1) (2) (3) (4)
Outcome SAT Evidence-Based Reading and Writing
Reference Year in Event Study Model 15-16 16-17 15-16 16-17Priority School 2013-14 -0.001 -0.032 0.035 -0.148*
(0.0436) (0.0263) (0.0712) (0.0524)Priority School 2014-15 0.024 -0.007 -0.113+ -0.296***
(0.0509) (0.0286) (0.0600) (0.0424)Priority School 2015-16 -0.031 -0.183***
(0.0438) (0.0402)Priority School 2016-17 0.031 0.183***
(0.0438) (0.0402)Priority School 2017-18 0.036 0.005 0.209+ 0.025
(0.0490) (0.0453) (0.1150) (0.0855)Priority School 2018-19 0.001 -0.030 0.192* 0.009
(0.0549) (0.0332) (0.0795) (0.0496)Partnership School 2013-14 0.036 0.006 0.016 0.088
(0.0536) (0.0391) (0.0704) (0.0566)Partnership School 2014-15 0.028 -0.002 0.190* 0.262**
(0.0634) (0.0421) (0.0769) (0.0598)Partnership School 2015-16 -0.030 0.072
(0.0553) (0.0425)Partnership School 2016-17 0.030 -0.072
(0.0553) (0.0425) Partnership School 2017-18 0.075 0.045 -0.004 0.068
(0.0574) (0.0494) (0.1080) (0.0833)Partnership School 2018-19 0.119 0.089+ 0.071 0.143*
(0.0711) (0.0460) (0.0638) (0.0461)School-level: % Non-White Students 0.330 0.330 0.796 0.796
(1.2200) (1.2200) (5.4750) (5.4750)School-level: % Black Students 0.231 0.231 -2.266 -2.266
(0.5650) (0.5650) (4.6850) (4.6850)School-level: % Hispanic Students 0.028 0.028 -9.905+ -9.905+
(0.8280) (0.8280) (5.0620) (5.0620)School-level: % Economically Disadvantaged Students -0.013 -0.013 -0.358 -0.358
(0.2140) (0.2140) (0.4630) (0.4630)School-level: % English Language Learner Students 0.331 0.331 0.736 0.736
(0.5500) (0.5500) (0.4330) (0.4330)School-level: % Students Receiving Special Education Services
-0.037 -0.037 -0.115 -0.115(0.4010) (0.4010) (0.2940) (0.2940)
Log of Student Enrollment 0.017 0.017 -0.065+ -0.065+(0.0335) (0.0335) (0.0312) (0.0312)
Constant -1.230* -1.189* 2.252 2.376-0.538 -0.541 -4.94 -4.947
Observations 228 228 67 67R-squared 0.892 0.892 0.888 0.888Adjusted R-squared 0.857 0.857 0.805 0.805
Note: Robust standard errors in parentheses. All models include school fixed effects. *** p<0.001, ** p<0.01, * p<0.05, + p<0.10

EPIC | Education Policy Innovation Collaborative — Michigan State University
225
EPIC | Education Policy Innovation Collaborative — Michigan State University
APPENDIX B-5. FULL RESULTS FOR TABLES 4.1 AND 4.2, ROW G. COHORT 1 GRADE RETENTION
Sample
All Students in Cohort 1 Partnership Schools and 2016-17 Priority
Schools
All Students in Cohort 1 Partnership Schools and 2016-17 Priority
Schools
All Students in DPSCD Cohort 1 Partnership Schools and 2016-17
DPSCD Priority Schools
All Students in DPSCD Cohort 1 Partnership Schools and 2016-17
DPSCD Priority Schools
(1) (2) (3) (4)
Outcome Probability of Being Retained in Grade
Reference Year in Event Study Model 15-16 16-17 15-16 16-17
Priority School 2013-14 -0.555*** -0.822*** -0.628*** -0.933*** (0.0551) (0.0845) (0.0267) (0.0395)
Priority School 2014-15 -0.276*** -0.543*** -0.316*** -0.621*** (0.0281) (0.0575) (0.0150) (0.0275)
Priority School 2015-16 -0.267*** -0.305***(0.0296) (0.0140)
Priority School 2016-17 0.267*** 0.305***(0.0296) (0.0140)
Priority School 2017-18 0.554*** 0.287*** 0.623*** 0.319***(0.0610) (0.0318) (0.0268) (0.0137)
Priority School 2018-19 0.824*** 0.556*** 0.924*** 0.619***(0.0856) (0.0561) (0.0401) (0.0269)
Partnership School 2013-14 0.002 0.001 0.012* 0.01+(0.0038) (0.0042) (0.0056) (0.0056)
Partnership School 2014-15 -0.002 -0.004 0.009+ 0.006(0.0031) (0.0041) (0.0051) (0.0045)
Partnership School 2015-16 -0.002 -0.002(0.0042) (0.0063)
Partnership School 2016-17 0.002 0.002(0.0042) (0.0063)
Partnership School 2017-18 -0.004 -0.006 -0.007 -0.01* (0.0064) (0.0061) (0.0063) (0.0049)
Partnership School 2018-19 0.007 0.005 0.006 0.004 (0.0048) (0.0045) (0.0072) (0.0061)
Economically Disadvantaged 0.001 0.001 0.004+ 0.004+ (0.0033) (0.0033) (0.0026) (0.0026)
English Language Learner -0.01 -0.01 -0.022** -0.022** (0.0071) (0.0071) (0.0086) (0.0086)
Receives Special Education 0.004 0.004 0.007 0.007 (0.0036) (0.0036) (0.0054) (0.0054)
School-level: % Non-White Students -0.026 -0.026 -0.044 -0.044 (0.0202) (0.0202) (0.0309) (0.0309)
School-level: % Black Students -0.040*** -0.040*** -0.033* -0.033* (0.0084) (0.0084) (0.0144) (0.0144)
School-level: % Hispanic Students -0.048*** -0.048*** -0.054** -0.054** (0.0139) (0.0139) (0.0193) (0.0193)
School-level: % Economically Disadvantaged Students 0.05*** 0.05*** 0.032+ 0.032+ (0.0136) (0.0136) (0.0185) (0.0185)
School-level: % English Language Learner Students 0.012 0.012 0.038 0.038 (0.0175) (0.0175) (0.0244) (0.0244)
School-level: % Students Receiving Special Education Services
0.048** 0.048** 0.003 0.003 (0.0187) (0.0187) (0.0231) (0.0231)

Partnership Turnaround: Year Two Report Appendix B | October 2020
226226
Sample
All Students in Cohort 1 Partnership Schools and 2016-17 Priority
Schools
All Students in Cohort 1 Partnership Schools and 2016-17 Priority
Schools
All Students in DPSCD Cohort 1 Partnership Schools and 2016-17
DPSCD Priority Schools
All Students in DPSCD Cohort 1 Partnership Schools and 2016-17
DPSCD Priority Schools
(1) (2) (3) (4)
Outcome Probability of Being Retained in Grade
Reference Year in Event Study Model 15-16 16-17 15-16 16-17
Log of Student Enrollment -0.001 -0.001 -0.007* -0.007* (0.0049) (0.0049) (0.0030) (0.0030)
1st Grade -0.305*** -0.305*** -0.291*** -0.291*** (0.0308) (0.0308) (0.0145) (0.0145)
2nd Grade -0.606*** -0.606*** -0.639*** -0.639*** (0.0598) (0.0598) (0.0282) (0.0282)
3rd Grade -0.900*** -0.900*** -0.978*** -0.978*** (0.0885) (0.0885) (0.0424) (0.0424)
4th Grade -1.186*** -1.186*** -1.304*** -1.304*** (0.1170) (0.1170) (0.0555) (0.0555)
5th Grade -1.467*** -1.467*** -1.621*** -1.621*** (0.1460) (0.1460) (0.0694) (0.0694)
6th Grade -1.744*** -1.744*** -1.929*** -1.929*** (0.1740) (0.1740) (0.0831) (0.0831)
7th Grade -2.018*** -2.018*** -2.236*** -2.236***-0.203 -0.203 (0.0978) (0.0978)
8th Grade -2.298*** -2.298*** -2.543*** -2.543*** (0.2310) (0.2310) (0.1130) (0.1130)
9th Grade -2.536*** -2.536*** -2.825*** -2.825*** (0.2630) (0.2630) (0.1340) (0.1340)
10th Grade -2.830*** -2.830*** -3.142*** -3.142*** (0.2920) (0.2920) (0.1440) (0.1440)
11th Grade -3.126*** -3.126*** -3.468*** -3.468*** (0.3230) (0.3230) (0.1570) (0.1570)
12th Grade -3.367*** -3.367*** -3.759*** -3.759*** (0.3520) (0.3520) (0.1690) (0.1690)
Constant 1.547*** 1.814*** 1.889*** 2.195*** (0.1370) (0.1660) (0.0807) (0.0939)
Observations 329,106 329,106 112,799 112,799
R-squared 0.435 0.435 0.426 0.426
Adjusted R-squared 0.295 0.295 0.285 0.285
Note: Robust standard errors in parentheses. All models include student fixed effects. *** p<0.001, ** p<0.01, * p<0.05, + p<0.10

EPIC | Education Policy Innovation Collaborative — Michigan State University
227
EPIC | Education Policy Innovation Collaborative — Michigan State University
APPENDIX B-6. FULL RESULTS FOR TABLES 4.1 AND 4.2, ROW E. COHORT 1 SCHOOL-LEVEL OUTCOMES PERCENT GRADUATING HIGH SCHOOL ON TRACK
Sample
All Students in Cohort 1 Partnership Schools and 2016-17 Priority
Schools
All Students in Cohort 1 Partnership Schools and 2016-17 Priority
Schools
All Students in DPSCD Cohort 1 Partnership Schools and 2016-17
DPSCD Priority Schools
All Students in DPSCD Cohort 1 Partnership Schools and 2016-17
DPSCD Priority Schools
(1) (2) (3) (4)
Outcome Percent Graduating High School On-Track
Reference Year in Event Study Model 15-16 16-17 15-16 16-17Priority School 2013-14 0.013 -0.010 -0.008 -0.117
(0.0507) (0.0334) (0.0667) (0.0906)Priority School 2014-15 0.002 -0.021 -0.061 -0.169
(0.0311) (0.0207) (0.0793) (0.1030)Priority School 2015-16 -0.023 -0.108*
(0.0268) (0.0383)Priority School 2016-17 0.023 0.108*
(0.0268) (0.0383)Priority School 2017-18 0.008 -0.015 0.072 -0.036
(0.0448) (0.0309) (0.0722) (0.0646)Priority School 2018-19 0.009 -0.015 0.007 -0.101*
(0.0394) (0.0221) (0.0596) (0.0382)Partnership School 2013-14 -0.000 0.014 0.040 0.113
(0.0567) (0.0397) (0.0810) (0.0836)Partnership School 2014-15 0.042 0.057 0.097 0.170
(0.0434) (0.0430) (0.0888) (0.1010)Partnership School 2015-16 0.014 0.073
(0.0374) (0.0433)Partnership School 2016-17 -0.014 -0.073
(0.0374) (0.0433)Partnership School 2017-18 0.032 0.046 0.054 0.127
(0.0580) (0.0385) (0.0876) (0.0828)Partnership School 2018-19 0.042 0.057 0.156* 0.229***
(0.0607) (0.0411) (0.0533) (0.0371)School-level: % Non-White Students 1.091+ 1.091+ 0.258 0.258
(0.5630) (0.5630) (2.4730) (2.4730)School-level: % Black Students -0.022 -0.022 2.875 2.875
(0.3180) (0.3180) (2.7400) (2.7400)School-level: % Hispanic Students 0.351 0.351 -0.334 -0.334
(0.3480) (0.3480) (5.2920) (5.2920)School-level: % Economically Disadvantaged Students 0.059 0.059 -0.542 -0.542
(0.2780) (0.2780) (0.3410) (0.3410)School-level: % English Language Learner Students 0.137 0.137 1.813* 1.813*
(0.1480) (0.1480) (0.7760) (0.7760)School-level: % Students Receiving Special Education Services
-0.963** -0.963** -1.692*** -1.692***(0.2910) (0.2910) (0.3440) (0.3440)
Log of Student Enrollment -0.011 -0.011 -0.062 -0.062(0.0482) (0.0482) (0.1160) (0.1160)
Constant 0.679 0.697 -0.877 -0.827(0.5350) (0.5390) (3.0140) (3.0300)
Observations 234 234 69 69R-squared 0.880 0.880 0.893 0.893Adjusted R-squared 0.839 0.839 0.813 0.813
Note: Robust standard errors in parentheses. All models include school fixed effects. *** p<0.001, ** p<0.01, * p<0.05, + p<0.10

Partnership Turnaround: Year Two Report Appendix B | October 2020
228228
APPENDIX B-7. FULL RESULTS FOR TABLES 4.1 AND 4.2, ROW F. COHORT 1 SCHOOL-LEVEL OUTCOMES HIGH SCHOOL DROP-OUT RATE
Sample
All Students in Cohort 1 Partnership Schools and 2016-17 Priority
Schools
All Students in Cohort 1 Partnership Schools and 2016-17 Priority
Schools
All Students in DPSCD Cohort 1 Partnership Schools and 2016-17
DPSCD Priority Schools
All Students in DPSCD Cohort 1 Partnership Schools and 2016-17
DPSCD Priority Schools
(1) (2) (3) (4)
Outcome High School Drop-Out Rate
Reference Year in Event Study Model 15-16 16-17 15-16 16-17Priority School 2013-14 -0.036 -0.032 0.184** 0.145*
(0.0328) (0.0488) (0.0514) (0.0603)Priority School 2014-15 -0.013 -0.009 0.158* 0.118**
(0.0175) (0.0267) (0.0710) (0.0381)Priority School 2015-16 -0.004 0.039
(0.0244) (0.0376)Priority School 2016-17 0.004 -0.039
(0.0244) (0.0376)Priority School 2017-18 0.008 0.012 0.098+ 0.059
(0.0299) (0.0394) (0.0467) (0.0361)Priority School 2018-19 0.000 0.004 0.049 0.010
(0.0230) (0.0356) (0.0477) (0.0667)Partnership School 2013-14 0.051 0.037 -0.143* -0.138+
(0.0392) (0.0509) (0.0503) (0.0635)Partnership School 2014-15 0.001 -0.012 -0.133+ -0.127*
(0.0295) (0.0303) (0.0708) (0.0420)Partnership School 2015-16 0.014 -0.006
(0.0295) (0.0349)Partnership School 2016-17 -0.014 0.006
(0.0295) (0.0349)Partnership School 2017-18 -0.017 -0.030 -0.167** -0.161**
(0.0360) (0.0500) (0.0535) (0.0407)Partnership School 2018-19 -0.010 -0.023 -0.126* -0.120+
(0.0338) (0.0461) (0.0482) (0.0590)School-level: % Non-White Students -0.484 -0.484 2.754 2.754
(0.4570) (0.4570) (2.2170) (2.2170)School-level: % Black Students -0.244 -0.244 0.610 0.610
(0.3550) (0.3550) (2.2800) (2.2800)School-level: % Hispanic Students -0.244 -0.244 6.468+ 6.468+
(0.3600) (0.3600) (3.0720) (3.0720)School-level: % Economically Disadvantaged Students -0.058 -0.058 0.416+ 0.416+
(0.2470) (0.2470) (0.2300) (0.2300)School-level: % English Language Learner Students -0.288+ -0.288+ -1.389** -1.389**
(0.1590) (0.1590) (0.3970) (0.3970)School-level: % Students Receiving Special Education Services
0.214 0.214 0.823*** 0.823***(0.1980) (0.1980) (0.1480) (0.1480)
Log of Student Enrollment 0.008 0.008 -0.033 -0.033(0.0358) (0.0358) (0.0400) (0.0400)
Constant 0.392 0.392 -1.192 -1.157(0.4110) (0.4060) (2.3950) (2.3930)
Observations 234 234 69 69R-squared 0.760 0.760 0.928 0.928Adjusted R-squared 0.678 0.678 0.875 0.875
Note: Robust standard errors in parentheses. All models include school fixed effects. *** p<0.001, ** p<0.01, * p<0.05, + p<0.10

EPIC | Education Policy Innovation Collaborative — Michigan State University
229
EPIC | Education Policy Innovation Collaborative — Michigan State University
APPENDIX B-8. FULL RESULTS FOR TABLES 4.3, ROW A. COHORT 2 MATH 3-8 ACHIEVEMENT
Sample
All Students in Cohort 2
Partnership and Comparison
Schools
All Students in Cohort 2
Partnership and Comparison
Schools
All Students in Cohort 2
Partnership and Comparison
Schools
All Students in Cohort 2
Partnership and Comparison
Schools
All Students in DPSCD Cohort 2 Partnership Schools and
DPSCD Cohort 2 Comparison
Schools
All Students in DPSCD Cohort 2 Partnership Schools and
DPSCD Cohort 2 Comparison
Schools
(1) (2) (3) (4) (5) (6)
Outcome Math M-Step Levels Math M-STEP Growth/Gains
Reference Year in Event Study Model 16-17 17-18 16-17 17-18 16-17 17-18
Comparison School 2013-14 -0.534*** -0.756*** -0.507*** -0.679*** -0.515*** -0.627***
(0.0423) (0.0547) (0.0573) (0.0751) (0.1010) (0.1300)
Comparison School 2014-15 -0.406*** -0.628*** -0.405*** -0.576*** -0.591*** -0.703***
(0.0305) (0.0430) (0.0434) (0.0602) (0.0869) (0.1140)
Comparison School 2015-16 -0.215*** -0.437*** -0.192*** -0.364*** -0.234*** -0.346***
(0.0171) (0.0298) (0.0266) (0.0424) (0.0435) (0.0664)
Comparison School 2016-17 -0.222*** -0.171*** -0.112*
(0.0187) (0.0267) (0.0448)
Comparison School 2017-18 0.222*** 0.171*** 0.112*
(0.0187) (0.0267) (0.0448)
Comparison School 2018-19 0.470*** 0.248*** 0.356*** 0.185*** 0.310*** 0.198***
(0.0305) (0.0183) (0.0404) (0.0299) (0.0724) (0.0556)
Partnership School 2013-14 0.038+ 0.062+ 0.001 0.038 0.001 0.023
(0.0219) (0.0322) (0.0291) (0.0381) (0.0548) (0.0681)
Partnership School 2014-15 -0.021 0.003 -0.097** -0.061 0.038 0.060
(0.0218) (0.0333) (0.0311) (0.0393) (0.0572) (0.0726)
Partnership School 2015-16 -0.014 0.010 -0.026 0.010 0.027 0.045
(0.0170) (0.0284) (0.0284) (0.0359) (0.0400) (0.0483)
Partnership School 2016-17 0.024 0.036 0.022
(0.0265) (0.0374) (0.0509)
Partnership School 2017-18 -0.024 -0.036 -0.022
(0.0265) (0.0374) (0.0509)
Partnership School 2018-19 0.013 0.037+ 0.011 0.048 0.035 0.057
(0.0309) (0.0190) (0.0286) (0.0364) (0.0564) (0.0606)
Economically Disadvantaged 0.015* 0.015* 0.005 0.005 -0.001 -0.001
(0.0074) (0.0074) (0.0100) (0.0100) (0.0211) (0.0211)
English Language Learner -0.007 -0.007 0.052 0.052 0.083 0.083
(0.0223) (0.0223) (0.0353) (0.0353) (0.0575) (0.0575)
Receives Special Education 0.045*** 0.045*** 0.071*** 0.071*** 0.035 0.035
(0.0104) (0.0104) (0.0177) (0.0177) (0.0358) (0.0358)
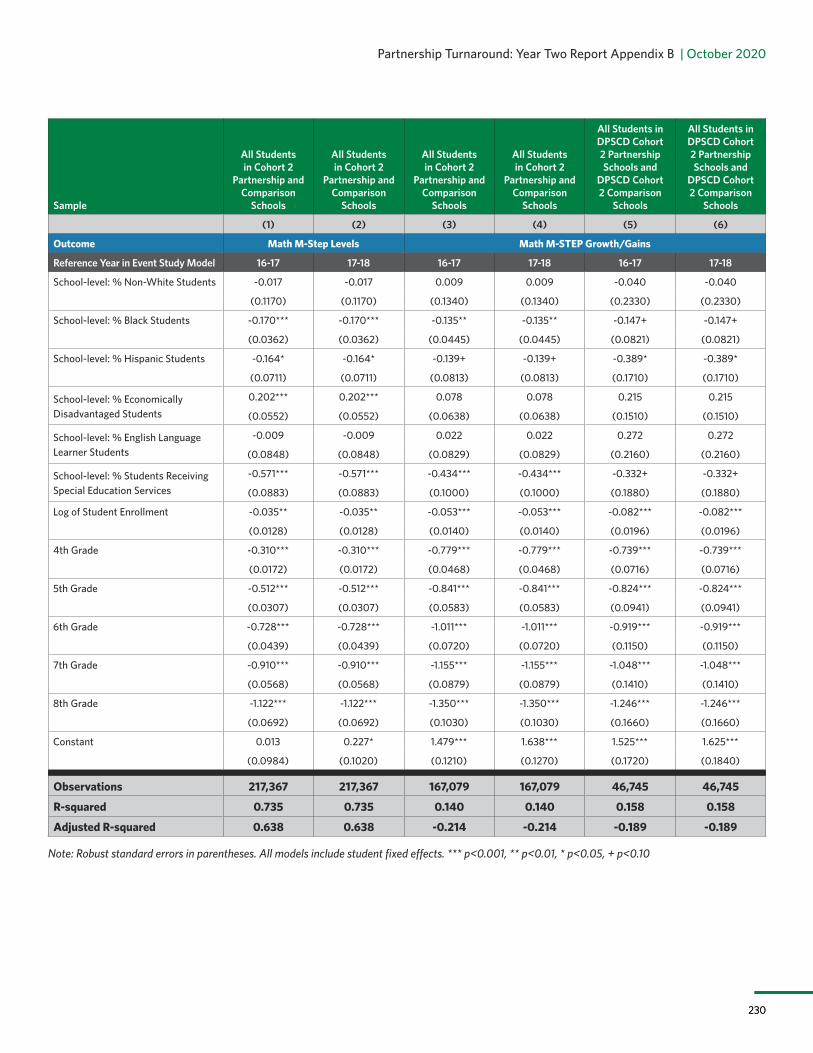
Partnership Turnaround: Year Two Report Appendix B | October 2020
230230
Sample
All Students in Cohort 2
Partnership and Comparison
Schools
All Students in Cohort 2
Partnership and Comparison
Schools
All Students in Cohort 2
Partnership and Comparison
Schools
All Students in Cohort 2
Partnership and Comparison
Schools
All Students in DPSCD Cohort 2 Partnership Schools and
DPSCD Cohort 2 Comparison
Schools
All Students in DPSCD Cohort 2 Partnership Schools and
DPSCD Cohort 2 Comparison
Schools
(1) (2) (3) (4) (5) (6)
Outcome Math M-Step Levels Math M-STEP Growth/Gains
Reference Year in Event Study Model 16-17 17-18 16-17 17-18 16-17 17-18
School-level: % Non-White Students -0.017 -0.017 0.009 0.009 -0.040 -0.040
(0.1170) (0.1170) (0.1340) (0.1340) (0.2330) (0.2330)
School-level: % Black Students -0.170*** -0.170*** -0.135** -0.135** -0.147+ -0.147+
(0.0362) (0.0362) (0.0445) (0.0445) (0.0821) (0.0821)
School-level: % Hispanic Students -0.164* -0.164* -0.139+ -0.139+ -0.389* -0.389*
(0.0711) (0.0711) (0.0813) (0.0813) (0.1710) (0.1710)
School-level: % Economically Disadvantaged Students
0.202*** 0.202*** 0.078 0.078 0.215 0.215
(0.0552) (0.0552) (0.0638) (0.0638) (0.1510) (0.1510)
School-level: % English Language Learner Students
-0.009 -0.009 0.022 0.022 0.272 0.272
(0.0848) (0.0848) (0.0829) (0.0829) (0.2160) (0.2160)
School-level: % Students Receiving Special Education Services
-0.571*** -0.571*** -0.434*** -0.434*** -0.332+ -0.332+
(0.0883) (0.0883) (0.1000) (0.1000) (0.1880) (0.1880)
Log of Student Enrollment -0.035** -0.035** -0.053*** -0.053*** -0.082*** -0.082***
(0.0128) (0.0128) (0.0140) (0.0140) (0.0196) (0.0196)
4th Grade -0.310*** -0.310*** -0.779*** -0.779*** -0.739*** -0.739***
(0.0172) (0.0172) (0.0468) (0.0468) (0.0716) (0.0716)
5th Grade -0.512*** -0.512*** -0.841*** -0.841*** -0.824*** -0.824***
(0.0307) (0.0307) (0.0583) (0.0583) (0.0941) (0.0941)
6th Grade -0.728*** -0.728*** -1.011*** -1.011*** -0.919*** -0.919***
(0.0439) (0.0439) (0.0720) (0.0720) (0.1150) (0.1150)
7th Grade -0.910*** -0.910*** -1.155*** -1.155*** -1.048*** -1.048***
(0.0568) (0.0568) (0.0879) (0.0879) (0.1410) (0.1410)
8th Grade -1.122*** -1.122*** -1.350*** -1.350*** -1.246*** -1.246***
(0.0692) (0.0692) (0.1030) (0.1030) (0.1660) (0.1660)
Constant 0.013 0.227* 1.479*** 1.638*** 1.525*** 1.625***
(0.0984) (0.1020) (0.1210) (0.1270) (0.1720) (0.1840)
Observations 217,367 217,367 167,079 167,079 46,745 46,745
R-squared 0.735 0.735 0.140 0.140 0.158 0.158
Adjusted R-squared 0.638 0.638 -0.214 -0.214 -0.189 -0.189
Note: Robust standard errors in parentheses. All models include student fixed effects. *** p<0.001, ** p<0.01, * p<0.05, + p<0.10

EPIC | Education Policy Innovation Collaborative — Michigan State University
231
EPIC | Education Policy Innovation Collaborative — Michigan State University
APPENDIX B-9. FULL RESULTS FOR TABLES 4.3, ROW B. COHORT 2 ELA 3-8 ACHIEVEMENT
Sample
All Students in Cohort 2
Partnership and Comparison
Schools
All Students in Cohort 2
Partnership and Comparison
Schools
All Students in Cohort 2
Partnership and Comparison
Schools
All Students in Cohort 2
Partnership and Comparison
Schools
All Students in DPSCD Cohort 2 Partnership Schools and
DPSCD Cohort 2 Comparison
Schools
All Students in DPSCD Cohort 2 Partnership Schools and
DPSCD Cohort 2 Comparison
Schools
(1) (2) (3) (4) (5) (6)
Outcome ELA M-Step Levels ELA M-STEP Growth/Gains
Reference Year in Event Study Model 16-17 17-18 16-17 17-18 16-17 17-18
Comparison School 2013-14 -0.536*** -0.752*** -0.585*** -0.761*** -0.630*** -0.744***
(0.0390) (0.0509) (0.0539) (0.0706) (0.0907) (0.1160)
Comparison School 2014-15 -0.408*** -0.624*** -0.439*** -0.615*** -0.606*** -0.720***
(0.0282) (0.0400) (0.0399) (0.0545) (0.0704) (0.0927)
Comparison School 2015-16 -0.219*** -0.435*** -0.210*** -0.386*** -0.242*** -0.356***
(0.0163) (0.0285) (0.0270) (0.0399) (0.0412) (0.0648)
Comparison School 2016-17 -0.216*** -0.176*** -0.114**
(0.0191) (0.0275) (0.0404)
Comparison School 2017-18 0.216*** 0.176*** 0.114**
(0.0191) (0.0275) (0.0404)
Comparison School 2018-19 0.455*** 0.239*** 0.384*** 0.208*** 0.288*** 0.174***
(0.0264) (0.0157) (0.0388) (0.0285) (0.0624) (0.0414)
Partnership School 2013-14 0.016 0.040 -0.024 0.002 0.028 -0.005
(0.0244) (0.0335) (0.0287) (0.0394) (0.0441) (0.0497)
Partnership School 2014-15 -0.044+ -0.020 -0.098** -0.071 0.023 -0.010
(0.0235) (0.0374) (0.0336) (0.0453) (0.0488) (0.0572)
Partnership School 2015-16 -0.016 0.009 0.009 0.036 0.068+ 0.035
(0.0187) (0.0326) (0.0294) (0.0366) (0.0355) (0.0495)
Partnership School 2016-17 0.025 0.027 -0.033
(0.0293) (0.0403) (0.0404)
Partnership School 2017-18 -0.025 -0.027 0.033
(0.0293) (0.0403) (0.0404)
Partnership School 2018-19 -0.010 0.015 -0.007 0.020 0.011 -0.022
(0.0277) (0.0178) (0.0292) (0.0383) (0.0438) (0.0457)
Economically Disadvantaged 0.022** 0.022** 0.006 0.006 0.013 0.013
(0.0072) (0.0072) (0.0115) (0.0115) (0.0243) (0.0243)
English Language Learner -0.016 -0.016 0.108*** 0.108*** 0.189*** 0.189***
(0.0208) (0.0208) (0.0290) (0.0290) (0.0441) (0.0441)
Receives Special Education 0.025* 0.025* 0.058** 0.058** 0.032 0.032
(0.0109) (0.0109) (0.0179) (0.0179) (0.0332) (0.0332)

Partnership Turnaround: Year Two Report Appendix B | October 2020
232232
Sample
All Students in Cohort 2
Partnership and Comparison
Schools
All Students in Cohort 2
Partnership and Comparison
Schools
All Students in Cohort 2
Partnership and Comparison
Schools
All Students in Cohort 2
Partnership and Comparison
Schools
All Students in DPSCD Cohort 2 Partnership Schools and
DPSCD Cohort 2 Comparison
Schools
All Students in DPSCD Cohort 2 Partnership Schools and
DPSCD Cohort 2 Comparison
Schools
(1) (2) (3) (4) (5) (6)
Outcome ELA M-Step Levels ELA M-STEP Growth/Gains
Reference Year in Event Study Model 16-17 17-18 16-17 17-18 16-17 17-18
School-level: % Non-White Students 0.039 0.039 0.231+ 0.231+ 0.256 0.256
(0.1120) (0.1120) (0.1300) (0.1300) (0.2220) (0.2220)
School-level: % Black Students -0.164*** -0.164*** -0.092* -0.092* -0.103 -0.103
(0.0348) (0.0348) (0.0410) (0.0410) (0.0707) (0.0707)
School-level: % Hispanic Students -0.120+ -0.120+ -0.043 -0.043 -0.203 -0.203
(0.0673) (0.0673) (0.0689) (0.0689) (0.1370) (0.1370)
School-level: % Economically Disadvantaged Students
0.259*** 0.259*** 0.140* 0.140* 0.170 0.170
(0.0558) (0.0558) (0.0599) (0.0599) (0.1110) (0.1110)
School-level: % English Language Learner Students
-0.052 -0.052 -0.039 -0.039 0.174 0.174
(0.0807) (0.0807) (0.0777) (0.0777) (0.1610) (0.1610)
School-level: % Students Receiving Special Education Services
-0.409*** -0.409*** -0.329** -0.329** -0.190 -0.190
(0.0875) (0.0875) (0.1000) (0.1000) (0.1600) (0.1600)
Log of Student Enrollment -0.047*** -0.047*** -0.068*** -0.068*** -0.078*** -0.078***
(0.0127) (0.0127) (0.0136) (0.0136) (0.0194) (0.0194)
4th Grade -0.254*** -0.254*** -0.637*** -0.637*** -0.584*** -0.584***
(0.0149) (0.0149) (0.0489) (0.0489) (0.0697) (0.0697)
5th Grade -0.459*** -0.459*** -0.774*** -0.774*** -0.699*** -0.699***
(0.0269) (0.0269) (0.0566) (0.0566) (0.0809) (0.0809)
6th Grade -0.626*** -0.626*** -0.921*** -0.921*** -0.797*** -0.797***
(0.0392) (0.0392) (0.0682) (0.0682) (0.1010) (0.1010)
7th Grade -0.831*** -0.831*** -1.135*** -1.135*** -0.983*** -0.983***
(0.0511) (0.0511) (0.0802) (0.0802) (0.1190) (0.1190)
8th Grade -1.019*** -1.019*** -1.301*** -1.301*** -1.144*** -1.144***
(0.0621) (0.0621) (0.0942) (0.0942) (0.1400) (0.1400)
Constant 0.01 0.218* 1.415*** 1.582*** 1.337*** 1.470***
(0.1000) (0.1020) (0.1180) (0.1250) (0.1730) (0.1850)
Observations 217,029 217,029 167,372 167,372 47,201 47,201
R-squared 0.746 0.746 0.141 0.141 0.153 0.153
Adjusted R-squared 0.653 0.653 -0.212 -0.212 -0.193 -0.193
Note: Robust standard errors in parentheses. All models include student fixed effects. *** p<0.001, ** p<0.01, * p<0.05, + p<0.10

EPIC | Education Policy Innovation Collaborative — Michigan State University
233
EPIC | Education Policy Innovation Collaborative — Michigan State University
APPENDIX B-10. FULL RESULTS FOR TABLE 4.3, ROW C. COHORT 2 SCHOOL-LEVEL OUTCOMES SAT MATH
Sample
All Students in Cohort 2 Partnership and
Comparison Schools
All Students in Cohort 2 Partnership and
Comparison Schools
All Students in DPSCD Cohort 2 Partnership Schools and DPSCD
Cohort 2 Comparison Schools
All Students in DPSCD Cohort 2 Partnership Schools and DPSCD
Cohort 2 Comparison Schools
(1) (2) (3) (4)
Outcome SAT Math
Reference Year in Event Study Model 16-17 17-18 16-17 17-18Comparison School 2013-14 0.143*** 0.130*** 0.462* 0.273+
(0.0268) (0.0311) (0.1500) (0.1350)Comparison School 2014-15 0.109*** 0.095** 0.476*** 0.287**
(0.0230) (0.0320) (0.0592) (0.0651)Comparison School 2015-16 0.033 0.020 0.338** 0.148
(0.0239) (0.0276) (0.0795) (0.0847)Comparison School 2016-17 -0.013 -0.190***
(0.0259) (0.0193)Comparison School 2017-18 0.013 0.190***
(0.0259) (0.0193)Comparison School 2018-19 0.015 0.002 -0.024 -0.214*
(0.0272) (0.0268) (0.0813) (0.0666)Partnership School 2013-14 0.064 0.025 -0.330+ -0.205
(0.0567) (0.0549) (0.1590) (0.1180)Partnership School 2014-15 0.091* 0.052 -0.309** -0.185
(0.0435) (0.0508) (0.0603) (0.1080)Partnership School 2015-16 -0.010 -0.049 -0.339*** -0.215+
(0.0398) (0.0420) (0.0577) (0.1030)Partnership School 2016-17 -0.039 0.124
(0.0480) (0.0684)Partnership School 2017-18 0.039 -0.124
(0.0480) (0.0684) Partnership School 2018-19 -0.026 -0.065 0.057 0.182+
(0.0561) (0.0578) (0.1320) (0.0773)School-level: % Non-White Students -0.108 -0.108 0.711 0.711
(0.3670) (0.3670) (6.4360) (6.4360)School-level: % Black Students 0.041 0.041 1.076 1.076
(0.2630) (0.2630) (5.5830) (5.5830)School-level: % Hispanic Students 0.694 0.694 -6.566 -6.566
(0.5180) (0.5180) (7.8920) (7.8920)School-level: % Economically Disadvantaged Students -0.030 -0.030 0.087 0.087
(0.1210) (0.1210) (0.5060) (0.5060)School-level: % English Language Learner Students -0.035 -0.035 -0.658 -0.658
(0.2200) (0.2200) (1.0210) (1.0210)School-level: % Students Receiving Special Education Services
-0.041 -0.041 -2.503 -2.503(0.2750) (0.2750) (1.5500) (1.5500)
Log of Student Enrollment 0.066 0.066 0.124 0.124(0.0518) (0.0518) (0.1870) (0.1870)
Constant -1.363*** -1.342*** -2.285 -2.204(0.3940) (0.3870) (5.0700) (5.0730)
Observations 512 512 47 47R-squared 0.699 0.699 0.779 0.779Adjusted R-squared 0.619 0.619 0.538 0.538
Note: Robust standard errors in parentheses. All models include school fixed effects. *** p<0.001, ** p<0.01, * p<0.05, + p<0.10

Partnership Turnaround: Year Two Report Appendix B | October 2020
234234
APPENDIX B-11. FULL RESULTS FOR TABLE 4.3, ROW D. COHORT 2 SCHOOL-LEVEL OUTCOMES SAT EVIDENCE-BASED READING AND WRITING
Sample
All Students in Cohort 2 Partnership and
Comparison Schools
All Students in Cohort 2 Partnership and
Comparison Schools
All Students in DPSCD Cohort 2 Partnership Schools and DPSCD
Cohort 2 Comparison Schools
All Students in DPSCD Cohort 2 Partnership Schools and DPSCD
Cohort 2 Comparison Schools
(1) (2) (3) (4)
Outcome SAT Evidence Based Reading and Writing
Reference Year in Event Study Model 16-17 17-18 16-17 17-18Comparison School 2013-14 0.068* 0.076* 0.516** 0.546**
(0.0322) (0.0308) (0.1460) (0.1160)Comparison School 2014-15 0.006 0.014 0.139 0.169
(0.0242) (0.0292) (0.0809) (0.1080)Comparison School 2015-16 0.029 0.037 0.074 0.104
(0.0266) (0.0278) (0.1020) (0.1290)Comparison School 2016-17 0.008 0.030
(0.0327) (0.0328)Comparison School 2017-18 -0.008 -0.030
(0.0327) (0.0328)Comparison School 2018-19 0.008 0.016 -0.082 -0.052
(0.0339) (0.0265) (0.0816) (0.0502)Partnership School 2013-14 0.002 -0.072 -0.454** -0.536***
(0.0427) (0.0514) (0.1120) (0.0757)Partnership School 2014-15 0.011 -0.062 -0.117 -0.199
(0.0394) (0.0515) (0.1010) (0.1490)Partnership School 2015-16 -0.044 -0.117* -0.096 -0.177
(0.0399) (0.0482) (0.0899) (0.1350)Partnership School 2016-17 -0.073 -0.082
(0.0457) (0.0765)Partnership School 2017-18 0.073 0.082
(0.0457) (0.0765) Partnership School 2018-19 -0.018 -0.091+ 0.072 -0.010
(0.0558) (0.0542) (0.0402) (0.0415)School-level: % Non-White Students -0.568 -0.568 5.499 5.499
(0.3530) (0.3530) (5.0350) (5.0350)School-level: % Black Students -0.232 -0.232 4.678 4.678
(0.2730) (0.2730) (4.9280) (4.9280)School-level: % Hispanic Students 0.494 0.494 -2.350 -2.350
(0.5650) (0.5650) (5.6180) (5.6180)School-level: % Economically Disadvantaged Students -0.156 -0.156 0.094 0.094
(0.1360) (0.1360) (0.6350) (0.6350)School-level: % English Language Learner Students -0.056 -0.056 -2.592* -2.592*
(0.2110) (0.2110) (1.0260) (1.0260)School-level: % Students Receiving Special Education Services
0.013 0.013 -0.457 -0.457(0.2750) (0.2750) (0.8940) (0.8940)
Log of Student Enrollment 0.059 0.059 -0.118 -0.118(0.0467) (0.0467) (0.1460) (0.1460)
Constant -1.004** -0.998** -4.793 -4.752(0.3400) (0.3330) (5.3350) (5.3450)
Observations 512 512 47 47R-squared 0.759 0.759 0.812 0.812Adjusted R-squared 0.695 0.695 0.607 0.607
Note: Robust standard errors in parentheses. All models include school fixed effects. *** p<0.001, ** p<0.01, * p<0.05, + p<0.10

EPIC | Education Policy Innovation Collaborative — Michigan State University
235
EPIC | Education Policy Innovation Collaborative — Michigan State University
APPENDIX B-12. FULL RESULTS FOR TABLE 4.3, ROW G. COHORT 2 GRADE RETENTION
Sample
All Students in Cohort 2 Partnership and
Comparison Schools
All Students in Cohort 2 Partnership and
Comparison Schools
All Students in DPSCD Cohort 2 Partnership Schools and DPSCD
Cohort 2 Comparison Schools
All Students in DPSCD Cohort 2 Partnership Schools and DPSCD
Cohort 2 Comparison Schools
(1) (2) (3) (4)
Outcome Probability of Being Retained in Grade
Reference Year in Event Study Model 16-17 17-18 13-17 17-18
Comparison School 2013-14 -0.842*** -1.117*** -1.124*** -1.501***(0.0662) (0.0903) (0.0324) (0.0438)
Comparison School 2014-15 -0.563*** -0.838*** -0.751*** -1.128***(0.0449) (0.0689) (0.0216) (0.0329)
Comparison School 2015-16 -0.278*** -0.553*** -0.372*** -0.749***(0.0232) (0.0472) (0.0109) (0.0222)
Comparison School 2016-17 -0.275*** -0.377***(0.0242) (0.0118)
Comparison School 2017-18 0.275*** 0.377***(0.0242) (0.0118)
Comparison School 2018-19 0.566*** 0.291*** 0.751*** 0.374***(0.0442) (0.0203) (0.0228) (0.0114)
Partnership School 2013-14 0.003 -0.001 -0.002 -0.001(0.0039) (0.0056) (0.0058) (0.0072)
Partnership School 2014-15 -0.003 -0.007 -0.004 -0.003(0.0036) (0.0054) (0.0035) (0.0050)
Partnership School 2015-16 -0.003 -0.007 -0.004 -0.003(0.0034) (0.0053) (0.0037) (0.0054)
Partnership School 2016-17 -0.004 0.001(0.0043) (0.0047)
Partnership School 2017-18 0.004 -0.001(0.0043) (0.0047)
Partnership School 2018-19 -0.002 -0.005 0.003 0.004(0.0042) (0.0045) (0.0049) (0.0040)
Economically Disadvantaged 0.001 0.001 0.003 0.003(0.0018) (0.0018) (0.0023) (0.0023)
English Language Learner 0.007+ 0.007+ 0.002 0.002(0.0042) (0.0042) (0.0061) (0.0061)
Receives Special Education -0.004 -0.004 -0.011* -0.011*(0.0033) (0.0033) (0.0055) (0.0055)
School-level: % Non-White Students -0.026 -0.026 0.022 0.022(0.0201) (0.0201) (0.0258) (0.0258)
School-level: % Black Students -0.023** -0.023** -0.012 -0.012(0.0089) (0.0089) (0.0096) (0.0096)
School-level: % Hispanic Students -0.024+ -0.024+ 0.012 0.012(0.0124) (0.0124) (0.0172) (0.0172)
School-level: % Economically Disadvantaged Students 0.029* 0.029* 0.004 0.004(0.0115) (0.0115) (0.0110) (0.0110)
School-level: % English Language Learner Students -0.006 -0.006 -0.020 -0.020(0.0155) (0.0155) (0.0157) (0.0157)
School-level: % Students Receiving Special Education Services
0.024 0.024 0.034* 0.034*(0.0158) (0.0158) (0.0169) (0.0169)
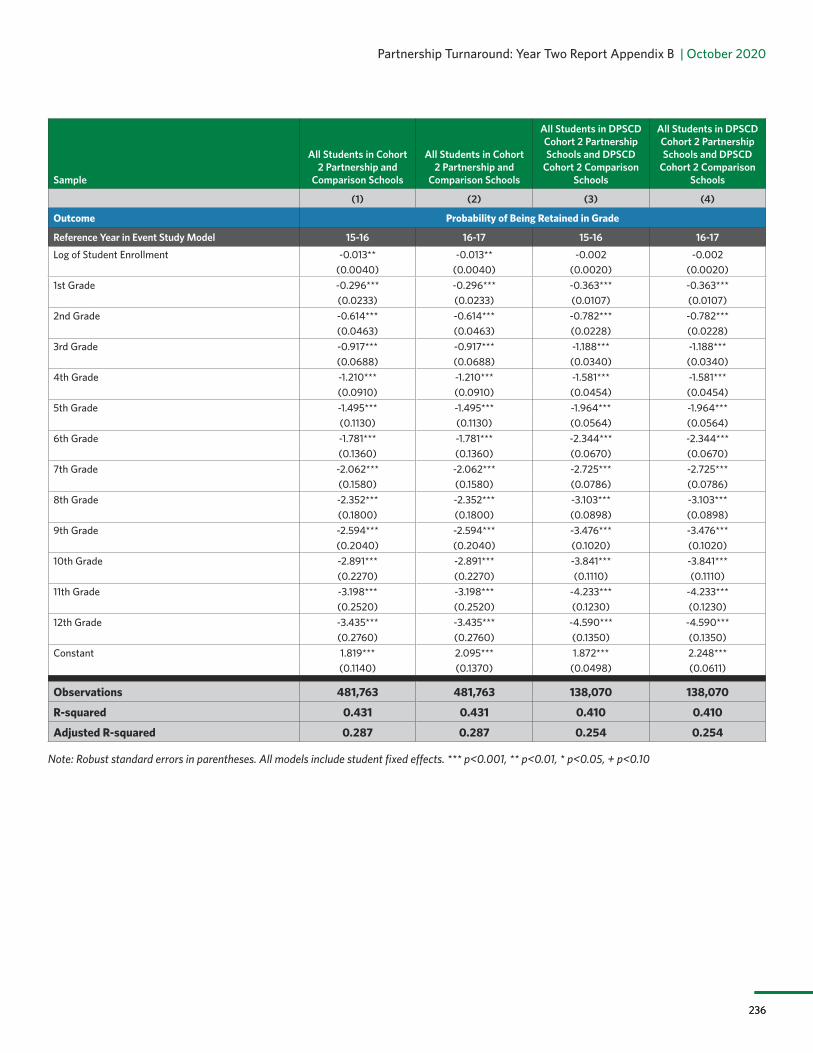
Partnership Turnaround: Year Two Report Appendix B | October 2020
236236
Sample
All Students in Cohort 2 Partnership and
Comparison Schools
All Students in Cohort 2 Partnership and
Comparison Schools
All Students in DPSCD Cohort 2 Partnership Schools and DPSCD
Cohort 2 Comparison Schools
All Students in DPSCD Cohort 2 Partnership Schools and DPSCD
Cohort 2 Comparison Schools
(1) (2) (3) (4)
Outcome Probability of Being Retained in Grade
Reference Year in Event Study Model 15-16 16-17 15-16 16-17
Log of Student Enrollment -0.013** -0.013** -0.002 -0.002(0.0040) (0.0040) (0.0020) (0.0020)
1st Grade -0.296*** -0.296*** -0.363*** -0.363***(0.0233) (0.0233) (0.0107) (0.0107)
2nd Grade -0.614*** -0.614*** -0.782*** -0.782***(0.0463) (0.0463) (0.0228) (0.0228)
3rd Grade -0.917*** -0.917*** -1.188*** -1.188***(0.0688) (0.0688) (0.0340) (0.0340)
4th Grade -1.210*** -1.210*** -1.581*** -1.581***(0.0910) (0.0910) (0.0454) (0.0454)
5th Grade -1.495*** -1.495*** -1.964*** -1.964***(0.1130) (0.1130) (0.0564) (0.0564)
6th Grade -1.781*** -1.781*** -2.344*** -2.344***(0.1360) (0.1360) (0.0670) (0.0670)
7th Grade -2.062*** -2.062*** -2.725*** -2.725***(0.1580) (0.1580) (0.0786) (0.0786)
8th Grade -2.352*** -2.352*** -3.103*** -3.103***(0.1800) (0.1800) (0.0898) (0.0898)
9th Grade -2.594*** -2.594*** -3.476*** -3.476***(0.2040) (0.2040) (0.1020) (0.1020)
10th Grade -2.891*** -2.891*** -3.841*** -3.841***(0.2270) (0.2270) (0.1110) (0.1110)
11th Grade -3.198*** -3.198*** -4.233*** -4.233***(0.2520) (0.2520) (0.1230) (0.1230)
12th Grade -3.435*** -3.435*** -4.590*** -4.590***(0.2760) (0.2760) (0.1350) (0.1350)
Constant 1.819*** 2.095*** 1.872*** 2.248***(0.1140) (0.1370) (0.0498) (0.0611)
Observations 481,763 481,763 138,070 138,070
R-squared 0.431 0.431 0.410 0.410
Adjusted R-squared 0.287 0.287 0.254 0.254
Note: Robust standard errors in parentheses. All models include student fixed effects. *** p<0.001, ** p<0.01, * p<0.05, + p<0.10

EPIC | Education Policy Innovation Collaborative — Michigan State University
237
EPIC | Education Policy Innovation Collaborative — Michigan State University
APPENDIX B-13. FULL RESULTS FOR TABLE 4.3, ROW E. COHORT 2 SCHOOL-LEVEL OUTCOMES PERCENT GRADUATING HIGH SCHOOL ON TRACK
Sample
All Students in Cohort 2 Partnership and
Comparison Schools
All Students in Cohort 2 Partnership and
Comparison Schools
All Students in DPSCD Cohort 2 Partnership Schools and DPSCD
Cohort 2 Comparison Schools
All Students in DPSCD Cohort 2 Partnership Schools and DPSCD
Cohort 2 Comparison Schools
(1) (2) (3) (4)
Outcome Percent Graduating High School On-Track
Reference Year in Event Study Model 16-17 17-18 16-17 17-18Comparison School 2013-14 0.004 -0.039* 0.044 0.087
(0.0180) (0.0187) (0.0688) (0.0529)Comparison School 2014-15 -0.015 -0.058* 0.043 0.085
(0.0191) (0.0227) (0.0617) (0.0725)Comparison School 2015-16 -0.015 -0.058** -0.140+ -0.098
(0.0123) (0.0193) (0.0682) (0.0797)Comparison School 2016-17 -0.043** 0.042+
(0.0159) (0.0228)Comparison School 2017-18 0.043** -0.042+
(0.0159) (0.0228)Comparison School 2018-19 0.057** 0.014 -0.059+ -0.017
(0.0188) (0.0117) (0.0284) (0.0198)Partnership School 2013-14 -0.033 -0.036 0.010 -0.011
(0.0354) (0.0408) (0.0555) (0.0521)Partnership School 2014-15 -0.073 -0.075 -0.003 -0.025
(0.0598) (0.0644) (0.0683) (0.0445)Partnership School 2015-16 -0.044 -0.047 0.144+ 0.122*
(0.0421) (0.0443) (0.0724) (0.0477)Partnership School 2016-17 -0.003 -0.021
(0.0231) (0.0437)Partnership School 2017-18 0.003 0.021
(0.0231) (0.0437)Partnership School 2018-19 -0.020 -0.022 0.067 0.045
(0.0375) (0.0304) (0.0600) (0.0580)School-level: % Non-White Students -0.058 -0.058 0.003 0.003
(0.2570) (0.2570) (3.3700) (3.3700)School-level: % Black Students -0.027 -0.027 -0.864 -0.864
(0.1340) (0.1340) (3.1400) (3.1400)School-level: % Hispanic Students 0.022 0.022 1.922 1.922
(0.2890) (0.2890) (3.9340) (3.9340)School-level: % Economically Disadvantaged Students -0.294** -0.294** -0.033 -0.033
(0.0945) (0.0945) (0.4570) (0.4570)School-level: % English Language Learner Students 0.318+ 0.318+ -0.901 -0.901
(0.1660) (0.1660) (1.0150) (1.0150)School-level: % Students Receiving Special Education Services
(0.0156) (0.0156) (0.2650) (0.2650)(0.2070) (0.2070) (0.3030) (0.3030)
Log of Student Enrollment 0.078* 0.078* -0.247* -0.247*(0.0383) (0.0383) (0.0822) (0.0822)
Constant 0.244 0.287 2.977 2.953(0.2500) (0.2510) (3.7140) (3.7580)
Observations 533 533 53 53R-squared 0.883 0.883 0.972 0.972 Adjusted R-squared 0.851 0.851 0.943 0.943
Note: Robust standard errors in parentheses. All models include school fixed effects. *** p<0.001, ** p<0.01, * p<0.05, + p<0.10

Partnership Turnaround: Year Two Report Appendix B | October 2020
238238
APPENDIX B-14. FULL RESULTS FOR TABLE 4.3, ROW F. COHORT 2 SCHOOL-LEVEL OUTCOMES HIGH SCHOOL DROP-OUT RATE
Sample
All Students in Cohort 2 Partnership and
Comparison Schools
All Students in Cohort 2 Partnership and
Comparison Schools
All Students in DPSCD Cohort 2 Partnership Schools and DPSCD
Cohort 2 Comparison Schools
All Students in DPSCD Cohort 2 Partnership Schools and DPSCD
Cohort 2 Comparison Schools
(1) (2) (3) (4)
Outcome High School Drop-Out Rate
Reference Year in Event Study Model 16-17 17-18 16-17 17-18Comparison School 2013-14 -0.007 -0.001 -0.109 -0.163
(0.0176) (0.0174) (0.1120) (0.0932)Comparison School 2014-15 -0.005 0.001 -0.117 -0.171
(0.0162) (0.0166) (0.0893) (0.0952)Comparison School 2015-16 0.008 0.014 -0.145 -0.199
(0.0108) (0.0156) (0.1580) (0.1560)Comparison School 2016-17 0.005 -0.054
(0.0145) (0.0389)Comparison School 2017-18 -0.005 0.054
(0.0145) (0.0389)Comparison School 2018-19 -0.020 -0.015 -0.101 -0.154*
(0.0154) (0.0142) (0.0659) (0.0617)Partnership School 2013-14 0.012 -0.015 0.061 0.064
-0.0282 -0.0419 -0.0827 -0.0708Partnership School 2014-15 0.015 -0.011 0.054 0.056
(0.0256) (0.0389) (0.0932) (0.1060)Partnership School 2015-16 0.047 0.021 0.065 0.068
(0.0494) (0.0589) (0.1160) (0.0990)Partnership School 2016-17 -0.026 0.003
(0.0316) (0.0869)Partnership School 2017-18 0.026 -0.003
(0.0316) (0.0869)Partnership School 2018-19 -0.021 -0.047 0.012 0.015
(0.0435) (0.0618) (0.0710) (0.0917)School-level: % Non-White Students -0.085 -0.085 2.883 2.883
(0.2140) (0.2140) (3.8760) (3.8760)School-level: % Black Students -0.054 -0.054 0.371 0.371
(0.1340) (0.1340) (2.4250) (2.4250)School-level: % Hispanic Students 0.517+ 0.517+ 10.400 10.400
(0.2830) (0.2830) (6.4100) (6.4100)School-level: % Economically Disadvantaged Students 0.161* 0.161* -0.191 -0.191
(0.0802) (0.0802) (0.4780) (0.4780)School-level: % English Language Learner Students -0.206 -0.206 -3.054 -3.054
(0.1350) (0.1350) (2.9590) (2.9590)School-level: % Students Receiving Special Education Services
0.373+ 0.373+ -1.887 -1.887(0.2060) (0.2060) (1.8710) (1.8710)
Log of Student Enrollment -0.044 -0.044 0.038 0.038(0.0294) (0.0294) (0.1720) (0.1720)
Constant 0.326+ 0.326+ -0.092 -0.041(0.1740) (0.1760) (2.7770) (2.8080)
Observations 533 533 53 53R-squared 0.730 0.730 0.832 0.832Adjusted R-squared 0.656 0.656 0.650 0.650
Note: Robust standard errors in parentheses. All models include school fixed effects. *** p<0.001, ** p<0.01, * p<0.05, + p<0.10

EPIC | Education Policy Innovation Collaborative — Michigan State University
239
EPIC | Education Policy Innovation Collaborative — Michigan State University
APPENDIX B-15. FULL RESULTS FOR TABLE 5.2.1. COHORT 1 TEACHER MOBILITY AND EFFECTIVENESS
Sample
All Cohort 1 Partnership Schools and
2016-17 Priority Schools
All Cohort 1 Partnership Schools and
2016-17 Priority Schools
All Cohort 1 Partnership Schools and
2016-17 Priority Schools
All Cohort 1 Partnership Schools and
2016-17 Priority Schools
All Cohort 1 Partnership Schools and
2016-17 Priority Schools
All Cohort 1 Partnership Schools and
2016-17 Priority Schools
All Cohort 1 Partnership Schools and
2016-17 Priority Schools
All Cohort 1 Partnership Schools and
2016-17 Priority Schools
(1) (2) (3) (4) (5) (6) (7) (8)Outcome Probability of Exiting Teaching Probability of Transferring Out of DistrictReference Year in Event Study Model 15-16 16-17 15-16 16-17 15-16 16-17 15-16 16-17Teacher Experience Group All All 1st-5th 1st-5th All All 1st-5th 1st-5thPriority School 2013-14 0.001 0.004 -0.004 -0.002 0.011 -0.012 0.010 -0.014
(0.0102) (0.0092) (0.0140) (0.0134) (0.0108) (0.0138) (0.0208) (0.0247)Priority School 2014-15 -0.010 -0.007 -0.021 -0.018 0.005 -0.019 0.010 -0.015
(0.0090) (0.0081) (0.0142) (0.0137) (0.0122) (0.0151) (0.0223) (0.0262)Priority School 2015-16 0.002 0.005 -0.021 -0.008
(0.0070) (0.0104) (0.0139) (0.0197)Priority School 2016-17 -0.007 0.000 0.058** 0.078*
(0.0082) (0.0131) (0.0219) (0.0349)Priority School 2017-18 0.011 0.015* 0.009 0.012 0.024* -0.004 -0.004 -0.035*
(0.0080) (0.0076) (0.0124) (0.0116) (0.0116) (0.0102) (0.0179) (0.0155)Priority School 2018-19 -0.062*** -0.058*** -0.055*** -0.052*** 0.048*** 0.019+ 0.053* 0.020
(0.0067) (0.0061) (0.0115) (0.0111) (0.0130) (0.0103) (0.0235) (0.0205)Partnership School 2013-14 0.023 0.039* 0.059+ 0.088* 0.029 0.048* 0.044 0.079+
(0.0167) (0.0177) (0.0325) (0.0354) (0.0192) (0.0205) (0.0374) (0.0426)Partnership School 2014-15 -0.008 0.008 0.039 0.068* 0.034+ 0.051* 0.055+ 0.091*
(0.0158) (0.0170) (0.0265) (0.0307) (0.0189) (0.0202) (0.0332) (0.0359)Partnership School 2015-16 0.021 0.046+ 0.036 0.063
(0.0167) (0.0256) (0.0230) (0.0393)Partnership School 2016-17 -0.033* -0.048+ -0.018 -0.034
(0.0148) (0.0287) (0.0265) (0.0539)Partnership School 2017-18 -0.038** -0.022+ -0.009 0.022 0.021 0.040* 0.031 0.071+
(0.0130) (0.0123) (0.0226) (0.0227) (0.0186) (0.0199) (0.0322) (0.0372)Partnership School 2018-19 -0.010 0.006 0.033 0.064** 0.020 0.039+ 0.041 0.082+
(0.0106) (0.0103) (0.0215) (0.0240) (0.0197) (0.0224) (0.0401) (0.0471)School-level: % Non-White Students 0.154 0.146 0.423+ 0.434+ 0.356 0.488+ 1.353+ 1.497*
(0.1540) (0.1500) (0.2370) (0.2390) (0.2910) (0.2740) (0.7350) (0.7150)School-level: % Black Students -0.121 -0.148+ -0.013 -0.045 0.086 0.186+ 0.280 0.351
(0.0784) (0.0764) (0.1520) (0.1420) (0.1100) (0.1130) (0.2390) (0.2290)School-level: % Hispanic Students -0.246* -0.297** -0.178 -0.216 0.026 0.125 -0.276 -0.203
(0.1210) (0.1110) (0.2650) (0.2510) (0.1260) (0.1250) (0.3000) (0.2860)School-level: % Economically 0.023 0.036 -0.007 0.010 -0.150+ -0.147+ -0.156 -0.105Disadvantaged Students (0.0420) (0.0408) (0.0723) (0.0722) (0.0822) (0.0879) (0.1440) (0.1510)School-level: % English Language 0.089 0.072 0.169 0.158 0.136 0.194* 0.439** 0.529**Learner Students (0.0871) (0.0825) (0.1610) (0.1540) (0.0873) (0.0959) (0.1650) (0.1640)School-level: % Students Receiving -0.054 -0.053 0.100 0.111 -0.080 -0.039 0.158 0.229Special Education Services (0.0813) (0.0843) (0.1710) (0.1700) (0.1460) (0.1570) (0.3250) (0.3400)Log of Student Enrollment -0.007 0.002 -0.032 -0.020 -0.074* -0.084** -0.095+ -0.094+
(0.0128) (0.0123) (0.0208) (0.0201) (0.0301) (0.0307) (0.0533) (0.0548)Teacher: Male 0.00003 -0.00003 0.010 0.010 0.009 0.009 0.007 0.007
(0.0047) (0.0047) (0.0083) (0.0084) (0.0063) (0.0063) (0.0128) (0.0128)Teacher: Black -0.033*** -0.034*** -0.039*** -0.040*** -0.009 -0.009 -0.016 -0.018
(0.0065) (0.0065) (0.0099) (0.0101) (0.0072) (0.0071) (0.0136) (0.0135)Teacher: Hispanic -0.014 -0.014 0.002 0.001 0.009 0.009 0.004 0.002
(0.0119) (0.0119) (0.0201) (0.0202) (0.0109) (0.0106) (0.0198) (0.0197)Teacher: Non-White 0.069*** 0.069*** 0.063** 0.063*** 0.001 0.001 -0.026 -0.024
(0.0146) (0.0146) (0.0189) (0.0189) (0.0112) (0.0111) (0.0204) (0.0205)Teacher: Years of Experience 0.002*** 0.002*** -0.003*** -0.003***
(0.0004) (0.0004) (0.0004) (0.0004)Teacher: Master's Degree or Higher -0.013** -0.012** -0.006 -0.006 0.009 0.009 0.014 0.014
(0.0044) (0.0044) (0.0068) (0.0068) (0.0079) (0.0078) (0.0137) (0.0137)School Moved Location 0.025 0.029 0.001 0.007
(0.0228) (0.0252) (0.0331) (0.0377)School Moved Districts 0.107* 0.136*** 0.081 0.139**
(0.0441) (0.0373) (0.0646) (0.0462)School Grade Levels Offered Changed 0.081*** 0.078*** 0.158*** 0.158***
(0.0195) (0.0203) (0.0321) (0.0338)School Closed After End of School Year and 0.327*** 0.269** 0.498*** 0.378***Reopened in a Different Sector (0.0905) (0.0911) (0.1130) (0.1090)School Reopened in Same District 0.101 0.106 0.152 0.153
(0.1860) (0.1850) (0.2400) (0.2400)School Consolidated After End 0.548*** 0.575*** 0.424* 0.483**of School Year (0.1440) (0.1470) (0.1640) (0.1690)School Reopened as Combined School 0.093 0.099 0.473* 0.496**
(0.1000) (0.1020) (0.1990) (0.1870)School Reopened as Split of Closed School -0.025 -0.031 -0.077 -0.079
(0.0695) (0.0701) (0.1070) (0.1070)School Split Off From Existing School 0.724*** 0.731*** 0.760*** 0.764***
-0.034 -0.032 -0.035 -0.034School Reopened in a Different Sector 0.240+ 0.234+ 0.308* 0.322*From Prior Year (0.1230) (0.1230) (0.1560) (0.1540)Constant 0.213* 0.168 0.296 0.219 0.616** 0.601** 0.586 0.473
(0.1080) (0.1040) (0.2190) (0.2040) (0.2100) (0.2240) (0.3750) (0.3920)
Observations 21,586 21,586 8,612 8,612 17,050 17,050 6,772 6,772R-squared 0.045 0.044 0.060 0.060 0.227 0.225 0.192 0.189Adjusted R-squared 0.023 0.022 0.023 0.024 0.207 0.205 0.153 0.150
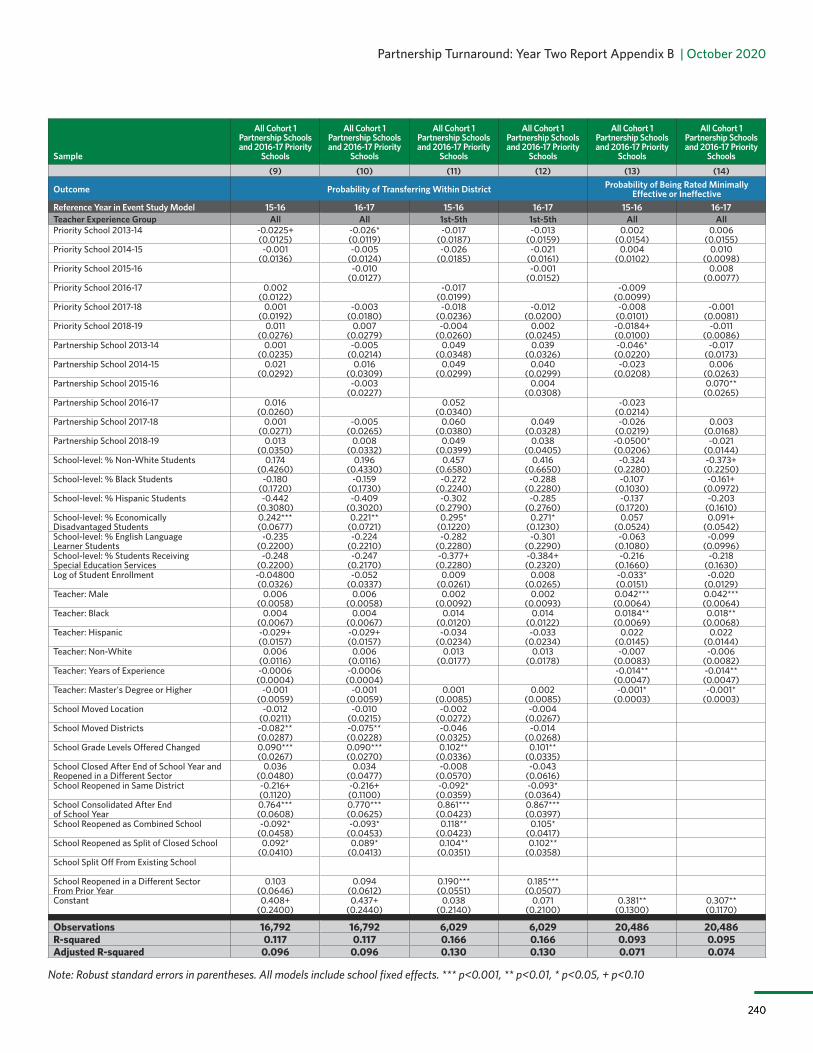
Partnership Turnaround: Year Two Report Appendix B | October 2020
240240
Sample
All Cohort 1 Partnership Schools and 2016-17 Priority
Schools
All Cohort 1 Partnership Schools and 2016-17 Priority
Schools
All Cohort 1 Partnership Schools and 2016-17 Priority
Schools
All Cohort 1 Partnership Schools and 2016-17 Priority
Schools
All Cohort 1 Partnership Schools and 2016-17 Priority
Schools
All Cohort 1 Partnership Schools and 2016-17 Priority
Schools(9) (10) (11) (12) (13) (14)
Outcome Probability of Transferring Within District Probability of Being Rated Minimally Effective or Ineffective
Reference Year in Event Study Model 15-16 16-17 15-16 16-17 15-16 16-17Teacher Experience Group All All 1st-5th 1st-5th All AllPriority School 2013-14 -0.0225+ -0.026* -0.017 -0.013 0.002 0.006
(0.0125) (0.0119) (0.0187) (0.0159) (0.0154) (0.0155)Priority School 2014-15 -0.001 -0.005 -0.026 -0.021 0.004 0.010
(0.0136) (0.0124) (0.0185) (0.0161) (0.0102) (0.0098)Priority School 2015-16 -0.010 -0.001 0.008
(0.0127) (0.0152) (0.0077)Priority School 2016-17 0.002 -0.017 -0.009
(0.0122) (0.0199) (0.0099)Priority School 2017-18 0.001 -0.003 -0.018 -0.012 -0.008 -0.001
(0.0192) (0.0180) (0.0236) (0.0200) (0.0101) (0.0081)Priority School 2018-19 0.011 0.007 -0.004 0.002 -0.0184+ -0.011
(0.0276) (0.0279) (0.0260) (0.0245) (0.0100) (0.0086)Partnership School 2013-14 0.001 -0.005 0.049 0.039 -0.046* -0.017
(0.0235) (0.0214) (0.0348) (0.0326) (0.0220) (0.0173)Partnership School 2014-15 0.021 0.016 0.049 0.040 -0.023 0.006
(0.0292) (0.0309) (0.0299) (0.0299) (0.0208) (0.0263)Partnership School 2015-16 -0.003 0.004 0.070**
(0.0227) (0.0308) (0.0265)Partnership School 2016-17 0.016 0.052 -0.023
(0.0260) (0.0340) (0.0214)Partnership School 2017-18 0.001 -0.005 0.060 0.049 -0.026 0.003
(0.0271) (0.0265) (0.0380) (0.0328) (0.0219) (0.0168)Partnership School 2018-19 0.013 0.008 0.049 0.038 -0.0500* -0.021
(0.0350) (0.0332) (0.0399) (0.0405) (0.0206) (0.0144)School-level: % Non-White Students 0.174 0.196 0.457 0.416 -0.324 -0.373+
(0.4260) (0.4330) (0.6580) (0.6650) (0.2280) (0.2250)School-level: % Black Students -0.180 -0.159 -0.272 -0.288 -0.107 -0.161+
(0.1720) (0.1730) (0.2240) (0.2280) (0.1030) (0.0972)School-level: % Hispanic Students -0.442 -0.409 -0.302 -0.285 -0.137 -0.203
(0.3080) (0.3020) (0.2790) (0.2760) (0.1720) (0.1610)School-level: % Economically 0.242*** 0.221** 0.295* 0.271* 0.057 0.091+Disadvantaged Students (0.0677) (0.0721) (0.1220) (0.1230) (0.0524) (0.0542)School-level: % English Language -0.235 -0.224 -0.282 -0.301 -0.063 -0.099Learner Students (0.2200) (0.2210) (0.2280) (0.2290) (0.1080) (0.0996)School-level: % Students Receiving -0.248 -0.247 -0.377+ -0.384+ -0.216 -0.218Special Education Services (0.2200) (0.2170) (0.2280) (0.2320) (0.1660) (0.1630)Log of Student Enrollment -0.04800 -0.052 0.009 0.008 -0.033* -0.020
(0.0326) (0.0337) (0.0261) (0.0265) (0.0151) (0.0129)Teacher: Male 0.006 0.006 0.002 0.002 0.042*** 0.042***
(0.0058) (0.0058) (0.0092) (0.0093) (0.0064) (0.0064)Teacher: Black 0.004 0.004 0.014 0.014 0.0184** 0.018**
(0.0067) (0.0067) (0.0120) (0.0122) (0.0069) (0.0068)Teacher: Hispanic -0.029+ -0.029+ -0.034 -0.033 0.022 0.022
(0.0157) (0.0157) (0.0234) (0.0234) (0.0145) (0.0144)Teacher: Non-White 0.006 0.006 0.013 0.013 -0.007 -0.006
(0.0116) (0.0116) (0.0177) (0.0178) (0.0083) (0.0082)Teacher: Years of Experience -0.0006 -0.0006 -0.014** -0.014**
(0.0004) (0.0004) (0.0047) (0.0047)Teacher: Master's Degree or Higher -0.001 -0.001 0.001 0.002 -0.001* -0.001*
(0.0059) (0.0059) (0.0085) (0.0085) (0.0003) (0.0003)School Moved Location -0.012 -0.010 -0.002 -0.004
(0.0211) (0.0215) (0.0272) (0.0267)School Moved Districts -0.082** -0.075** -0.046 -0.014
(0.0287) (0.0228) (0.0325) (0.0268)School Grade Levels Offered Changed 0.090*** 0.090*** 0.102** 0.101**
(0.0267) (0.0270) (0.0336) (0.0335)School Closed After End of School Year and 0.036 0.034 -0.008 -0.043Reopened in a Different Sector (0.0480) (0.0477) (0.0570) (0.0616)School Reopened in Same District -0.216+ -0.216+ -0.092* -0.093*
(0.1120) (0.1100) (0.0359) (0.0364)School Consolidated After End 0.764*** 0.770*** 0.861*** 0.867***of School Year (0.0608) (0.0625) (0.0423) (0.0397)School Reopened as Combined School -0.092* -0.093* 0.118** 0.105*
(0.0458) (0.0453) (0.0423) (0.0417)School Reopened as Split of Closed School 0.092* 0.089* 0.104** 0.102**
(0.0410) (0.0413) (0.0351) (0.0358)School Split Off From Existing School
School Reopened in a Different Sector 0.103 0.094 0.190*** 0.185***From Prior Year (0.0646) (0.0612) (0.0551) (0.0507)Constant 0.408+ 0.437+ 0.038 0.071 0.381** 0.307**
(0.2400) (0.2440) (0.2140) (0.2100) (0.1300) (0.1170)
Observations 16,792 16,792 6,029 6,029 20,486 20,486R-squared 0.117 0.117 0.166 0.166 0.093 0.095Adjusted R-squared 0.096 0.096 0.130 0.130 0.071 0.074
Note: Robust standard errors in parentheses. All models include school fixed effects. *** p<0.001, ** p<0.01, * p<0.05, + p<0.10
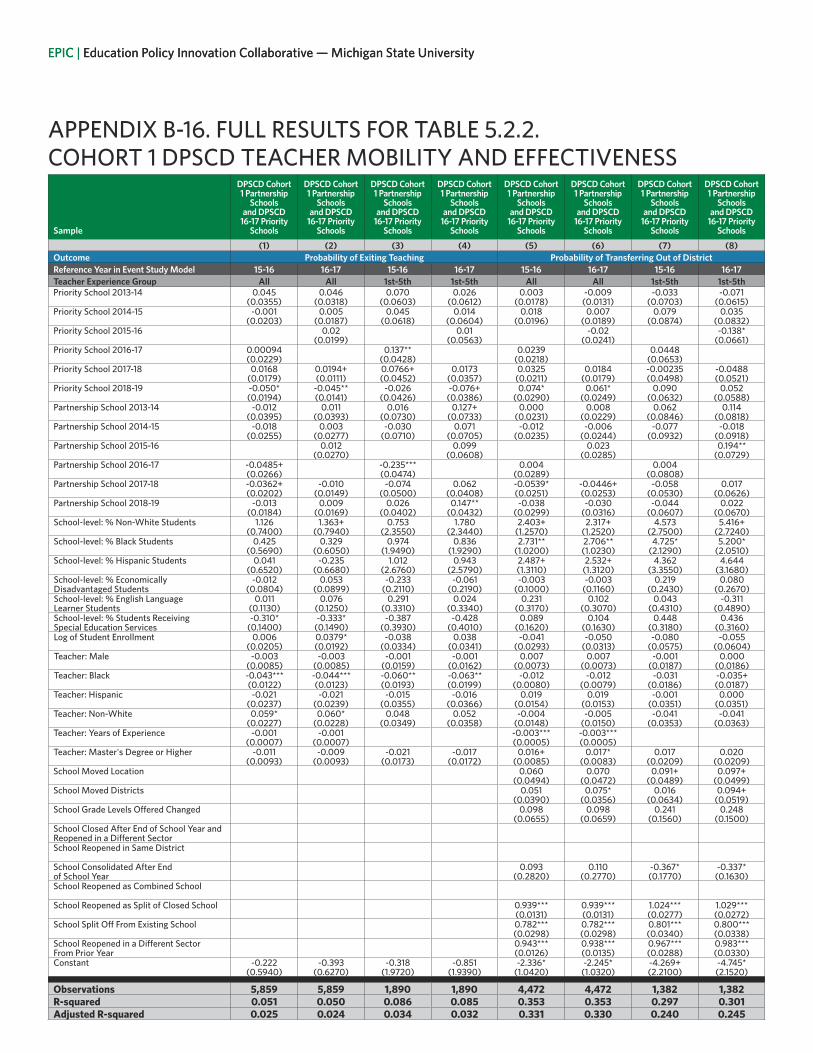
EPIC | Education Policy Innovation Collaborative — Michigan State University
241
EPIC | Education Policy Innovation Collaborative — Michigan State University
APPENDIX B-16. FULL RESULTS FOR TABLE 5.2.2. COHORT 1 DPSCD TEACHER MOBILITY AND EFFECTIVENESS
Sample
DPSCD Cohort 1 Partnership
Schools and DPSCD
16-17 Priority Schools
DPSCD Cohort 1 Partnership
Schools and DPSCD
16-17 Priority Schools
DPSCD Cohort 1 Partnership
Schools and DPSCD
16-17 Priority Schools
DPSCD Cohort 1 Partnership
Schools and DPSCD
16-17 Priority Schools
DPSCD Cohort 1 Partnership
Schools and DPSCD
16-17 Priority Schools
DPSCD Cohort 1 Partnership
Schools and DPSCD
16-17 Priority Schools
DPSCD Cohort 1 Partnership
Schools and DPSCD
16-17 Priority Schools
DPSCD Cohort 1 Partnership
Schools and DPSCD
16-17 Priority Schools
(1) (2) (3) (4) (5) (6) (7) (8)Outcome Probability of Exiting Teaching Probability of Transferring Out of DistrictReference Year in Event Study Model 15-16 16-17 15-16 16-17 15-16 16-17 15-16 16-17Teacher Experience Group All All 1st-5th 1st-5th All All 1st-5th 1st-5thPriority School 2013-14 0.045 0.046 0.070 0.026 0.003 -0.009 -0.033 -0.071
(0.0355) (0.0318) (0.0603) (0.0612) (0.0178) (0.0131) (0.0703) (0.0615)Priority School 2014-15 -0.001 0.005 0.045 0.014 0.018 0.007 0.079 0.035
(0.0203) (0.0187) (0.0618) (0.0604) (0.0196) (0.0189) (0.0874) (0.0832)Priority School 2015-16 0.02 0.01 -0.02 -0.138*
(0.0199) (0.0563) (0.0241) (0.0661)Priority School 2016-17 0.00094 0.137** 0.0239 0.0448
(0.0229) (0.0428) (0.0218) (0.0653)Priority School 2017-18 0.0168 0.0194+ 0.0766+ 0.0173 0.0325 0.0184 -0.00235 -0.0488
(0.0179) (0.0111) (0.0452) (0.0357) (0.0211) (0.0179) (0.0498) (0.0521)Priority School 2018-19 -0.050* -0.045** -0.026 -0.076+ 0.074* 0.061* 0.090 0.052
(0.0194) (0.0141) (0.0426) (0.0386) (0.0290) (0.0249) (0.0632) (0.0588)Partnership School 2013-14 -0.012 0.011 0.016 0.127+ 0.000 0.008 0.062 0.114
(0.0395) (0.0393) (0.0730) (0.0733) (0.0231) (0.0229) (0.0846) (0.0818)Partnership School 2014-15 -0.018 0.003 -0.030 0.071 -0.012 -0.006 -0.077 -0.018
(0.0255) (0.0277) (0.0710) (0.0705) (0.0235) (0.0244) (0.0932) (0.0918)Partnership School 2015-16 0.012 0.099 0.023 0.194**
(0.0270) (0.0608) (0.0285) (0.0729)Partnership School 2016-17 -0.0485+ -0.235*** 0.004 0.004
(0.0266) (0.0474) (0.0289) (0.0808)Partnership School 2017-18 -0.0362+ -0.010 -0.074 0.062 -0.0539* -0.0446+ -0.058 0.017
(0.0202) (0.0149) (0.0500) (0.0408) (0.0251) (0.0253) (0.0530) (0.0626)Partnership School 2018-19 -0.013 0.009 0.026 0.147** -0.038 -0.030 -0.044 0.022
(0.0184) (0.0169) (0.0402) (0.0432) (0.0299) (0.0316) (0.0607) (0.0670)School-level: % Non-White Students 1.126 1.363+ 0.753 1.780 2.403+ 2.317+ 4.573 5.416+
(0.7400) (0.7940) (2.3550) (2.3440) (1.2570) (1.2520) (2.7500) (2.7240)School-level: % Black Students 0.425 0.329 0.974 0.836 2.731** 2.706** 4.725* 5.200*
(0.5690) (0.6050) (1.9490) (1.9290) (1.0200) (1.0230) (2.1290) (2.0510)School-level: % Hispanic Students 0.041 -0.235 1.012 0.943 2.487+ 2.532+ 4.362 4.644
(0.6520) (0.6680) (2.6760) (2.5790) (1.3110) (1.3120) (3.3550) (3.1680)School-level: % Economically -0.012 0.053 -0.233 -0.061 -0.003 -0.003 0.219 0.080Disadvantaged Students (0.0804) (0.0899) (0.2110) (0.2190) (0.1000) (0.1160) (0.2430) (0.2670)School-level: % English Language 0.011 0.076 0.291 0.024 0.231 0.102 0.043 -0.311Learner Students (0.1130) (0.1250) (0.3310) (0.3340) (0.3170) (0.3070) (0.4310) (0.4890)School-level: % Students Receiving -0.310* -0.333* -0.387 -0.428 0.089 0.104 0.448 0.436Special Education Services (0.1400) (0.1490) (0.3930) (0.4010) (0.1620) (0.1630) (0.3180) (0.3160)Log of Student Enrollment 0.006 0.0379* -0.038 0.038 -0.041 -0.050 -0.080 -0.055
(0.0205) (0.0192) (0.0334) (0.0341) (0.0293) (0.0313) (0.0575) (0.0604)Teacher: Male -0.003 -0.003 -0.001 -0.001 0.007 0.007 -0.001 0.000
(0.0085) (0.0085) (0.0159) (0.0162) (0.0073) (0.0073) (0.0187) (0.0186)Teacher: Black -0.043*** -0.044*** -0.060** -0.063** -0.012 -0.012 -0.031 -0.035+
(0.0122) (0.0123) (0.0193) (0.0199) (0.0080) (0.0079) (0.0186) (0.0187)Teacher: Hispanic -0.021 -0.021 -0.015 -0.016 0.019 0.019 -0.001 0.000
(0.0237) (0.0239) (0.0355) (0.0366) (0.0154) (0.0153) (0.0351) (0.0351)Teacher: Non-White 0.059* 0.060* 0.048 0.052 -0.004 -0.005 -0.041 -0.041
(0.0227) (0.0228) (0.0349) (0.0358) (0.0148) (0.0150) (0.0353) (0.0363)Teacher: Years of Experience -0.001 -0.001 -0.003*** -0.003***
(0.0007) (0.0007) (0.0005) (0.0005)Teacher: Master's Degree or Higher -0.011 -0.009 -0.021 -0.017 0.016+ 0.017* 0.017 0.020
(0.0093) (0.0093) (0.0173) (0.0172) (0.0085) (0.0083) (0.0209) (0.0209)School Moved Location 0.060 0.070 0.091+ 0.097+
(0.0494) (0.0472) (0.0489) (0.0499)School Moved Districts 0.051 0.075* 0.016 0.094+
(0.0390) (0.0356) (0.0634) (0.0519)School Grade Levels Offered Changed 0.098 0.098 0.241 0.248
(0.0655) (0.0659) (0.1560) (0.1500)School Closed After End of School Year andReopened in a Different SectorSchool Reopened in Same District
School Consolidated After End 0.093 0.110 -0.367* -0.337*of School Year (0.2820) (0.2770) (0.1770) (0.1630)School Reopened as Combined School
School Reopened as Split of Closed School 0.939*** 0.939*** 1.024*** 1.029***(0.0131) (0.0131) (0.0277) (0.0272)
School Split Off From Existing School 0.782*** 0.782*** 0.801*** 0.800***(0.0298) (0.0298) (0.0340) (0.0338)
School Reopened in a Different Sector 0.943*** 0.938*** 0.967*** 0.983***From Prior Year (0.0126) (0.0135) (0.0288) (0.0330)Constant -0.222 -0.393 -0.318 -0.851 -2.336* -2.245* -4.269+ -4.745*
(0.5940) (0.6270) (1.9720) (1.9390) (1.0420) (1.0320) (2.2100) (2.1520)
Observations 5,859 5,859 1,890 1,890 4,472 4,472 1,382 1,382R-squared 0.051 0.050 0.086 0.085 0.353 0.353 0.297 0.301Adjusted R-squared 0.025 0.024 0.034 0.032 0.331 0.330 0.240 0.245

Partnership Turnaround: Year Two Report Appendix B | October 2020
242242
Sample
DPSCD Cohort 1 Partnership Schools
and DPSCD 16-17 Priority Schools
DPSCD Cohort 1 Partnership Schools
and DPSCD 16-17 Priority Schools
DPSCD Cohort 1 Partnership Schools
and DPSCD 16-17 Priority Schools
DPSCD Cohort 1 Partnership Schools
and DPSCD 16-17 Priority Schools
DPSCD Cohort 1 Partnership Schools
and DPSCD 16-17 Priority Schools
DPSCD Cohort 1 Partnership Schools
and DPSCD 16-17 Priority Schools
(9) (10) (11) (12) (13) (14)
Outcome Probability of Transferring Within District Probability of Being Rated Minimally Effective or Ineffective
Reference Year in Event Study Model 15-16 16-17 15-16 16-17 15-16 16-17Teacher Experience Group All All 1st-5th 1st-5th All AllPriority School 2013-14 -0.021 -0.016 0.103 0.093 -0.0423* -0.0320+
(0.0347) (0.0304) (0.0902) (0.0880) (0.0198) (0.0179)Priority School 2014-15 -0.015 -0.020 0.041 0.023 -0.022 -0.007
(0.0261) (0.0226) (0.0807) (0.0865) (0.0175) (0.0176)Priority School 2015-16 -0.0605* -0.0756+ 0.01
(0.0257) (0.0421) (0.0249)Priority School 2016-17 -0.0222 -0.0132 -0.0495*
(0.0307) (0.0484) (0.0226)Priority School 2017-18 -0.0463 -0.0408 -0.0267 -0.0391 -0.0485+ -0.0344+
(0.0375) (0.0297) (0.0607) (0.0562) (0.0256) (0.0176)Priority School 2018-19 0.158 0.162 0.278* 0.266* -0.076** -0.058**
(0.1310) (0.1260) (0.1230) (0.1250) (0.0234) (0.0184)Partnership School 2013-14 -0.019 -0.046 -0.093 -0.079 -0.016 0.030
(0.0420) (0.0382) (0.0991) (0.0937) (0.0278) (0.0235)Partnership School 2014-15 0.0734+ 0.052 0.020 0.042 0.017 0.065
(0.0424) (0.0470) (0.0928) (0.0935) (0.0342) (0.0444)Partnership School 2015-16 0.008 0.092+ 0.106**
(0.0259) (0.0532) (0.0388)Partnership School 2016-17 0.047 0.008 -0.022
(0.0482) (0.0625) (0.0330)Partnership School 2017-18 0.040 0.011 0.069 0.094 0.009 0.0625*
(0.0421) (0.0403) (0.0755) (0.0706) (0.0328) (0.0264)Partnership School 2018-19 -0.136 -0.161 -0.200+ -0.175 -0.043 0.005
(0.1230) (0.1230) (0.1190) (0.1260) (0.0260) (0.0221)School-level: % Non-White Students 2.822 2.914 5.080 5.530 -0.408 -0.108
(3.3420) (3.3780) (3.6540) (3.6300) (1.3790) (1.3640)School-level: % Black Students 0.634 0.980 3.312 3.628 0.282 0.191
(1.8450) (1.8680) (2.5220) (2.6110) (1.0070) (0.9840)School-level: % Hispanic Students 0.519 0.944 1.333 1.417 0.137 -0.505
(1.9520) (1.8740) (3.0170) (2.8710) (1.2300) (1.3060)School-level: % Economically 0.300 0.117 0.223 0.114 0.232* 0.333*Disadvantaged Students (0.1980) (0.2150) (0.2670) (0.2830) (0.1080) (0.1510)School-level: % English Language -0.737 -0.786 -1.411* -1.536** -0.700** -0.472**Learner Students (0.6580) (0.6100) (0.6750) (0.5480) (0.2380) (0.1570)School-level: % Students Receiving 0.473 0.527 0.234 0.200 -0.557+ -0.652*Special Education Services (0.4490) (0.4470) (0.4410) (0.4360) (0.3050) (0.2960)Log of Student Enrollment -0.032 -0.063 -0.031 -0.019 -0.085* -0.015
(0.0570) (0.0619) (0.0588) (0.0605) (0.0409) (0.0314)Teacher: Male 0.004 0.004 -0.004 -0.003 0.031** 0.030**
(0.0097) (0.0096) (0.0186) (0.0185) (0.0113) (0.0112)Teacher: Black 0.008 0.008 0.026 0.025 0.022+ 0.020+
(0.0131) (0.0131) (0.0313) (0.0316) (0.0111) (0.0109)Teacher: Hispanic -0.039* -0.040* -0.014 -0.011 -0.001 0.000
(0.0173) (0.0178) (0.0384) (0.0385) (0.0186) (0.0186)Teacher: Non-White 0.014 0.014 0.038 0.038 -0.008 -0.005
(0.0192) (0.0192) (0.0491) (0.0493) (0.0177) (0.0175)Teacher: Years of Experience -0.001 -0.001 -0.035*** -0.032***
(0.0009) (0.0008) (0.0089) (0.0088)Teacher: Master's Degree or Higher -0.010 -0.011 -0.028 -0.027 -0.001 -0.001
(0.0119) (0.0118) (0.0225) (0.0227) (0.0006) (0.0006)School Moved Location -0.038 -0.043 -0.046 -0.050
(0.0300) (0.0317) (0.0364) (0.0366)School Moved Districts -0.069 -0.077* -0.006 -0.002
(0.0459) (0.0344) (0.0467) (0.0379)School Grade Levels Offered Changed
School Closed After End of School Year andReopened in a Different SectorSchool Reopened in Same District
School Consolidated After End 0.940*** 0.943*** 1.000*** 1.001***of School Year (0.1030) (0.0978) (0.1150) (0.1150)School Reopened as Combined School
School Reopened as Split of Closed School
School Split Off From Existing School
School Reopened in a Different SectorFrom Prior YearConstant -0.572 -0.549 -2.965 -3.226 0.374 -0.064
(1.8670) (1.8410) (2.5460) (2.6070) (1.0200) (0.9550)
Observations 4,625 4,625 1,337 1,337 5,412 5,412R-squared 0.116 0.117 0.159 0.160 0.101 0.109Adjusted R-squared 0.096 0.098 0.107 0.108 0.076 0.084
Note: Robust standard errors in parentheses. All models include school fixed effects. *** p<0.001, ** p<0.01, * p<0.05, + p<0.10
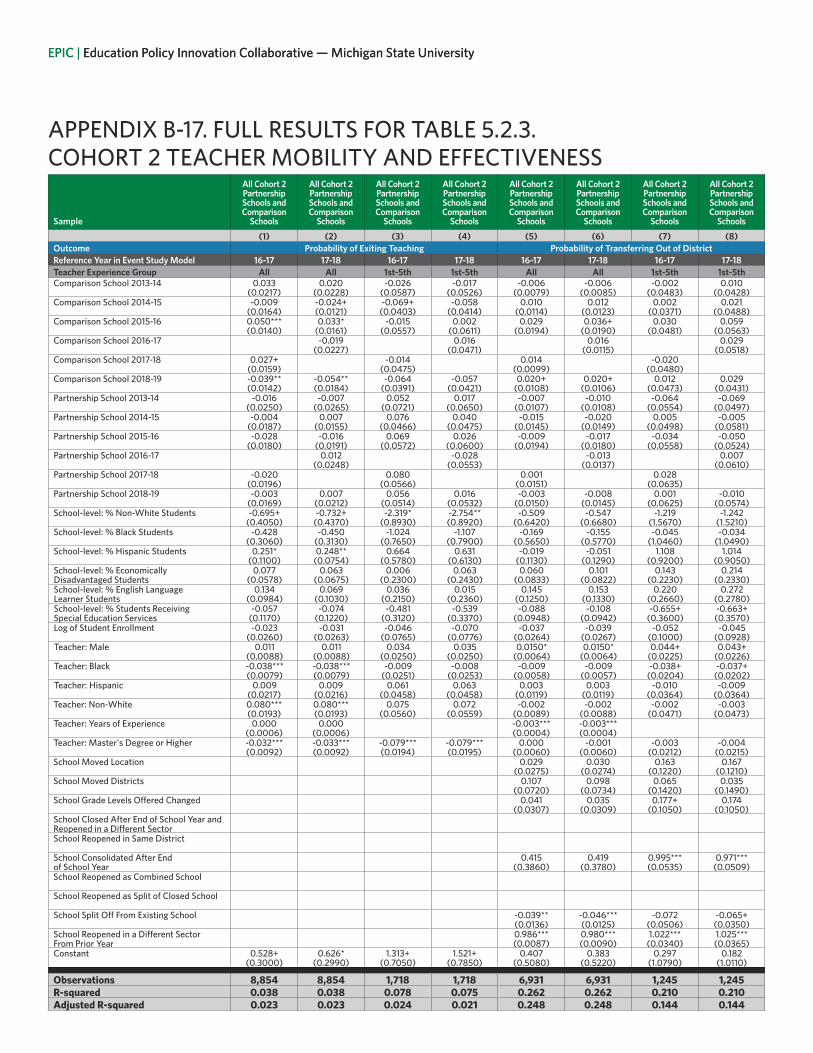
EPIC | Education Policy Innovation Collaborative — Michigan State University
243
EPIC | Education Policy Innovation Collaborative — Michigan State University
APPENDIX B-17. FULL RESULTS FOR TABLE 5.2.3. COHORT 2 TEACHER MOBILITY AND EFFECTIVENESS
Sample
All Cohort 2 Partnership Schools and Comparison
Schools
All Cohort 2 Partnership Schools and Comparison
Schools
All Cohort 2 Partnership Schools and Comparison
Schools
All Cohort 2 Partnership Schools and Comparison
Schools
All Cohort 2 Partnership Schools and Comparison
Schools
All Cohort 2 Partnership Schools and Comparison
Schools
All Cohort 2 Partnership Schools and Comparison
Schools
All Cohort 2 Partnership Schools and Comparison
Schools(1) (2) (3) (4) (5) (6) (7) (8)
Outcome Probability of Exiting Teaching Probability of Transferring Out of DistrictReference Year in Event Study Model 16-17 17-18 16-17 17-18 16-17 17-18 16-17 17-18Teacher Experience Group All All 1st-5th 1st-5th All All 1st-5th 1st-5thComparison School 2013-14 0.033 0.020 -0.026 -0.017 -0.006 -0.006 -0.002 0.010
(0.0217) (0.0228) (0.0587) (0.0526) (0.0079) (0.0085) (0.0483) (0.0428)Comparison School 2014-15 -0.009 -0.024+ -0.069+ -0.058 0.010 0.012 0.002 0.021
(0.0164) (0.0121) (0.0403) (0.0414) (0.0114) (0.0123) (0.0371) (0.0488)Comparison School 2015-16 0.050*** 0.033* -0.015 0.002 0.029 0.036+ 0.030 0.059
(0.0140) (0.0161) (0.0557) (0.0611) (0.0194) (0.0190) (0.0481) (0.0563)Comparison School 2016-17 -0.019 0.016 0.016 0.029
(0.0227) (0.0471) (0.0115) (0.0518)Comparison School 2017-18 0.027+ -0.014 0.014 -0.020
(0.0159) (0.0475) (0.0099) (0.0480)Comparison School 2018-19 -0.039** -0.054** -0.064 -0.057 0.020+ 0.020+ 0.012 0.029
(0.0142) (0.0184) (0.0391) (0.0421) (0.0108) (0.0106) (0.0473) (0.0431)Partnership School 2013-14 -0.016 -0.007 0.052 0.017 -0.007 -0.010 -0.064 -0.069
(0.0250) (0.0265) (0.0721) (0.0650) (0.0107) (0.0108) (0.0554) (0.0497)Partnership School 2014-15 -0.004 0.007 0.076 0.040 -0.015 -0.020 0.005 -0.005
(0.0187) (0.0155) (0.0466) (0.0475) (0.0145) (0.0149) (0.0498) (0.0581)Partnership School 2015-16 -0.028 -0.016 0.069 0.026 -0.009 -0.017 -0.034 -0.050
(0.0180) (0.0191) (0.0572) (0.0600) (0.0194) (0.0180) (0.0558) (0.0524)Partnership School 2016-17 0.012 -0.028 -0.013 0.007
(0.0248) (0.0553) (0.0137) (0.0610)Partnership School 2017-18 -0.020 0.080 0.001 0.028
(0.0196) (0.0566) (0.0151) (0.0635)Partnership School 2018-19 -0.003 0.007 0.056 0.016 -0.003 -0.008 0.001 -0.010
(0.0169) (0.0212) (0.0514) (0.0532) (0.0150) (0.0145) (0.0625) (0.0574)School-level: % Non-White Students -0.695+ -0.732+ -2.319* -2.754** -0.509 -0.547 -1.219 -1.242
(0.4050) (0.4370) (0.8930) (0.8920) (0.6420) (0.6680) (1.5670) (1.5210)School-level: % Black Students -0.428 -0.450 -1.024 -1.107 -0.169 -0.155 -0.045 -0.034
(0.3060) (0.3130) (0.7650) (0.7900) (0.5650) (0.5770) (1.0460) (1.0490)School-level: % Hispanic Students 0.251* 0.248** 0.664 0.631 -0.019 -0.051 1.108 1.014
(0.1100) (0.0754) (0.5780) (0.6130) (0.1130) (0.1290) (0.9200) (0.9050)School-level: % Economically 0.077 0.063 0.006 0.063 0.060 0.101 0.143 0.214Disadvantaged Students (0.0578) (0.0675) (0.2300) (0.2430) (0.0833) (0.0822) (0.2230) (0.2330)School-level: % English Language 0.134 0.069 0.036 0.015 0.145 0.153 0.220 0.272Learner Students (0.0984) (0.1030) (0.2150) (0.2360) (0.1250) (0.1330) (0.2660) (0.2780)School-level: % Students Receiving -0.057 -0.074 -0.481 -0.539 -0.088 -0.108 -0.655+ -0.663+Special Education Services (0.1170) (0.1220) (0.3120) (0.3370) (0.0948) (0.0942) (0.3600) (0.3570)Log of Student Enrollment -0.023 -0.031 -0.046 -0.070 -0.037 -0.039 -0.052 -0.045
(0.0260) (0.0263) (0.0765) (0.0776) (0.0264) (0.0267) (0.1000) (0.0928)Teacher: Male 0.011 0.011 0.034 0.035 0.0150* 0.0150* 0.044+ 0.043+
(0.0088) (0.0088) (0.0250) (0.0250) (0.0064) (0.0064) (0.0225) (0.0226)Teacher: Black -0.038*** -0.038*** -0.009 -0.008 -0.009 -0.009 -0.038+ -0.037+
(0.0079) (0.0079) (0.0251) (0.0253) (0.0058) (0.0057) (0.0204) (0.0202)Teacher: Hispanic 0.009 0.009 0.061 0.063 0.003 0.003 -0.010 -0.009
(0.0217) (0.0216) (0.0458) (0.0458) (0.0119) (0.0119) (0.0364) (0.0364)Teacher: Non-White 0.080*** 0.080*** 0.075 0.072 -0.002 -0.002 -0.002 -0.003
(0.0193) (0.0193) (0.0560) (0.0559) (0.0089) (0.0088) (0.0471) (0.0473)Teacher: Years of Experience 0.000 0.000 -0.003*** -0.003***
(0.0006) (0.0006) (0.0004) (0.0004)Teacher: Master's Degree or Higher -0.032*** -0.033*** -0.079*** -0.079*** 0.000 -0.001 -0.003 -0.004
(0.0092) (0.0092) (0.0194) (0.0195) (0.0060) (0.0060) (0.0212) (0.0215)School Moved Location 0.029 0.030 0.163 0.167
(0.0275) (0.0274) (0.1220) (0.1210)School Moved Districts 0.107 0.098 0.065 0.035
(0.0720) (0.0734) (0.1420) (0.1490)School Grade Levels Offered Changed 0.041 0.035 0.177+ 0.174
(0.0307) (0.0309) (0.1050) (0.1050)School Closed After End of School Year andReopened in a Different SectorSchool Reopened in Same District
School Consolidated After End 0.415 0.419 0.995*** 0.971***of School Year (0.3860) (0.3780) (0.0535) (0.0509)School Reopened as Combined School
School Reopened as Split of Closed School
School Split Off From Existing School -0.039** -0.046*** -0.072 -0.065+(0.0136) (0.0125) (0.0506) (0.0350)
School Reopened in a Different Sector 0.986*** 0.980*** 1.022*** 1.025***From Prior Year (0.0087) (0.0090) (0.0340) (0.0365)Constant 0.528+ 0.626* 1.313+ 1.521+ 0.407 0.383 0.297 0.182
(0.3000) (0.2990) (0.7050) (0.7850) (0.5080) (0.5220) (1.0790) (1.0110)
Observations 8,854 8,854 1,718 1,718 6,931 6,931 1,245 1,245R-squared 0.038 0.038 0.078 0.075 0.262 0.262 0.210 0.210Adjusted R-squared 0.023 0.023 0.024 0.021 0.248 0.248 0.144 0.144

Partnership Turnaround: Year Two Report Appendix B | October 2020
244244
Sample
All Cohort 2 Partnership Schools
and Comparison Schools
All Cohort 2 Partnership Schools
and Comparison Schools
All Cohort 2 Partnership Schools
and Comparison Schools
All Cohort 2 Partnership Schools
and Comparison Schools
All Cohort 2 Partnership Schools
and Comparison Schools
All Cohort 2 Partnership Schools
and Comparison Schools
(9) (10) (11) (12) (13) (14)
Outcome Probability of Transferring Within District Probability of Being Rated Minimally Effective or Ineffective
Reference Year in Event Study Model 16-17 17-18 16-17 17-18 16-17 17-18Teacher Experience Group All All 1st-5th 1st-5th All AllPriority School 2013-14 -0.003 0.001 0.066 0.092 -0.008 -0.006
(0.0190) (0.0220) (0.0731) (0.0816) (0.0100) (0.0121)Priority School 2014-15 -0.020 -0.020 0.003 0.037 0.003 0.007
(0.0212) (0.0252) (0.0727) (0.0713) (0.0126) (0.0165)Priority School 2015-16 -0.015 -0.018 -0.080 -0.035 0.018 0.025
(0.0215) (0.0273) (0.0492) (0.0566) (0.0154) (0.0192)Priority School 2016-17 -0.015 0.068 0.010
(0.0197) (0.0669) (0.0147)Priority School 2017-18 -0.021 -0.024 0.001
(0.0192) (0.0593) (0.0255)Priority School 2018-19 0.108 0.109 0.121 0.154 -0.013 -0.011
(0.0938) (0.1000) (0.1240) (0.1320) (0.0154) (0.0090)Partnership School 2013-14 -0.020 -0.034 -0.093 -0.109 0.009 0.006
(0.0249) (0.0285) (0.0807) (0.0882) (0.0133) (0.0157)Partnership School 2014-15 0.004 -0.009 -0.028 -0.049 0.010 0.006
(0.0292) (0.0320) (0.0804) (0.0812) (0.0214) (0.0245)Partnership School 2015-16 0.034 0.023 0.113* 0.084 -0.002 -0.007
(0.0248) (0.0275) (0.0556) (0.0618) (0.0202) (0.0228)Partnership School 2016-17 -0.003 -0.043 -0.004
(0.0219) (0.0852) (0.0166)Partnership School 2017-18 0.042+ 0.012 0.005
(0.0246) (0.0701) (0.0254)Partnership School 2018-19 -0.041 -0.054 0.034 0.012 -0.008 -0.011
(0.0981) (0.1030) (0.1330) (0.1410) (0.0164) (0.0127)School-level: % Non-White Students 1.247 1.167 3.821+ 4.002* 0.621 0.598
(1.1690) (1.1720) (1.9800) (1.9550) (0.4940) (0.4830)School-level: % Black Students 0.574 0.489 0.797 0.932 0.419 0.417
(0.8890) (0.9100) (1.2470) (1.2570) (0.4800) (0.4800)School-level: % Hispanic Students -0.006 0.020 1.742* 1.716* 0.064 0.038
(0.2210) (0.2440) (0.7600) (0.8090) (0.1400) (0.1140)School-level: % Economically 0.075 0.044 0.018 0.089 0.055 0.088Disadvantaged Students (0.1040) (0.1160) (0.1730) (0.1850) (0.0658) (0.0734)School-level: % English Language 0.004 -0.020 -0.619 -0.489 0.176 0.193Learner Students (0.4920) (0.4670) (0.6390) (0.5990) (0.1850) (0.2000)School-level: % Students Receiving 0.322 0.317 0.296 0.303 0.072 0.060Special Education Services (0.2230) (0.2300) (0.4520) (0.4500) (0.2250) (0.2190)Log of Student Enrollment 0.018 0.008 -0.081 -0.064 0.037 0.038
(0.0568) (0.0583) (0.1330) (0.1190) (0.0338) (0.0336)Teacher: Male 0.006 0.006 0.000 0.000 0.057*** 0.057***
(0.0090) (0.0089) (0.0260) (0.0261) (0.0105) (0.0105)Teacher: Black 0.019+ 0.019+ 0.020 0.021 0.007 0.007
(0.0094) (0.0094) (0.0227) (0.0225) (0.0067) (0.0067)Teacher: Hispanic -0.056** -0.056** -0.104** -0.102** -0.049+ -0.049+
(0.0177) (0.0176) (0.0316) (0.0306) (0.0249) (0.0248)Teacher: Non-White 0.017 0.017 -0.065+ -0.065+ 0.022+ 0.022+
(0.0164) (0.0164) (0.0378) (0.0377) (0.0127) (0.0125)Teacher: Years of Experience -0.002* -0.002* -0.004 -0.004
(0.0006) (0.0006) (0.0081) (0.0080)Teacher: Master's Degree or Higher -0.009 -0.009 -0.005 -0.005 -0.001* -0.001*
(0.0101) (0.0102) (0.0230) (0.0230) (0.0005) (0.0005)School Moved Location -0.026 -0.028 0.271** 0.272**
(0.0340) (0.0339) (0.0795) (0.0796)School Moved Districts -0.127*** -0.123*** -0.096** -0.108*
(0.0133) (0.0169) (0.0349) (0.0508)School Grade Levels Offered Changed -0.062 -0.060 -0.138+ -0.141+
(0.0606) (0.0594) (0.0776) (0.0794)School Closed After End of School Year andReopened in a Different SectorSchool Reopened in Same District
School Consolidated After End 0.888*** 0.892*** 1.106*** 1.114***of School Year (0.0654) (0.0656) (0.0986) (0.1030)School Reopened as Combined School
School Reopened as Split of Closed School
School Split Off From Existing School -0.047 -0.062 0.112 0.128(0.0391) (0.0402) (0.1010) (0.0900)
School Reopened in a Different Sector 0.822*** 0.814***From Prior Year (0.0209) (0.0227)Constant -0.615 -0.444 -0.302 -0.621 -0.647 -0.676
(0.8800) (0.9100) (1.3220) (1.2170) (0.4450) (0.4570)
Observations 7,388 7,388 1,280 1,280 7,103 7,103R-squared 0.056 0.056 0.136 0.136 0.068 0.068Adjusted R-squared 0.043 0.043 0.074 0.075 0.052 0.052
Note: Robust standard errors in parentheses. All models include school fixed effects. *** p<0.001, ** p<0.01, * p<0.05, + p<0.10

EPIC | Education Policy Innovation Collaborative — Michigan State University
245
EPIC | Education Policy Innovation Collaborative — Michigan State University
APPENDIX B-18. FULL RESULTS FOR TABLE 5.2.3. COHORT 2 DPSCD TEACHER MOBILITY AND EFFECTIVENESS
Sample
DPSCD Cohort 2 Partnership Schools and
DPSCD Cohort 2 Comparison
Schools
DPSCD Cohort 2 Partnership Schools and
DPSCD Cohort 2 Comparison
Schools
DPSCD Cohort 2 Partnership Schools and
DPSCD Cohort 2 Comparison
Schools
DPSCD Cohort 2 Partnership Schools and
DPSCD Cohort 2 Comparison
Schools
DPSCD Cohort 2 Partnership Schools and
DPSCD Cohort 2 Comparison
Schools
DPSCD Cohort 2 Partnership Schools and
DPSCD Cohort 2 Comparison
Schools
DPSCD Cohort 2 Partnership Schools and
DPSCD Cohort 2 Comparison
Schools
DPSCD Cohort 2 Partnership Schools and
DPSCD Cohort 2 Comparison
Schools(1) (2) (3) (4) (5) (6) (7) (8)
Outcome Probability of Exiting Teaching Probability of Transferring Out of DistrictReference Year in Event Study Model 16-17 17-18 16-17 17-18 16-17 17-18 16-17 17-18Teacher Experience Group All All 1st-5th 1st-5th All All 1st-5th 1st-5thComparison School 2013-14 0.015* 0.010 0.007 0.008 -0.017+ -0.014+ -0.019 -0.009
(0.0068) (0.0071) (0.0098) (0.0102) (0.0087) (0.0083) (0.0156) (0.0149)Comparison School 2014-15 0.012+ 0.007 0.004 0.005 -0.010 -0.006 -0.003 0.010
(0.0069) (0.0076) (0.0096) (0.0108) (0.0112) (0.0104) (0.0182) (0.0160)Comparison School 2015-16 0.002 -0.004 -0.001 0.000 -0.005 0.001 0.001 0.015
(0.0064) (0.0071) (0.0092) (0.0103) (0.0127) (0.0117) (0.0200) (0.0195)Comparison School 2016-17 -0.005 0.010 0.029* 0.054*
(0.0080) (0.0112) (0.0144) (0.0218)Comparison School 2017-18 0.013+ 0.011 0.0199+ 0.024
(0.0077) (0.0101) (0.0105) (0.0176)Comparison School 2018-19 -0.063*** -0.070*** -0.070*** -0.070*** 0.020 0.0219+ 0.046* 0.056**
(0.0052) (0.0055) (0.0089) (0.0100) (0.0125) (0.0124) (0.0220) (0.0209)Partnership School 2013-14 0.003 0.003 -0.012 -0.022 0.023+ 0.019 0.020 0.015
(0.0123) (0.0128) (0.0200) (0.0221) (0.0124) (0.0133) (0.0283) (0.0277)Partnership School 2014-15 -0.014 -0.014 0.015 0.005 0.017 0.013 0.026 0.021
(0.0109) (0.0116) (0.0187) (0.0206) (0.0155) (0.0155) (0.0356) (0.0346)Partnership School 2015-16 0.006 0.006 0.037* 0.026 0.031+ 0.027 0.039 0.035
(0.0111) (0.0109) (0.0179) (0.0182) (0.0186) (0.0179) (0.0375) (0.0367)Partnership School 2016-17 0.000 -0.007 0.007 0.030
(0.0113) (0.0205) (0.0186) (0.0336)Partnership School 2017-18 0.000 0.026 0.023 0.051
(0.0114) (0.0200) (0.0167) (0.0334)Partnership School 2018-19 0.015 0.015 0.036+ 0.024 0.054** 0.048* 0.065 0.056
(0.0092) (0.0096) (0.0206) (0.0194) (0.0206) (0.0194) (0.0406) (0.0354)School-level: % Non-White Students -0.164 -0.145 -0.258 -0.268 0.099 0.059 0.349 0.252
(0.1080) (0.1090) (0.1740) (0.1750) (0.1770) (0.1720) (0.3330) (0.3310)School-level: % Black Students -0.130+ -0.111 -0.147 -0.137 0.086 0.092 0.180 0.176
(0.0766) (0.0754) (0.0962) (0.0965) (0.0729) (0.0705) (0.1410) (0.1400)School-level: % Hispanic Students -0.070 -0.065 -0.287+ -0.282+ 0.123 0.123 0.159 0.185
(0.1330) (0.1260) (0.1550) (0.1550) (0.1550) (0.1580) (0.3240) (0.3310)School-level: % Economically -0.004 0.004 0.067 0.100+ -0.073 0.008 -0.109 0.012Disadvantaged Students (0.0381) (0.0398) (0.0561) (0.0587) (0.0661) (0.0607) (0.1280) (0.1130)School-level: % English Language 0.008 0.025 -0.014 -0.012 0.167* 0.149+ 0.296** 0.250*Learner Students (0.0583) (0.0593) (0.0876) (0.0889) (0.0776) (0.0793) (0.1100) (0.1150)School-level: % Students Receiving 0.012 0.019 -0.045 -0.051 0.109 0.085 0.227 0.195Special Education Services (0.0824) (0.0819) (0.1250) (0.1250) (0.0905) (0.0896) (0.2090) (0.2060)Log of Student Enrollment -0.004 -0.008 0.007 0.005 -0.039+ -0.037 -0.017 -0.015
(0.0120) (0.0124) (0.0195) (0.0200) (0.0234) (0.0235) (0.0369) (0.0360)Teacher: Male 0.006 0.007 0.017** 0.017** 0.013** 0.013** 0.008 0.008
(0.0040) (0.0040) (0.0061) (0.0061) (0.0045) (0.0045) (0.0091) (0.0091)Teacher: Black -0.026*** -0.026*** -0.013 -0.013 -0.013* -0.013* -0.035*** -0.034***
(0.0045) (0.0045) (0.0093) (0.0094) (0.0053) (0.0053) (0.0100) (0.0100)Teacher: Hispanic 0.001 0.002 0.013 0.013 0.022 0.022 0.043 0.043
(0.0126) (0.0126) (0.0204) (0.0204) (0.0136) (0.0136) (0.0280) (0.0282)Teacher: Non-White 0.083*** 0.083*** 0.073*** 0.073*** -0.019* -0.019* -0.048** -0.049**
(0.0114) (0.0114) (0.0159) (0.0159) (0.0075) (0.0076) (0.0168) (0.0168)Teacher: Years of Experience 0.001** 0.001*** -0.003*** -0.003***
(0.0004) (0.0004) (0.0003) (0.0003)Teacher: Master's Degree or Higher -0.014*** -0.015*** -0.012+ -0.012+ 0.004 0.003 0.008 0.008
(0.0040) (0.0040) (0.0065) (0.0065) (0.0048) (0.0048) (0.0086) (0.0085)School Moved Location 0.047+ 0.050* 0.080* 0.080*
(0.0248) (0.0253) (0.0361) (0.0358)School Moved Districts 0.199*** 0.176** 0.215+ 0.150
(0.0562) (0.0616) (0.1150) (0.1250)School Grade Levels Offered Changed 0.0777*** 0.0771*** 0.128*** 0.129***
(0.0152) (0.0150) (0.0259) (0.0253)School Closed After End of School Year and 0.011 0.019 -0.127 -0.103Reopened in a Different Sector (0.1720) (0.1700) (0.0842) (0.0888)School Reopened in Same District -0.123*** -0.130***
(0.0179) (0.0178)School Consolidated After End 0.344 0.343 0.901*** 0.860***of School Year (0.2590) (0.2490) (0.1190) (0.0985)School Reopened as Combined School 0.097* 0.098* 0.223*** 0.226***
(0.0489) (0.0484) (0.0607) (0.0576)School Reopened as Split of Closed School -0.032 -0.027 -0.152** -0.141**
(0.0406) (0.0404) (0.0520) (0.0503)School Split Off From Existing School 0.022 0.018 0.150 0.147
(0.0338) (0.0335) (0.1200) (0.1200)School Reopened in a Different Sector -0.113 -0.109 -0.134 -0.120From Prior Year (0.0732) (0.0715) (0.0870) (0.0839)Constant 0.218+ 0.221+ 0.147 0.123 0.304+ 0.225 0.123 0.006
(0.1120) (0.1150) (0.1620) (0.1670) (0.1700) (0.1700) (0.2790) (0.2720)
Observations 33,333 33,333 13,518 13,518 26,800 26,800 10,825 10,825R-squared 0.034 0.034 0.046 0.045 0.126 0.126 0.089 0.091Adjusted R-squared 0.024 0.023 0.023 0.023 0.114 0.114 0.062 0.063
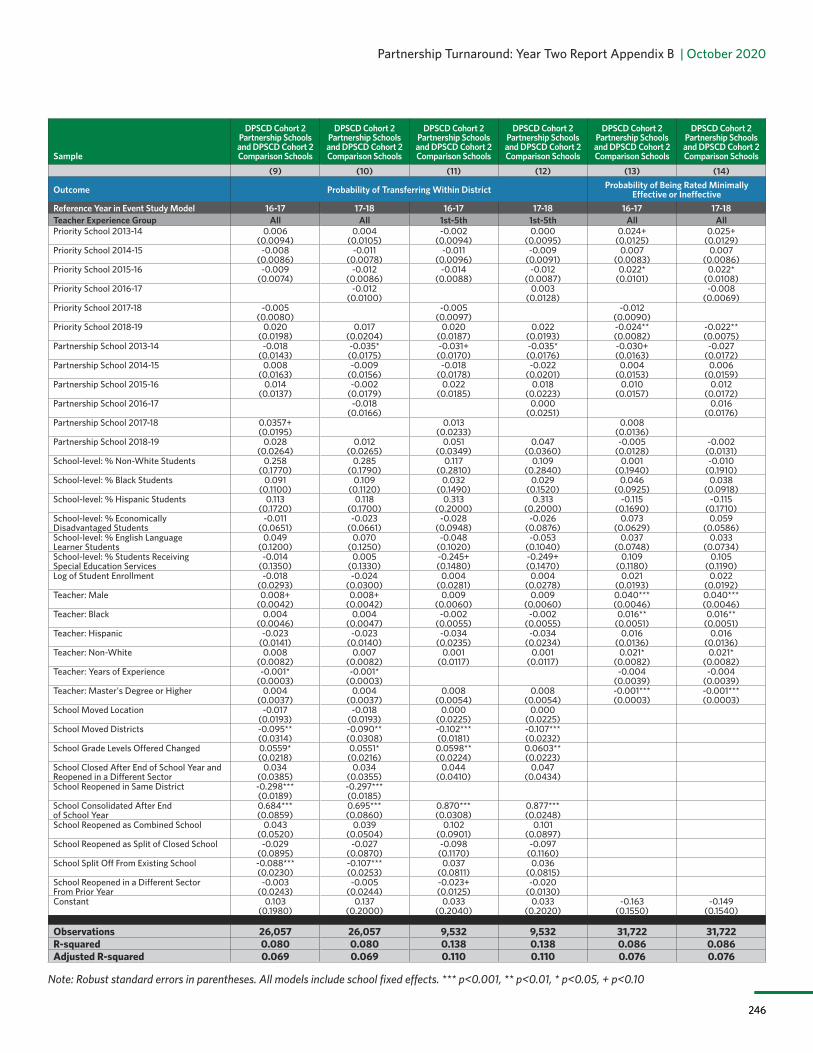
Partnership Turnaround: Year Two Report Appendix B | October 2020
246246
Note: Robust standard errors in parentheses. *** p<0.001, ** p<0.01, * p<0.05, + p<0.10
Sample
DPSCD Cohort 2 Partnership Schools and DPSCD Cohort 2 Comparison Schools
DPSCD Cohort 2 Partnership Schools and DPSCD Cohort 2 Comparison Schools
DPSCD Cohort 2 Partnership Schools and DPSCD Cohort 2 Comparison Schools
DPSCD Cohort 2 Partnership Schools and DPSCD Cohort 2 Comparison Schools
DPSCD Cohort 2 Partnership Schools and DPSCD Cohort 2 Comparison Schools
DPSCD Cohort 2 Partnership Schools and DPSCD Cohort 2 Comparison Schools
(9) (10) (11) (12) (13) (14)
Outcome Probability of Transferring Within District Probability of Being Rated Minimally Effective or Ineffective
Reference Year in Event Study Model 16-17 17-18 16-17 17-18 16-17 17-18Teacher Experience Group All All 1st-5th 1st-5th All AllPriority School 2013-14 0.006 0.004 -0.002 0.000 0.024+ 0.025+
(0.0094) (0.0105) (0.0094) (0.0095) (0.0125) (0.0129)Priority School 2014-15 -0.008 -0.011 -0.011 -0.009 0.007 0.007
(0.0086) (0.0078) (0.0096) (0.0091) (0.0083) (0.0086)Priority School 2015-16 -0.009 -0.012 -0.014 -0.012 0.022* 0.022*
(0.0074) (0.0086) (0.0088) (0.0087) (0.0101) (0.0108)Priority School 2016-17 -0.012 0.003 -0.008
(0.0100) (0.0128) (0.0069)Priority School 2017-18 -0.005 -0.005 -0.012
(0.0080) (0.0097) (0.0090)Priority School 2018-19 0.020 0.017 0.020 0.022 -0.024** -0.022**
(0.0198) (0.0204) (0.0187) (0.0193) (0.0082) (0.0075)Partnership School 2013-14 -0.018 -0.035* -0.031+ -0.035* -0.030+ -0.027
(0.0143) (0.0175) (0.0170) (0.0176) (0.0163) (0.0172)Partnership School 2014-15 0.008 -0.009 -0.018 -0.022 0.004 0.006
(0.0163) (0.0156) (0.0178) (0.0201) (0.0153) (0.0159)Partnership School 2015-16 0.014 -0.002 0.022 0.018 0.010 0.012
(0.0137) (0.0179) (0.0185) (0.0223) (0.0157) (0.0172)Partnership School 2016-17 -0.018 0.000 0.016
(0.0166) (0.0251) (0.0176)Partnership School 2017-18 0.0357+ 0.013 0.008
(0.0195) (0.0233) (0.0136)Partnership School 2018-19 0.028 0.012 0.051 0.047 -0.005 -0.002
(0.0264) (0.0265) (0.0349) (0.0360) (0.0128) (0.0131)School-level: % Non-White Students 0.258 0.285 0.117 0.109 0.001 -0.010
(0.1770) (0.1790) (0.2810) (0.2840) (0.1940) (0.1910)School-level: % Black Students 0.091 0.109 0.032 0.029 0.046 0.038
(0.1100) (0.1120) (0.1490) (0.1520) (0.0925) (0.0918)School-level: % Hispanic Students 0.113 0.118 0.313 0.313 -0.115 -0.115
(0.1720) (0.1700) (0.2000) (0.2000) (0.1690) (0.1710)School-level: % Economically -0.011 -0.023 -0.028 -0.026 0.073 0.059Disadvantaged Students (0.0651) (0.0661) (0.0948) (0.0876) (0.0629) (0.0586)School-level: % English Language 0.049 0.070 -0.048 -0.053 0.037 0.033Learner Students (0.1200) (0.1250) (0.1020) (0.1040) (0.0748) (0.0734)School-level: % Students Receiving -0.014 0.005 -0.245+ -0.249+ 0.109 0.105Special Education Services (0.1350) (0.1330) (0.1480) (0.1470) (0.1180) (0.1190)Log of Student Enrollment -0.018 -0.024 0.004 0.004 0.021 0.022
(0.0293) (0.0300) (0.0281) (0.0278) (0.0193) (0.0192)Teacher: Male 0.008+ 0.008+ 0.009 0.009 0.040*** 0.040***
(0.0042) (0.0042) (0.0060) (0.0060) (0.0046) (0.0046)Teacher: Black 0.004 0.004 -0.002 -0.002 0.016** 0.016**
(0.0046) (0.0047) (0.0055) (0.0055) (0.0051) (0.0051)Teacher: Hispanic -0.023 -0.023 -0.034 -0.034 0.016 0.016
(0.0141) (0.0140) (0.0235) (0.0234) (0.0136) (0.0136)Teacher: Non-White 0.008 0.007 0.001 0.001 0.021* 0.021*
(0.0082) (0.0082) (0.0117) (0.0117) (0.0082) (0.0082)Teacher: Years of Experience -0.001* -0.001* -0.004 -0.004
(0.0003) (0.0003) (0.0039) (0.0039)Teacher: Master's Degree or Higher 0.004 0.004 0.008 0.008 -0.001*** -0.001***
(0.0037) (0.0037) (0.0054) (0.0054) (0.0003) (0.0003)School Moved Location -0.017 -0.018 0.000 0.000
(0.0193) (0.0193) (0.0225) (0.0225)School Moved Districts -0.095** -0.090** -0.102*** -0.107***
(0.0314) (0.0308) (0.0181) (0.0232)School Grade Levels Offered Changed 0.0559* 0.0551* 0.0598** 0.0603**
(0.0218) (0.0216) (0.0224) (0.0223)School Closed After End of School Year and 0.034 0.034 0.044 0.047Reopened in a Different Sector (0.0385) (0.0355) (0.0410) (0.0434)School Reopened in Same District -0.298*** -0.297***
(0.0189) (0.0185)School Consolidated After End 0.684*** 0.695*** 0.870*** 0.877***of School Year (0.0859) (0.0860) (0.0308) (0.0248)School Reopened as Combined School 0.043 0.039 0.102 0.101
(0.0520) (0.0504) (0.0901) (0.0897)School Reopened as Split of Closed School -0.029 -0.027 -0.098 -0.097
(0.0895) (0.0870) (0.1170) (0.1160)School Split Off From Existing School -0.088*** -0.107*** 0.037 0.036
(0.0230) (0.0253) (0.0811) (0.0815)School Reopened in a Different Sector -0.003 -0.005 -0.023+ -0.020From Prior Year (0.0243) (0.0244) (0.0125) (0.0130)Constant 0.103 0.137 0.033 0.033 -0.163 -0.149
(0.1980) (0.2000) (0.2040) (0.2020) (0.1550) (0.1540)
Observations 26,057 26,057 9,532 9,532 31,722 31,722R-squared 0.080 0.080 0.138 0.138 0.086 0.086Adjusted R-squared 0.069 0.069 0.110 0.110 0.076 0.076
Note: Robust standard errors in parentheses. All models include school fixed effects. *** p<0.001, ** p<0.01, * p<0.05, + p<0.10

EPIC
Education Policy Innovation Collaborative
MICHIGAN SATE UNIVERSITY236 Erickson Hall | 620 Farm LaneEast Lansing, MI 48824
(517) [email protected]
www.EPICedpolicy.msu.edu
RESEARCH WITH CONSEQUENCE