October 14 - Michigan Achieves Event Presentation
26
© 2015 THE EDUCATION TRUST-MIDWEST June 6, 2015 Collaborative Engagement Working Together on a Shared Goal of Making Michigan a Top 10 Education State State Leadership Retreat October 14, 2015
-
Upload
the-education-trust-midwest -
Category
Documents
-
view
171 -
download
0
description
October 14 - Michigan Achieves Event Presentation
Transcript of October 14 - Michigan Achieves Event Presentation

© 2015 THE EDUCATION TRUST-MIDWEST
June 6, 2015
Collaborative EngagementWorking Together on a Shared Goal of Making Michigan a
Top 10 Education State
State Leadership Retreat October 14, 2015
© 2015 THE EDUCATION TRUST-MIDWEST
Source:
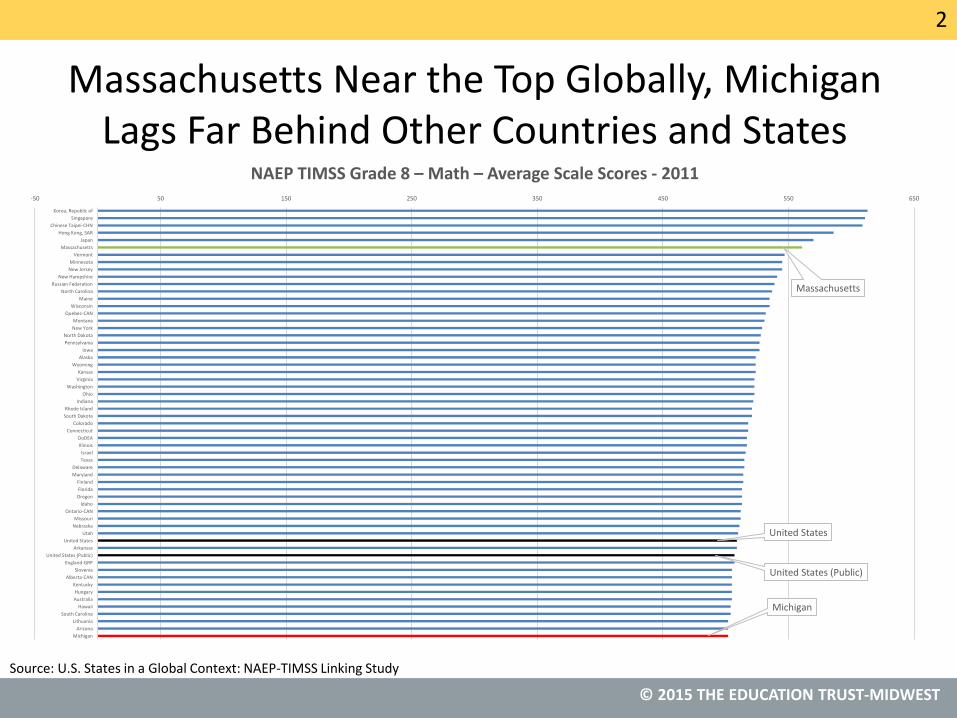
Massachusetts
United States
United States (Public)
Michigan
-50 50 150 250 350 450 550 650
Korea, Republic of
Singapore
Chinese Taipei-CHN
Hong Kong, SAR
Japan
Massachusetts
Vermont
Minnesota
New Jersey
New Hampshire
Russian Federation
North Carolina
Maine
Wisconsin
Quebec-CAN
Montana
New York
North Dakota
Pennsylvania
Iowa
Alaska
Wyoming
Kansas
Virginia
Washington
Ohio
Indiana
Rhode Island
South Dakota
Colorado
Connecticut
DoDEA
Illinois
Israel
Texas
Delaware
Maryland
Finland
Florida
Oregon
Idaho
Ontario-CAN
Missouri
Nebraska
Utah
United States
Arkansas
United States (Public)
England-GRP
Slovenia
Alberta-CAN
Kentucky
Hungary
Australia
Hawaii
South Carolina
Lithuania
Arizona
Michigan
NAEP TIMSS Grade 8 – Math – Average Scale Scores - 2011
Massachusetts Near the Top Globally, Michigan Lags Far Behind Other Countries and States
U.S. States in a Global Context: NAEP-TIMSS Linking Study
2
© 2015 THE EDUCATION TRUST-MIDWEST
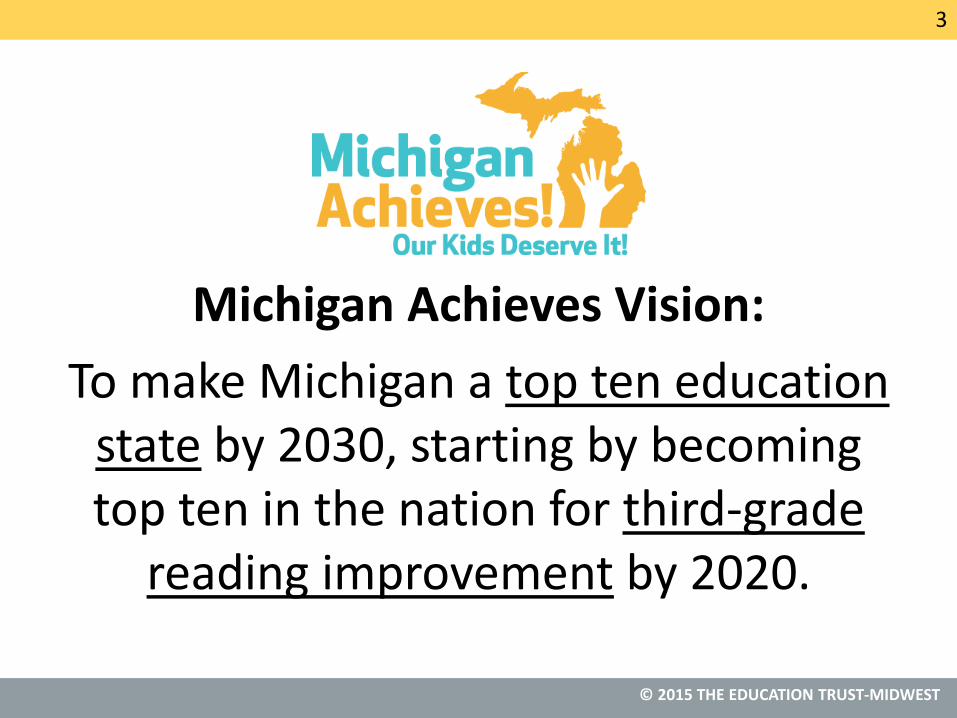
Michigan Achieves Vision:
To make Michigan a top ten education state by 2030, starting by becoming top ten in the nation for third-grade
reading improvement by 2020.
3
© 2015 THE EDUCATION TRUST-MIDWEST
Source:
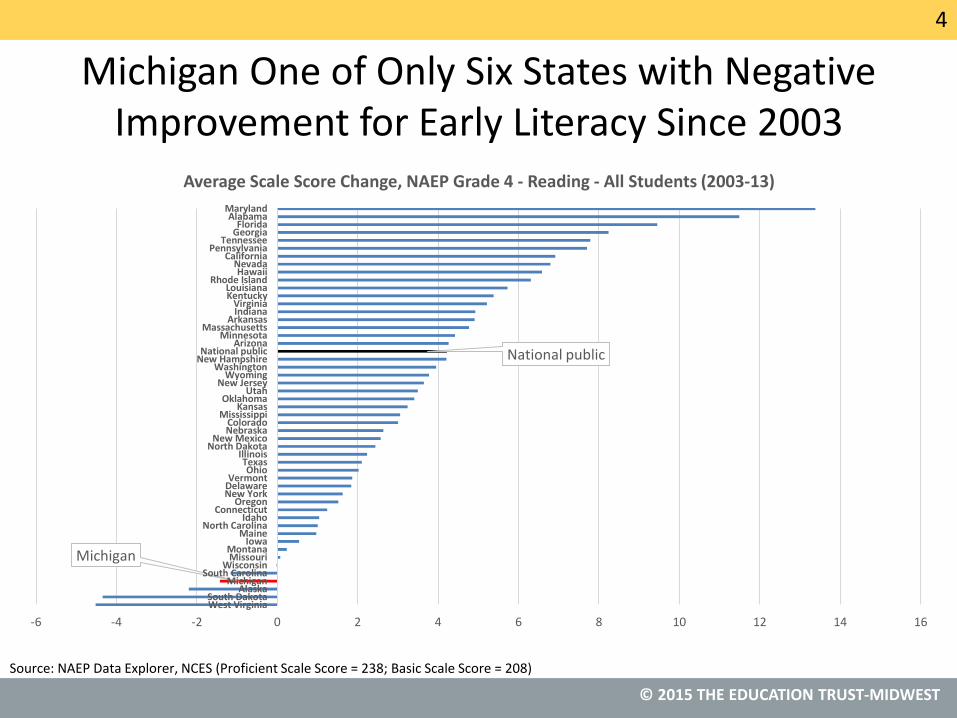
Michigan One of Only Six States with Negative Improvement for Early Literacy Since 2003
Michigan
National public
-6 -4 -2 0 2 4 6 8 10 12 14 16
West VirginiaSouth Dakota
AlaskaMichigan
South CarolinaWisconsin
MissouriMontana
IowaMaine
North CarolinaIdaho
ConnecticutOregon
New YorkDelawareVermont
OhioTexas
IllinoisNorth Dakota
New MexicoNebraskaColorado
MississippiKansas
OklahomaUtah
New JerseyWyoming
WashingtonNew HampshireNational public
ArizonaMinnesota
MassachusettsArkansas
IndianaVirginia
KentuckyLouisiana
Rhode IslandHawaii
NevadaCalifornia
PennsylvaniaTennessee
GeorgiaFlorida
AlabamaMaryland
Average Scale Score Change, NAEP Grade 4 - Reading - All Students (2003-13)
NAEP Data Explorer, NCES (Proficient Scale Score = 238; Basic Scale Score = 208)
4
© 2015 THE EDUCATION TRUST-MIDWEST
Source:
© 2014 THE EDUCATION TRUST-MIDWEST
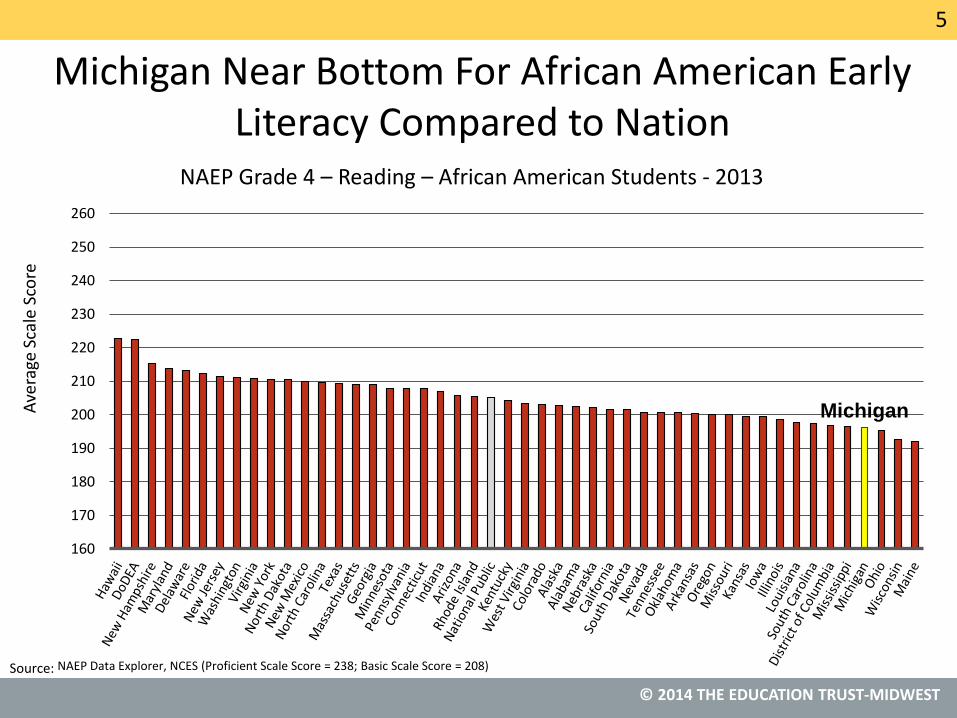
Michigan
160
170
180
190
200
210
220
230
240
250
260
Ave
rage
Sca
le S
core
NAEP Grade 4 – Reading – African American Students - 2013
NAEP Data Explorer, NCES (Proficient Scale Score = 238; Basic Scale Score = 208)
Michigan Near Bottom For African American Early Literacy Compared to Nation
5
© 2015 THE EDUCATION TRUST-MIDWEST
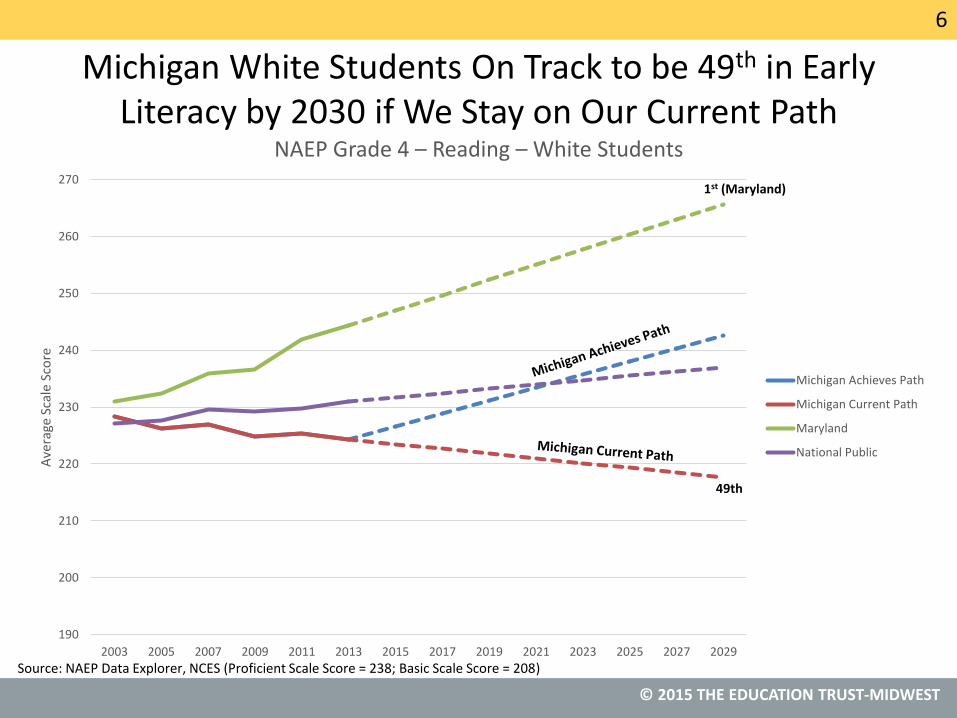
Michigan White Students On Track to be 49th in Early Literacy by 2030 if We Stay on Our Current Path
190
200
210
220
230
240
250
260
270
2003 2005 2007 2009 2011 2013 2015 2017 2019 2021 2023 2025 2027 2029
Ave
rage
Sca
le S
core
NAEP Grade 4 – Reading – White Students
Michigan Achieves Path
Michigan Current Path
Maryland
National Public
49th
Source: NAEP Data Explorer, NCES (Proficient Scale Score = 238; Basic Scale Score = 208)
1st (Maryland)
6
© 2015 THE EDUCATION TRUST-MIDWEST
Source:
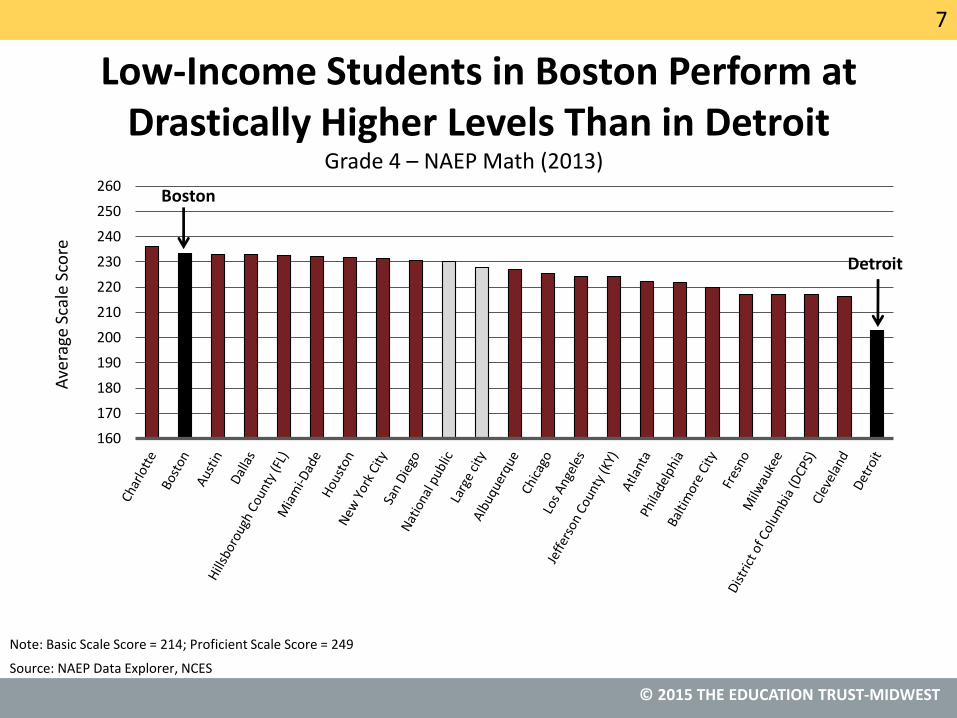
Low-Income Students in Boston Perform at Drastically Higher Levels Than in Detroit
160
170
180
190
200
210
220
230
240
250
260
Ave
rage
Sca
le S
core
Grade 4 – NAEP Math (2013)
NAEP Data Explorer, NCES
Note: Basic Scale Score = 214; Proficient Scale Score = 249
Detroit
Boston
7
© 2015 THE EDUCATION TRUST-MIDWEST
Source:
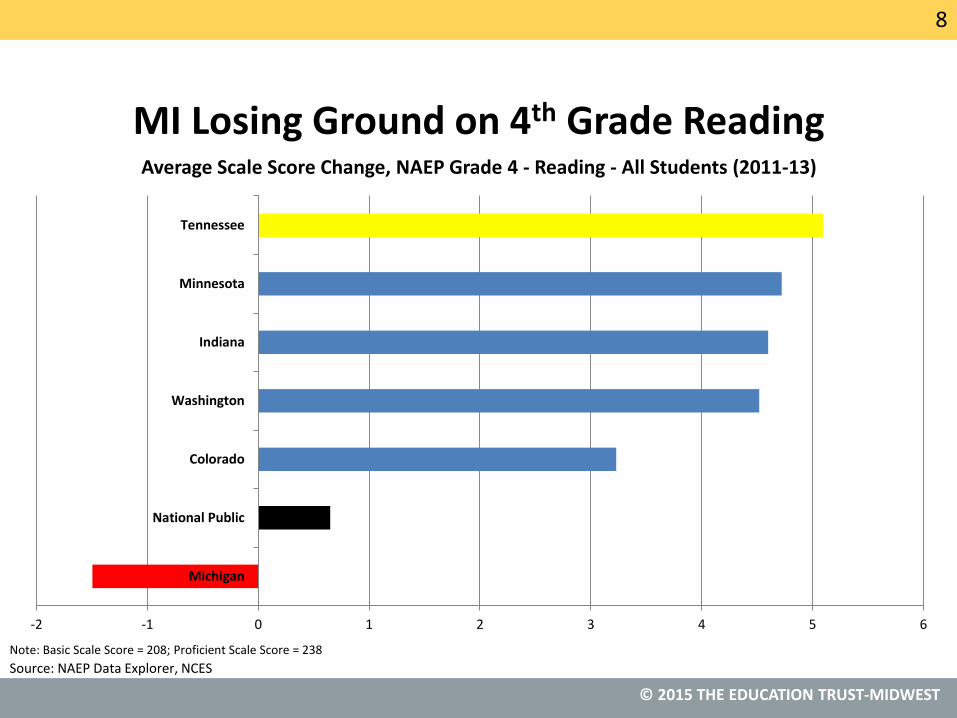
MI Losing Ground on 4th Grade Reading
Note: Basic Scale Score = 208; Proficient Scale Score = 238
NAEP Data Explorer, NCES
-2 -1 0 1 2 3 4 5 6
Michigan
National Public
Colorado
Washington
Indiana
Minnesota
Tennessee
Average Scale Score Change, NAEP Grade 4 - Reading - All Students (2011-13)
8

© 2015 THE EDUCATION TRUST-MIDWEST
Panelists
• Amber Arellano, Executive Director, The Education Trust-Midwest
• Sara Heyburn, Executive Director, Tennessee State Board of Education
• Marc Hill, Chief Policy Officer, Nashville Area Chamber of Commerce
• Paul Reville, Francis Keppel Professor of Practice of Educational Policy
and Administration, Harvard University’s Graduate School of Education
9
JOURNEY TOWARD EQUITYAND EXCELLENCE
THE MASSACHUSETTSEXPERIENCE
PAUL REVILLE
Francis Keppel Professor o f Pract ice and Educat iona l Po l icy and Admin is t ra t ion
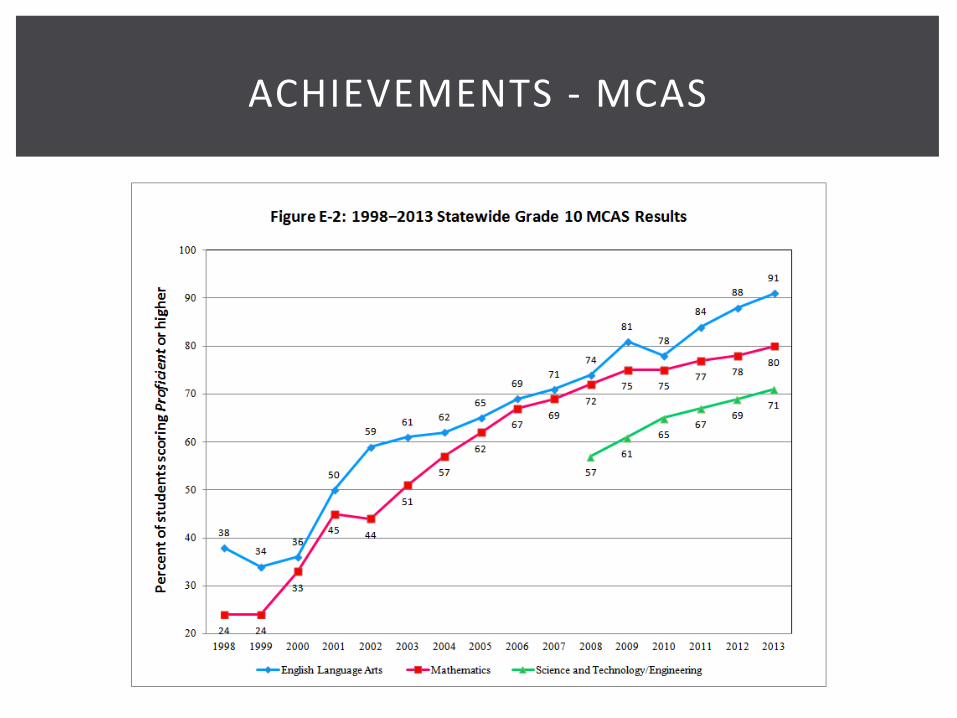
ACHIEVEMENTS - MCAS
In NAEP Reading and Math tests (4 th and 8th
grades), administered in 2005, 2009, 2011, and 2013, Massachusetts was 1st or tied for 1st on all four tests each year.
ACHIEVEMENTS - NAEP
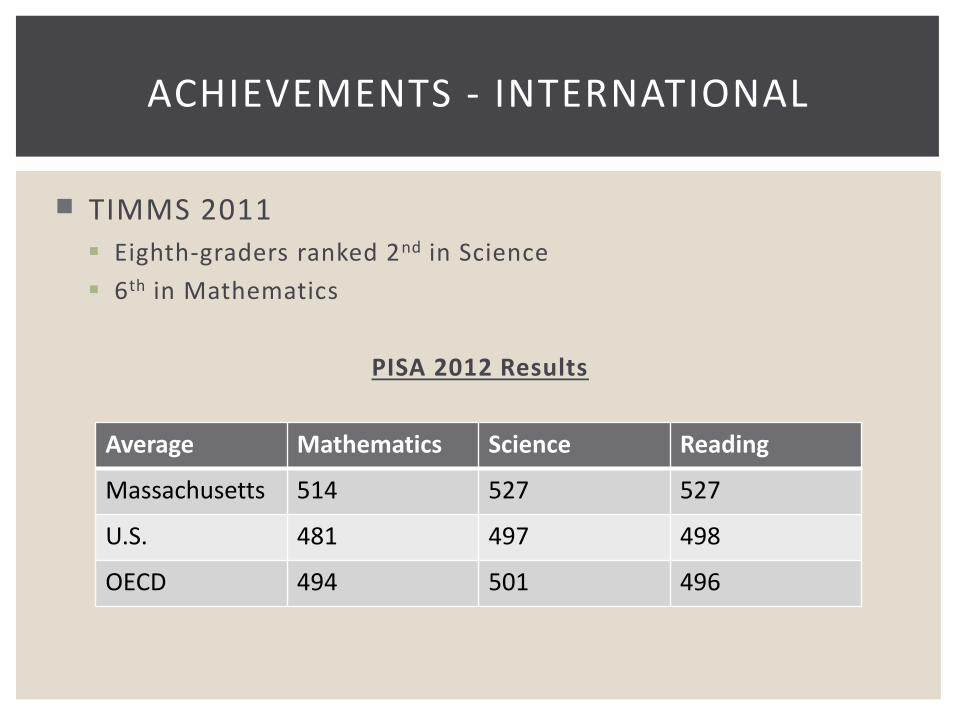
TIMMS 2011
Eighth-graders ranked 2nd in Science
6th in Mathematics
PISA 2012 Results
ACHIEVEMENTS - INTERNATIONAL
Average Mathematics Science Reading
Massachusetts 514 527 527
U.S. 481 497 498
OECD 494 501 496
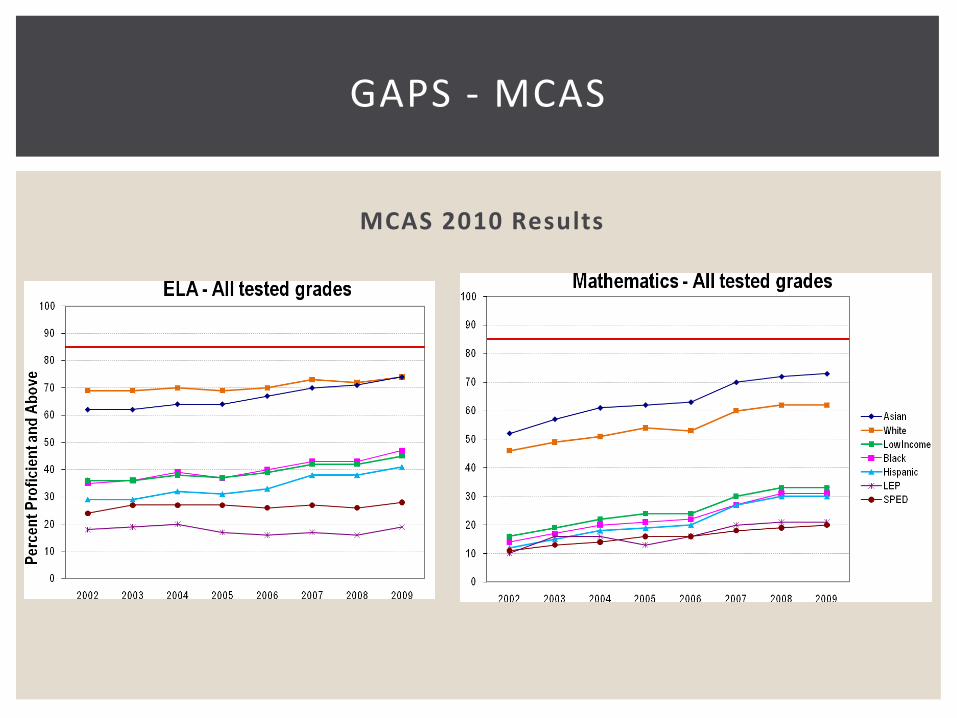
MCAS 2010 Results
GAPS - MCAS
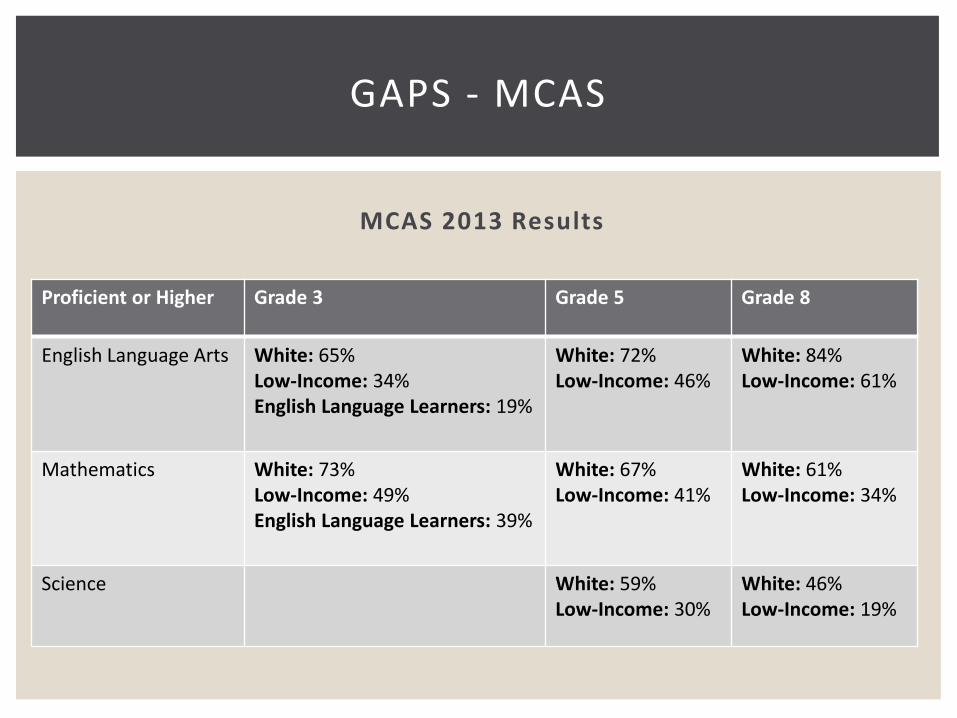
MCAS 2013 Results
GAPS - MCAS
Proficient or Higher Grade 3 Grade 5 Grade 8
English Language Arts White: 65%Low-Income: 34%English Language Learners: 19%
White: 72%Low-Income: 46%
White: 84%Low-Income: 61%
Mathematics White: 73%Low-Income: 49%English Language Learners: 39%
White: 67%Low-Income: 41%
White: 61%Low-Income: 34%
Science White: 59%Low-Income: 30%
White: 46%Low-Income: 19%
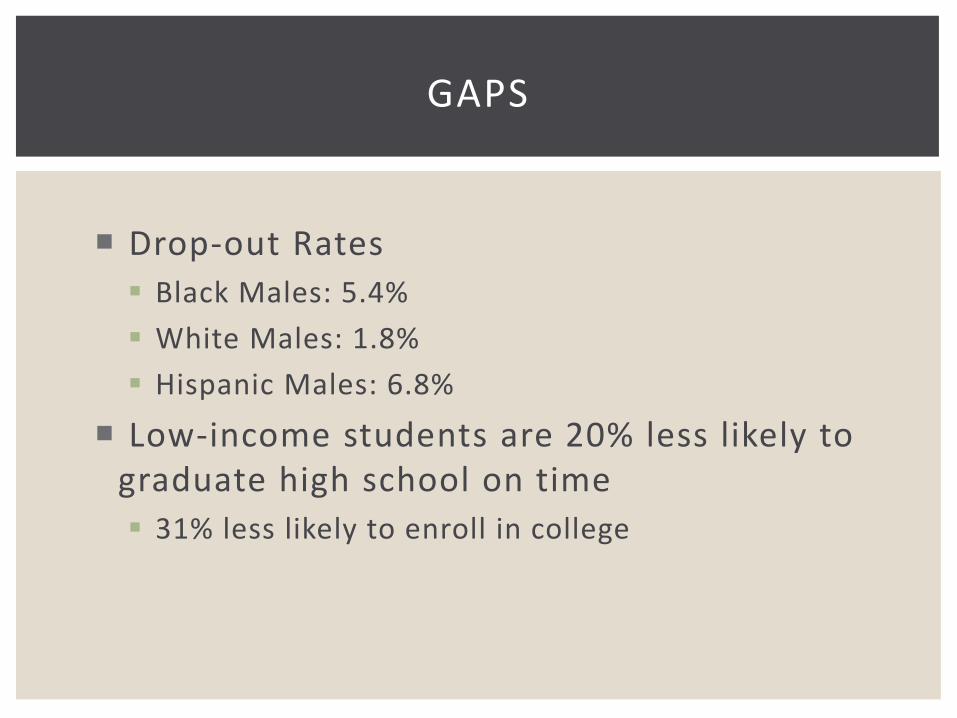
Drop-out Rates
Black Males: 5.4%
White Males: 1.8%
Hispanic Males: 6.8%
Low-income students are 20% less likely to graduate high school on time
31% less likely to enroll in college
GAPS
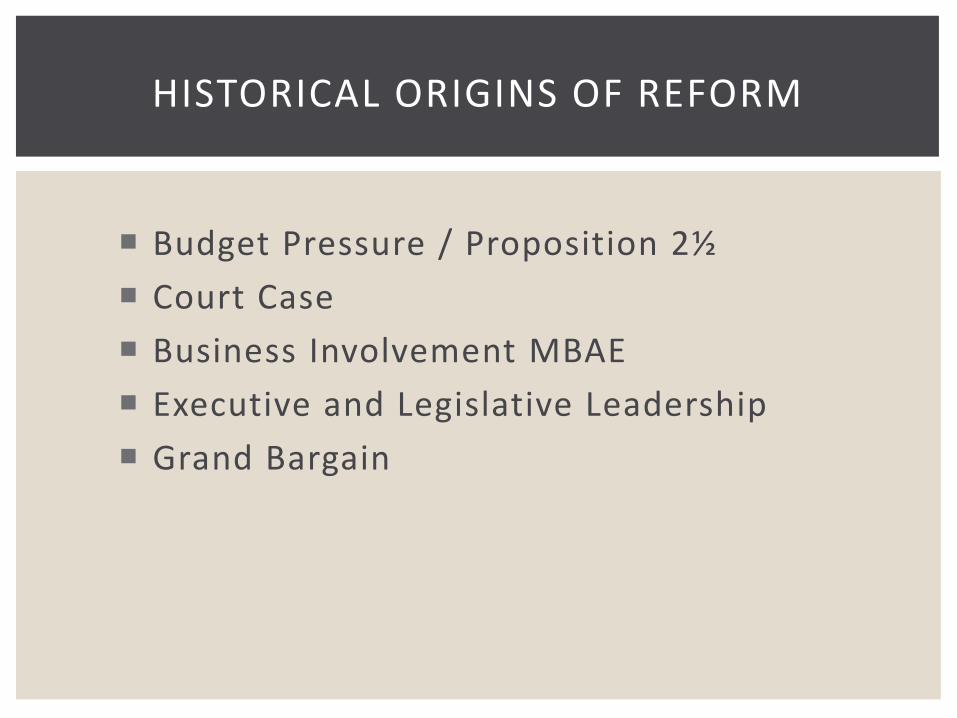
Budget Pressure / Proposition 2½
Court Case
Business Involvement MBAE
Executive and Legislative Leadership
Grand Bargain
HISTORICAL ORIGINS OF REFORM
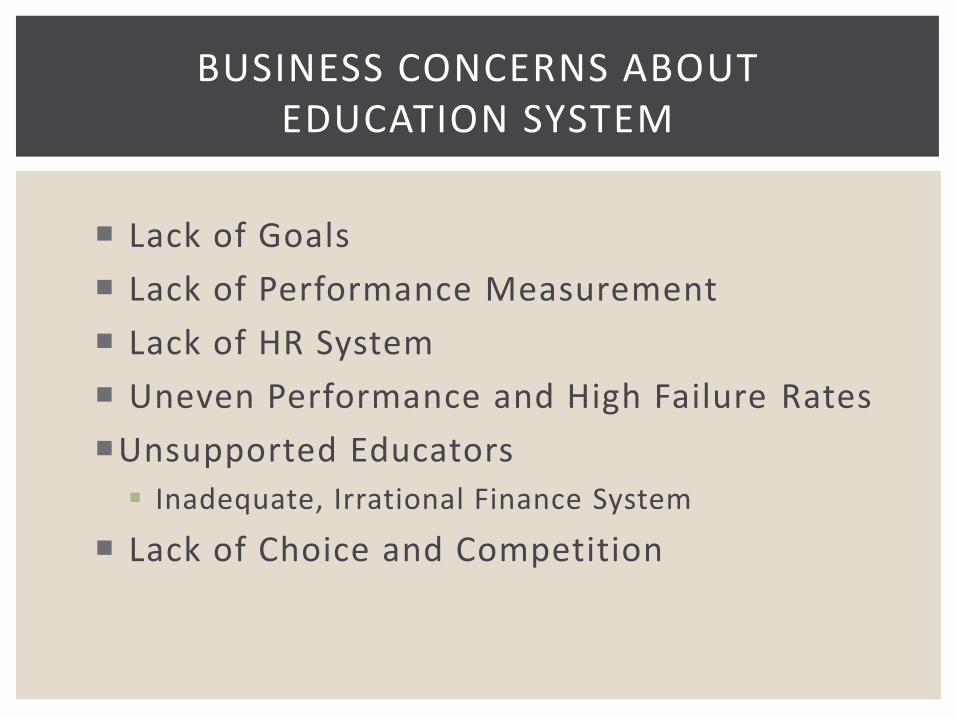
Lack of Goals
Lack of Performance Measurement
Lack of HR System
Uneven Performance and High Failure Rates
Unsupported Educators
Inadequate, Irrational Finance System
Lack of Choice and Competition
BUSINESS CONCERNS ABOUT EDUCATION SYSTEM
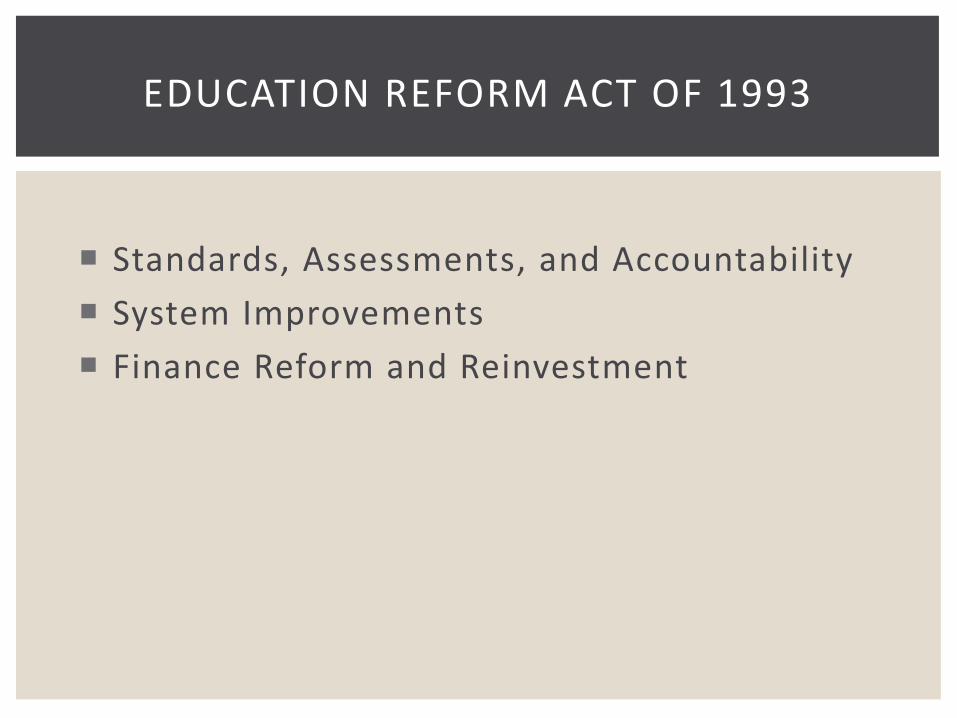
Standards, Assessments, and Accountability
System Improvements
Finance Reform and Reinvestment
EDUCATION REFORM ACT OF 1993
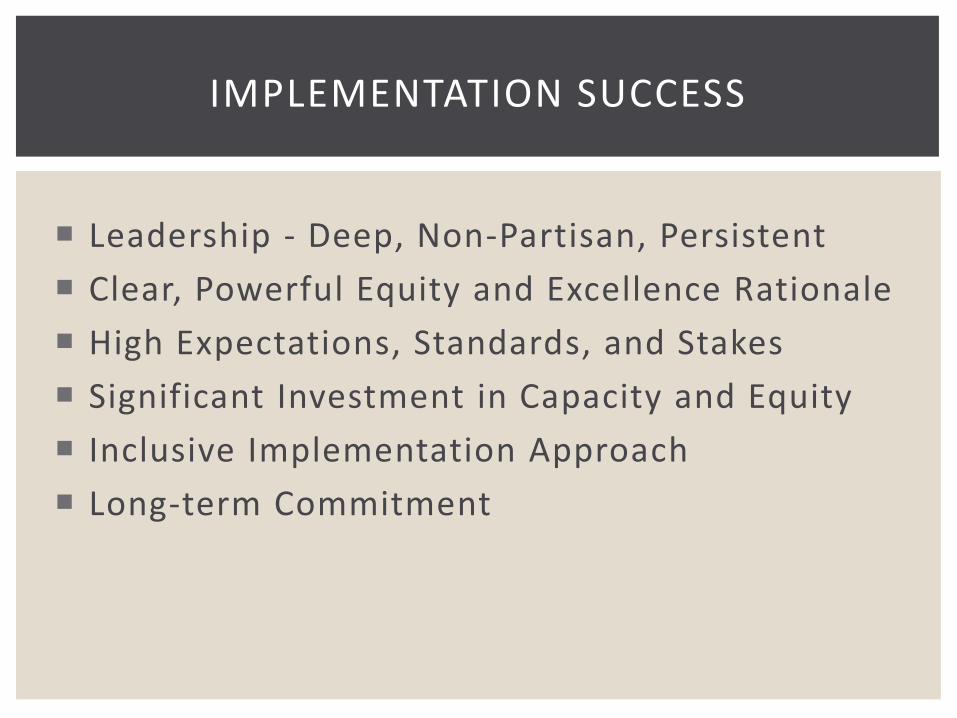
Leadership - Deep, Non-Partisan, Persistent
Clear, Powerful Equity and Excellence Rationale
High Expectations, Standards, and Stakes
Significant Investment in Capacity and Equity
Inclusive Implementation Approach
Long-term Commitment
IMPLEMENTATION SUCCESS
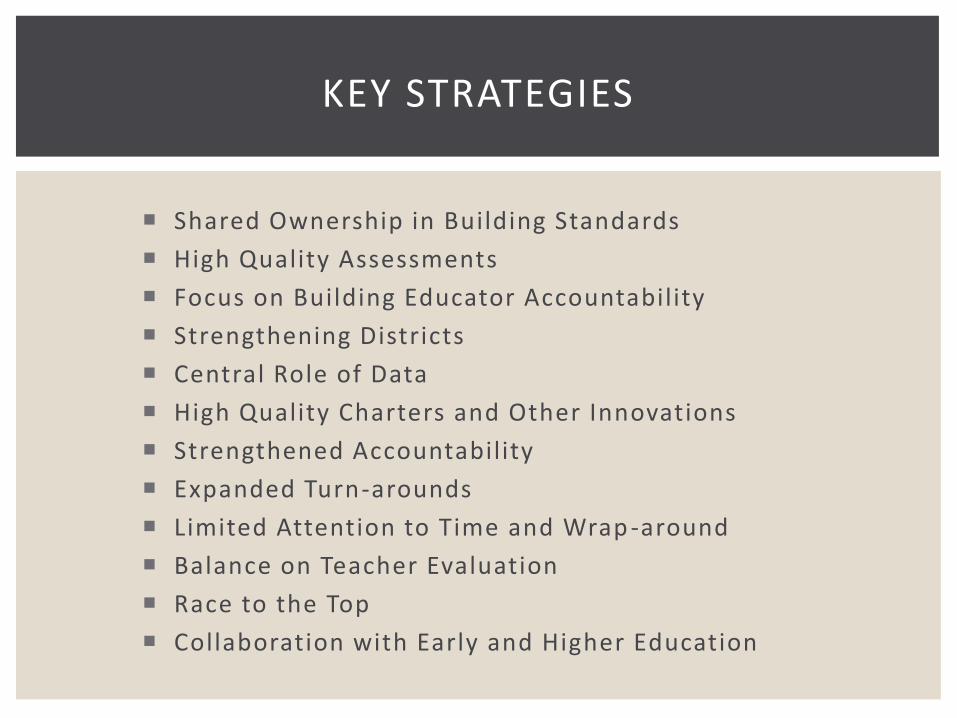
Shared Ownership in Building Standards
High Quality Assessments
Focus on Building Educator Accountability
Strengthening Districts
Central Role of Data
High Quality Charters and Other Innovations
Strengthened Accountability
Expanded Turn-arounds
Limited Attention to Time and Wrap -around
Balance on Teacher Evaluation
Race to the Top
Collaboration with Early and Higher Education
KEY STRATEGIES
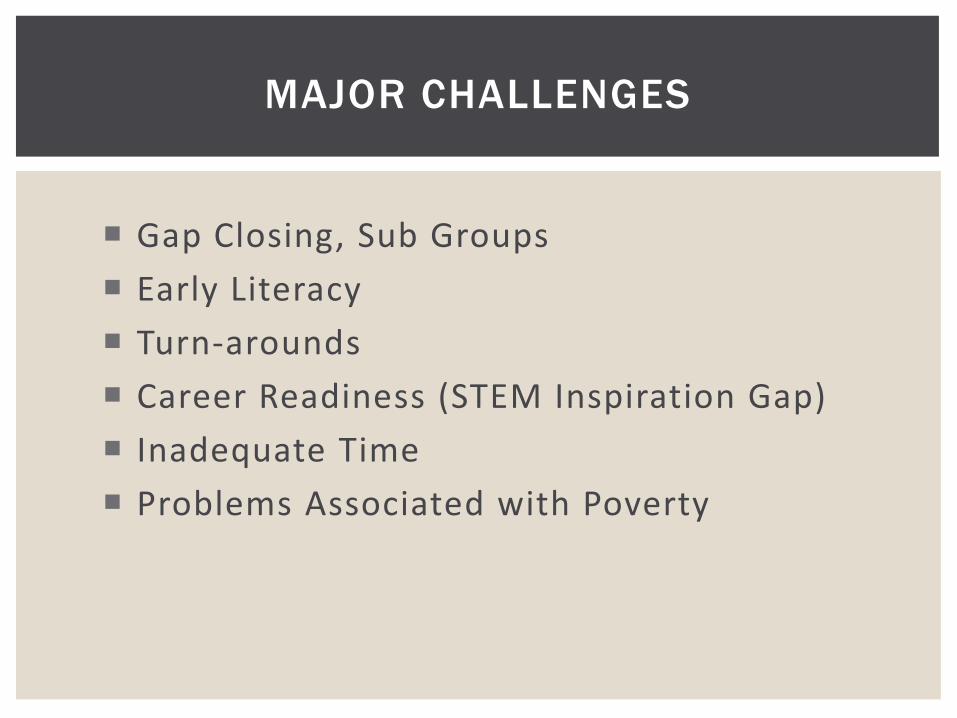
Gap Closing, Sub Groups
Early Literacy
Turn-arounds
Career Readiness (STEM Inspiration Gap)
Inadequate Time
Problems Associated with Poverty
MAJOR CHALLENGES
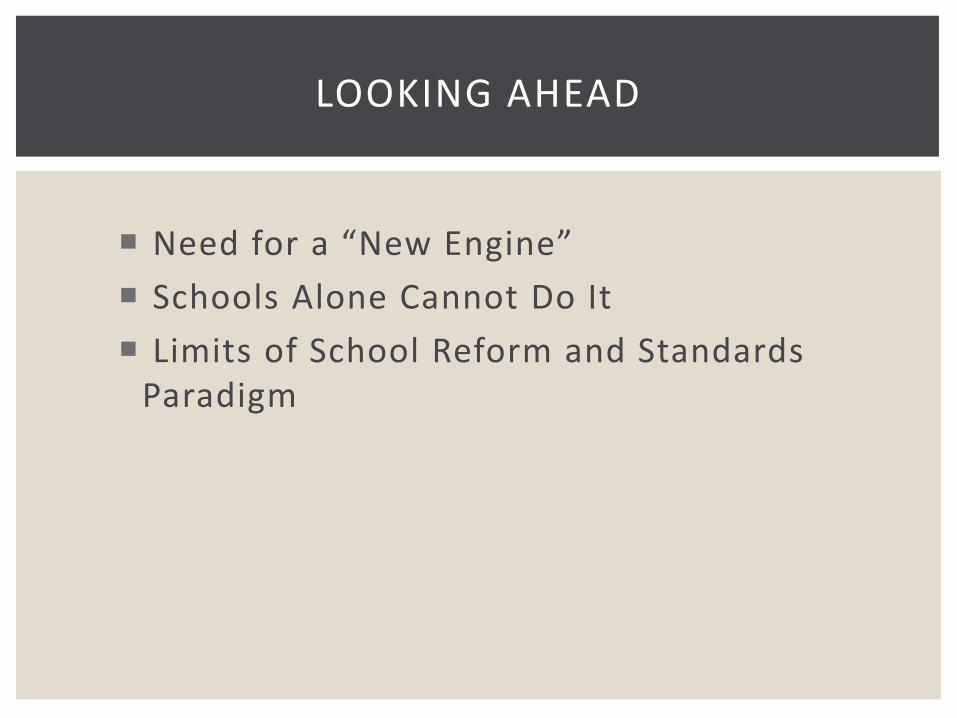
Need for a “New Engine”
Schools Alone Cannot Do It
Limits of School Reform and Standards Paradigm
LOOKING AHEAD
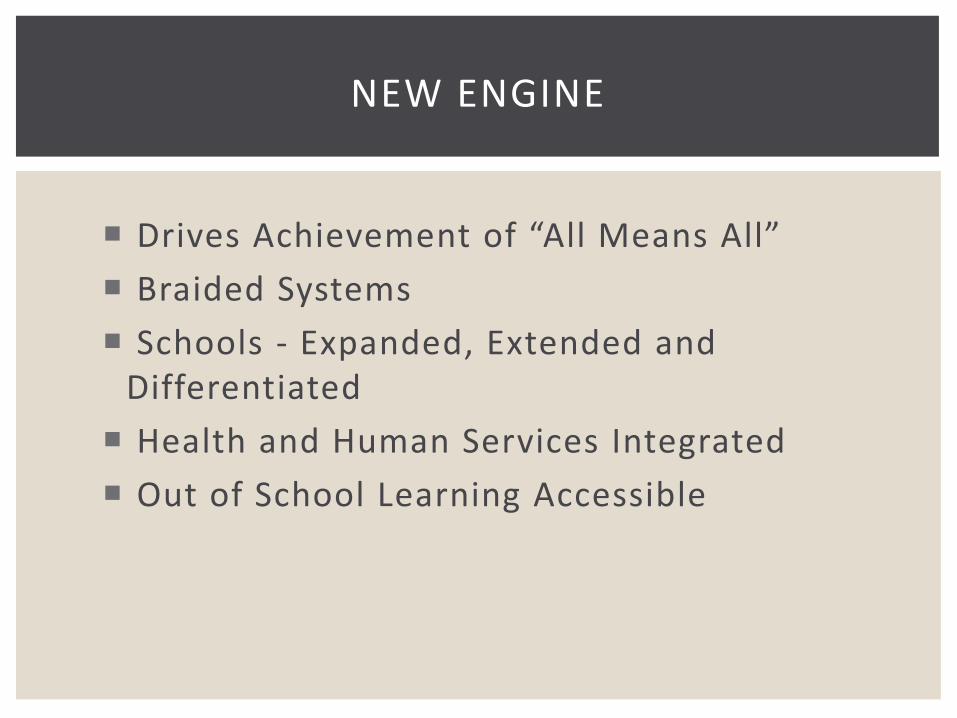
Drives Achievement of “All Means All”
Braided Systems
Schools - Expanded, Extended and Differentiated
Health and Human Services Integrated
Out of School Learning Accessible
NEW ENGINE

© 2015 THE EDUCATION TRUST-MIDWEST
Panelists
• Amber Arellano, Executive Director, The Education Trust-Midwest
• Sara Heyburn, Executive Director, Tennessee State Board of Education
• Marc Hill, Chief Policy Officer, Nashville Area Chamber of Commerce
• Paul Reville, Francis Keppel Professor of Practice of Educational Policy
and Administration, Harvard University’s Graduate School of Education
25
© 2015 THE EDUCATION TRUST-MIDWEST
26