Oceanographic survey techniques and living resources assessment...
36
Intergovernmental Oceanographic Commission Manuals and Guides OCEANOGRAPHIC SURVEY TECHNIQUES AND LIVING RESOURCES ASSESSMENT METHODS 1996 UNESCO 32 Optical Character Recognition (OCR) document. WARNING! Spelling errors might subsist. In order to access to the original document in image form, click on "Original" button on 1st page.
-
Upload
nguyentuyen -
Category
Documents
-
view
230 -
download
2
Transcript of Oceanographic survey techniques and living resources assessment...
IntergovernmentalOceanographicCommission
Manuals and Guides
OCEANOGRAPHIC SURVEYTECHNIQUES ANDLIVING RESOURCESASSESSMENT METHODS
1996 UNESCO
32
Optical Character Recognition (OCR) document. WARNING! Spelling errors might subsist. In order to accessto the original document in image form, click on "Original" button on 1st page.
No.
1 rev. 2
2
3 rev. 2
4
56 rev.
7
8
9 rev.
9 Annex I
9 Annex II
10
11
1213
14
15
16
17
IOC Manuals and Guides
Title
Guide to IGOSS Data Archives and Exchange (BATHY and TESAC). 1993.27 pp. (English, French, Spanish,Russian)
International Catalogue of Ocean Data Station. 1976. (Out of stock)
Guide to Operational Procedures for the Collection and Exchange of IGOSS Data. Second Revised Edition,1988.68 pp. (English, French, Spanish, Russian)
Guide to Oceanographic and Marine Meteorological Instruments and Observing Practices. 1975.54 pp.(English)
Guide to Establishing a National Oceanographic Data Centre. 1975. (Out of stock)Wave Reporting Procedures for Tide Observers in the Tsunami Warning System. 1968.30 pp. (English)
Guide to Operational Procedures for the IGOSS Pilot Project on Marine Pollution (Petroleum) Monitoring. 1976.50 pp. (French, Spanish)
(Superseded by IOC Manuals and Guides No. 16)
Manual on International Oceanographic Data Exchange. (Fifth Edition). 1991.82 pp. (French, Spanish, Russian)
(Superseded by IOC Manuals and Guides No. 17)
Guide for Responsible National Oceanographic Data Centres. 1982.29 pp. (English, French, Spanish, Russian)
(Superseded by IOC Manuals and Guides No. 16)The Determination of Petroleum Hydrocarbons in Sediments. 1982.38 pp. (French, Spanish, Russian)
Chemical Methods for Use in Marine Environment Monitoring. 1983.53 pp. (English)Manual for Monitoring Oil and Dissolved/Dispersed Petroleum Hydrocarbons in Marine Waters and on Beaches.1984.35 pp. (English, French, Spanish, Russian)Manual on Sea-Level Measurements and Interpretation. 1985.83 pp. (English, French, Spanish, Russian)
Operational Procedures for Sampling the Sea-Surface Microlayer. 1985.15 pp. (English)
Marine Environmental Data Information Referral Catalogue. Third Edition. 1993.157 pp. (CompositeEnglish/French/Span ish/Russian )GF3: A General Formatting System for Gee-referenced Data
Vol. 1: Introductory Guide to the GF3 Formatting System. 1993.35 pp. (English, French, Spanish, Russian)
Vol. 2: Technical Description of the GF3 Format and Code Tables. 1987.111 pp. (English, French, Spanish,Russian)
18
19
20
21
22
23
24
25
26
27
28
29
30
31
32
Vol. 4: User Guide to the GF3-Proc Software. 1989.23 pp. (English, French, Spanish, Russian)
Vol. 5: Reference Manual for the GF3-Proc Software. 1992.67 pp. (English, French, Spanish, Russian)
Vol. 6: Quick Reference Sheets for GF3 and GF3-Proc. 1989.22 pp. (English, French, Spanish, Russian)
User Guide for the Exchange of Measured Wave Data. 1987.81 pp. (English, French, Spanish, Russian)
Guide to IGOSS Specialized Oceanographic Centres (SOCs). 1988.17 pp. (English, French, Spanish, Russian)Guide to Drifting Data Buoys. 1988.71 pp. (English, French, Spanish, Russian)
(Superseded by IOC Manuals and Guides No. 25)
GTSPP Real-time Quality Control Manual. 1990.122 pp. (English)
Marine Information Centre Development: An Introductory Manual. 1991.32 pp. (English, French, Spanish,Russian)
Guide to Satellite Remote Sensing of the Marine Environment. 1992.178 pp. (English)
Standard and Reference Materials for Marine Science. Revised Edition. 1993.577 pp. (English)
Manual of Quality Control Procedures for Validation of Oceanographic Data, 1993.436 pp. (English)
Chlorinated Biphenyls in Open Ocean Waters: Sampling, Extraction, Clean-up and Instrumental Determination.E1993.36 pp. ( nglish)
Nutrient Analysis in Tropical Marine Waters. 1993.24 pp. (English)
Protocols for the Joint Global Ocean Flux Study (JGOFS) Core Measurements. 1994.178 pp (English)
MIM Publication Series:
Vol. 1: Report on Diagnostic Procedures and a Definition of Minimum Requirements for Providing InformationServices on a National and/or Regional Level. 1994.6 pp. (English)
Vol. 2: Information Networking: The Development of National or Regional Scientific Information Exchange. 1994.22 pp. (English)
Vol. 3: Standard Directory Record Structure for Organizations, Individuals and their Research Interests. 1994.33 pp. (English)
HAB Publication Series:
Vol. 1: Amnesic Shellfish Poisoning. 1995.18 pp. (English)
Oceanographic Survey Techniques and Living Resources Assessment Methods. 1996, 34 pp. (English)
Optical Character Recognition (OCR) document. WARNING! Spelling errors might subsist. In order to accessto the original document in image form, click on "Original" button on 1st page.

IntergovernmentalOceanographicCommission
Manuals and Guides
32
OCEANOGRAPHIC SURVEYTECHNIQUES ANDLIVING RESOURCESASSESSMENT METHODS
by Philip Tortell and Larry Awosika
1996 UNESCO
Optical Character Recognition (OCR) document. WARNING! Spelling errors might subsist. In order to accessto the original document in image form, click on "Original" button on 1st page.

The designations employed and the presentation of thematerial in this publication do not imply the expression of anyopinion whatsoever on the part of the Secretariats of UNESCOand IOC concerning the legal status of any country, territory,or its authorities, or concerning the delimitations of the frontiersof any country or territory.
For bibliographic purposes this documentshould be cited as follows :
Oceanographic Survey Techniques andLiving Resources Assessment MethodsIOC Manuals and Guides No. 32. UNESCO 1996(English)
Published in 1996by the United Nations Educational,Scientific and Cultural Organization,7, place de Fontenoy, 75700 Paris
Printed in UNESCO’s Workshops
© UNESCO 1996Printed in France
Optical Character Recognition (OCR) document. WARNING! Spelling errors might subsist. In order to accessto the original document in image form, click on "Original" button on 1st page.
TABLE OF CONTENTS
PART 1 : INTRODUCTION
1.1 THE EASTERN AFRICAN ACTION PLAN
1.2 INTEGRATED COASTAL AREA MANAGEMENT
1.3 PRINCIPLES AND DEFINITIONS
1.4 ACKNOWLEDGEMENTS
PART 2 : OCEANOGRAPHIC SURVEY TECHNIQUES
2.12.1.12.1.22.1.32.1.42.1.5
2.22.2.12.2.22.2.32.2.42.2.5
2.32.3.12.3.22.3.32.3.42.3.52.3.62.3.72.3.82.3.92.3.102.3.112.3.12
2.42.4.12.4.22.4.32.4.42.4.52.4.6
NAVIGATIONAL SYSTEMSShore based radio navigation systemTransit satellite navigation systemGlobal Positioning System (GPS)Speed logging systemIntegrated navigation systems
MARINE PROCESSESTidesWavesWave reflection, refraction and diffractionCurrentsOceanic circulation
OCEANOGRAPHIC TECHNIQUESBathymetryMeasurement of tide (water level variation)Measurement of ocean surface wavesMeasurement of currentsDrift measurementsWater sampling devicesMeasurement of temperatureMeasurement of salinityMeasurement of sound velocityMeasurement of densityMeasurement of the content of suspended materialsMeasurement of dissolved substances
COASTAL PROCESSES SURVEYIntroductionCauses of beach erosionBeach erosion monitoringBeach profilingProfile of the underwater beachLittoral environment observations
5
5
5
6
6
7
777778
889
101111
12121313141414141515151515
16161617171920
REFERENCES 20
Optical Character Recognition (OCR) document. WARNING! Spelling errors might subsist. In order to accessto the original document in image form, click on "Original" button on 1st page.
PART 3 : LIVING RESOURCES ASSESSMENT METHODS
3.13.1.13.1.23.1.33.1.43.1.5
3.23.2.13.2.2
3.33.3.13.3.23.3.33.3.43.3.53.3.6
3.43.4.13.4.2
ECOLOGICAL SURVEYMacro scale surveyRapid rural appraisalRemote sensing“On the ground’” surveySome common sampling approaches
MONITORINGObjectives and principles of monitoringIndicator species
INFORMATION MANAGEMENTSimple tabulationMatrixGraphicsDatabasesMaps and plansGeographic Information Systems (GIS)
WORKED EXAMPLEThe existing situationProposed development
22
292929
31313133
333334
‘34REFERENCES
3
Optical Character Recognition (OCR) document. WARNING! Spelling errors might subsist. In order to accessto the original document in image form, click on "Original" button on 1st page.
PART 1 : INTRODUCTION
1.1 THE EASTERN AFRICAN ACTIONPLAN
More than 25% of the population of the EasternAfrican Region today lives along its coastal areasor not far inland. Most seek employment aroundthe coast as well as unrestricted access to and fromthe foreshore, the freedom of navigation on anywaters, the right to anchor and seek shelter, theright to fish and gather shellfish and other livingresources for their livelihood or sustenance and theright to seek their leisure and recreation. Inaddition, coastal areas provide the landfall or takeoff point for imports and exports respectively, theyare often the focus for industrial development and,increasingly, they are promoted as the sites fortourism developments which have become thechief foreign currency earner in many of thesecountries.
These multiple demands on coastal resourcesrequire the best management strategies to ensuresustainability.
The Governments of the Eastern AfricanRegion (Somalia, Kenya, Tanzania, Mozambique,Comoros, Madagascar, Mauritius, Seychelles andFrance (Reunion)), recognizing the importance oftheir marine and coastal areas and, at the sametime, the environmental threats that they face,adopted the Action Plan for the Protection,Management and Development of the Marine andCoastal Environment of the Eastern AfricanRegion. Through the Plan they seek regionalsolutions to region-wide problems.
The governments are assisted with theimplementation of the Action Plan by a number ofmultilateral aid agencies. These include UN,UNDP, ECA, FAO, UNESCO, IOC, WHO,WMO, IMO, UNIDO, IAEA, IUCN, EU, andUNEP.
The protection and management of the marineand coastal areas in the Eastern African Region(EAF/5) is a key component of the Action Plan andit was under this component that FAO/PAP-RAC/IUCN/IOC/UNEP Regional Workshop on theDevelopment of Coastal Area Management Plans,Surveying Techniques and Marine ResourcesAssessment, was held in Mombasa, Kenya, in1993.
1.2 INTEGRATED COASTAL A R E AM A N A G E M E N T
It is the task of administrators and managers toseek a wise balance between the many conflictingdemands being made on the coastal environment,ensuring that its limits of tolerance and its capacityfor sustainability are not exceeded. In order to dothis successfully they need a comprehensivemanagement approach giving them a holistic viewof the resources, the demands, and the variousdirect and indirect physical interrelationships.
Integrated coastal area management is anapproach that allows such a comprehensive andholistic view to be taken of the multiple, oftenconflicting, demands that are made on coastalresources. It provides decision-makers, plannersand managers with a practical methodology forresolving conflicts and assigning priorities and forbalancing protection and development.
The Regional Workshop on the Development ofCoastal Area Management Plans, SurveyingTechniques and Marine Resources Assessment,brought together a number of participants fromthroughout the Eastern African Region withplanning, management and related responsibilitiesfor coastal and marine resources. The participationof the Intergovernmental OceanographicCommission (IOC) of UNESCO comprisedsessions on oceanographic and ecological surveytechniques for coastal area planning andmanagement.
This manual arises from those sessions and it isbeing published in the belief that the methodologiesand techniques provided to the Workshopparticipants, are of much broader interest and canbe applied successfully beyond the Eastern Africanregion in order to achieve a wiser use of coastalresources, to reduce wastage of non-renewableresources, to avoid conflicts and to ensuresustainability for future generations.
The section on oceanographic survey techniquesis the work of’ Dr Larry Awosika of the NigerianInstitute of Oceanography and Marine Research,Lagos, Nigeria, while the section on livingresources assessment methods was contributed byDr Philip Tortell of Environmental Management
5
Optical Character Recognition (OCR) document. WARNING! Spelling errors might subsist. In order to accessto the original document in image form, click on "Original" button on 1st page.
Limited, Wellington, New Zealand. Dr Tortell wasalso responsible for overall editing of the manualand preparing it for publication.
1.3 PRINCIPLES AND DEFINITIONS
Survey, monitoring, assessment and similarmeasurements are only a means to an end. Theyachieve little in themselves except, maybe add aquantum of knowledge and some understanding.What is even more important, is the use of theresults of survey and monitoring - how and when touse the information and knowledge obtainedthrough survey and monitoring.
Since survey and monitoring can consume agreat deal of time, staff and funds, it is essential toestablish clear objectives before survey and focuson those objectives throughout. Survey,monitoring, assessments and measurement can turninto an expensive “black hole” into whichresources are poured at ever increasing amounts.It is often the view that more data are needed andthat there is not enough information - in effect,there are never “enough” data and the importantthing is to make the judgement as to how muchdata and information are “essential” in order tomeet the objectives.
Some Definitions “Coastal area” is the areaor zone which spans the interface between land andwater; it includes both land and water and itextends inland as far as the expected influences onthat interface; it extends seaward as far as one canmeaningfully manage.
“Management” means planned, rational andwise use of land and water and all their resourcesand values in a sustainable, long-term manner so asto obtain the maximum benefits with the minimumof impacts which are kept within tolerable limits.
“Integrated” is a management approach whichtakes a comprehensive view and does not sacrificeunknowingly some resources for the sake of others;if such sacrifices have to be made, they are notmade in ignorance, but only after carefulconsideration and after clear objectives have beenset in order of priority, and after careful assessmentof the comparative values and impacts.
“Integrated coastal area management” is a shiftfrom the reactionary, problem-oriented approach toa planned, pre-emptive, management-basedapproach; it is a comprehensive and holisticapproach which addresses the multiple demands onboth terrestrial and marine resources; it providesthe conceptual framework within which thecumulative, multisectoral environmentalconsequences of development can be managed toremain within assessed, pre-determined, tolerablelimits.
1.4 ACKNOWLEDGEMENTS
The authors first presented this material toparticipants at the Regional Workshop on theDevelopment of Coastal Area Management Plans,Surveying Techniques and Marine ResourcesAssessment. The excellent discussions andquestioning generated by participants during theWorkshop have helped us to focus better andimprove our material for this manual.
We are grateful to the Secretariat of theIntergovernmental Oceanographic Commission(IOC) of UNESCO for encouraging us to presentour material for publication and for their supportduring the preparation of this manual.
A number of the techniques and methodologiesdescribed in the manual were taken from a varietyof other works. We wish to record ourappreciation to the authors and publishers of theseother works which are listed in the references at theend of each section.
Optical Character Recognition (OCR) document. WARNING! Spelling errors might subsist. In order to accessto the original document in image form, click on "Original" button on 1st page.
PART 2 : OCEANOGRAPHIC SURVEY TECHNIQUES
2.1 NAVIGATIONAL SYSTEMS
Collection and monitoring of oceanographicdata most often takes place on board researchvessels or other craft The accuracy of suchinformation depends on the ability of the vessel tolocate its exact position either to repeat previousstations where data collection has already takenplace in the past, or to undertake newinvestigations. To meet this objective, specialnavigational systems have been developed and themore important ones are described below.
Conventional methods can be used to fixpositions rather simply but the level of accuracy isvery low. Radar, compass and sextant angles canbe related to land based known positions orfeatures to give rather rough positions. Such landbased features can be hills, steep headlands, bays,identifiable outstanding buildings or other markedfeatures on existing maps.
2.1.1 Shore based radio navigation system
In coastal areas, shore-based transmitterstations can be used for more accurate positioning.The receiver onboard determines the distancedifference between the vessel and two pairs oftrisponders onshore. An example of this system isthe Decca chain which provides good positioninginformation over distances of a few hundredkilometres. The Omega navigation system, withvery long wavelengths, is another type of shorebased radio navigation system but this type is bestsuited for submarines down to 20m below thesurface.
Trisponder navigation systems are widely usedfor local work in small areas in the open sea.They are usually deployed at three or moresuitable points in the working area. Acousticinterrogator pulses are sent from onboard to theshore stations and these are answered bytrisponders with pulses at different frequencies.The system on the ship computes the distance toall trisponders and the exact position of the vesselcan hence be fixed. Trisponder systems can alsobe used for the positioning of deep-towedsampling or surveying devices and submersibles.
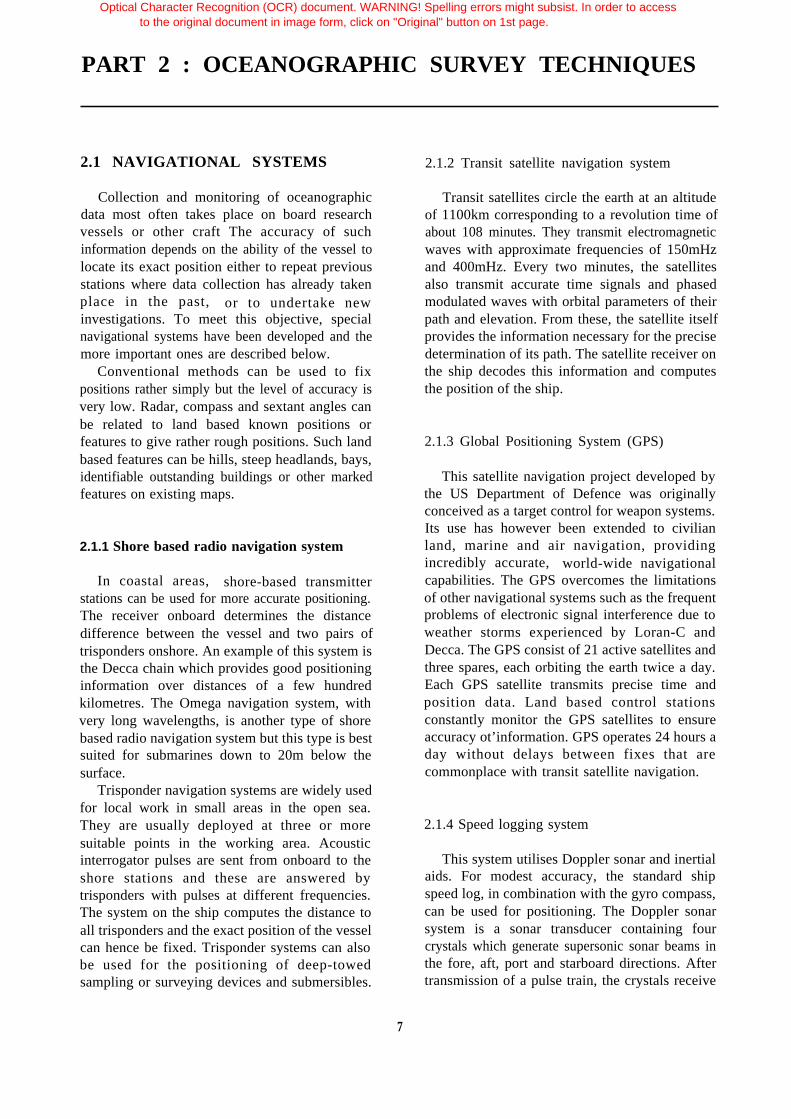
2.1.2 Transit satellite navigation system
Transit satellites circle the earth at an altitudeof 1100km corresponding to a revolution time ofabout 108 minutes. They transmit electromagneticwaves with approximate frequencies of 150mHzand 400mHz. Every two minutes, the satellitesalso transmit accurate time signals and phasedmodulated waves with orbital parameters of theirpath and elevation. From these, the satellite itselfprovides the information necessary for the precisedetermination of its path. The satellite receiver onthe ship decodes this information and computesthe position of the ship.
2.1.3 Global Positioning System (GPS)
This satellite navigation project developed bythe US Department of Defence was originallyconceived as a target control for weapon systems.Its use has however been extended to civilianland, marine and air navigation, providingincredibly accurate, world-wide navigationalcapabilities. The GPS overcomes the limitationsof other navigational systems such as the frequentproblems of electronic signal interference due toweather storms experienced by Loran-C andDecca. The GPS consist of 21 active satellites andthree spares, each orbiting the earth twice a day.Each GPS satellite transmits precise time andposition data. Land based control stationsconstantly monitor the GPS satellites to ensureaccuracy ot’information. GPS operates 24 hours aday without delays between fixes that arecommonplace with transit satellite navigation.
2.1.4 Speed logging system
This system utilises Doppler sonar and inertialaids. For modest accuracy, the standard shipspeed log, in combination with the gyro compass,can be used for positioning. The Doppler sonarsystem is a sonar transducer containing fourcrystals which generate supersonic sonar beams inthe fore, aft, port and starboard directions. Aftertransmission of a pulse train, the crystals receive
7
Optical Character Recognition (OCR) document. WARNING! Spelling errors might subsist. In order to accessto the original document in image form, click on "Original" button on 1st page.
the back scatter and part of the signal. Theobserved frequency shift serves to determine thevelocity vector of the ship in relation to the seabed or, in water deeper than about 400m, relativeto a layer in the water column which scatters asufficient percentage of the wave.
2.1.5 Integrated navigation systems
An integrated navigation system ( ins )combines the output of several systems. The mainadvantage of this is that it combines sensors withdifferent navigational characteristics, with theweak points of one subsystem as the strong partsof another. For example the Transit system canbe used in conjunction with Doppler sonar. TheTransit satellite provides accurate fixes every fewhours while the Doppler sonar enables deadreckoning between fixes.
2.2 MARINE PROCESSES
The marine environment is a dynamicenvironment and this dynamism must be takeninto account when undertaking coastal and marinesurvey work.
2.2.1 Tides
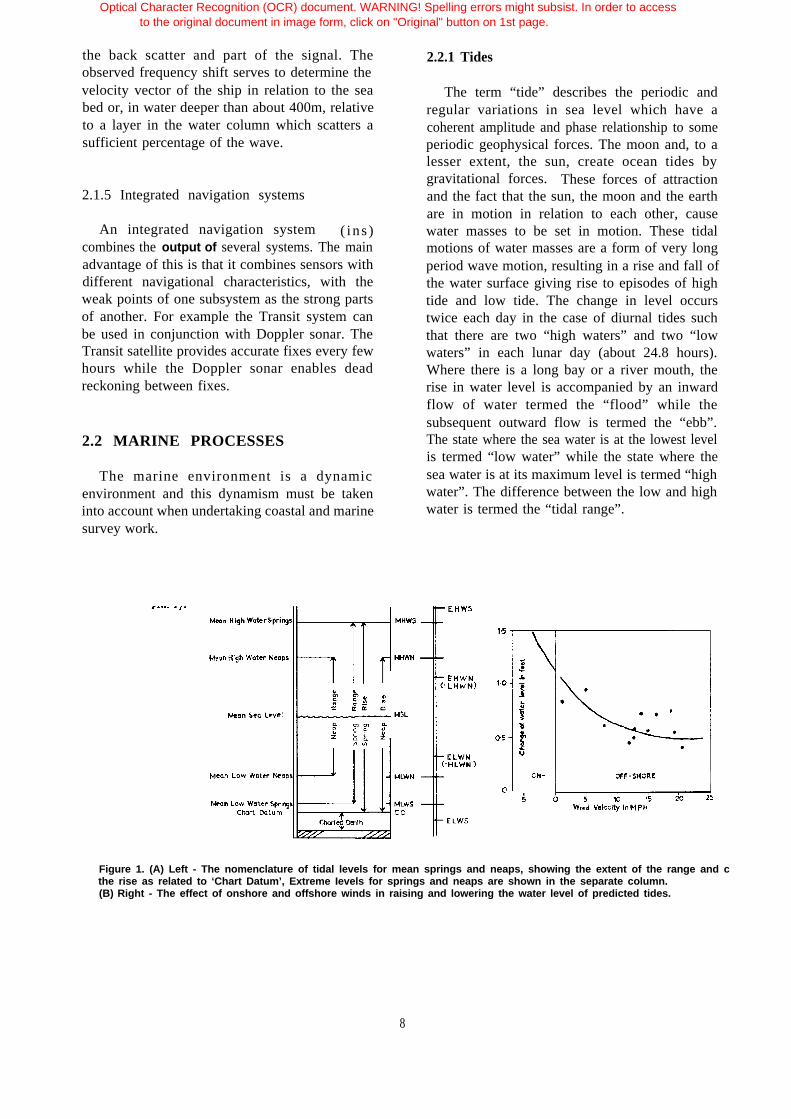
The term “tide” describes the periodic andregular variations in sea level which have acoherent amplitude and phase relationship to someperiodic geophysical forces. The moon and, to alesser extent, the sun, create ocean tides bygravitational forces. These forces of attractionand the fact that the sun, the moon and the earthare in motion in relation to each other, causewater masses to be set in motion. These tidalmotions of water masses are a form of very longperiod wave motion, resulting in a rise and fall ofthe water surface giving rise to episodes of hightide and low tide. The change in level occurstwice each day in the case of diurnal tides suchthat there are two “high waters” and two “lowwaters” in each lunar day (about 24.8 hours).Where there is a long bay or a river mouth, therise in water level is accompanied by an inwardflow of water termed the “flood” while thesubsequent outward flow is termed the “ebb”.The state where the sea water is at the lowest levelis termed “low water” while the state where thesea water is at its maximum level is termed “highwater”. The difference between the low and highwater is termed the “tidal range”.
Figure 1. (A) Left - The nomenclature of tidal levels for mean springs and neaps, showing the extent of the range and cthe rise as related to ‘Chart Datum’, Extreme Ievels for springs and neaps are shown in the separate column.(B) Right - The effect of onshore and offshore winds in raising and lowering the water level of predicted tides.
8
Optical Character Recognition (OCR) document. WARNING! Spelling errors might subsist. In order to accessto the original document in image form, click on "Original" button on 1st page.

Figure 2. The tidal curve for semidiurnal tides with two sets of springs and two of neaps, over a period of one month
Tides of highest magnitude occur at new moonand again during full moon when the positions ofthe moon, sun and earth are aligned. This meansthat the gravitational forces of the sun and mooncome into phase and the range of the tideincreases to a maximum. These are known as“spring tides”.
Minimal tides occur during the first and thirdlunar quarters when the sun and moon are actingin opposition to each other or are aligned at rightangles. These are known as “neap tides”.Successive spring and neap tides occur at intervalsof about 15 days.
In localities subjected to semi-diurnal tidesthere are two high and two low waters in eachlunar day. For semi-diurnal tides in some regions,two successive high waters will have nearly thesame height and two successive low waters willhave nearly the same (lower) height. In otherregions successive high and low waters will eachhave different height. In some areas apredominantly semi-diurnal tide becomes diurnalfor a short time each month during neap tides.
The tidal oscillations generate currents termed“tidal currents”. Tidal currents are generally inphase with tidal direction and are stronger duringebb tides than during flood tides.
2.2.2 Waves
Waves involve water motions which are largely(but not exclusively) confined to the surface andmay be described as the surface disturbance of afluid medium. There are also waves that formbelow the surface.
Waves are typified by an up and down bobbing
periodic motion which is particularly apparent atthe surface. The observed alternate elevations anddepressions of the surface above and below itsmean position is merely indicative of the passageof energy. In wave motion, the medium throughwhich the wave passes does. not move along withthe wave. If a cork was left on the surface, thecork bobs up and down but does not travelhorizontally even though the ripples arepropagated horizontally across the surface. Thehorizontal movement of the wave results from thevertical oscillations of the water column with thesame frequency but with a progressivelyincreasing phase lag the further the waves arefrom the source.
The generation and subsequent propagation ofwaves can result from changes in air pressurecaused for example by wind acting directly on,and putting some stress on, the water surface.Another possible cause is any significantdisturbance of the basin (i.e. the earth’s crust)holding sea water such as during an earthquakewith the resulting tsunami. Most waves arecaused by the former.
Wave parameters of importance and whichmay need to be recorded during a survey include:●
●
●
●
Wave Height: The wave height (H) is thevertical distance between a crest and anadjacent trough.Amplitude: This is a measure of the intensityof oscillation. It is defined as H/2.Wavelength: The wavelength (L) is thehorizontal distance between neighboringcrests or troughs in the direction of wavetravel.Wave Period: The wave period (T) is the timeinterval between the occurrence of successive
9
Optical Character Recognition (OCR) document. WARNING! Spelling errors might subsist. In order to accessto the original document in image form, click on "Original" button on 1st page.
troughs or crests at a fixed position.Wave frequency: This is the number of crestspassing a given point per second, i.e.
oscillation per second. It is the reciprocal ofthe wave period, i,e I/T.Wave velocity: The distance a given crestappears to travel in a second.
Internal waves can be caused by a wide varietyof phenomena including storms, tidal action,traveling ships or a combination of factors. Theyusually occur at density interfaces in the ocean.The surface that separates the water masses ofdiffering densities may be set in motion in amanner similar to that previously described for theocean surface. Below the density interface, thereis orbital motion in the direction of propagationwhile above it, there is movement in the oppositedirection. In comparison with surface waves,internal waves are slow moving and are generallysinusoidal in shape. This results largely from thefact that the density interface is easily distortedbecause the difference in density across thisinterface is small.
Wind generated waves can be categorised intothree types:
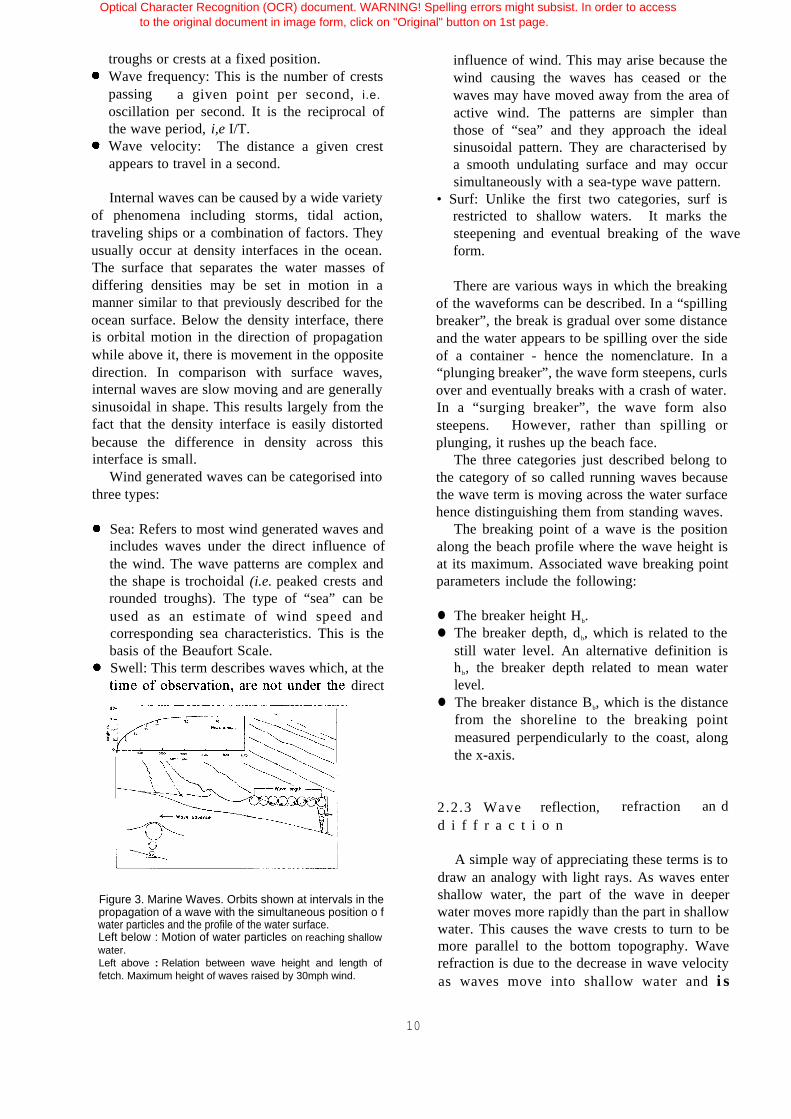
Sea: Refers to most wind generated waves andincludes waves under the direct influence ofthe wind. The wave patterns are complex andthe shape is trochoidal (i.e. peaked crests androunded troughs). The type of “sea” can beused as an estimate of wind speed andcorresponding sea characteristics. This is thebasis of the Beaufort Scale.Swell: This term describes waves which, at the
direct
Figure 3. Marine Waves. Orbits shown at intervals in thepropagation of a wave with the simultaneous position o fwater particles and the profile of the water surface.Left below : Motion of water particles on reaching shallowwater.Left above : Relation between wave height and length offetch. Maximum height of waves raised by 30mph wind.
influence of wind. This may arise because thewind causing the waves has ceased or thewaves may have moved away from the area ofactive wind. The patterns are simpler thanthose of “sea” and they approach the idealsinusoidal pattern. They are characterised bya smooth undulating surface and may occursimultaneously with a sea-type wave pattern.
• Surf: Unlike the first two categories, surf isrestricted to shallow waters. It marks thesteepening and eventual breaking of the waveform.
There are various ways in which the breakingof the waveforms can be described. In a “spillingbreaker”, the break is gradual over some distanceand the water appears to be spilling over the sideof a container - hence the nomenclature. In a“plunging breaker”, the wave form steepens, curlsover and eventually breaks with a crash of water.In a “surging breaker”, the wave form alsosteepens. However, rather than spilling orplunging, it rushes up the beach face.
The three categories just described belong tothe category of so called running waves becausethe wave term is moving across the water surfacehence distinguishing them from standing waves.
The breaking point of a wave is the positionalong the beach profile where the wave height isat its maximum. Associated wave breaking pointparameters include the following:
●
●
●
The breaker height Hb.The breaker depth, db, which is related to thestill water level. An alternative definition ishb, the breaker depth related to mean waterlevel.The breaker distance Bb, which is the distancefrom the shoreline to the breaking pointmeasured perpendicularly to the coast, alongthe x-axis.
2.2.3 Wave reflection, refraction an dd i f f r a c t i o n
A simple way of appreciating these terms is todraw an analogy with light rays. As waves entershallow water, the part of the wave in deeperwater moves more rapidly than the part in shallowwater. This causes the wave crests to turn to bemore parallel to the bottom topography. Waverefraction is due to the decrease in wave velocityas waves move into shallow water and i s
10
Optical Character Recognition (OCR) document. WARNING! Spelling errors might subsist. In order to accessto the original document in image form, click on "Original" button on 1st page.
analogous to refraction of light. Refraction canalso be observed in deep waters. When a wavecrosses a current, if it has a component of motionagainst the current, it tends to be refracted into astream. If it has a component of motion with thecurrent, there is a tendency for it to be turnedaside.
Waves can also be reflected and diffracted inshallow water. For example, waves movingagainst a vertical sea wall or a steep clift will bereflected back towards sea. Wave diffractioncauses energy to be transferred along a wavecrest. Wave diffraction can cause waves to effectwater far to the lee of the interfering structure.Diffraction may however be complicated byrefraction depending on the topography of thebottom surrounding the barrier.
2.2.4. Currents
The main types of currents responsible fortransport in the ocean arc tidal currents, wavegenerated longshore currents, rip currents andoceanic currents.
Tidal currents: The rise and fall in sea levelgenerate currents which are called tidal currents.When currents and tides are both semi-diurnal,there is a definite relationship between times ofcurrent and the times of high and low water in thelocality. Tidal currents that attain maximumvelocity during the time from low water to highwater are called flood currents and those thatattain their maximum velocity during the timefrom high water to low water are called ebbcurrents. The variation in the speed of the tidalcurrent from place to place is not necessarilyconsistent with the range of the tide.
In general, the current turns earlier near shorethan in midstream, where the speed is greater.The speed of the current also varies across achannel, being usually greater in midstream ormidchannel than nearshore. In winding rivers orchannels the strongest currents occur near theconcave shore and are weak or may eddy near theopposite (convex) shore.
Tidal currents also vary with depth. In a tidalestuary, particularly in the lower reaches wherethere is considerable difference in density fromtop to bottom, flood usually begins earlier near thebottom than at the surface. The difference maybeas much as one or two hours or as little as a fewminutes, depending on the estuary, the location inthe estuary and the freshwater conditions. Even
when the freshwater flow becomes so great as toprevent the surface marine current from flooding,it may still flood below the surface. The ebbspeed and strength usually decrease graduallyfrom top to bottom, but the speed of flood tide isoften stronger at subsurface depths than at thesurface.
Wave generated currents: When waves breakobliquely to the shoreline, they generate currentsin the direction of the wave opening. Thesecurrents are called longshore currents which moveparallel to the general orientation of the shoreline.Longshore currents are mainly responsible formoving sediments as well as other suspendedmatter along the shore. Longshore movementtakes place primarily in two zones. Beach driftingoccurs along the upper limit of’ the wave actionand is related to the swash and backwash of thewaves. The other zone is the surf zone where thelargest quantity of material is in suspension andwhich can be carried by relatively weak longshorecurrents,
Rip currents: Rip. currents flow seawards(though not too far seawards) perpendicular to theshoreline, when waves break. Rip currents areresponsible for transporting sediments out to seaparticularly in the surf zone.
2.2.5 Oceanic circulation
The totality of the systems of water movementis a very complex one. This is probably sobecause the factors which govern these variousmovements in both the vertical and horizontaldirections are themselves subject to considerablevariations. Besides, describing the motion of afluid which is itself in a basin that is rotating aswell as being in orbit and which is at the sametime influenced by the wind is bound to becomplicated. These motions are perhaps bestdescribed in terms of their complex mathematicssome of which can be found in any standard texton dynamic physical oceanography.
Oceanic circulation can be considered fromtwo angles - wind driven (mostly surface)circulation and thermohaline (mostly intermediateand deep) circulation. These divisions are veryuseful for descriptive purposes.
Wind driven circulation : Wind drivencirculation is directly influenced by atmosphericcirculation. Atmospheric circulation has solarradiation as its driving force and so radiation fromthe sun can be regarded as the ultimate driving
11
Optical Character Recognition (OCR) document. WARNING! Spelling errors might subsist. In order to accessto the original document in image form, click on "Original" button on 1st page.

force of oceanic circulation. Surface currentsgenerally have a horizontal component.
When the wind blows over the water surface,there is friction between moving air andmotionless water. Apart from causing ripples andwaves, the stress of the wind results in the transferof energy which causes water motion (currents).They may be turbulent or laminar depending onthe velocity of the causative wind. Because thesecurrents are generated at the air-water interphase,their strength decreases with depth.
The direct influence of atmospheric parameterson surface ocean circulation is apparent if oneexamines the relationship between the major gyresin the northern and southern hemispheres. Thecurrents, although following the wind patternclosely, are at an angle to it (45°) to the right andleft of the wind directions in the northern andsouthern hemispheres respectively. This is due tothe Coriolis or geostrophic effect. Otherpeculiarities include the tendency for westwardcurrent intensification. This is due to thelatitudinal variation in the magnitude ofacceleration associated with a solid rotating earthunder liquid oceans irrespective of hemisphere.
Thermohaline circulation: This type ofcirculation is associated with deep waters belowthe major wind driven currents and as the nameimplies, it is due to temperature and salinitydifferences. These differences result in densityvariations which set up movement akin to aconvection current. Thermohaline forcing can alsobe achieved by freshwater runoff from land whichsets up a salinity gradient normal to the coast.
Upwelling: Upwelling may be defined as theupward transport of sub-surface (often nutrientrich) cold water to the sea surface. It is caused bya variety of factors and varies in duration andextent.
In some coastal areas, the vertical temperatureprofile sometimes appears to be anomalous andreflects a breakdown in thermal stratification.This apparent anomaly can be caused bymovement of water in response to the Corioliseffect according to the Ekman Spiral during whichsurface winds result in the net horizontal transportof surface water, causing deeper, colder water torise (upwell) to the surface. In the northernhemisphere for example, where surface windsblow in a north-south direction on the western sideof a land mass, the wind results in the nettransport of surface water westwards making wayfor the deeper colder water to upwell. This settingis particularly true of coastal inshore upwelling.
Upwelling and the associated phenomenon ofdownwelling can also result from surface “windstress causing divergence or convergence. Theterm upwelling sometimes leads people intothinking that water is upwelled from the bottom.This is rarely the case and characterization ofwater masses in upwelling areas in terms of theirphysical, chemical and biological characteristicshas revealed that water is upwelled from depthsthat rarely exceed 400m.
Upwelling is very important in fisheries sincecool upwelled water usually contains relativelyhigh concentrations of nutrients especially nitrateand phosphate. Upwelling areas are thereforeusually fertile and may support rich fisheries.Examples of some rich fishing grounds based onupwelling include the Pacific coasts of Californiaand Peru and the Atlantic coast of southern Africaand off the coast of Ghana.
2.3 OCEANOGRAPHIC TECHNIQUES
Instruments for oceanographic measurementsand data gathering must have certain qualities -
High sensitivity and good reproducibility sothat even small fluctuations in thermodynamicvariables can be identified.Salt resistance.Ability to withstand hydrostatic pressure andsupply data not affected by pressure effects.Sufficiently robust to cope with rough fieldconditions.
2.3.1 Bathymetry
Bathymetry is the distance (water depth)between the water surface and the sea bottom.Methods that are used to determine water depthsare as follows:
i) Measurement of hydrostatic pressure. Fromhydrostatic pressure “p” of a water column themean density of which is known, the depth “z” isobtained according to the hydrostatic basicequation
here “g” = acceleration due to gravity andpressure measurements can be made with
12
Optical Character Recognition (OCR) document. WARNING! Spelling errors might subsist. In order to accessto the original document in image form, click on "Original" button on 1st page.
Bourdon tubes or Well tubes.ii) Measurement of sinking time of a free-
falling probe offers a very simple method for thedetermination of depth.
iii) Special measurement by means of an echosounder which sends a pulse through the water tothe sea bed. This pulse returns to the receiverwhere conversion of the speed and time is made toobtain the depth (D) based on the formula:
D= 0.5 VT
where V = velocity of the pulse (1500 m/s),and T = time of travel of pulse.
The bottom profile of the sea is printed on theecho sounder paper as an echogram.
2.3.2 Measurement of t ide (wa te r l eve lvariation)
Two types of gauges are used for measuringtidal variations : non-registering and self-registering. Non-registering gauges require thepresence of an observer to measure and record theheight of the tide. Self-registering, or automaticgauges, automatically record the rise and fall ofthe tide while unattended.
Non-registering gauges include the tide staff,the simplest kind of which consists of a plain staffor board about 2-5cm thick and 5-15cm wide andgraduated. The length of the staff should besufficient to extend from the lowest to the highesttide in the locality where the staff is to be used.The staff is secured in a vertical position byfastening it to a pile or other suitable support. Theheight of tides can be read from the graduationson the staff.
Self-recording tide gauges include :● Floa t gauges - with direct mechanical
registration of the water level.● Pneumatic gauge - in which a diving bell lies
on the sea floor at such a depth that pressurevariations due to surface waves can be ignored.By means of an air-filled tube, the hydrostaticpressure is connected with a recordingmanometer on shore on a measuring pole.
● Acoustic gauge - by means of acoustic signalssent to the seabed, the depth being determinedby the time required for a sound wave to travelfrom the ship or boat (acoustic transmitter) tothe bottom and for the echo to return.
A depth recorder can also be used to measuretides from submerged capsules and platforms. Foraccuracy, tidal readings must be related to adatum, the commonest being the chart datum.
2.3.3 Measurement of ocean surface waves
Waves can be measured from the sea floor, atthe sea surface or from an aircraft. The mostimportant method of measuring waves from thesea floor is the recording of bottom pressurefluctuations that reflect surface waves and whichcan be used to calculate surface displacements inaccordance with the linear wave theory. Inpressure gauges, the pressure sensor reactsexclusively on any variations of the hydrostaticpressure. Another method, though of lessimportance, is the measurement with a reversingecho sounder.
Float gauges and electrical measuring devicesare suited for measurement from the sea surface.They are deployed from fixed platforms, likebridges at the coast or pole research towers. Floatgauges are similar to those used for themeasurement of tides. With electrical devices,variations of water level are converted intochanges in electrical resistance capacitance. Inthe capacitive method, an insulated wire isstretched in a vertical position with a cylindricalcapacitor in the range where it is wetted withwater. The variation in length of wetted clinger,or the variations in size of the capacitorrespectively, correspond to the variations in waterlevel.
Wave observations from a ship can be carriedout visually, photographically or by means ofbuilt-in measuring devices (slip burner recorders).
Accelerometer instrumented buoys are oftenused for wave measurements in deeper waterswhere pressure sensors cannot be used and wherestructures are not available for attachment of othertypes of wave sensors. Accelerometers cantransmit wave measurements to a shore-basedreceiving station where wave data are recorded ormonitored in real time.
Aircraft and satellites which orbit the earthcarry sensors which can measure sea waves.However, the resolution and accuracy of wavedata from atmospheric measurements is still poorwhen compared with that from sea-basedinstruments described above. A promising recentdevelopment permits recording of the state of thesea from simultaneous measurements of the sea
1 3
Optical Character Recognition (OCR) document. WARNING! Spelling errors might subsist. In order to accessto the original document in image form, click on "Original" button on 1st page.
surface temperature through infrared andmicrowave radiation.
2.3.4 Measurement of currents
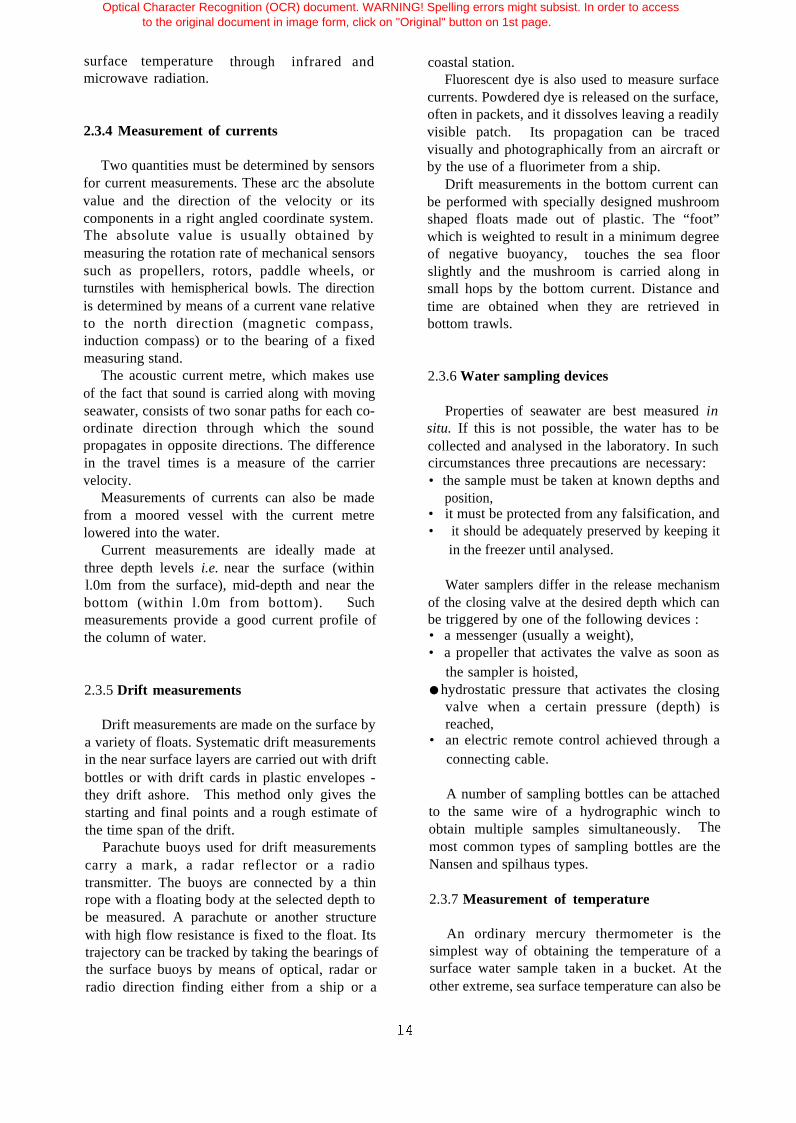
Two quantities must be determined by sensorsfor current measurements. These arc the absolutevalue and the direction of the velocity or itscomponents in a right angled coordinate system.The absolute value is usually obtained bymeasuring the rotation rate of mechanical sensorssuch as propellers, rotors, paddle wheels, orturnstiles with hemispherical bowls. The directionis determined by means of a current vane relativeto the north direction (magnetic compass,induction compass) or to the bearing of a fixedmeasuring stand.
The acoustic current metre, which makes useof the fact that sound is carried along with movingseawater, consists of two sonar paths for each co-ordinate direction through which the soundpropagates in opposite directions. The differencein the travel times is a measure of the carriervelocity.
Measurements of currents can also be madefrom a moored vessel with the current metrelowered into the water.
Current measurements are ideally made atthree depth levels i.e. near the surface (withinl.0m from the surface), mid-depth and near thebottom (within l.0m from bottom). Suchmeasurements provide a good current profile ofthe column of water.
2.3.5 Drift measurements
Drift measurements are made on the surface bya variety of floats. Systematic drift measurementsin the near surface layers are carried out with driftbottles or with drift cards in plastic envelopes -they drift ashore. This method only gives thestarting and final points and a rough estimate ofthe time span of the drift.
Parachute buoys used for drift measurementscarry a mark, a radar reflector or a radiotransmitter. The buoys are connected by a thinrope with a floating body at the selected depth tobe measured. A parachute or another structurewith high flow resistance is fixed to the float. Itstrajectory can be tracked by taking the bearings ofthe surface buoys by means of optical, radar orradio direction finding either from a ship or a
coastal station.Fluorescent dye is also used to measure surface
currents. Powdered dye is released on the surface,often in packets, and it dissolves leaving a readilyvisible patch. Its propagation can be tracedvisually and photographically from an aircraft orby the use of a fluorimeter from a ship.
Drift measurements in the bottom current canbe performed with specially designed mushroomshaped floats made out of plastic. The “foot”which is weighted to result in a minimum degreeof negative buoyancy, touches the sea floorslightly and the mushroom is carried along insmall hops by the bottom current. Distance andtime are obtained when they are retrieved inbottom trawls.
2.3.6 Water sampling devices
Properties of seawater are best measured insitu. If this is not possible, the water has to becollected and analysed in the laboratory. In suchcircumstances three precautions are necessary:• the sample must be taken at known depths and
position,• it must be protected from any falsification, and• it should be adequately preserved by keeping it
in the freezer until analysed.
Water samplers differ in the release mechanismof the closing valve at the desired depth which canbe triggered by one of the following devices :• a messenger (usually a weight),• a propeller that activates the valve as soon as
the sampler is hoisted,● hydrostatic pressure that activates the closing
valve when a certain pressure (depth) isreached,
• an electric remote control achieved through aconnecting cable.
A number of sampling bottles can be attachedto the same wire of a hydrographic winch toobtain multiple samples simultaneously. Themost common types of sampling bottles are theNansen and spilhaus types.
2.3.7 Measurement of temperature
An ordinary mercury thermometer is thesimplest way of obtaining the temperature of asurface water sample taken in a bucket. At theother extreme, sea surface temperature can also be
Optical Character Recognition (OCR) document. WARNING! Spelling errors might subsist. In order to accessto the original document in image form, click on "Original" button on 1st page.
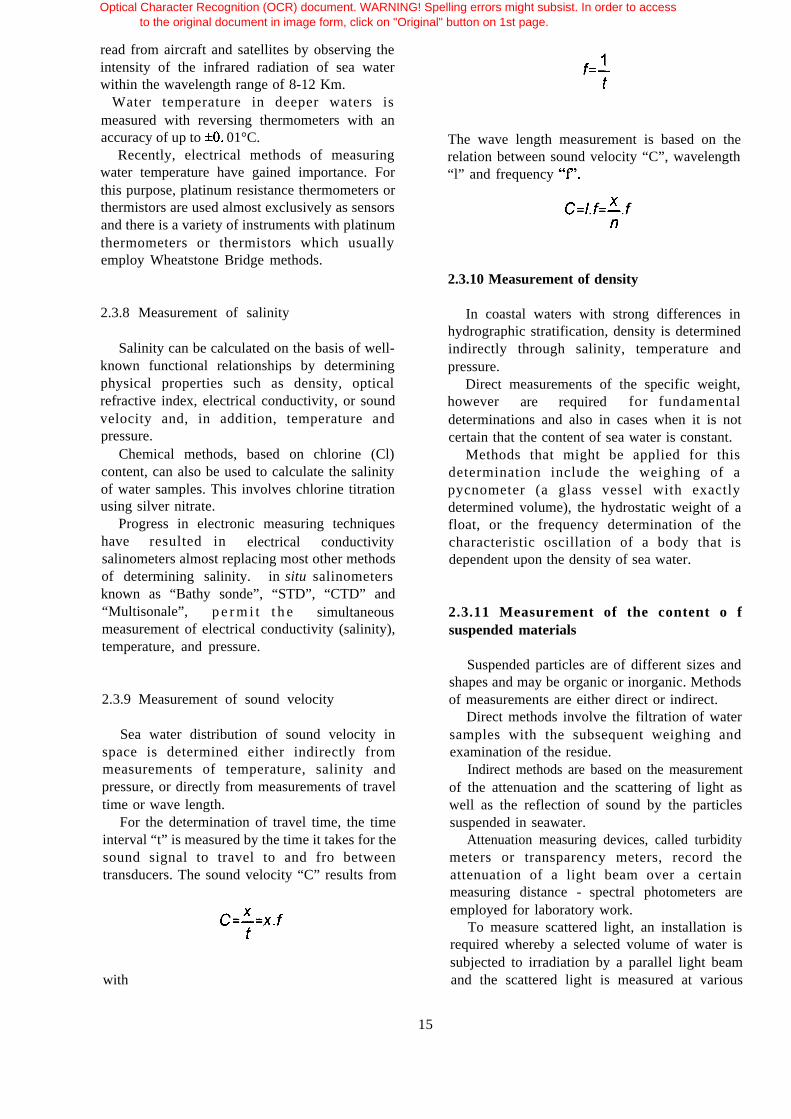
read from aircraft and satellites by observing theintensity of the infrared radiation of sea waterwithin the wavelength range of 8-12 Km. Water temperature in deeper waters ismeasured with reversing thermometers with anaccuracy of up to *0. 01°C.
Recently, electrical methods of measuringwater temperature have gained importance. Forthis purpose, platinum resistance thermometers orthermistors are used almost exclusively as sensorsand there is a variety of instruments with platinumthermometers or thermistors which usuallyemploy Wheatstone Bridge methods.
2.3.8 Measurement of salinity
Salinity can be calculated on the basis of well-known functional relationships by determiningphysical properties such as density, opticalrefractive index, electrical conductivity, or soundvelocity and, in addition, temperature andpressure.
Chemical methods, based on chlorine (Cl)content, can also be used to calculate the salinityof water samples. This involves chlorine titrationusing silver nitrate.
Progress in electronic measuring techniqueshave resulted in electrical conductivitysalinometers almost replacing most other methodsof determining salinity. in situ salinometersknown as “Bathy sonde”, “STD”, “CTD” and“Multisonale”, p e r m i t t h e simultaneousmeasurement of electrical conductivity (salinity),temperature, and pressure.
2.3.9 Measurement of sound velocity
Sea water distribution of sound velocity inspace is determined either indirectly frommeasurements of temperature, salinity andpressure, or directly from measurements of traveltime or wave length.
For the determination of travel time, the timeinterval “t” is measured by the time it takes for thesound signal to travel to and fro betweentransducers. The sound velocity “C” results from
with
The wave length measurement is based on therelation between sound velocity “C”, wavelength“l” and frequency “f
2.3.10 Measurement of density
In coastal waters with strong differences inhydrographic stratification, density is determinedindirectly through salinity, temperature andpressure.
Direct measurements of the specific weight,however are required for fundamentaldeterminations and also in cases when it is notcertain that the content of sea water is constant.
Methods that might be applied for thisdetermination include the weighing of apycnometer (a glass vessel with exactlydetermined volume), the hydrostatic weight of afloat, or the frequency determination of thecharacteristic oscillation of a body that isdependent upon the density of sea water.
2.3.11 Measurement of the content o fsuspended materials
Suspended particles are of different sizes andshapes and may be organic or inorganic. Methodsof measurements are either direct or indirect.
Direct methods involve the filtration of watersamples with the subsequent weighing andexamination of the residue.
Indirect methods are based on the measurementof the attenuation and the scattering of light aswell as the reflection of sound by the particlessuspended in seawater.
Attenuation measuring devices, called turbiditymeters or transparency meters, record theattenuation of a light beam over a certainmeasuring distance - spectral photometers areemployed for laboratory work.
To measure scattered light, an installation isrequired whereby a selected volume of water issubjected to irradiation by a parallel light beamand the scattered light is measured at various
15
Optical Character Recognition (OCR) document. WARNING! Spelling errors might subsist. In order to accessto the original document in image form, click on "Original" button on 1st page.
angles relative to the beam.
2.3.12 Measurement of dissolved substances
Dissolved substances in sea water are measuredfor two principal purposes - the first is todetermine the basic composition of thesecomponents which are only slightly influenced bybiological processes, if at all. The second is torecord whole ocean areas in space and time and toobserve biochemical processes in a delimitedregion.
Gravimetric proportion analysis, volumetricand calorimetric methods were earlier used tomeasure the dissolved substances in water. Morerecently, spectral photometric methods are usedfor the direct determination of nutrients and forthe measurement of several trace elements afterthey have been enriched and extracted. Thesemethods include, atomic absorptionspectrophotometry and neutron activationanalysis, gas chromatography, potentiometricmethods with ion-specific electrodes, inversepolarography and microbiological assays.
2.4 COASTAL PROCESSES SURVEY
2.4.1 Introduction
Coastal processes are those processes thataffect the morphology of beaches (includingcoastal areas) and shallow nearshore waters. Suchprocesses are usually the result of interactionsbetween marine and fluvial processes andmeteorologic al conditions. Suchland/sea/atmosphere interactions can be modifiedby human activities and can lead to significantchanges in coastal morphology.
Probably the most important natural forceshaping coastlines is the force of waves. In deepwater, fluid particles move in nearly closedexponential decaying circular orbits. But when thewater depth decreases to about one-half of thewave length, waves approaching the coast start to“feel” the bottom. Particle motion becomes moreand more elliptical and a velocity develops alongthe bottom that moves the bottom sediments. Asthe waves continue towards the beach, shoalingcauses wave steepness to increase until a pointwhere the depth is about 0.78 of the wave height.At this depth waves break. As waves break, water
moves forward as a line of foam which carriesfine sand in suspension toward the inner beach.When the foam line slows down, sand is depositedon the beach. Some of the remaining water,which has not percolated into the beach, returns asgravity flow down the beach taking sand with it.At the point where this flow meets the forwardmoving water of the next incoming wave, theoutgoing material is deposited forming a lowseaward facing beach slope that changes positionwith wave conditions.
Continuous pounding of beaches, especiallysandy ones, results in beach profiles developingwith time since the sediments are composed ofmovable particles.
Ocean waves affect beaches in two ways.Firstly, relatively steep wind waves cause beacherosion by taking sand and other materials fromthe area just above the water level andtransporting them into deeper water. Secondly,waves approaching the beach at an angle breaknear the beach and generate a current that movesparallel to the shore line. This is called littoralcurrent or longshore current and is mostnoticeable in the surf zone. Longshore current isan important coastal process since it carries largeamounts of beach sand, stirred into suspension bythe breaking waves, along the beach.
2.4.2 Causes of beach erosion
Beach erosion can be caused by both naturaland human activities. These causes however, varyfrom area to area and in intensity. Some of thenatural causes include: low lying topography,intense wave climate, vulnerable soilcharacteristics, nature of shelf width andtopography and the occurrence of offshorecanyons.
Anthropogenic activities causing beach erosioninclude : damming of rivers which reduces thesediment reaching the shoreline, construction ofharbour protection structures and jetties, beachsand mining, removal of coastal vegetation anddredging activities.
Subsidence which may be induced by naturalcompaction of sediments or by human activitiessuch as oil and groundwater extraction can alsoexacerbate rates of coastal erosion. Furthermore,the problems of coastal erosion worldwide areexpected to be exacerbated by predicted sea levelrise.
16
Optical Character Recognition (OCR) document. WARNING! Spelling errors might subsist. In order to accessto the original document in image form, click on "Original" button on 1st page.
2.4.3 Beach erosion monitoring
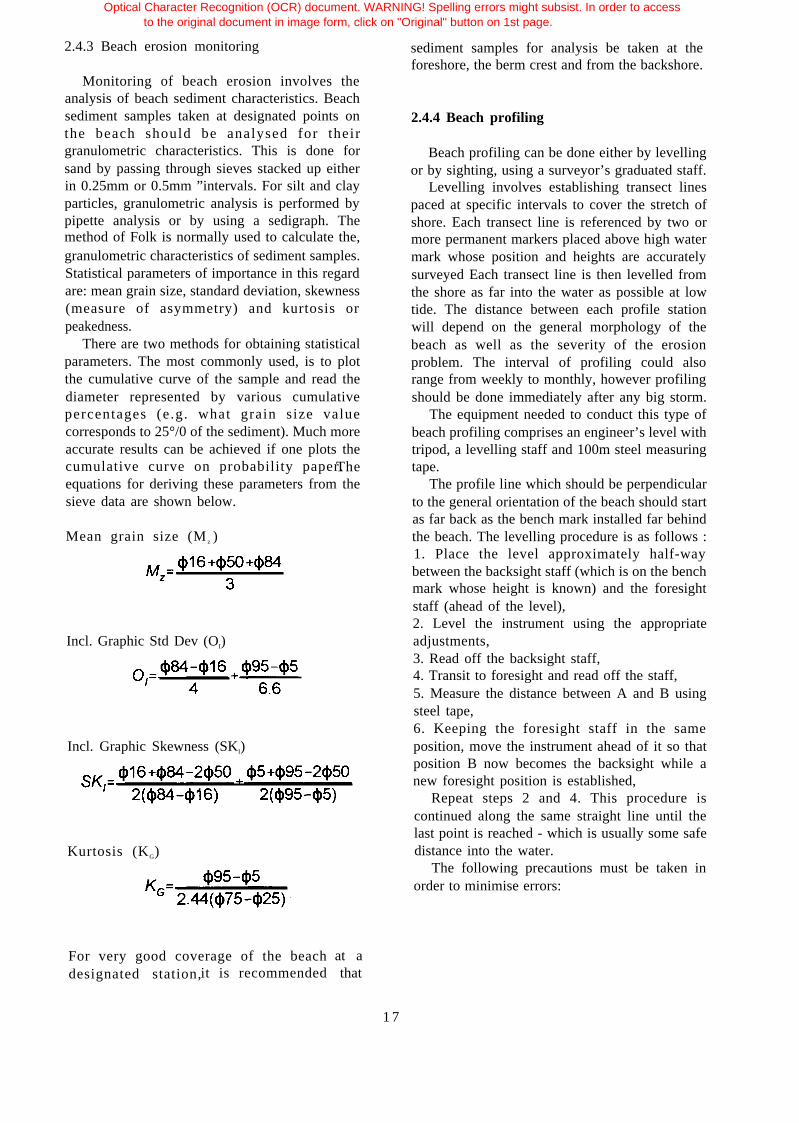
Monitoring of beach erosion involves theanalysis of beach sediment characteristics. Beachsediment samples taken at designated points onthe beach should be analysed for theirgranulometric characteristics. This is done forsand by passing through sieves stacked up eitherin 0.25mm or 0.5mm ”intervals. For silt and clayparticles, granulometric analysis is performed bypipette analysis or by using a sedigraph. Themethod of Folk is normally used to calculate the,granulometric characteristics of sediment samples.Statistical parameters of importance in this regardare: mean grain size, standard deviation, skewness(measure of asymmetry) and kurtosis orpeakedness.
There are two methods for obtaining statisticalparameters. The most commonly used, is to plotthe cumulative curve of the sample and read thediameter represented by various cumulativepercentages (e.g. what grain size valuecorresponds to 25°/0 of the sediment). Much moreaccurate results can be achieved if one plots thecumulative curve on probability paper.Theequations for deriving these parameters from thesieve data are shown below.
Mean grain size (M z )
Incl. Graphic Std Dev (OI)
Incl. Graphic Skewness (SKI)
Kurtosis (KG)
For very good coverage of the beachdesignated station,it is recommended
at athat
sediment samples for analysis be taken at theforeshore, the berm crest and from the backshore.
2.4.4 Beach profiling
Beach profiling can be done either by levellingor by sighting, using a surveyor’s graduated staff.
Levelling involves establishing transect linespaced at specific intervals to cover the stretch ofshore. Each transect line is referenced by two ormore permanent markers placed above high watermark whose position and heights are accuratelysurveyed Each transect line is then levelled fromthe shore as far into the water as possible at lowtide. The distance between each profile stationwill depend on the general morphology of thebeach as well as the severity of the erosionproblem. The interval of profiling could alsorange from weekly to monthly, however profilingshould be done immediately after any big storm.
The equipment needed to conduct this type ofbeach profiling comprises an engineer’s level withtripod, a levelling staff and 100m steel measuringtape.
The profile line which should be perpendicularto the general orientation of the beach should startas far back as the bench mark installed far behindthe beach. The levelling procedure is as follows :1. Place the level approximately half-waybetween the backsight staff (which is on the benchmark whose height is known) and the foresightstaff (ahead of the level),2. Level the instrument using the appropriateadjustments,3. Read off the backsight staff,4. Transit to foresight and read off the staff,5. Measure the distance between A and B usingsteel tape,6. Keeping the foresight staff in the sameposition, move the instrument ahead of it so thatposition B now becomes the backsight while anew foresight position is established,
Repeat steps 2 and 4. This procedure iscontinued along the same straight line until thelast point is reached - which is usually some safedistance into the water.
The following precautions must be taken inorder to minimise errors:
1 7
Optical Character Recognition (OCR) document. WARNING! Spelling errors might subsist. In order to accessto the original document in image form, click on "Original" button on 1st page.
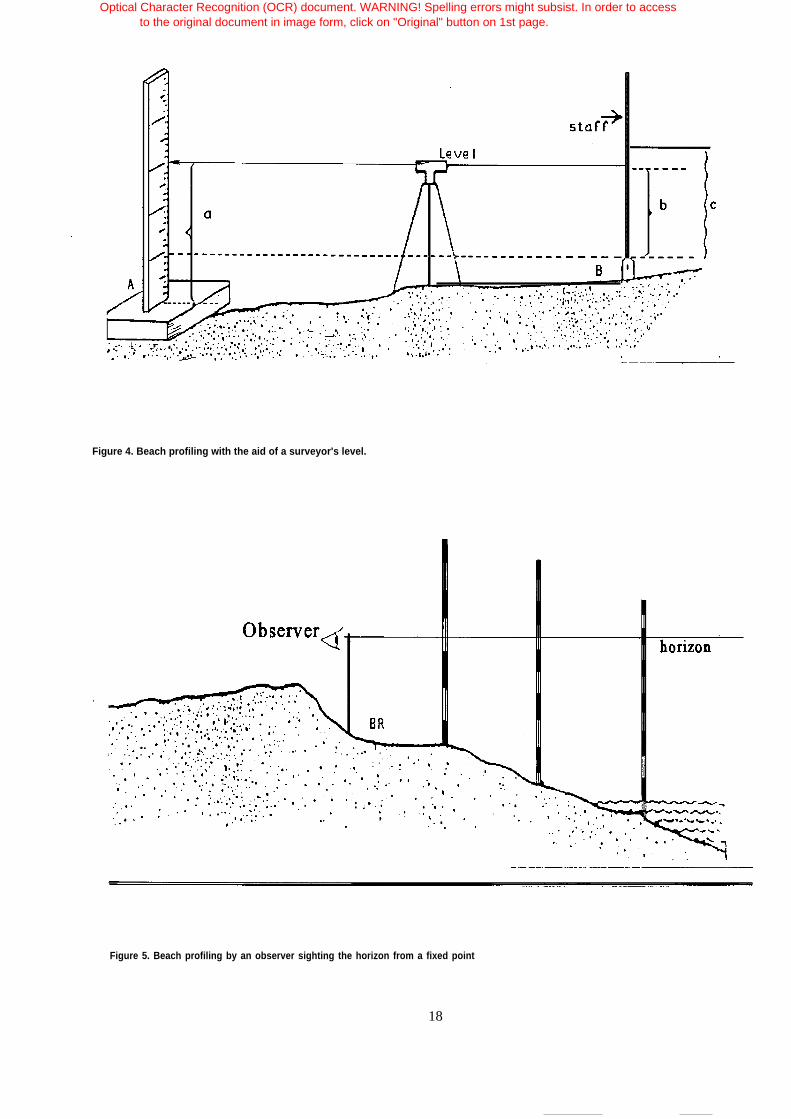
Figure 4. Beach profiling with the aid of a surveyor's level.
.
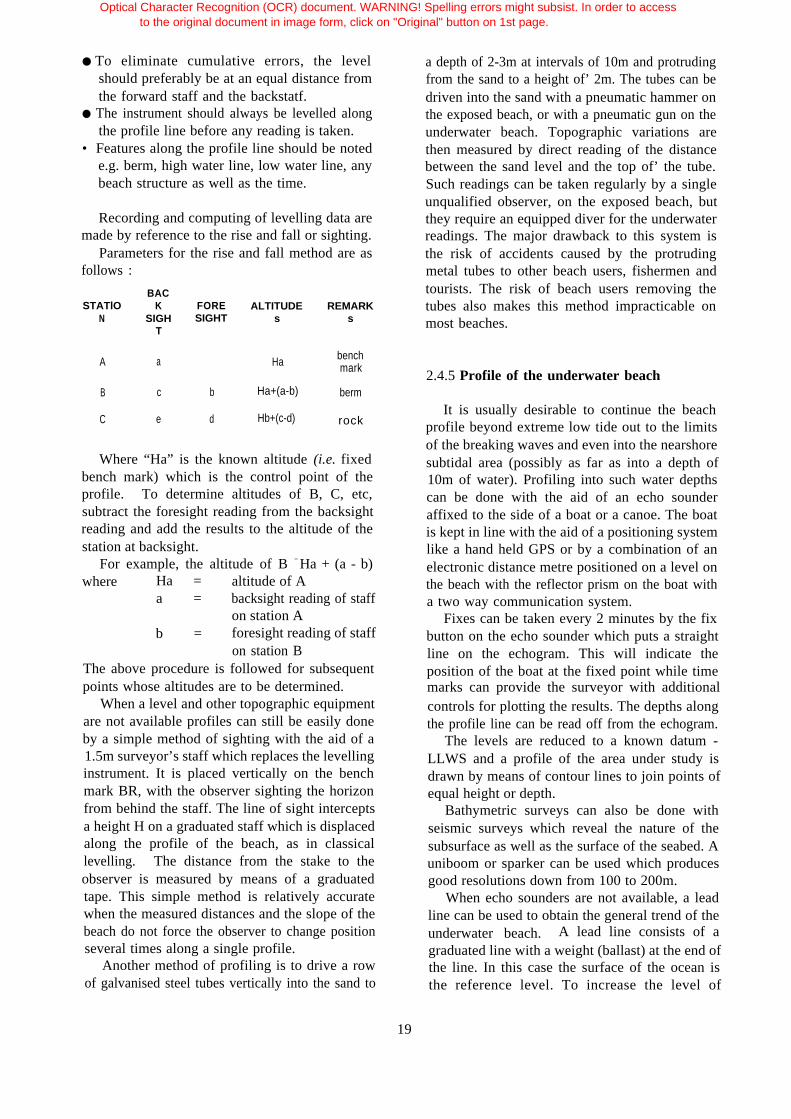
Figure 5. Beach profiling by an observer sighting the horizon from a fixed point
18
Optical Character Recognition (OCR) document. WARNING! Spelling errors might subsist. In order to accessto the original document in image form, click on "Original" button on 1st page.
● To eliminate cumulative errors, the levelshould preferably be at an equal distance fromthe forward staff and the backstatf.
● The instrument should always be levelled alongthe profile line before any reading is taken.
• Features along the profile line should be notede.g. berm, high water line, low water line, anybeach structure as well as the time.
Recording and computing of levelling data aremade by reference to the rise and fall or sighting.
Parameters for the rise and fall method are asfollows :
BACSTATlO K FORE ALTITUDE REMARK
N SIGH SIGHT s sT
A a Ha benchmark
B c b Ha+(a-b) berm
C e d Hb+(c-d) rock
Where “Ha” is the known altitude (i.e. fixedbench mark) which is the control point of theprofile. To determine altitudes of B, C, etc,subtract the foresight reading from the backsightreading and add the results to the altitude of thestation at backsight.
For example, the altitude of B = Ha + (a - b)where Ha = altitude of A
a = backsight reading of staffon station A
b = foresight reading of staffon station B
The above procedure is followed for subsequentpoints whose altitudes are to be determined.
When a level and other topographic equipmentare not available profiles can still be easily doneby a simple method of sighting with the aid of a1.5m surveyor’s staff which replaces the levellinginstrument. It is placed vertically on the benchmark BR, with the observer sighting the horizonfrom behind the staff. The line of sight interceptsa height H on a graduated staff which is displacedalong the profile of the beach, as in classicallevelling. The distance from the stake to theobserver is measured by means of a graduatedtape. This simple method is relatively accuratewhen the measured distances and the slope of thebeach do not force the observer to change positionseveral times along a single profile.
Another method of profiling is to drive a rowof galvanised steel tubes vertically into the sand to
a depth of 2-3m at intervals of 10m and protrudingfrom the sand to a height of’ 2m. The tubes can bedriven into the sand with a pneumatic hammer onthe exposed beach, or with a pneumatic gun on theunderwater beach. Topographic variations arethen measured by direct reading of the distancebetween the sand level and the top of’ the tube.Such readings can be taken regularly by a singleunqualified observer, on the exposed beach, butthey require an equipped diver for the underwaterreadings. The major drawback to this system isthe risk of accidents caused by the protrudingmetal tubes to other beach users, fishermen andtourists. The risk of beach users removing thetubes also makes this method impracticable onmost beaches.
2.4.5 Profile of the underwater beach
It is usually desirable to continue the beachprofile beyond extreme low tide out to the limitsof the breaking waves and even into the nearshoresubtidal area (possibly as far as into a depth of10m of water). Profiling into such water depthscan be done with the aid of an echo sounderaffixed to the side of a boat or a canoe. The boatis kept in line with the aid of a positioning systemlike a hand held GPS or by a combination of anelectronic distance metre positioned on a level onthe beach with the reflector prism on the boat witha two way communication system.
Fixes can be taken every 2 minutes by the fixbutton on the echo sounder which puts a straightline on the echogram. This will indicate theposition of the boat at the fixed point while timemarks can provide the surveyor with additionalcontrols for plotting the results. The depths alongthe profile line can be read off from the echogram.
The levels are reduced to a known datum -LLWS and a profile of the area under study isdrawn by means of contour lines to join points ofequal height or depth.
Bathymetric surveys can also be done withseismic surveys which reveal the nature of thesubsurface as well as the surface of the seabed. Auniboom or sparker can be used which producesgood resolutions down from 100 to 200m.
When echo sounders are not available, a leadline can be used to obtain the general trend of theunderwater beach. A lead line consists of agraduated line with a weight (ballast) at the end ofthe line. In this case the surface of the ocean isthe reference level. To increase the level of
19
Optical Character Recognition (OCR) document. WARNING! Spelling errors might subsist. In order to accessto the original document in image form, click on "Original" button on 1st page.
accuracy when using this method, it is importantthat the intervals at which the depths are taken bevery close. It is also important that the surveyorshould keep along the line of profile.
The sea state, especially the tide, should bemonitored during bathymetric surveys. This willhelp relate bathymetric data to a known datum.
2.4.6 Littoral environment observations
It is important that hydrodynamiccharacteristics be recorded at each station duringeach beach profiling. While sophisticatedequipment is available to monitor these, they canbe measured more simply by visual observation.
The main hydrodynamic variables that shouldbe measured along the beach are:●
●
●
●
●
●
Wave type: This is done by visually observingthe most prevalent type of breaking waves aseither spilling, plunging, or surging.Amplitude of waves at breaking point (Hb):This is done by averaging 10 to 20 visualestimates of the amplitudes of successivewaves. These estimates are made, if necessary,with a swell measuring rod graduated every0.5m and permanently fixed in the breakingzone. A trained observer can estimate waveamplitude to within plus or minus 10cm.Period of waves: This is deduced from the timeseparating the breaking of 10 successive waves.Direction of the waves at the breaking point(b): This can be estimated by means of asimple protractor fixed horizontally to a postand with its base running parallel to theshoreline. Taking the averages of 10consecutive visual estimates yields thedirection of the propagation of the waveswithin a few degrees.Longshore currents: To measure the directionof the longshore current that is generatedbetween the breaking zone and the shoreline, afloat is thrown into the breaking waves and thedirection of movement of the float is known asthe direction of the longshore current. Theaverage speed of the current is estimated bystaking a distance of 10m and timing thedisplacement of the float over the stakeddistance. The current speed is then determinedby dividing the staked distance of 10m by thetime. This is done three or more times and theaverage is taken as the speed of the current.Width of the breaking zone (W): This isestimated visually as the distance between the
●
breaking line and the shoreline.Sea level: This is observed by visual estimationof the average level on a graduated rod fixed inthe sea near the shoreline; the same rod can beused to estimate the swell characteristics.
Other meteorological data that should berecorded during each beach visit, include:●
●
●
●
Air and water temperature: this is usually donewith the aid of a simple thermometer.Wind speed: A hand held anemometer is usedfor this.Wind direction: This can be estimated byholding a handkerchief in the air and noting thedirection of wind. The direction can then beestimated with the aid of a compass.General weather conditions: Brief anddescriptive notes on any other weatherconditions as well as anything else of intereston the beach should be recorded.
REFERENCES
Awosika, L F, Ibe, C E, Nwankvvu, E O, Balogun,A and Adekoya, E A (1992) Physical andGeological Factors Affecting the Transport,Dispersion and Deposition of Pollutants in theLagos Lagoon, Nigeria. WACAF II Phase 2Project. A Progress report for IOC.
Cook, P (1994) Offshore Mineral Resources. In :Proceedings International Conference onOceanography. Lisbon, November 1994.
Davis, R A (Jr), (1977) Principles ofOceanography Addison - Wesley.
Defant, A, (1961) Physical Oceanography VOl.IPergamon Press.
Dietrich et al, (1972) General Oceanography.
Earle, M D, and Bishop J M (1984) A Practicalguide to Ocean Measurement and Analysis.Published by ENDECO, Inc. Marion, MAU.S.A.
Ibe, A C, (1982) A review of potential economicmineral resources in offshore Nigeria. NIOMRTech. Paper No. 8.
Ibe, A C, Ajao, E A, Oyewo, E O, Awosika, L F,Ihenyen, A E, Tiamiyu, A I, Ibe, C E,
20
Optical Character Recognition (OCR) document. WARNING! Spelling errors might subsist. In order to accessto the original document in image form, click on "Original" button on 1st page.
Inegbedion, L and Adekanye, J E (1988)Physico-chemical Parameters and Dynamics ofthe Ocean off Lagos, Cruises 1, 2, and 3. Areport for the Nigerian Army.
Ibe, A C and Quelennec, R E (1989) Methodologyfor the assessment and control of coastalerosion in West and Central Africa. UNEPRegional Seas Reports and Studies No. 107.UNEP, Nairobi.
Knauss, J A, (1978) Introduction to PhysicalOceanography. Prentice - Hall Inc.
Lewis, E L and Perkin, R G, (1981) The PracticalSalinity Scale 1978. Deep Sea Research28A(4): 307-328.
US Army Coastal Engineering Research Centre(CERC) (1973) Shore Protection Manual. U.S.Army Corps of Engineers, Fort Belvoir,Virginia.
21
Optical Character Recognition (OCR) document. WARNING! Spelling errors might subsist. In order to accessto the original document in image form, click on "Original" button on 1st page.
PART 3 : LIVING RESOURCES ASSESSMENT METHODS
Living resources include all living things frommangroves to manatees to microbes. They alsoinclude ecosystem functioning, health andintegrity and, for the purpose of coastal survey,they include also subsistence fishing as well ascommercial, economic use of various resources.Living resources also include the living landscape- whatever gives a particular part of the globe itsunique ecological and aesthetic character.
3.1 ECOLOGICAL SURVEY
One of the most common reasons forecological survey is to document the ecologicalsituation and establish a baseline of what needs tobe managed and their condition.
This is basically a description of the biologicalenvironment including all its biota, their trophicrelationships, various life stages and seasonalvariations, the presence of rare and endangeredspecies, and the presence of special populations orecological communities such as mangroves, coralreefs, wetland systems, and seagrass meadows.
The biological environment often reflects, andhas an influence on, the physical environment.For example, coral reefs and mangrove forestsplay a major role in controlling coastal erosion. Itis therefore artificial to make a clear distinctionbetween the biological and physical environmentand ecological surveys usually address a holisticview.
3.1.1 Macro scale survey
Macro scale surveys utilize visualrepresentations of data, often in a coarse format.Topographic maps, bathymetric charts andthematic maps (e.g. geology, vegetation) are themost common of the coarse data summaries.When coupled with local knowledge which can besuperimposed on the base maps and after somevalidation by rapid checking in the field, they areoften more than adequate as macro surveys.
Better definition and detail can be provided byaerial photographs whether taken vertically or
time series, aerial photographs can provideaccurate information on trends in mangrovedistribution, the migration of sand spits, the extentof seagrass meadows, etc.
3.1.2 Rapid rural appraisal
This is an excellent survey technique which canprovide a quick preliminary assessment of thesituation for comparatively little cost. It providesmainly a good “gut feeling” and may requirefollow-up, however, after an effective rapid ruralappraisal, any follow-up can be targeted muchbetter.
The techniques employed in rapid ruralappraisal can include any combination of: reviewof existing data, direct personal observations,semi-structured interviews with local people,community meetings, relating of personal storiesand experience, drawing of diagrams, etc.
Rapid rural appraisal can be used successfullyto establish a baseline of the existing situation. Itcan then be repeated to record historical changes,particularly those within the collective livingmemory of a community. It can also provide acomprehensive analysis of single events such as acyclone, a flood or an oil spill. It is alsoextremely valuable to provide an insight into theseasonal variability of a particular environment,especially when the investigator is limited to oneparticular time of the year.
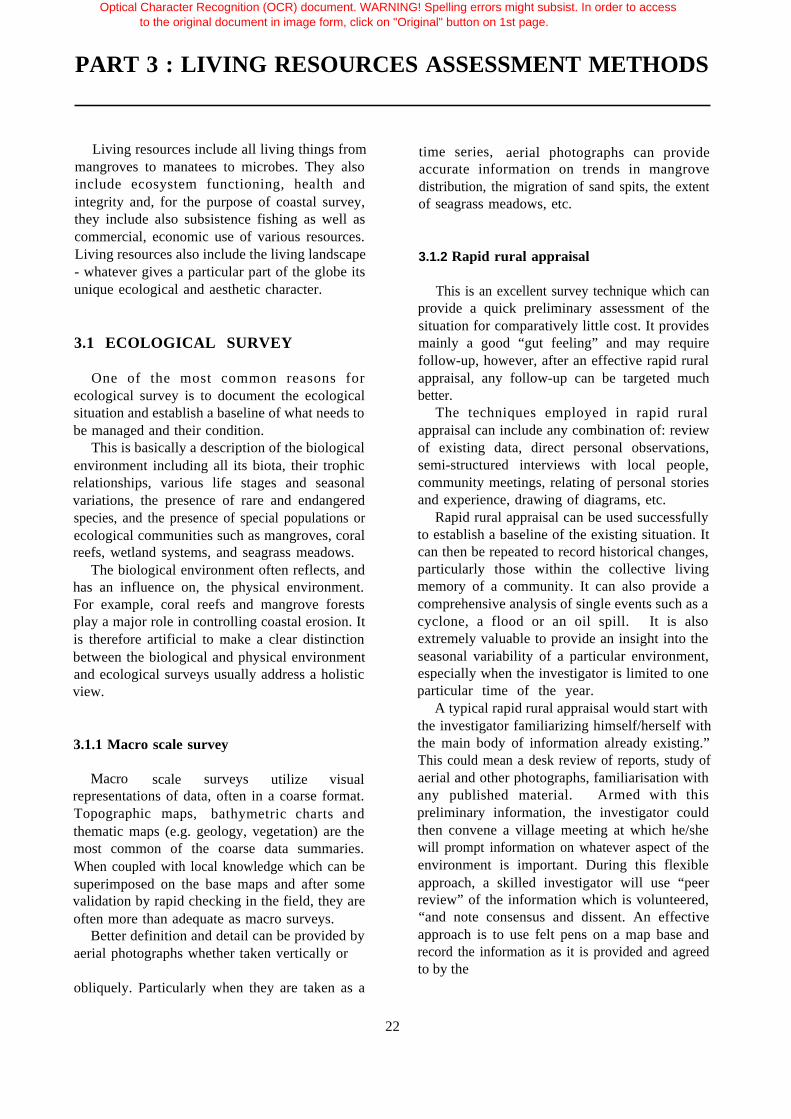
A typical rapid rural appraisal would start withthe investigator familiarizing himself/herself withthe main body of information already existing.”This could mean a desk review of reports, study ofaerial and other photographs, familiarisation withany published material. Armed with thispreliminary information, the investigator couldthen convene a village meeting at which he/shewill prompt information on whatever aspect of theenvironment is important. During this flexibleapproach, a skilled investigator will use “peerreview” of the information which is volunteered,
“and note consensus and dissent. An effectiveapproach is to use felt pens on a map base andrecord the information as it is provided and agreedto by the
obliquely. Particularly when they are taken as a
22
Optical Character Recognition (OCR) document. WARNING! Spelling errors might subsist. In order to accessto the original document in image form, click on "Original" button on 1st page.
meeting participants. It is also possible to takeone or two knowledgeable local people into thefield to validate the critical information throughspot checks. The data can then be refined andconverted onto annotated maps, cross-sections ofthe environment, time sequences, etc. These willserve as a strong basis for any more thoroughassessment or survey that is deemed necessary.
3.1.3 Remote sensing
While rapid rural appraisal is usually the leastcostly and most basic ecological surveymethodology, remote sensing is often the mostsophisticated and most expensive. However, itcan also be the most objective and most accurateand, depending on the environment that is beingsurveyed, it can also be very cost-effective.
Remote sensing can be defined as the obtainingof data about a target without the sensor being incontact with the target.
There are many sensor and recording systemsand they include photographic cameras(sometimes with specialized type of film),radiometers and radar systems which can recordin photographic form or in digital form. Digitaldata, which depends on image processing systemsto be transformed into useable imagery, is veryversatile and can make corrections for radiometricand geometric “noise” and can also be enhancedusing specialized spectral techniques.
Figure 6. Sketch map of a peasantland-holding and activities in Ethiopia
Remote sensing using space satellites has beenused to provide data on : ocean colour (whichreflects productivity, sediment load, planktonblooms, etc), sea surface temperatures (canindicate upwelling), surface wind and waveconditions (essential when dealing with an oilspill), landuse (down to a resolution of 10 metresby the SPOT satellite), bathymetry, oil pollution,submerged (e.g. algae and seagrasses) andemergent (e.g. mangrove) vegetation distribution.
There are some serious limitations of satelliteremote sensing techniques for coastal survey.With a return period of 16-26 days, it is notconsidered as providing sufficient temporalresolution for such a dynamic environment.Interpretation of satellite images is often hinderedby tidal fluctuations and other influences (such asstorm surges) on surface water levels. Cloudcover, which is very common in humid tropicalcoastal environments, is a big problem and canonly be overcome by the use of microwavesensors. Finally, light penetration in water islimited and therefore the deeper one tries to readbelow the water surface, the less reliable the databecomes.
3.1.4 “On the ground” survey
On the ground ecological survey is the mostcommon and relies on standard methodologiesusually employing a sampling approach. Forexample :
23
Optical Character Recognition (OCR) document. WARNING! Spelling errors might subsist. In order to accessto the original document in image form, click on "Original" button on 1st page.
• Transects - which record the presence (andabundance) or absence of biota and the natureof the environment along a linear path.
• Quadrats - usually a square metre and used inconjunction with a transect. Can consist of aphotograph (e.g. to record the extent of coverby algae).
• Deep cores -to penetrate beneath the surface ofsand or mud. Requires sieving and counting.
• Trawl - usually for a set period of time at a setspeed, in mid-water or at the bottom, to recordlarger epibenthic biota.
• Plankton nets - tow nets can be towed for a setperiod of time, at a set speed and level in thewater column; alternatively, weighted drop netscan be used to sample vertically the watercolumn at a selected location.
● Gill nets - a standard length of net with astandard mesh size, set for a specific period oftime at a specific depth level.All the above methodologies rely on samples in
order to interpret the overall situation. If the datafrom samples is to be extrapolated to the whole,the samples must be known to be representativeaccording to reliable statistical techniques. Theminimum number of replicate samples required toobtain representativness, is the number at which a100% increase in sample numbers will only leadto a 5-10% improvement in accuracy.
It is also essential that samples are replicable sothat results from different sites can be comparedand contrasted, and so that repeat samples of thesame site can be taken over time in order toobserve any changes. The only way to ensurereplicability is to record the approach andmethodology used right from the planning stages,through to field work and subsequent analysis.
3.1.5 Some common sampling approaches
Estuarine finfish are best sampled by set gillnets, of about 75mm mesh size and about 150metres long. It is probably best if the samplingnet conforms to the equipment used by localfisherfolk. Aerial photographs are often used todetermine the best location for setting the nets.They are usually set at high tide, parallel to themangrove fringe or across small creeks, andcollected some six hours later at low tide. Theexercise needs to be repeated at least three times,depending on variability and the state of the tidemust be consistent each time. Care must be takento take into consideration the time of day and theweather conditions during the sampling period and
immediately prior to it - fish behaviour can beinfluenced dramatically by these and similarparameters.
Reef finfish are best sampled by swimmingalong a transect for, say, 100 metres along the reefedge, and counting all the fish within 1-2 metreson either side of a rope floating on the surface.The counting could be repeated on the returnswim. The transect rope can be placedpermanently for better replicability. However,care must be taken to avoid the disturbance factor.
Pelagic fish are more difficult to sample.However, an idea of their distribution and densitycan be obtained through point counts. These aremade by a solitary diver (using SCUBA) who isrelatively stationary, and who scans a full 360°circle, counting all fish within a set radius of, say,10 metres. A larger area can be covered byrepeating the solitary and stationary stations atpre-determined locations.
Bottom data and benthic biota can be recordedvery accurately through the use of quadrats alonga transect. The presence of sessile organisms isoften expressed as a percentage of ground coverand this is usually made easier by working withquadrats which are one square metre in area.These quadrats can either remain fixed to theseabed or they can be repeated with reference tofixed markers. Photographs can also be extremelyuseful for bottom sampling.
With sessile organisms it is also possible torecord competition for space, survival andsuccession. This is done by sampling thesettlement patterns over a period of time. Inplanning such a survey, it is important todetermine the frequency of sampling dependingon the data required (e.g. bivalve settlement dates,growth rate, fouling organisms, etc). Thesubstrate that is to be used to attract settlementmust be chosen very carefully and a decisionneeds to be made on whether it is necessary tosample different levels in the water column.Common substrates include tiles, rope, bamboo,slate.
For this exercise, samples of the substratematerial are deployed in pairs at the pre-determined depth or depths and at the pre-determined time intervals. On each visit, a newpair of substrate samples are deployed and one ofthe previous pair is removed for analysis. Thisprovides a record of what settlement has takenplace between visits and records the survival rateof different species and different age classes ofthe same species. It can also
24
Optical Character Recognition (OCR) document. WARNING! Spelling errors might subsist. In order to accessto the original document in image form, click on "Original" button on 1st page.

Optical Character Recognition (OCR) document. WARNING! Spelling errors might subsist. In order to accessto the original document in image form, click on "Original" button on 1st page.
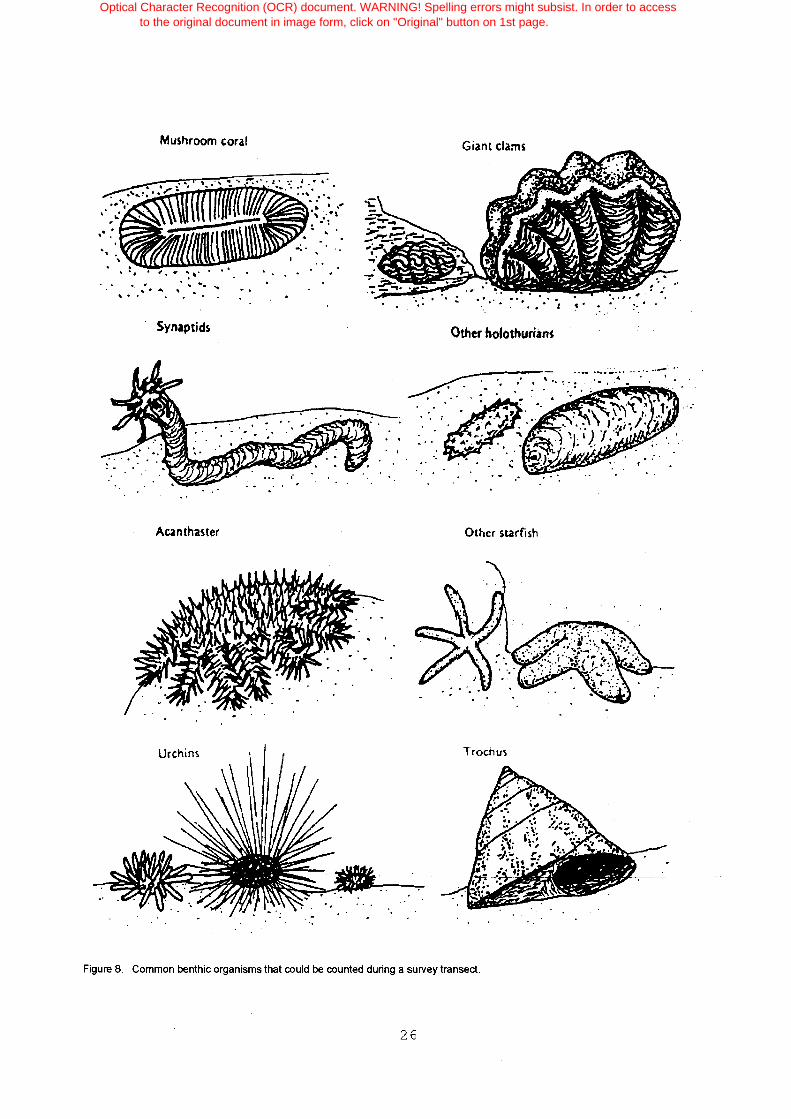
Optical Character Recognition (OCR) document. WARNING! Spelling errors might subsist. In order to accessto the original document in image form, click on "Original" button on 1st page.
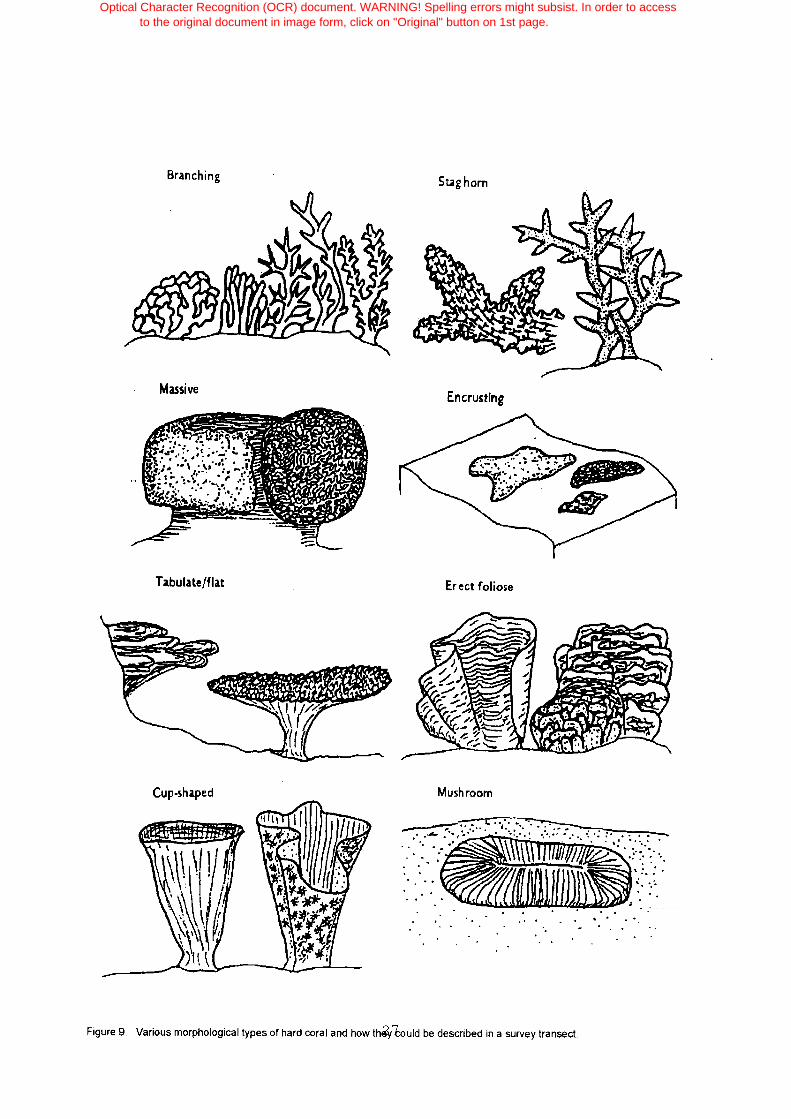
Optical Character Recognition (OCR) document. WARNING! Spelling errors might subsist. In order to accessto the original document in image form, click on "Original" button on 1st page.
indicate prefered substrates, provide an insightinto zonation with depth, identify high and lowseasons for different species and recordsuccession patterns.
The picture can be made even more completeif the settlement sampling is complemented byplankton samples (see above). They shouldindicate the planktonic stages of sessile organismsbefore they settle and could permit reasonablyaccurate forecasting of settlement. The life stagescan be taken back to an even earlier stage bysampling the adult population which is thought tobe the source of the planktonic larvae and thesubsequent settlement. By taking gonad samplesand assessing their stage of maturity, it should bepossible to predict when the larvae are going toappear in the plankton and when they are likely tostart settling. Such a sampling strategy is oftenused to predict the settlement of mussels, oystersand other commercially valuable organisms.
3.2
3.2.1
MONITORING
Objectives and principles of monitoring
Survey is the methodical gathering of datawhile monitoring is regular, repetitive surveys.
Monitoring may be carried out for a variety ofreasons :• to discover what there is, find out the situation• to discover change, determine trends• to assess impact• to check predictions and forecasts• to check compliance with regulations• to measure performance and effectiveness.
Having determined why monitoring needs to becarried out it is important to determine what is tobe monitored, and where - this requires planning.
Unfortunately much monitoring is undertakenwithout adequate justification or planning. Thisresults in extravagant and expensive masses ofdata being collected, never to be used.
For monitoring to be meaningful, effective andfully justified, it must satisfy most, if not all, thefollowing criteria -• it must be according to clear objectives of what
is to be monitored, and why;• no more than the minimum number of simple
measurements or observations should be made;• monitoring should be carried out with the
minimum frequency;
•
•
the products of monitoring (data) must besubjected to meaningful processing, analysisand interpretation; and,monitoring must set in motion pre-determinedaction by previously identified individualsaccording to agreed contingency plans.
As an example, the objectives of a monitoringstrategy following a coastal development, couldbe:• to document the success or otherwise of the
project;• to ensure that impacts are no worse than
predicted;• to guard against unpredicted, unplanned
outcomes;• to act as an early warning system and provide
an information base for necessary action.
Since monitoring can be very expensive andexasperating, care must be taken to ensure thatmeasurements are no more than is necessary.Neither should measurements be any more thancan be usefully anaylzed - excessive data are notonly useless, they are also expensive.
Those undertaking field measurements, as areoften necessary for survey and monitoring, mayencounter a number of difficulties such as accessto the site, weather, state of the tide, season, timeof day, etc. It must be remembered that the easierit is to collect the data, the more likely that thedata will be reliable, consistent and applicable.
It is also extremely important to guard againstpersonal and subjective interpretation of the data.Most monitoring programmes are usually of longduration and they may go beyond the change ofpersonnel. It is therefore imperative thatinterpretation of the data must be objective andaccording to measurable parameters, and does.not rely on the analyst.
Routine and boring analyses, performedmanually, increase the risk of mistakes.Therefore, if at all possible, repetitive tasks shouldbe automated. This ensures consistency andreduces the chances of error.
A c o m m o n object ive of monitoringprogrammes is to ensure that certain criteria arebeing met, or other conditions upheld. In suchcases, it is necessary to plan for what action willbe taken when monitoring indicates that theselimits are in danger of being exceeded. It is notenough to document and record the deteriorationof the coastal environment - what is more
28
Optical Character Recognition (OCR) document. WARNING! Spelling errors might subsist. In order to accessto the original document in image form, click on "Original" button on 1st page.
important is the action that will be taken to arrestthe deterioration before it exceeds what has beendetermined as acceptable. There needs to be acommitment to such remedial action with clearlyidentified responsibilities - who does what - whichwill be triggered by the results of monitoring.
3.2.2 Indicator species
Long-term monitoring seeks to identifychanges that were not predicted. One way inwhich this can be done is through the sampling ofa reliable indicator species.
Not every species can be used as an indicatorspecies. Indicator species must show a markedresponse to environmental stress. They need to beeither extremely tolerant or extremely susceptibleto change. Their response can be manifested bytheir physical presence or absence, by theirbehaviour, or by their anatomical or physiologicalreactions. Ideally, the individual members of anindicator species should be of consistent anduniform morphology so that when anatomicalchanges occur they are uniform and noticeable.They must be easy to see and identify, and easy tosample if they are present.
The coral reef is a difficult environment tosearch for indicator species because the organismsand ecological assemblages are highly variableand changes are often not related to humanactivities. Factors which cause stress to coralsmay also do so in a manner which is difficult todistinguish.
However, an ecological expert with good localknowledge, may be able to select one or moreindicator species even from among a difficultgroup such as corals. For example, corals withfinely branching structures or those with cup-shaped morphology, are often more vulnerable toincreases in suspended sediment than the massivecoral varieties. While the growth pattern of somecup corals may be influenced by high sedimentloads to make them more tolerant, theirmorphological adaptations can be used asindications of higher than normal sediment loads.The most common adaptation under suchcircumstances is for the cup corals to form onlyincomplete cups so sediment can be excluded atthe base.
3.3 INFORMATION MANAGEMENT
What should be done with the results of surveyand monitoring?
There is a distinction between data andinformation. Survey and monitoring produce datawhich are most often screeds of figures and rawobservations of very little use to anyone in theircrude state. These data must be transformed intoinformation which is an accessible, retrievableand user-friendly product. The transformation ofdata into information comprises processing,analysis, interpretation and eventfully applicationand this process can be referred to as data orinformation management.
The type and format of information depends onthe needs of the user or users, and this relates backto the objectives of survey and monitoring in thefirst place. The various formats for informationmanagement and display can be grouped looselyinto six categories - simple tabulation, matrix,graphics, databases, maps and plans, and GIS.
3.3.1 Simple Tabulation
This is probably the most commonly usedformat for displaying numerical data. By usingrows and columns in a logical manner, a table canprovide visual relationships and connections andtransform raw data into information.
3.3.2 Matrix
Almost by definition, a matrix is expected to bemore complex than a simple tabulation. Itprovides an analytical relationship between data ina visual display - a cumulative visual summary ofall impacts on all resources.
For example, a matrix can be used to assess theimpacts on coastal resources of an activity such asdredging. In such a matrix, all resources(including amenity values, uses, etc) are listed onthe vertical
29
Optical Character Recognition (OCR) document. WARNING! Spelling errors might subsist. In order to accessto the original document in image form, click on "Original" button on 1st page.
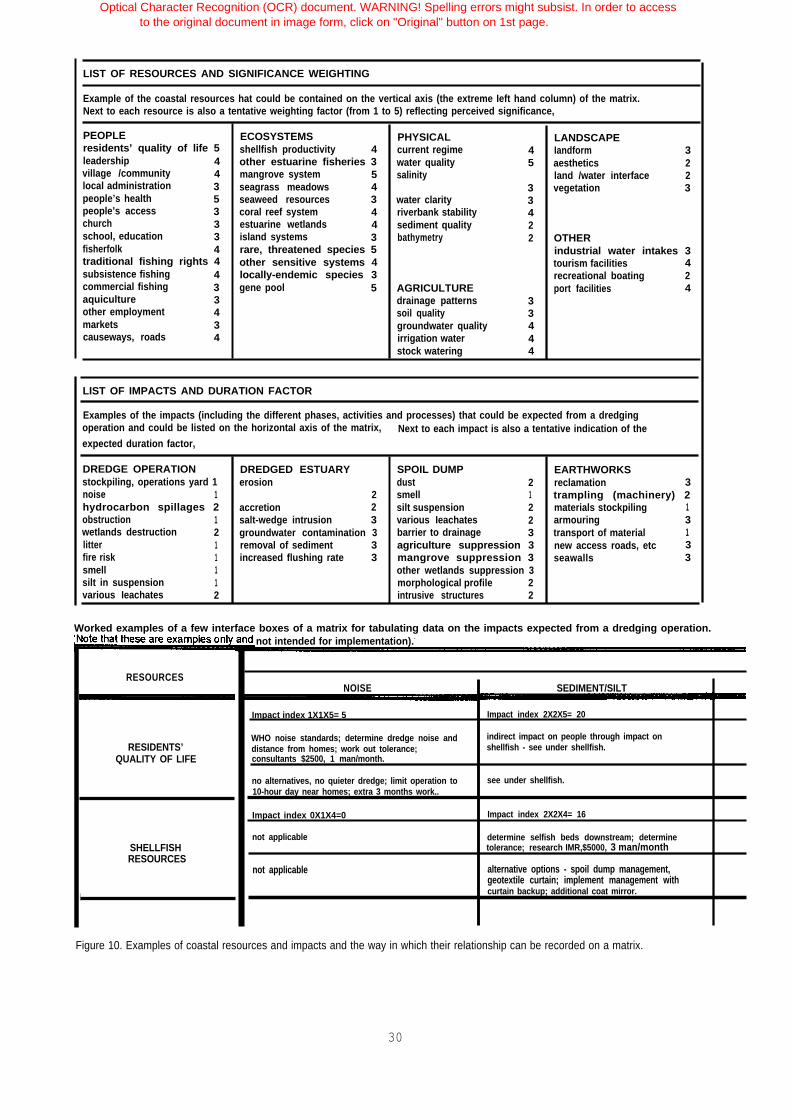
LIST OF RESOURCES AND SIGNIFICANCE WEIGHTING
Example of the coastal resources hat could be contained on the vertical axis (the extreme Ieft hand column) of the matrix.Next to each resource is also a tentative weighting factor (from 1 to 5) reflecting perceived significance,
PEOPLE ECOSYSTEMS PHYSICAL LANDSCAPEresidents’ quality of life 5 shellfish productivity 4 current regime 4 Iandform 3leadership 4 other estuarine fisheries 3 water quality 5 aesthetics 2village /community 4 mangrove system 5 salinity land /water interface 2local administration 3 seagrass meadows 4 3 vegetation 3people’s health 5 seaweed resources 3 water clarity 3people’s access 3 coral reef system 4 riverbank stability 4church 3 estuarine wetlands 4 sediment quality 2school, education 3 island systems 3 bathymetry 2fisherfolk
OTHER4 rare, threatened species 5
traditional fishing rights 4industrial water intakes 3
other sensitive systems 4 tourism facilities 4subsistence fishing 4 locally-endemic species 3 recreational boating 2commercial fishing 3 gene pool 5 AGRICULTURE port facilities 4aquiculture 3 drainage patterns 3other employment 4 soil quality 3markets 3 groundwater quality 4causeways, roads 4 irrigation water 4
stock watering 4
LIST OF IMPACTS AND DURATION FACTOR
Examples of the impacts (including the different phases, activities and processes) that could be expected from a dredgingoperation and could be listed on the horizontal axis of the matrix, Next to each impact is also a tentative indication of theexpected duration factor,
DREDGE OPERATION DREDGED ESTUARY SPOIL DUMP EARTHWORKSstockpiling, operations yard 1 erosion dust 2 reclamation 3noise 1 2 smell 1hydrocarbon spillages 2
trampling (machinery) 2accretion 2 silt suspension 2 materials stockpiling 1
obstruction 1 salt-wedge intrusion 3 various Ieachates 2 armouring 3wetlands destruction 2 groundwater contamination 3 barrier to drainage 3 transport of material 1litter 1 removal of sediment 3 agriculture suppression 3 new access roads, etc 3fire risk 1 increased flushing rate 3 mangrove suppression 3 seawalls 3smell 1 other wetlands suppression 3silt in suspension 1 morphological profile 2various Ieachates 2 intrusive structures 2
not intended for implementation).-
Worked examples of a few interface boxes of a matrix for tabulating data on the impacts expected from a dredging operation.
RESOURCES
RESIDENTS’QUALITY OF LIFE
SHELLFISHRESOURCES
I
Figure 10. Examples of coastal resources and impacts and the way in which their relationship can be recorded on a matrix.
30
NOISE SEDIMENT/SILT
Impact index 1X1X5= 5 Impact index 2X2X5= 20
WHO noise standards; determine dredge noise anddistance from homes; work out tolerance;
indirect impact on people through impact onshellfish - see under shellfish.
consultants $2500, 1 man/month.
no alternatives, no quieter dredge; limit operation to see under shellfish.10-hour day near homes; extra 3 months work..
Impact index 0X1X4=0 Impact index 2X2X4= 16
not applicable determine selfish beds downstream; determinetolerance; research IMR,$5000, 3 man/month
not applicable alternative options - spoil dump management,geotextile curtain; implement management withcurtain backup; additional coat mirror.
Optical Character Recognition (OCR) document. WARNING! Spelling errors might subsist. In order to accessto the original document in image form, click on "Original" button on 1st page.

axis, together with a numerical weighting factor(say from 1 to 5) to reflect the perceivedsignificance or value. All impacts (from variousphases, activities and processes) are listed on thehorizontal axis, together with a weighting factorreflecting the expected duration of the impact (1= short term, 2 = long term, 3 = irreversible). Infact? the preparation of these two lists is already avery useful exercise providing a mental checklistof areas of contention.
Having listed all the resources and all theimpacts, the next stage is to relate, in an analyticalmanner, the items on the vertical axis with thoseon the horizontal axis. This relationship can inmost cases be translated into a numerical impactindex. Wherever the grid intersects, a judgementis made of the severity of the particular impact onthe particular resource, and this can range from O(no impact, not applicable) to 3 (high impact).The numerical value representing impact severityis multiplied by the figure for impact duration andthe result is multiplied further by the figurerepresenting the resource significance or value.The resulting figure can be called the impactindex and it provides an excellent comparativepicture of where the problem areas of adevelopment are likely to arise. It must bestressed that the impact index is not an absolutefigure but only a comparative one within the sameimpact assessment exercise. Although it is notable to be used for comparison across projects, itcan certainly provide useful information on thecomparative costs and benefits of variousmitigation measures proposed within a project, aswell as a good picture of cumulative impacts.Although it is only relative and indicative, ratherthan absolute, it can be a very useful andinexpensive data analytical tool in the hands of anexperienced assessor.
Examples of the lists of resources and impactsand a worked example of a few interface boxes ofthe matrix are given in Figure 10 above.
3.3.3 Graphics
Graphic presentation of the results of surveyand monitoring can range from common graphs tocomplicated illustrations. The latter can be hand-drawn or photographic images. Although they arenot expected to have a degree of accuracy thatwill enable them to be used as identificationguides, all illustrations of plants and animalsshould depict what they are trying to represent asaccurately as possible. It is important for graphic
representations to be kept simple, avoiding clutterand avoiding the need for interpretation - if theycannot convey the information without resortingto explanatory text, it may be better to simply relyon the text.
3.3.4 Databases
A database can be defined as a collection ofdata related to a particular topic or for a particularpurpose. A database management system storesand retrieves data in the form of information.Simple databases can range from a field notebook,to a filing cabinet, a card index, a photocollection, a bibliography, etc.
A computerized database management systemis a software programme used to store and retrievedata or information on computer. Much has beenmade of electronic databases in recent time and itis worth remembering that the database is madeup of what the user puts in - the computer onlyprovides the system that stores and retrieves data.
However, a relational database managementsystem has the added ability to manage the systemin a related manner. This means that changes orupdates in one cluster of data, will be reflected ina related cluster.
Before investing time and money in setting upa database, especially if it is a sophisticatedelectronic one, it is essential to determine at theoutset the purpose of the database, who will use it,what are his/her needs, which are the mostimportant parameters or fields or data sets, and therelationship between them.
3.3.5 Maps and Plans
Maps and plans of coastal resources representa significant advance from tabulations, matricesand graphic presentations of the results of surveyand monitoring. Maps and plans truly transformdata into information since they present the resultswithin a spatial, geographic context, giving theman added dimension. Maps and plans allow theuser to collate, analyse synthesise and apply; largeamounts of information, in a simple, visualrepresentation. They can juxtapose resource dataand demands on resources; and they can indicateconflicting demands and potential impacts beforethey occur.
Maps and plans are a versatile and sound basisfor decisions on resource use. They are anexcellent tool for professional managers of coastalresources.
31
Optical Character Recognition (OCR) document. WARNING! Spelling errors might subsist. In order to accessto the original document in image form, click on "Original" button on 1st page.
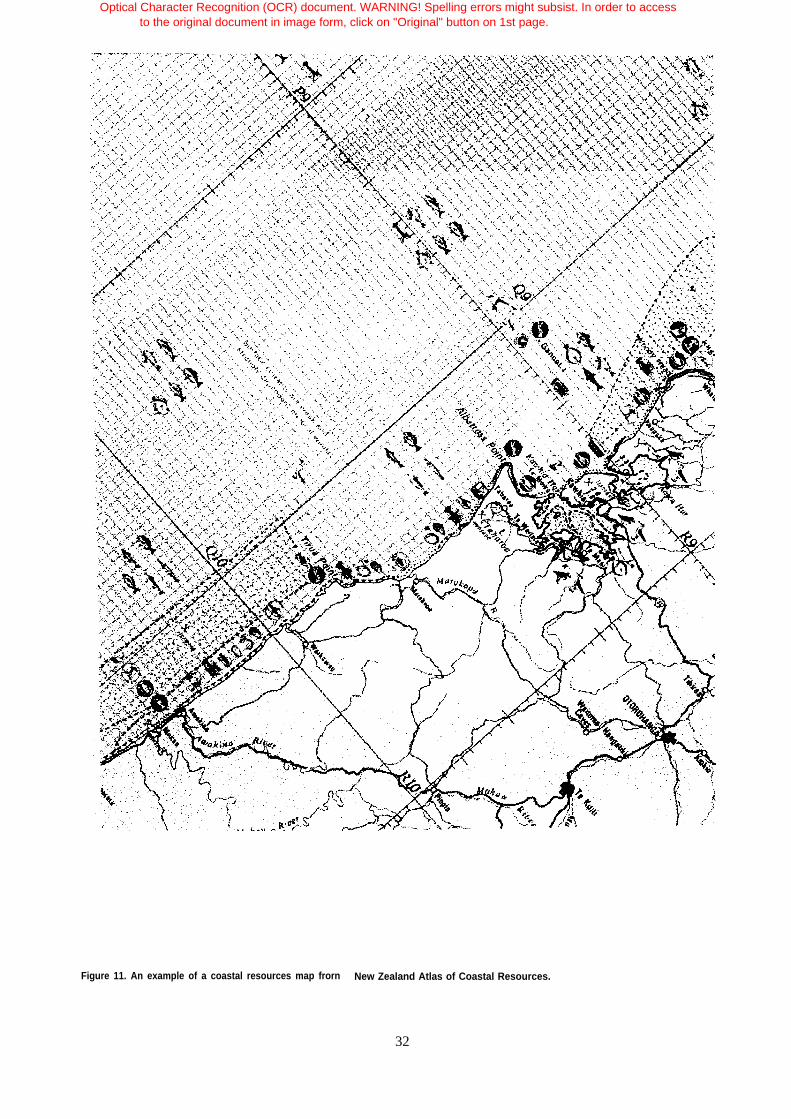
Figure 11. An example of a coastal resources map frorn New Zealand Atlas of Coastal Resources.
32
Optical Character Recognition (OCR) document. WARNING! Spelling errors might subsist. In order to accessto the original document in image form, click on "Original" button on 1st page.
They can expose weaknesses in the availableinformation base and help focus research efforts.They can inform members of the public, makingthem more sensitive to the multiple issues thatneed to be resolved. They are a good early guidefor developers and a good departure point for anyassessment of the potential impacts of a proposeddevelopment. They are a very good source offormal educational material both at the secondaryand tertiary levels. Finally, they are an excellentrecord and a subsequent measure, for policies,objectives and goals for coastal area management.
Maps and plans can accommodate an enormousamount of information, but they need to bedesigned by a professional cartographer in orderto finish up as a good, useful product. Figure 11is an example of a resource map taken from theNew Zealand Atlas of Coastal Resources (Tortell,1981).
3.3.6 Geographic Information Systems (GIS)
A GIS is a computer-based system that caninputt, retrieve, analyze and display geographicallyreferenced information. It is often erroneouslyregarded as synonymous with, or closely tied toremote sensing, database management, computer-aided design (CAD), and computer cartography.In fact, it is allied to all these and has somecommon elements with some of them. However,it is a unique tool, very sophisticated, andcomprising elements of all except perhaps, remotesensing.
There are a number of benefits and advantagesGIS in resource management :it integrates data of various types (graphics,text, digital, analogue);it has an enhanced capacity for data exchangeamong disciplines or departments;it can process and analyse data very efficientlyand effectively;it can apply models, testing and comparingalternative scenarios;it has a facility for efficient updating of data(including graphic data);it has the ability of handling large volumes ofdata.
The dimensions of integrated coastal areamanagement are very broad and encompass themaritime influence on land as well as theterrestrial influence on water. They also includea third dimension of depth, taking in water volume
with vertical variability. Coastal areas have fuzzyboundaries both physical (land and sea interface)and administrative (coastal area limits formanagement purposes). Finally, the coastal areahas a wide array of scales and processes - fromthe microscopic biological processes, to chemicalones, from the spread of the Exclusive EconomicZone (EEZ) to the millimetres of sea level rise.An ideal GIS would be able to deal with theserequirements and complexities, but none does asyet, at least not completely. Most good GISprogrammes can handle the third dimension(depth), but a fourth dimension (time) is stillbeyond existing software.
GIS therefore has limitations, but in spite ofthese limitations, it is an excellent tool for coastalarea planning and management and an efficientmechanism for handling data and transforming itinto information.
3.4 WORKED EXAMPLE
The following worked example is a summaryof the processes described above, i.e. tbe role ofsurvey and monitoring in integrated coastal areaplanning and management. .
A fictitious locality called “Seaside Bay” willbe used for the purpose of this example. SeasideBay can be considered as an average sort of baysurrounded by a mixture of permanent residents,tourists and visitors in season, and a small amountof industrial activity.
3.4.1 The existing situation
A coastal area management plan has beendeveloped and adopted for Seaside Bay with broadpublic participation. Through survey and datagathering, the plan reflects the communityconsensus on the ecological and other resources ofSeaside Bay, their uses, the demands made onthem, the value placed on them by the community,and the relative priorities. This baselineinformation is summarised in a detailed resourcemap of the bay which shows various zones whichguide day-to-day managers and decision-makers.
For example, it has been determined that aparticular part of the bay is excellent for oysterfarming. It is also known that this activityprovides employment for a significant number offamilies directly and an even greater number offamilies indirectly. Data are available on the
- -
Optical Character Recognition (OCR) document. WARNING! Spelling errors might subsist. In order to accessto the original document in image form, click on "Original" button on 1st page.
income generated by the oyster farming industrythrough the sale of oysters, the servicing of theoperation, and by attracting tourists. Oysterfarming is therefore a priority resource whichmust be managed on a sustainable basis.
In order to ensure protection of the oysterfarming industry, surveys have determined themost important requirements of oysters. Theseinclude, for example, no oil or other hydrocarbonsin the water because of tainting, and a certainminimum concentration of dissolved oxygen.These two parameters, as well as a number ofothers, have been adopted as water qualitystandards for Seaside Bay. The local authority forSeaside Bay is seeking a mathematical model itcan apply to determine the assimilative capacityof the bay for a number of critical parameters.Unfortunately, mathematical models areexpensive and therefore, for the moment, the localauthority ensures that water quality standards arenot exceeded by an effective monitoringprogramme.
3.4.2 Proposed development
A developer proposes to build a factory andapplies for the necessary permits and consents.
The Environmental Impact Assessment (EIA)Process is applied and closely tied to theintegrated coastal area management process.Among other things, the factory is expected torequire diesel as the fuel source and will have aneffluent discharge which will include highbiochemical oxygen demand (BOD),
Unless the original ecological data baseline isconsidered to still be reliable and up-to-date, anew survey will need to be undertaken by thedeveloper for the EIA. There will be a number ofsubmissions probably from individuals, from theoyster farmers and their organization, from thetourist hotel operators, and from others such asscientists, etc. Some of these individuals andgroups will conduct their own survey and datagathering, or they may rely on information whichalready exists.
The EIA Review Board and/or the PlanningAuthority, will assess the proposal as described inthe EIA, in the light of all the submissionsreceived and having conducted its own survey andresearch. They are likely to ask for the advice ofvarious experts and will eventually grant ordecline the application. If the application isgranted, conditions will need to be attached to
ensure that the factory will not jeopardize thewater quality standards and that the oysterfarming industry is protected.
Once approval is given and the factory is built,the local authority staff will need to monitor theeffluent discharge to ensure that the levels ofcontaminants set in the conditions of the permitare not being exceeded. They must also monitorthe receiving waters of the bay to ensure thatwater quality standards are being respected.Finally, they must also do periodic checks of thevarious resources identified in the coastal areamanagement plan to ensure that they are not atrisk. Occasionally, the local authority will need torepeat its survey of ecological baseline conditionsas a pre-emptive, precautionary measure.Eventually, new survey will be needed when theIntegrated Coastal Area Management Plan isreviewed, which should be about every five years.
REFERENCES
Dahl, A L (1981) Coral Reef MonitoringHandbook. South Pacific Commission, Noumea.
Kam, S P, Paw, J N, and Loo, M (19xx) The useof remote sensing and geographic informationsystems in coastal zone management. In:Integrative Framework and Methods forCoastal Area Management. ICLARM, Manila.
McCracken, J A, Pretty, J N, and Conway, G R(undated) An Introduction to Rapid RuralAppraisal for Agricultural Development.International Institute for Environment andDevelopment.
Tortell, Philip (1981) New Zealand Atlas ofCoastal Resources. New Zealand GovernmentPrinter, Wellington.
Tortell, P, Collins, D, DuBois, R, Gwyther, D,and Sedlak, O (1992) EnvironmentalGuide l ines for Dredg ing and R iverImprovement. United Nations Food &Agriculture Organization (FAO), Rome.
Tortell, P (1992) Coastal Zone SensitivityMapping and its Role in Marine EnvironmentalManagement. Marine Pollution Bulletin 25(1-4):88-93.
34
Optical Character Recognition (OCR) document. WARNING! Spelling errors might subsist. In order to accessto the original document in image form, click on "Original" button on 1st page.