Award of Excellence Small Area/Special Area Planning Elizabeth Area Plan
Ocean Special Area Management Plan
Ocean SAMP D R A F T of 7/23/10 Chapter 7 Page 1 of 59
Chapter 7
Marine Transportation, Navigation and Infrastructure
Table of Contents
700 Introduction…………………………………………………………………………...…3 710 History of Marine Transportation and Naval Activities in the SAMP
Area……………………………………………………………………………………....5 720 Navigation Features in the SAMP Area..........................................................................9 720.1 Area Overview…………………………………………………………………….9
720.2 Shipping Lanes, Traffic Separation Schemes and Precautionary Areas……..11 720.3 Recommended Vessel Routes……………………………………………………12
720.4 Ferry Routes……………………………………………………………………...12 720.5 Pilot Boarding Areas…………………………………………………………….12
720.6 Anchorages……………………………………………………………………….13 720.7 Navy Restricted Areas………………………………………………………….. 13
720.8 Right Whale Seasonal Management Area……………………………………...16 730 Marine Transportation in the SAMP Area...................................................................18
730.1 Shipping Activity …..……………………………………………………………18 730.2 Cargo Vessels…………………………………………………………………….27 730.3 Passenger Ferries………………………………………………………………...29 730.4 Cruise Ships…………………….………………………………………………..33 730.5 Naval Vessels ……………….……………………………………………………34 730.6 Other Government/Enforcement ………………………………………............36 730.7 Other Vessels…………………………………………………………………….36
740 Ports and Harbors Adjacent to the SAMP Area …………………………………....37 740.1 Providence…...…………………………………………………………………..37 740.2 Quonset/Davisville………………………………………………………………38 740.3 Fall River…………………………………………………………………………41 740.4 Newport…………………………………………………………………………..42 740.5 Point Judith………………………………………………………………………42
740.6 Block Island………………………….…………………………………………...42 750 Other Infrastructure in the SAMP Area ………………..……………………………43 750.1 Disposal Sites………………………………………………………………….….43 750.2 Unexploded Ordnance (UXO)…………………………………………………..43
750.3 Underwater Cables………………………………………………………………43
760 Value of Marine Transportation and Navigational Uses within the SAMP Area….46

Ocean Special Area Management Plan
Ocean SAMP D R A F T of 7/23/10 Chapter 7 Page 2 of 59
770 Marine Transportation, Navigation and Infrastructure Policies ………..………….49 770.1 Policies………………………………………………………………………….…49 770.2 Standards…………………………………………………………………………50 780 Works Cited……………………………………………………………...…………..….52 Tables Table 1. Vessel Transits In and Out of Narragansett Bay Using Federally Maintained
Navigation Channels in 2007………………..…………….…...………………………..19 Table 2. Volume of Cargo Transported in 2007…………………………………………...…….20 Table 3. Annual Cargo Volume Processed by Narragansett Bay Ports between 1997
and 2007…………..…………………………………..……………………………...….21 Table 4. Number and Types of Barges Entering Narragansett Bay in 2007…………………….28 Table 5. Description of Ferry Operations within the SAMP Area………………………………32 Table 6. Passengers Carried Between 2003 and 2005 Aboard Ferries Operating
Within the Ocean SAMP Area………………………………………………….……….33 Table 7. Port of Davisville Monthly Car Carrier Visits and Vehicle Units Imported,
July 2007 through June 2009……………………………...…………………………….40 Table 8. Economic Impact of the Port of Providence in 2006…………………………………...47 Table 9. Economic Impact of the Port of Davisville in 2007………………………...………….47 Table 10. Economic Impact of the Naval Undersea Warfare Center Division Newport,
2007-2008………………………………………..……………………………………..48 Figures Figure 1. Map of Select Navigation Features…………………………………...……………….10 Figure 2. Map of Naval Operating Areas………………………………………………………..15 Figure 3. Map of Right Whale Seasonal Management Area…………………………………….17 Figure 4. Annual Cargo Volume Processed by Narragansett Bay Ports, 1997-2007……………21 Figure 5. Total Number of Vessel Transits and Volume of Cargo Processed in Providence, RI…………………………………………………………………………………..…..22 Figure 6. Map of Commercial Ship Traffic Based on AIS Data…………………………...……25 Figure 7. Map of Commercial Ship Traffic and Navigation Areas………………………...……26 Figure 8. Map of Ferry Routes…………………………………………………………………...31 Figure 9. Map of Underwater Cables, Unexploded Ordnance, and Dredge Disposal Site………45

Ocean Special Area Management Plan
Ocean SAMP D R A F T of 7/23/10 Chapter 7 Page 3 of 59
Section 700: Introduction
1. The area enclosed by the SAMP boundary is an important and highly valuable marine transportation corridor. The SAMP area represents a crossroads between multiple heavily-used waterways: Narragansett Bay, Long Island Sound, Buzzards Bay, and Vineyard Sound. Vessels pass through the SAMP area when passing between these waterways en route to commercial ports, harbors, and other facilities. These vessels include cargo ships, such as tankers, bulk carriers, and tug and barges; passenger ferries; naval vessels; government research, enforcement, and search-and-rescue vessels; and pilot boats. They carry goods, move people, or provide other functions that are essential to Rhode Island, neighboring states, and the entire nation. The SAMP area is part of the nation’s Marine Transportation System, which is the network of all navigable waterways, vessels, operators, ports, and intermodal landside connections facilitating the marine transport of people and goods in the United States (Marine Transportation System National Advisory Council, 2009). One of the main goals of the Ocean SAMP is to promote and enhance these and other existing uses. Proposed future uses related to marine transportation and other topics are addressed in Chapter 9: Future Uses.
2. This chapter focuses on the commercial, military, government and support
vessels, and infrastructure that comprise the SAMP area elements of the nation’s Marine Transportation System. Other vessels which operate in the SAMP area and utilize this infrastructure include fishing and recreational craft. Fishing vessels and activities are discussed in Chapter 5, Fisheries Resources and Uses. Recreational vessels and activities are discussed in Chapter 6, Recreation and Tourism.
3. Marine transportation in and through the SAMP area is supported by a network of
navigation features including shipping lanes, traffic separation schemes, navigational aids, and other features that facilitate safe navigation within the area. Marine transportation in the SAMP area also relies on adjacent land-based infrastructure, such as cargo handling facilities and storage areas in nearby ports. Marine transportation activity in the SAMP area is shaped by activity at these facilities, in ports such as Providence and Quonset/Davisville, RI, and Fall River, MA. Together, these navigation features and port infrastructure provide for the safe passage and operations of a wide range of vessels which provide Rhode Island with essential goods and services.
4. The SAMP area also includes other infrastructure that does not support
navigation. This infrastructure includes existing undersea cables, unexploded ordnance, and other marine debris notated on NOAA nautical charts, as well as designated dredged material disposal sites.
5. As is illustrated by the Ocean SAMP boundary (see Chapter 1: Introduction), the
Ocean SAMP document and policies are focused on the offshore environment, not adjacent upland areas. This offshore focus is due to the fact that the CRMC
Ocean Special Area Management Plan
Ocean SAMP D R A F T of 7/23/10 Chapter 7 Page 4 of 59
already has a regulatory program, including a zoning program, in place for coastal lands and waters out to the three-nautical mile boundary. Accordingly, this chapter focuses on marine transportation activities and infrastructure in the offshore environment, outside of Narragansett Bay. Discussion of upland areas is focused on the Narragansett Bay ports that make these uses possible, as well as the economic impact of these uses on these ports and the state of Rhode Island.

Ocean Special Area Management Plan
Ocean SAMP D R A F T of 7/23/10 Chapter 7 Page 5 of 59
Section 710: History of Marine Transportation and Naval Activities in the SAMP Area
1. Rhode Island’s offshore waters have been used for maritime commerce,
exploration, transportation, and military purposes for over 400 years. While none of Rhode Island’s cargo ports or naval facilities are within the SAMP area, cargo ships, support vessels and military craft traverse the SAMP area en route to the Rhode Island ports of Providence, Quonset/Davisville, and Newport in Narragansett Bay, and the Massachusetts port of Fall River (which includes Fall River and Somerset) in Mt. Hope Bay. Maritime commerce in Rhode Island dates back to the 17th century, whereas Rhode Island-based naval activities were more common in the late 19th through the 20th centuries. Together, these activities have been essential to Rhode Island’s economic growth and vitality, and are central to Rhode Island’s history.
2. Much of the maritime activity in the SAMP area was, and still is, fishing. Prior to
European contact, Wampanoag and Narragansett Indians fished from shore as well as from dugout canoes, primarily in coastal waters (Hale 1998). See Chapter 4: Cultural and Historic Resources, for further discussion of the Wampanoag and Narragansett Indian tribes’ histories. Early Rhode Islanders observed right whales from shore, and rowed out in longboats to hunt and capture their prey (Albion et al 1970). While whaling never became a major industry in Rhode Island, commercial fishing in Rhode Island dates back to the 17th century (Hall-Alber et al. 2001) and has been a viable industry since then, characterized by a diversity of target species and gear types. For a detailed history of fishing activities in the SAMP area and adjacent ports, see Chapter 5: Fisheries Resources and Uses.
3. Before maritime trade came to dominate offshore waters, early European
explorers navigated through the SAMP area, laying the groundwork for future colonization and commerce. In 1524, Italian explorer Giovanni da Verrazano explored Block Island Sound before venturing into Narragansett Bay; and in 1614 Dutch explorer Adriaen Block followed a similar route – while naming the offshore island for himself (Albion et al 1970).
4. Rhode Island’s maritime commerce first developed in the 17th century while the
state was still an English colony. Newport, with its large, deep, well-protected natural harbor, was the center of this early maritime activity. Newport first engaged in trading agricultural goods with the nearby ports of Salem, Boston, and New Amsterdam (later New York). As a result, by the late 17th century Rhode Island had achieved a favorable balance of trade – unlike neighboring colonies, which imported more than they exported (Kellner and Lemons 2004). In the early 18th century, Newport trading ships ventured through the SAMP area into the Caribbean, trading with Spanish, French, and Dutch colonies, and later began trading with Africa and England. Some of this commerce was based in privateering, in which Rhode Island ships attacked enemy merchant ships during
Ocean Special Area Management Plan
Ocean SAMP D R A F T of 7/23/10 Chapter 7 Page 6 of 59
wartime (such as the French-Indian War, 1754-1763) and seized their cargos (Kellner and Lemons 2004).
5. Whereas 17th century trade had focused on agricultural goods, 18th-century trade
thrived on the re-export business – exporting products that had been made in Rhode Island using goods that had been imported from other locations. Key products were candles made of spermaceti (a wax-like substance found in sperm whales’ heads), twine and cordage, and rum distilled from molasses; Newport was known as a center for spermaceti candle-making and rum distillation (Kellner and Lemons 2004). Spermaceti to make the candles came from the nearby whaling ports of New Bedford and Nantucket (Labaree et al 1998), whereas molasses to make rum originated from the Caribbean (Kellner and Lemons 2004).
6. Rhode Island’s early business in distilling and trading rum highlights the state’s
connection to the slave trade. Rum was produced from molasses which Rhode Island distilleries imported from Caribbean ports. While much rum was consumed in Rhode Island itself or shipped to ports in Europe, the Caribbean, and South America, Rhode Island merchants traded some rum in African ports in exchange for slaves (Kellner and Lemons 2004). In the early 17th century some Newport vessels entered the slave trade, followed by ships from Bristol and Providence. One source indicates that between 1725 and 1807 at least 934 vessels left Rhode Island for African ports, and carried away an estimated 106,000 slaves from the continent (Coughtry, cited in Kellner and Lemons 2004). In the late 18th century, the Brown family of Providence entered the slave trade, which led to the growth of the port of Providence as well as the rise of this prominent merchant family (Kellner and Lemons 2004).
7. Newport was the fifth largest town and one of the leading ports in colonial
America through the 1760s. However, the Brown family and other Providence merchants actively pursued maritime commerce in the late 18th and early 19th centuries. Due to these merchants’ activities, coupled with Providence’s geographic advantages and Newport’s travails during the American Revolution, Providence soon eclipsed Newport as Rhode Island’s main port. Providence ships passed through the SAMP area en route to European and Caribbean ports, and Providence merchants also pursued opportunities in the newer trades with South America, Australia, and Asian ports. Beginning in the late 18th century, the Brown brothers were major leaders in these newer trades. Nicholas Brown was the first Rhode Islander to trade with Brazil, and John Brown was the first Rhode Islander and the second American to begin trading with both China and Australia. Because of these activities, and in particular the Browns’ participation in the highly lucrative trade with China, the port of Providence remained preeminent into the 1820s-30s (Albion et al 1970; Kellner and Lemons 2004).
8. The height of Rhode Island-based maritime trade lasted only through the 1830s.
The whaling activities of nearby ports continued to spur shipbuilding and the spermaceti candle business through the middle of the 19th century, but by mid-
Ocean Special Area Management Plan
Ocean SAMP D R A F T of 7/23/10 Chapter 7 Page 7 of 59
century this business also had diminished (Kellner and Lemons 2004). By 1860, Rhode Island’s foreign commerce had declined dramatically such that Rhode Island ports recorded many fewer ship arrivals (Albion et al 1970). In the mid- to late-19th century, this trade was gradually replaced by a new coastal trade aboard steamboats, many of which were passenger vessels (Albion et al 1970). Late-19th and early-20th century maritime activity in the SAMP area was characterized largely by passenger steamboats and other recreational craft; see Chapter 6, Recreation and Tourism, for further discussion of the history of recreation in the SAMP area.
9. Maritime trade, coupled with the Industrial Revolution of the 19th century,
required the industrialization of many waterfront areas. Providence became a modern industrial city port, its shoreline lined with warehouses, wharves and piers. Later, rail service and cargo hoisting equipment was brought to the industrial waterfront so that cargo could be transported from ship to rail car, and wharves were rebuilt to support the weight of this new equipment. In the 20th century, highway construction created additional truck access to these port facilities (RI Coastal Resources Management Council, in review). Throughout the 19th and 20th centuries, similar transformations took place at different scales in Quonset/Davisville, Newport, and other ports throughout the state. Rhode Island’s industrialized waterfronts continue to provide critical infrastructure that supports maritime commerce and Naval activities.
10. In the early 20th century, during the 14 years known as Prohibition, maritime
activity in Rhode Island’s offshore waters expanded to include the illegal transport of alcoholic beverages. Rum supply vessels typically lined up offshore beyond federal jurisdiction and supplied “rum-runners,” small boats that could outrun Coast Guard enforcement vessels while smuggling alcohol back to shore. One source indicates that rum supply vessels serving Rhode Island communities anchored in the SAMP area about 15 miles southeast of Block Island, and that rum runners used the three entrances to Narragansett Bay to their advantage in attempting to avoid enforcement vessels (Hale 1998).
11. The U.S. Navy became one of the dominant users of the SAMP area in the late
19th century, though Rhode Island has a long history of ties with the Navy. The U.S. Navy was created, in part, in Rhode Island a century earlier during the American Revolution - the first ship in the Continental Navy was the sloop Providence, and the first admiral was Rhode Island native Esek Hopkins. In the late 19th century, Narragansett Bay’s deep, protected harbors attracted the Navy to Rhode Island, and as a result the Navy established the Naval Torpedo Station on Goat Island in 1869, the Naval Training Station in Newport in 1883, and the Naval War College in Newport in 1884. During World War II, a large portion of the Atlantic Fleet was based out of Newport for a short time, and naval air bases, training centers, and other facilities were established at Quonset/Davisville, Melville, and other locations throughout the state. The Navy’s presence had a tremendous impact on the state’s economy, especially throughout World War II,

Ocean Special Area Management Plan
Ocean SAMP D R A F T of 7/23/10 Chapter 7 Page 8 of 59
providing employment for Rhode Islanders, as well as clientele for businesses in Newport and throughout the state (Kellner and Lemons 2004).
12. The Navy’s presence made Rhode Island a possible target for attack during the
early 20th century. During World War I, a German U-boat sailed directly into Newport Harbor; the next day, the U-boat sank six unarmed cargo ships off Nantucket (Hale 1998). During World War II, the Navy mined the approaches to Narragansett Bay and set out antisubmarine nets to block the passages into the Bay. In 1945, a German U-boat prowling the East Coast torpedoed and sunk an American coal ship off Pt. Judith, and in retaliation Naval forces hunted and sunk the U-boat, U-853, off Block Island. This represented the final battle of the Atlantic in World War II. The wreck of the U-853 remains in the charted approach to Narragansett Bay and is a popular dive site, and many unexploded ordnance still exist in the waters of Rhode Island Sound in the approaches to the Bay (Kellner and Lemons 2004). See Chapter 6, Recreation and Tourism, for further information on diving; for further information on unexploded ordnance and other features of the SAMP area see section 750 of this chapter.
13. The Navy’s presence in Rhode Island’s waters was operationally diminished in
early 1973 with the moving of the active fleet from Newport, accompanied by the closing of the Quonset Point Naval Air Station, a drawdown of facilities at Davisville, and a cutback of personnel and activities (Globalsecurity.org 2009). However, the Navy retains several facilities of strategic importance in Newport, which together comprise Naval Station Newport. Naval Station Newport is home to more than 42 commands and is considered the Navy’s primary site for training officers and senior personnel as well as developing undersea warfare systems. Newport Naval institutions include the Naval Undersea Warfare Center, Division Newport, the Naval War College, the Naval Academy Prep School, and the Surface Warfare Officers School (U.S. Navy 2009).
Ocean Special Area Management Plan
Ocean SAMP D R A F T of 7/23/10 Chapter 7 Page 9 of 59
Section 720: Navigation Features in the SAMP Area
720.1 Area Overview
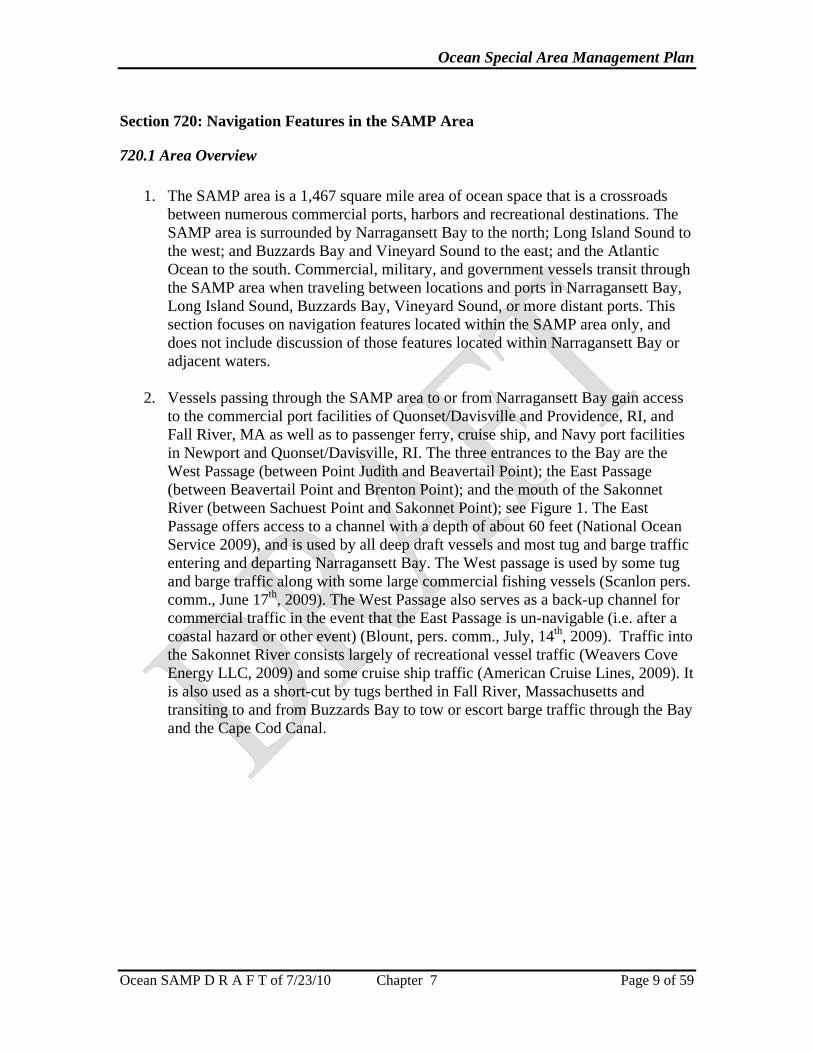
1. The SAMP area is a 1,467 square mile area of ocean space that is a crossroads between numerous commercial ports, harbors and recreational destinations. The SAMP area is surrounded by Narragansett Bay to the north; Long Island Sound to the west; and Buzzards Bay and Vineyard Sound to the east; and the Atlantic Ocean to the south. Commercial, military, and government vessels transit through the SAMP area when traveling between locations and ports in Narragansett Bay, Long Island Sound, Buzzards Bay, Vineyard Sound, or more distant ports. This section focuses on navigation features located within the SAMP area only, and does not include discussion of those features located within Narragansett Bay or adjacent waters.
2. Vessels passing through the SAMP area to or from Narragansett Bay gain access
to the commercial port facilities of Quonset/Davisville and Providence, RI, and Fall River, MA as well as to passenger ferry, cruise ship, and Navy port facilities in Newport and Quonset/Davisville, RI. The three entrances to the Bay are the West Passage (between Point Judith and Beavertail Point); the East Passage (between Beavertail Point and Brenton Point); and the mouth of the Sakonnet River (between Sachuest Point and Sakonnet Point); see Figure 1. The East Passage offers access to a channel with a depth of about 60 feet (National Ocean Service 2009), and is used by all deep draft vessels and most tug and barge traffic entering and departing Narragansett Bay. The West passage is used by some tug and barge traffic along with some large commercial fishing vessels (Scanlon pers. comm., June 17th, 2009). The West Passage also serves as a back-up channel for commercial traffic in the event that the East Passage is un-navigable (i.e. after a coastal hazard or other event) (Blount, pers. comm., July, 14th, 2009). Traffic into the Sakonnet River consists largely of recreational vessel traffic (Weavers Cove Energy LLC, 2009) and some cruise ship traffic (American Cruise Lines, 2009). It is also used as a short-cut by tugs berthed in Fall River, Massachusetts and transiting to and from Buzzards Bay to tow or escort barge traffic through the Bay and the Cape Cod Canal.

Ocean Special Area Management Plan
Ocean SAMP D R A F T of 7/23/10 Chapter 7 Page 10 of 59
Figure 1. Map of Navigation Features.
Ocean Special Area Management Plan
Ocean SAMP D R A F T of 7/23/10 Chapter 7 Page 11 of 59
3. Features described in this section are further detailed on NOAA nautical charts including NOAA Chart No.13205 and Chart No.13218, and in the U.S. Coast Pilot Vol. 2 (NOAA National Ocean Service 2009); recent updates to these documents may be found in U.S. Coast Guard ”Local Notice to Mariners” publications. For further information on navigation within the SAMP area please consult these documents directly.1
4. Taken together, the features described in the remainder of this section (e.g.,
shipping lanes, recommended vessel routes, pilot boarding areas, anchorages, etc.) comprise a traffic management system applicable to and used by virtually all vessels transiting within or through the SAMP area. Questions regarding this traffic management system may be referred to the U.S. Coast Guard Sector Southeastern New England.
720.2 Shipping Lanes, Traffic Separation Schemes and Precautionary Areas
1. There are two main shipping lanes traversing the SAMP area: the approach to Narragansett Bay and the approach to Buzzards Bay. A precautionary area in the center of the SAMP area, centered on 41°06’06”N., 71°23’22”W (marked by a mid-channel buoy, RW “A”), marks the offshore limits of these shipping lanes. See Figure 1. These shipping lanes and the precautionary area were designed in accordance with standards and adopted under the auspices of the International Maritime Organization. While designed as a measure of safety to aid commercial shipping entering and exiting Narragansett Bay and Buzzards Bay, use of these lanes and precautionary area are not mandatory. Most prudent mariners will, however, transit within the appropriate traffic lanes when entering or exiting port (LeBlanc, pers. comm., December 16, 2009).
2. The approach to Narragansett Bay runs north/south and comprises inbound and
outbound traffic lanes, which are separated by a traffic separation zone. The offshore limit of this approach is marked by a precautionary area as described above. The inshore limit of this approach is marked by a precautionary area, centered on 41°25’35” N., 71°23’22”W (marked by a mid-channel buoy, RW “NB”); see Figure 1.
3. The approach to Buzzards Bay is also characterized by inbound and outbound
traffic lanes which are separated by a traffic separation zone. The offshore limit of this approach is marked by a precautionary area as described above in #1. There is no inshore precautionary area; the next inshore navigational aid is the Buzzards Bay Entrance Light. See Figure 1.
4. Ship traffic passing through the approaches to Narragansett Bay and Buzzards
Bay are directed by Traffic Separation Schemes. In both cases, the Traffic 1 For further information on NOAA nautical charts and the U.S. Coast Pilot, please contact the NOAA Office of Coast Survey, Silver Spring, MD. For further information on U.S. Coast Guard Notices to Mariners, please contact the U.S. Coast Guard District 1.

Ocean Special Area Management Plan
Ocean SAMP D R A F T of 7/23/10 Chapter 7 Page 12 of 59
Separation Schemes comprise the above-mentioned traffic lanes, separation zone, and precautionary areas, and are a means of preventing collisions. Traffic Separation Schemes are recommended for large commercial ships entering or leaving the respective bays and are not intended for smaller vessels or those engaged in inshore transit; for further information see the U.S. Coast Pilot, Volume 2 (NOAA National Ocean Service 2009). However it should be noted that under federal Navigation Rules, vessels engaged in fishing are prohibited from impeding the transit of a vessel following a traffic lane (33 USC 2010 et. seq.).
720.3 Recommended Vessel Routes
1. In addition to the official shipping lanes described above, there are two Recommended Vessel Routes running through the SAMP area roughly parallel to the mainland. One route runs from The Race at the entrance to Long Island Sound along the Rhode Island coast to Point Judith, and a second route runs from the approach to Narragansett Bay in a northeasterly direction toward Buzzards Bay (see Figure 1). Recommended Vessel Routes are established for commercial deep-draft traffic transiting the inshore waters of Block Island and Rhode Island Sounds and are designed to reduce conflicts with recreational boaters and other users of these areas; however vessels are not required to utilize these routes nor are fishermen required to keep fishing gear outside these routes. Recommended Vessel Routes in the SAMP area are established by the U.S. Coast Guard in cooperation with the Southeastern Massachusetts and Rhode Island Port Safety and Security Forums. For further information see the U.S. Coast Pilot, Volume 2 (NOAA National Ocean Service 2009).
720.4 Ferry Routes
1. Ferries operating within the SAMP area travel relatively consistent routes that do not necessarily align with charted shipping lanes or recommended vessel routes. At the time of this writing, none of the SAMP area ferry routes are notated on NOAA nautical charts, though the U.S. Coast Guard is in the process of charting the Block Island Ferry route between Point Judith and Block Island’s Old Harbor (Cowan, pers. comm., December 23, 2009). See section 730 for further discussion of ferries and Figure 8 for a map of approximate routes for ferries currently operating within the SAMP area.
720.5 Pilot Boarding Areas
1. Marine pilots board commercial vessels bound for Narragansett Bay or other area ports to provide local knowledge and navigation assistance. Marine pilots board commercial vessels in charted pilot boarding areas in order to guide commercial ships through state waters. Pilotage in the SAMP area is primarily provided by the Northeast Marine Pilots Association, based in Newport, RI.

Ocean Special Area Management Plan
Ocean SAMP D R A F T of 7/23/10 Chapter 7 Page 13 of 59
2. Currently there are four pilot boarding areas within the SAMP area: the Point Judith Pilot Station, south of Point Judith, centered at 41°17'N, 071°30.5'W; the Montauk Pilot Boarding Station, southeast of Montauk, NY, centered at 41°02'N, 071°42'W; the Brenton Point Pilot Boarding Station, south of Brenton Point, at about 41°23.2’ N, 071°21.3’ W; and the Buzzards Bay Pilot Station, centered at 41°23'48"N., 71°02'01"W (see Figure 1).
3. For entry into Narragansett Bay the Brenton Point Pilot Station is used, and for
entry into Long Island Sound the Point Judith Pilot Station is used. Because of this, vessels requiring a marine pilot frequently travel through the SAMP area to the Point Judith Pilot Station to board a pilot, even if they are destined for a port within Long Island Sound. The Montauk Pilot Boarding Station is only used by special arrangement due to the less favorable sea conditions that persist at that location (Costabile, pers. comm., December 16, 2009).
720.6 Anchorages
1. Vessels bound to or from Narragansett Bay or other area ports may temporarily anchor within or outside of Narragansett Bay. Vessels do this for a variety of reasons including waiting for dock space; waiting for a favorable tide or better weather; waiting for shipping orders; or in order to lighter cargo (transfer cargo from a larger to a smaller vessel). In the vicinity of the SAMP area, all lightering activity takes place within the Bay where weather conditions are more favorable.
2. At present there are no anchorages charted within the SAMP area; all anchorages
are within Narragansett Bay. However, a general anchorage is proposed for the waters south of Brenton Point in the Brenton Reef area in federal waters (see Figure 1) (LeBlanc, pers. comm., June 29, 2009). For further information on the status of this proposed general anchorage, please contact the U.S. Coast Guard Sector Southeastern New England.
720.7 Navy Restricted Areas
1. There are two Navy restricted areas within the SAMP area as indicated in the U.S. Coast Pilot: a torpedo range and a practice minefield training area (NOAA National Ocean Service 2009); see Figure 2.
2. The first Navy restricted area is a 2-nautical mile-wide strip that begins within the
northern precautionary area of the approach to Narragansett Bay, and extends south for over 11.5 nautical miles, coinciding with the Traffic Separation Zone (see Figure 2). During appropriate weather conditions this area is used as a torpedo range under the direction of the Naval Undersea Warfare Center in Newport. Navigation in this area is prohibited during times of torpedo range use. For further information see the U.S. Coast Pilot, Volume 2 (NOAA National Ocean Service 2009).
Ocean Special Area Management Plan
Ocean SAMP D R A F T of 7/23/10 Chapter 7 Page 14 of 59
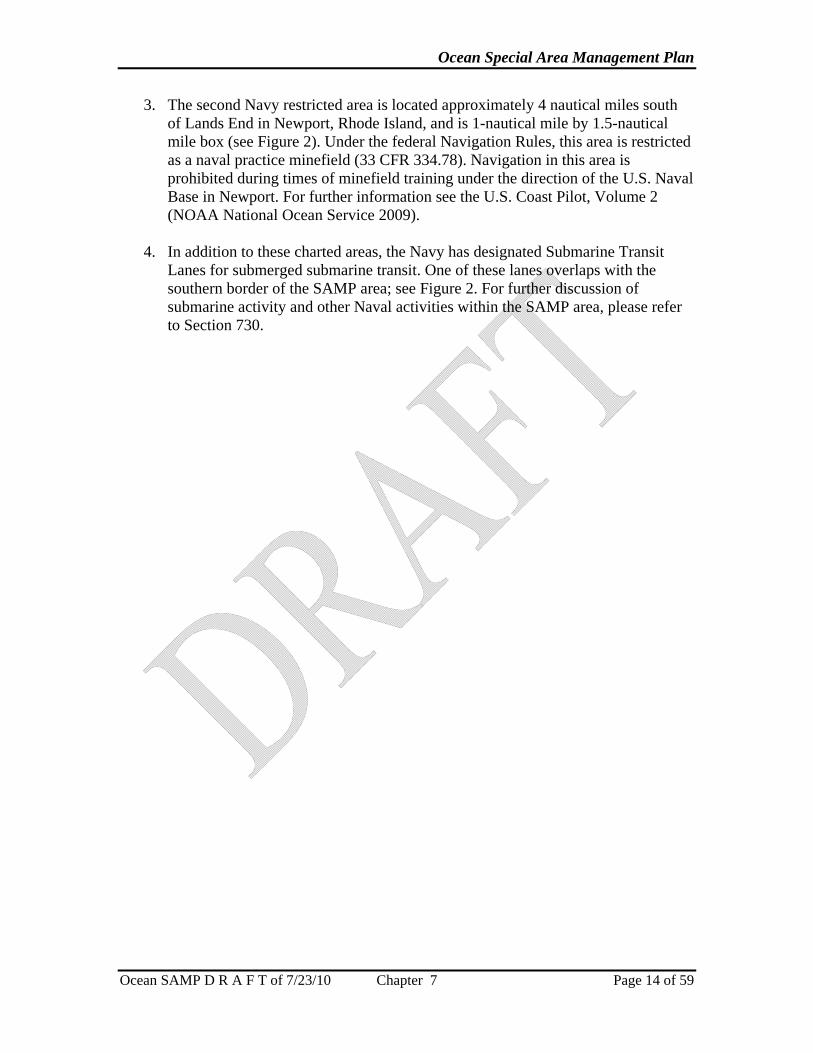
3. The second Navy restricted area is located approximately 4 nautical miles south of Lands End in Newport, Rhode Island, and is 1-nautical mile by 1.5-nautical mile box (see Figure 2). Under the federal Navigation Rules, this area is restricted as a naval practice minefield (33 CFR 334.78). Navigation in this area is prohibited during times of minefield training under the direction of the U.S. Naval Base in Newport. For further information see the U.S. Coast Pilot, Volume 2 (NOAA National Ocean Service 2009).
4. In addition to these charted areas, the Navy has designated Submarine Transit
Lanes for submerged submarine transit. One of these lanes overlaps with the southern border of the SAMP area; see Figure 2. For further discussion of submarine activity and other Naval activities within the SAMP area, please refer to Section 730.

Ocean Special Area Management Plan
Ocean SAMP D R A F T of 7/23/10 Chapter 7 Page 15 of 59
Figure 2. Map of Naval Operating Areas
Ocean Special Area Management Plan
Ocean SAMP D R A F T of 7/23/10 Chapter 7 Page 16 of 59
720.8 Right Whale Seasonal Management Area
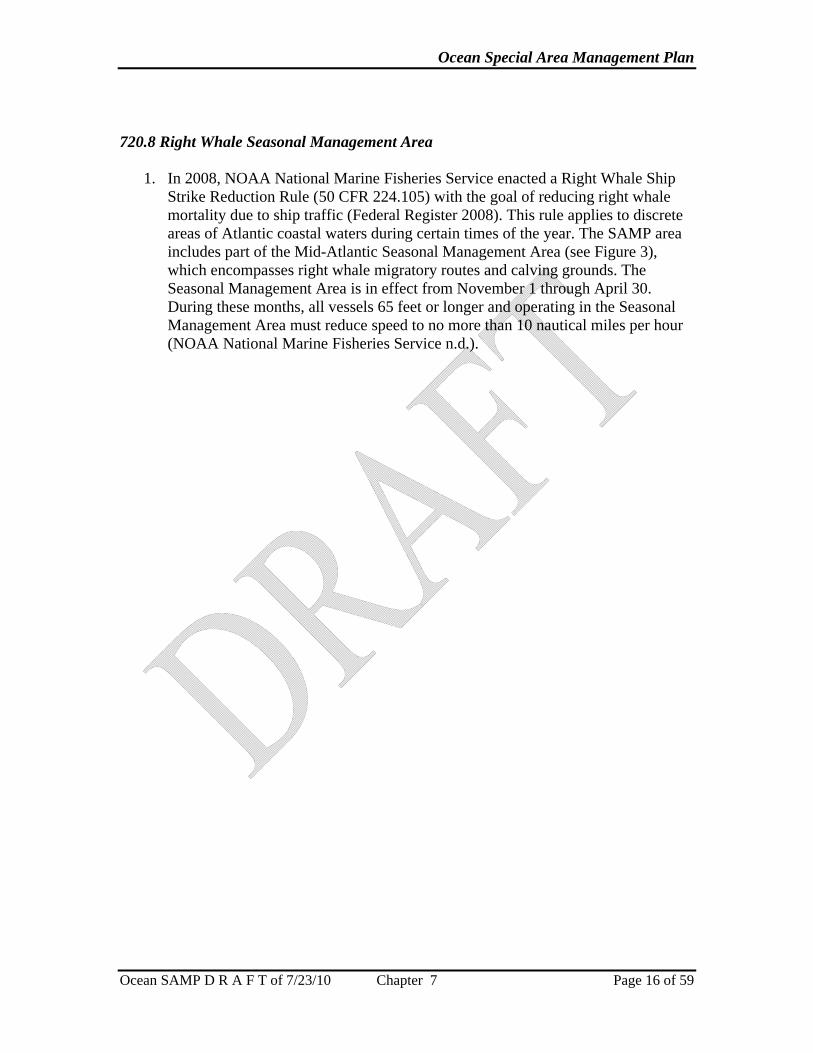
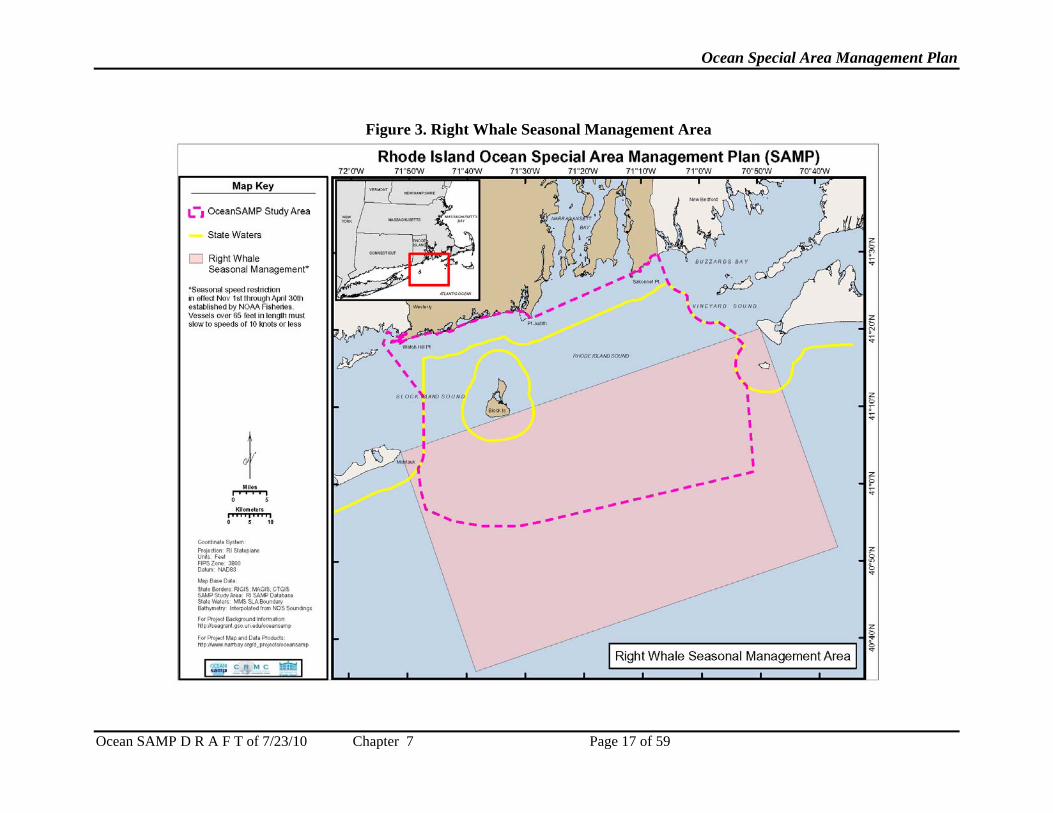
1. In 2008, NOAA National Marine Fisheries Service enacted a Right Whale Ship Strike Reduction Rule (50 CFR 224.105) with the goal of reducing right whale mortality due to ship traffic (Federal Register 2008). This rule applies to discrete areas of Atlantic coastal waters during certain times of the year. The SAMP area includes part of the Mid-Atlantic Seasonal Management Area (see Figure 3), which encompasses right whale migratory routes and calving grounds. The Seasonal Management Area is in effect from November 1 through April 30. During these months, all vessels 65 feet or longer and operating in the Seasonal Management Area must reduce speed to no more than 10 nautical miles per hour (NOAA National Marine Fisheries Service n.d.).
Ocean Special Area Management Plan
Ocean SAMP D R A F T of 7/23/10 Chapter 7 Page 17 of 59
Figure 3. Right Whale Seasonal Management Area

Ocean Special Area Management Plan
Ocean SAMP D R A F T of 7/23/10 Chapter 7 Page 18 of 59
Section 730: Marine Transportation in the SAMP Area
1. Marine transportation in the SAMP area is characterized by a range of vessel types and activities. Commercial shipping involves the transport of goods such as petroleum products, coal, and cars through the SAMP area, while passenger ferries and cruise ships transport people between nearby coastal communities. Pilot boats, government enforcement and search-and-rescue vessels provide critical support to commercial vessel operations, and facilitate safe navigation, while naval vessels engage in training activities in SAMP area waters, or pass through the area when traveling between ports.
2. Recreational and fishing vessels also operate in this area and utilize the same
navigational features. For an extensive discussion of fishing vessels and activity areas, see Chapter 5: Fisheries Resources and Uses. For an extensive discussion of recreational vessels and activity areas, see Chapter 6: Recreation and Tourism.
730.1 Shipping Activity
1. Commercial shipping within the SAMP area includes cargo vessels transiting to or from the Narragansett Bay ports of Providence; Davisville; and Fall River, MA. It also includes ships transiting the SAMP area between a variety of other ports including the Port of New York and New Jersey; the Port of Boston; and other ports located on the east coast or abroad. While data is available on the number of ships calling at Narragansett Bay ports, it is difficult to quantify the remaining shipping traffic traveling through the SAMP area because these data are typically collected only for specific ports or harbors.
2. The U.S. Army Corps of Engineers (USACE) collects annual data on freight
traffic (tonnage per year), the number of vessel transits, and drafts of vessels utilizing federally-maintained navigation channels.2 Given that the SAMP area’s northern boundary coincides with the three entrances to Narragansett Bay, USACE data collected for Narragansett Bay provide one measure of commercial traffic through this area. The 2007 data for Narragansett Bay (see Table 1) illustrate that the majority of traffic entering the Bay is destined for the ports of Providence or Fall River, MA (U.S. Army Corps of Engineers, 2007). Of a total of 2,412 vessel transits to and from Narragansett Bay in 2007, 1,762 were headed to and from Providence; of these transits, 23% were foreign-flagged vessels. An additional 650 transits were to and from Fall River, MA, 16% of which were foreign-flagged vessels. This vessel transit total is conservative in that it does not include transits by car carriers to and from Davisville.3 Between 80 and 100 ships
2 The U.S. Army Corps of Engineers Waterborne Commerce statistics only records trips in waterways and channels maintained by the U.S. Army Corps of Engineers. Therefore, the data do not capture Narragansett Bay traffic proceeding to Davisville because this traffic does not pass any channels that are maintained by the U.S. Army Corps of Engineers. 3 USACE data do not include traffic to and from Davisville because the navigation channel approaching Davisville is not a USACE-maintained federal channel.
Ocean Special Area Management Plan
Ocean SAMP D R A F T of 7/23/10 Chapter 7 Page 19 of 59
call on the Port of Davisville each year, resulting in 160 to 200 additional transits in and out of Narragansett Bay (Quonset Development Corporation 2009; see Section 740.2). See Section 740 for further discussion of the ports of Providence, Quonset/Davisville, and Fall River.
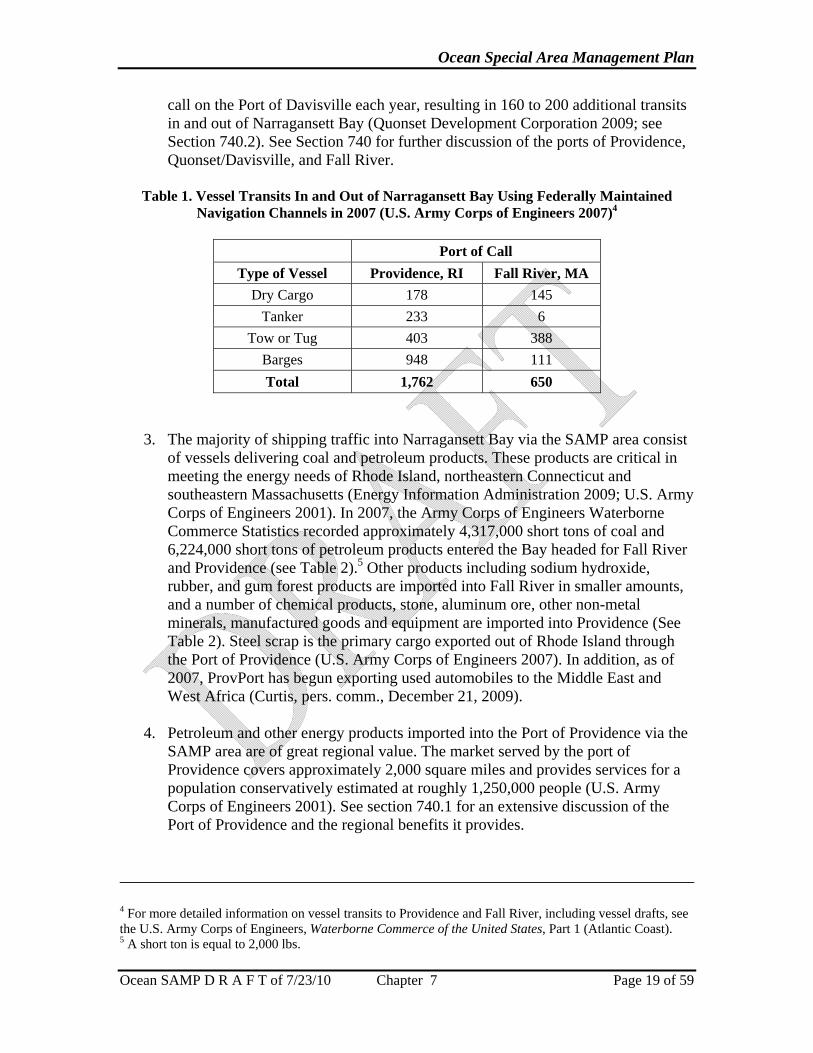
Table 1. Vessel Transits In and Out of Narragansett Bay Using Federally Maintained
Navigation Channels in 2007 (U.S. Army Corps of Engineers 2007)4
Port of Call Type of Vessel Providence, RI Fall River, MA
Dry Cargo 178 145 Tanker 233 6
Tow or Tug 403 388 Barges 948 111 Total 1,762 650
3. The majority of shipping traffic into Narragansett Bay via the SAMP area consist of vessels delivering coal and petroleum products. These products are critical in meeting the energy needs of Rhode Island, northeastern Connecticut and southeastern Massachusetts (Energy Information Administration 2009; U.S. Army Corps of Engineers 2001). In 2007, the Army Corps of Engineers Waterborne Commerce Statistics recorded approximately 4,317,000 short tons of coal and 6,224,000 short tons of petroleum products entered the Bay headed for Fall River and Providence (see Table 2).5 Other products including sodium hydroxide, rubber, and gum forest products are imported into Fall River in smaller amounts, and a number of chemical products, stone, aluminum ore, other non-metal minerals, manufactured goods and equipment are imported into Providence (See Table 2). Steel scrap is the primary cargo exported out of Rhode Island through the Port of Providence (U.S. Army Corps of Engineers 2007). In addition, as of 2007, ProvPort has begun exporting used automobiles to the Middle East and West Africa (Curtis, pers. comm., December 21, 2009).
4. Petroleum and other energy products imported into the Port of Providence via the
SAMP area are of great regional value. The market served by the port of Providence covers approximately 2,000 square miles and provides services for a population conservatively estimated at roughly 1,250,000 people (U.S. Army Corps of Engineers 2001). See section 740.1 for an extensive discussion of the Port of Providence and the regional benefits it provides.
4 For more detailed information on vessel transits to Providence and Fall River, including vessel drafts, see the U.S. Army Corps of Engineers, Waterborne Commerce of the United States, Part 1 (Atlantic Coast). 5 A short ton is equal to 2,000 lbs.
Ocean Special Area Management Plan
Ocean SAMP D R A F T of 7/23/10 Chapter 7 Page 20 of 59

Ocean Special Area Management Plan
Ocean SAMP D R A F T of 7/23/10 Chapter 7 Page 21 of 59
Table 2. Volume of Cargo Transported in 2007 (in Thousands of Short Tons) (U.S. Army Corps of Engineers 2007)
Cargo Type Port of Call
Fall River,
MA Providence,
RI Total
Coal 3,521 796 4,317 Petroleum Products 82 6,142 6,224
Chemical and Fertilizers 12 328 340 Gravel, Sand and Stone 0 18 18 Iron Ore & Steel Scrap 0 632 632
Aluminum Ore 0 67 67 Other Non-Metal Minerals 0 234 234
Forest Products 33 0 33 Manufactured Goods 0 890 890
Manufactured Equipment 0 117 117 Unknown 0 1 1
Total 3,648 9,225 12,873
4. In general, the volume of imports into Narragansett Bay remains constant throughout the year. Tankers and barges carrying home heating oil, gasoline and other petroleum products, which make up the majority of cargo entering the Bay, are evenly spread out throughout the year (Federal Energy Regulatory Committee 2005). An important exception to this pattern is vehicle imports into Davisville, which peak in the late fall, generally October through December (Matthews, pers. comm., July 27th, 2009).
5. Time series shipping data for Narragansett Bay show that over the past two
decades the total cargo tonnage processed by Narragansett Bay ports has remained relatively constant, between 11 and 13 million short tons per year (see Figure 4 and Table 3 below). However, over this same time period the number of vessels used to transport this amount of cargo has been decreasing because vessel capacity is growing. For example, in 1980 there were 5,614 transits to and from Providence (Rhode Island Senate Policy Office 2002). Transits fell to 2,893 in 1997 and 1,762 in 2007 (U.S. Army Corps of Engineers 2007); see Figure 5. Conversely, the amount of cargo imported into Providence during this time period increased from 7.5 million short tons in 1980 (Rhode Island Senate Policy Office 2002), to 8.8 million short tons in 1997 and 9.2 million short tons in 2007 (U.S. Army Corps of Engineers 2007); see Figure 5.
6. The 2005 dredging of the Providence River to a controlling depth of 40 feet
allows for the accommodation of deeper- draft vessels. This channel deepening project is consistent with the abovementioned trend toward larger, deeper-draft cargo vessels.

Ocean Special Area Management Plan
Ocean SAMP D R A F T of 7/23/10 Chapter 7 Page 22 of 59
Figure 4. Annual Cargo Volume Processed by Narragansett Bay Ports, 1997-2007. (U.S. Army Corps of Engineers 2007)
0
2,000
4,000
6,000
8,000
10,000
12,000
14,000
16,000
1997 1998 1999 2000 2001 2002 2003 2004 2005 2006 2007Time
Tota
l Am
ount
of C
argo
in T
hous
ands
of
Shor
t Ton
sFall River, MAProvidence, RITotal
Table 3. Annual Cargo Volume Processed by Narragansett Bay Ports between 1997 and 2007 (In Thousands of Short Tons) (U.S. Army Corps Engineers 2007)
Port of Call
Year Fall River, MA Providence, RI Total 1997 3,394 8,814 12,362 1998 3,776 8,028 11,848 1999 3,395 8,627 12,063 2000 3,402 8,870 12,272 2001 3,382 9,030 12,414 2002 3,392 8,244 11,729 2003 2,977 9,214 12,192 2004 3,161 9,559 12,722 2005 3,157 10,045 13,742 2006 3,364 9,267 13,724 2007 3,648 9,225 12,873

Ocean Special Area Management Plan
Ocean SAMP D R A F T of 7/23/10 Chapter 7 Page 23 of 59
Figure 5. Total Number of Vessel Transits and Volume of Cargo Processed in Providence, RI.
(U.S. Army Corps of Engineers 1980, 1997 and 2007)
0
1000
2000
3000
4000
5000
6000
1980 1997 2007
Year
Tota
l Num
ber o
f Ves
sel T
rans
its
0
1000
2000
3000
4000
5000
6000
7000
8000
9000
10000
Tota
l Ton
nage
Pro
cess
ed in
Th
ousa
nds
of S
hortT
ons
Total Number of Vessel Transits
Total Cargo Tonnage Processed
7. Traffic in and out of Narragansett Bay makes up only part of the commercial traffic moving through the SAMP area. Much of the SAMP area traffic consists of vessels traveling coastwise. Many of these ships are tug and barge units carrying petroleum products; these vessels originate in the Port of New York/New Jersey or points south and travel to and from Buzzards Bay and the Cape Cod Canal. There are also ships transiting to and from Long Island Sound via Block Island Sound (McVay, pers. comm., August 31, 2009). Exact numbers of coastwise transits through the SAMP area are not available; however traffic data from Long Island Sound and the Cape Cod Canal provide an approximation of traffic traveling through the SAMP area associated with surrounding east coast ports. In 2006, the U.S. Coast Guard estimated that there may be 2,000-4,000 transits through Long Island Sound each year; those transits leaving the eastern end of Long Island Sound must pass through the SAMP area. Furthermore, in 2005, 443 foreign-flagged vessels were recorded traveling through the SAMP area, destined for ports within Long Island Sound (U.S. Coast Guard 2006). And in 2007, 649 foreign vessels were recorded passing through the Cape Cod Canal (U.S. Army Corps of Engineers 2007), thus passing through Buzzards Bay into the SAMP area.
8. Commercial traffic in the SAMP area may increase in the future if a short sea
shipping industry develops in Rhode Island. Short sea shipping is the movement

Ocean Special Area Management Plan
Ocean SAMP D R A F T of 7/23/10 Chapter 7 Page 24 of 59
of goods (usually containerized) domestically aboard barges, with the goal of reducing truck traffic on congested highways. The corridor between Boston, New York, and Washington DC has been proposed as an attractive region in which to develop short sea shipping routes due to the amount of traffic congestion, the region’s population density, and the availability of port facilities (Rhode Island Economic Monitoring Collaborative 2007). No short sea shipping routes are currently in use in the area. However, some sources indicate that if this use were to develop in the area, Rhode Island ports, and Providence in particular, could serve as a central hub (Rhode Island Economic Monitoring Collaborative 2007; National Ports and Waterways Institute, University of New Orleans 2004). If short sea shipping were to develop in Rhode Island, it would greatly increase the number and frequency of vessel transits through the SAMP area. See Chapter 9: Future Uses for further discussion of this and other future uses of the SAMP area.
9. Automatic Identification System (AIS) data, when aggregated and analyzed using
Geographic Information System (GIS) tools, provide a relatively reliable means of analyzing commercial ship traffic activity and density within the SAMP area (see Figure 6). AIS is a transponder-based ship identification system that broadcasts vessel data (such as vessel name, type, position, course, speed, navigation status, dimensions, and type of cargo) among ships and with shore-side facilities. Generally, vessels currently required by federal regulation to carry an operational AIS include commercial ships of 65 feet or more in length, all tankers, most commercial towing vessels, and large passenger vessels.6 In addition to the vessels listed above, a vessel navigating in an area in which there is a Vessel Traffic Service (VTS), such as the Port of New York, is also required to carry AIS. It is important to note that at the time of this writing, AIS is not required aboard commercial fishing vessels or many ferry boats.7 However, required use of AIS may be expanded in the future.8 It should also be noted that many vessels –
6 According to 33 CFR §164.46, vessels which must carry AIS include self-propelled vessels of 65 feet or more in length, used for domestic or international commercial shipping, or that are certified to carry less than 151 passengers-for-hire; passenger vessels of 150 gross tons or more; all tankers, regardless of tonnage; vessels, other than passenger vessels or tankers, of 300 gross tonnages or more; towing vessels of 26 feet or more in length and more than 600 horsepower, in commercial service; and passenger vessels certified to carry more than 150 passengers-for-hire. 7 Although fishing vessels are not required to carry AIS, Vessel Monitoring Systems (VMS) are required on some commercial fishing vessels with federal permits as an enforcement mechanism. See Chapter 5: Fisheries Resources and Uses for further information. 8 In December 2008 the Coast Guard published a Notice of Proposed Rulemaking in which it was proposed that Federal regulations requiring the use of AIS be expanded to include some ferries and other vessels. Specifically, under the proposed rule, the use of AIS would be required by: self-propelled vessels of 65 feet or more in length, engaged in commercial service; towing vessels of 26 feet or more in length and more than 600 horsepower, engaged in commercial towing; self-propelled vessels carrying 50 or more passengers, engaged in commercial service; vessels carrying more than 12 passengers for hire and capable of speeds in excess of 30 knots; dredges and floating plants operating near channels likely to restrict or affect navigation of other vessels; self-propelled vessels carrying or engaged in the movement of certain dangerous cargos (U.S. Coast Guard 2008). As of the time of this writing, final Coast Guard action on these proposed regulations is still pending.
Ocean Special Area Management Plan
Ocean SAMP D R A F T of 7/23/10 Chapter 7 Page 25 of 59
especially large yachts or recreational vessels – carry AIS even though they are not required to do so (McVay, pers. comm., August 31, 2009).
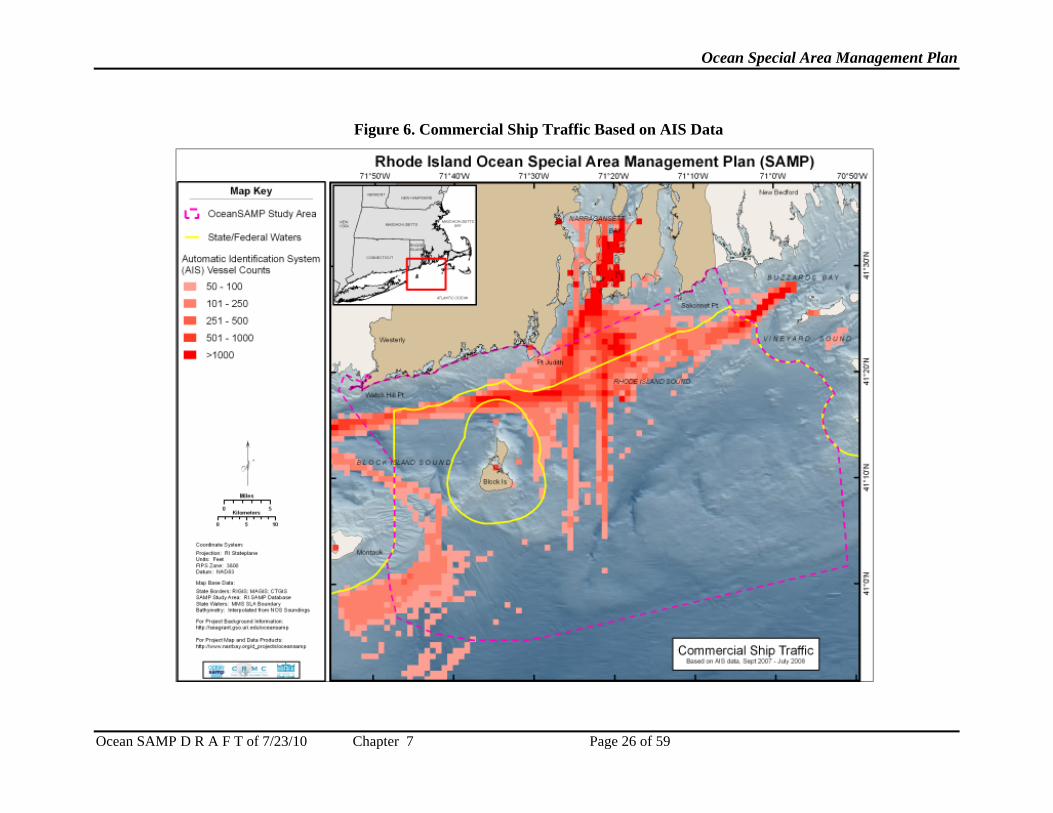
12. To help visualize commercial ship usage of the Ocean SAMP area, a density plot
was developed using AIS point data (from September 2007 to July 2008) and a 1 km by 1 km grid overlay to determine the relative density of commercial ship traffic.9 See Figure 6 for a map of this ship traffic, and see Figure 7 for a map showing ship traffic as well as designated navigation areas. On these maps, vessel traffic density per 1 kilometer square is shown. Traffic in squares with fewer than 50 vessel counts is not shown. The darkest squares represent the areas within the SAMP that have the most traffic – in this case over 1,000 vessel transits recorded.
13. Figures 6 and 7 show that there are several heavily trafficked areas within the
SAMP area. One is at the entrance to Narragansett Bay, which corresponds roughly with the northern precautionary area of the approach to Narragansett Bay (see Figure 7). A great deal of traffic is also concentrated within the vicinity of the coastwise Recommended Vessel Route, though it should be noted that this traffic pattern is not confined to the narrow Recommended Vessel Route that is delineated on nautical charts (see Figure 7). There is also a clear traffic pattern running north/south through the middle of the SAMP area that corresponds clearly with the charted shipping lanes and Traffic Separation Scheme (see Figure 7). Finally, it is important to note the concentration of traffic in the southwest corner of the SAMP area, which represents ships rounding Montauk Point and passing into Long Island Sound; this heavily-used area does not correspond to a shipping lane or any other codified transportation area. Conversely, relatively little traffic is shown passing through the charted approach to Buzzards Bay, which runs diagonally through the SAMP area (see Figure 7). See section 720 for further information on the abovementioned navigation areas.
14. Previous AIS analysis conducted by the U.S. Coast Guard of commercial vessel
traffic through Block Island Sound suggests that the majority of commercial vessel traffic within the SAMP area does not experience significant month to month variation (U.S. Coast Guard, 2006). Monthly AIS data for commercial vessel traffic in Block Island Sound, Montauk Channel, the Race, and Long Island Sound from 2005 were compared and determined by the U.S. Coast Guard to have no “significant month by month variation” (U.S. Coast Guard, 2006, 29).
9 AIS data used in this analysis were purchased by URI researchers from a private consulting company.
Ocean Special Area Management Plan
Ocean SAMP D R A F T of 7/23/10 Chapter 7 Page 26 of 59
Figure 6. Commercial Ship Traffic Based on AIS Data

Ocean Special Area Management Plan
Ocean SAMP D R A F T of 7/23/10 Chapter 7 Page 27 of 59
Figure 7. Commercial Ship Traffic and Navigation Areas

Ocean Special Area Management Plan
Ocean SAMP D R A F T of 7/23/10 Chapter 7 Page 28 of 59
730.2 Cargo Vessels
1. There are multiple types of commercial vessels transporting cargo through the SAMP area. These include bulk vessels (merchant ships designed to carry unpackaged, dry, bulk cargo), break bulk carriers (ships designed to carry packaged, non-unitized goods), coal carrying ships, tankers delivering liquid bulk cargo such as petroleum products, tug and barge units, and car carrying ships. Pilot boats also operate in the SAMP area, transporting marine pilots to arriving commercial vessels and taking them off departing vessels.
2. Bulk cargo vessels entering the Bay via the SAMP area are carrying coal,
chemicals, cement, aggregates, ore, oxide, metals, salt, cobblestone and limestone (Waterson Terminal Services 2008). Alternatively, break bulk cargo vessels operating in the area are transporting forest products, steel, copper and calcium into Providence (Waterson Terminal Services 2008). A typical bulk carrier transiting through the Ocean SAMP area is over 700 feet long, 106 feet abeam and roughly 36,000 gross tons (Costabile, pers. comm., August 31, 2009).
3. Coal is one of the most common bulk cargos transported by ship into the Bay.
Coal carrying ships entering the Bay are destined for either Providence or Somerset, Massachusetts, across from Fall River. Ships destined for Providence transit directly up the East Passage of the Bay. Larger coal ships destined for Somerset power plants along the Taunton River sometimes need to transfer cargo, through a process known as lightering, onto barges that can navigate the channel’s 35 foot controlling depth (Weaver’s Cove Energy LLC 2009). These barges usually each carry an average of 20,000 tons of coal to Somerset (Costabile, pers. comm., December 16, 2009). Typical coal carriers that head straight for Somerset without lightering onto barges are roughly 750 feet long, 105 feet abeam and between 38,000 and 43,000 gross tons (Costabile, pers. comm., December 23, 2009). Because the two coal-powered facilities located in Somerset (across from Fall River) can require approximately 10,000 tons of coal per day to operate, a steady inflow of coal is required.10 Therefore, bulk vessels carrying coal enter the Bay at least once a week, sometimes every two to three days (McVay, pers. comm., August 31, 2009). In 2008, Northeast Marine Pilots handled 60 coal carriers making round trips to Brayton Point alone, whereas many other coal ships went to Providence or lightered in the Bay (Costabile, pers. comm., November 13, 2009). See Chapter 8, Renewable Energy, for further discussion of power sources.
4. Southern New England’s demand for petroleum products is met largely by oil
tankers and barges that transit through the SAMP area and into Narragansett Bay via the East Passage. As has been noted by the Energy Information Association
10 In December 2009 the NRG Energy coal-powered facility in Somerset, MA closed and ceased operations indefinitely (Dion 2009). As of the time of this writing a determination as to when, if ever, the facility may resume operations has not been made. If this facility is ultimately permanently closed, a significant reduction in coal barge and coal ship deliveries through the SAMP area to Mt. Hope Bay can be expected (LeBlanc, pers. comm., December 16, 2009).

Ocean Special Area Management Plan
Ocean SAMP D R A F T of 7/23/10 Chapter 7 Page 29 of 59
(2009), petroleum products imported into Providence provide nearly all of the transportation and home heating fuel used in Rhode Island, northeastern Connecticut, and southeastern Massachusetts. The majority of the petroleum-carrying ships entering Narragansett Bay are domestic tankers, self and non-self propelled, carrying petroleum products to Providence and East Providence. Petroleum imports are evenly distributed throughout the year, with vessels transiting during the day and night. Only a few deeper draft vessels require tidal lift, requiring the ships arrival to be coordinated with the occurrence of high tide (Federal Energy Regulatory Committee 2005).
5. In total, 239 tanker transits were recorded within Narragansett Bay during 2007 (6
headed to and from Fall River, MA, and 233 to and from Providence, RI) (U.S. Army Corps of Engineers 2007). Tanker drafts ranged from 20 to 40 feet, with the deepest draft vessels destined for Providence. A typical tanker transiting the Ocean SAMP area to or from Narragansett Bay is roughly 600 feet long, 90 feet abeam and over 23,000 gross tons (Costabile, pers. comm., August 31, 2009). In addition to traditional petroleum products, Liquefied Petroleum Gas (LPG) ships also transit the SAMP area en route to Providence. Typically, 10 to 12 ships per year enter the Bay, primarily within the fall and winter seasons, unloading approximately 20,000 to 30,000 metric tons of LPG per visit (Federal Energy Regulatory Committee 2005). These vessels are subject to special U.S. Coast Guard safety and security requirements upon entering the Bay (Federal Energy Regulatory Committee 2005).
6. The majority of traffic entering the Bay via the SAMP area is non-self propelled
barges, carrying petroleum and petroleum products, which are towed by tugboats or moved as part of integrated tug and barge units. In 2007, 592 barges, making over 1,000 transits, entered the Bay, primarily headed for Providence; see Table 4 below (U.S. Army Corps of Engineers, 2007). While the majority of barges entering Rhode Island are petroleum barges, dry cargo products including asphalt, coal, cement and road salt destined for Providence are also carried by barges (U.S. Army Corps of Engineers 2006). Fall River receives smaller amounts of dry cargo via barges; products imported to Fall River are mainly coal, chemicals and other crude materials such as rubbers and gums (U.S. Army Corps of Engineers 2006). Barge traffic originates mainly from the Port of New York and New Jersey, or points south, and travels northward for ports throughout New England. Tug and barges are more commonly used in coastal shipping because they are overall less expensive to operate (McVay, pers. comm., August 31, 2009).
Table 4. Number and Types of Barges Entering Narragansett Bay in 2007.
(U.S. Army Corps of Engineers 2007)
Type of Non-Self Propelled Barge Port of Call Providence Fall River
Dry Cargo 57 49 Tanker 474 12 Total 531 61

Ocean Special Area Management Plan
Ocean SAMP D R A F T of 7/23/10 Chapter 7 Page 30 of 59
7. Approximately 100 car carrier ships enter the Bay each year, destined for the Port
of Davisville (FXM Associates, 2008b). Typical car carriers transiting the area are up to 650 feet long and 106 feet abeam, and between 46,000 and 54,000 gross tons (Costabile, pers. comm., December 23, 2009). Per trip, these ships import approximately 800 to 1,000 units of VW, Audis, Subaru and Bentley brand vehicles that are subsequently distributed throughout the Northeast. Typically, car carrier ships anchor overnight outside the mouth of Narragansett Bay and transit up the East Passage toward Davisville in the early morning. Car carriers are usually unloaded in a single day, though some stay for two days (Matthews, pers. comm., July 27th, 2009). Average car carrier ships headed to Davisville are approximately 590 feet in length and 106 feet abeam (Costabile, pers. comm., August 31, 2009). See Section 740.2 for additional information on car carrier traffic into the Port of Davisville.
8. All foreign-flagged vessels, regardless of tonnage, and many U.S. flagged
commercial vessels entering Narragansett Bay must be escorted by a licensed marine pilot.11 A pilot provides a ship’s master with local knowledge on navigation and the safest route to the final destination. In the SAMP area, marine pilots board Narragansett Bay-bound commercial vessels in designated pilot boarding areas; see Figure 1 and Section 720 for further discussion.
9. For ships bound for Narragansett Bay, a marine pilot from the Northeast Marine
Pilots Association travels via pilot boat out to meet the inbound ship in order to guide it through state waters. The pilot then boards the vessel, and under the authority of the ship’s master, safely navigates the ship through the confined waters of a port, river or bays to its destination. Two pilot boats operate within the SAMP area, serving vessels bound for Narragansett Bay, Eastern Long Island Sound and Buzzards Bay (Northeast Marine Pilots Association 2009). Both vessels are docked in Newport Harbor.
730.3 Passenger Ferries
1. Multiple passenger ferries operate within the SAMP area, connecting a variety of
mainland and island destinations within and adjacent to the SAMP area. Some ferries connect Rhode Island destinations such as Block Island, Newport, and Point Judith; others link Connecticut and New York ports with Rhode Island and Massachusetts destinations. Within the SAMP area, ferries serving Block Island and Martha’s Vineyard are the most prominent routes and are of particular importance insofar as they create access to the mainland for island communities.
2. Figure 8 illustrates the typical routes of all ferries operating in the SAMP area. As
noted above, many ferries do not carry AIS transponders and so the Commercial Ship Traffic map (Figure 6, above) does not reflect ferry traffic. Ferries operating
11 46 R.I.G.L. § 46-9 et. seq..
Ocean Special Area Management Plan
Ocean SAMP D R A F T of 7/23/10 Chapter 7 Page 31 of 59
in the SAMP area typically follow standard routes that do not correspond to shipping lanes or other codified transportation areas, though these routes vary from time to time due to weather, traffic, or other conditions.
3. Interstate Navigation, whose ferries connect both Point Judith and Newport with
Block Island, provides a critical lifeline to Block Island through its ferry service. It is the only ferry operating company within the Ocean SAMP area that is regulated under the Rhode Island Public Utilities Commission. The Division of Public Utilities and Carriers and the Public Utilities Commission hold jurisdiction over intrastate water carriers of passengers and vehicles operating between ports within the State of Rhode Island (Rhode Island Public Utilities Commission, 2009). As a result of this authority, the Public Utilities Commission must approve Interstate Navigation ferry schedules, fares and routes (Myers, pers. comm., August 17, 2009).
4. Passenger counts for all ferries operating within the SAMP area between 2003
and 2005 indicate that the greatest number of passengers travel from Point Judith to Block Island on Interstate Navigation’s Block Island Ferry (see Table 6). In 2005 alone, Interstate Navigation’s traditional ferries carried 244,000 passengers (hi-speed was not yet in operation), 67,700 vehicles, 18,000 bicycles, 1,000 motorcycles and 10,000 tons of freight (Interstate Navigation 2006).

Ocean Special Area Management Plan
Ocean SAMP D R A F T of 7/23/10 Chapter 7 Page 32 of 59
Figure 8. Map of Ferry Routes
Ocean Special Area Management Plan
Ocean SAMP D R A F T of 7/23/10 Chapter 7 Page 33 of 59
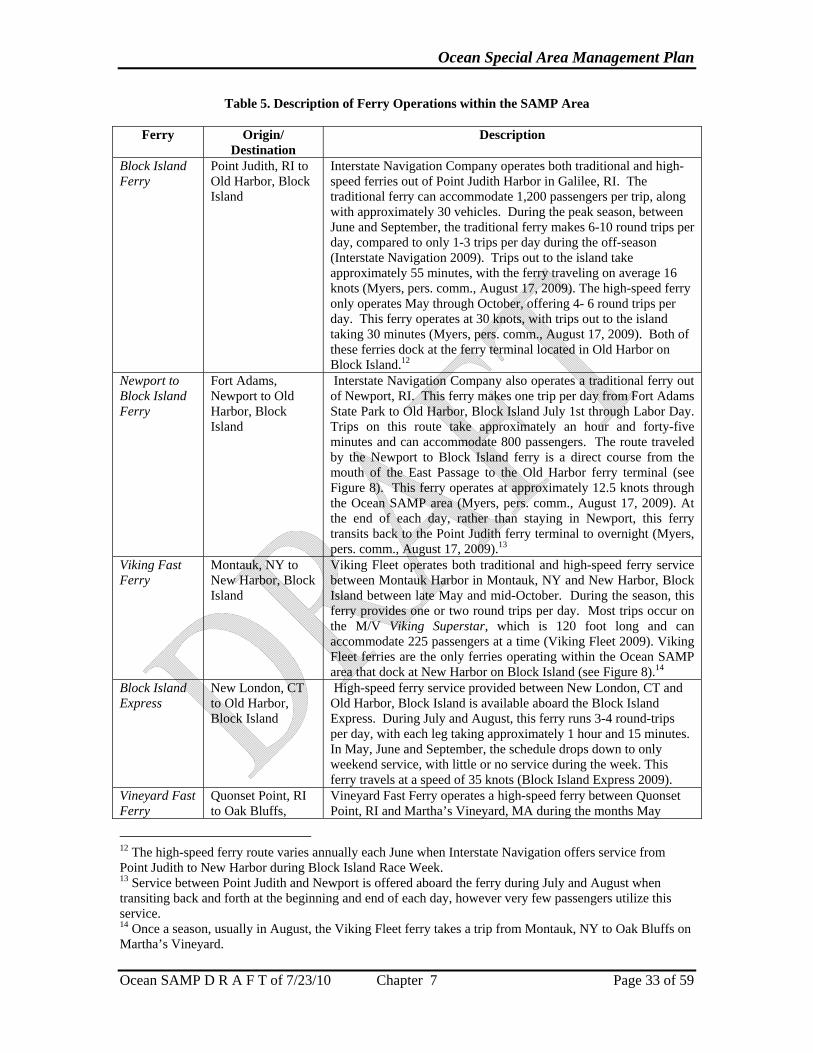
Table 5. Description of Ferry Operations within the SAMP Area
Ferry Origin/ Destination
Description
Block Island Ferry
Point Judith, RI to Old Harbor, Block Island
Interstate Navigation Company operates both traditional and high-speed ferries out of Point Judith Harbor in Galilee, RI. The traditional ferry can accommodate 1,200 passengers per trip, along with approximately 30 vehicles. During the peak season, between June and September, the traditional ferry makes 6-10 round trips per day, compared to only 1-3 trips per day during the off-season (Interstate Navigation 2009). Trips out to the island take approximately 55 minutes, with the ferry traveling on average 16 knots (Myers, pers. comm., August 17, 2009). The high-speed ferry only operates May through October, offering 4- 6 round trips per day. This ferry operates at 30 knots, with trips out to the island taking 30 minutes (Myers, pers. comm., August 17, 2009). Both of these ferries dock at the ferry terminal located in Old Harbor on Block Island.12
Newport to Block Island Ferry
Fort Adams, Newport to Old Harbor, Block Island
Interstate Navigation Company also operates a traditional ferry out of Newport, RI. This ferry makes one trip per day from Fort Adams State Park to Old Harbor, Block Island July 1st through Labor Day. Trips on this route take approximately an hour and forty-five minutes and can accommodate 800 passengers. The route traveled by the Newport to Block Island ferry is a direct course from the mouth of the East Passage to the Old Harbor ferry terminal (see Figure 8). This ferry operates at approximately 12.5 knots through the Ocean SAMP area (Myers, pers. comm., August 17, 2009). At the end of each day, rather than staying in Newport, this ferry transits back to the Point Judith ferry terminal to overnight (Myers, pers. comm., August 17, 2009).13
Viking Fast Ferry
Montauk, NY to New Harbor, Block Island
Viking Fleet operates both traditional and high-speed ferry service between Montauk Harbor in Montauk, NY and New Harbor, Block Island between late May and mid-October. During the season, this ferry provides one or two round trips per day. Most trips occur on the M/V Viking Superstar, which is 120 foot long and can accommodate 225 passengers at a time (Viking Fleet 2009). Viking Fleet ferries are the only ferries operating within the Ocean SAMP area that dock at New Harbor on Block Island (see Figure 8).14
Block Island Express
New London, CT to Old Harbor, Block Island
High-speed ferry service provided between New London, CT and Old Harbor, Block Island is available aboard the Block Island Express. During July and August, this ferry runs 3-4 round-trips per day, with each leg taking approximately 1 hour and 15 minutes. In May, June and September, the schedule drops down to only weekend service, with little or no service during the week. This ferry travels at a speed of 35 knots (Block Island Express 2009).
Vineyard Fast Ferry
Quonset Point, RI to Oak Bluffs,
Vineyard Fast Ferry operates a high-speed ferry between Quonset Point, RI and Martha’s Vineyard, MA during the months May
12 The high-speed ferry route varies annually each June when Interstate Navigation offers service from Point Judith to New Harbor during Block Island Race Week. 13 Service between Point Judith and Newport is offered aboard the ferry during July and August when transiting back and forth at the beginning and end of each day, however very few passengers utilize this service. 14 Once a season, usually in August, the Viking Fleet ferry takes a trip from Montauk, NY to Oak Bluffs on Martha’s Vineyard.

Ocean Special Area Management Plan
Ocean SAMP D R A F T of 7/23/10 Chapter 7 Page 34 of 59
Martha’s Vineyard through October. The 100 foot long, jet-propelled catamaran can accommodate 400 passengers and reach speeds of 33 knots. Round-trip service is offered two to four times per day, with the greatest number of trips occurring on holidays and weekends. The ferry will depart the Bay via the East passage and take a direct course to Oak Bluffs on Martha’s Vineyard (Vineyard Fast Ferry 2009) (see Figure 8).
Table 6. Passengers Carried Between 2003 and 2005 Aboard Ferries Operating Within the
Ocean SAMP Area (United States Coast Guard 2006)
Ferry Number of Passengers Number Daily Transits Maximum Minimum
New London to Block Island (High-Speed Ferry) 132,500 10 8
Montauk, NY to Block Island 8,700 10 4 Point Judith to Block Island
(High Speed) 66,605 12 6
Point Judith to Block Island (Traditional)
520,000 (plus 64,000 vehicles) 18 2
Newport to Block Island 6,500 2 2
730.4 Cruise Ships
1. Cruise ships frequently travel through the SAMP area destined for Rhode Island ports of call, which include Newport, Block Island, Bristol and Providence. Tens of thousands of visitors are transported aboard Rhode Island-bound cruise ships each year. In 2008, over 68,000 cruise ship passengers disembarked in Newport, contributing millions to the local economy. Cruise ship activity in and adjacent to the SAMP area is detailed below; see section 740.4 for a discussion of cruise ship port infrastructure and Chapter 6: Recreation and Tourism for a description of the tourism activity and economic impact associated with cruise ships.
2. According to the Newport Convention and Visitors Bureau (2009), 58 cruise ships
from eleven cruise lines were scheduled to stop in Newport in 2009 between April and November, with the most visits occurring in September and October (see Chapter 6: Recreation and Tourism). Normally, only one cruise ship is in port at any time and remains at anchor in Newport Harbor for 8 to 10 hours, though occasionally there are two ships scheduled for the same day (Newport Convention and Visitors Bureau 2009). During a cruise ship’s port call, a 200-yard U.S. Coast Guard-mandated security zone is maintained around the ship (City of Newport 2009). The security zone is activated at the Brenton Point pilot boarding station as a cruise ship begins its transit to Newport. The security zone remains in effect while the ship is in Newport and during the ship’s transit back out of the Bay, until the ship reaches the pilot boarding station again (LeBlanc pers. comm. November 11, 2009). No vessels are allowed within this security zone without permission of the Captain of the Port (City of Newport, Department of Economic

Ocean Special Area Management Plan
Ocean SAMP D R A F T of 7/23/10 Chapter 7 Page 35 of 59
Development 2009). The majority of cruise ships that visit Newport anchor off Newport Harbor in a general anchorage west of Goat Island and shuttle passengers to Newport’s Perrotti Park via ship tenders or local tenders (City of Newport, Department of Economic Development, 2009). American Cruise Line ships, which are generally smaller, dock at Newport’s Fort Adams rather than anchoring out in the harbor.
3. Most cruise ships transiting the SAMP area utilize the recommended vessel traffic
route through the SAMP area (see Section 720) and enter the Bay via the East Passage. However, ships operated by American Cruise Lines, which are more common within the SAMP area, may utilize the Sakonnet River entrance to Narragansett Bay (American Cruise Lines 2009). The larger cruise ships that call in Newport can carry up to 3,000 passengers and are as big as1132 feet long,134 feet abeam and 528 gross tons (Costabile, pers. comm., December 23, 2009). Smaller American Cruise Line ships carry up 100 passengers and average around 170 feet in length and 40 feet abeam (Costabile, pers. comm., November 13, 2009).
730.5 Naval Vessels
1. While Naval activity in Rhode Island and adjacent waters has been reduced since the active fleet left in 1972, the Navy still maintains a variety of strategic facilities at Naval Station Newport, including the Newport division of the Naval Undersea Warfare Center, and still conducts various land- and water-based training and testing operations in Newport and in Narragansett Bay, Block Island Sound, and Rhode Island Sounds. In addition, U.S. and foreign Naval vessels visit the Newport Naval facilities on a regular basis.
2. Naval ships heading to Naval Station Newport enter Narragansett Bay using the
Traffic Separation Scheme (see Section 720) and enter the Bay’s East Passage to reach the Naval Station Newport facilities.
3. Northeast Marine Pilots will in most cases provide a pilot for Naval ships entering
Narragansett Bay. While a commissioned government ship with an officer aboard is not required to use the services of a pilot, most ships choose to do so (Costabile, pers. comm., November 10, 2009). See section 720.5 for further information on pilot boarding areas.
4. Northeast Marine Pilots provided pilots for Navy vessels seven times in 2006; six
times in 2007; 10 times in 2008; and five as of November 1 in 2009 (Costabile, pers. comm., November 13, 2009). This results in an annual average of about seven port visits or 14 total transits.
5. The Navy retains two restricted area for torpedo testing and mine laying
exercises—see Figure 2 and Section 720.7 for information on Navy restricted
Ocean Special Area Management Plan
Ocean SAMP D R A F T of 7/23/10 Chapter 7 Page 36 of 59
areas. The Navy also maintains a large portion of Rhode Island Sound and the SAMP boundary area as the Narragansett Bay Operations Area (see Figure 2).
6. Naval fleet training exercises are generally carried out in deeper waters, as the
SAMP boundary area is regarded as too shallow (Tompsett, pers. comm., November 12, 2009). Surface vessels may take part at times and upon request in submarine training exercises in the Operations Area.
7. Whereas there is little Naval fleet training activity within the SAMP area, the
Naval Undersea Warfare Center, Division Newport (NUWC), routinely performs testing in the SAMP area. NUWC is based in Newport in part because it provides access to the SAMP area, where conditions are appropriate for testing and evaluation. Six different test operation types occur within some portion of the SAMP study area. These are: launcher testing; torpedo testing; semi-stationary equipment testing; towed equipment testing; Unmanned Surface Vehicle (USV) testing; and Unmanned Undersea Vehicle (UUV) testing. High speed launcher and torpedo testing are confined to the designated Navy restricted areas (see section 720.7), while all other activities are allowed to be conducted in waters both inside and outside the restricted areas. These activities have been determined to be consistent with the CRMC’s coastal policies; see the 2007 “Coastal Consistency Determination for Test Operations in Rhode Island Waters” for further information (Naval Undersea Warfare Center Division Newport 2007).
8. The number of annual tests performed by NUWC varies each year. Estimates
provided by NUWC indicate that there are five days of torpedo testing each year; five days of launcher testing; five days of towed equipment testing; 20 days of USV testing; 10 days of UUV testing; and 20 operations with semi-stationary equipment (these tests may occur over a number of days, e.g. a test item is deployed then recovered a week later). Navy vessels are generally associated with all test operations and can range in size from the smaller USVs to the TWR-841, a 120-foot torpedo weapons retriever (Tompsett, pers. comm., November 25, 2009).
9. Submarine traffic originates primarily from New London, CT. Submarines travel
on the surface from New London through the southwest corner of the SAMP area to reach deepwater Naval Fleet Operations Submarine Transit Lanes. Figure 2 shows a triangular part of the submarine lane to the southeast of Block Island, which is the only part of the SAMP area where submarines might be submerged, as they generally wait until they reach the 100-fathom depth far offshore (Vincent, pers. comm., November 12, 2009).
10. The submarine fleet also uses the Narragansett Bay Operations Area for training
exercises, and to prepare submarines and their crews for their formal voyages. This training can include the use of surface vessels and/or planes and helicopters. Detailed information on submarine transits through the SAMP area is unavailable as this information is classified.

Ocean Special Area Management Plan
Ocean SAMP D R A F T of 7/23/10 Chapter 7 Page 37 of 59
730.6 Other Government/Enforcement Vessels
1. There are two main types of enforcement vessels that operate within the Ocean SAMP area, RI Department of Environmental Management (DEM) vessels and U.S. Coast Guard vessels.
2. DEM’s Division of Law Enforcement operates enforcement vessels around Block
Island and along Rhode Island’s southern coast within 3 nautical miles of shore, enforcing regulations regarding recreational and commercial fishing, boating safety, and water quality. In addition, DEM also investigates recreational boating accidents, conducts water-based search and rescues, state beach and coastal park patrols, and responds to marine animal complaints (Rhode Island Department of Environmental Management, Division of Law Enforcement 2009).
3. The U.S. Coast Guard operates a variety of enforcement, search and rescue, and
government vessels within the SAMP area. Coast Guard vessels maintain maritime homeland security and enforce federal maritime law; conduct search and rescue missions, address marine environmental protection goals, and maintain all aids to navigation (United States Coast Guard, 2009). The SAMP area lies within the First District of the U.S. Coast Guard, a district that extends from Maine to New Jersey.
4. Other government vessels operating in the SAMP area may include survey or
research vessels such as those operated by CRMC, NOAA, the Environmental Protection Agency, the U.S. Geological Survey, and other entities. Such vessels collect data on the physical characteristics or biological resources of the area.
730.7 Other Vessels
1. Commercial and recreational fishing vessels use the navigational channels and infrastructure within the Ocean SAMP area when transiting out to fishing grounds or engaging in fishing activities. Fishing vessels use the same navigational infrastructure and some of the same port facilities as the vessel types discussed in this chapter. Fishing vessels and activity areas are discussed at length in Chapter 4 Fisheries Resources and Uses.
2. Recreational powerboats and sailboats frequently pass through or engage in
recreational activities within the SAMP area. These vessels use the same navigational infrastructure and some of the same port facilities as the vessel types discussed in this chapter. Recreational boating and cruising routes/activity areas are discussed at length in Chapter 6 Recreation and Tourism.
3. Other vessels which may pass through the SAMP area include commercial yacht
carriers, tall ships, and university or private research vessels.
Ocean Special Area Management Plan
Ocean SAMP D R A F T of 7/23/10 Chapter 7 Page 38 of 59
Section 740: Port Infrastructure Supporting Marine Transportation in the SAMP Area
1. The transport of goods and passengers by ship through the SAMP area and into Rhode Island is supported by port infrastructure in Rhode Island and neighboring ports. Commercial shipping in Narragansett Bay is primarily facilitated by the ports of Providence and Davisville, RI as well as Fall River, MA. Passenger ferry vessels utilize port infrastructure on Block Island and in Newport, Point Judith, and Quonset Point, whereas cruise ships rely on port facilities in Newport, Block Island, and Providence.
2. Industrial waterfronts throughout Rhode Island and adjacent states provide critical
infrastructure in support of ports and marine transportation activities. Per the Rhode Island Coastal Resources Management Program (CRMP), coastal waters adjacent to industrial waterfronts are zoned as Type 6 waters (“Industrial Waterfronts and Commercial Navigation Channels”). See Section 200.6 of the Rhode Island Coastal Resources Management Program for further information. According to the draft report of the Rhode Island Ports and Harbors Inventory (Bannon et al., in review), marine commercial waterfront property adjacent to Type 6 waters is quite limited yet valuable insofar as it supports a variety of marine commercial activities. See the Rhode Island Ports and Harbors Inventory for further information.
3. Fishing vessels rely on fishing-related infrastructure in Point Judith, Newport,
Block Island, and other Rhode Island ports. For detailed descriptions of Rhode Island’s fishing ports, see Chapter 4, Fisheries Resources and Uses. Recreational vessels take advantage of recreational marinas, boat ramps, and other infrastructure designed specifically for recreational users. For further information on these facilities see Chapter 6, Recreation and Tourism.
740.1 Providence
1. The Port of Providence is Rhode Island’s principal commercial port, handling over 70% of the cargo entering Narragansett Bay via federally maintained navigation channels (see Table 3, U.S. Army Corps of Engineers 2007). Services provided by the Port of Providence provide significant benefits to the state of Rhode Island and to the entire region. The market served by the port of Providence covers approximately 2,000 square miles in Rhode Island, northeastern Connecticut, and southeastern Massachusetts (U.S. Army Corps of Engineers 2001). The Port of Providence is an intermodal port that offers interstate highway access as well as rail service that reaches inland to major connections throughout the U.S. Coal imported into Providence is transported as far afield as Merrimack, NH (Waterson Terminal Services, 2008 as reported in CRMC, in review), and road salt is distributed from the Port over a 100-mile

Ocean Special Area Management Plan
Ocean SAMP D R A F T of 7/23/10 Chapter 7 Page 39 of 59
radius throughout all of New England (Sprague Energy, 2008 as reported in CRMC, in review).
2. The Port of Providence is of particular importance, both locally and regionally,
for its role in supplying energy products to Southern New England. Providence has been referred to as the “energy lifeline of the state” (U.S. Army Corps of Engineers 1998) due to its critical role in importing home heating oil and other petroleum products. One estimate suggested it would take approximately 140,000 truckloads to transport the equivalent amount of cargo carried by tanker and barges into the state annually (U.S. Army Corps of Engineers 1998). Furthermore, the Energy Information Administration (2009) recognizes the importance of the Port of Providence as “a key petroleum products hub for the New England area. Almost all of the transportation and heating fuel products consumed in Rhode Island, eastern Connecticut, and parts of Massachusetts are supplied via marine shipments through this port.” The Department of Homeland Security also recognizes the Port of Providence as a critical port in supplying energy to New England. Homeland Security has allocated in the past, and continues to allocate, port security grant funding to ensure the security of this important energy supply line (e.g. Department of Homeland Security 2008). .
3. Shipping operations into the Port of Providence are reliant on port facilities
located in both Providence and East Providence. Most of the port’s maritime activity is concentrated in ProvPort (a private port facility located in Providence), though these industries depend on support services provided by tugboat, shipyard, and other services located throughout Providence Harbor. Petroleum import facilities and tank farms are located on both sides of the Harbor in Providence and East Providence. For further information on port facilities in Providence, see the Metro Bay SAMP (CRMC in review) and the Rhode Island Ports and Harbors Inventory (URI Coastal Resources Center, in review).
4. Marine transportation into the Port of Providence is facilitated by a federally
maintained navigational channel, which was recently dredged in 2005 to a 40 foot depth, allowing Providence to accommodate larger draft vessels. The deep draft channel, as well as its intermodal capabilities, connecting water, rail and land transportation, together make the Port of Providence attractive to both domestic and international vessels (ProvPort 2009). Providence is one of the few New England ports that can accommodate large ocean-going vessels and offer direct access to interstate highways (I-95 and I-195), making it an attractive port for cargo destined for inland Northeastern cities (FXM Associates 2008a).
740.2 Quonset/Davisville
1. The Quonset Business Park includes the Port of Davisville, which is the second intermodal shipping terminal in Rhode Island; a ferry terminal utilized by Vineyard Fast Ferry; and several other maritime businesses. For further

Ocean Special Area Management Plan
Ocean SAMP D R A F T of 7/23/10 Chapter 7 Page 40 of 59
information on maritime facilities in Quonset/Davisville, see the Rhode Island Ports and Harbors Inventory (URI Coastal Resources Center, in review).
2. The Port of Davisville offers direct access to rail service and major highways
from the port facilities. Vehicle imports comprise the majority of the cargo handled by the port. The Port of Davisville is home to the twelfth largest automobile importing, processing and distribution center in the United States, with approximately 100 car carrier ships handled by the port per year (FXM Associates, 2008b). Each vessel imports approximately 800 to 1,000 vehicles per trip, to be later distributed throughout New England and the Northeast. Table 7 shows the number of ships and vehicles processed at Davisville for the past two years. In peak months Davisville handles up to 13 vessels and in slower months as few as 4 vessels (see Table 7).
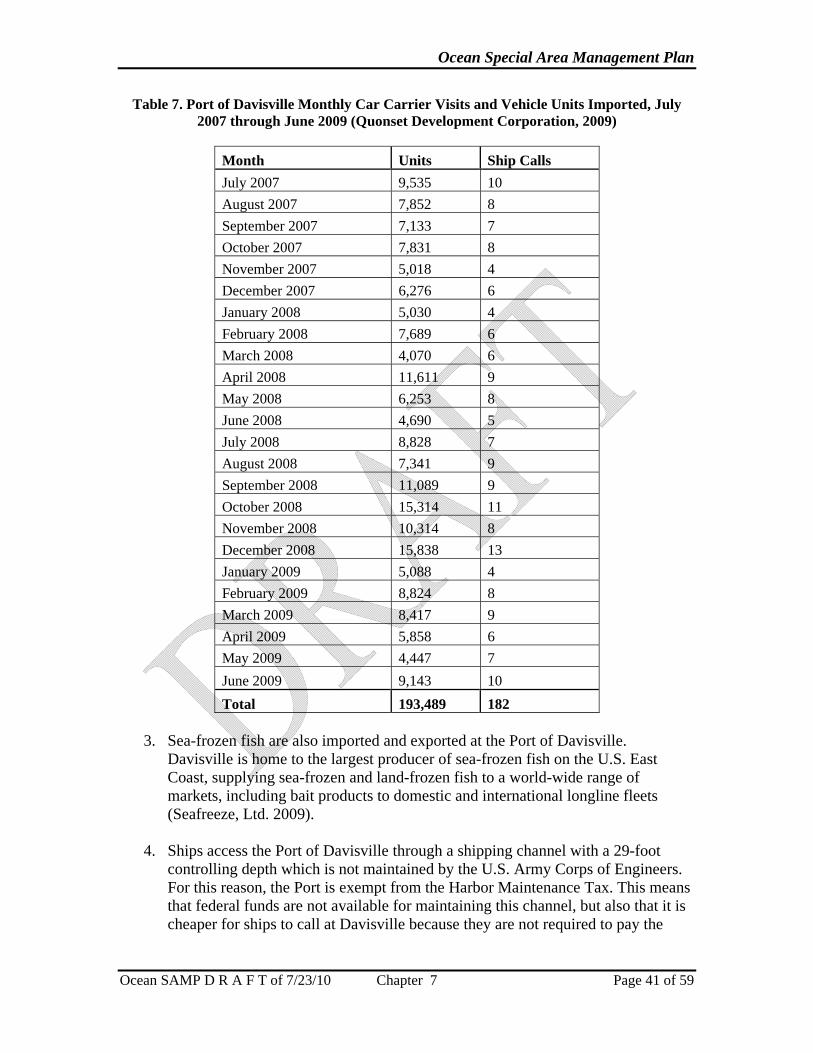
Ocean Special Area Management Plan
Ocean SAMP D R A F T of 7/23/10 Chapter 7 Page 41 of 59
Table 7. Port of Davisville Monthly Car Carrier Visits and Vehicle Units Imported, July 2007 through June 2009 (Quonset Development Corporation, 2009)
Month Units Ship Calls July 2007 9,535 10 August 2007 7,852 8 September 2007 7,133 7 October 2007 7,831 8 November 2007 5,018 4 December 2007 6,276 6 January 2008 5,030 4 February 2008 7,689 6 March 2008 4,070 6 April 2008 11,611 9 May 2008 6,253 8 June 2008 4,690 5 July 2008 8,828 7 August 2008 7,341 9 September 2008 11,089 9 October 2008 15,314 11 November 2008 10,314 8 December 2008 15,838 13 January 2009 5,088 4 February 2009 8,824 8 March 2009 8,417 9 April 2009 5,858 6 May 2009 4,447 7 June 2009 9,143 10 Total 193,489 182
3. Sea-frozen fish are also imported and exported at the Port of Davisville.
Davisville is home to the largest producer of sea-frozen fish on the U.S. East Coast, supplying sea-frozen and land-frozen fish to a world-wide range of markets, including bait products to domestic and international longline fleets (Seafreeze, Ltd. 2009).
4. Ships access the Port of Davisville through a shipping channel with a 29-foot
controlling depth which is not maintained by the U.S. Army Corps of Engineers. For this reason, the Port is exempt from the Harbor Maintenance Tax. This means that federal funds are not available for maintaining this channel, but also that it is cheaper for ships to call at Davisville because they are not required to pay the
Ocean Special Area Management Plan
Ocean SAMP D R A F T of 7/23/10 Chapter 7 Page 42 of 59
Harbor Maintenance Tax on their cargo (Matthews, pers. comm., December 22, 2009). Davisville’s tax-exempt status means a savings of $12.50 per $10,000 in cargo value (NORAD 2009).
5. The Port of Davisville has several advantages in attracting commercial vessel
traffic. These include the lack of a Harbor Maintenance Fee charged on cargo (discussed above) and its designation as a Foreign Trade Zone with U.S. Customs operations (FXM Associates 2008b; Quonset Development Corporation 2009). Together these features help attract foreign vessel traffic to the state.15
6. Vineyard Fast Ferry, which operates a seasonal fast ferry between Quonset Point,
RI and Martha’s Vineyard, MA, operates a small ferry terminal in the Quonset Davisville Business Park. See section 730.3 for further information on this and other passenger ferries operating in the SAMP area.
7. Other current marine transportation-related uses at the Quonset Business Park
include businesses such as Senesco Marine, a barge-building company, and General Dynamics Electric Boat, which builds parts of U.S. Navy submarines. In addition, the Park is scheduled to become the home port of the new NOAA research ship, R/V Okeanos Explorer (Kuffner 2009).
740.3 Fall River
1. The Port of Fall River is the third major commercial port in Narragansett Bay, and is the second most active port in Massachusetts (Donovan 2003). In the Port of Fall River, which for the purposes of this chapter includes both Fall River and Somerset, commercial cargo and fishing vessels are accommodated at the Fall River State Pier. Coal carriers also make berth at power plants in Somerset, across from Fall River. Most commercial traffic transiting through the SAMP area to Fall River and Somerset is coal carriers and barges, as well as chemical cargo to support nearby power stations and chemical facilities. Coal brought to Somerset via the SAMP area directly supports the operations of the Brayton Point Power Station (Dominion 2009).
2. Due to the shallow depth of Mount Hope Bay outside the federally maintained
channel approaching the Port of Fall River, many larger commercial vessels lighter within Narragansett Bay in an anchorage near Gould Island before proceeding to port (Weavers Cove Energy LLC 2009).
15 U.S. Customs and Border Protection charges a fee of 0.125% of the cargo value on all imported goods admitted into a foreign trade zone via navigable waterways, maintained by the U.S. Army Corps of Engineers. Harbor Maintenance Fees are subsequently deposited into the Harbor Maintenance Trust Fund, which is then made available, to the Army Corps of Engineers for the improvement, dredging and maintenance of U.S. navigational channels, ports, and harbors (Water Resources Development Act of 1986, 33 U.S.C. 2238 §210, Internal Revenue Code of 1986, §9505c).
Ocean Special Area Management Plan
Ocean SAMP D R A F T of 7/23/10 Chapter 7 Page 43 of 59
740.4 Newport
1. Newport Harbor is a major hub of activity for vessels traveling through the SAMP area. Within Newport Harbor and Brenton Cove, terminals at Fort Adams and Perotti Park are frequently used by visiting cruise ships as well as passenger ferries destined for Block Island (see Section 730.4 and Ch. 6 Recreation and Tourism for further discussion).
2. Naval vessels associated with the Naval Station Newport and the Naval Undersea
Warfare Center (NUWC), also in Newport, travel through the SAMP area and are supported by infrastructure located at these facilities. See section 730.5 for further discussion of Naval operations.
3. Newport is a popular staging area or destination for recreational vessels; a number
of privately owned docks, moorings, marinas and yacht clubs, public piers, and other infrastructure support recreational vessels. See Chapter 6, Recreation and Tourism for further discussion. Newport also has some fisheries-related port infrastructure used by commercial and recreational fishermen. See Chapter 5, Fisheries Resources and Uses, for further discussion.
740.5 Point Judith
1. Point Judith Harbor supports both commercial and privately owned vessels that utilize the SAMP area through the privately owned marinas and moorings, as well as the public boat state pier facilities located here. The outer harbor is also classified as a Harbor of Refuge, offering a protected and sheltered anchorage for vessels transiting the SAMP area.
2. Point Judith Harbor is the main port of embarkation for Interstate Navigation’s
Block Island Ferry (see Section 730.3) which utilizes the state pier facilities.
3. Point Judith is the center of the Rhode Island commercial fishing industry and is the home port for many commercial as well as party/charter boat fishing vessels; see Chapter 5, Fisheries Resources and Uses, for further discussion.
740.6 Block Island
1. Block Island’s shore-side infrastructure includes two ferry terminals, one each in Old Harbor and New Harbor, as well as a number of public boat ramps and privately owned marinas. Apart from the ferry service, and the occasional cruise ship described above in section 730, vessel traffic to and from Block Island is comprised mainly of pleasure craft. For more information on recreational boating associated with Block Island and the marinas and boat ramps that support these activities see Chapter 6 Recreation and Tourism.

Ocean Special Area Management Plan
Ocean SAMP D R A F T of 7/23/10 Chapter 7 Page 44 of 59
Section 750: Other Infrastructure in the SAMP Area 750.1 Disposal Sites
1. There is one active dredged material disposal site within the SAMP boundary, the Rhode Island Sound Disposal Site. This site was designated in December 2004; before its formal site designation it was used as a disposal site for sediment from the Providence River dredging project (USACE n.d.) This site is managed by the U.S. Environmental Protection Agency (EPA). This site is centered at 41° 13.8’ N, 71° 22.8’W, approximately 9.1 nautical miles south southeast of Point Judith within the traffic separation zone (See Figure 9). A second inactive disposal site, labeled on NOAA charts as “Dumping Ground,” is located about 4.5 nautical miles south of Brenton Point (see Figure 9).
750.2 Unexploded Ordnance (UXO)
1. There are seven identified locations of unexploded ordnance within the SAMP area, all to the east of Block Island (see Figure 9). These include unexploded depth charges, unexploded bombs and unexploded general ordnance. There is no evidence that these will be removed, as some date back to the 1940s and ‘50s. (Battelle 2003). Moving from east to west on Figure 9 these include a depth charge (1995); depth charges (1952); bombs (1958); depth charge (1947); general ordnance (1971); depth charge (1957); and general ordnance (1992) (NOAA Chart 13218).
750.3 Underwater Cables
1. Underwater cables running through the SAMP area are owned by three companies: AT&T, Verizon and Reliance Globalcom. They include both in service and out of service telecommunications cables (See Figure 9).
2. There are six communications cables running through the SAMP area. Three are
owned by AT&T and one managed by the company, and they all originate at Green Hill in South Kingstown, RI. Two of these cables are in active use. One AT&T cable, TAT 12/13 Interlink (in service), runs to the west of Block Island. The other three communications cables (TAT 6 [out of service], TAT 10 [out of service] and TAT 12 [in service]) run to the east of Block Island. Another cable, CB-1 (formerly Gemini North), is owned by Verizon, and also originates in Green Hill, and runs to Bermuda. The last cable, FA-1 North (formerly FLAG Atlantic North) is an international telecommunications cable owned by Reliance Globalcom and is in service, and originates from the north shore of Long Island at Crab Meadow. All of these cables exit the southern boundary of the SAMP area (pers. comm., Robert Wargo, AT&T; Frank Salley, Verizon; Martin Tegg, Reliance Globalcom, November 12 – 19, 2009).

Ocean Special Area Management Plan
Ocean SAMP D R A F T of 7/23/10 Chapter 7 Page 45 of 59
3. NOAA nautical charts may list “Cable Areas” but that does not necessarily mean that actual cables reside there. Cables are shown on NOAA charts at the request of a data provider, such as the U.S. Army Corps of Engineers or other permitting entity, so that mariners do not anchor or drag gear over these areas and damage the cable (National Oceanic and Atmospheric Administration 1992).

Ocean Special Area Management Plan
Ocean SAMP D R A F T of 7/23/10 Chapter 7 Page 46 of 59
Figure 9. Map of Undersea Cables, Unexploded Ordnance and Dredge Disposal Site

Ocean Special Area Management Plan
Ocean SAMP D R A F T of 7/23/10 Chapter 7 Page 47 of 59
Section 760: Value of Marine Transportation and Navigational Uses within the SAMP Area
1. Marine transportation and navigational uses of the SAMP area are economically valuable to the State of Rhode Island and to the entire Southern New England region. Imports into the Port of Providence, which pass through the SAMP area, provide an “energy lifeline” not only to Rhode Island residents, but also to households and businesses in Massachusetts and Connecticut (U.S. Army Corps of Engineers 1998; Energy Information Administration 2009). In addition, these uses facilitate commerce through the import of consumer and manufacturing goods, and support marine-related industries throughout the state. These industries in turn create jobs, both on ships and ashore, for Rhode Island residents. Detailed statistics on Rhode Island marine transportation-related jobs and wages are included below.
2. An economic impact study of Rhode Island’s navigation-dependent industries,
conducted as part of the Environmental Impact Statement for the recent Providence River dredging project, found that “navigation-dependent activity in Rhode Island has a significant impact on the states economy as a whole that goes beyond the navigation-dependent sectors” (The Greeley-Polhemus Group, Inc. 2004, pg. 15). This study, which included navigation-dependent marine transportation industries as well as recreational and fishing-related industries, found that in 2000, $586 million of direct economic impact on the Gross State Product (GSP) was generated from the navigation-dependent industries listed above. Moreover, if indirect and induced GSP were considered, the economic impact of navigation-dependent activities in Rhode Island totaled $1.1 billion. Furthermore, according to this assessment, 12,265 direct jobs and $425 million in wages were supported by navigation-dependent industries in Rhode Island during 2000 (The Greeley-Polhemus Group, Inc. 2004).
3. The National Ocean Economics Program (2009) found that in 2004, marine
transportation-related industries in Rhode Island alone accounted for 1,968 jobs, $134 million in wages, and $97 million in gross domestic product. These statistics are based on analysis of Bureau of Labor Statistics data and reflect jobs in freight and passenger transportation, marine transportation-related equipment, and other marine transportation-related businesses.16
4. Rhode Island’s ports rely on ships passing through the SAMP area; these ports
generate a significant amount of economic activity. A 2009 study of the Port of
16 Marine transportation-related businesses are defined by the National Ocean Economics Program as businesses falling under the following Standard Industrial Classification (SIC) and North American Industrial Classification System (NAICS) categories: Water Transportation of Freight, Water Transportation of Passengers, Deep Sea Freight Transportation, Marine Passenger Transportation, Marine Transportation Services, Search and Navigation Equipment and Warehousing (Colgan 2007).
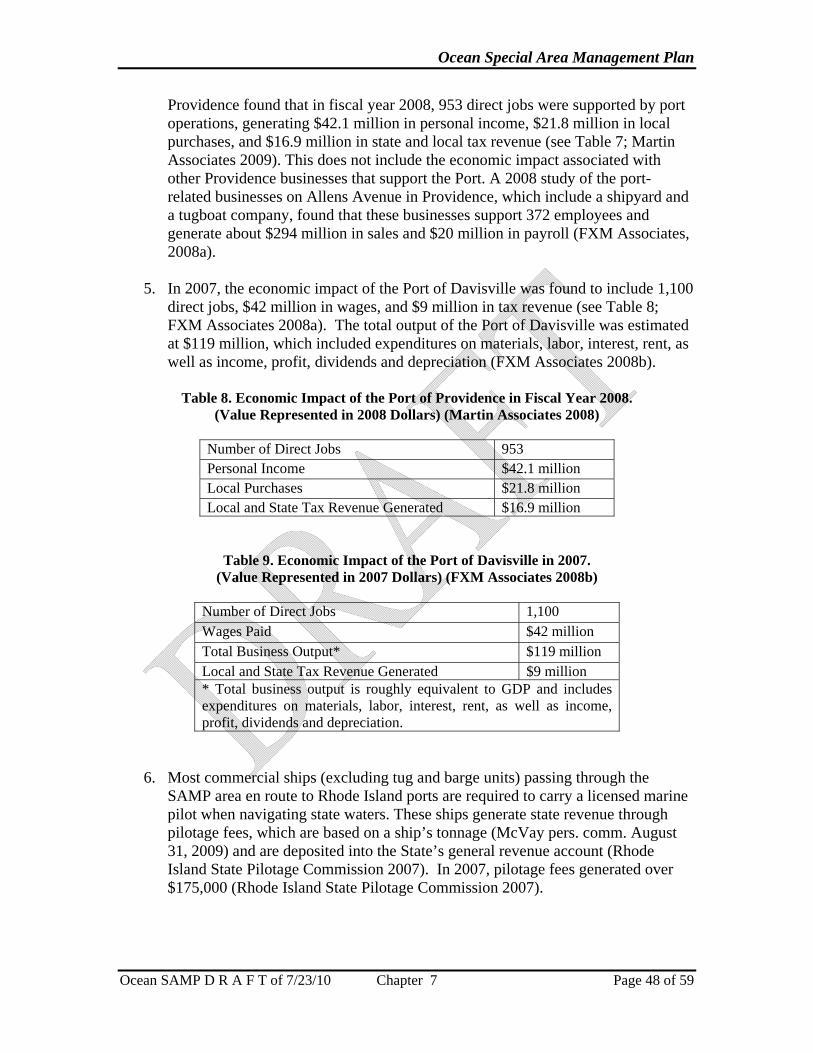
Ocean Special Area Management Plan
Ocean SAMP D R A F T of 7/23/10 Chapter 7 Page 48 of 59
Providence found that in fiscal year 2008, 953 direct jobs were supported by port operations, generating $42.1 million in personal income, $21.8 million in local purchases, and $16.9 million in state and local tax revenue (see Table 7; Martin Associates 2009). This does not include the economic impact associated with other Providence businesses that support the Port. A 2008 study of the port-related businesses on Allens Avenue in Providence, which include a shipyard and a tugboat company, found that these businesses support 372 employees and generate about $294 million in sales and $20 million in payroll (FXM Associates, 2008a).
5. In 2007, the economic impact of the Port of Davisville was found to include 1,100
direct jobs, $42 million in wages, and $9 million in tax revenue (see Table 8; FXM Associates 2008a). The total output of the Port of Davisville was estimated at $119 million, which included expenditures on materials, labor, interest, rent, as well as income, profit, dividends and depreciation (FXM Associates 2008b).
Table 8. Economic Impact of the Port of Providence in Fiscal Year 2008.
(Value Represented in 2008 Dollars) (Martin Associates 2008)
Number of Direct Jobs 953 Personal Income $42.1 million Local Purchases $21.8 million Local and State Tax Revenue Generated $16.9 million
Table 9. Economic Impact of the Port of Davisville in 2007. (Value Represented in 2007 Dollars) (FXM Associates 2008b)
Number of Direct Jobs 1,100 Wages Paid $42 million Total Business Output* $119 million Local and State Tax Revenue Generated $9 million * Total business output is roughly equivalent to GDP and includes expenditures on materials, labor, interest, rent, as well as income, profit, dividends and depreciation.
6. Most commercial ships (excluding tug and barge units) passing through the SAMP area en route to Rhode Island ports are required to carry a licensed marine pilot when navigating state waters. These ships generate state revenue through pilotage fees, which are based on a ship’s tonnage (McVay pers. comm. August 31, 2009) and are deposited into the State’s general revenue account (Rhode Island State Pilotage Commission 2007). In 2007, pilotage fees generated over $175,000 (Rhode Island State Pilotage Commission 2007).

Ocean Special Area Management Plan
Ocean SAMP D R A F T of 7/23/10 Chapter 7 Page 49 of 59
7. Cruise ship traffic through the SAMP area contributes revenue to local economies, such as Newport, through the influx of cruise ship passengers during the summer season. For every cruise ship passenger that disembarks from a vessel in Newport, the City of Newport collects a $4 port tax (Smith, pers. comm., July 16, 2009). Consequently, the 2008 cruise ship season produced approximately $272,000 in city revenue. In addition to municipal revenue, cruise ship passengers also have an economic impact through their personal spending; see Chapter 6, Recreation and Tourism, for further discussion
8. Navy operations in the SAMP area contribute not only to national security, but
also to the local economies in which military facilities are based through expenditures, development, and the creation of jobs. The economic value of naval uses of the SAMP area is difficult to quantify, as much of the military activity occurring in the SAMP area is based out of facilities in neighboring states, such as Groton, CT. However, in 2008 the Naval Undersea Warfare Center (NUWC) Division in Newport, RI reported over $531 million in total institutional spending, and spent over $240 million in wages on their 2,600 employees (see Table 9). Moreover, local businesses also benefitted from $189 million awarded in Navy contracts to Rhode Island-based companies (see Table 9).
Table 10. Economic Impact of the Naval Undersea Warfare Center Division Newport,
2007-2008 (Naval Undersea Warfare Center Division Newport 2008 and 2009)
2007 2008 Total NUWC Spending $466 mil $531 mil Total Number of Employees 2,578 2,602 Wages Paid $235 mil $246 mil Contracts Awarded to Rhode Island-Based Companies $123 mil $189 mil
9. Recreational boaters and commercial and recreational fishing vessels also utilize the SAMP area for fishing or other recreational uses. These uses support Rhode Island’s marine-related industry, as well as coastal economies, through the sale of fuel, supplies, and marina services and are discussed in detail in Chapter 5 Fisheries Resources and Uses and Chapter 6 Recreation and Tourism.
10. The data presented here reflects the economic importance of marine transportation
and navigational uses of the SAMP area to the state as a whole, as well as the coastal communities of the state. Port operations within Rhode Island rely on the waters of the SAMP area to transport valuable cargo and facilitate commerce within the region. In addition, the economic activity of cruise ship tourism, recreational boating and military uses that navigate and operate within the SAMP area contribute to both state and local economies.
Ocean Special Area Management Plan
Ocean SAMP D R A F T of 7/23/10 Chapter 7 Page 50 of 59
Section 770: Marine Transportation, Navigation and Infrastructure Policies 770.1 Policies
1. Applications for projects proposed to be sited in State waters pursuant to the Ocean SAMP shall not have a significant impact on marine transportation, navigation and existing infrastructure. , Where the Council, in consultation with the US Coast Guard, Navy, NOAA, MMS, USACE, marine pilots, the RI Port Safety and Security Forums, or other entities, as applicable, determines that such an impact on marine transportation, navigation and existing infrastructure is unacceptable, the Council shall require that the applicant modify the proposal or the Council shall deny the proposal. For the purposes of Chapter 7 and policies 770.1.1 – 770.2.1, impacts will be evaluated according to the same criteria used by the U.S. Coast Guard, as follows; these criteria shall not be construed to apply to any other Ocean SAMP chapters or policies:
a. Negligible: No measure impacts. b. Minor: Adverse impacts to the affected activity could be avoided with
proper mitigation; or impacts would not disrupt the normal or routine functions of the affected activity or community; or once the impacting agent is eliminated, the affected activity would return to a condition with no measurable effects from the proposed action without any mitigation.
c. Moderate: Impacts to the affected activity are unavoidable; and proper mitigation would reduce impacts substantially during the life of the proposed action; or the affected activity would have to adjust somewhat to account for disruptions due to impacts of the proposed action; or once the impacting agent is eliminated, the affected activity would return to a condition with no measurable effects from the proposed action if proper remedial action is taken.
d. Major: Impacts to the affected activity are unavoidable; proper mitigation would reduce impacts somewhat during the life of the proposed action; the affected activity would experience unavoidable disruptions to a degree beyond what is normally acceptable; and once the impacting agent is eliminated, the affected activity may retain measurable effects of the proposed action indefinitely, even if remedial action is taken.
2. Projects or proposals that significantly impact marine transportation are
prohibited. The Council recognizes the importance of shipping lanes, precautionary areas, recommended vessel routes, pilot boarding areas, anchorages, and Navy restricted areas to marine transportation and navigation activities in the SAMP area. The Council also recognizes that these and other waters within the SAMP area are heavily used by numerous existing users which have adapted to each other with regard to their uses of ocean space. Any changes in the spatial use patterns of any one of these users will result in potential impacts to the other users. The Council will carefully consider the potential impacts of such changes on the marine transportation network. Where it is determined that
Ocean Special Area Management Plan
Ocean SAMP D R A F T of 7/23/10 Chapter 7 Page 51 of 59
there is a significant adverse impact, the Council may modify or deny activities that significantly detract from these transportation areas and activities. Changes to existing designated navigational areas proposed by the U.S. Coast Guard, NOAA, the Rhode Island Port Safety and Security Forums, or other entities could similarly impact existing uses. The Council requests that they be notified by any of these parties if any such changes are to be made to the transportation network so that they may work with those entities to achieve a proper balance among existing uses. .
3. The Council will consult with marine transportation organizations, vessel
operators, and federal entities such as the U.S. Coast Guard, the U.S. Navy, the Northeast Marine Pilots Association, and nearby port operators when scheduling offshore marine construction or dredging activities. It is the Council’s policy to promote harmonious interaction between uses of offshore waters. The Council will not allow activities that cause a significant disruption to occur. Where it is determined that there is a significant conflict with marine transportation and navigation, the Council may modify or deny activities to minimize conflict with these uses.
4. The Council recognizes the economic, historic, and cultural value of marine
transportation and navigation uses of the Ocean SAMP area to the state of Rhode Island. The Council’s goal is to promote uses of the Ocean SAMP area that do not significantly interfere with marine transportation and safe navigation within designated areas. Designated areas are defined as shipping lanes, precautionary areas, recommended vessel routes, pilot boarding areas, anchorages, and Navy restricted areas as delineated on NOAA nautical charts.
5. The Council will encourage and support uses of the SAMP area that enhance
marine transportation and safe navigation within designated areas. Designated areas are defined above in section 770.1.4.
6. The Council shall work together with the U.S. Coast Guard, the U.S. Navy, the
U.S. Army Corps of Engineers, NOAA, recreational boating organizations, marine pilots, and other marine safety organizations to promote safe navigation around offshore structures during both the construction and operation phases of such projects. The Council will promote and support the education of recreational boaters regarding safe boating around offshore structures.
7. Preliminary consultations with the U.S. Coast Guard, the U.S. Minerals
Management Service, and the U.S. Army Corps of Engineers have indicated that no boating access restrictions are planned for the waters around and through offshore structures and developments and cable routes except for those necessary for navigational safety. The Council endorses this approach and will work to ensure that the waters surrounding offshore structures remain open to marine transportation, except for navigational safety restrictions.
Ocean Special Area Management Plan
Ocean SAMP D R A F T of 7/23/10 Chapter 7 Page 52 of 59
8. The Council will provide for communication with marine transportation and navigation user groups regarding offshore marine construction or dredging activities. Communication will be facilitated through a project website and will complement standard U.S. Coast Guard procedures such as Notices to Mariners for notifying vessel operators of obstructions to navigation.
770.2 Standards
1. The potential impacts of a proposed project on marine transportation and navigation may be evaluated in accordance with the National Environmental Policy Act, 42 U.S.C. § 4321 et. seq. Depending on the project and the lead federal agency, NEPA review may include a waterway suitability assessment describing vessel use and the impacts a proposed project may have on navigational safety and security, an assessment of boating intensity in the project area, or other requirements (e.g. Minerals Management Service 2009a; Federal Energy Regulatory Commission 2008; Weavers Cove Energy 2009). See the MMS Renewable Energy Framework for further information on NEPA requirements for renewable energy projects in federal waters (Minerals Management Service 2009b).

Ocean Special Area Management Plan
Ocean SAMP D R A F T of 7/23/10 Chapter 7 Page 53 of 59
Section 780: Works Cited
Albion, Robert G., Benjamin W. Labaree, and William A. Baker. 1970. New England and the Sea. Mystic, CT: Mystic Seaport Press. American Cruise Lines. 2009. New England Islands Eight-Day/Seven-Night Cruise. Available online at: www.americancruiselines.com. Last accessed December 7, 2009. Bannon, Rebecca, Austin Becker, Susan Kennedy, Jennifer McCann, Don Robadue, and Angela Wilson. In review. Rhode Island’s Ports and Commercial Harbors: A GIS Inventory of Current Uses. University of Rhode Island Coastal Resources Center/Rhode Island Sea Grant. Battelle. Final Report, Task 10.4 Alternative Site Screening Report. June 2003. Block Island Express. 2009. Jessica W. Available online at: https://www.longislandferry.com/bif/home.htm. Last accessed December 7, 2009. Block Island Ferry. 2009. Schedule. http://www.blockislandferry.com. Last accessed December 7, 2009. City of Newport, Department of Economic Development. 2009. Cruise Ships. Available online at: http://www.ci.newport.ri.us/departments/economic-development/harbor/cruise.cfm Colgan, C.L. 2007. A Guide to the Measurement of the Market Data for the Ocean and Coastal Economy in the National Ocean Economics Program. National Ocean Economics Program, January 2007. Available online at: www.oceaneconomics.org. Last accessed November 17, 2009. Dion, Marc Munroe. 2009. “Somerset’s NRG power plant closing down.” Fall River, MA: Herald News. November 4, 2009. Available online at http://www.heraldnews.com/business/x1312013989/Somersets-NRG-power-plant-closing-down. Dominion Power. 2009. Brayton Point Power Station. Available online at: http://www.dom.com/about/stations/fossil/brayton-point-power-station.jsp. Last accessed October 21, 2009. Donovan, Ann. 2003. “Beyond Boston Harbor – The Bay State’s ‘Four Ports’.” In Coastlines. Massachusetts Office of Coastal Zone Management. Energy Information Administration. 2009. State Energy Profiles: Rhode Island. Available online at: http://tonto.eia.doe.gov/state/state_energy_profiles.cfm?sid=RI#map

Ocean Special Area Management Plan
Ocean SAMP D R A F T of 7/23/10 Chapter 7 Page 54 of 59
Federal Energy Regulatory Committee. 2005. Weaver’s Cove LNG Project Final Environmental Impact Statement. Available online at: http://www.ferc.gov/industries/lng/enviro/eis/2005/05-20-05-eis.asp. Last accessed October 16, 2009. Federal Highway Administration. 2006. Key Freight Transportation Challenges: Congestion and Capacity. Available online at http://ops.fhwa.dot.gov/freight/freight_analysis/freight_story/congest.htm. Last accessed December 7, 2009. Federal Register. 2008. “Endangered Fish and Wildlife; Final Rule To Implement Speed Restrictions to Reduce the Threat of Ship Collisions With North Atlantic Right Whales.” Federal Register, October 10, 2008, pg. 60173-60191. FXM Associates. 2008a. Economic Effects of Allens Avenue Businesses. Prepared for the Providence Working Waterfront Alliance. FXM Associates. 2008b. Economic Effects of the Port of Davisville, RI. Prepared for the Quonset Development Corporation. Global Security. Military-Newport. Available online at: http://www.globalsecurity.org/military/facility/newport.htm Last accessed November 11, 2009. Greeley-Polhemus Group, Inc. 2004. Final Report, Task 15.1: The Economic Significance of the Navigation-Dependent Industries with the Zone of Siting Feasibility. Rhode Island Region Long-Term Dredged Material Disposal Site Evaluation Project. Report to the U.S. Army Corps of Engineers, Contract Number DACW33-01-D-0004, Delivery Order No. 0002. Hale, Stuart O. 1998 (updated ed.) Narragansett Bay: A Friend’s Perspective. University of Rhode Island Marine Advisory Service NOAA/Sea Grant Marine Bulletin 42. Hall-Arber M, Dyer C, Poggie J, McNally J, Gagne R. 2001. New England’s Fishing Communities. Cambridge (MA): MIT Sea Grant 01-15. Available online at http://seagrant.mit.edu/cmss/ Institute for Global Maritime Studies and Tufts University Fletcher School of Law and Diplomacy. 2008. America’s Deep Blue Highway, How Coastal Shipping Could Reduce Traffic Congestion, Lower Pollution, and Bolster National Security. Interstate Navigation. 2006. Sum of monthly reports, entitled “Vessel Operation Report Statement of Freight and Passengers Carried (shallow draft traffic),” submitted to the U.S. Army Corps of Engineers in 2005.
Ocean Special Area Management Plan
Ocean SAMP D R A F T of 7/23/10 Chapter 7 Page 55 of 59
Kellner, George H. and J. Stanley Lemons. 2004. Rhode Island, the Ocean State: An Illustrated History. Sun Valley, CA: American Historical Press. Kuffner, Alex. 2009. “Quonset lands NOAA research vessel Okeanos Explorer.” Providence, RI: Providence Journal, April 22, 2009. Available online at http://www.projo.com/business/content/BZ_QUONSET_OKEANOS_04-22-09_MDE3V96_v21.30b12ba.html. Labaree, Benjamin W., William M. Fowler Jr., Edward W. Sloan, John B. Hattendorf, Jeffrey J. Safford, and Andrew W. German. 1998. America and the Sea: A Maritime History. Mystic, CT: Mystic Seaport Press. Marine Transportation System National Advisory Council. 2009. Marine Transportation System National Advisory Council. Available online at www.mtsnac.org. Last accessed December 7, 2009. Martin Associates. 2009. The Local and Regional Economic Impacts of Maritime Activity at PROVPORT. Prepared for ProvPort. June 5, 2009. National Oceanic and Atmospheric Administration. 1992. Nautical Chart Manual, Volume 1, Part 1. Seventh (1992) Edition, updated through March 2004. National Oceans Economics Program. 2009. Ocean Economy: Rhode Island. Available online at: http://www.oceaneconomics.org. Last accessed October 21, 2009. National Ports and Waterways Institute, University of New Orleans. 2004. The Public Benefits of the Short Sea Intermodal Shipping System. Report prepared for the Short Sea Cooperative Program. Available online at: http://advancedmaritimetechnology.aticorp.org/short-sea-shipping/Public%20Benefits%20of%20SSS%20-%20UNO.pdf. Last accessed December 7, 2009. Naval Undersea Warfare Center (NUWC) Division Newport. 2009. “NUWC Division Newport’s economic impact topped half-billion mark in 2008.” Press Release, January 29, 2009. Available online at: http://www.navsea.navy.mil/nuwc/newport/pages/pr.aspx. Last accessed October 21, 2009. Naval Undersea Warfare Center (NUWC) Division Newport. 2008. “Naval Undersea Warfare Center Newport’s economic impact topped $466 million in 2007.” Press Release, January 18, 2008. Available online at: http://www.navsea.navy.mil/nuwc/newport/pressroom/0208-EconomicImpact.pdf. Last accessed October 21, 2009. Naval Undersea Warfare Center (NUWC), Division Newport. 2007. Coastal Consistency Determination for Test Operations in Rhode Island Water. October 2007.

Ocean Special Area Management Plan
Ocean SAMP D R A F T of 7/23/10 Chapter 7 Page 56 of 59
Newport Convention and Visitors Bureau. 2009. Cruise Ship Schedule. Available online at http://www.gonewport.com/. Last accessed December 7, 2009. NOAA National Marine Fisheries Service. n.d. “Reducing Ship Strikes to North Atlantic Right Whales.” Available online at http://www.nmfs.noaa.gov/pr/shipstrike/. Last accessed October 30, 2009. NOAA National Ocean Service. 2009. United States Coast Pilot. Volume 2, Atlantic Coast: Cape Cod, MA to Sandy Hook, NJ. 38th Edition. Available online at http://www.nauticalcharts.noaa.gov/nsd/coastpilot.php?book=2. NOAA Office of Coast Survey. Chart 13205: Block Island Sound and Approaches. NOAA Office of Coast Survey. Chart 13218: Martha’s Vineyard to Block Island. NORAD. 2009. Highlights and Points. Available online at: http://www.noradinc.com. Last accessed December 7, 2009. North Atlantic Distribution (NORAD) 2009. Detailed Points of the Port Facility. Available online at: http://www.noradinc.com. Last accessed October 22, 2009. Northeast Marine Pilots Association, 2009. The Pilot Boats. Available online at: http://www.nemarinepilots.com. Last accessed October 16, 2009. Personal communication with Bud Vincent, University of Rhode Island Graduate School of Oceanography. November 12, 2009 Personal communication with Captain Howard McVay, Northeast Marine Pilots Association, August 31, 2009. Personal communication with Captain Paul Costabile, Executive Director, Northeast Marine Pilots Association, August 31, November 10, and November 13, 2009. Personal communication with Chris Myers, Vessel Operations Manager, Interstate Navigation Company, August 7, 2009. Personal communication with Chris Tompsett, NUWC Division Newport. November 10, 2009 and November 25, 2009. Personal communication with Edward LeBlanc, Chief, Waterways Management, U.S. Coast Guard Sector Southeastern New England, November 11, 2009. Personal communication with Evan Smith, Newport County Convention and Visitors Bureau, July 16, 2009.
Ocean Special Area Management Plan
Ocean SAMP D R A F T of 7/23/10 Chapter 7 Page 57 of 59
Personal communication with Evan Matthews, Port Director, Quonset Development Corporation, July 27th, 2009. Personal communication with Frank Salley, Verizon. November 13, 2009. Personal communication with Kevin Blount, United States Coast Guard, July 14, 2009. Personal communication with Martin Tegg, Reliance Globalcom. November 16, 2009. Personal communication with Mike Scanlon, Rhode Island Department of Environmental Management, June 17, 2009. Personal communication with Robert Wargo, AT&T. November 12-19, 2009. Personal communication with Lt. Trevor Cowan, U.S. Coast Guard, December 23, 2009. ProvPort. 2009. Facilities. Available online at: http://www.ProvPort.com/. Last accessed December 7, 2009. Quonset Development Corporation. 2009. Ship Waybill Database. Accessed July 27th, 2009. Rhode Island Coastal Resources Management Council (CRMC). In review. Metro Bay Special Area Management Plan (SAMP). Rhode Island Department of Environmental Management, Division of Law Enforcement, 2009. http://www.dem.ri.gov/programs/bnatres/enforce/marine.htm. Rhode Island Economic Monitoring Collaborative. 2007. FY07 Economic Monitoring Report. Rhode Island Marine Trades Association. 2007. Report on the Sales Tax Repeal 2007. Available online at www.rimta.org. Last accessed September 30, 2009. Rhode Island Marine Trades Association. 2008. The Marine Trades in Rhode Island: A Skills Gap Analysis. Available online at: www.rimta.org. Last accessed November 17, 2009. Rhode Island Public Utilities Commission. 2009. Ferry Services. Available online at http://www.ripuc.org/utilityinfo/ferryservices.html. Last accessed December 7, 2009. Rhode Island Senate Policy Office. 2002. The Marine Cluster: An Investment Agenda for Rhode Island’s Marine Related Economy.
Ocean Special Area Management Plan
Ocean SAMP D R A F T of 7/23/10 Chapter 7 Page 58 of 59
Rhode Island State Pilotage Commission. 2007. Rhode Island State Pilotage Commission Annual Report Fiscal Year 2007. Rhode Island Department of Environmental Management, Division of Coastal Resources Management. Seafreeze Ltd. 2009. Seafreeze, Ltd. Available online at http://www.seafreezeltd.com/. Last accessed October 20, 2009. U.S. Army Corps of Engineers. 2006. Waterborne Commerce of the United States: Calendar Year 2006, Part 1– Waterways and Harbors Atlantic Coast. WR-WCUS-06-1. Available online at: http://www.ndc.iwr.usace.army.mil. Last accessed October 16, 2009. U.S. Army Corps of Engineers, 2007. Waterborne Commerce of the United States: Calendar Year 2007, Part 1– Waterways and Harbors Atlantic Coast. WR-WCUS-07-1. Available online at: http://www.ndc.iwr.usace.army.mil. Last accessed October 16, 2009. U.S. Army Corps of Engineers. 1998. Providence River and Harbor Maintenance Dredging Project Draft Environmental Impact Statement. U.S. Army Corps of Engineers, New England District, October 1998. U.S. Army Corps of Engineers. 2001. Providence River and Harbor Maintenance Dredging Project Final Environmental Impact Statement. U.S. Army Corps of Engineers, New England District, August 2001. U.S. Army Corps of Engineers. n.d. “Rhode Island Sound Disposal Site.” Disposal Area Monitoring System (DAMOS) U.S. Coast Guard. 2006. U.S. Coast Guard Captain of the Port Long Island Sound Waterways Suitability Report for the Proposed Broadwater Liquefied Natural Gas Facility. U.S. Coast Guard. 2008. Vessel Requirements for Notices of Arrival and Departure, and Automatic Identification System. Notice of proposed rulemaking published in the Federal Register, December 16, 2008. U.S. Coast Guard, 2009. About Us. Available online at http://www.uscg.mil/top/about. Last accessed December 7, 2009. U.S. Department of Homeland Security. 2008. FY 2008 Infrastructure Protection Activities. Available online at http://www.dhs.gov/xlibrary/assets/fy2008_infrastructure_protection_activities.pdf. Last accessed December 23, 2009. U.S. Department of Transportation Bureau of Transportation Statistics. 2002. “Shipment Characteristics by Mode of Transport for the United States.” Available online at http://www.bts.gov/publications/commodity_flow_survey/2002/united_states/html/table_01_b.html. Last accessed December 7, 2009.
Ocean Special Area Management Plan
Ocean SAMP D R A F T of 7/23/10 Chapter 7 Page 59 of 59
U.S. Department of Transportation Committee on the Marine Transportation System. 2008. National Strategy for the Marine Transportation System: A Framework for Action. U.S. Navy. 2009. Naval Station Newport: History. Online at https://www.cnic.navy.mil/Newport/AboutCNIC/GeneralInformation/index.htm. Last accessed December 2, 2009. Viking Fleet, 2009. Ferries. Available online at www.vikingfleet.com. Last accessed December 7, 2009. Vineyard Fast Ferry, 2009. About the Martha's Vineyard Fast Ferry. Available online at: http://www.vineyardfastferry.com. Last accessed December 7, 2009. Waterson Terminal Services. 2008. Presentation to Providence Waterfront Charrette, June 9, 2008, Providence, Rhode Island. Available online at: www.watersonllc.com. Last accessed October 22, 2009. Weaver’s Cove Energy LLC. 2009. United States Coast Guard Waterway Suitability Assessment for Weaver’s Cove. Redacted Version.