OCEAN CLASSIFICATION OF DYNAMICAL STRUCTURES …
6
OCEAN CLASSIFICATION OF DYNAMICAL STRUCTURES DETECTED BY SAR AND SPECTRAL METHODS J.M. Redondo 1 , J.J. Martinez-Benjamin 1 , J.D. Tellez 1 , J.Jorge 1 , M. Diez 2 , and E. Sekula 2 1 UPC Barcelona Tech. B5 Campus Nord, 09034 Barcelona, Spain 2 Ports de la Generalitat, 08800 Vilanova i la Geltru, Spain ABSTRACT We discuss a taxonomy of different dynamical features in the ocean surface and provide some eddy and front statistics, as well as describing some events detected by several satellites and even with additional cruise obser- vations and measurements, in the North-west Mediter- ranean Sea area between 1996 and 2012. The structure of the flows are presented using self-similar traces that may be used to parametrize mixing at both limits of the Rossby Deformation Radius scale, RL. Results show the ability to identify different SAR signatures and at the same time provide calibrations for the different local con- figurations of vortices, spirals, Langmuir cells, oil spills and tensioactive slicks that eventually allow the study of the self-similar structure of the turbulence. Depending on the surface wind and wave level, and also on the fetch. the bathimetry, the spiral parameters and the resolution of vortical features change. Previous descriptions did not in- clude the new wind and buoyancy features. SAR images also show the turbulence structure of the coastal area and the Regions of Fresh Water Influence (ROFI). It is note- worthy tt such complex coastal field-dependent behavior is strongly influenced by stratification and rotation of the turbulence spectrum is observed only in the range smaller than the local Rossby deformation radius, RL. The mea- sures of diffusivity from buoy or tracer experiments are used to calibrate the behavior of different tracers and pol- lutants, both natural and man-made in the NW Mediter- ranean Sea. Thanks to different polarization and inten- sity levels in ASAR satellite imagery, these can be used to distinguish between natural and man-made sea surface features due to their distinct self-similar and fractal as a function of spill and slick parameters, environmental con- ditions and history of both oil releases and weather condi- tions. Eddy diffusivity map derived from SAR measure- ments of the ocean surface, performing a feature spatial correlation of the available images of the region are pre- sented. Both the multi fractal discrimination of the local features and the diffusivity measurements are important to evaluate the state of the environment. The distribution of meso-scale vortices of size, the Rossby deformation scale and other dominant features can be used to distin- guish features in the ocean surface. Multi-fractal analysis is then very usefull. The SAR images exhibited a large variation of natural features produced by winds, internal waves, the bathymetric distribution, by convection, rain, etc as all of these produce variations in the sea surface roughness so that the topological changes may be stud- ied and classified. In a similar way bathimetry may be studied with the methodology described here using the coastline and the thalwegs as generators of local vertical vorticity. Key words: SAR analysis; Vortex Statistics; Oil slicks; Ocean Turbulence; Fractal Spectra; Diffusion. 1. INTRODUCTION Digital analysis of video images recorded after the re- lease of dye patches in the ocean surface (Bezerra et al. 1998) has been used to investigate the structure of the surf-zone and its turbulent mixing. This technique of di- rectly measuring the area spread of a marker allows to study both, the internal structure of the dye blobs and to quantify the 2D dispersion coefficients. Experimental re- sults on temporal and spatial evolution of these coeffi- cients in the nearshore zone, and also on board several cruises (Martinez-Benjamin et al. 1998), (Redondo and Platonov 2009) under different low energy conditions are presented as a possible interactive calibration of satellite images (Redondo et al. 2008a,b). We used a novel tech- niques to study turbulent diffusion by means of digital processing of images taken from remote sensing and also of video recordings of the sea surface. The use of image analysis allows to measure variations of several decades in horizontal local diffusivity values using directly Ein- stein’s equation. (Bezerra et al 1998) found that near the coast there is a power law increase of diffusivity with wave height but only for large wave Wave Reynolds num- bers. Other important factors are wind speed and tidal currents. A method for evaluating mesoscale eddy diffusivities in the ocean from the measured distribution of integral length scales and the eddy turnover times associated to inertial oscillations associated to the local Coriolis pa- rameter f (y) are also discussed here, because of the im- portance of vertical vorticity i the ocean surface. Us-
Transcript of OCEAN CLASSIFICATION OF DYNAMICAL STRUCTURES …

OCEAN CLASSIFICATION OF DYNAMICAL STRUCTURES DETECTED BY SAR ANDSPECTRAL METHODS
J.M. Redondo1, J.J. Martinez-Benjamin1, J.D. Tellez1, J.Jorge1, M. Diez2, and E. Sekula2
1UPC Barcelona Tech. B5 Campus Nord, 09034 Barcelona, Spain2Ports de la Generalitat, 08800 Vilanova i la Geltru, Spain
ABSTRACT
We discuss a taxonomy of different dynamical featuresin the ocean surface and provide some eddy and frontstatistics, as well as describing some events detected byseveral satellites and even with additional cruise obser-vations and measurements, in the North-west Mediter-ranean Sea area between 1996 and 2012. The structureof the flows are presented using self-similar traces thatmay be used to parametrize mixing at both limits of theRossby Deformation Radius scale, RL. Results showthe ability to identify different SAR signatures and at thesame time provide calibrations for the different local con-figurations of vortices, spirals, Langmuir cells, oil spillsand tensioactive slicks that eventually allow the study ofthe self-similar structure of the turbulence. Dependingon the surface wind and wave level, and also on the fetch.the bathimetry, the spiral parameters and the resolution ofvortical features change. Previous descriptions did not in-clude the new wind and buoyancy features. SAR imagesalso show the turbulence structure of the coastal area andthe Regions of Fresh Water Influence (ROFI). It is note-worthy tt such complex coastal field-dependent behavioris strongly influenced by stratification and rotation of theturbulence spectrum is observed only in the range smallerthan the local Rossby deformation radius, RL. The mea-sures of diffusivity from buoy or tracer experiments areused to calibrate the behavior of different tracers and pol-lutants, both natural and man-made in the NW Mediter-ranean Sea. Thanks to different polarization and inten-sity levels in ASAR satellite imagery, these can be usedto distinguish between natural and man-made sea surfacefeatures due to their distinct self-similar and fractal as afunction of spill and slick parameters, environmental con-ditions and history of both oil releases and weather condi-tions. Eddy diffusivity map derived from SAR measure-ments of the ocean surface, performing a feature spatialcorrelation of the available images of the region are pre-sented. Both the multi fractal discrimination of the localfeatures and the diffusivity measurements are importantto evaluate the state of the environment. The distributionof meso-scale vortices of size, the Rossby deformationscale and other dominant features can be used to distin-guish features in the ocean surface. Multi-fractal analysisis then very usefull. The SAR images exhibited a large
variation of natural features produced by winds, internalwaves, the bathymetric distribution, by convection, rain,etc as all of these produce variations in the sea surfaceroughness so that the topological changes may be stud-ied and classified. In a similar way bathimetry may bestudied with the methodology described here using thecoastline and the thalwegs as generators of local verticalvorticity.
Key words: SAR analysis; Vortex Statistics; Oil slicks;Ocean Turbulence; Fractal Spectra; Diffusion.
1. INTRODUCTION
Digital analysis of video images recorded after the re-lease of dye patches in the ocean surface (Bezerra et al.1998) has been used to investigate the structure of thesurf-zone and its turbulent mixing. This technique of di-rectly measuring the area spread of a marker allows tostudy both, the internal structure of the dye blobs and toquantify the 2D dispersion coefficients. Experimental re-sults on temporal and spatial evolution of these coeffi-cients in the nearshore zone, and also on board severalcruises (Martinez-Benjamin et al. 1998), (Redondo andPlatonov 2009) under different low energy conditions arepresented as a possible interactive calibration of satelliteimages (Redondo et al. 2008a,b). We used a novel tech-niques to study turbulent diffusion by means of digitalprocessing of images taken from remote sensing and alsoof video recordings of the sea surface. The use of imageanalysis allows to measure variations of several decadesin horizontal local diffusivity values using directly Ein-stein’s equation. (Bezerra et al 1998) found that nearthe coast there is a power law increase of diffusivity withwave height but only for large wave Wave Reynolds num-bers. Other important factors are wind speed and tidalcurrents.
A method for evaluating mesoscale eddy diffusivitiesin the ocean from the measured distribution of integrallength scales and the eddy turnover times associated toinertial oscillations associated to the local Coriolis pa-rameter f(y) are also discussed here, because of the im-portance of vertical vorticity i the ocean surface. Us-
ing the integral lenthscale distribution l(x, y) as func-tion of longitude x and latitude x, estimated through avariety of Eulerian or Lagrangian ways, we may calcu-late, using dimensional analysis, the eddy diffusivity asK(x, y) = l(x, y)2f(y) where K(x, y) is the horizontaldiffusivity at latitude y and longitude x. A further re-finement, that takes into account the multifractality of theimages and the relation between fractal dimensions andvelocity spectra relevant in the spectra, inertial,l rangebetween the integral length scale l(x, y) and the Kol-mogorov lengthscale or the pixel resolution of the im-ages is discussed in section 2 for SAR images, In section3 we discuss further the relation between vorticity, fractalspectra and structure functions. Presenting some statis-tical classification of dynamical features detected in theocean surface and discussing the results.
2. SAR IMAGES OF THE OCEAN
The satellite-borne SAR and ASAR is an excellent sys-tem not only to detect manmade oil spills and slicks (Redondo and Platonov 2001, 2009), but it also detectsdynamic features and the ocean eddies of different sizes.The study of the topology of the regions of different ru-gosity of the ocean surface can map the eddy shaped el-liptic regions as well as the hyperbolic or shear domi-nated areas, it is also a convenient tool to investigate theeddy structures, the scale to scale energy and enstrophytransfer of a certain area, and to calculate the eddy diffu-sivity values. The effect of bathymetry and local currentsare important in describing the ocean surface behavior,and specially the non-homogeneous transition betweenthe coastline and open sea ( ROFI). In the NW Mediter-ranean the maximum eddy size agrees statisticallt withthe limit imposed by the local Rossby deformation ra-dius, Redondo and Platonov (2001, 2009). This is at-tained when local buoyancy and Coriolis forces are inequilibrium. In the region RL depends on the season andstratification, but lies between 15-40 Km.
Quantifying coastal diffusion in presence of waves and(wind and/or wave driven) currents is a very difficult andcomplex task because most of the times their temporaland spatial hydrodynamic scales are overlapped, so thereis a combination of these effects. To quantitatively es-timate the dispersion of a pollutant substance in coastalwaters, previous experiments were carried out in orderto establish some empirical relationships with the dimen-sionless numbers associated to the different dominant ef-fects such as wave activity, wind and currents. It is impor-tant to relate the length scale of the turbulent processesand the velocity field in the mass of water to effectiveeddy diffusivities. Similarly to the molecular diffusionprocess, it is hypotetized that the density or concentra-tion flux along a specific direction is proportional to theconcentration gradient in such direction, the turbulent dif-fusion coefficient (K) and the density (ρ), .K evolves intime ( and space) following initially a ballistic fase fol-lowing t2, when it is of the size of the scale l(x, y) itfollows Richardson’s law i.e. t3, also depending on inter-
mittency, but finally at sufficiently large scales it followsa Brownian law, proportional to t.
Video analysis of the dispersion of dye streaks or blobs inthe ocean as well as Satellite SAR measurements allow toestimate eddy difusivities assuming a dependance on theintegral lengthscale of the relevant sea surface featuresand we may also estimate the energy ( or tracer scalar )spectra from theoretical grounds. The method discussedabove using dimensional analysis to estimate the “dom-inant” mesoscale eddy difusivity (as a velocity times alength scale) from the integral measured length scales andthe eddy turnover times associated to inertial ( or inter-nal, or tidal, etc...) oscillations. K(x, y) = l(x, y)2f(y)where K is the horizontal diffusivity,l, now from SARimages, the integral lengthscale of reflectivities and f theCoriolis parameter defined as: f = 2Ωsenφ. ( Ω isthe rotation of the Earth and φ. the latitude), the inte-gral scales, either for velocity or SAR intensity i, may becalculated over distance r as:
l(r) =
∫ Lmax
0
R(r)dr (1)
with R(r) as the velocity or scalar spatial cross correla-tion.
Another method that also takes into account the fractaldimension of the SAR images and the relation betweenfractal dimensions and velocity spectra Gade and Re-dondo(1999) is used to provide more detailled estimatesof the seasonal variations of eddy diffusivities. Here anintegration of the obtained local fractal spectra is used toestimate the relevant velocity v(x, y), and then:
v(x, y) = (E(x, y)l(x, y))1/2 (2)
and then an alternative way to estimate the spatial distri-bution of horizontal eddy diffusivity taking into accountthe flow structure is:
K(x, y) = l(x, y)v(x, y) = l(x, y)3/2E(x, y)1/2. (3)
This provides a simple relationship between the geomet-rical selfsimilarity of the area detected by the fractal di-mension of the dye streaks or of the SAR image intensitywhich is detected by both the fractal dimensionD and theintegral length scale l(x, y). Redondo(1996), Castilla etal.(2007) found that on a 2D surface, using the wavenum-ber k, a traditional (K41) relationship between the powerspectrum of velocity E(k) = k−β and the fractal dimen-sion may be found as β = 5−2D, and that, then, both thespectra and the fractal dimension measurements may bealso influenced by the intermittency within the turbulencecascade.
It is of fundamental importance to investigate the differ-ent influence of these topological diverse regions on theeddy diffusivity, and to calibrate numerical models withhigher order descriptors. A Smagorinski formulation

may be used to investigate both local and non-local dy-namics. The role of self similarity in non-homogeneoussystems forces a carefull definition of the resulting eddydiffusivity which plays an important role in the predic-tion of environmental turbulence. Ways in which tur-bulence parametrizations may be used in environmentalflows have to include the complexity of the Eulerian andLagrangian topology defined as the non-homogeneousdistribution in the physical space of vorticity gradientsand strain. These play an important role in the under-standing and prediction of dispersion in the environment.
The fractal dimension is calculated as the maximum frac-tal dimension of all possible intensity contours of theSAR reflected intensity which exhibit a complex geom-etry.( Redondo(1995), Nicoleau et al. 2011) One addi-tional important hypothesis is that the topological com-plexity of dye and tracer dispersion in the images is sup-posed induced by the dynamics of the velocity field at thesea surface. It is not thought that a precise distinction ofthe features produced by the wind and those producedby the wave field or local currents is needed, becauseas shown by Bezerra et al(1998), Rodriguez et al.(1997,1999) all effects produce a combined turbulent diffusionat the sea surface.
Other features in the gulf of Lions, and specially nearBarcelona and the Rhone and Ebro Deltas are used inthe periods where several instruments are available, be-ing able to compare coastal radar based in situ mea-surements with remote sensing satellite measurements.The meteorological phenomena such as cyclones, atmo-spheric fronts, surface wind, atmospheric internal wavesand rains, all at larger scales, are also detected by theSAR The coupling between wind and ocean rugossity isbest studied using a friction velocity u∗, as friction at ahorizontal (or wavy) surface produces vertical shear ∂u
∂zand if friction velocity is due to the turbulent stressesτ = ρu′w′ then u∗ =
√τρ and we have, assuming on
dimensional grounds that eddies scale from the distanceto the ocean surface ( or coastline), that
du
dz=u∗kz
=1
kz
(τ
ρ
)1/2
(4)
where k is here Von Karman’s constant k = 0.42, pro-ducing the usual turbulent logaritmic profile
u =u∗
kln(
z
z0) (5)
This is a well known result for the wind in the atmo-spheric boundary, also used for the bottom stress in oceancurrents and tidal stirring, here we may also use it for lat-eral shear, with z0 a modified roughness parameter.
In the complex and varying distribution vortices in theocean, local shear will transform slicks in the surface toalign and follow the local flow so the resulting patterntends to be spiral. The mixing processes at large scaleproduce stirring, which maintains large gradients of the
Figure 1. Example of SAR image from the study areashowing the structure of the ocean surface flow
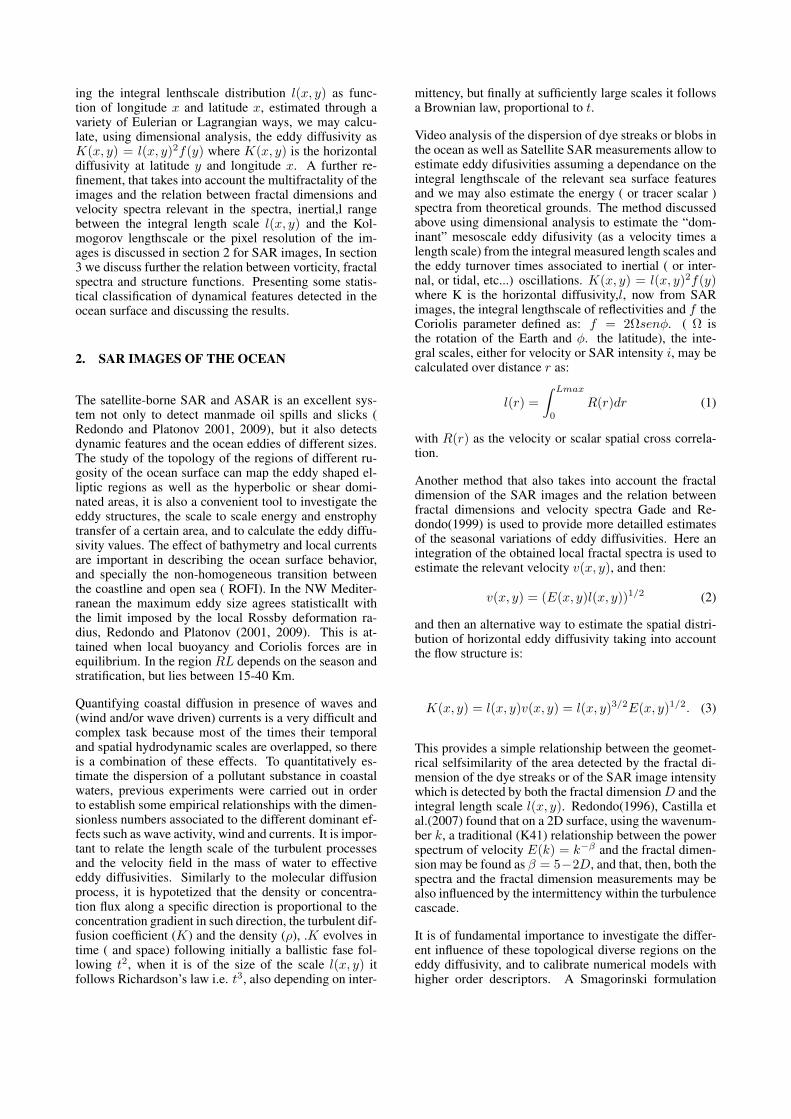
tracers. But in order to mix at molecular level in an irre-versible fashion, the energy has to cascade to the small-est internal scales (Kolmogorov or Batchelor scales). Intime the area where diffusion takes place increases andthe variation of area in time may be used as a measure ofthe overall diffusion coefficient, what is often noticed intime sequences of the eddy distribution is the occasionalenergetic burst that in a couple of days destroys the exist-ing eddy distribution, after these sudden meteorologicalor hydraulic driven intermittent forcing, the eddies tendto grow and decay. Thermal images of the ocean, cou-pled with clorophyl-colour ones are suited to describe thedifferent forcing and time evolution, but the effect of thecloud cover precisely hampers the study of the most ac-tive forcing periods. SAR images on the other hand arenot affected by clouds or bad weather and the obtainededdy statistics have no weather related bias. In figure 1a SAR image near Barcelona shows the complex struc-ture of the dominant eddies, Their distribution is apparentwhen they are classified, grouping them in a time period( one year, 1997) as shown in figure 2. The distributionof oil spills was performed by (Gade and Redondo 1999)and Redondo and Platonov(2001,2009).
Besides ERS-1/2, RADARSAT and ENVISAT, eddieswere also observed on TSM SPOT images in northerlyland out-shore wind condition able to reconnect the resuspended coastal waters to the river plume, enabling off-shore transport of sediment and ROFI tracers. In thiscase, secondary counter rotating vortices play also a veryimportant role in local mixing and transport. Numer-
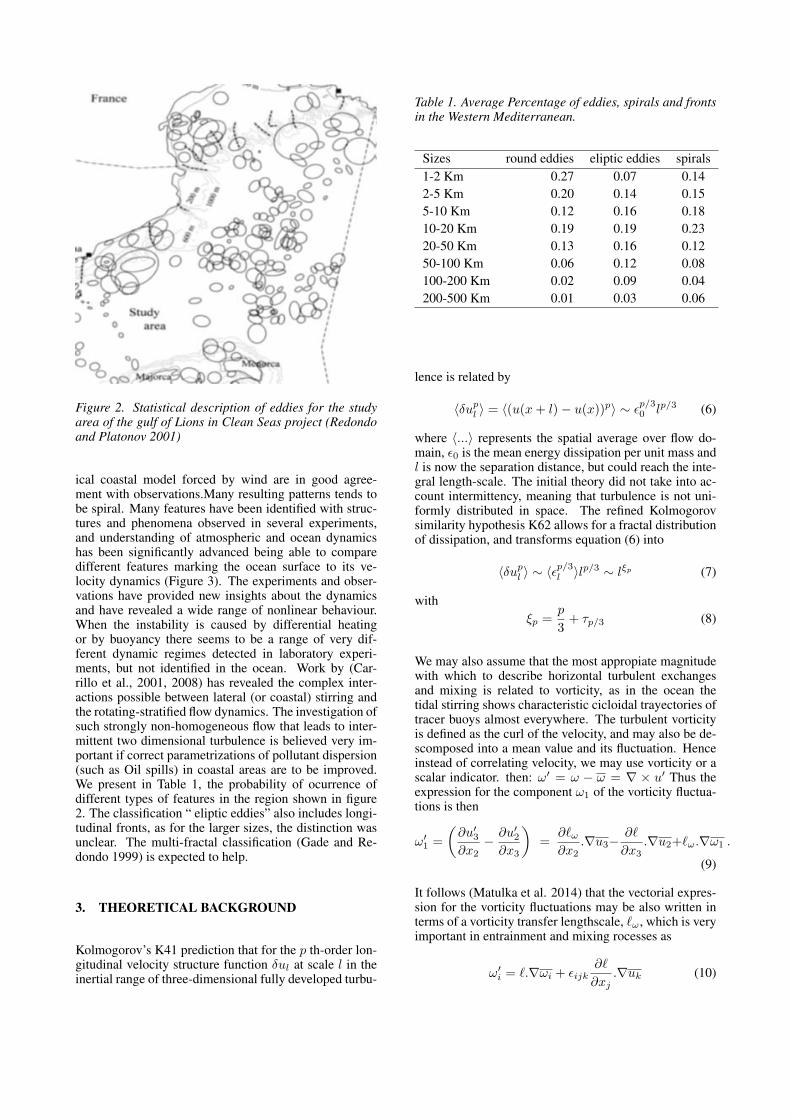
Figure 2. Statistical description of eddies for the studyarea of the gulf of Lions in Clean Seas project (Redondoand Platonov 2001)
ical coastal model forced by wind are in good agree-ment with observations.Many resulting patterns tends tobe spiral. Many features have been identified with struc-tures and phenomena observed in several experiments,and understanding of atmospheric and ocean dynamicshas been significantly advanced being able to comparedifferent features marking the ocean surface to its ve-locity dynamics (Figure 3). The experiments and obser-vations have provided new insights about the dynamicsand have revealed a wide range of nonlinear behaviour.When the instability is caused by differential heatingor by buoyancy there seems to be a range of very dif-ferent dynamic regimes detected in laboratory experi-ments, but not identified in the ocean. Work by (Car-rillo et al., 2001, 2008) has revealed the complex inter-actions possible between lateral (or coastal) stirring andthe rotating-stratified flow dynamics. The investigation ofsuch strongly non-homogeneous flow that leads to inter-mittent two dimensional turbulence is believed very im-portant if correct parametrizations of pollutant dispersion(such as Oil spills) in coastal areas are to be improved.We present in Table 1, the probability of ocurrence ofdifferent types of features in the region shown in figure2. The classification “ eliptic eddies” also includes longi-tudinal fronts, as for the larger sizes, the distinction wasunclear. The multi-fractal classification (Gade and Re-dondo 1999) is expected to help.
3. THEORETICAL BACKGROUND
Kolmogorov’s K41 prediction that for the p th-order lon-gitudinal velocity structure function δul at scale l in theinertial range of three-dimensional fully developed turbu-
Table 1. Average Percentage of eddies, spirals and frontsin the Western Mediterranean.
Sizes round eddies eliptic eddies spirals1-2 Km 0.27 0.07 0.142-5 Km 0.20 0.14 0.155-10 Km 0.12 0.16 0.1810-20 Km 0.19 0.19 0.2320-50 Km 0.13 0.16 0.1250-100 Km 0.06 0.12 0.08100-200 Km 0.02 0.09 0.04200-500 Km 0.01 0.03 0.06
lence is related by
〈δupl 〉 = 〈(u(x+ l)− u(x))p〉 ∼ εp/30 lp/3 (6)
where 〈...〉 represents the spatial average over flow do-main, ε0 is the mean energy dissipation per unit mass andl is now the separation distance, but could reach the inte-gral length-scale. The initial theory did not take into ac-count intermittency, meaning that turbulence is not uni-formly distributed in space. The refined Kolmogorovsimilarity hypothesis K62 allows for a fractal distributionof dissipation, and transforms equation (6) into
〈δupl 〉 ∼ 〈εp/3l 〉l
p/3 ∼ lξp (7)
withξp =
p
3+ τp/3 (8)
We may also assume that the most appropiate magnitudewith which to describe horizontal turbulent exchangesand mixing is related to vorticity, as in the ocean thetidal stirring shows characteristic cicloidal trayectories oftracer buoys almost everywhere. The turbulent vorticityis defined as the curl of the velocity, and may also be de-scomposed into a mean value and its fluctuation. Henceinstead of correlating velocity, we may use vorticity or ascalar indicator. then: ω′ = ω − ω = ∇ × u′ Thus theexpression for the component ω1 of the vorticity fluctua-tions is then
ω′1 =
(∂u′3∂x2− ∂u′2∂x3
)=
∂`ω∂x2
.∇u3−∂`
∂x3.∇u2+`ω.∇ω1 .
(9)
It follows (Matulka et al. 2014) that the vectorial expres-sion for the vorticity fluctuations may be also written interms of a vorticity transfer lengthscale, `ω , which is veryimportant in entrainment and mixing rocesses as
ω′i = `.∇ωi + εijk∂`
∂xj.∇uk (10)

Figure 3. SAR image from the study of Gade et al.(2013)
Figure 4. Use of ImaCalc on figure 3 showing the his-togram and multifractal spectra of the SAR intensity ofthe complex surface flow
Thus, vorticity fluctuations and transport can arise due toseveral causes, one contribution is given by the distribu-tion of the mean vorticity, and arises when a fluid regionmoves to a level of different local mean vorticity; there isalso a local vorticity transfer due to the variations in shearof the mean velocity felt by the fluid in its displacements,the scaling arguments for velocity and velocity structurefunctions may also be generalized for vorticity, and theequilibrium between velocity( energy) and vorticity (en-strophy) cascades will help to describe the area.
4. DISCUSSION AND CONCLUSIONS
Then reference plots of features such as the maximumfractal dimension with the integral of the fractal dimen-sion over all possible intensity levels of SAR can be usedto predict the behaviour of the oil spills. The topologi-cal structure may also help us to distinguish between oilseeps from the ocean bottom (more distributed) and oilspills from ships (elongated). (Redondo and Platonov2009). The distribution of meso-scale vortices of sizethe Rossby deformation scale and other dominant fea-tures, it has been confirmed that for local scales largerthan Rl. circular vortices are destroyed. Multi-fractalanalysis can be used to distinguish different dynamical
features in the ocean surface. The SAR images exhibiteda large variation of natural features produced by winds,internal waves, the bathymetric distribution, by convec-tion, rain, etc. as all of these produce variations in the seasurface roughness so that the topological changes may bestudied and classified. In a similar way topography or al-timetry may be studied with the methodology described.An additional parameter is obtained that characterizes theoverall spatial fractal dimension of the system integrat-ing the multifractal functions between the spatial limitsof interest but here a Stommel diagram is needed. Severalpolarizations of the SAR exhibit their different structurefunctions up to 6th order. The flatness or Kurthosis is astatistic parameter which indicates the shape of the pdfsof the SAR intensity, and seems to be a very good in-dicator of the degree of existing structure; when flatnesschanges with scale following a potencial law, intermit-tency is present.
Turbulent mixing diagnostic based on Laboratory meth-ods of visualization calculating difusivity with EinsteinsLaw. We are interested in the local topology and influ-ence on the conditions for turbulent mixing, the influenceof subsequent vortices and waves. Future work will in-clude spectral and fractal descriptors in (Re, Ri, Ro ) pa-rameter space (Redondo et al. 2008)(Tarquis et al. 2014).
The flatness or Kurthosis is a statistic parameter whichindicates the shape of the pdfs of the SAR intensity, andseems to be a very good indicator of the degree of exist-ing structure; when flatness changes with scale followinga potencial law, intermittency is present. Both the mul-tifractal spectra and the distributions are useful tools tomeasure intermittency, when it is applied to the corre-lations between the different SAR polarizations. Com-parisons with the standard multi-fractal formalism alsomay reveal the importance of anisotropy. (Castilla et al.2007, Nicoleau et al 2011) Environmental factors deter-mine spreading, drift and weathering of oil on the seasurface, but note that coastal turbulence becomes helicall and stratified, and is also modified by the intermittencyandreflects changes in the maximum fractal dimension,related to the energy (and also to vorticity and enstrophy)spectra of the flow. Using all the available scaling infor-mation, it is possible to investigate the spatial variabil-ity of the horizontal eddy diffusivity K(x, y) in differentcoastal regions and weather conditions.
ACKNOWLEDGMENTS
The authors thank the ENV4-CT96-0334 EuropeanUnion Project, INTAS, ISTC1481, and ESA-IP2240as well as MEC projects SB2000-0076 and ESP2005-07551. We thank Dr. A. Platonov for organizing and ex-panding the SAR Image Database of Clean Seas Projectand Drs. J. Grau and A. Carrillo for implementations ofprograms ImaCalc, SpilSim and OilKart.

Figure 5. Diffusivity map of the coastal region nearBarcelona obtained using the parametrization of figure(3) and the SAR detected eddy sizes in the study area dur-ing 1997.
REFERENCES
[1] Bezerra, M.O., M. Diez, C. Medeiros, A. Rodriguez,E. Bahia., A. Sanchez-Arcilla and J.M. Redondo. Studyon the influence of waves on coastal diffusion usingimage analysis. Applied Scientific Research (1998) 59.191-204.
[2] Martinez-Benjamin J.J., Medeiros C. , Chic O. ,Bezerra M.O. and Redondo J.M. (1998) Incidenceof SAR images on the study of NE-Brazilian coastand shelf waters”, Proc. SPIE 3496, Earth Sur-face Remote Sensing II, 212; doi:10.1117/12.332726;http://dx.doi.org/10.1117/12.332726
[3] Redondo J.M. and Platonov A. (2009)Self-similardistribution of oil spills in European coastal waters. En-viron. Res. Lett. 4, 14008.
[4] Redondo J.M. (1995) Difusion in the atmosphere andocean, Ed. M. Velarde and C. Christos, 584-597.
[5] Redondo J.M., Grau J., Platonov A and GarzonG.(2008) Analisis multifractal de procesos autosimi-lares, Imagenes de satelite e inestabilidades baroclinas.Rev. Int. Met. Num. Calc. Dis. Ing. 24, 1, 25-48.
[6] Redondo J.M., Grau J., Platonov A. and Matulka A.(2008) Multifractal analysis of SAR of the ocean surfacecurrents, eddy structure, oil sliks and diffusivity analy-sis. Instrumentation viewpoint, 13, 107-108.
[7] Rodriguez A., Sanchez-Arcilla A., E. Bahia RedondoJ.M. and M. Diez (1997) Study of Surf-zone MixingUsing Video Images. Coastal Research Through LargeScale Experiments, Ed. D. Huntley (ISBN 0-905227-86-7) 182-183.
[8] Redondo J.M. and Platonov A. (2001) Aplicacionesde las imagenes SAR en el estudio de la dinamica de lasaguas y de la polucion en el mar Mediterraneo cerca deBarcelona. Ingenieria del Agua 8, 1, 15-23.
[9] Rodriguez A.,C. Mosso, Sanchez-Arcilla A., Re-dondo J.M and E. Bahia (1999) Macroturbulence in theSurf Zone: Field and Laboratory Measurements. Exper-iments in Fluids,
[10] Redondo, J. M. and Platonov, A. Self-similar distri-bution of oil spills in European coastal waters, Environ.Res. Lett.,(2009) 4, 14008.
[11] Redondo J.M. (1996) Vertical microstructure andmixing in stratified flows. Advances in Turbulence VI.Eds. S. Gavrilakis et al. 605-608.
[12] Bezerra M.O., Diez M., Medeiros C. Rodriguez A.,Bahia E., Sanchez Arcilla A. and Redondo J.M. (1998)” Study on the influence of waves on coastal diffusionusing image analysis Applied Scientific Research, 59,127-142.
[13] Rodriguez A., Bahia E., Diez M.,Sanchez-ArcillaA., J.M. Redondo and M. Mestres (1997), IV JornadasEspanolas de ingenieria de costas y puertos. Ed. J.C.Serra, Cadiz. (ISBN 84-7721-573-1). 643-656.
[14] Gade, M., V. Byfield, S. Ermakov, O. Lavrova,and L. Mitnik. 2013. Slicks as indicators formarine processes. Oceanography 26(2):138149,http://dx.doi.org/10.5670/oceanog.2013.39.
[15] Carrillo, A.; Sanchez, M.A.; Platonov, A.; Re-dondo, J.M., : Coastal and Interfacial Mixing. Labo-ratory Experiments and Satellite Observations. Physicsand Chemistry of the Earth, (2001) B, 26/4. 305-311.
[16] Carrillo A., Redondo J.M., Fraunie P. and DurandN. Induced structures under seasonal flow conditions inthe Ebro delta shelf. Laboratory and numerical models,Il Nuovo Cimento C (2008) 31, 5-6, 771-790.
[17] Gade M. and Redondo J.M. (1999) Marine pollu-tion in European coastal waters monitored by the ERS-2SAR: a comprehensive statistical analysis. OCEANS’99MTS/IEEE. Riding the Crest into the 21st Century,IEEE. 3, 1239-1243.
[18] Nicolleau, F.C.G.A.; Cambon, C.; Redondo,J.M.; Vassilicos, J.C.; Reeks, M.; Nowakowski, A.F.(Eds.)(2011) New Approaches in Modeling MultiphaseFlows and Dispersion in Turbulence, Fractal Methodsand Synthetic Turbulence. ERCOFTAC Series.
[19] Matulka, A., Lpez, P., Redondo, J. M., and Tarquis,A.(2014) On the entrainment coefficient in a forcedplume: quantitative effects of source parameters, Non-lin. Processes Geophys., 21, 269-278.
[20] Castilla R., Onate E. and Redondo J.M. (2007)Models, Experiments and Computations in Turbulence.CIMNE, Barcelona, 255.
[21] Tarquis, A. M., Platonov, A., Matulka, A., Grau, J.,Sekula, E., Diez, M. and Redondo, J. M. (2014). Ap-plication of multifractal analysis to the study of SARfeatures and oil spills on the ocean surface. NonlinearProcesses in Geophysics, 21(2), 439-450.