
Ocean Acidification in the Southern California Bight
15
Ocean Acidification in the Southern California Bight Karen McLaughlin SCCWRP Symposium March 1, 2017
Transcript of Ocean Acidification in the Southern California Bight
Ocean Acidification in the Southern California Bight
Karen McLaughlinSCCWRP Symposium
March 1, 2017
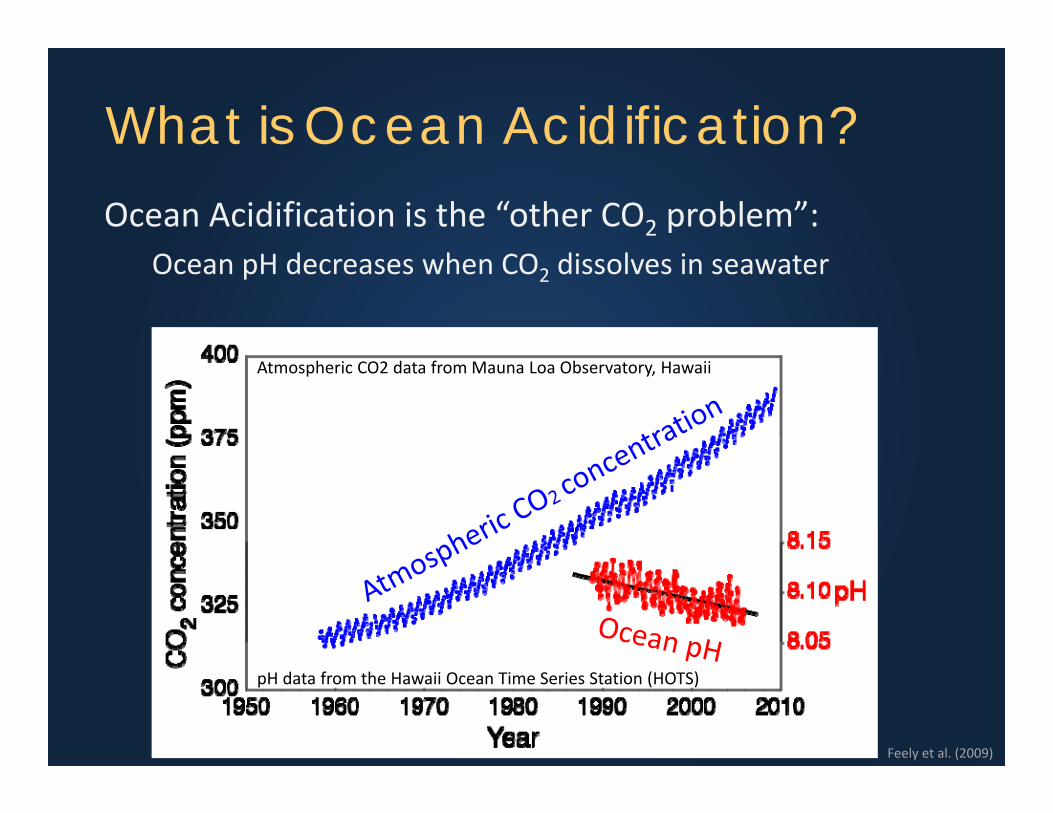
What is Ocean Acidification?Ocean Acidification is the “other CO2 problem”:
Ocean pH decreases when CO2 dissolves in seawater
Feely et al. (2009)
pH data from the Hawaii Ocean Time Series Station (HOTS)
Atmospheric CO2 data from Mauna Loa Observatory, Hawaii

OOHCC
OO
OO2. Reacts with water
to form bicarbonate ion
OO CC OO
1. Dissolves in the ocean
H+H+and hydrogen ion
3. Most of the hydrogen ions react with carbonate ions to form
bicarbonate ion OOHCC
OO
OOH+H+
OOCC
OO
OO
CO2
H2O
HCO3‐
HCO3‐
CO32‐
Effect of Adding CO2 to Seawater
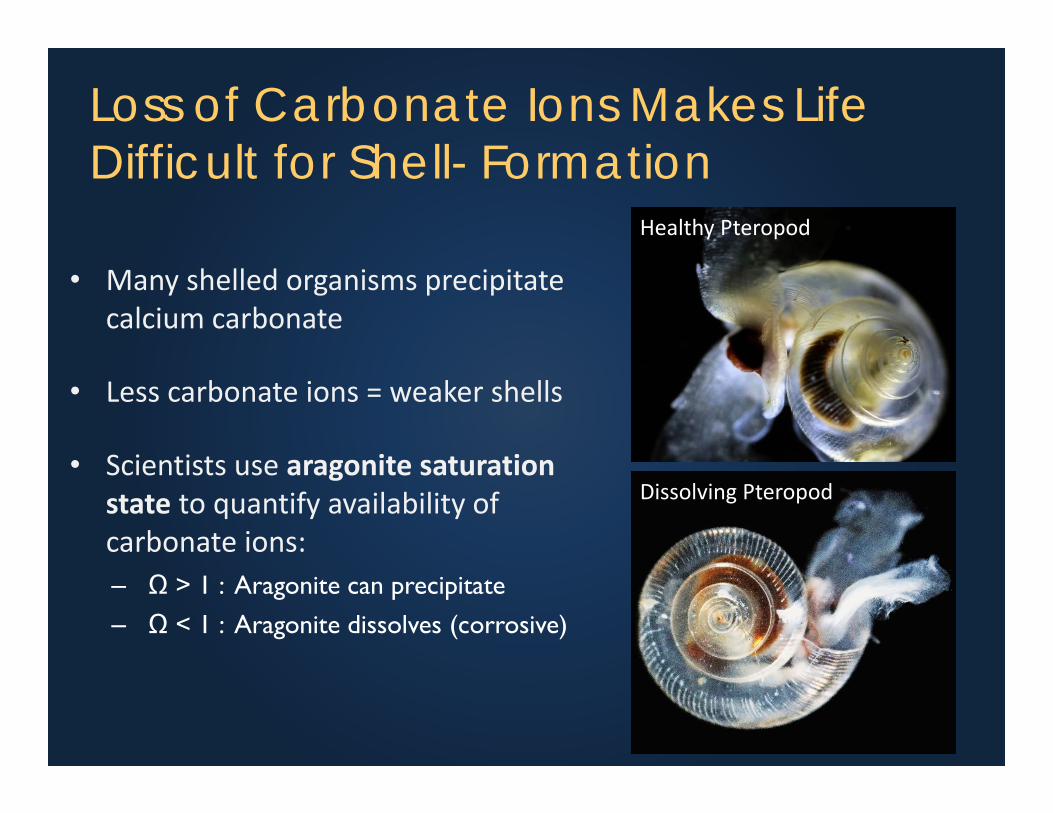
Loss of Carbonate Ions Makes Life Difficult for Shell- Formation
• Many shelled organisms precipitate calcium carbonate
• Less carbonate ions = weaker shells
• Scientists use aragonite saturation state to quantify availability of carbonate ions:– Ω > 1 : Aragonite can precipitate– Ω < 1 : Aragonite dissolves (corrosive)
Healthy Pteropod
Dissolving Pteropod
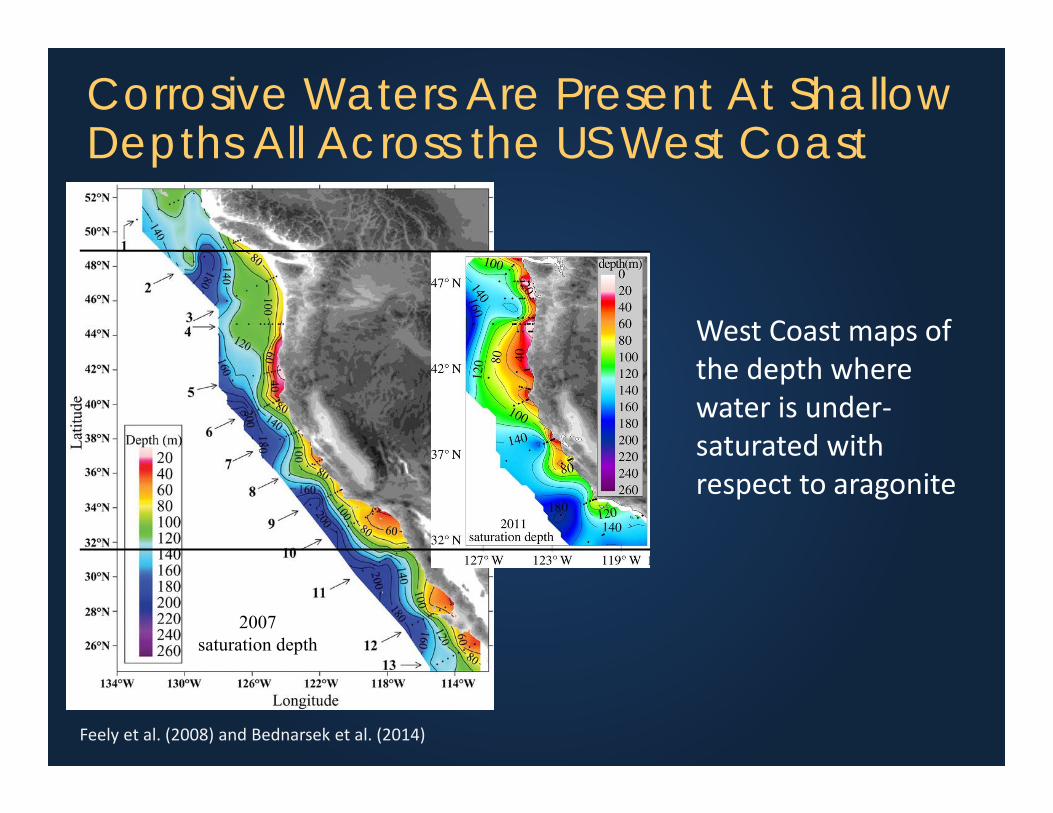
Corrosive Waters Are Present At Shallow Depths All Across the US West Coast
Feely et al. (2008) and Bednarsek et al. (2014)
West Coast maps of the depth where water is under‐saturated with respect to aragonite
2007saturation depth
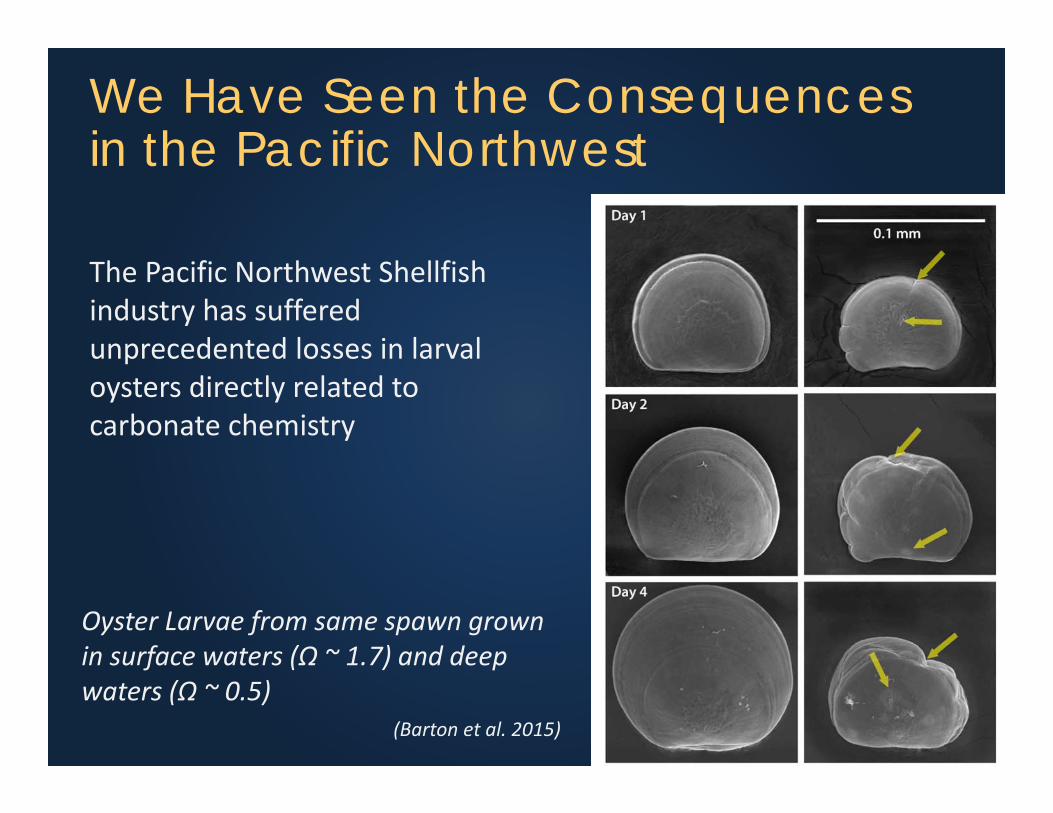
We Have Seen the Consequences in the Pacific Northwest
The Pacific Northwest Shellfish industry has suffered unprecedented losses in larval oysters directly related to carbonate chemistry
Oyster Larvae from same spawn grown in surface waters (Ω ~ 1.7) and deep waters (Ω ~ 0.5)
(Barton et al. 2015)

What is the State of the Bight?
• Acidification surveys in the Bight are limited to two CALCOFI lines and 6 nearshore stations
• A more comprehensive dataset was needed to understand patterns in acidification
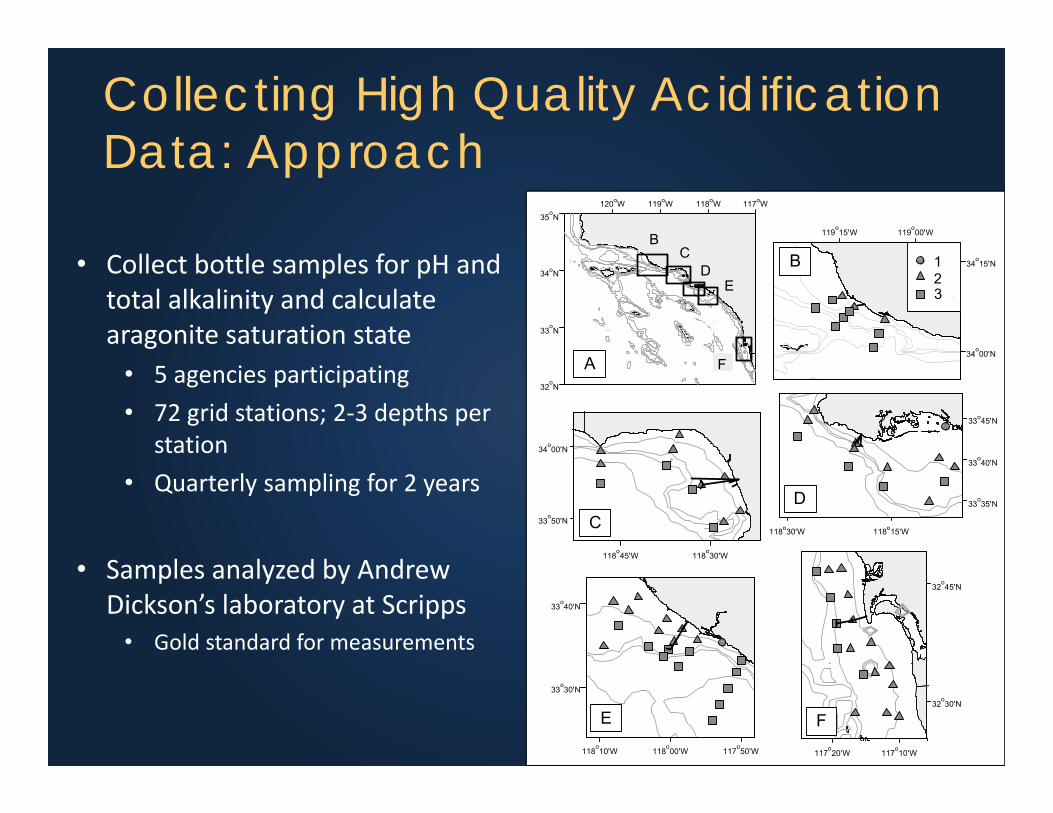
Collecting High Quality Acidification Data: Approach
• Collect bottle samples for pH and total alkalinity and calculate aragonite saturation state
• 5 agencies participating• 72 grid stations; 2‐3 depths per
station• Quarterly sampling for 2 years
• Samples analyzed by Andrew Dickson’s laboratory at Scripps
• Gold standard for measurements
120oW 119oW 118oW 117oW
32oN
33oN
34oN
35oN
A
BC
DE
F
119o15'W 119o00'W
34o00'N
34o15'N123-4
118o45'W 118o30'W
33o50'N
34o00'N
118o30'W 118o15'W
33o35'N
33o40'N
33o45'N
118o10'W 118o00'W 117o50'W
33o30'N
33o40'N
117o20'W 117o10'W
32o30'N
32o45'N
B
C D
E F
3

Aragonite Saturation State in the SCB
Aragonite Saturation State
0.0 0.5 1.0 1.5 2.0 2.5 3.0 3.5
Perc
ent o
f Sam
ples
0
20
40
60
80
100
Wat
ers
unde
rsat
urat
ed
Pter
opod
diss
olut
ion
Larv
al o
yste
r gro
wth
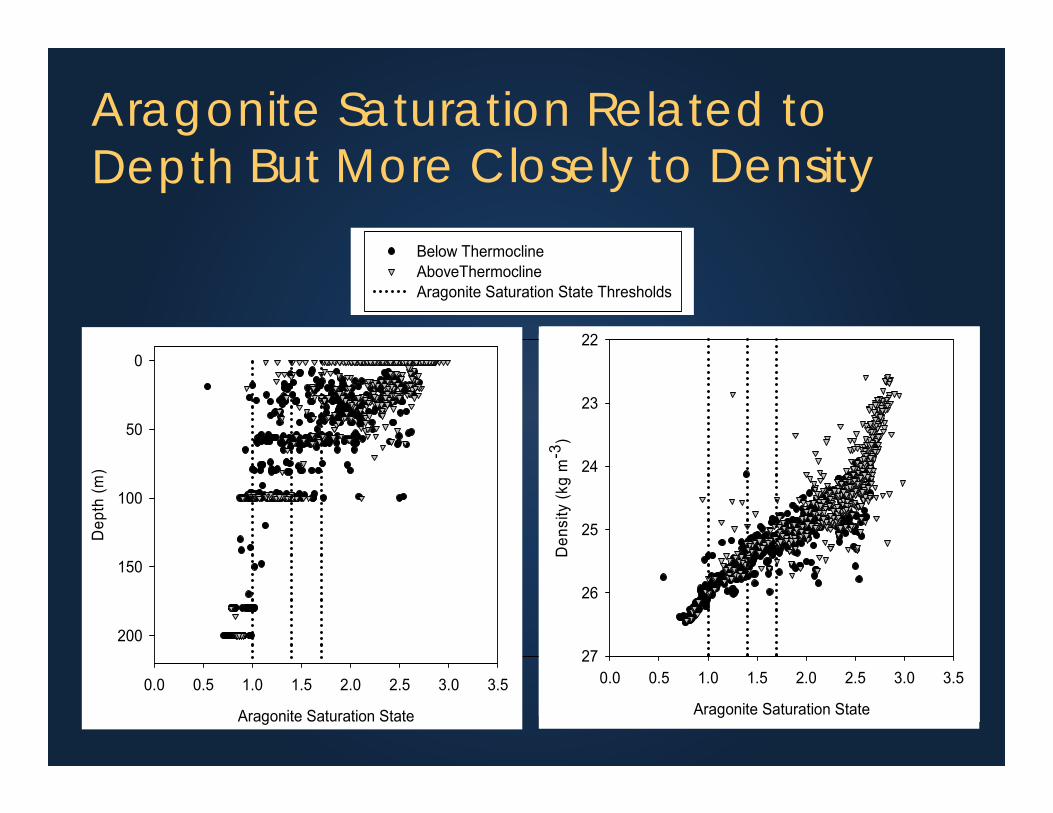
Aragonite Saturation Related to Depth But More Closely to Density
Below ThermoclineAboveThermoclineAragonite Saturation State Thresholds
3.5
Aragonite Saturation State
0.0 0.5 1.0 1.5 2.0 2.5 3.0 3.5
Den
sity
(kg
m-3
)
22
23
24
25
26
27
B.
Aragonite Saturation State
0.0 0.5 1.0 1.5 2.0 2.5 3.0 3.5
Dep
th (m
)
0
50
100
150
200
Den
sity
(kg
m-3
)
A.

There is a Clear Seasonality in Aragonite Saturation State
0-20m 20-40m 40-60m 60-80m 80-100m 100-120m 120-200m
>1.7 1.4-1.7 1.0-1.4 < 1.0
020
4060
8010
0
0-20m 20-40m 40-60m 60-80m 80-100m 100-120m 120-200m
>1.7 1.4-1.7 1.0-1.4 < 1.0
020
4060
8010
0
Spring (Upwelling) Fall

No Difference In Nearshore Versus Offshore
Next Steps
• Refine thresholds• SCCWRP is partnering with the OPC to gain scientific consensus on the
relevant endpoints
• Continue to collect high quality measurements of acidification• Bight ‘13 also piloted an in situ calibration to collected better pH data • SCCWRP is partnering with SCCOOS and member agencies to install
moored sensors to collect high frequency acidification measurements
• Run models to characterize drivers

What Are the Drivers of Ocean Acidification?
• Models can be used to untangle different drivers of spatial and temporal variability in acidification• Natural climate variability• Anthropogenically‐induced climate change• Anthropogenic inputs
• SCCWRP is partnering with leading modelers to develop an integrated model of the southern California bight• Please attend Fayçal Kessouri’s talk at 1:00 pm for more information