OCCURRENCE AND REACTIONS OF OIL SHALE SULFUR Alan K
24
UCRL- 87052 PREPRINT OCCURRENCE AND REACTIONS OF OIL SHALE SULFUR Alan K. Burnham Robert W. Taylor This paper was prepared for presentation at the 15th Oil Shale Symposium, April 28-30, 1982, Golden, Colorado April 1982
Transcript of OCCURRENCE AND REACTIONS OF OIL SHALE SULFUR Alan K

UCRL- 87052 PREPRINT
OCCURRENCE AND REACTIONS OF OIL SHALE SULFUR
Alan K. Burnham Robert W. Taylor
This paper was prepared for presentation at the 15th Oil Shale Symposium, April 28-30, 1982,
Golden, Colorado
April 1982

DISCLAIMER
This document was prepared as an account of work sponsored by an agency of the United States Government. Neither the United States Government nor the University of California nor any of their employees, makes any warranty, express or implied, or assumes any legal liability or responsibility for the accuracy, completeness, or usefulness of any information, apparatus, product, or process disclosed, or represents that its use would not infringe privately owned rights. Reference herein to any specific commercial product, process, or service by trade name, trademark, manufacturer, or otherwise, does not necessarily constitute or imply its endorsement, recommendation, or favoring by the United States Government or the University of California. The views and opinions of authors expressed herein do not necessarily state or reflect those of the United States Government or the University of California, and shall not be used for advertising or product endorsement purposes.
OCCURRENCE AND REACTIONS OF OIL SHALE SULFUR*
Alan K. Burnham and Robert W. Taylor Lawrence Livermore National Laboratory
P.O. Box 808, L-207 Livermore, CA 94550
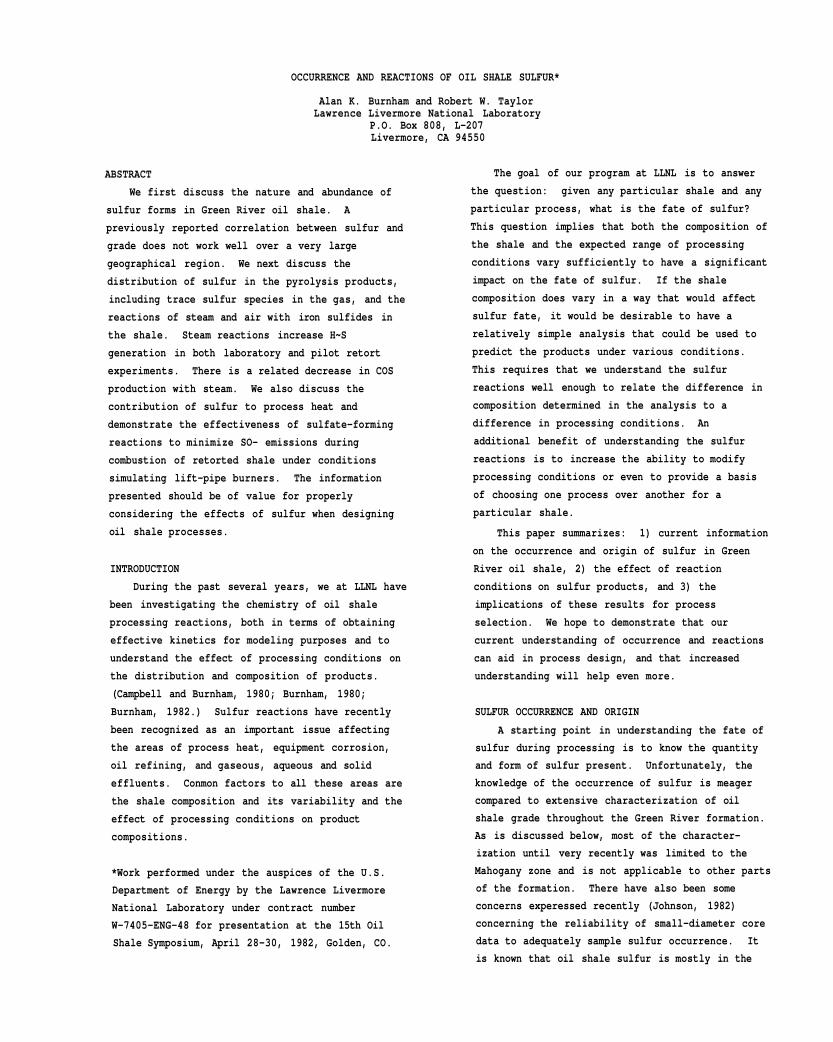
ABSTRACT
We first discuss the nature and abundance of
sulfur forms in Green River oil shale. A
previously reported correlation between sulfur and
grade does not work well over a very large
geographical region. We next discuss the
distribution of sulfur in the pyrolysis products,
including trace sulfur species in the gas, and the
reactions of steam and air with iron sulfides in
the shale. Steam reactions increase H~S
generation in both laboratory and pilot retort
experiments. There is a related decrease in COS
production with steam. We also discuss the
contribution of sulfur to process heat and
demonstrate the effectiveness of sulfate-forming
reactions to minimize SO- emissions during
combustion of retorted shale under conditions
simulating lift-pipe burners. The information
presented should be of value for properly
considering the effects of sulfur when designing
oil shale processes.
INTRODUCTION
During the past several years, we at LLNL have
been investigating the chemistry of oil shale
processing reactions, both in terms of obtaining
effective kinetics for modeling purposes and to
understand the effect of processing conditions on
the distribution and composition of products.
(Campbell and Burnham, 1980; Burnham, 1980;
Burnham, 1982.) Sulfur reactions have recently
been recognized as an important issue affecting
the areas of process heat, equipment corrosion,
oil refining, and gaseous, aqueous and solid
effluents. Conmon factors to all these areas are
the shale composition and its variability and the
effect of processing conditions on product
compositions.
*Work performed under the auspices of the U.S.
Department of Energy by the Lawrence Livermore
National Laboratory under contract number
W-7405-ENG-48 for presentation at the 15th Oil
Shale Symposium, April 28-30, 1982, Golden, CO.
The goal of our program at LLNL is to answer
the question: given any particular shale and any
particular process, what is the fate of sulfur?
This question implies that both the composition of
the shale and the expected range of processing
conditions vary sufficiently to have a significant
impact on the fate of sulfur. If the shale
composition does vary in a way that would affect
sulfur fate, it would be desirable to have a
relatively simple analysis that could be used to
predict the products under various conditions.
This requires that we understand the sulfur
reactions well enough to relate the difference in
composition determined in the analysis to a
difference in processing conditions. An
additional benefit of understanding the sulfur
reactions is to increase the ability to modify
processing conditions or even to provide a basis
of choosing one process over another for a
particular shale.
This paper summarizes: 1) current information
on the occurrence and origin of sulfur in Green
River oil shale, 2) the effect of reaction
conditions on sulfur products, and 3) the
implications of these results for process
selection. We hope to demonstrate that our
current understanding of occurrence and reactions
can aid in process design, and that increased
understanding will help even more.
SULFUR OCCURRENCE AND ORIGIN
A starting point in understanding the fate of
sulfur during processing is to know the quantity
and form of sulfur present. Unfortunately, the
knowledge of the occurrence of sulfur is meager
compared to extensive characterization of oil
shale grade throughout the Green River formation.
As is discussed below, most of the character
ization until very recently was limited to the
Mahogany zone and is not applicable to other parts
of the formation. There have also been some
concerns experessed recently (Johnson, 1982)
concerning the reliability of small-diameter core
data to adequately sample sulfur occurrence. It
is known that oil shale sulfur is mostly in the

form of pyrite, FeS- (Stanfield and others,
1951; Smith and others, 1964). At various
locations within the Green River formation, it
occurs as microscopic crystals imbedded in the
kerogen, in veins parallel to the bedding planes
and in nearly vertical fractures in the shale
according to the observations of ourselves and
others (Johnson, 1982; Hakkila and others, 1978;
Desborough and Pitman, 1974).
A more quantitative distribution is available
for sulfur forms in the Mahogany zone. For a
composite of Mahogany zone shale from near Rifle,
CO, Stanfield and others (1951) report an average
sulfur content of 0.63 wt%. Using a method
developed for coal (ASTM test D2492), they found
that 68% of the sulfur was in the form of pyrite,
2% in the form of sulfate, and, by difference, 30%
in the organic material. The coal method
determines pyrite from the HNO,-soluble iron
following an HC1 extraction of the shale.
However, Smith and others (1964) claimed that the
coal method for determining sulfur forms was
inadequate. They stated that in some cases the
pyritic sulfur exceeded the total sulfur. They
developed an alternate method based on reduction
of the pyrite with lithium aluminum hydride and
determined the average distribution of raw shale
sulfur to be 73* pyritic, 3* sulfate, and 24%
organic for a Mahogany zone composite sample from
near Rifle, CO. The total sulfur content of their
composite was 0.72 wt%. Young (1980) used this
method to determine sulfur forms for the 10
Mahogany zone composites from Colorado and Utah
(Figure 1). He found an average distribution of
77% pyritic, 1% sulfate, and 22% organic sulfur.
It is generally believed that sulfur content
is related to organic carbon content. One might
expect such a relationship if the prinicpal source
of the sulfur is the organic material, even if
post-depositional bacterial action converts the
sulfur to H-S, which is captured by iron to form
pyrite. Atwood and others (1979) found a
reasonably high correlation (r = +0.951) between
oil shale grade and pyritic sulfur for samples
from the Mahogany zone. A similar correlation is
evident between organic carbon content and total,
pyritic, and organic sulfur in the data of
Stanfield and others (1951). Desborough and
others (1976) state a similar conclusion, although
their data do not particularly support it.
Figure 1. Total sulfur content in ten 104
L/Mg (25 gal/ton) composite samples from
the Mahogany zone (Young, 1980). Dashed
line is the surface outcrop of the
Mahogany zone.
However, the correlation between carbon and
sulfur content is not universal in the Green River
formation. The total sulfur content reported by
Young (1980) for the 10 Mahogany zone composites
(all 104 L/Mg) ranged from 0.45 to 0.74 wt%. As
shown in Figure 1, there tends to be higher sulfur
content towards the center of the Green River
formation. Additional results showing a lower
sulfur content in Utah oil shale are given by
Desborough and others (1976).
There are additional data showing the lack of
a relationship between organic carbon and sulfur
content. In Figure 2 we show the total sulfur and
organic carbon content for samples from three
cores. The sulfur content was determined at LLNL;
the organic carbon was determined at LLNL for the
Geokinetics core and reported by Giauque and
others (1980) for the NOSR cores. Cores NOSR 25
and NOSR 15/16 are from the Naval Oil Shale Reserve
No. 1. NOSR 25 is on the edge of the basin, while
NOSR 15/16 is towards the interior. The
Geokinetics core is from Utah. The samples from
the NOSR 25 and Geokinetics cores are mostly from
The Mahogany zone, but a significant number of
samples from NOSR 15/16 come from the next rich
oil shale zone below the Mahogany zone.

2.0
1.0
0.0
T - I 1 —I
_ NOSR 15/16
0
' * a * °o
0 a ^
8 aa* o « °
° 5 ^ °o 1 1 1
NOSR 25 •
0
o O o
0
8 ° ° OO
0 ° ° o o B 0 g
0 ^ o " Cb«8 f f
1 1 1
Gaokinatics o
o
» o o %
oo o %o %
° ntf ° n °
—1 1 —
0
oo
% • * 0
o°
i '
O r
O O
o
1 1
o
• J . •• 1
1 1 —
% o
o
-
r = 0.63
L '
o
-
-
r = 0.63 .
» »
-
r = 0.04 -
' '
3 | 1.0
0.0
1.0
0.0 0 10 20 30
Organic carbon (wt%)
Figure 2. Relationship between total sulfur
content and organic content for three
cores in the upper part of the Green
River formation. The different symbols
represent different depth zones as
follows. NOSR core 15/16; •, 1170 to
1208 ft; o, 1210 to 1346 ft (Mahogany
zone); a, 1377 to 1468 ft. NOSR core
25: a, 498 to 613 ft; o, 636 to 705 ft
(Mahogany zone). GKI core: o, 45 to 83
ft (mostly Mahogany zone).
The correlation between organic carbon and
sulfur in the NOSR cores is statistically
significant but weak; the Geokinetics core
exhibits none at all. For NOSR 15/16, the samples
from below the Mahogany zone tend to have a higher
sulfur content that those with the same organic
carbon content in the Mahogany zone. Additional
results Indicating increased sulfur content below
the Mahogany zone are given by Desborough and
others (1976).
A similar breakdown in the relationship
between organic carbon and sulfur is evident from
sulfur analysis of samples from the corehole and
40
mineshaft MDP-1 at Tract C-a (Figure 3). For the
20-m composite samples, the sulfur content
increases with depth while organic carbon content
decreases. In the 160 to 170 m depth range, there
is no apparent correlation between grade and
sulfur. However, grab samples from a pile of
mine-run shale nominally attributed to a depth of
132 m, the richest part of the Mahogany zone,
generally show increased sulfur content at higher
grades. Combined with the results discussed
above, this indicates that the correlation between
organic carbon and sulfur content is probably
appreciable only in the Mahogany zone of the
Piceance basin. Overall, there tends to be a
general increase in sulfur content near the center
of the Green River formation (Figure 1) and an
even greater Increase in at least the first four
zones below the Mahogany zone near Tract C-a
(Figure 3). The lack of a general relationship
between total S and organic C leads to a
consideration of the organic S to organic C
ratio. Although Stanfield (1951) found a constant
S/C ratio in 10 Mahogany zone kerogens, Young
(1980) found that the organic sulfur content
varied from 0.08 to 0.19 wt* which indicates a
more than twofold variation of organic S/organic
C The lower organic S/organic C ratios were in
the samples with the lowest total S.
The variation 1n the organic S to organic C
ratio observed to this point is small compared to
the variation in total S to organic C. However,
there is insufficient data to develop a good
understanding of the relationship between total
and organic sulfur content. This lack of
understanding of the incorporation of sulfur into
the oil shale is a limitation in understanding the
fate of sulfur during pyrolysis, as will become
evident in the next section.
Some work has been reported that will aid in
eventually unraveling this problem. The sulfur in
oil shale, as well as most carbonaeous sediments,
probably has at least three sources (Wedepohl,
1978). Some is retained from the sulfur-bearing
amino acids in the protein of the organisms whose
much-altered and fermented debris constitute the
organic material of oil shale. The organic
material may also contain sulfur which was not in
the living organisms. This sulfur is the product
of chemical reactions between reactive functional
groups of the organic debris and reduced forms of
3

inL/Ma
120 160 200 Depth of burial (m)
24t
Figure 3. Variation of sulfur concentration
in Tract C-a shale as a function of
depth. The bars represent composites
over the indicated interval. The points
represent grab samples from mine-run
shale at approximately the indicated
depth, except the 192 and 23 L/Mg
samples, which are one-foot intervals
from the core.
sulfur produced from sulfate by microbial activity
under reducing conditions.
The variable relationship between sulfur and
organic carbon becomes clearer with the
realization that most of the sulfur in oil shale
comes from microbial reduction of sulfate. The
ratio of sulfur to organic carbon in oil shale, as
in most carbonaceous sediments, is greater than
the ratio in living organisms. For example, Philp
(1978) reports a sulfur-to-carbon ratio of 1/71
and 1/97 on a weight basis for two kinds of
algae. The ratio in oil shale is between
approximately 1/10 to 1/40. This kind of
observation helped lead to the discovery of
sulfur-fixing bacteria nearly a century ago
(Clarke, 1924 and Peck, 1975). The presence of
organic matter is needed to create the conditions
necessary for sulfate reduction.
The high sulfur contents of some petroleums
demonstrate post-depositional sulfurization
reactions. The details and timing of the
sulfur-fixing processes are the subject of current
research (Pyzik and others, 1981). High sulfur
petroleum most often evolves from low-iron source
rocks such as carbonate rocks, suggesting a
competition between iron and carbonaceous material
for biogenic H.S, or other reduced forms of
sulfur (Tissot and Welte, 1978). Orr (1978)
summarizes principal environmental factors which
fix the sulfur content and speciation in
sedimentary deposits as the dissolved sulfate
concentration, Eh (a controller of microbial
activity), nature and abundance of organic matter,
and the abundance of iron which competes with
organic matter for the reduced sulfur. A
description of the Eocene lake environment in
which the oil shale formed is given by Murray
(1974), Roehler (1974) and Cole (1975).
There is an additional factor that may affect
the distribution of sulfur in pyritic and organic
forms. It is known that additional deposits of
pyrite occur within fractures in oil shale below
the Mahogany zone in Tract C-a (Johnson, 1982).
This pyrite is probably formed after the primary
sulfur-fixing reactions and may be responsible for
the elevated sulfur concentrations. In addition,
the core sample may not be completely
representative depending on the diameter of the
core and the distribution of fractures, or some of
the pyrite crystals in the fractures may be lost
during handling. From the discussion in this
section, it is evident that the abundance of both
total sulfur and sulfur forms are inadequately
characterized and understood to be reliable input
to a predictive model of sulfur chemistry.
Further work is necessary. The issue of sulfur
speciation in raw shale is discussed again in the
section concerning pyrolysis reactions.
SULFUR REACTIONS DURING PYROLYSIS
During pyrolysis of oil shale, sulfur is
distributed among the solid, liquid and gaseous
products. Results from a variety of shale samples
by several workers (Stanfield and others, 1951;
Berry, 1980; Goodfellow and Atwood, 1974) are
summarized in Table 1. In addition, the Colony
assay agrees well with the distribution obtained
in the Tosco-II semi-works (Goodfellow and Atwood,
1974). An average fractional distribution
obtained for assay is about 0.7 in the retorted
shale, 0.1 in the oil, and 0.2 in the gas.
Most of the sulfur in the oil is in the form
of thiophenes (Dinneen and others, 1961; Dinneen,
1962; Poulson, 1975; Willey and others, 1981).
The sulfur content decreases slightly with an
increase in boiling point range (Lovell, 1978).

Table 1. Distribution of raw shale sulfur in products from Fischer assay.
Sample
Site
Anvil Points
Anvil Points
Anvil Points
Geokinetics
Tract C-a
Tract C-a
Colony
Assaying
Lab
LETCb
LETCb
LLNL
LLNL
LLNL
T0SCOC
T0SC0d
No. of
Samples
10
6
4
8
7
8
1
Avg . Totals
wt%
0.6
1.29
0.6
0.5
1.4 1.4
0.8
Avg % of Raw Shale S
Spent Shale Oil
69
78
74
86
60 66
69
11
8
15
7
8
5
15
in Product
Gasa
20 14
11
7
32
28
19
By difference except for TOSCO results.
3Stanfield and others, 1951.
:Berry, 1980. j Goodfellow and Atwood, 1974.
Unlike nitrogen (Stout and others, 1976), the
sulfur content does not appear to be affected
appreciably by the heating rate during pyrolysis.
The sulfur contents of two oil samples prepared
from the same shale (Tract C-a, 104 L/Mg) at
heating rates of 12 and 0.1°C/min were 1.03 +
0.03% to 1.09 +0.03%, respectively. Most of the
sulfur in the gas is in the form of H?S. In the
routine gas analysis performed on pyrolysis gas
from LLNL assay, we have detected COS, CH,SH,
and dimethyldisulfide at levels of 10 to 100 times
lower than H„S. These data are not sufficiently
accurate to derive any clear trends. Other
organic sulfur compounds detected in oil shale
gases include CS-, thiophene, and methyl
thiophene (Ondov and others, 1981; Sklarew and
others, 1981).
There are several indications that average
values for the distribution of sulfur are
inadequate for universal process design. First,
the average fraction of sulfur distributed in the
oil ranges from 0.05 to 0.15 in the results of
various workers. This quantity might be expected
to be constant if the total sulfur were
proportional to grade and the organic S/organic C
ratio in the raw shale were constant. In fact,
neither are very true. Second, the distribution
of sulfur in products is a strong function of oil
shale grade for the Tract C-a samples analyzed by
Tosco, as shown in Figure 4. The same trend is
present to a lesser extent in the results of
Stanfield (1951). Third, the product distribution
of sulfur in the LLNL combustion retorts is
influenced by the presence of injected steam
(Burnham, 1981). Finally, retorting by direct
contact with hot recycled burned shale sharply
reduces the H„S content of the pyrolysis gas
(Schmalfeld, 1975; Weiss, 1982).
To more completely understand the sulfur
reactions during pyrolysis, we monitored the
evolution of H.S (Burnham and others, 1981b).
The rate of H2S evolution as the shale is heated
at 4.8°C/min under an autogenous atmosphere is
shown in Figure 5a for Anvil Points samples of
varying grades. Similar results were obtained for
samples from Tract C-a, Logan Wash and the Colony
mine. The temperature of the maximum rate of
evolution of H^S was approximately 425°C for
rich shale increasing to 460°C for lean shales.
For comparison, the maximum rate of oil evolution
5

occurs at about 455°C (Shih and Sohn, 1980).
Addition of finely-ground pyrite to the sample
increases the amount of H-S evolved but does not
modify the evolution profile, as indicated in
Figure 5b.
0.8
0.7
0.8
-
1 ' 1
• \ A*
1
•TV
1
-
-
1 20 0 10
Organic carbon in raw shale |wt%]
Figure 4. Distribution of sulfur from Tract
C-a oil shale into gaseous, liquid, and
solid products of a Fischer assay. The
fraction occurring in the gas and oil are
read from different scales (indicated by
arrows). The data shown by solid squares
comes from gas evolution experiments
(Burnham and others, 1981b).
1
i
1
_ rAP22 plus _ wt% pyrite
AP22
300 400 500 600 300 400 BOO 600
Temperature (CC)
Figure 5. Rate of H~S evolution from Anvil
Points oil shale of various grades heated
at 4.8 C/min. The sulfur contents of
samples AP8, AP22, AP25, and AP61 are
0.26, 0.31, 0.66, and 0.98 wtX,
respectively. The rate is expressed in
units of ug H~S per gram samples per
second. Addition of pyrite causes an
increase in H_S generation.
We have proposed a tentative explanation
(Burnham and others, 1981b) for the results in
Figures 4 and 5. Most of the raw shale sulfur is
in the form of pyrite. The dominant sulfur
reaction during pyrolysis appears to be
FeS2 + 2H FeS + H2S (1)
where the hydrogen donor is not defined. The
reaction occurs at a lower temperature and to a
greater extent for rich oil shale. The apparent
limit that at least half of the sulfur remains in
the retorted shale (Figure 4) is consistent with
the previous observation that pyrrhotite (FeS) is
not easily reduced to Fe at temperatures below
900°C (Attar, 1978).
The rate of reaction between the hydrogen
donor and pyrite depends on the degree of contact
and residence time. Several rLS evolution
experiments were conducted where powdered
(< 0.84 mm) oil shale was suspended in quartz
wool in the presence of an argon sweep (Burnham
and others, 1981b). In one sample, CA19, much of
the H2S was evolved between 500 and 525°C
(Figure 6a). This behavior was duplicated by
adding finely-ground pyrite to another sample,
AP22 (Figure 6b). Interestingly, Sample CA19 is
the only sample that contained visible crystals of
pyrite. We suspect that these crystals became
small independent pyrite particles during
grinding, so the contact with organic material was
insufficient to react below 500 C as it did in
an autogenous atmosphere (Figure 5b).
— 8 9
I i 4
! * e/j
1 1 Argon
. c A 1 9
-̂ 4 \
\j
2.5 -
2.0 -Argon
AP22 plus 1 wt% pyrite-
300 400 500 600 300 400 500 Temperature (°C)
600
Figure 6. H~S evolution rate from a Tract
C-a shale (CA19) that has two peaks. The
high-temperature peak is observed when
pyrite crystal are blended with an Anvil
Points sample (AP22), shown on right-hand
figure. This implies that the visible
pyrite crystals in sample CA19 become
separated from the shale during grinding
and have different reaction characteristics.

There is more organic sulfur in the raw shale
than appears in the oil, so the organic sulfur may
also be a source of H^S generation during
pyrolysis. The functionality of the organic
sulfur in the raw shale is unknown, so it is not
known if it would most likely end up in the gas,
oil or carbonaceous residue (char). It is also
unknown how much inorganic sulfur is transferred
to the oil or to char during pyrolysis. A more
general reaction scheme for sulfur compounds
during pyrolysis in the absence of recycled
oxidized shale is:
FeS2 + Org H * FeS + H2S + Oil S
Org S - H2S + Oil S + Char S
H2S + FeX - FeS
(2a)
(2b)
(2c)
The results of Stanfield (1951) indicate that
there is little or no organic sulfur in the spent
shale from a Fischer assay, but this result must
be viewed with caution because of problems with
the same analytical technique underestimating
organic sulfur in raw shale. However, the
Mossbauer results of Williamson and other (1980)
reinforce this conclusion. It is necessary to
include an additional FeS formation reaction (2c)
because Stanfield shows a 1.5-fold increase in
iron contained in sulfides after pyrolysis. The
iron donor is unknown, but it is presumably an
iron carbonate in solid solution with dolomite, in
which case C02 and H„0 would be evolved (Cole,
1978). At temperatures above approximately
300 C, it Is thermodynamically favorable for
iron carbonate to remove H2S from a C0 2 and
H20-rich gas even if the concentration of H-S
is as low as 1 ppm. The rate of this reaction is
unknown.
We have attempted to determine if indirect
tests can be used to determine the stoichlometry
of the organic sulfur reactions and the tendency
to convert pyrytic sulfur to oil sulfur. Figure 7
shows the relationship between the total S/organic
C ratio in the raw shale to the S/C atomic ratio
in the oil. Several observations are apparent:
(1) Mahogany zone samples from Anvil Points cover
a very small fraction of the observed variation,
(2) the S/C ratio in the Geokinetics oil samples
are low and essentially independent of the
S/organic C ratio in the raw shale, and (3) there
1s a weak relationship between the S/organic C
ratio in Tract C-a raw shale and the corresponding
oil. A tentative explanation for these results is
that the S/C ratio in the oil depends mostly on
the S/C ratio in the raw shale organic material.
The latter ratio may vary from zone to zone
roughly as the total sulfur content varies. The
low S/C ratio in the Geokinetics oil is consistent
with the low organic S to organic C ratio found in
the Utah Mahogany zone shale by Young (1980).
I
A Tract C-a, TMBA 0.16 \- A Tract C-a
• Gaokinetics [ LLNL • Anvil points) A Anvil points, LETC
0.12
0.08
O
e I 0.04
S/C in A.P. karogan
0 0.002 0.004 0.006 0.008
S/C atomic ratio in oil
Figure 7. Relationship between the ratio of
sulfur to organic carbon in raw shale to
the same ratio in oil produced from that
shale. The limited range for Anvil
Points is shown along with the ratio in
kerogen from Anvil Points.
A related issue is whether or not increased
levels of pyrite can cause a decrease in oil
yield. Such an effect may be present in Eastern
shale (Coburn, 1980). Also, an increase in pyrite
content from 4 to 40% caused the yield from
Colorado shale to decrease from 146 to 121 L/Mg of
oil shale (Jones and Dickert, 1965). The
possibility that sulfur content affects the amount
of organic matter converted to oil was
investigated using the sulfur data in Figure 2
along with the other results of Giauque and others
(1981). The fraction of organic matter converted
into oil was fitted to the form mx + b, where x
was the S content, S/C ratio or N/C org org
ratio (Giauque, 1981). (Elevated nitrogen content
has been implicated for increased char production
[Singleton and others, 1982].) We found that the
variation in the N/C ratio accounted for a org
much larger fraction of the variation in the oil
production than did variation in the sulfur
parameters. A multiple regression analysis with
both N/C and sulfur parameters did not
significantly improve the fit over using N/C
alone. This implies that variation in sulfur
content is probably not a significant factor in
causing variations in kerogen pyrolysis
stoichiometry for Green River oil shale.
In summary, the principal H„S-forming
reaction appears to be the reaction of pyrite with
organic material. The rate of the reaction
depends on the degree of physical contact. The
degree of conversion of pyrite to pyrrhotite
appears to depend on both grade and lateral
location within a given strata. There is some
evidence that extra pyrrhotite forms due to the
capture of H-S by FeCO,. The distribution of
organic sulfur during pyrolysis is less clear.
The oil contains less sulfur than the starting
organic material, but the precise distribution has
yet to be determined. Overall, more than half of
the sulfur remains in the retorted shale after
pyrolysis. There is room for improvement in
predicting the fate of sulfur during pyrolysis.
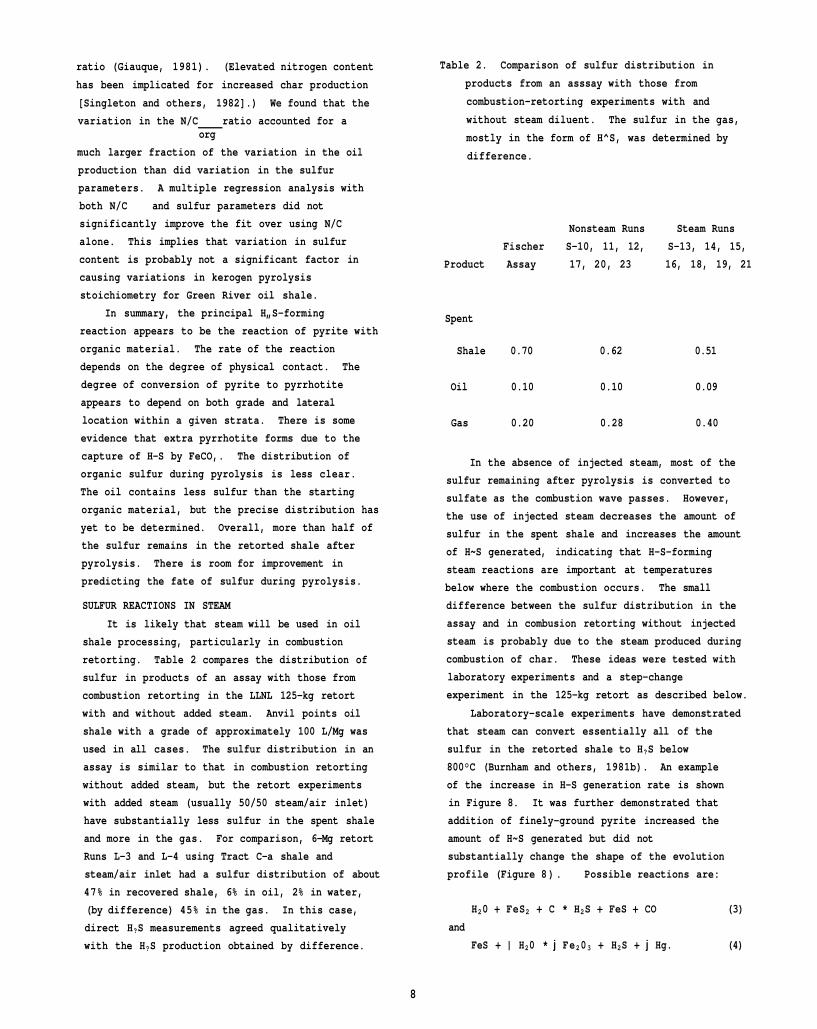
SULFUR REACTIONS IN STEAM
It is likely that steam will be used in oil
shale processing, particularly in combustion
retorting. Table 2 compares the distribution of
sulfur in products of an assay with those from
combustion retorting in the LLNL 125-kg retort
with and without added steam. Anvil points oil
shale with a grade of approximately 100 L/Mg was
used in all cases. The sulfur distribution in an
assay is similar to that in combustion retorting
without added steam, but the retort experiments
with added steam (usually 50/50 steam/air inlet)
have substantially less sulfur in the spent shale
and more in the gas. For comparison, 6-Mg retort
Runs L-3 and L-4 using Tract C-a shale and
steam/air inlet had a sulfur distribution of about
47% in recovered shale, 6% in oil, 2% in water,
(by difference) 45% in the gas. In this case,
direct H?S measurements agreed qualitatively
with the H?S production obtained by difference.
Table 2. Comparison of sulfur distribution in
products from an asssay with those from
combustion-retorting experiments with and
without steam diluent. The sulfur in the gas,
mostly in the form of H^S, was determined by
difference.
Nonsteam Runs Steam Runs
Fischer S-10, 11, 12, S-13, 14, 15,
Product Assay 17, 20, 23 16, 18, 19, 21
Spent
Shale 0.70 0.62 0.51
Oil 0.10 0.10 0.09
Gas 0.20 0.28 0.40
In the absence of injected steam, most of the
sulfur remaining after pyrolysis is converted to
sulfate as the combustion wave passes. However,
the use of injected steam decreases the amount of
sulfur in the spent shale and increases the amount
of H~S generated, indicating that H-S-forming
steam reactions are important at temperatures
below where the combustion occurs. The small
difference between the sulfur distribution in the
assay and in combusion retorting without injected
steam is probably due to the steam produced during
combustion of char. These ideas were tested with
laboratory experiments and a step-change
experiment in the 125-kg retort as described below.
Laboratory-scale experiments have demonstrated
that steam can convert essentially all of the
sulfur in the retorted shale to H?S below
800°C (Burnham and others, 1981b). An example
of the increase in H-S generation rate is shown
in Figure 8. It was further demonstrated that
addition of finely-ground pyrite increased the
amount of H~S generated but did not
substantially change the shape of the evolution
profile (Figure 8 ) . Possible reactions are:
H20 + FeS2 + C * H2S + FeS + CO (3)
and
FeS + | H20 * j Fe 20 3 + H2S + j Hg. (4)
8

400 500 600 700300400 500 800 700
Temperature (°C)
Figure 8. Increase in H„S evolution from
Anvil Points oil shale in the presence of
steam, both with (b) and without (c)
added pyrite.
These observations indicate that both
steam-pyrite and steam-pyrrhotite reactions are
fast enough to occur during oil shale processing.
However, thermodynamic calculations indicate that
the reactions will be somewhat different in
retorts. The H_0/H2 ratios will be such that
Fe^O. will be the final iron phase. More
important, the gas flows in combustion retorting
are not fast enough to prevent H-S
concentrations from building up to near
equilibrium values (Burnham and others, 1981b).
This implies that the pyrite-to-pyrrhotite
conversion is the practical limit for sulfur
conversion. This is consistent with the sulfur
balances shown in Table 2.
Both the increase in H„S generation with
steam and the thermodynamic limitations on the
steam-pyrrhotite reaction were confirmed by
measurements of retort offgas composition
(Burnham, 1981). During LLNL retort Run S-24, the
otherwise constant steam flow was interrupted for
one hour. The change in the H„S production rate
during that period is shown in Figure 9a. The
decrease in H„S production rate reached a factor
of 1.5 near the end of the steam interruption.
This factor is in good agreement with the factor
of 1.4 determined by the sulfur-balance
calculations shown in Table 2.
During the same period of time that the steam
was off, the COS concentration jumped (Figure
9b). Two reactions thought to be responsible are:
i 0.M
I 1 1 1 40
8 " 10
IK H off
1 1 1 61.0 SI.6 62.0 52.6 63.0 46 60 66 «0
T(m» into Mparhmnt (hn) Tim* into l i p i l m i H (Nn)
Figure 9. Decrease in H2S production rate
and increase in COS concentration in LLNL
retort Run S-24 during a one-hour
interruption of the steam input. Equal
volumes of air and steam were injected
during the balance of the run.
Both of these reactions are similar to the
water-gas shift reaction. If they are catalyzed
by iron oxides or sulfides, they may proceed by
analogous reaction intermediates. This would
explain why the presence of steam appears to
depress COS concentrations in the LLNL combustion
retorts, since a 50X steam diluent increases both
steam and hydrogen concentrations much more than
H»S concentrations.
Near the end of retort Run S-24, the bottom
1/3 of the retort became nearly isothermal at
527 C because of thermal conduction down the
walls, as shown in Figure 10. The effluent gas
composition during this time is given in Table 3.
1000
and
H2S + C02 = COS + H20
H2S + CO = COS + H2 .
(5)
(6)
4 6
Level in retort
Figure 10. Temperature profile in retort Run
S-24 near the end of the experiment
showing a nearly isothermal zone in the
lower third of the retort.
Organic pyrolysis reactions were essentially
complete. The CO. was produced from char
combustion and carbonate decomposition. H. was
produced principally from char gasification by

Table 3. Gas composition near the end of the
retort run S-24 (95 hours) calculated
from the dry-gas composition and an
equimolar steam-air inlet.
Gas Vol* Gas Vol%
H20
H2 CO
co0
34
4.6
1.2 30
N2 H2S
COS
27
0.05
4.0 ppm
mid stages of kerogen pyrolysis (Huss and Burnham,
1981). This suggests that COS concentrations
might be estimated from assay-gas analysis.
However, only a qualitative relationship has been
found, probably due to both limited and inaccurate
data on the assay gases (Burnham, 1981).
Moreover, the use of steam has been shown above to
affect COS concentrations. At the time that
Equation (8) adequately predicts H2S
concentrations during S-24, COS is only at 105£ of
its equilibrium value, possibly because of the low
concentrations. More work is required to
accurately predict COS production from raw shale
properties and processing conditions.
steam. The H„S concentration dropped to a low,
steady value. Because of the shape of the thermal
wave and the time of exposure, the pyrite-steam
reaction should have been complete and the
steam-pyrrhotite reaction near equilibrium
according to our arguments above. The
water-gas-shift was within 253£ of equilibrium, -?fi
indicating an oxygen partial pressure of 10"
atm, which implies that the iron sulfide was
oxidized to Fe,0.. The equilibrium expression
for the reaction
FeS + > 2 0 = JFe304 * H2S + ^ (7)
is given by
K = P H S P H 1/3- • H2S H 2 P ^ 0 4/3 1.1 x 10"3 at 527°C. (8)
Substituting the concentrations of H? and H ?0
from Table 3 into Eq. (8) and solving for P„ <-
results in an H?S concentration of 0.07%, which
is in excellent agreement with the measured value
of 0.05X. This result makes the steam-pyrrhotite
equilibrium plausible. Combined with the other
results in this section, this result indicates
that our understanding of the steam-iron sulfide
reactions as they affect H?S concentrations in
oil shale processing is reasonably good.
The reactions leading to COS formation are
less well understood. In one gas-evolution
experiment on a 77 L/Mg sample from Tract C-a, the
maximum rate of COS evolution while being heated
at 2°C/min was between 400 and 425°C,
indicating that it is formed during the early to
SULFUR REACTIONS DURING OXIDATION OF RETORTED SHALE
The energy source for many retorting processes
is the combustion of retorted shale. Depending on
the process, the combustion temperature may be
from 500 to 1200 C. The combustion temperature
affects the energy contribution of sulfur
reactions by influencing the types and rates of
reactions occurring. Furthermore, the combustion
temperature determines whether S0 2 escapes to
the atmosphere or is captured by carbonate
minerals to form sulfates.
In order to estimate the contribution of
sulfur to the heat of combustion of retorted
shale, it is necessary to know what the chemical
reactions are. The principal heat-producing
reactions thought to be important during the
oxidation of retorted shale are given in Table 4.
Although tabulated at 25 C, the enthalpy of
these reactions changes little with temperature.
The source of these data are Stull and others
(1971) and Robie and others (1979). Determining
which reactions occur under which conditions is
made difficult by the low concentrations of sulfur
minerals, generally less than a few percent, too
low for identification by X-ray diffraction. In
the case of oxidized shale the sulfur is in the
form of sulfates almost all of which are soluble
in water. Thus by chemical analysis of the water
in which oxidized shale is leached, we are able to
deduce which sulfate minerals are present (Taylor
and others, 1982). Retorted shale oxidized in air
at temperatures from 300 to 600°C yielded a
leach solution containing nearly equal
concentrations of calcium and magnesium sulfate,
but when oxidized above 600 C mostly calcium
10

Table 4. Reactions During Oxidation of Retorted Shale
Enthalpy kJ/Mole
2 5°C
(1) Char (C^ > 4 ) + ^ J 0 2 = C02 + ^ 2
0 ( g )
(2) S(thiophene) + 02 = St^
(3) S(thiophene) + | o 2 + CaMg(C03)2 = CaS04 + MgO + 2C02
(4) FeS + Jo2 = ^ e ^ + S02
(5) FeS + ^ 0 2 + ^CaMg(C03)2 = ^CaS04 + ^*gS04 + - j ^ O j + C02
(6) FeS + ^0 2 + CaMg(C03)2 = CaS04 + MgO + ^ F e ^ + 2C02
(7) ^FeS2 + ^ | o 2 + CaMg(C03)2 = CaS04 + MgO + ^Fe203 + 2C02
(8) CaMg(C03)2 + CaC03 + 2Si02 = C a j M g S i ^ + 3C02
(9) CaMg(C03)2 + 2Si02 = CaMgSijOg + 2C02
(10) FeS +^02 + Ca2MgSi207 = CaS04 + CaMgSigO, • j f e - O j
(11) ^FeS2 + ^ | o 2 + Ca2
M9Si207 = CaS04 + C a M g S i ^ + ^Fe203
(12) FeC03 + ^ 0 2 = ^-FejOj + C02
(13) CaMg(C03)2 = CaCOj + MgO + C02
(14) CaC03 = CaO + C02
(15) H2S + 202 + CaMg(C03)2 = CaS04 + MgO + 2C02 + H20(g)
(16) CaS + 2^ = CaS04
(17) MgS + 202 = MgS04
(18) 2Fe304 + ̂ 0 2 = 3Fe203
-466
-249
-450
-608
-84 5
-810
-619
+296
+148
-1080
-889
-69
+ 122
+179
-719
-959
-822
-242
sulfate was found (Figure 11). Thus we deduce
reaction (5) (Table 4) is the dominant
sulfur-fixing reaction at oxidation temperatures
below 525°C. Because some sulfur is released
into the gas during low temperature oxidation,
reaction (4) (or a similar reaction involving
FeSg) is also taking place. If retorted shale
contains organic sulfur, it is probably thiophenic
and may be oxidized according to reaction (2) or
(3) depending upon temperature. Oxidation of
retorted shale at temperatures above approximately
600 C results in a disposition of sulfur that
can be expressed by equations (6) and (7)
(Table 4). It is also possible that the products
of carbonate-silicate reactions are involved in
sulfur-capture reactions; for example, reactions
(10) and (11).
11

10
.2 ¥ 0.1
Mg/Ca ratio in raw •hale-' A
3 0 m i n ( . x t r V o l B t t d ) / ® 1 0 0 m i n
O
| 10 2
10"
10"
-Valuator ® 1i
J L 300 400 BOO WW 700 800
Oxidation tamparatura (°C)
Figure 1 1 . Ratio of Mg/Ca in the water used
to leach oxidized shale as a funct ion of
ox idat ion temperature. The Mg and Ca
were approximately balanced by s u l f a t e .
Oxidation was in a i r f o r 30 minutes
except as where noted.
General ly, one has l im i ted informat ion about
the chemical composition of re tor ted shale, i . e . ,
% organic carbon, % s u l f u r , and acid evolved
C0~. In a process where combustion is rap id and
maintained at a temperature below carbonate
decomposition the heat of combustion in joules per
gram of re to r ted shale is approximately:
-AHc(J/g) = 388(wt% org C) + 245(wt% S) (9)
The carbon coefficient, 388, is based on an
average char composition of CH„ ^ (Burnham and
others, 1981a). The coefficient for sulfur is
based on a retorted shale containing 75% FeS and
25% FeS2 as found in Fischer assay retorted
shale by Williamson and others (1980) and by
Stanfield and others (1951). The burning iron
sulfides are assumed to react with dolomite to
form CaSO^ and MgSO.. Although retorted shale
from a Fischer assay contains more FeS than
FeS.,, this may not be true for more rapid
pyrolysis. Furthermore, the fuel value of the
solids from a retort using hot recycled burned
shale may be quite different due to the presence
of CaS and Fe30..
In practice, it may prove to be impossible to
burn char without some carbonate decomposition in
excess of that required for sulfate formation. To
evaluate the corresponding heat loss, it is
necessary to measure difference (A) in the wt%
acid C02 of retorted shale before and after
oxidation. In this case:
-AHc(J/g) = +388(wt% org C) + 245(wt% S)
28(fiwtr/i acid CO-) (10)
The endothermic acid C0 ? term approximately
accounts for carbonate decomposition in excess of
that caused by sulfate formation. The
approximation involves neglecting the cancelling
effects of weight and acid C0 ? changes
associated with sulfate formation and weight
losses due to char combustion and carbonate
decomposition. They could all be taken into
account in a more detailed calculation. We are
presently checking these theoretical equations by
measuring the heat released by the isothermal
combustion of shales retorted under various
conditions, particularly shales retorted by
recycled burnt shale.
Similar equations have been derived previously
(Burnham and others, 1981a) for high-temperature
combustion where complete carbonate decomposition
and silicate and sulfate formation occur. They
are:
•AHC (J /g)
and
388(wt% org C) + 320(wt% S) -
18(wt% acid C02) (11)
-AH C (J/g) = 368.3(wt% org C) + 512.5(wt% S)
20.85(wt% acid C02) (12)
Equation (11) is an estimate based on reactions
(1) and (8) through (12) in Table 4. It is based
on a 2:1 ratio of dolomite to calcite, and the
observation that CaMgSipO, and Ca,MgSi?07
are common minerals in shale exposed to high
temperatures. Equation (12) comes from a
regression analysis of experimentally measured
heats of combustion of assay retorted shales and
burned shales from LLNL pilot retorts. The
12

procedure involved dropping terms due to sulfate
decomposition and ash fusion that occur above
1200°C. This regression analysis had a standard
error of 56 J/g, about 30% lower than equation
(11), which is based on thermochemical estimates.
The standard errors on the char, sulfur, and acid
C0 2 coefficients are 9.2, 80 and 2.0 J/g,
respectively. The discrepancy between the
estimated and fitted coefficients is not
understood, but is probably related in part to
simplifications in the mineral reactions. The
choice of which equation to use is to large extent
a matter of personal preference. For a typical
retorted shale containing 3.5 wt% org C, 0.6 wt%
S, and 20 wt% acid C02, the difference in
calculating heats by either equation (11) or (12)
amounts to only 11 out of 1190 J/g. For
comparison, Eq. (10) assuming that 10% of the
carbonates decompose results in a heat of
1449 J/g. This indicates the advantages of
maintaining combustion temperatures below 650 C.
Combustion temperature also affects S0?
release (Taylor and others, 1981). Retorted shale
containing 0.783! sulfur was preheated in nitrogen
to 390, 505 or 595°C and then exposed to flowing
air. The temperature rose during combustion by
typically 50 C. The percent of S in the
retorted shale that was released as SO- is shown
in Table 5 as a function of combustion
temperature. The raw shale came from Tract C-a,
contained 1.13 wt% S and yielded 9.3 wt% (103
L/Mg) oil.
The loss of sulfur during combustion was
determined by measuring the concentration of S0„
in the exit gas as well as measuring the
difference in total sulfur between the initial
retorted shale and the final oxidized shale.
These results indicate that when combustion is
initiated in retorted shale at temperatures above
approximately 525 C, less than 0.2% of the
sulfur in the solids will be emitted as S0 ?.
For average Mahogany zone shale, this corresponds
to less than 2 x 10"4 kg S02/kg oil.
As we shall discuss in the next section, it
may take a higher temperature to scrub SO., from
the gas phase than to retain sulfur within a solid
particle. This might be important for the case of
powdered oil shale that has a significant amount
of sulfur as pyrite in macroscopic crystals.
These crystals tend to separate from the shale
13
during grinding, as demonstrated by the results in
Figure 6. This sulfur will become gas-phase SO.
during combustion. Likewise, sulfur in other
fuels, such as coal, pyrolysis gas, or scrubbed
sulfur gases, will be more difficult to remove
than the sulfur within the shale particle.
IMPLICATIONS FOR PROCESSING
There are many ways to process oil shale. A
convenient scheme of classification, in terms of
discussing the importance of sulfur, is by heat
source and heat carrier. This is shown in
Table 6. It is offered with the caution that
processes are continuing to evolve, e.g., coal may
be used as a substitute for pyrolysis gas for
process heat. Within this context, the desirable
objective is to obtain sufficient process heat
with a minimum of costs, including environmental
costs. In this section, we discuss the ways in
which the sulfur chemistry affects process heat
and environmental emissions.
Thoem and others (1980) have suggested that
sulfur emissions could limit oil production in the
Piceance Basin due to degradation of air quality
at the Flat Tops Wilderness Area even if present
emission limits are met. This conclusion was
reached using permit data from processes that
either burn pyrolysis gas for process heat
(Tosco-II, Union B) or dilute it with combustion
gas (modified in-situ). Processes that provide
process heat by burning retorted shale in a vessel
separate from pyrolysis were not considered. -4
Typical emissions of SO. were 5 x 10 kg
S02/kg shale oil, while the Colorado limit is
9.4 x 10"4 kg S02/kg oil (0.3 lbs S02 per
barrel of oil [Edmonds, 1981]).
The degree of gas cleanup required to meet the
emission standard is a straightforward
calculation. Consider two cases of shale
producing 13 wt% oil (e.g., 95% yield from 35
gal/ton shale): (1) a South Piceance basin shale
containing 0.7 wt% S that converts 20% of the S to
sulfur gases, and (2) a Tract C-a shale containing
1.4 wt% S that converts 30% of the S to sulfur
gases. The first shale would produce 1.8 x 10
kg S02/kg oil without cleanup, hence, needs 95%
of its sulfur gases removed to meet standards. _2
The second shale produces 6.5 x 10 kg S02/kg
oil without cleanup, hence, needs 98.5% of its
sulfur gases removed.

Table 5. Percentage of t o t a l su l fu r released as SO2 dur ing f i v e minute combustion of re to r ted o i l shale from Tract C-a contain ing 0.8 wt% S.
Preheat Temperature
595°C
505°C
390°C
Maximum Temperature
645°C
555°C
430°C
Percent S Released3
< 0.2
0.2-0.3
10
kg S02 Per kg 0 i l b
<2 x 10"4
-4 -4 2 x 1 0 - 4 x 1 0
1.5 x 10"2
Pounds SO? Per Barrel O i l 0
< 0.07
0.07-0.1
aPercent of su l f u r in the re to r ted shale, which contains 69% of the raw shale su l f u r
D0oes not include S produced during r e t o r t i n g . The present l i m i t in Colorado is 0.3 pounds of SO2 per bar re l of o i l .
Table 6. C lass i f i ca t i on of o i l shale processing methods according to heat source and heat c a r r i e r . DH and IH re fe r to d i r ec t and i nd i rec t heating mode of operat ion, respec t ive ly .
TYPE HEAT SOURCE HEAT CARRIER EXAMPLES
Direct Char plus recycle
I nd i r ec t
I nd i r ec t
I nd i rec t
Offgas
Offgas
Char
Combustion gas
Recycle gas
Ceramic ba l l s
Burnt shale
Modified-In-Situ, Paraho DH,
Superior DH, Union A
Paraho IH, Superior IH, Union B
TOSCO-II, Shell Spher
Lurgi, Chevron STB
D I S C L A I M E R
This document was prepared as an account of work sponsored by an agency or the United Stales Government. Neither the United States Government nor the University of California nor any of their employees, makes any warranty, express or implied, or assumes any legal liability or responsibility for the accuracy, completeness, or usefulness of any information. apparatus, product, or process disclosed, or represents that its use would not infringe privately owned rights. Reference herein to any specific commercial products, process, or service by trade name, trademark, manufacturer, or otherwise, does not necessarily constitute or imply its endorsement, recommendation, or favoring by the United States Government or the University of California. The views and opinions of authors expressed herein do not necessarily state or reflect those of the United States Government thereof, and shall not be used for advertising or product endorsement purposes.
14

For indirect processes that burn the pyrolysis
gas for heat, the logical course would be to scrub
the gas prior to combustion. Green River oil
shale produces 9 ± 2 g-moles of gas per kg of
oil during assay (Singleton and others, 1982).
For Mahogany zone shale from near Anvil Points,
one would expect H~S concentrations to be less
than 5%. Offgas from the TOSCO-II Semiworks
operation using Mahogany zone shale from the
Colony mine contains about 4% hUS (Witcombe and
others, 1976 and Fruchter and others, 1980). In
other parts of the formation, one might expect
levels of up to 15% for shale of commercial
value. Some low-grade, high-sulfur shales give
H-S concentrations of 40 to 50*. The COS and
CH,SH concentrations are roughly proportional to
H?S and reach levels of tenths of percent for
high sulfur samples.
The presence of significant quantities of
non-H„S sulfur-containing gases complicates the
cleanup process. A detailed discussion of the
various alternatives is given by Lovell and others
(1980). It is possible that differences in total
sulfur levels and trace sulfur-containing gas
species may result in different cleanup methods
being best suited for different parts of the Green
River formation. To meet Colorado emission
standards, the pyrolysis gas (assuming 9 g-mole/kg
oil) would have to contain less than about 0.16%
of sulfur, which would result in a concentration
of S02 in the flue gas of about 100 ppm based on
a 16-fold volume dilution by combustion air.
In a direct process the pyrolysis gas is
diluted roughly twentyfold by gases produced from
combustion, gasification and carbonate
decomposition. Some additional light hydrocarbons
are produced by pyrolysis of char and shale oil.
Some steam is produced during combustion so more
H_S is produced than during an assay. For
Mahogany zone shale from near Anvil Points, H-S
concentrations of less than 1% would be expected.
If additional steam is injected, H.S production
would increase by a factor of 1.4. For
high-sulfur shale from closer to the center of the
Piceance Basin, H-S levels of up to 5% have been
observed (Sklarew and others, 1981). In Table 7,
results from the LLNL pilot retorts are summarized
which indicate a few of the expected trends. For
steam/air runs, the vol% H„S in the offgas is
approximately equal to the wt% S in the raw shale.
For direct processes, the Stretford process is
thought to be the best gas-cleanup method.
However, the Stretford process will not remove COS
or organic sulfur compounds (Lovell and others,
1980), which may constitute up to 10% of the
sulfur gases from a combustion retort (Sklarew and
others, 1981; Ondov and others, 1981; Table 8).
For Runs S-20, S-23, L-l, and L-3 top, the COS
production alone exceeded the Colorado emission
standard. (Any process using S-23 conditions
would use an acid-gas cleanup to recycle CO^)-
The use of steam in a direct retort may help gas
cleanup. Although it causes roughly a 1.4-fold
increase in H^S production, the COS
concentration is decreased twofold. The latter
effect may cause the net emissions to decrease
after Stretford treatment. A related complication
is that the dilution of pyrolysis gases by
combustion gases makes it more difficult to remove
organic sulfur compounds such as thiophene and
methyl thiophene by condensation. These compounds
have been detected in the offgas of combustion
retorts.
In the Paraho DH process, the combustion wave
is stationary and the shale passes through the
retort. Part of the offgas is recycled into the
center of the retort to stabilize the combustion
front. In principle, recycled sulfur gases may be
captured as sulfates on the shale. In this case,
the sulfur concentrations in the gas will be
reduced from those in an ordinary direct process
by a factor equal to or less than the recycle
ratio. Unfortunately, concentrations of H?S
detected from the Paraho retort (Fruchter and
Wilkerson, 1981) indicate that little of the
sulfur is captured, probably because of poor
gas-solid contact. However, Jones and Heistand
(1979) have reported a method of recycling offgas
lower in the retort to increase the capture of
sulfur gases.
Indirect processes such as the Lurgi-Rhurgas
(Schmalfeld, 1975) and the Chevron STB (T amm and
others, 1981) that use a lift pipe to burn
retorted shale to produce process heat appear to
have an advantage in minimizing sulfur emissions.
Rio Blanco (1981) quotes a level of 30 ppm S0 2
in the lift-pipe flue gas, and a sulfur balance
showing 0.25% of the sulfur in the flue gas from a
shale containing 1% total sulfur and 8 wt% shale
oil. This value is consistent with our laboratory

Table 7. Typical H?S and COS Concentrations and Conditions in LLNL Pilot Retort Experiments
(Campbell, 1981; Raley and Campbell, 1981; Raley and others, 1981; unpublished results).
For the steam/air runs, the vol* of H„S in the offgas is approximately equal to the wt% S
in the raw shale.
Exp. No.
S-20
S-21
S-23
S-24
L-l
L-2
L-3 Top
L-3 Bottom
L-4 Top
L-4 Bottom
H2S
Vol*
0.6
0.5
0.3
0.5
0.2
0.8
2.2
1.2
2.0
1.5
COS
ppm
300
80
20
100
40
70
35
Grade
L/Mg
42
99
86
88
108
97
73
152
84
135
S
wt%
1.0 0.7
0.6
0.6
0.7
0.7
1.7
1.0
1.7
1.0
Inlet Gas Comp.
100* air
02/Steam 11/89
02/C02 11/89
Air/Steam 51/49
Air/N2 42/58
Air/Steam 47/53
Air/Steam 50/50
Air/Steam 46/54
Air/Steam 42/58
Air/Steam 30/70
g-moles qas
kg oil
640
90
240*
170
470
180
300
160
200
200
* 93* C02
Table 8. Changes in Enthalpy (AH) and Gibbs Free Energy (AG) for Possible Chemical Reactions in a Retort Heated by Recycled Oxidized Shale
(1) CaS04 + 4H2 = CaS + 4H20
(2) MgS04 + 4H2 = MgS + 4H20
(3) 3Fe203 + H2 = 2Fe304 + H20
(4) H2S + - | H 2 + JFe203 = FeS + | H 2 0
(5) H2S + CaMg(C03)2 = CaS + MgO + 2C02 + H20
(6) H2S + CaCO, = CaS + CO. + H20
(7) H2S + CaO = CaS + H20
(8) H2S + MgO = MgS + H20
kJ/mole,
_aH
-29.7
-17.1
+6.00
-28.5
+232
+ 114
-59.1
+35.4
800K
jG
-138
-175
-69.4
-57.5
-25.8
-43.4
-60.5
+28.8
16

Figure 12. Sketch of oil shale processes
that utilize burnt shale as the heat
carrier for pyrolysis.
results given in Table 5. Flue gas emissions _4
without cleanup would be 6 x 10 kg SO./kg
shale oil. Use of higher-grade oil shale would
result in a lower value.
In the Lurgi and Chevron processes hot
oxidized shale is mixed with raw shale whereby the
raw shale is heated and retorted (Figure 12). The
oxidized sulfur and iron in the oxidized shale are
unstable in the reducing environment of the retort
and the reactions given in Table 8 should be
considered. Reactions (1) and (2), the reduction
of sulfate, consume eight moles of hydrogen per
mole of sulfur. In retorts where the ratio of
recycled shale to raw shale is * 4/1 this
reaction can, in principle, be a significant
hydrogen sink. Apparently these reactions are too
slow to be very important, however, because the
oil yield from a Lurgi plant is not decreased
compared to Fischer assay (Schmalfeld, 1975). The
reduction of iron oxide (reaction 3) in recycled
shale does consume some hydrogen, but because it
requires three moles of iron to remove one mole of
hydrogen the reaction is a less important hydrogen
consumer than reactions (1) and (2) in typical
shales which have Fe/S = 1.5 on a molar basis.
The use of oxidized shale in a retort offers
the opportunity for H„S removal from pyrolysis
gas. The low concentration of H ?S (^.1 volX,
Schmalfeld, 1975; 0.4% vol*, Weiss, 1982) in the
pyrolysis gas of a Lurgi retort demonstrates the
effectiveness of H~S scrubbing by recycled
oxidized shale. The specific reactions are
uncertain, but reactions (4) through (8) are
possibilities. These reactions have been
investigated by Attar and Depois (1979) in
connection with the processing of coal. Reaction
(8) is not favored thermo-dynamically; &G is
positive 28.8 kJ/mole at 527°C. Reaction (7)
requires the presence of free CaO. However, free
CaO is unstable compared to CaCO, in the
conditions expected (T < 700°C, P CO., 15
to 20X) in a lift-pipe combustor. Any calcite
decomposition must be due to reaction to form
silicates (Campbell, 1978).
Iron and sulfur compounds reduced during
recycle through a retort will be reoxidized along
with the char (Reactions 16-18, Table 4 ) . The
contribution to the heat can be significant. For
example, 1 wtX sulfur as CaS will contribute as
much to the heat of combustion of a retorted shale
as 0.75 wt% char. The rates of combustion of CaS,
MgS, and Fe,0. are probably different from the
rate of combustion of char. For these reasons,
combustors designed to operate by burning char may
perform 1n unexpected ways when operated on
recycled shale containing these compounds.
The next question that arises is what to do
with the pyrolysis gas. If it is burned on site,
its SO- emissions would also have to be
considered. Alternatively, it could be pipelined
from the basin, in which case only the tail gas
from making it pipeline quality would have to be
considered. Rio Blanco (1981) mentions that its
flue-gas emissions "includes the sulfur from the
product gas used as auxiliary fuel." Presumably,
the sulfur components could be injected into the
lift-pipe burner with or without the rest of the
pyrolysis gas. This implies that it has either
been assumed or shown that capture of S0„ from
the gas stream is highly efficient under the
conditions appropriate for lift-pipe combustion;
for example, by reactions such as (15) Table 4.
In principle, SO- capture from the gas phase
is more difficult than SO- capture from
1ron-sulfide combustion because of mass-transfer
limitations. Nevertheless, scrubbing of SO- by
oil shale during fluidized-bed coal combustion has
been demonstrated by Fuchs and others (1978) and
Wilson and others (1980) at temperatures above
700°C. Doyle (1981) also used oil shale to
reduce S0„ emissions in a coal-burning fluidized
bed at temperatures above approximately 815°C.
17

Lift-pipe combustion of retorted shale would
probably operate at lower temperatures. We found
that the SO- generated by the oxidation of
sulfides within shale was effectively captured
(retained) if the oxidation temperature was above
approximately 525°C. Capture of SO. from the
gas phase by oil shale appears to require a
temperature approximately 50 C higher according
to Schulman (1976). However, these two
experiments were not identical in other respects
so that this comparison may not be justified. We
plan to make additional laboratory experiments on
this point.
Table 9 illustrates the relative heat of
combustion of char, iron sulfides, and H-S based
on an example of the Fischer-assay distribution of
sulfur. The C concentration of retorted org shale is assumed to be 3 wt%. The fractionation
of sulfur is assumed to be 70% as sulfide, 20% as
H~S in pyrolysis gases and 10% as oil for the
low-sulfur shale and 65% as sulfide, 30% as H?S
and 5% as oil for the high-sulfur shale. The
H?S is assumed to be extracted and burned along
with the char according to reaction (15),
Table 4. In the extreme case where nearly all the
sulfur is produced as H?S by steam retorting,
the fuel value of the H2S would be 20% of the
fuel value of char if the raw shale contained 1
wt% of S and the retorted shale contained 3% char.
Table 9. Fuel value of retort products as a
function of sulfur concentration (Organic C of
retorted shale assumed to be 3%)
%S in %S in J/g of raw shale
Raw Retorted Char Iron H-S
Shale Shale Sulfides
0.7 0.5 1020 120 30
1.4 1.0 1020 220 90
CONCLUSIONS
We are beginning to be able to make fairly
accurate predictions on the fate of sulfur during
oil shale processing. Most of the effects
observed in pilot-scale processing have been
observed in bench-scale experiments. Careful
analysis and comparison of pilot- and bench-scale
experiments reduces the need for larger-scale
experiments to predict sulfur fate in
commercial-scale operations.
The H.S and COS concentrations depend on
shale composition and processing conditions. We
are presently able to predict H-S concentrations
more accurately than COS concentrations.
Insufficient data exists to determine how
accurately organo-sulfur compounds in the gas can
be predicted from assay-gas analysis.
Retorted shale can be burned without the
release of SO- and without much carbonate
decomposition. The contribution of sulfur
combustion to process heat is significant.
Refinements are needed in our understanding of the
sulfur-related reactions during combustion,
particularly those occurring in processes that use
recycled, burned shale as a heat carrier. Further
work is also required to determine the rates of
the sulfur-related oxidation reactions.
Finally, the simple picture of sulfur
occurrence based on Anvil Points Mahogany zone is
not generally applicable. The substantial
variation in sulfur occurrence undoubtably leads
to variations in the sulfur disposition. However,
sufficient data is not yet available to deduce
reliable relations between raw shale sulfur
content and sulfur fate.
ACKNOWLEDGMENT
The work presented here is based on the
analytical support of numerous individuals. In
particular, we would like to thank M. Singleton
and L. Gregory.
REFERENCES
Attar, A., 1978, "Chemistry, Thermodynamics
and Kinetics of Reactions of Sulfur in Coal-gas
Reactions: A Review," Fuel 57, pp 201-212.
Attar, A. and Dupuis, F., 1979, "The Rate and
the Fundamental Mechanisms of the Reaction of
Hydrogen Sulfide with the Basic Minerals in Coal,"
I. and E.C. Process Design and Development, vol
18, pp 607-618.
Atwood, M. T., Goodfellow, L. and Kauffman, R.
K., 1979, "Chemical and Physical Properties of Oil
Shale Dust and Correlations with Laboratory Fire
and Explosivity Test Results," 12th Oil Shale
18

Symposium Proceedings, Colorado School of Mines
Press, Golden, CO, pp 299-315.
Berry, K. L., 1980, Rio Blanco Oil Shale
Company, letter to J. H. Raley.
Burnham, A. K., Crawford, P. C. and Carley, J.
F., 1981a, "Heats of Combustion of Retorted and
Burnt Colorado Oil Shale," Lawrence Livermore
National Laboratory, Report UCRL-86470, to be
published in I. and E.C. Process Design and
Development.
Burnham, A. K., Kirkman Bey, N. and Koskinas,
G. J., 1981b, "Hydrogen Sulfide Evolution from
Colorado Oil Shale," Oil Shale, Tar Sands and
Related Materials, ACS Symposium Series 163, pp
61-77.
Burnham, A. K., 1980, "Studies of Oil Shale
Reaction Chemistry at LLL," in Symposium Papers:
Synthetic Fuels from Oil Shale, Institute of Gas
Technology, Chicago, pp 323-352.
Burnham, A. K., 1982, "Reaction Kinetics and
Diagnostics for Oil Shale Retorting," in Symposium
Papers: Synthetic Fuels from Oil Shale II,
Institute of Gas Technology, Chicago, pp 175-202.
Burnham, A. K., 1981, "Effect of Steam on
H_, C0?, H?S, CO, and COS Concentrations in
Combustion-Retort Offgas," Lawrence Livermore
National Laboratory, Report UCID-19093.
Campbell, J. H. and Burnham, A. K., 1980,
"Reaction Kinetics for Modeling Oil Shale
Retorting," In-Situ 4, pp 1-37.
Campbell, J. H., 1981, "Modified In-Situ
Retorting Results from LLNL Pilot Retorting
Experiments," Lawrence Livermore National
Laboratory, Report UCRL-53168.
Clarke, F. w., 1924, "The Data of
Geochemistry," U.S. Geological Survey Bulletin
770, p 150 and 518.
Coburn, T. T., Rubel, A. M. and Henson, T. S.,
1980, "Eastern Oil Shale Retorting, 1: Pyrolysis
of the Sunbury Shale of Kentucky," Kentucky
Institute of Mining and Minerals Research, Report
IMMR 81/062.
Cole, R. D., Liu, J. H., Smith, G. V.,
Hinckley, C. C. and Saporoschenko, M., 1978, "Iron
Partitioning in Oil Shale of the Green River
Formation, Colorado: A Preliminary Mossbauer
Study," Fuel 57, pp 514-528.
Cole, R. D., 1975, "Sedimentology and Sulphur
Isotope Geochemistry of the Green River Formation
(Eocene), Uinta Basin, Utah and the Piceance Creek
19
Basin, Colorado," Ph.D. Thesis, University of
Utah, Salt Lake City.
Desborough, G. A. and Pitman, J. K., 1974,
"Significance of Applied Mineralogy to Oil Shale
in the Upper Part of the Parachute Creek Member of
the Green River Formation, Piceance Creek Basin,
Colorado," from the 1974 Guidebook, Rocky Mountain
Association of Geologists.
Desborough, G. A., Pitman, J. K. and Huffman,
C, Jr., 1974, "Concentration and Mineralogical
Residence of Elements in Rich Oil Shales of the
Green River Formation, Piceance Creek Basin,
Colorado, and the Unita Basin, Utah...A
Preliminary Report," U.S. Geological Survey,
Open-file Report 74-77.
Desborough, G. A., Pitman, J. K. and Huffman,
C, Jr., 1976, "Concentration and Mineralogical
Residence of Elements in Rich Oil Shales of the
Green River Formation, Piceance Creek Basin,
Colorado, and the Unita Basin, Utah - A
Preliminary Report," Chemical Geology, Vol 17, pp
13-26.
Dinneen, G. U., Van Meter, R. A., Smith, J.
R., Bailey, C. H., Cook, G. L., Allbright, C. S.
and Ball, J. S., 1961, Composition of Shale Oil
Naphtha, U.S. Bur. Mines Bull. 593.
Dinneen, G. U., 1962, "Sulfur and Nitrogen
Compounds in Shale Oil," Proc. API 42 (VIII), p 41.
Doyle, J. B., 1981, "Fluid Bed Combustion of
Coal-Oil Shale Mixture," presented to the Fourth
Annual Oil Shale Conversion Symposium, Denver,
Colorado, March 24-26, 1981, (A contribution from
Alliance Research Center, Babcock and Wilcox Co.,
Alliance, Ohio)
Edmonds C, 1981, "The Clean Air Act - Putting
Together a Jigsaw Puzzle," Shale Country,
February/March 1981, pp 15-17.
Fruchter, J. S. and Wilkerson, C. L., 1981,
"Characterization of Oil Shale Retort Effluents,"
in Oil Shale, the Environmental Challenges, edited
by Peterson, K. K., Proceedings of an
International Symposium, August 11-14, 1980, Vail,
Colorado, Colorado School of Mines Press, Golden,
Colorado, pp 31-55.
Fuchs, L. H., Nielsen, E. L. and Hubble, B.
R., 1978, "Use of Oil Shale For Control of Sulfur
Dioxide Emissions From the Combustion of Coal,"
Thermochimica Acta, Vol 26, pp 229-239.
Giauque, R. D., Fox, J. P. and Smith, J. w.,
1980, "Characterization of Two Core Holes From the

Naval Oil Shale Reserve Number 1," Lawrence
Berkeley Laboratory, Report LBL-10809.
Giauque, R. D., May 1981, Lawrence Berkeley
Laboratory, letter to A. K. Burnham.
Goodfellow, L. and Atwood, M. T., 1974,
"Fischer Assay of Oil Shale Procedures of the Oil
Shale Corporation," Quart. Colo. Sch. Mines 69, pp
205-219.
Hakkila, E. A., Elliott, N. E., Williams, J.
M. and Wewerka, E. M., 1978, "A Preliminary
Electron Microprobe Study of Green River and
Devonian Oil Shales," in Analytical Chemistry of
Liquid Fuel Sources, Uden, P. C, Siggia, S. and
Jensen, H. G., editors, Advances in Chemistry
Series 170, American Chemical Society, Washington,
D.C., pp 181-194.
Huss, E. B., and Burnham, A. K., 1981, "Gas
Evolution During Pyrolysis of Various Colorado Oil
Shales," Lawrence Livermore National Laboratory,
Report 87008 preprint.
Jackson, L. P., Morandi, J. R., and Poulson,
R. E., 1978, "Compositional Variation of Retorted
Shale Oils with Stratigraphy: Wyoming Core,
Northern Green River Basin," in Oil Sand and Oil
Shale Chemistry, edited by Strausz, 0. P. and
Lown, E. M., Verlag Chemie, N.Y.
Johnson, D. R., 1982, Mineral Management
Service, U.S. Dept. Interior, personal
communication.
Jones, D. G. and Dickert, J. J., 1965,
"Composition and Reactions of Oil Shale of the
Green River Formation," in Hydrocarbons from Oil
Shale, Oil Sands and Coal, CEP Symp. Ser. 54, Vol
61, p 33.
Jones, J. B., and Heistand, R. N., 1979,
"Recent Paraho Operations," 12th Oil Shale Symp.
Proc, Colo. Sch. Mines Press, Golden, CO, pp
184-194.
Lovell, P. F., 1978, "Production of Utah Shale
Oils by the Paraho DH and Union B Retorting
Processes," 11th Oil Shale Symp. Proc, Colo. Sch.
Mines Press, Golden, CO, pp 184-192.
Lovell, R. J., Dylewski, S. W. and Peterson,
C. A., 1980, "Control of Sulfur Emissions from Oil
Shale Retorts," IT Environscience, Knoxville, TN.
Murray, D. K., 1974, Guidebook to the Energy
Resources of the Piceance Creek Basin, Colorado,
Twenty-Fifth Field Conference Rocky Mountain
Association of Geologists, Denver, CO.
Office of Technology Assessment, Congress of
the United States, 1980, "An Assessment of Oil
Shale Technologies," pp 278-279.
Ondov, J. M., et al, 1981, "Measurements of
Potential Atmospheric Pollutants in Offgases from
the LLNL 6-Tonne Retort, L-3," Lawrence Livermore
National Laboratory, Report UCRL-53265.
Orr, W. L., 1978, "Sulfur in Heavy Oils, Oil
Sands and Oil Shales," in Oil Sand and Oil Shale
Chemistry, edited by Strausz, 0. P., and Lown, E.
M., Verlag Chemie, N.Y.
Peck, H. D., Jr., 1975, "Biological Oxidation
and Reduction of Inorganic Compounds of Sulfur,"
in preprints of papers presented at the 169th
National ACS Meeting, Division of Fuel Chemistry,
Symposium on Sulfur and Nitrogen in Coal and Oil
Shale, Philadelphia, Pennsylvania, April 6-11,
1975, pp 76-84.
Philp, R. P., 1978, "Recent Studies on the
Origin and Structure of Possible
Kerogen-Precursors," in Oil Sand and Oil Shale
Chemistry, edited by Strausz, 0. P. and Lown, E.
M., Verlag Chemie, N.Y.
Poulson, R.E., 1975, "Nitrogen and Sulfur in
Raw and Refined Shale Oils," ACS Div. Fuel Chem.
Preprints 20 (2), pp 183-197.
Pyzik, A. J. and Sommer, S. E., 1981,
"Sedimentary Iron Monosulfides: Kinetics and
Mechanism of Formation," Geochimica et
Cosmochimica Acta, Vol 45, pp 687-698.
Raley, J. H. and Campbell, J. H., 1981, "Oil
Shale Project Run Summary: Small Retort Runs S-21
and S-23," Lawrence Livermore National Laboratory,
Report UCID-19082.
Raley, J. H., Sandholtz, W. A., Ott, L. L.,
Miller, W. C. and Burnham, A. K., 1981, "Oil Shale
Project Run Summary: Small Retort Run S-24,"
Lawrence Livermore National Laboratory, Report
UCID-19219.
Rio Blanco Oil Shale Co., 1981, "Tract C-a,
Modification to the Detailed Development Plan,
Lurgi Demonstration Project."
Robie, R. A., Hemingway, B. S. and Fisher, J.
R., 1979, "Thermodynamic Properties of Minerals
and Related Substances at 298.15K and 1 Bar (105
Pascals) Pressure and at Higher Temperatures,"
Geological Survey Bulletin 1452, U.S. Government
Printing Office, Washington, D.C.
Roehler, H. W., 1974, "Depositional
Environments of Rocks in The Piceance Creek Basin,
Colorado," in Rocky Mountain Association of
Geologists Guidebook to the Energy Resources of
the Piceance Creek Basin, Colorado, 25th Field
Conference, pp 57-64.
Schmalfeld, P., 1975, "The Use of the
Lurgi-Ruhrgas Process for the Distillation of Oil
Shale," Quart. Colo. Sch. Mines 70, No. 3, pp
129-145.
Schulman, B. L., 1976, "Shale Matrix Plays
Important Role in Energy From Oil Shale," in Oil
Shale and Tar Sands, Smith, J. W. and Atwood, M.
T., editors, AIChE Symposium Series No 155, Vol
72, pp 39-43.
Shih, S. M. and Sohn, H. Y., 1980,
"Nonisothermal Determination of the Intrinsic
Kinetics of Oil Generation from Oil Shale," I. and
E.C. Process Design and Development, vol 19, pp
420-426.
Singleton, M. F., Koskinas, G. J., Burnham, A.
K. and Raley, J. H., 1982, "Assay Products from
Green River Oil Shale," Lawrence Livermore
National Laboratory, Report UCRL-53273.
Sklarew, D. S., Fruchter, J. S., Schoengold,
D. M., Tompkins, M. R. and Morris, C. L., 1981,
"Measurement of Sulfur Species in Offgas from Rio
Blanco's Retort 0 Tract C-a, Colorado,"
Preliminary Report, Battelle-Pacific Northwest
Laboratories, Richland Wash.
Smith, J. W., 1961, "Ultimate Composition of
Organic Matter in Green River Oil Shale," U.S.
Bureau of Mines Rept. of Investigations 5725.
Smith, J. W., Young, N. B. and Lawler, D. L.,
1964, "Direct Determination of Sulfur Forms in
Green River Oil Shale," Anal Chem 36, pp 618-622.
Stanfield, K. E., Frost, I. C, McAuley, W. S.
and Smith, H. N., 1951, "Properties of Colorado
Oil Shale," U.S. Bureau of Mines, R.I. 4825.
Stout, N. S., Koskinas, G. J., Raley, J. H.,
Santor, S. D., Opila, R. J. and Rothman, A. J.,
1976, "Pyrolysis of Oil Shale: Effects of Thermal
History on Oil Yield," Quarterly of the Colorado
School of Mines, Vol 71, No 4, pp 153-172.
Stull, D. R. and Prophet, H., 1971, JANAF
Thermochemical Tables: National Standard,
Reference Data Series, National Bureau of
Standards, Vol 37.
Tamm, P. W., Bertelsen, G. M., Handel, G. W.,
Spurs, B. G. and Wallman, P. H., 1981, "The
Chevron STB Oil Shale Retort," Preprint No 23-81,
American Petroleum Institute, 2101 L Street N.W.,
Washington, D.C., 20037, presented at 46th Midyear
Refining Meeting, Chicago, IL, May 13, 1981.
Taylor, R. W., Burnham, A. K., Mallon, R. G.
and Morris, C. J., 1981, "SO., Emissions from the
Oxidation of Retorted Oil Shale," Lawrence
Livermore National Laboratory, Report UCRL-86491,
to be published in Fuel.
Taylor, R. W., Strickland, C. S. and Gregory,
L. J., 1982, "The Disposition of Sulfur During the
Oxidation and Subsequent Leaching of Retorted Oil
Shale," Lawrence Livermore National Laboratory,
Report UCID-In Press.
Thoem, T., Bates. C, Dial, C, Harris, E.,
and Princiotta, F., 1980, "Status of EPA
Regulatory and Research Activities Affecting Oil
Shale Development," 13th Oil Shale Symposium
Proceedings, Colorado School of Mines, pp 288-299.
Tissot, B. P. and Welte, D. H., 1978,
Petroleum Formation and Occurrence,
Springer-Verlagg, N.Y., pp 396-397.
Wedepohl, K. H., 1978, "Sulfur", Handbook of
Geochemistry, Chapter 16, Springer-Verlag, N.Y.
Weiss, H., 1982, "Retorting of Oil
Shale--Background, Status and Potential of the
Lurgi-Ruhrgas (LR) Process," paper presented at
the ACS Symposium "Oil Shale Retorting—Latest
Development," March 28-April 12, Las Vegas, Nevada.
Willey, C, Iwad, M., Castle, R. N. and Lee,
M. L., 1981, "Determination of Sulfur Heterocycles
in Coal Liquids and Shale Oils," Anal Chem 53, p
400.
Williamson, D. L. and Melchior, D. C, 1980,
"Changes in Iron Minerals During Oil-Shale
Retorting," 13th Oil Shale Symposium Proceedings,
Colorado School of Mines Press, Golden, CO, pp
337-350.
Wilson, W. I., Snyder, R. B. and Johnson, I.,
1980, "The Use of Oil Shale for S02 Emission
Control in Atmospheric-Pressure Fluidized-Bed Coal
Combustors," I. and E. C. Process Design and
Development, Vol 19, No 1, pp 47-51.
Witcombe, J. A. and Vawter, R. G., 1976, "The
TOSCO-II Oil Shale Process," in Science and
Technology of Oil Shale, Ann Arbor Science, Ann
Arbor, MI, pp 47-64.
Young, N. B., 1980, personal communication.