
Occupational Tasks and Changes in the Wage Structurewebfac/kline/e251_f09/lemieux.pdfOccupational...
49
Occupational Tasks and Changes in the Wage Structure Sergio Firpo EESP-FGV Nicole Fortin UBC Thomas Lemieux UBC and NBER September 2009 Abstract This paper looks at the contribution of occupations to changes in the distrib- ution of wages. We rst present a simple model where wages in each occupation are set on the basis of linear task pricing model. We argue that this simple model provides a general way of capturing changes in wages induced by factors like tech- nological change and o/shoring. Using Current Population Survey (CPS) for the years 1983-85 and 2000-02, we nd that the simple linear skill pricing model char- acterizes well the observed changes in the wage distribution. In particular, it goes a long way towards accounting for the U-shaped feature of the curve depicting changes in real wages at each percentile of the overall wage distribution. We then explicitly quantify the contribution of these factors to changes in wage inequality relative to other explanations such as de-unionization and changes in the returns to education. We do so using a decomposition based on the inuence function regression approach suggested by Firpo, Fortin, and Lemieux (2009). The results indicate that technological change and o/shoring are two among a variety of other factors that can account for the observed changes in the distribution of wages.
Transcript of Occupational Tasks and Changes in the Wage Structurewebfac/kline/e251_f09/lemieux.pdfOccupational...

Occupational Tasks and Changes in the Wage Structure
Sergio Firpo
EESP-FGV
Nicole Fortin
UBC
Thomas Lemieux
UBC and NBER
September 2009
Abstract
This paper looks at the contribution of occupations to changes in the distrib-
ution of wages. We �rst present a simple model where wages in each occupation
are set on the basis of linear task pricing model. We argue that this simple model
provides a general way of capturing changes in wages induced by factors like tech-
nological change and o¤shoring. Using Current Population Survey (CPS) for the
years 1983-85 and 2000-02, we �nd that the simple linear skill pricing model char-
acterizes well the observed changes in the wage distribution. In particular, it goes
a long way towards accounting for the U-shaped feature of the curve depicting
changes in real wages at each percentile of the overall wage distribution. We then
explicitly quantify the contribution of these factors to changes in wage inequality
relative to other explanations such as de-unionization and changes in the returns
to education. We do so using a decomposition based on the in�uence function
regression approach suggested by Firpo, Fortin, and Lemieux (2009). The results
indicate that technological change and o¤shoring are two among a variety of other
factors that can account for the observed changes in the distribution of wages.

1 Introduction
Until recently, most studies on changes in inequality and in the wage structure have
focused on explanations such as changes in the return to traditional measure of skills like
education and experience (e.g. Katz and Murphy, 1992) and institutions (e.g. DiNardo,
Fortin, and Lemieux, 1996). The role of industrial change due to de-industrialisation and
foreign competition was also explored in some of the early studies such as Murphy and
Welch (1991), Bound and Johnson (1992), and Freeman (1995). Until recently, however,
little attention had been paid to the potential role of occupations in changes in wage
inequality.
This situation has changed over the last �ve years for a number of reasons. First, Au-
tor, Levy, and Murnane (2003), Goos and Manning (2007), and Autor, Katz and Kearney
(2006) have proposed a new explanation for changes in wage inequality based on a more
�nuanced�view of skill-biased technological change. The idea is that the introduction of
computer and information technologies have not simply depressed the relative demand
for less skilled workers, as it was assumed in early studies such as Berman, Bound, and
Griliches (1994). Rather, what computer and information technologies have done is to
depress the return to �routine�tasks that can now be executed by computer technolo-
gies, irrespective of whether they required skilled or unskilled labor in the �rst place.
Autor, Katz and Kearney (2006) and Goos and Manning (2007) argue that this factor
can account for the polarization of wages that happened in the 1990s. Relatively skilled
workers performing routine tasks experienced a decline in relative wages during this pe-
riod. To the extent that these workers were around the middle of the skill distribution,
technological change could explain why wages in the middle of the distribution fell more
than those at the bottom and top end of the distribution.
This more nuanced view of technological change puts occupations at the forefront of
the inequality debate since the task content of work (routine nature of the job, cognitive
skills required, etc.) is typically measured at the occupation level.1 The key empirical
implication of this more nuanced view of technological change is that wage changes in
di¤erent occupations should be linked to the type of tasks performed in these occupations.
In other words, occupations are the key channel through which technological change
should a¤ect the wage structure.
1Most studies have either used data from the Dictionary of Occupation Titles (DOT) or the morerecent Occupational Information Network (O*NET) to get information about the task content of jobs.Since jobs are de�ned on the basis of a detailed occupational classi�cation, this naturally lead to ananalysis at the occupational level.
1

A second reason for looking at the contribution of occupations in changes in the wage
structure is o¤shoring. Traditional explanations for the role of international trade in
changes in inequality have focused on the role of trade in �nal products that are de�ned
at the industry level. More recently, however, authors such as Feenstra and Hanson
(2003) have argued that trade in intermediate inputs was a more promising explanation
for changes in wage inequality than trade in �nal goods and services. For instance,
a U.S. multinational can hire computer programmers in India to perform some of the
work required to develop, say, a new software product. This lowers the relative demand
for a particular occupation, computer programmers, in the United States, which then
depresses their wages. As in the case of technological change, occupations are the key
channel through which o¤shoring can contribute to changes in wage inequality.
A third reason for looking at the contribution of occupations in changes in wage
inequality is the stunning growth in wages at the very top of the distribution. For
instance, Gabaix and Landier (2008) link the growth in CEO pay to an increase in the
return to talent in this particular occupation. Kaplan and Rauh (2009) show that workers
in a few highly paid occupations in the �nancial sector also account for a large share of
the growth in wages at the very top end of the distribution.
But although occupations now feature prominently as a possible explanation for re-
cent changes in wage inequality, the role of occupations in these changes has not been
systemically investigated yet. Some studies do suggest an important role for an occupa-
tional based explanation. Goos and Manning (2007) show that the composition e¤ect
linked to changes in the distribution of occupations accounts for a substantial part of the
increase in inequality in the United Kingdom. Autor, Katz and Kearney (2006) provide
evidence that, consistent with a �nuanced�view of technological change, the share of em-
ployment in occupations in the middle of the wage distribution has declined over time.
While these evidences suggest a potentially important role for occupations, it remains
to be seen how much of the total change in the distribution of wages factors linked to
occupations can actually account for.
The goal of this paper is to �ll this gap by systematically investigating the contribution
of occupations to changes in the distribution of wages. We �rst present a simple model
where wages in each occupation are set on the basis of linear skill pricing model. We argue
that this simple model provides a general way of capturing changes in wages induced by
factors like technological change and o¤shoring. The model yields a number of testable
implications on the relationship between wages changes and base period wages at each
percentile of the within-occupation wage distribution. Using Current Population Survey
2

(CPS) for the years 1983-85 and 2000-02, we �nd that the simple linear skill pricing
model characterizes well the observed changes in the wage distribution. In particular,
it goes a long way towards accounting for the U-shaped feature of the curve depicting
changes in real wages at each percentile of the overall wage distribution.
Having shown the important role of occupations, we then attempt to related changes
in the linear pricing functions to measures of the task content of occupations linked
to technological change, o¤shoring, and other factors. We �nd that these task content
measures explain well (about half of the observed variation) changes in both the intercept
and the slopes of the pricing functions. The results provide some support to the role of
technological change and o¤shoring in changes in the distribution of wages between 1983-
85 and 2000-02.
In the last part of the paper, we explicitly quantify the contribution of these factors to
changes in wage inequality compared to other explanations such as de-unionization and
changes in the returns to general (non occupation-speci�c) skills such as labor market
experience and education. We compute the decomposition using the in�uence function
regression approach suggested by Firpo, Fortin, and Lemieux (2009). The results indicate
that technological change and o¤shoring are two among a variety of other factors that
can account for the observed changes in the distribution of wages.
2 Linear Skill Pricing Model
In the �rst part of the empirical analysis, we look at the contribution of occupations
to changes in the wage structure using a simple regression approach to link changes in
various percentiles of the within-occupation distribution of wages to the corresponding
wage percentile in the base period. As we explain later, doing so enables us to summarize
the contribution of occupational wage setting to changes in the distribution of wages.
In this section, we propose a simple model to help interpret these regressions. Follow-
ing Welch (1969) and Heckman and Sheinkman (1987), we consider a wage determination
model where wages are a linear function of the various skills and other personal attributes
embodied in each worker. We take a very general approach at this point that allows for a
large variety of skills or attributes such as formal schooling, cognitive and non-cognitive
skills, manual dexterity, etc., to a¤ect wages. Since di¤erent occupations involve di¤er-
ent production technologies, we consider a model where the return to skills or attributes
varies from one occupation to another. This yields the following skill pricing equation
for worker i in occupation j at time t:
3
wijt = �jt +
KXk=1
�jktSik + uijt;
where wijt is the (log) wage, Sik (for k = 1; :::; K) is each skill component k embodied in
worker i, and uijt is an idiosyncratic error term. The �jkt�s are the returns (or �prices�)
to each skill component k in occupation j, while �jt is a base payment that a worker
receives in occupation j regardless of her skills.
This skill pricing model is general enough to capture the impact of factors such
as technological change or o¤shoring on wages. For instance, consider the return to
manual dexterity. Prior to the introduction of sophisticated robots or other computer
technologies, manual dexterity was a highly valued skill in some particular occupations
(e.g. precision workers) but not in others (e.g. sales clerk). When routine manual tasks
start getting replaced by automated machines or robots, this depresses the return to
manual dexterity in occupations where these returns were previously high, but not in
others where manual dexterity was not a job requirement.
Similarly, returns to social or communication skills are presumably high in occupations
where face-to-face meetings with customers are important (e.g. sale representatives). In
occupations where face-to-face meetings are not essential (e.g. phone operators), however,
the returns to these skills will go down as �rms are now able to o¤shore a lot of this work.
The general point here is that the impact of technological change and o¤shoring can be
captured in the above model by changes in the skill pricing parameters �jkt.
If we had panel data on individuals who stay in the same occupation over time, we
could look at how the wage of worker i changes in response to changes in the skill pricing
parameters, ��jk:
�wij = ��j +KXk=1
��jkSik +�uijt:
The wage change, �wij, can be linked to the wage in the base period (t = 0) using a
simple linear regression equation
�wij = aj + bjwij0 + eij:
Under the simplifying assumption that the di¤erent skill components Sik are uncorrelated,
4

the slope parameter of the regression, bj, can be written as:
bj =cov(�wij; wij0)
var(wij0)=
KPk=1
��jk0��jk
�� �2kj
KPk=1
�2jk0 � �2kj + �2uj0; (1)
where �2kj is the variance of the skill component Sik for workers in occupation k, and
where �2ujt is the variance of the idiosyncratic error term uijt.
Even when the �jkt�s cannot be estimated for lack of precise measures of the skill
components Sik, it is still possible to learn about changes in the �jkt�s from the estimates
of the slope coe¢ cients bj. While the denominator in equation 1 (a variance) is always
positive, the sign of the numerator depends on the correlation between returns to skills
in the base period (�jk0), and change in the return to skill (��jk). For example, in
manual occupations where the return to manual dexterity used to be large (�jk0 >> 0)
but declined substantially (��jk << 0), we expect the slope coe¢ cient bj to be negative.
By contrast, in some scienti�c or professional occupations where the return to cognitive
skills is high (�jk0 >> 0) and does increase over time (��jk << 0), we expect the slope
coe¢ cient bj to be positive.
In the empirical analysis presented below, we rely on large repeated cross-sections
of the CPS instead of panel data. While it is not feasible to directly estimate bj in
that setting, we can still estimate a closely related parameter ebj using percentiles of thewithin-occupation distribution of wages.
To �x ideas, let�s further simplify the model by assuming that both the skill com-
ponents, Sik (for k = 1; :::; K), and the idiosyncratic error term, uijt, follow a normal
distribution. It follows that wages are themselves normally distributed, and the qth per-
centile of the distribution of wijt, wqjt, is given by
wqjt = wjt + �jt��1(q); (2)
where �(�) is the standard normal distribution function, wjt is the mean of wages inoccupation j at time t, and �jt is its standard deviation, where
�2jt =KXk=1
�2jkt � �2kj + �2ujt:
5

Now consider a regression of �wqj on wqj0:2
�wqj = eaj +ebjwqj0 + eqj : (3)
The slope parameter, ebj, is now given byebj = cov(�wqj ; w
qj0)
var(wqj0)=(��j � �j0) � var(��1(q))
�2j0 � var(��1(q))=��j�j0
: (4)
Using the linear approximations ��j � ��2j=2�j0 and ��2jk � �jk0��jk yields
ebj �KPk=1
��jk0��jk
�� �2kj
�2j0+��2uj2�2j0
: (5)
The �rst term in equation (5) is similar to the slope coe¢ cient obtained earlier in
(1) and has, therefore, a similar interpretation. The second term re�ects the fact that
an increase in the variance of the idiosyncratic error term widens the wage distribution,
which results in a positive relationship between change in wages and base wage levels.
Using the fact that E(wqjt) = wjt (expectation taken over q, for q = 0; ::; 1), the
intercept in the regression model, eaj, can be written as:eaj = �wj � ��j
�j0wj0; (6)
where
�wj = ��j +KXk=1
��jkSjk: (7)
Without loss of generality, we can normalize the base period wage in each occupation
to have a mean zero. The intercept can then be written as:
eaj = ��j + KXk=1
��jkSjk: (8)
Like the slope parameter ebj, the intercept eaj depends on changes in the return toskill components, ��jk. The intercept also depends on ��j, which re�ects changes in
2Note that under the normality assumption, the error term eqj is equal to zero. We introduce theerror term in the equation, nonetheless, to allow for a more general case where the normality assumptionfails.
6

occupational wage di¤erentials unrelated to skills. This could re�ect occupational rents,
compensating wage di¤erentials, etc.
2.1 Estimation approach
Under the strong assumption that skills Sik and the error term uijt are normally distrib-
uted, the regression model in equation (3) fully describes the relationship between the
base wage and the change in wage at each percentile q of the within-occupation wage
distribution.
This suggests a simple way of assessing the contribution of changes in the occupational
wage structure to changes in the distribution of wages. In a �rst step, we can estimate
equation (3) separately for each occupation (or in a pooled regression with interactions)
and see to what extent the simple linear model helps explain the observed changes in
wages. We can then run �second step�regressions of the estimated eaj and ebj on measuresof task content of work that correlates with the ��s and with the change in the ��s at the
occupational level.
While the normality assumption is convenient for illustrating the basic predictions
of the linear skill pricing model, it is also restrictive. As is well known, the normal
distribution is fully characterized by its location (wjt above) and scale parameter (�jtabove). This can be generalized to the case where the wage distribution is not normal,
but only the location and scale changes over time. Relative to equation (2), this means we
can replace ��1(q) by a more general and occupation-speci�c inverse probability function
F�1j (q). Equation (2) is then replaced by
wqjt = wjt + �jtF�1j (q): (9)
We can then get the same regression equation since
�wqj = �wj +��jF�1j (q): (10)
Solving for F�1j (q) in equation (9) at t = 0, and substituting into equation (10) yields
�wqj = �wj ���j�j0
wj0 +��j�j0
wqj0; (11)
which is identical to equation (3) since eaj = �wj � ��j�j0wj0 and ebj = ��j
�j0.
In general, however, changes in the returns to skill �jkt are expected to change the
7

shape of the wage distribution above and beyond the scale and location. F�1j (q) is no
longer a constant over time. As a result, equation (10) becomes
�wqj = �wj +��j1F
�1j1 (q)� �j0F�1j0 (q)
�(12)
= �wj +��jF�1j0 (q) + e
qj (13)
where eqj = �j1�F�1j1 (q)� F�1j0 (q)
�. Substituting in F�1j0 (q) = (w
qj0 � wj0)=�j0 and using
the de�nitions of eaj and ebj then yields�wqj = eaj +ebjwqj0 + eqj : (14)
It is generally not possible to �nd a close form expression for eqj . If changes in the
F�1jt (q) functions are similar across occupation, however, this will generate a percentile
speci�c component in the error term. For instance, Autor, Katz and Kearney (2008) show
that the distribution of wage residuals has become more skewed over time (convexi�cation
of the distribution). This is inconsistent with the normality assumption, but can be
captured by allowing for a percentile-speci�c component �q in eqj :
eqj = �q + "qj : (15)
This leads to the main regression equation to be estimated in the �rst step of the
empirical analysis:
�wqj = eaj +ebjwqj0 + �q + "qj : (16)
A more economically intuitive interpretation of the percentile-speci�c error compo-
nents �q is that it represents a generic change in the return to unobservable skills of the
type considered by Juhn, Murphy, and Pierce (1993). For example, if unobservable skills
in a standard Mincer type regression re�ect unmeasured school quality, and that school
quality is equally distributed and rewarded in all occupations, then changes in the return
to school quality will be captured by the error component �q.
In the second step of the analysis, we link the estimated intercepts and (eaj and ebj)to measures of the task content of each occupation. Since technological change and
o¤shoring are the key explanatory variables used in the second step, the next section
discusses how we measure these factors before moving to the estimation results in Section
4.
8

3 Occupational Measures of Technological Change
and O¤shoring Potential
Like many recent papers (Goos and Manning (2007), Goos, Manning and Salomons
(2009), Crino (2009)) that study the task content of jobs, and in particular their o¤-
shorability potential, we use the O*NET data to compute our measures of technological
change and o¤shoring potential.3 Our aim is to produce indexes for all 3-digit occupa-
tions available in the CPS, a feat that neither Jensen and Kletzer (2007) nor Blinder
(2007) completed.4 Our construction of an index of potential o¤shorability follows the
pioneering work of Jensen and Kletzer (2007) [JK, thereafter] while incorporating some
of the criticisms of Blinder (2007). The main concern of Blinder (2007) is the inability of
the objective indexes to take into account two important criteria for non-o¤shorability: a)
that a job needs to be performed at a speci�c U.S. location, and b) that the job requires
face-to-face personal interactions with consumers. We thus pay particular attention to
the �face-to-face�and �on-site�categories in the construction of our indexes.
In the spirit of Autor, Levy, and Murnane (2003), who used the Dictionary of Occu-
pational Titles (DOT) to measure the routine vs. non-routine, and cognitive vs. non-
cognitive aspects of occupations, JK use the information available in the O*NET, the
successor of the DOT, to construct their measure. The O*NET content model organize
the job information into a structured system of six major categories: worker character-
istics, worker requirements, experience requirements, occupational requirements, labor
market characteristics, and occupation-speci�c information.
Like JK, we focus on the �occupational requirements� of occupations, but we add
some �work context�measures to enrich the �generalized work activities�measures. JK
consider eleven measures of �generalized work activities�, subdivided into �ve categories:
1) on information content: getting information, processing information, analyzing data
or information, documenting/recording information; 2) on internet-enabled: interacting
with computers; 3) on face-to-face contact: assisting or caring for others, performing or
working directly with the public, establishing or maintaining interpersonal relationships;
4) on the routine or creative nature of work: making decisions and solving problems,
thinking creatively; 5) on the �on-site�nature of work: inspecting equipment, structures
or material.3Available from National Center for O*NET Development.4Blinder (2007) did not compute his index for Category IV occupations (533 occupations out of 817),
that are deemed impossible to o¤shore. Although, Jensen and Kletzer (2007) report their index for 457occupations, it is not available for many blue-collar occupations (occupations SOC 439199 and up).
9

We also consider �ve similar categories, but include �ve basic elements in each of
these categories. Our �rst category �Information Content� regroups JK categories 1)
and 2). It identi�es occupations with high information content that are likely to be af-
fected by ICT technologies; they are also likely to be o¤shored if there are no mitigating
factor.5 Appendix Figure 1 shows that average occupational wages in 2000-02 increase
steadily with the information content. Our second category �Automation�is constructed
using some work context measures to re�ect the degree of potential automation of jobs
and is similar in spirit to the manual routine index of Autor et al. (2003). The work
context elements are: degree of automation, importance of repeating same tasks, struc-
tured versus unstructured work (reverse), pace determined by speed of equipment, and
spend time making repetitive motions. The relationship between our automation index
and average occupational wages display an inverse U-shaped left-of-center of the wage
distribution. We think of these �rst two categories as being more closely linked to tech-
nological change, although we agree with Blinder (2007) that there is some degree of
overlap with o¤shorability. Indeed, the information content is a substantial component
of JK�s o¤shorability index.
Our three remaining categories �Face-to-Face Contact�, �On-site Job�and �Decision-
Making�are meant to capture features of jobs that cannot be o¤shored, and that they
capture the non-o¤shorability of jobs. Note, however, that the decision-making features
were also used by Autor et al. (2003) to capture the notion of non-routine cognitive tasks.
Our �Face-to-Face Contact�measure adds one work activity �coaching and developing
others�and one work context �face-to-face discussions�element to JK�s face-to-face in-
dex. Our �On-site Job�measure adds four other elements of the JK measure: handling
and moving objects, controlling machines and processes, operating vehicles, mechanized
devices, or equipment, and repairing and maintaining mechanical equipment and elec-
tronic equipment (weight of 0.5 to each of these last two elements). Our �Decision-
Making�measure adds one work activity �developing objectives and strategies�and two
work context elements, �responsibility for outcomes and results�and �frequency of deci-
sion making�to the JK measure. The relationship between these measures of o¤shora-
bility (the reverse of non-o¤shorability) and average occupational wages are displayed in
Appendix Figure 1. Automation and No-Face-to-Face contact exhibit a similar shape.
No-Site is clearly U-shaped, and No-Decision-Making is steadily decreasing with average
occupational wages.
5Appendix Table 1 lists the exact reference number of the generalized work actitivies and work contextitems that make up the indexes.
10

For each occupation, O*NET provides information on the �importance�and �level�
of required work activity and on the frequency of �ve categorical levels of work context.6
We follow Blinder (2007) in arbitrarily assigning a Cobb-Douglas weight of two thirds to
�importance�and one third to �level� in using a weighed sum for work activities. For
work contexts, we simply multiply the frequency by the value of the level.
Each composite TCh score for occupation j in category h is, thus, computed as
TCjh =
AhXk=1
I2=3jk L
1=3jk +
ChXl=1
Fjl � Vjl; (17)
where Ah is the number of work activity elements, and Ch the number of work context
elements in the category TCh, h = 1; : : : ; 5.
To summarize, we compute �ve di¤erent measures of task content using the O*NET:
i) the information content of jobs, ii) the degree of automation of the job and whether it
represents routine tasks, iii) the importance of face-to-face contact, iv) the need for on-
site work, and v) the importance of decision making on the job. Call these �ve measures
of task content (in each occupation j) TCjh, for h = 1; ::; 5. The second step regressions
are eaj = 0 + 5Xh=1
jhTCjh + �j; (18)
and ebj = �0 + 5Xh=1
�jhTCjh + �j: (19)
There is no direct mapping from the task content measures TCjh to the return to
skill parameters, �jk. We expect to see, however, a steeper decline in the relevant �jkt�s
in occupations with traditional task requirements that are more easily replaceable by
technology or o¤shore workers. For example, occupations scoring high in terms of the
routine aspect of the work performed should experience a sizable decline in both eaj andebj. Similarly, occupations that involve face-to-face meetings are less likely to be o¤shoredand experience a decline in the eaj or ebj parameters.
6For example, the work context element �frequency of decision-making" has �ve categories: 1) never,2) once a year or more but not every month, 3) once a month or more but not every week, 4) once a weekor more but not every day, and 5) every day. The frequency corresponds to the percentage of workersin an occupation who answer a particular value. As shown in Appendix 1, 33 percent of sales manageranswer 5) every day, while that percentage among computer programmers is 11 percent.
11

4 Occupation Wage Pro�les: Results
In this Section, we present the estimates of the occupational wage pro�les (equation
(16)), and then link the estimated slope and intercept parameters to our measures of
task content from the O*Net. The empirical analysis is based on data for men from
the 1983-85 and 2000-02 Outgoing Rotation Group (ORG) Supplements of the Current
Population Survey. The data �les were processed as in Lemieux (2006b) who provides
detailed information on the relevant data issues. The wage measure used is an hourly
wage measure computed by dividing earnings by hours of work for workers not paid by
the hour. For workers paid by the hour, we use a direct measure of the hourly wage rate.
CPS weights are used throughout the empirical analysis.
The choice of years is driven by data consistency issues. First, there is a major change
in occupation coding in 2003 when the CPS switches to the 2000 Census occupation
classi�cation. This makes it hard to compare detailed occupations from the 1980s or
1990s to those in the post-2002 data. Another data limitation is that the union status,
another important source of changes in the wage distribution, is only available in the
ORG CPS from 1983 on. But despite these data limitations, the 1983-85 to 2000-02 is
a good time period to study given the purpose of this paper, since this is when most of
the polarization of wages phenomenon documented by Autor, Katz and Kearney (2006)
happened.
By pooling three years of data at each end of the sample period, we obtain relatively
large samples both in 1983-85 (274,625 observations) and 2000-02 (252,397 observations).
But despite these large samples, we are left with a small number of observations in many
occupations when we work at the three-digit level. In the analysis presented in this
section, we thus focus on occupations classi�ed at the two-digit level (45 occupations)
to have a large enough number of observations in each occupation. This is particularly
important given our empirical approach where we run regressions of change in wages on
the base-period wage. Sampling error in wages generates a spurious negative relationship
between base-level wages and wage changes that can be quite large when wage percentiles
are imprecisely estimated.7
In principle, we could use a large number of wage percentiles wqjt in the empirical
analysis. But since wage percentiles are strongly correlated for small di¤erences in q,
we only extract the nine deciles of the within-occupation wage distribution, i.e. wqjt for
7The bias could be adjusted using a measurement-error corrected regression approach, as in Cardand Lemieux, 1996, or using an instrumental variables approach.
12

q = 10; 20; :::; 90. Finally, all the regression estimates are weighted by the number of
observations (weighted using the earnings weight from the CPS) in each occupation.
Figure 1 presented the raw data used in the analysis. The �gure simply plots the 405
observed changes in wages (9 observation for each of the 45 occupations) as a function of
the base wages. The most striking feature of Figure 1 is that wage changes exhibit the
well-known U-shaped pattern documented by Autor, Katz, and Kearney (2006). Broadly
speaking, the goal of the �rst part of the empirical analysis is to see whether the simple
linear model presented in equation (16) helps explain a substantial part of the variation
documented in Figure 1.
Table 1 shows the estimates from various versions of equation (16). We present two
measures of �t for each estimated model. First, we report the adjusted R-square of the
model. Note that even if the model in equation (16) was the true wage determination
model, the regressions would not explain all of the variation in the data because of the
residual sampling error in the estimated wage changes. The average sampling variance of
wage changes is 0.0002, which represents about 3 percent of the total variation in wage
changes by occupation and decile. This means that one cannot reject the null hypothesis
that sampling error is the only source of residual error (i.e. the model is �true�) whenever
the R-square exceeds 0.97.
The second measure of �t consists of looking at whether the model is able to explain
the U-shaped feature of the raw data presented in Figure 1. As a reference, the estimated
coe¢ cient on the quadratic term in the �tted (quadratic) regression reported in Figure 1
is equal to 0.124. For each estimated model, we run a simple regression of the regression
residuals on a linear and quadratic term in the base wage to see whether there is any
curvature left in the residuals that the model is unable to explain.
As a benchmark, we report in column 1 the estimates from a simple model where
the only explanatory variable is the base wage. This model explains essentially none of
the variation in the data as the R-square is only equal to 0.0029. This re�ects the fact
that running a linear regression on the data reported in Figure 1 essentially yields a �at
line. Since the linear regression cannot, by de�nition, explain any of the curvature of the
changes in wages, the curvature parameter in the residuals (0.0124) is exactly the same
as in the simple quadratic regression discussed above.
In column 2, we only include the set of occupation dummies (the eaj�s) in the regres-sion. The restriction imbedded in this model is that all the wage deciles within a given
occupation increase at the same rate, i.e. there is no change in within-occupation wage
dispersion. Just including the occupation dummies explain almost two thirds of the raw
13

variation in the data, and half of the curvature. The curvature parameter declines from
0.124 to 0.064 but remains strongly signi�cant.
Column 3 shows that only including decile dummies (the �q�s) explains none of the
variation or curvature in the data. This is a strong result as it indicates that using
a common within-occupation change in wage dispersion cannot account for any of the
observed change in wages. Interestingly, adding the decile dummies to the occupation
dummies (column 4) only marginally improves the �t of the model compared to the model
with occupation dummies in column 2. This indicates that within-occupation changes
in the wage distribution are highly occupation-speci�c, and cannot simply be linked to a
pervasive increase in returns to skill �à la�Juhn, Murphy and Pierce (1993).
By contrast, the �t of the model improves drastically once we introduce occupation-
speci�c slopes in column 5. The R-square of the model jumps to 0.9304, which is quite
close to the critical value for which we cannot reject the null hypothesis that the model
is correctly speci�ed, and that all the residual variation is due to sampling error. The
curvature parameter now drops to -0.002 and is no longer statistically signi�cant.
Replacing the decile dummies by a linear function in the �normits���1(q) does not
substantially a¤ect the �t of the model.8 This suggests that the decile dummies do not
capture much of the curvature in the data, but help �t the model with occupation speci�c
intercepts and slopes since the R-square drops more substantially once they are excluded
in column 7.The last column of the table (column 8) shows that just including the base
wage (not interacted with occupation dummies) leads to a very substantial drop in the
�t of the model. One main message for the table is, thus, that allowing for occupation
speci�c slopes is essential to any explanation of the data pattern reported in Figure 1.
Figures 2 and 3 report the estimated slopes and intercept from the model estimated
in column 7 of Table 1. Not surprisingly, the intercepts follow a U-shaped pattern similar
to the one shown in Figure 1. This is expected from the results in column 2 of Table
1, which indicate that about half of the curvature can be captured by including only
occupation dummies. More interestingly, Figure 3 shows that the slopes also exhibit,
to some extent, a U-shaped pattern. Generally speaking, the �gure indicates that high-
wage occupations experience a substantial increase in return to skill, while low-wage and,
especially, middle-wage occupations experienced a decline. This is consistent with the
model of Section 2 where the skills that used to be valuable in lower paid jobs are much
8One could also include the value of q instead of the normit ��1(q). However, if wages are distributedlog normal and the variance within occupation increases by the same in all occupations, this change willbe exactly captured by including a linear function in ��1(q). Empirically, a linear function function in��1(q) indeed �ts the data better than a linear function in q.
14

less valuable than they used to be, while the opposite is happening in high-wage jobs.
We explore this hypothesis more formally by estimating the regression models in
equations (18) and (19) that link the intercept and slopes of the occupation wage change
pro�les to the task content of occupations. The results are reported in Table 2. In the �rst
four columns of Table 2, we include all �ve task measures together in the regressions. In
the last four columns, we show the estimates from regressions in which each task measure
is entered separately.
To get a better sense of how these task measures vary across the occupation distribu-
tion, consider Appendix Figure 1, which plots the values of the task index as a function
of the average wage in the (3-digit) occupation. The �information content�and �decision
making�measures are strongly positively related to wages. Consistent with Autor, Levy
and Murnane (2003), the �automation�task follows an inverse U-shaped curve. To the
extent that technological change allows �rms to replace workers performing these types
of tasks with computer driven technologies, we would expect both the intercept and slope
of occupations with high degree of automation to decline over time.
But although occupations in the middle of the wage distribution may be most vul-
nerable to technological change, they also involve relatively more on-site work (e.g. re-
pairmen) and may, therefore, be less vulnerable to o¤shoring. The last measure of task,
face-to-face contact, is not as strongly related to average occupational wages as the other
task measures. On the one hand, we expect workers in occupations with a high level of
face-to-face contact to do relatively well in the presence of o¤shoring. On the other hand,
since many of these workers may have relatively low formal skills such as education (e.g.
retail sales workers), occupations with a high level of face-to-face contact may experience
declining relative wages if returns to more general forms of skills increase. To adjust for
the possible confounding e¤ect of overall changes in the return to skill, we also report
estimates that control for the base (median) wage level in the occupation.
The strongest and most robust result in Table 2 is that occupations with high level
of automation experience a relative decline in both the intercept and the slope of their
occupational wage pro�les. The e¤ect is statistically signi�cant in most speci�cations
reported in Table 2. As expected, the information content and on-site task measures
generally have a positive e¤ect on both the slope and the intercept. The results for the
two other task measures are not as clear. The e¤ect of face-to-face is quite sensitive to
the speci�cation used, while decision making has, surprisingly, a negative e¤ect in most
cases. Note however, that neither of these measures has a signi�cant e¤ect in the two
most general speci�cations (columns 2 and 4) where all �ve measures are included along
15

with the base wage.
We draw two main conclusions from Table 2. First, as predicted by the linear skill
pricing model of Section 2, the measures of task content of jobs tend to have a similar
impact on the intercept and the sloped of the occupational pro�les. Second, automa-
tion, information content and the on-site nature of jobs have the expected e¤ects on
the occupational wage pro�les, while the e¤ect of the two remaining task measures are
less precisely estimated. Taken together, this suggests that occupational characteristics
as measured by these �ve tasks can play a substantial role in explaining the U-shaped
feature of the raw data illustrated in Figure 1. More formally, the R-square of the re-
gressions indicate that the �ve task measures explain close to have of the variation in
intercepts and slopes across the 45 2-digit occupations. This suggest that occupational
characteristics, as measured by these task content measures, can go a long way towards
explaining changes in the wage distribution between 1983-85 and 2000-02.
5 Decomposition: Occupational Characteristics vs.
Other Factors
Although the analysis presented in Section 3 helps illustrate the mechanisms through
which occupations play a role in changes in the wage structure, it does not precisely
quantify the contribution of occupational factors for two reasons. First, the occupational
wage pro�les estimated above only describe changes in the within-occupation distribution
of wages. One needs to aggregate these wage pro�les to quantify the contribution of
occupational factors on the overall distribution of wages. Second, the estimates presented
above do not control for other factors such as education, experience, unionization, etc.
Since the estimates reported in Table 2 indicate that controlling for the base wage does
a¤ect the contribution of the task measures to changes in the intercepts and slopes, this
suggests that controlling for other factors may be important too.
In this section, we decompose changes in the distribution of wages between 1983-85
and 2000-02 into the contribution of occupational and other factors. We do so using
the recentered in�uence function (RIF) regression approach introduced by Firpo, Fortin,
and Lemieux (2009). As is well known, a standard regression can be used to perform
a Oaxaca-type decomposition for the mean of a distribution. RIF regressions allow us
to perform the same kind of decomposition for any distributional parameter, including
percentiles.
16

Firpo, Fortin, and Lemieux (2007), explain in detail how to perform these decomposi-
tions, and show how to compute the standard errors for each element of the distribution.
In this paper, we only provide a quick summary of how the decomposition method works.
For more detail, see Firpo, Fortin, and Lemieux (2007).
5.1 Decomposing Changes in Distributions Using RIF Regres-
sions
In general, any distributional parameter can be written as a functional �(FY ) of the cu-
mulative distribution of wages, FY (Y ).9 Examples include wage percentiles, the variance
of log wage, the Gini coe¢ cient, etc. The �rst part of the decomposition consists of
dividing the overall change in a given distributional parameter into a composition e¤ect
linked to changes in the distribution of the covariates, X, and a wage structure e¤ect
that re�ects how the conditional distribution of wage F (Y jX) changes over time. In astandard Oaxaca decomposition, the wage structure e¤ect only depends on changes in
the conditional mean of wages, E(Y jX). More generally, however, the wage structuree¤ect depends on the whole conditional wage distribution.
It is helpful to discuss the decomposition problem using the potential outcomes frame-
work. We focus on di¤erences in the wage distributions for two time periods, 1 and 0.
For a worker i, let Y1i be the wage that would be paid in period 1, and Y0i the wage that
would be paid in period 0. Since a given individual i is only observed in one of the two
periods, we either observe Y1i or Y0i, but never both. Therefore, for each i we can de�ne
the observed wage, Yi, as Yi = Y1i � Di + Y0i � (1�Di), where Di = 1 if individual i is
observed in period 1, and Di = 0 if individual i is observed in period 0. There is also a
vector of covariates X 2 X � RK that we can observe in both periods.Consider ��
O, the overall change over time in the distributional statistic �. We have
��O = �
�FY1jD=1
�� �
�FY0jD=0
�=
��FY1jD=1
�� �
�FY0jD=1
�| {z }��S
+��FY0jD=1
�� �
�FY0jD=0
�| {z }��X
:
��S is the wage structure e¤ect, while �
�X is the composition e¤ect. Key to this
decomposition is the counterfactual distributional statistics ��FY0jD=1
�. This represents
9In this section, we denote the wage using Y instead of W to be consistent with Firpo, Fortin, andLemieux (2007) and the program evaluation literature.
17

the distributional statistic that would have prevailed if workers observed in the end period
(D = 1) had been paid under the wage structure of period 0.
Estimating that counterfactual distribution is a well known problem. For instance,
DiNardo, Fortin and Lemieux (1996) suggest estimating this counterfactual by reweight-
ing the period 0 data to have the same distribution of covariates as in period 1. We follow
the same approach here, since Firpo, Fortin and Lemieux (2007) show that reweighting
provides a consistent nonparametric estimate of the counterfactual under the ignorability
assumption.
However, the main goal of this paper is to separate the contribution of di¤erent subsets
of covariates to ��O , �
�S , and �
�X . As is well known, this is easily done in the case of
the mean where each component of the above decomposition can be written in terms of
the regression coe¢ cients and the mean of the covariates. For example, in the case of
the mean, ��FY1jD=1
�is just the mean of wages in period 1, and can be written as
��FY1jD=1
�= E(Y1jD = 1) = E [XjD = 1]| �1;
where �1 is the vector or coe¢ cient from a standard wage regression in period 1. The
contributions of each covariate to the wage structure and composition e¤ect are simply
��S = E [XjD = 1]
| (�1 � �0);
and
��X = (E [XjD = 1]� E [XjD = 0])|�0:
For distributional statistics besides the mean, Firpo, Fortin, and Lemieux (2009)
suggest estimating the same of regression where the usual outcome variable, Y , is replaced
by the recentered in�uence function RIF(y; �). The recentering consists of adding back
the distributional statistic � to the in�uence function IF(y; �):
RIF(y; �) = � + IF(y; �):
Note that in the case of the mean where the in�uence function is IF(y;�) = y��, wehave RIF(y;�) = �+(y��) = y. Since the RIF is simply the outcome variable y, the RIFregression corresponds to a standard wage regression, as in the Oaxaca decomposition.
It is also possible to compute the in�uence function for any other distributional statis-
tics. Of particular interest is the case of quantiles. The � -th quantile of the distribution
F is de�ned as the functional, Q(F; �) = inffyjF (y) � �g, or as q� for short. Its in�uence
18

function is:
IF(y; q� ) =� � 1I fy � q�g
fY (q� ): (20)
The recentered in�uence function of the � th quantile is RIF(y; q� ) = q� + IF(y; q� ). Con-
sider � , the estimated coe¢ cients from a regression of RIF(y; �) on X. By analogy with
the Oaxaca decomposition, the wage structure and composition e¤ects can be written as:
��S = E [XjD = 1]
| ( �1 � �0);
and
��X = (E [XjD = 1]� E [XjD = 0])| �0:
This particular distribution is very easy to compute since it is similar to a standard
Oaxaca decomposition. Firpo, Fortin and Lemieux (2007) point out, however, that there
may be a bias in the decomposition because the linear speci�cation used in the regression
is only a local approximation that does not generally hold for larger changes in the
covariates. A related point was made by Barsky et al. (2002) in the context of the Oaxaca
decomposition for the mean. These authors point out that when the true conditional
expectation is not linear, the decomposition based on a linear regression will be biased.
Barsky et al. (2002) suggest using a reweighting procedure instead, though this is not
fully applicable here since we also want to estimate the contribution of each individual
covariate.
Firpo, Fortin and Lemieux (2007) suggest a solution to this problem based on an
hybrid approach that involves both reweighting and RIF regressions. They show that
the following decomposition is valid:
��S = E [XjD = 1]
| ( �1 � �01); (21)
and
��X = (E [XjD = 1]� E [XjD = 0])| �0 +R� ; (22)
where �01 are the coe¢ cients from a RIF regression on the period 0 sample reweighted to
have the same distribution of covariates as in period 1. The idea is that since a regression
is the best linear approximation for a given distribution of X, this approximation may
change when the distribution of X changes even if the wage structure remains the same.
For example, if the true relationship between Y and a single X is convex, the linear
regression coe¢ cient will increase when we shift the distribution of X up, even if the true
19

(convex) wage structure remained unchanged.
Back to our problem, this means that �1 and �0 may be di¤erent just because they are
estimated for di¤erent distributions of X even if the wage structure remains unchanged
over time. Since reweighting adjusts for this problem, we know for sure that �1 � �01re�ects a true change in the wage structure. This is the reason why using �1 � �01 forthe decomposition yields a pure wage structure e¤ect, while using �1 � �0 instead wouldnot.
Finally, in the case of the composition e¤ect, the remainder or approximation error
term R� is equal to the di¤erence between the composition e¤ect that would be consis-
tently estimated using the reweighting approach, and the composition e¤ect estimated
using the regression-based linear approximation.
5.2 Results: RIF Regressions
Before showing the decomposition results, we �rst present some estimates from the RIF-
regressions for the di¤erent wage quantiles, and for the variance of log wages and the Gini
coe¢ cient.10 For wage percentiles, we compute IF(yi; q� ) for each observation using the
sample estimate of q� , and the kernel density estimate of f (q� ) using the Epanechnikov
kernel and a bandwidth of 0.06. In addition to the reweighting factors discussed above,
we also use CPS sample weights throughout the empirical analysis. In practice, this
means that we multiply the relevant reweighting factor with CPS sample weight.
The list of covariates included in the regressions re�ect the di¤erent explanations
that have been suggested for the changes in the wage distribution over our sample pe-
riod. Lemieux (2008) reviews possible explanations for the increased polarization in the
labor market, including the technological-based explanation of Autor, Katz and Kearney.
Furthermore, since it is well known that education wage di¤erentials kept expanding af-
ter the late 1980s, the contribution of education to the wage structure e¤ect is another
leading explanation for inequality changes over this period.
Existing studies also indicate that composition e¤ects played an important role over
the 1988-2005 period. Lemieux (2006b) shows that all the growth in residual inequality
over this period is due to composition e¤ects linked to the fact that the workforce became
older and more educated, two factors associated with more wage dispersion. Further-
more, Lemieux (2008) argues that de-unionization, another composition e¤ect the way
10Firpo, Fortin, and Lemieux (2007) show the formula for the in�uence function in the case of thevariance and the Gini coe¢ cient.
20

it is de�ned in this paper, contributed to the changes in the wage distribution over this
period.
These various explanations can all be categorized in terms of the respective contri-
butions of various sets of factors (occupational characteristics, unions, education, experi-
ence, etc.) to either wage structure or composition e¤ects. This makes the decomposition
method proposed in this paper ideally suited for estimating the contribution of each of
these possible explanations to changes in the wage distribution. Applying our method
to this issue �lls an important gap in the literature, since no existing study has system-
atically attempted to estimate the contribution of each of the aforementioned factors to
recent changes in the U.S. wage distribution.
As discussed above, our empirical analysis is based on data for men from the 1983-85
and 2000-02 ORG CPS. In light of the above discussion, the key set of covariates on which
we focus are education (six education groups), potential experience (nine groups), union
coverage, and the �ve measures of occupational task requirements discussed earlier. We
also include controls for marital status and race in all the estimated models. The sample
means for all these variables are provided in Table A1.
The RIF-regression coe¢ cients for the 10th, 50th, and 90th quantiles in 1988-90 and
2003-05, along with their (robust) standard errors are reported in Table 3. The RIF-
regression coe¢ cients for the variance and the Gini are reported in Table 4. We also report
in Figure 4 the estimated coe¢ cients from RIF-regressions for 19 di¤erent wage quantiles
(from the 5th to the 95th quantile) equally spread over the whole wage distribution. This
enables us to see whether di¤erent factors have di¤erent impacts at di¤erent points of
the wage distribution. Using this �exible approach, as opposed to summary measures
of inequality like the Gini coe¢ cient or the variance of log wages, is important since
wage dispersion changes very di¤erently at di¤erent points of the distribution during this
period.
Both Table 3 and the �rst panel of Figure 4 show that the e¤ect of the union status
across the di¤erent quantiles is highly non-monotonic. In both 1983-85 and 2000-2002,
the e¤ect �rst increases up to around the median, and then declines. The union e¤ect
even turns negative for the 90th and 95th quantiles. Overall, unions tend to reduce wage
inequality, since the wage e¤ect tends to be larger for lower than higher quantiles of the
wage distribution. As shown by the RIF-regressions for the more global measures of
inequality �the variance of log wages and the Gini coe¢ cient�displayed in Table 4, the
e¤ect of unions on these measures is negative, although the magnitude of that e¤ect has
decreased over time. This is consistent with the well-known result (e.g. Freeman, 1980)
21

that unions tend to reduce the variance of log wages for men.
More importantly, the results also indicate that unions increase inequality in the
lower end of the distribution, but decrease inequality even more in the higher end of
the distribution. For example, the estimates in Table 3 for 1983-85 imply that a 10
percent increase in the unionization rate would increase the 50-10 gap by 0.020, but
decrease the 90-50 gap by 0.046.11 As we will see later in the decomposition results, this
means that the continuing decline in the rate of unionization can account for some of the
�polarization�of the labor market (decrease in inequality at the low-end, but increase in
inequality at the top end).
The results for unions also illustrate an important feature of RIF regressions for
quantiles, namely that they capture the e¤ect of covariates on both between- and within-
group component of wage dispersion. The between-group e¤ect dominates at the bottom
end of the distribution, which explains why unions tend to increase inequality in that
part of the distribution. The opposite happens, however, in the upper end of the wage
distribution where the within-group e¤ect dominates the between-group e¤ect.
As in the case of unions, the RIF-regression estimates in Table 3 for other covariates
also capture between- and within-group e¤ects. Consider, for instance, the case of college
education. Table 3 and Figure 4 show that the e¤ect of college increases monotonically
as a function of percentiles. In other words, increasing the fraction of the workforce with
a college degree has a larger impact on higher than lower quantiles. The reason why the
e¤ect is monotonic is that education increases both the level and the dispersion of wages
(e.g. Lemieux, 2006a). As a result, both the within- and between-group e¤ects go in the
same direction of increasing inequality. Similarly, the e¤ect of experience also tends to
be monotonic as experience has a positive impact on both the level and the dispersion
of wages.
Another clear pattern that emerges in Figure 4 is that, for most inequality enhancing
covariates, i.e. those with a positively sloped curve, the inequality enhancing e¤ect
increases over time. In particular, the slopes for high levels of education (college graduates
and post-graduates) become clearly steeper over time. This suggests that these covariates
make a positive contribution to the wage structure e¤ect.
The results for the �ve measures of occupational task requirements are broadly con-
sistent with the predictions of the technological change and o¤shoring literature. While
11These numbers are obtained by multiplying the change in the unionization rate (0.1) by the di¤erencebetween the e¤ects at the 50th and 10th quantiles (0.406-0.208=0.198), and at the 90th and 50th quantiles(�0.055-0.406=-0.461).
22

the pattern of results in a given period are fairly non-linear and often hard to interpret,
changes over time suggest an important role for these factors in changes in the distribu-
tion of wages. First consider the case of the information requirement of jobs. As in the
case of unions, Figure 4 shows that this factor has an inverse U-shaped impact across
the di¤erent percentiles of the wage distribution. More interestingly, the e¤ect on wages
declines in the lower middle of the distribution, but increase in the upper middle of the
distribution. This may re�ect the fact that this measure captures heterogenous tasks
at di¤erent points of the distribution. For instance, we both use the O*Net scores on
�processing information�and �analyzing data or information�to construct the informa-
tion content measure. One possible explanation for the results is that workers processing
information tend to earn lower wages and have experienced a decline in wages as their
tasks are easier to execute with computers instead. By contrast, workers analyzing infor-
mation may be earning higher wages, and have fared relatively well since the tasks they
performed are complementary to computer technologies.
Changes over time in the wage e¤ect of the second occupational task content measure,
automation, indicate a large negative impact in the middle of the wage distribution, with
a much smaller impact at the two ends of the distribution. This is consistent with Autor,
Levy and Murnane (2003) who show that workers in the middle of the distribution are
more likely to experience negative wage changes as the �routine� tasks they used to
perform can now be executed by computer driven technologies instead.
Turning to the task measures linked to o¤shoring, Figure 4 shows that while jobs that
involve no face-to-face contact tend to pay more than jobs that do involve face-to-face
contact, this positive e¤ect has declined substantially in the lower middle part of the wage
distribution. This is consistent with the view that lower skill jobs that do not involve face-
to-face contacts can be o¤shored, which has a negative impact on the wages of workers
performing these kinds of tasks domestically. Similarly, the wage impact linked to jobs
that do not involve on-site work has declined at the lower end of the wage distribution.
Finally it is hard to discern any systematic pattern in the case of the decision-making
measure. Jobs with no decision-making involved pay less at all points of the distribution,
but the e¤ect has not changed very much over time.
5.3 Decomposition Results
The results of the decomposition are presented in Figures 5-7. Table 5 also summarizes
the results for the standard measure of top-end (90-50 gap) and low-end (50-10) wage
23

inequality, as well as for the variance of log wages and the Gini coe¢ cient. Note that the
base group used in the RIF-regression models consists of non-union, white, and married
men with a high school degree, 15 to 19 years of potential experience, and occupational
task measures at one standard deviation below their sample averages. The covariates
used in the RIF-regression models are those discussed above and listed in Table A1. A
richer speci�cation with additional interaction terms is used to estimate the logit models
used compute the reweighting factor.12
As is well known (e.g. Oaxaca and Ransom, 1999), the detailed wage structure part
of the decomposition (equation (21)) depends arbitrarily on the choice of the base group.
This problem has mostly been discussed in the case of categorical variables, but it also
applies in the case of continuous variables such as our task content measures.
To see this, consider eX, the �raw�variable, and XB, the value of eX chosen to be
the base group. The base group is implicitly included in the regression model by using
X = eX �XB, the recentered version of eX, as a regressor. While XB is often set to zero,
we have in general that:
��S = E [XjD = 1]| ( �1 � �01)=
�Eh eXjD = 1i�XB
�|( �1 � �01)�
Eh eXjD = 1i�XB
�| �1 �
�Eh eXjD = 1i�XB
�| �01:
The last line of the equation shows that the wage structure e¤ect is the di¤erence in the
�treatment e¤ect�of switching eX from its base group value to its mean value under the
wage structure parameters of period 1 ( �1) and 0 ( �01), respectively. Since the treatment
e¤ect obviously depends on the magnitude of the change in X (Eh eXjD = 1i�XB), the
wage structure e¤ect also depends in an arbitrary way on the choice of XB.
In the case of each task measure, we normalize the variable such that Eh eXjD = 1i�
XB is equal to one standard deviation of the raw measure. The interpretation of the wage
structure e¤ect for each of these measures is thus the extent to which the wage impact
of a one standard deviation increase in the measure has changed over time. But while
the sign of the wage structure e¤ect does not depend on the size of the increase in the X
variable considered (one standard deviation), its magnitude does depend arbitrarily on
this choice. The results presented below should, therefore, be interpreted with caution.
Figure 5a shows the overall change in (real log) wages at each percentile � , (��O), and
12The logit speci�cation also includes a full set of interaction between experience and education, unionstatus and education, union status and experience, and education and occupation task measures.
24

decomposes this overall change into a composition (��X) and wage structure (�
�S) e¤ect
using the reweighting procedure. Consistent with Autor, Katz and Kearney (2006), the
overall change is U-shaped as wage dispersion increases in the top-end of the distribution,
but declines in the lower end. This stands in sharp contrast with the situation that
prevailed in the early 1980s when the corresponding curve was positively sloped as wage
dispersion increased at all points of the distribution (Juhn, Murphy, and Pierce, 1993).
Most summary measures of inequality such as the variance or the 90-10 gap nonetheless
increase over the 1983-2002 period as wage gains in the top-end of the distribution exceed
those at the low-end. In other words, though the curve for overall wage changes is U-
shaped, its slope is positive, on average, suggesting that inequality generally goes up.
Figure 5a also shows that, consistent with Lemieux (2006b), composition e¤ects have
contributed to a substantial increase in inequality. In fact, once composition e¤ects
are accounted for, the remaining wage structure e¤ects follow a �purer�U-shape than
overall changes in wages. The lowest wage changes are now right in the middle of the
distribution (from the 30th to the 70th percentile), while wage gains at the top and low
end are quantitatively similar. Accordingly, Table 5 shows that all of the 0.062 change
in the 90-10 gap is explained by the composition e¤ects. By the same token, however,
composition e¤ects cannot account at all for the U-shaped nature of wage changes.
Figure 6 moves to the next step of the decomposition using RIF-regressions to at-
tribute the contribution of each set of covariates to the composition e¤ect. Figure 7 does
the same for the wage structure e¤ect. Figure 6a compares the �total�composition e¤ect
obtained by reweighting that was reported in Figure 5a, ��X , to the composition e¤ect
explained using the RIF-regressions, [E [XjD = 1]| � E [XjD = 0]]| � �0. The di¤erencebetween the two curves is the speci�cation (approximation) error R� . The error term is
generally quite small and does not exhibit much of a systematic pattern. This means
that the RIF-regression model does a very good job at tracking down the composition
e¤ect estimated consistently using the reweighting procedure.
Figure 6b then divides the composition e¤ect (explained by the RIF-regressions) into
the contribution of �ve main sets of factors.13 To simplify the discussion, let�s focus
on the impact of each factor in the lower and upper part of the distribution that is
summarized in terms of the 50-10 and 90-50 gaps in Table 5. With the notable exception
of unions, all factors have a larger impact on the 50-10 than on the 90-50 gap. The total
13The e¤ect of each set of factors is obtained by summing up the contribution of the relevant covariates.For example, the e¤ect for �education� is the sum of the e¤ect of each of the �ve education categoriesshown in Table 1. Showing the e¤ect of each individual dummy separately would be cumbersome andharder to interpret.
25

contribution of all factors other than unionization is 0.041 and -0.008 for the 50-10 and
90-50 gaps, respectively. Composition e¤ects linked to factors other than unions thus go
the �wrong way�in the sense that they account for rising inequality at the bottom end
while inequality is actually rising at the top end, a point noted earlier by Autor, Katz,
and Kearney (2008).
In contrast, composition e¤ects linked to unions (the impact of de-unionization) re-
duce inequality at the low end (e¤ect of -0.016 on the 50-10) but increases inequality at
the top end (e¤ect of 0.038 on the 90-50). Note that, as in an Oaxaca decomposition,
these e¤ects on the 50-10 and the 90-50 gap can be obtained directly by multiplying the
8.2 percent decline in the unionization rate (Table A1) by the relevant union e¤ects in
1988-90 shown in Table 4. The e¤ect of de-unionization accounts for 19 percent of the
total change in the 50-10 gap, and 26 percent of the change in the 90-50 gap. The mag-
nitude of these estimates is comparable to the relative contribution of de-unionization
to the growth in inequality estimated for the 1980s (see Freeman, 1993, Card, 1992, and
DiNardo, Fortin and Lemieux, 1996).
Figure 7a divides the wage structure e¤ect, ��S, into the part explained by the RIF-
regression models,MXk=2
E�XkjD = 1
��� �1;k � �01;k
�, and the residual change �1;1 � �01;1
(the change in the intercepts). The contribution of each set of factors is then shown in
Figure 7b. As in the case of the composition e¤ects, it is easier to discuss the results by
focusing on the 90-50 and 50-10 gaps presented in Table 5. The results �rst show that -
0.051 of the -0.129 change (decline) in the 50-10 gap due to wage structure e¤ects remains
unexplained. By contrast, covariates account for all of the 0.108 change in the 90-50 gap
linked to the wage structure and even more, as the residual term is now negative. Taken
at face value, the results suggest a substantial decline in residual wage inequality at all
points of the distribution. This �nding may re�ect, however, the peculiarities of the base
group (see the discussion above).
Switching to the contribution of the di¤erent covariates, Table 5 shows that changes
in the wage structure linked to education play a substantial role at the top end of the
distribution, but do not have much impact at the lower end. These �ndings con�rm
Lemieux (2006a)�s conjecture that the large increase in the return to post-secondary
education has contributed to a convexi�cation of the wage distribution. Changes in the
wage structure linked to experience go in the other direction, re�ecting the fact that
returns to experience have declined since the mid-1980s.
More importantly, the results show that changes in the wage structure linked to the
26

technology and o¤shoring task measures have contributed to the U-shape change in the
wage distribution over this period. Table 5 shows that both factors make a large and
positive contribution to the increase in the 90-50 gap, and a sizable contribution to the
decline in the 50-10 gap. Taken literally, the results suggest that these two factors can
essentially account for all of the change in the 90-50 and 50-10 wage gap. This can also
be seen in Figure 7b where the wage structure e¤ects linked to technology and o¤shoring
both follow a distinct U-shaped shape that closely mirror the shape of the overall change
in the wage distribution (Figure 5a). For the reasons mentioned above, however, the
precise magnitude of the estimated e¤ect is di¢ cult to interpret because of the base
group problem.
A number of interesting conclusions emerge, nonetheless, from the detailed wage
decompositions. First, consistent with earlier studies, the composition e¤ect linked to
de-unionization accounts for about a fourth of the change in inequality both at the
lower (50-10) and upper (90-50) end of the distribution. Second, the changing wage
structure e¤ects linked to unionization, education, and the occupational task measures
of technology and o¤shoring all help explain the U-shaped feature of the changing wage
distribution. Overall the results suggest that factors linked to occupation help explain
some, but certainly not all, of the changes in the wage distribution observed between
1983-85 and 2000-02.
6 Conclusion
In this paper, we look at the contribution of occupations to changes in the distribution of
wages. We �rst present a simple linear skill pricing model, and use this as a motivation
for estimating models for the change in within-occupation wage percentiles between 1983-
85 and 2000-02. The �ndings from this �rst part of the empirical analysis suggest that
changes in occupational wage pro�les help explain the U-shaped of changes in the wage
distribution over this period. We also �nd that measures of technological change and
o¤shoring at the occupation level help predict the changes in the occupational wage
pro�les.
We then explicitly quantify the contribution of these factors (technological change
and o¤shoring) to changes in wage inequality relative to other explanations such as
de-unionization and changes in the returns to education. We do so using a decompo-
sition based on the in�uence function regression approach suggested by Firpo, Fortin,
and Lemieux (2009). The results indicate that technological change and o¤shoring are
27

two among a variety of other factors that can account for the observed changes in the
distribution of wages.
One drawback of our decomposition exercise is that quantifying the contribution of
technological change, o¤shoring, or any another factor to changes in the wage structure
is di¢ cult because of the well known base-group problem (Oaxaca and Ransom, 1999).
Another limitation of our analysis is that we do not control for other factors (education,
etc.) in the �rst part of the analysis where we estimate changes in occupational wage
pro�les. We plan to address these two issues in more detail in future work.
REFERENCES
Autor, D.H., Katz, L.F. and M.S. Kearney (2005), �Trends in U.S. Wage Inequal-
ity: Revising the Revisionists,�Review of Economics and Statistics, May 2008
Autor, D.H., Katz, L.F. and M.S. Kearney (2006), �The Polarization of the U.S.
Labor Market,�American Economic Review 96, 189�194.
Autor, D.H., F. Levy, and R.J. Murnane (2003), �The Skill Content Of Re-
cent Technological Change: An Empirical Exploration�, Quarterly Journal of Eco-
nomics, 118(4) 1279-1333.
Barsky, R., J. Bound, K. Charles, and J. Lupton (2002), �Accounting for the
Black-White Wealth Gap: A Nonparametric Approach,�Journal of the American
Statistical Association, 97(459), 663-673.
Blinder, A., (2007) �How Many U.S. Jobs Might Be O¤shorable?,�Center for Eco-
nomic Policy Studies Working Discussion Paper no. 142, Princeton University.
Bound, J., and G. Johnson (1992), �Changes in the Structure of Wages in the
1980s: An Evaluation of Alternative Explanations,�American Economic Review
82(3): 371-92
Card, D. (1992) �The E¤ects of Unions on the Distribution of Wages: Redistribution
or Relabelling?�NBER Working Paper 4195, Cambridge: Mass.: National Bureau
of Economic Research, 1992.
Crinò, R. (2009) �Service O¤shoring and White-Collar Employment,�UFAE and IAE
Working Papers.
28

DiNardo, J., N.M. Fortin, and T. Lemieux, (1996), �Labor Market Institutions
and the Distribution of Wages, 1973-1992: A Semiparametric Approach,�Econo-
metrica, 64, 1001-1044.
Firpo, S. Fortin, N.M., and T. Lemieux (2007) �Decomposing Distribution Using
Recentered In�uence Fucntion Regressions,� Unpublished manuscript, PUC-Rio
and UBC
Firpo, S. Fortin, N.M., and T. Lemieux (2009) �Unconditional Quantile Regres-
sions,�Econometrica 77(3), May, 953-973.
Feenstra, R, and G. Hanson (2003), �Global Production Sharing and Inequal-
ity: A Survey of Trade and Wages,� in: Choi EK, Harrigan J (eds) Handbook of
International Trade, Blackwell, Malden Oxford Victoria, 146-185.
Freeman, R.B. (1980), �Unionism and the Dispersion of Wages,�Industrial and Labor
Relations Review, 34, 3-23.
Freeman, R.B.. (1993), �How Much has Deunionization Contributed to the Rise of
Male Earnings Inequality?�In Sheldon Danziger and Peter Gottschalk, eds. Uneven
Tides: Rising Income Inequality in America. New York: Russell Sage Foundation,
133-63.
Freeman, R.B.. (1995), �Are Your Wages Set in Beijing?� Journal of Economic
Perspectives, 9(3), 15-32.
Gabaix, X., and A. Landier (2008) �Why Has CEO Pay Increased So Much?�
Quarterly Journal of Economics 123(1), February, 49-100.
Goos, Maarten and Alan Manning (2007) �Lousy and Lovely Jobs: The Rising
Polarization of Work in Britain�, Review of Economics and Statistics, 89(1), 118-
133
Goos, Maarten, Alan Manning, and Anna Salomons (2009) �Recent Changes
in the European Employment Structure: The Roles of Technological Change, Glob-
alization and Institutions,�unpublished manauscript.
Heckman, J., and J. Scheinkman (1987), �The Importance of Bundling in a Gorman-
Lancaster Model of Earnings,�Review of Economic Studies, 54(2), 243-55.
29

Jensen, J. Braford and Lori G. Kletzer, (2007) �Measuring the Task Content of
O¤shorable Services Jobs, Tradable Services and Job Loss,�Peterson Institute for
International Economics (shorter version forthcoming in Labor in the New Econ-
omy, Katharine Abraham, Mike Harper, and James Spletzer, eds., University of
Chicago Press.)
Juhn, C., K. Murphy, and B. Pierce, (1993), �Wage Inequality and the Rise in
Returns to Skill,�The Journal of Political Economy, 101, 410-442.
Kaplan, S.N., and J. Rauh (2009) �Wall Street and Main Street: What Contributes
to the Rise in the Highest Incomes?�Review of Financial Studies.
Lemieux, T., (2006a), �Post-secondary Education and Increasing Wage Inequality�,
American Economic Review 96(2), 195-199.
Lemieux, T., (2006b),�Increasing Residual Wage Inequality: Composition E¤ects,
Noisy Data, or Rising Demand for Skill?�, American Economic Review 96(3), 461-
498.
Lemieux, T., (2008), �The Changing Nature of Wage Inequality�, Journal of Popula-
tion Economics 21(1), January 2008, 21-48.
Murphy, K.M., and F. Welch (1991) �The role of international trade in wage
di¤erentials,�in M. Kosters (ed.) Workers and Their Wages, American Enterprise
Institute Press, Washington DC, 39-69.
Oaxaca, R. and M.R. Ransom (1999), �Identi�cation in Detailed Wage Decompo-
sitions,�Review of Economics and Statistics 81(1), 154�157.
Welch, F. (1969) �Linear Synthesis of Skill Distribution,� The Journal of Human
Resources, 4(3), Summer, 311-327 .
30

Tabl
e 1:
Reg
ress
ion
fit o
f mod
els
for 1
983-
85 to
200
0-02
cha
nges
in w
ages
at e
ach
deci
le,
by
2-di
git o
ccup
atio
n
(1)
(2)
(3)
(4)
(5)
(6)
(7)
(8)
Occ
upat
ion
dum
mie
s
X
X
X
X
X
X
Dec
ile d
umm
ies
X
X
X
X
N
orm
it (li
near
)
X
Ba
se w
age
X
X X
X
X
O
cc *
bas
e w
age
X
X
X
R-s
quar
e 0.
0029
0.
6347
0.
0079
0.
6580
0.
9304
0.
9173
0.
8492
0.
7038
C
urva
ture
0.
124
0.06
4 0.
113
0.05
3 -0
.002
0.
012
0.01
4 0.
065
in re
sidu
als
(0.0
13)
(0.0
07)
(0.0
13)
(0.0
07)
(0.0
03)
(0.0
04)
(0.0
05)
(0.0
06)
Not
es: R
egre
ssio
n m
odel
s es
timat
ed fo
r eac
h de
cile
(10t
h, 2
0th,
�, 9
0th)
of e
ach
2-di
git o
ccup
atio
n.
405
obs
erva
tions
use
d in
all
mod
els
(45
occu
patio
ns, 9
obs
erva
tions
per
occ
upat
ion)
. All
mod
els
are
wei
ghte
d us
ing
the
fract
ion
of o
bser
vatio
ns in
the
2-di
git o
ccup
atio
n in
the
base
per
iod.
The
"nor
mits
" a
re th
e in
vers
e of
the
cum
ulat
ive
norm
al d
istri
butio
n at
eac
h pe
rcen
tile
(.1, .
2,�
,.9).

Ta
ble
2: E
stim
ated
Effe
ct o
f Tas
k R
equi
rem
ents
on
Inte
rcep
t and
Slo
pe o
f Wag
e
Cha
nge
Reg
ress
ions
by
2-di
git O
ccup
atio
n
Task
s in
clud
ed to
geth
er
Ta
sks
incl
uded
sep
arat
ely
In
terc
ept
S
lope
Inte
rcep
t
Slo
pe
(1
) (2
)
(3)
(4)
(5
) (6
)
(7)
(8)
Info
rmat
ion
cont
ent
0.01
0 0.
027
0.
015
0.01
0
0.01
7 0.
040
0.
046
0.03
0
(0.0
12)
(0.0
11)
(0
.017
)(0
.018
)
(0.0
08)
(0.0
12)
(0
.010
)(0
.015
)
A
utom
atio
n -0
.035
-0
.043
-0.0
25
-0.0
23
-0
.046
-0
.056
-0.0
55
-0.0
36
(0
.013
) (0
.011
)
(0.0
17)
(0.0
18)
(0
.009
) (0
.010
)
(0.0
15)
(0.0
15)
On-
site
job
-0.0
01
0.00
1
0.02
4 0.
024
0.
017
0.01
9
0.03
1 0.
024
(0
.007
) (0
.006
)
(0.0
09)
(0.0
09)
(0
.005
) (0
.005
)
(0.0
07)
(0.0
06)
Face
-to-F
ace
-0.0
40
-0.0
13
0.
044
0.03
7
-0.0
52
-0.0
57
-0
.043
-0
.024
(0.0
17)
(0.0
16)
(0
.023
)(0
.026
)
(0.0
11)
(0.0
12)
(0
.019
)(0
.017
)
D
ecis
ion
mak
ing
-0.0
25
-0.0
08
-0
.032
-0
.025
-0.0
25
-0.0
55
-0
.053
-0
.020
(0.0
18)
(0.0
18)
(0
.025
) (0
.029
)
(0.0
11)
(0.0
15)
(0
.015
)(0
.021
)
B
ase
wag
e no
ye
s
no
yes
no
ye
s
no
yes
R-s
quar
e 0.
40
0.55
0.45
0.
44
--
- --
-
---
---

Table 3. Unconditional Quantile Regression Coefficients on Log Wages
Years: 1983/85 2000/02Quantiles: 10 50 90 10 50 90
Explanatory VariablesUnion covered 0.208 0.406 -0.055 0.112 0.278 -0.073
(0.003) (0.004) (0.004) (0.003) (0.005) (0.006)Non-white -0.090 -0.140 -0.055 -0.040 -0.131 -0.071
(0.006) (0.004) (0.004) (0.006) (0.004) (0.006)Non-Married -0.162 -0.122 -0.015 -0.072 -0.111 -0.066
(0.004) (0.004) (0.004) (0.004) (0.004) (0.005)Education ( High School omitted) Primary -0.278 -0.392 -0.156 -0.390 -0.378 -0.070
(0.008) (0.007) (0.004) 0.012 (0.009) (0.005) Some HS -0.301 -0.146 -0.023 -0.396 -0.188 0.034
(0.007) (0.004) (0.004) (0.01) (0.005) (0.004) Some College 0.045 0.129 0.086 0.031 0.118 0.053
(0.005) (0.005) (0.004) (0.004) (0.004) (0.004) College 0.142 0.316 0.375 0.102 0.386 0.561
(0.004) (0.006) (0.007) (0.004) (0.005) (0.011) Post-grad 0.088 0.337 0.559 0.066 0.403 1.025
(0.005) (0.006) (0.011) (0.004) (0.006) (0.018)Potential Experience (15< Experience < 20 omitted)Experience <5 -0.512 -0.549 -0.339 -0.427 -0.441 -0.254
(0.009) (0.007) (0.007) (0.008) (0.007) (0.009)5< Experience < 10 -0.073 -0.318 -0.295 -0.080 -0.257 -0.265
(0.005) (0.007) (0.008) (0.005) (0.007) (0.01)10< Experience < 15 -0.032 -0.157 -0.199 -0.029 -0.127 -0.136
(0.004) (0.005) (0.008) (0.005) (0.006) (0.01)20< Experience < 25 -0.022 -0.054 -0.074 -0.012 -0.048 -0.017
(0.005) (0.006) (0.008) (0.005) (0.005) (0.011)25< Experience < 30 -(0.005) (0.028) (0.048) (0.) (0.012) (0.006)
(0.005) (0.006) (0.01) (0.004) (0.005) (0.01)30< Experience < 35 0.002 0.034 0.055 0.001 0.015 0.021
(0.005) (0.006) (0.009) (0.005) (0.006) (0.01)35< Experience < 40 0.017 0.031 0.056 0.005 0.003 0.037
(0.005) (0.008) (0.009) (0.005) (0.007) (0.012)Experience > 40 0.055 0.011 -0.025 -0.002 -0.031 -0.029
(0.006) (0.007) (0.008) (0.008) (0.008) (0.012)O*NET MeasuresInformation Content 0.048 0.072 0.015 0.038 0.061 0.030
(0.002) (0.002) (0.002) (0.002) (0.002) (0.003)Automation 0.021 -0.025 -0.047 0.009 -0.053 -0.035
(0.002) (0.002) (0.002) (0.002) (0.002) (0.003)No Face-to-Face 0.109 0.132 0.121 0.083 0.110 0.107
(0.003) (0.002) (0.003) (0.002) (0.002) (0.004)Non On-Site Job -0.007 0.021 0.037 -0.016 0.014 0.051
(0.001) (0.001) (0.001) (0.001) (0.001) (0.001)No Decision-Making -0.123 -0.127 -0.125 -0.109 -0.135 -0.118
(0.003) (0.003) (0.003) (0.003) (0.003) (0.004)Number of obs. 274,625 252,397
Note: Boostrapped standard errors (100 reps) are in parentheses.

Table 4. RIF Regression of Inequality Measures on Log Wages
Dependent Variables Variance: 0.2936 0.3380 Gini: 0.1750 0.1834
Years: 1983/85 2000/02 1983/85 2000/02Explanatory VariablesConstant 0.2814 0.2359 0.1687 0.1538
(0.0028) (0.004) (0.0009) (0.001)Union covered -0.0974 -0.0747 -0.0568 -0.0350
(0.0015) (0.0023) (0.0004) (0.0006)Non-white 0.0185 -0.0090 0.0171 0.0067
(0.0025) (0.0029) (0.0008) (0.0007)Non-Married 0.0669 0.0169 0.0318 0.0135
(0.0017) (0.0024) (0.0006) (0.0006)Education (High School omitted) Primary 0.0682 0.1459 0.0517 0.0744
(0.0035) (0.0046) (0.0013) (0.0018) Some HS 0.0907 0.1576 0.0429 0.0646
(0.0025) (0.0033) (0.0007) (0.0011) Some College 0.0125 0.0074 -0.0057 -0.0052
(0.002) (0.0021) (0.0006) (0.0007) College 0.0609 0.1547 -0.0085 0.0104
(0.003) (0.0037) (0.0008) (0.0008) Post-grad 0.1389 0.3306 0.0128 0.0491
(0.0035) (0.0053) (0.0009) (0.0013)Potential Experience (15< Experience < 20 omitted)Experience <5 0.0791 0.0880 0.0734 0.0652
(0.0032) (0.0041) (0.0011) (0.001)5< Experience < 10 -0.0633 -0.0569 0.0041 0.0042
(0.0026) (0.0039) (0.0009) (0.001)10< Experience < 15 -0.0539 -0.0350 -0.0046 -0.0005
(0.0023) (0.004) (0.0008) (0.0008)20< Experience < 25 -0.0189 -0.0036 -0.0011 0.0023
(0.0027) (0.004) (0.0009) (0.0009)25< Experience < 30 0.0167 0.0025 0.0030 0.0000
(0.0032) (0.0038) (0.001) (0.0009)30< Experience < 35 0.0162 0.0101 0.0022 0.0018
(0.0036) (0.0043) (0.001) (0.001)35< Experience < 40 0.0148 0.0245 0.0015 0.0054
(0.0034) (0.005) (0.0011) (0.0011)Experience > 40 -0.0238 0.0087 -0.0096 0.0045
(0.0035) (0.0056) (0.001) (0.0015)O*NET MeasuresInformation Content -0.0147 -0.0076 -0.0097 -0.0065
(0.0008) (0.0013) (0.0003) (0.0003)Automation -0.0255 -0.0165 -0.0062 -0.0022
(0.0009) (0.0011) (0.0003) (0.0003)No Face-to-Face -0.0065 -0.0047 -0.0138 -0.0107
(0.0012) (0.0014) (0.0004) (0.0004)Non On-Site Job 0.0106 0.0225 0.0017 0.0051
(0.0005) (0.0007) (0.0002) (0.0002)No Decision-Making 0.0069 0.0070 0.0145 0.0142
(0.0011) (0.0018) (0.0004) (0.0005)
Note: Boostrapped standard errors (100 reps) are in parentheses.

Table 5. Decomposition Results 1983/85-2000/02
90-10 50-10 90-50 Variance GiniTotal Change 0.0622 -0.0830 0.1452 0.0443 0.0085
(0.0149) (0.0147) (0.0034) (0.0013) (0.0004)Wage Structure -0.0208 -0.1287 0.1079 0.0170 0.0041
(0.0114) (0.0113) (0.0043) (0.0015) (0.0004)Composition 0.0829 0.0457 0.0373 0.0273 0.0043
(0.0055) (0.0051) (0.0031) (0.0008) (0.0003)Composition Effects:Union 0.0215 -0.0159 0.0375 0.0080 0.0046
(0.0039) (0.0036) (0.0007) (0.0002) (0.0001)Education -0.0009 0.0111 -0.0120 -0.0019 -0.0041
(0.0022) (0.0018) (0.0018) (0.0003) (0.0001)Experience 0.0141 0.0186 -0.0045 0.0032 -0.0022
(0.0011) (0.0009) (0.0009) (0.0003) (0.0001)Technology 0.0030 0.0073 -0.0043 0.0430 0.0182
(0.0022) (0.0018) (0.0018) (0.0002) (0.0001)Offshorability 0.0073 0.0033 0.0040 -0.0204 -0.0054
(0.0008) (0.0007) (0.0007) (0.0002) (0.0001)Other 0.0103 0.0009 0.0093 0.0048 0.0025
(0.0016) (0.0014) (0.0016) (0.0002) (0.0001)Residual 0.0276 0.0203 0.0072 -0.0092 -0.0095
(0.001) (0.001) (0.0004) (0.0005) (0.0002)
Wage Structure Effects:Union 0.0111 -0.0048 0.0160 0.0040 0.0031
(0.0031) (0.0025) (0.0021) (0.0006) (0.0001)Education 0.0890 0.0169 0.0721 0.0324 0.0072
(0.0029) (0.0024) (0.0025) (0.0019) (0.0005)Experience -0.0337 -0.0081 -0.0257 -0.0097 -0.0052
(0.009) (0.0098) (0.0092) (0.0037) (0.001)Technology 0.0484 -0.0322 0.0806 0.4520 0.2067
(0.0178) (0.0154) (0.0176) (0.0027) (0.0008)Offshorability 0.0500 -0.0218 0.0718 0.3334 0.0888
(0.0115) (0.0131) (0.0113) (0.0024) (0.0007)Other -0.0516 -0.0274 -0.0242 -0.0213 -0.0074
(0.0112) (0.0094) (0.0079) (0.0017) (0.0004)Residual -0.1339 -0.0511 -0.0828 -0.7736 -0.2890
(0.0059) (0.0054) (0.0048) (0.0054) (0.0015)
Note: Boostrapped standard errors (100 reps) are in parentheses. Repetitions conducted over the entire procedure.
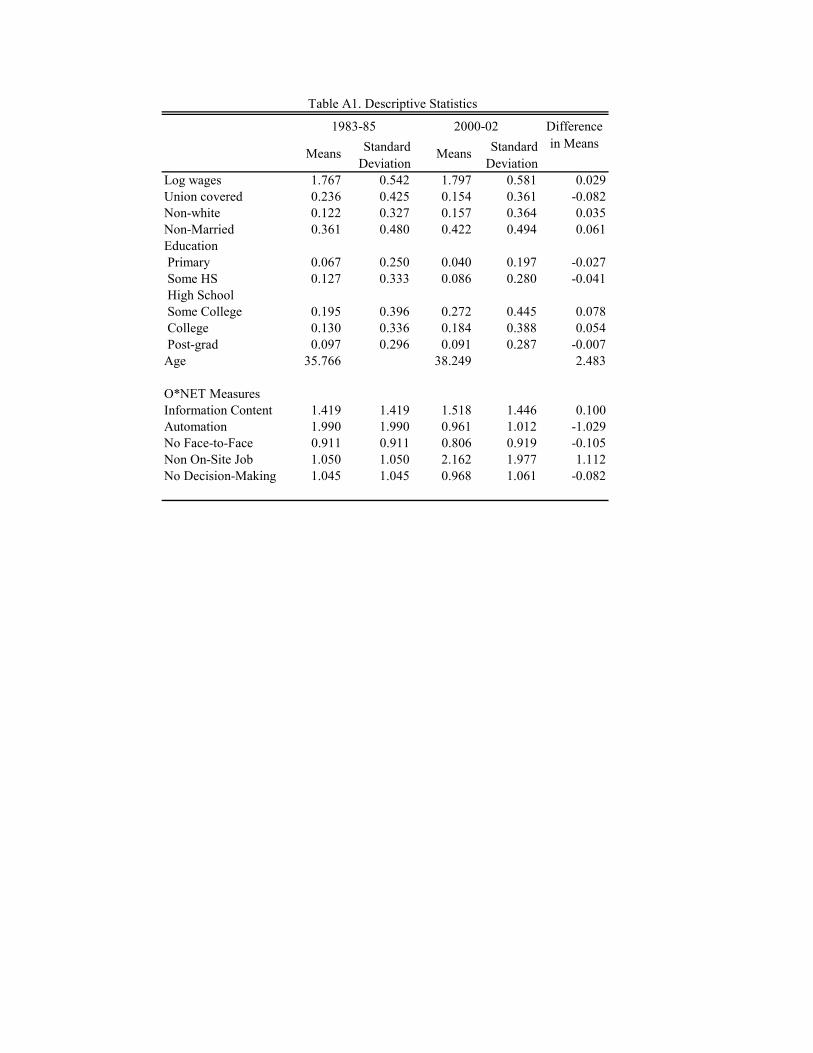
Table A1. Descriptive Statistics
Difference
Means Standard Deviation
Means Standard Deviation
in Means
Log wages 1.767 0.542 1.797 0.581 0.029Union covered 0.236 0.425 0.154 0.361 -0.082Non-white 0.122 0.327 0.157 0.364 0.035Non-Married 0.361 0.480 0.422 0.494 0.061Education Primary 0.067 0.250 0.040 0.197 -0.027 Some HS 0.127 0.333 0.086 0.280 -0.041 High School Some College 0.195 0.396 0.272 0.445 0.078 College 0.130 0.336 0.184 0.388 0.054 Post-grad 0.097 0.296 0.091 0.287 -0.007Age 35.766 38.249 2.483
O*NET MeasuresInformation Content 1.419 1.419 1.518 1.446 0.100Automation 1.990 1.990 0.961 1.012 -1.029No Face-to-Face 0.911 0.911 0.806 0.919 -0.105Non On-Site Job 1.050 1.050 2.162 1.977 1.112No Decision-Making 1.045 1.045 0.968 1.061 -0.082
1983-85 2000-02

-.20.2.4
.51
1.5
22.
53
3.5
Bas
e pe
riod
wag
e
Wag
e ch
ange
Qua
drat
ic fi
t
1983
-85
to 2
000-
02 c
hang
e fo
r eac
h de
cile
Figu
re 1
: Cha
nge
in w
age
by 2
-dig
it oc
cupa
tion

-.3-.2-.10.1.2
11.
52
2.5
Bas
e pe
riod
med
ian
Inte
rcep
tQ
uadr
atic
fit
Wag
e C
hang
e be
twee
n 19
83-8
5 an
d 20
00-0
2Fi
gure
2: I
nter
cept
of W
age
Cha
nge
Reg
ress
ion
by 2
-dig
it oc
cupa
tion

-.4-.20.2.4
11.
52
2.5
Bas
e pe
riod
med
ian
Slo
peQ
uadr
atic
fit
Wag
e C
hang
e be
twee
n 19
83-8
5 an
d 20
00-0
2
Figu
re 3
: Slo
pe o
f Wag
e C
hang
e R
egre
ssio
n by
2-d
igit
occu
patio
n

Figu
re 4
. U
ncon
ditio
nal Q
uant
ile R
egre
ssio
ns C
oeff
icie
nts:
19
83/8
5-20
00/0
2 S
elec
ted
Var
iabl
es
-.20.2.4
0.2
.4.6
.81
Qua
ntile
2000
-02
1983
-85
Uni
on
-.2-.15-.1-.050
0.2
.4.6
.81
Qua
ntile
Non
-Whi
te
-.5-.250.25.5.751
0.2
.4.6
.81
Qua
ntile
Ele
men
tary
-.5-.250.25.5.751
0.2
.4.6
.81
Qua
ntile
Dro
p-O
ut
-.5-.250.25.5.751
0.2
.4.6
.81
Qua
ntile
Som
e C
olle
ge
-.5-.250.25.5.751
0.2
.4.6
.81
Qua
ntile
Col
lege
-.5-.250.25.5.751
0.2
.4.6
.81
Qua
ntile
Pos
t-Gra
duat
e
0.02.04.06.08.1
0.2
.4.6
.81
Qua
ntile
Info
rmat
ion
-.08-.06-.04-.020.02
0.2
.4.6
.81
Qua
ntile
Aut
omat
ion
.04.06.08.1.12.14
0.2
.4.6
.81
Qua
ntile
No
Face
2Fac
e
-.04-.020.02.04.06
0.2
.4.6
.81
Qua
ntile
No
On-
Site
-.16-.14-.12-.1-.08-.06
0.2
.4.6
.81
Qua
ntile
No
Dec
isio
n-M
akin
g

Figure 5. Decomposition of Total Change into Composition and Wage Structure Effects
-.05
0.0
5.1
.15
Log
Wag
e C
hang
e
0 .2 .4 .6 .8 1Quantile
Total ChangeWage StructureComposition
Change in Log Wages 2000/02-1983/85
-.05
0.0
5.1
.15
Log
Wag
e C
hang
e
0 .2 .4 .6 .8 1Quantile
UnionEducationExperienceTechnologyNon-Offshore
Total Effects

Figure 6. Decomposition of Composition Effects
-.05
0.0
5.1
.15
Log
Wag
e C
hang
e
0 .2 .4 .6 .8 1Quantile
TotalExplainedSpec. Error
Composition Effects
-.05
0.0
5.1
.15
Log
Wag
e C
hang
e
0 .2 .4 .6 .8 1Quantile
UnionEducationExperienceTechnologyNon-Offshore
Composition Effects

Figure 7. Decomposition of Wage Structure Effects
-.05
0.0
5.1
.15
Log
Wag
e C
hang
e
0 .2 .4 .6 .8 1Quantile
TotalExplainedResidual
Wage Structure Effects
-.05
0.0
5.1
.15
Log
Wag
e C
hang
e
0 .2 .4 .6 .8 1Quantile
UnionEducationExperienceTechnologyNon-Offshore
Wage Structure Effects

Appendix Table 1. O*NET Work Activities & Work Context Characteristics linked to Technological Change/Offshorability Information Content 4.A.1.a.1 Getting Information 4.A.2.a.2 Processing Information 4.A.2.a.4 Analyzing Data or Information 4.A.3.b.1 Interacting With Computers 4.A.3.b.6 Documenting/Recording Information Automation/Routine 4.C.3.b.2 Degree of Automation 4.C.3.b.7 Importance of Repeating Same Tasks 4.C.3.b.8 Structured versus Unstructured Work (reverse) 4.C.3.d.3 Pace Determined by Speed of Equipment 4.C.2.d.1.i Spend Time Making Repetitive Motions Characteristics linked to Non-Offshorability Face-to-Face Contact 4.C.1.a.2.l Face-to-Face Discussions 4.A.4.a.4 Establishing and Maintaining Interpersonal Relationships 4.A.4.a.5 Assisting and Caring for Others 4.A.4.a.8 Performing for or Working Directly with the Public 4.A.4.b.5 Coaching and Developing Others On-site Job 4.A.1.b.2 Inspecting Equipment, Structures, or Material 4.A.3.a.2 Handling and Moving Objects 4.A.3.a.3 Controlling Machines and Processes 4.A.3.a.4 Operating Vehicles, Mechanized Devices, or Equipment 4.A.3.b.4 Repairing and Maintaining Mechanical Equipment (*0.5) 4.A.3.b.5 Repairing and Maintaining Electronic Equipment (*0.5) Decision-Making 4.A.2.b.1 Making Decisions and Solving Problems 4.A.2.b.2 Thinking Creatively 4.A.2.b.4 Developing Objectives and Strategies 4.C.1.c.2 Responsibility for Outcomes and Results 4.C.3.a.2.b Frequency of Decision Making

Examples of Work Activities for O*Net Occupation for (11-2022) Sales Managers and (15-1021) Computer Programmers 11-2022.00 4.A.2.b.2 Thinking Creatively IM 3.95 11-2022.00 4.A.2.b.2 Thinking Creatively LV 4.25 11-2022.00 4.A.3.b.1 Interacting With Computers IM 3.80 11-2022.00 4.A.3.b.1 Interacting With Computers LV 3.60 11-2022.00 4.A.4.a.5 Assisting and Caring for Others IM 2.25 11-2022.00 4.A.4.a.5 Assisting and Caring for Others LV 2.30 15-1021.00 4.A.2.b.2 Thinking Creatively IM 3.11 15-1021.00 4.A.2.b.2 Thinking Creatively LV 4.01 15-1021.00 4.A.3.b.1 Interacting With Computers IM 4.99 15-1021.00 4.A.3.b.1 Interacting With Computers LV 5.39 15-1021.00 4.A.4.a.5 Assisting and Caring for Others IM 2.86 15-1021.00 4.A.4.a.5 Assisting and Caring for Others LV 3.21 Examples of Work Context for O*Net Occupation for (11-2022) Sales Managers and (15-1021) Computer Programmers 4.C.3.a.2.b Frequency of Decision Making CXP 1 Never 4.C.3.a.2.b Frequency of Decision Making CXP 2 Once a year or more but not every month 4.C.3.a.2.b Frequency of Decision Making CXP 3 Once a month or more but not every week 4.C.3.a.2.b Frequency of Decision Making CXP 4 Once a week or more but not every day 4.C.3.a.2.b Frequency of Decision Making CXP 5 Every day 11-2022.00 4.C.3.a.2.b Frequency of Decision Making CX n/a 3.62 11-2022.00 4.C.3.a.2.b Frequency of Decision Making CXP 1 0.00 11-2022.00 4.C.3.a.2.b Frequency of Decision Making CXP 2 19.05 11-2022.00 4.C.3.a.2.b Frequency of Decision Making CXP 3 33.3 11-2022.00 4.C.3.a.2.b Frequency of Decision Making CXP 4 14.29 11-2022.00 4.C.3.a.2.b Frequency of Decision Making CXP 5 33.33 15-1021.00 4.C.3.a.2.b Frequency of Decision Making CX n/a 3.14 15-1021.00 4.C.3.a.2.b Frequency of Decision Making CXP 1 15.03 15-1021.00 4.C.3.a.2.b Frequency of Decision Making CXP 2 8.49 15-1021.00 4.C.3.a.2.b Frequency of Decision Making CXP 3 34.93 15-1021.00 4.C.3.a.2.b Frequency of Decision Making CXP 4 30.46 15-1021.00 4.C.3.a.2.b Frequency of Decision Making CXP 5 11.09 4.C.3.b.7 Importance of Repeating Same Tasks CXP 1 Not important at all 4.C.3.b.7 Importance of Repeating Same Tasks CXP 2 Fairly important 4.C.3.b.7 Importance of Repeating Same Tasks CXP 3 Important 4.C.3.b.7 Importance of Repeating Same Tasks CXP 4 Very important 4.C.3.b.7 Importance of Repeating Same Tasks CXP 5 Extremely important 11-2022.00 4.C.3.b.7 Importance of Repeating Same Tasks CX n/a 2.67 11-2022.00 4.C.3.b.7 Importance of Repeating Same Tasks CXP 1 19.05 11-2022.00 4.C.3.b.7 Importance of Repeating Same Tasks CXP 2 28.57 11-2022.00 4.C.3.b.7 Importance of Repeating Same Tasks CXP 3 28.57 11-2022.00 4.C.3.b.7 Importance of Repeating Same Tasks CXP 4 14.29

11-2022.00 4.C.3.b.7 Importance of Repeating Same Tasks CXP 5 9.52 15-1021.00 4.C.3.b.7 Importance of Repeating Same Tasks CX n/a 2.74 15-1021.00 4.C.3.b.7 Importance of Repeating Same Tasks CXP 1 16.29 15-1021.00 4.C.3.b.7 Importance of Repeating Same Tasks CXP 2 28.00 15-1021.00 4.C.3.b.7 Importance of Repeating Same Tasks CXP 3 31.59 15-1021.00 4.C.3.b.7 Importance of Repeating Same Tasks CXP 4 13.82 15-1021.00 4.C.3.b.7 Importance of Repeating Same Tasks CXP 5 10.31 4.C.3.b.8 Structured versus Unstructured Work CXP 1 No freedom 4.C.3.b.8 Structured versus Unstructured Work CXP 2 Very little freedom 4.C.3.b.8 Structured versus Unstructured Work CXP 3 Limited freedom 4.C.3.b.8 Structured versus Unstructured Work CXP 4 Some freedom 4.C.3.b.8 Structured versus Unstructured Work CXP 5 A lot of freedom 11-2022.00 4.C.3.b.8 Structured versus Unstructured Work CX n/a 4.33 11-2022.00 4.C.3.b.8 Structured versus Unstructured Work CXP 1 0.00 11-2022.00 4.C.3.b.8 Structured versus Unstructured Work CXP 2 4.76 11-2022.00 4.C.3.b.8 Structured versus Unstructured Work CXP 3 0.00 11-2022.00 4.C.3.b.8 Structured versus Unstructured Work CXP 4 52.38 11-2022.00 4.C.3.b.8 Structured versus Unstructured Work CXP 5 42.86 15-1021.00 4.C.3.b.8 Structured versus Unstructured Work CX n/a 3.99 15-1021.00 4.C.3.b.8 Structured versus Unstructured Work CXP 1 0.80 15-1021.00 4.C.3.b.8 Structured versus Unstructured Work CXP 2 1.12 15-1021.00 4.C.3.b.8 Structured versus Unstructured Work CXP 3 1.11 15-1021.00 4.C.3.b.8 Structured versus Unstructured Work CXP 4 91.87 15-1021.00 4.C.3.b.8 Structured versus Unstructured Work CXP 5 5.09

-2.502.55Index
11.
52
2.5
Ave
rage
Occ
upat
iona
l Log
Wag
es
Info
rmat
ion
Con
tent
-2.502.55Index
11.
52
2.5
Ave
rage
Occ
upat
iona
l Log
Wag
es
Aut
omat
ion
-2.502.55Index
11.
52
2.5
Ave
rage
Occ
upat
iona
l Log
Wag
es
No
Face
-to-F
ace
Con
tact
-2.502.55Index
11.
52
2.5
Ave
rage
Occ
upat
iona
l Log
Wag
es
No
On-
Site
Job
-2.502.55Index
11.
52
2.5
Ave
rage
Occ
upat
iona
l Log
Wag
es
No
Dec
isio
n-M
akin
g
App
endi
x Fi
gure
1. A
vera
ge O
ccup
atio
nal W
ages
in 2
000-
02 a
nd T
ask
Cat
egor
y In
dexe
s

0246810Index
11.
52
2.5
Ave
rage
Occ
upat
iona
l Log
Wag
es
Non
rout
ine
man
ual
0246810Index
11.
52
2.5
Ave
rage
Occ
upat
iona
l Log
Wag
es
Rou
tine
man
ual
0246810Index
11.
52
2.5
Ave
rage
Occ
upat
iona
l Log
Wag
es
Non
rout
ine
cogn
itive
/inte
ract
ive
0246810Index
11.
52
2.5
Ave
rage
Occ
upat
iona
l Log
Wag
es
Rou
tine
cogn
itive
0246810Index
11.
52
2.5
Ave
rage
Occ
upat
iona
l Log
Wag
es
Non
rout
ine
cogn
itive
/ana
lytic
al
App
endi
x Fi
gure
2. A
vera
ge O
ccup
atio
nal W
ages
in 2
000-
02 a
nd A
utor
et a
l. (2
003)
Inde
xes