Occupational Road Safety A South African Utility Experience Jace Naidoo.

i
Occupational Stress in a South African Workforce:
Instrument Testing, Prevalence Measurement and
Risk Factor Analysis
Heinrich Cyril Volmink
A research report submitted to the Faculty of Health Sciences of the University of the
Witwatersrand in partial fulfillment of the requirements for the degree of Master of
Medicine in the branch of Community Health (Public Health Medicine).
Supervisors:
Professor David Rees
Dr Spo Kgalamono
May 2014
i
DECLARATION
I, Heinrich Cyril Volmink, declare that this research report is my own. It is being
submitted as per the requirements for the degree of Master of Medicine in the branch
of Community Health (Public Health Medicine). It has not been used, either wholly or
partially, for any other degree or examination at this or any other university.
___________________ ________________
HC Volmink Date
27 May 2014

ii
DEDICATION
This dissertation is dedicated to my wife, Odette, and my son, Caleb. You have given
me strength and inspiration during this difficult process. Thank you, both, for saving
me from a high level of occupational stress.

iii
ACKNOWLEDGEMENTS
I would like to thank my supervisors, Professor David Rees and Dr Spo Kgalamono
(from the National Institute for Occupational Health and the University of the
Witwatersrand) for their incredible guidance, insight and support. Mr Cornelius
Nattey and Dr Eustasius Musenge also gave me considerable technical advice for
which I am appreciative. I would like to acknowledge the management of Chris Hani
Baragwanath Academic Hospital, especially Dr Nkele Lesia and Mr Allen Mbalati, as
well as the staff members who helped us on-site, especially Ms Zanele Mashigo. The
following individuals provided fieldwork assistance, for which I am most grateful: Mr
Joel Munyewende, Mr Kaddy Kalima, Mr Noko Thantsha and Sr Goitsimang Buffel.
Finally, I would like to thank all of my colleagues in the Department of Community
Health for their continual support.

iv
ABSTRACT
Background
Occupational stress represents a substantial public health challenge. Although there
has been an extensive focus on this form of stress within the international setting,
there appears to be a paucity of relevant evidence within South Africa. Specifically,
within the local context, there are relatively few: (1) reliability testing studies of
screening and assessment instruments, (2) prevalence analyses of occupational
stress and (3) work-related stress management intervention designs.
Methods
A cross-sectional descriptive and analytical study was undertaken in a large tertiary
hospital in Johannesburg. Primary data were collected between February 2013 and
September 2013 using the Copenhagen Psychosocial Questionnaire (COPSOQ). A
sample (n=166) of administrative staff was selected, stratified into front line staff
(n=54), back office staff (n=90) and managers (n=22).
Data analysis included reliability testing of the COPSOQ using the Cronbach‘s alpha
statistic. Prevalence measurement was also undertaken to describe the distribution
of stress and other variables across the study sample. Finally, logistic regression
was used to estimate associations between the exposure variables and the stress
outcome (at the p < 0.05 level of significance).

v
Results
The Cronbach‘s alpha range for the COPSOQ was 0.31 to 0.85. Two out of 24
scales of the instrument fell below the unacceptability threshold of 0.5. In terms of
prevalence, the stress mean for the study sample (on a scale from 0 to 100) was
38.8 (SD 19.8). Furthermore, 68.1% (n=113) of the study sample had a stress value
above the reference mean. There were also significant differences in the stress
values by job category, with managers having the highest mean at 51.2 (SD 24.2).
Adjusting for job category, risk factors significantly associated with occupational
stress in the main logistic model were offensive behaviour (OR 3.38, 95% CI: 1.54 –
7.43), quantitative demands (OR 2.83, 95% CI: 1.35 – 5.92) and emotional demands
(OR 2.32, 95% CI: 1.08 – 4.96), while quality of leadership (OR 0.32, 95% CI: 0.15 –
0.67) was a protective factor. Further analysis showed that the most harmful risk
factor for females was work-family conflict (OR 4.03; 95% CI: 1.45 - 11.21), and for
males was exposure to offensive behaviour (OR 4.63; 95% CI: 1.15 - 18.63). Finally,
ordinal regression found offensive behaviour (OR 3.60; 95% CI: 1.92 - 6.75) and
quantitative demands (OR: 2.38; 95% CI: 1.27 - 4.46) to be significant risks for
moving from low stress to high stress, while a commitment to workplace (OR 0.46;
95% CI: 0.24 - 0.86) could help to prevent this.
Conclusions
The level of occupational stress in the study sample was high relative to reference
values. An occupational stress intervention is recommended, which should include

vi
primary, secondary and tertiary prevention strategies (according to identified risks).
Further development of the instrument is also recommended, so as to improve its
reliability in the local context. Finally, future research into occupational stress should
explore the impact of factors such as resource constraints and HIV/AIDS, and should
include an expansion into other settings and occupational categories.
Key words
Occupational stress, questionnaire reliability, psychosocial risks, intervention design.
vii
TABLE OF CONTENTS
DECLARATION ................................................................................................... i
DEDICATION ....................................................................................................... ii
ACKNOWLEDGEMENTS ................................................................................... iii
ABSTRACT ......................................................................................................... iv
TABLE OF CONTENTS ..................................................................................... vii
LIST OF FIGURES ............................................................................................... x
LIST OF TABLES ................................................................................................ xi
ABBREVIATIONS .............................................................................................. xii
GLOSSARY ...................................................................................................... xiii
CHAPTER ONE .................................................................................................. 1
1. Introduction ..................................................................................................... 1
1.1 Background ................................................................................................... 1
1.2. Rationale for the study ................................................................................. 3
1.3 Aim ................................................................................................................ 4
1.4. Research Objectives .................................................................................... 4
1.5. Arrangement of subsequent chapters .......................................................... 5
CHAPTER TWO.................................................................................................. 6
2. Literature Review ........................................................................................... 6
2.1. Chapter overview ......................................................................................... 6
2.2. Definitions of occupational stress ................................................................. 6
2.3. Epidemiology ................................................................................................ 8
2.4. Risk factors .................................................................................................. 9
2.5. Outcomes ................................................................................................... 11

viii
2.6. Measuring Occupational Stress.................................................................. 12
2.7. Managing occupational stress .................................................................... 15
2.8. Studies specific to the South African setting .............................................. 17
2.9. Summary of literature review ...................................................................... 22
CHAPTER THREE ............................................................................................ 24
3. Methodology ................................................................................................... 24
3.1. Chapter overview ....................................................................................... 24
3.2. Study design .............................................................................................. 24
3.3. Study setting ............................................................................................... 24
3.4. Target population ....................................................................................... 25
3.5. Study period ............................................................................................... 26
3.6. Sampling approach .................................................................................... 26
3.7. Sample size calculation ............................................................................... 27
3.8. Data collection and entry ............................................................................ 29
3.9 Data analysis ............................................................................................... 30
3.10. Ethical considerations .............................................................................. 43
CHAPTER FOUR .............................................................................................. 45
4. Results .......................................................................................................... 45
4.1. Chapter overview ........................................................................................ 45
4.2 Description of the study sample .................................................................. 45
4.3. Reliability testing ........................................................................................ 47
4.4. Prevalence measurement .......................................................................... 50
4.5. Analysis of risk factors ................................................................................ 56
4.6. Summary of results .................................................................................... 62

ix
CHAPTER FIVE ................................................................................................ 64
5. Discussion ...................................................................................................... 64
5.1. Chapter overview ....................................................................................... 64
5.2. Reliability testing ........................................................................................ 64
5.3. Prevalence measurement .......................................................................... 68
5.4. Analysis of risk factors ................................................................................ 72
5.5. Contextual factors ...................................................................................... 81
5.6. Limitations .................................................................................................. 82
CHAPTER SIX .................................................................................................. 85
6. Conclusions and recommendations .............................................................. 85
6.1. Chapter overview ....................................................................................... 85
6.2. Study summary .......................................................................................... 85
6.3. Generalizability of the study ....................................................................... 87
6.4. Recommendations ..................................................................................... 88
6.5. Concluding thoughts ................................................................................... 94
REFERENCES .................................................................................................. 95
APPENDICES ................................................................................................. 117
Appendix 1: The Copenhagen Psychosocial Questionnaire (medium size) .... 118
Appendix 2: The scales of the medium size COPSOQ II questionnaire .......... 130
Appendix 3: Ethics clearance certificate .......................................................... 142
Appendix 4: Medical Advisory Committee permission letter ............................ 144
Appendix 5: Consent form ............................................................................... 146
Appendix 6: Study information sheet ............................................................... 148

x
LIST OF FIGURES
Figure 1: Risk factors, responses and outcomes of occupational stress ........... 11
Figure 2: View of Chris Hani Bargawanath Academic Hospital ......................... 25
Figure 3: Flow of data collection and entry ........................................................ 29
Figure 4: Flow of data analysis .......................................................................... 43
Figure 5: Cronbach‘s alpha values with upper and lower threshold limits ......... 49
Figure 6: Distribution of stress data for study population................................... 52
Figure 7: Mean stress values according to demographic categories ................. 53
Figure 8: Box plots of outcome variables .......................................................... 54
Figure 9: Two way scatter plot of stress and burnout data ................................ 54
Figure 10: Two way scatter plot of stress and sleeping troubles data ................ 55
Figure 11: ROC curve analysis of main multivariate logistic regression model . 60
Figure 12: Significant exposures related to occupational stress ........................ 72

xi
LIST OF TABLES
Table 1: List of occupational stress instruments ................................................. 13
Table 2: Management models of occupational stress ....................................... 16
Table 3: Results of search relating to occupational stress studies .................... 17
Table 4: Summary of selected occupational stress studies in South Africa ....... 20
Table 5: Number of employees in the target population and sampling groups .. 27
Table 6: Demographic, exposure and outcome variables used in analysis ....... 31
Table 7: Non-normally distributed numerical variables ...................................... 35
Table 8: Threshold guideline for Cronbach‘s alpha values ................................ 37
Table 9: Sex distribution by age group .............................................................. 46
Table 10: Sex and age group distribution by job category ................................. 46
Table 11: Reliability of scales using Cronbach‘s alpha ...................................... 47
Table 12: Performance of scales in terms of reliability thresholds ..................... 48
Table 13: Results of exposure and outcome variable analysis .......................... 51
Table 14: Prevalence of offensive behaviour components ................................ 52
Table 15: Results of multicollinearity testing ..................................................... 56
Table 16: Findings of the main logistic regression model ................................... 58
Table 17: Further multivariate logistic regression, by sex .................................. 59
Table 18: Findings of the ordinal logistic regression model ............................... 61
Table 19: Comparison of scales that meet the internal consistency assumption 66
Table 20: Rotated factor loadings ..................................................................... 67
Table 21: Variables that may require special emphases for certain groups ...... 71

xii
ABBREVIATIONS
CI Confidence interval
COPSOQ Copenhagen Psychosocial Questionnaire
EI Emotional intelligence
EU European Union
ILO International Labor Organization
MID Minimal important difference
NIOH National Institute for Occupational Health
NIOSH National Institute of Occupational Safety and Health
NHS National Health Service
PRIMA-EF European Framework for Psychosocial Risk Management
OR Odds ratio
PTSD Post-traumatic stress disorder
USD United States dollar
VIF Variance inflation factor
WHO World Health Organization
ZAR South African rand
xiii
GLOSSARY
Commitment to
workplace:
Concerns the extent to which employees would tell other
people about their work and/or encourage other people to
join their workplace. Includes an indication of possible
intentions to leave the workplace.*
Emotional demands: Demands arising from emotional involvement with, or
disturbing aspects of, work tasks or work environment
(includes engaging with the personal problems of other
people).*
Influence: Degree to which employees can influence the assignment
of their work, as well as choose who they work with.*
Instrument:
Any tool (such as a questionnaire) used for detecting and
measuring occupational stress.
Job satisfaction: Level of satisfaction that employees have with regards to
their work, including perceptions of job prospects and
satisfaction with the actual physical conditions at work.*

xiv
Justice and respect:
Relates to perceptions around fairness of conflict resolution,
distribution and appreciation of work, and treatment of
suggestions.*
Meaning of work:
Degree to which work is meaningful and important to
employees. Includes their perceived level of motivation.*
Mutual trust between
employees:
General level of trust between co-workers. Also relates to
the degree to which employees withhold information from
each other and management.*
Offensive behaviour:
Pertains to sexual harassment, threats of violence, physical
violence or bullying in workplace.*
Possibilities for
development:
Extent to which there are opportunities for the use and/or
development of skill. Possible requirements to take initiative
with regards to work tasks are also relevant here.*
Predictability:
Degree to which employees receive information pertaining
to changes and plans that concern them. Includes the
provision of information related to task completion.*

xv
Quality of leadership: Perceptions that the employees have with regards to their
supervisors‘ ability to plan work and resolve conflicts. Also
involves perceptions of supervisors‘ concerns for employee
development and level of job satisfaction.*
Quantitative demands: Demands arising from workload distribution and volume as
well as time-constraints.*
Rewards (recognition):
Relates to receiving respect and recognition from
management for work accomplishments as well as
perceived fair treatment in the working setting.*
Role clarity: Clearness of work objectives, responsibilities and
expectations.*
Role conflicts:
Conflicts arising from contradictions in demands or
disagreements in relation to work tasks.*
Social community at
work:
Pertains to the atmosphere between co-workers as well as
the level of co-operation. Involves a sense of being part of
the work community.*

xvi
Social support from
colleagues:
Degree to which the employees find their colleagues to be
helpful and supportive, prepared to listen to their work
problems and opened to giving feedback with regards to the
carrying out of work tasks.*
Social support from
supervisors:
Degree to which the employees find their supervisors to be
helpful and supportive, prepared to listen to their work
problems and opened to giving feedback with regards to the
carrying out of work tasks.*
Trust regarding
management:
Extent to which the employees are able to express their
feelings and viewpoints with management. Also includes
the degree to which employees trust information given by
management and suspicions around the withholding of this
information. Management‘s trust in employees to do their
work at a suitable level is also considered here.*
Work pace: Rate and duration of pace for completing work tasks.*
Work-family conflict:
Conflict arising from work taking time and energy away from
the employees private lives. Also relates to complaints from
family members or friends about excessive work.*
* Source: Copenhagen Psychosocial Questionnaire scales guidance document
(appendix 2).
1
CHAPTER ONE
1. Introduction
1.1 Background
Enhancing mental health is a vital component of public health action. As Dr Margaret
Chan, Director-General of the World Health Organization (WHO), has stated,
―Mental well-being is a fundamental component of WHO's definition of health.
Good mental health enables people to realize their potential, cope with the
normal stresses of life, work productively, and contribute to their communities.‖
1(p.5)
The above notwithstanding, mental illnesses impose a substantial burden of disease.
The initial estimates of the 2001 World Health Report were that approximately 450
million people had a neuropsychiatric disorder. Furthermore, these illnesses
accounted for 12.3% of the global disability adjusted life-years in 2000.2 Within the
national context, the South African Stress and Health study revealed a lifetime
prevalence of 30.3% for any mental disorder, with the most prevalent class being
anxiety disorders (15.8% lifetime prevalence).3
Occupational stress is a growing component of the mental health burden. Indeed,
work-related stress has been described by the International Labor Organization (ILO)
as a ―global epidemic.‖4 A 2009 study by the American Psychological Association, for
example, showed that almost 70% of employees reported their work as being a

2
significant contributor to stress.5 Furthermore, a 2005 European Union (EU) study
showed that stress was experienced by over one-fifth of workers surveyed.6
Although national prevalence data for work-related stress is not currently available in
South Africa, stress have been described in a number of occupational categories in
the country, including healthcare workers,7 educators,8 construction professionals,9
police officers10 and correctional service personnel.11
Numerous factors can act as risks for work-related stress. Characteristics that are
intrinsic to the job (such as high workload), difficulties related to the employees
organisational role (such as role ambiguity), lack of opportunities for career
development and problematic relationships within the work environment12,13 are
among the important exposures. Furthermore, conflict between work and home life
has also been shown to be a considerable stressor.12
Occupational stress has, in turn, been associated with a range of health outcomes.
These include cardiovascular diseases such as hypertension,14 coronary heart
disease15 and type 2 diabetes mellitus.16 Stress experienced in the workplace may
also lead to further psychopathology, such as burnout,17 anxiety disorders,18
depression19 and suicide ideation.20
In addition to its health consequences, stress may impact adversely on workplace
behaviour. Occupational stress has, for example, been shown to diminish job
performance as well as impede cognition (including reduced concentration and
perseverance).21 A statistically significant relationship has also been shown between
high levels of stress and illness-related absenteeism.22

3
There is certainly a substantial economic cost related to work-related stress, which
may result from outcomes such as absenteeism as well as the required health care
provision. It was estimated, for example, that occupational stress cost the EU 20
billion Euros in 2002.23 In the United States, the cost of stress (in United States
dollars, or USD) increased from USD 42 billion in 2002 to USD 300 billion for
companies in 2006.24 Within the South African context, it has been reported that
occupational stress may carry with it an economic burden (in South African rands, or
ZAR) of ZAR 3 billion per year.25
Given both the health and economic costs of occupational stress, the development
of occupational stress interventions would appear to be an imperative. Interventions
that have been shown to be particularly effective are those that (1) focus on the
primary level of prevention (that is, the reduction of possible psychosocial risk
factors) and (2) combine both an individual and an organisational focus.26
Concomitant with the development of occupational stress management programmes
would be the accurate measurement of the level of stress within workplaces. To this
end, numerous validated and reliable occupational stress assessment tools, or
instruments, have been developed.27
1.2. Rationale for the study
Occupational stress poses a significant threat to employees, and incurs both a health
and an economic cost. Despite this, there are scant prevalence analyses of
occupational stress within the South African setting. Furthermore, an examination of
psychosocial risks may provide contextual evidence on which occupational stress

4
interventions can be based. Finally, the testing of relevant instruments is necessary
to confirm their usefulness in terms of measuring occupational stress within local
organisations. Therefore, a study of a South African workforce that assesses an
appropriate occupational stress tool, determines the prevalence of work-related
stress and explores significant risk factors may be of value.
1.3 Aim
To test instrument reliability, measure prevalence and analyze risk factors related to
occupational stress in a South African organisational setting.
1.4. Research Objectives
A. To test the reliability of an internationally recognised occupational stress tool
in a South African workforce setting.
B. To measure the prevalence and distribution of occupational stress in the
administrative staff of a South African workforce.
C. To analyze contextual risk factors of occupational stress in the administrative
staff of a South African workforce.

5
1.5. Arrangement of subsequent chapters
Chapter 2: This chapter will be presented in the form of a literature review and will
attempt to glean information relevant to the study of occupational stress.
Chapter 3: A description of the study‘s methodology will be provided in this
chapter. This will include details of study design, data collection and quantitative
analysis techniques.
Chapter 4: This chapter will display the main findings of the study, in the order of:
questionnaire reliability testing, prevalence analysis and risk factor assessment.
Chapter 5: A discussion of the implication of the findings, as well as an
identification of study limitations, will then ensue.
Chapter 6: Finally, a summation of the occupational stress study will allow for the
presentation of key conclusions and recommendations.
6
CHAPTER TWO
2. Literature Review
2.1. Chapter overview
This chapter will seek to provide a summary of selected literature pertinent to
occupational stress, with a special emphasis on the South African context. It will
begin by exploring a conceptual understanding of occupational stress. This will be
followed by an examination of the epidemiology, psychosocial risks and outcomes of
the disorder. The array of possible tools that could be used to measure stress, as
well as approaches to managing stress in the workplace, will also briefly be
examined. Finally, in the chapter‘s conclusion, key gaps in the literature related to
occupational stress in the South African setting will be distilled.
2.2. Definitions of occupational stress
Before an exploration of the meaning of ‗occupational stress‘ can be undertaken, a
preliminary consideration of the more general concept of ‗stress‘ is needed. While a
range of definitions of stress have been offered, a useful synopsis is provided by
Fisher et al.12 They argue that any one of the following approaches to
conceptualizing stress can be adopted (each being germane to the research
process):
1) where stress is considered to be dependent (outcome) variable, or
2) where it is ascribed as an independent (input) variable, or

7
3) where it is seen an intervening variable, viz. ―a psychological [,] cognitive and
emotional variable … that takes place between stimulus and response.‖
12(p.134)
The last approach explores the dynamics between the person (P) and their
environment (E). Stress is said to manifest when the demands made by E place
sufficient strain on P‘s resources and/or capacities (Fisher et al. appear to favour the
intervening variable/P-E fit model of conceptualizing stress).12
What, then, is occupational stress? Definitions have ranged from the relatively
simplistic (an ―… adverse reaction people have to excessive pressures or other
types of demand placed on them‖ 28 (p.1)) to the more intricate (the ―… emotional,
cognitive, behavioural and physiological reaction to aversive and noxious aspects of
work, work environments and work organisation‖ 29 (p.3)). The National Institute of
Occupational Safety and Health (NIOSH) offers a perhaps more balanced definition
of occupational stress as being:
―… the harmful physical and emotional responses that occur when the
requirements of the job do not match the capabilities, resources, or needs of
the worker.‖30 (p.6)
This succinct description, which also reflects some of the elements of the P-E
model discussed earlier, will serve as the preferred definition of occupational
stress for the purposes of this study.

8
2.3. Epidemiology
There is a considerable availability of prevalence data relating to occupational stress
in developed countries. A report by European Agency for Safety and Health at
Work,23 for example, described epidemiological data from the EU. Drawing on
different data sources, including the Fourth European Survey of Working
Conditions,6 it reported that, in 2005, an average of 22% of all EU workers
experienced stress. The highest prevalences were seen in Greece (55%), Slovenia
and Sweden (38%), and the lowest were in the United Kingdom (12%) and Ireland,
the Netherlands and Germany (16%). Anxiety in the occupational setting was highest
for workers in healthcare, education, public administration, defence, certain
agriculture-related industries and forestry. Furthermore, it was reported that
occupational stress was slightly more prevalent in males (23%) than in females
(20%), and that the self-reporting that work affected their health was commonest
amongst those in the 45 - 54 age group.23
In the United States, a survey study of adults 18 years and older (n=1568) was
undertaken by the American Psychological Association in 2009.5 Work was reported
as being a significant source of stress by 69% of respondents. This reporting was
slightly higher for males (70%) as compared to females (68%) and was highest in the
31 – 44 year old age group (75%).5
The NIOSH‘s 2004 Worker Health Chartbook explored a range of diseases
experienced by workers in the United States. It showed that, in 2001, workers with
‗anxiety, stress and neurotic disorders‘ had an average of approximately 25 days of

9
absence from work compared to six days for the entire non-fatal injury and illness
group. Job categories with the highest levels of these disorders were ‗technical,
sales, and administrative support‘ (33.6%) and ‗managerial and professional
specialty‘ jobs (29.9%).31
There is a relative dearth of data related to the epidemiology of stress in developing
countries. For example, although the WHO has stated that, in Latin America, ―work-
related stress is at present already acknowledged as one of the big epidemics of
modern working life‖ 32 (p.12) it was very difficult to identify the empirical data that
could inform this. However, a large survey study of employed persons (n=1004) in a
Hermosillo, Mexico, did find 26% of participants to be in ‗high strain‘ jobs.32,33
More broadly, Kortum et al. undertook a qualitative study (involving a Delphi survey,
expert interviews and focus group) that examined occupational stress in developing
countries.34 The study, which included participants from a number of
regions/countries (including sub-Saharan Africa), highlighted the need to understand
and address psychosocial risks in the workplace. The above notwithstanding,
national prevalence data relating to occupational stress in South Africa could not be
found.
2.4. Risk factors
The aetiology of occupational stress has been described as being multi-factorial.35
The categorization of risk factors has been undertaken by Fisher et al.12, Baker35 and
Michie,13 and includes:

10
The work environment: factors include exposure to physical hazards (such as
noise and temperature extremes) and poor ergonomics.
Job characteristics: factors include the experience of high work load, high time
pressures, long working hours, complexity of work and variety of tasks
Organisational role(s): factors include having to play multiple, conflicting
and/or ambiguous roles within the workplace.
Organisational relationships: factors include poor vertical relationships (with
managers/supervisors) and horizontal relationships (with colleagues).
Career development: factors include under or over promotion as well as job
insecurity.
Home-work interactions: factors include absence from home (due to work
demands) as well as taking work-related tasks into the home environment.
Michie continues by describing the interface between risk factors and the
physiological response at the individual level. Specifically, she describes how
stressors illicit an ―alarm response‖ (the acute flight versus fight reaction to a
perceived workplace threat) or ―adaptation‖ (a down-regulation of the response to
stimuli in the work environment when they are no longer perceived as being threats).
Stress arising when there is a dysfunction of, or a failed shift between, these
responses.13

11
2.5. Outcomes
The sequelae of occupational stress can been clustered into physiological,
psychological and behavioural outcomes.35,36 Physiological outcomes include
cardiovascular disease (such as hypertension), type 2 diabetes and peptic
ulcerations; psychological outcomes include anxiety and mood disorders (such as
depression) and behavioural outcomes include a decrease in productivity and
absenteeism.16,35,36 The latter group clearly has ramifications at both the individual
and the organisational levels. A diagrammatic depiction of the interplay between risk
factors, individual response(s) and outcomes, is given in figure 1.
Figure 1: Risk factors, responses and outcomes of occupational stress
(Sources: Fisher et al,12 Baker,35 Michie,13 Robbins and Judge36)
12
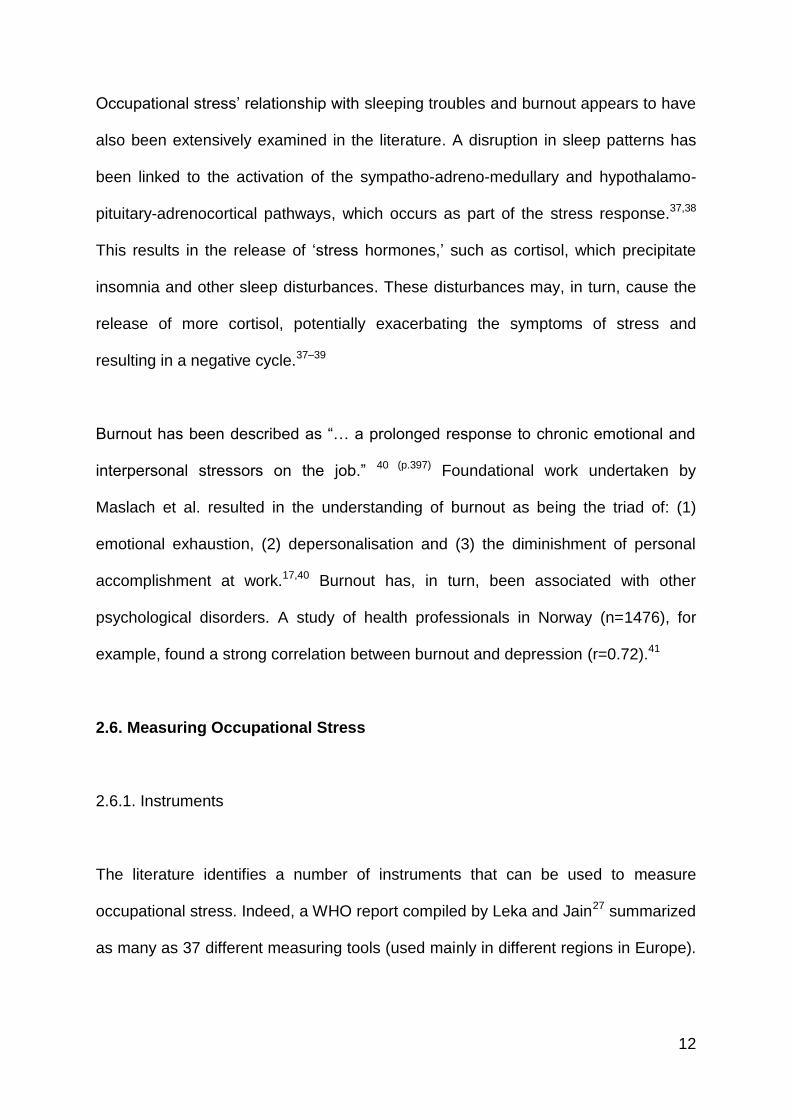
Occupational stress‘ relationship with sleeping troubles and burnout appears to have
also been extensively examined in the literature. A disruption in sleep patterns has
been linked to the activation of the sympatho-adreno-medullary and hypothalamo-
pituitary-adrenocortical pathways, which occurs as part of the stress response.37,38
This results in the release of ‗stress hormones,‘ such as cortisol, which precipitate
insomnia and other sleep disturbances. These disturbances may, in turn, cause the
release of more cortisol, potentially exacerbating the symptoms of stress and
resulting in a negative cycle.37–39
Burnout has been described as ―… a prolonged response to chronic emotional and
interpersonal stressors on the job.‖ 40 (p.397) Foundational work undertaken by
Maslach et al. resulted in the understanding of burnout as being the triad of: (1)
emotional exhaustion, (2) depersonalisation and (3) the diminishment of personal
accomplishment at work.17,40 Burnout has, in turn, been associated with other
psychological disorders. A study of health professionals in Norway (n=1476), for
example, found a strong correlation between burnout and depression (r=0.72).41
2.6. Measuring Occupational Stress
2.6.1. Instruments
The literature identifies a number of instruments that can be used to measure
occupational stress. Indeed, a WHO report compiled by Leka and Jain27 summarized
as many as 37 different measuring tools (used mainly in different regions in Europe).

13
These instruments, which range from broad measures of workplace stress to specific
burnout inventories, are listed in table 1.
Table 1: List of occupational stress instruments
(source: Leka and Jain27)
Burnout Measure Pressure Management Indicator
Copenhagen Psychosocial Questionnaire Psychosocial Working Conditions
Copenhagen Burnout Inventory Stress Diagnostic Survey
Effort-Reward Imbalance Stress d‘organisation Questionnaire
General Nordic Questionnaire Stress Profile
HSE Indicator Tool Stress Risk Assessment Questionnaire
Job Characteristics Index Travail et santé
Job Content Questionnaire Tripod Sigma Questionnaire
Job Diagnostic Survey Vragenlijst beleving en beoordeling van de arbeid
Job Stress Survey Work Environment Scale
Maslach Burnout Inventory Working Conditions and Control Questionnaire
Multidimensional Organisational Health Questionnaire
Canevas (company analysis)
NIOSH Generic Job Stress Questionnaire Finnish Institute of Occupational Health (observational checklist)
Nova Weba Questionnaire Position Analysis Questionnaire
Occupational Stress Index RHIA/VERA (observational job-stress analysis)
Occupational Stress Indicator Suvapro (checklist)
Occupational Stress Inventory Travailleur et organisation (obervational checklist)
Occupational Stress Questionnaire WEBA(welzijn bij of arbeid) (job-analysis instrument)
Oldenburg Burnout Inventory
2.6.2. The Copenhagen Psychosocial Questionnaire
2.6.2.a Description

14
Due to its wide use, an instrument that warrants special consideration is the
Copenhagen Psychosocial Questionnaire (COPSOQ). The first version of the
COPSOQ was developed in Denmark in 1997 by Kirsten et al.42,43 It was
subsequently translated into several languages and has been used in numerous
studies covering a range of occupational settings.43 The following were among the
stated objectives for the development of the questionnaire:
―(i) to develop valid and relevant instruments for the assessment of
psychosocial factors at work, (ii) to make national and international
comparisons possible, (iii) to improve evaluations of interventions … ‖ 42 (p.439)
The second (and current) version of the COPSOQ was developed using data from
3517 Danish workers collected in 2004/2005. Changes included the incorporation of
values-related scales (such as justice and trust) as well as certain symptom-related
scales (such as stress, burnout and sleeping troubles). Additional scales include
recognition and work-family conflicts as well as items on offensive behaviour.
Ultimately, 57% of the items in the first version of the COPSOQ were kept in the
second version. 43
The COSPOQ is presented in three formats: a long version of 128 items developed
for researchers, a medium version for 87 items for the use of ‗work environment
professionals‘, and a short version of 40 items for workplaces.44,45 The medium size
COPSOQ, along with a detailed description of its scales, are provided in appendices
1 and 2 respectively.

15
2.6.2.b. Reliability testing
An important characteristic of a questionnaire is its reliability, that is, the extent to
which repeated tests of its components produce results which are in agreement (this
differs from validity, another important characteristic that can be defined as the
extent to which instrument correctly measures which it is intended to measure).46,47
With regards to this, an acceptable level of reliability of different versions and
adaptations of the COPSOQ has been reported in studies undertaken in several
country-settings, including Denmark,48 France,49 Germany,50 Spain51 and Japan.52
Although reliability testing of the entire COPSOQ in the South African setting could
not be found in published literature, certain scales of the instrument were used (and
found to be reliable) in the grey literature in the form of an academic dissertation
completed at the University of Pretoria.53
2.7. Managing occupational stress
Having briefly described occupational stress measurement tools, different
approaches to its management will now be considered. In the international context, a
range of management models has been designed. The WHO, for example, has
recommended a ‗step-wise approach‘ to managing work-related stress in developing
countries.32 Other context-specific interventions guidelines include the European
Framework for Psychosocial Risk Management (PRIMA-EF)54 and The National
Institute for Occupational Safety and Health‘s (NIOSH‘s) prevention model.30 A
summary of these models is provided in table 2.

16
Table 2: Management models of occupational stress
(sources: Houtman and Jettinghoff,32 Leka and Cox54 and NIOSH30)
WHO ‘step-wise’ model PRIMA-EF model NIOSH prevention model
(1) Preparations and
detecting signs of
occupational stress.
(1) Assessment of
psychosocial risks.
(1) Identification of problem
by collecting and analyzing
data related to stress.
(2) Analysis of risk factors &
groups (through, for
example, questionnaires).
(2) Analysis of existing
practices/measures.
(2) Development and
implementation interventions
using evidence from step (1).
(3) Development of the
action plan (covering both
individual and organisational
interventions).
(3-5) Development,
implementation and
evaluation of the action plan.
(3) Evaluation of
interventions.
(4) Implementing the action
plan.
(6) Development of
organisational learning.
(5) Evaluating interventions. (7) Assessment of risk
management outcomes.
As can be observed, the identification and analysis of risk factors is the common
‗first-step‘ in the models described. Hence it may not be appropriate (or, indeed,
even possible) to develop and implement interventions without an adequate
understanding of the risk factors specific to the workplace setting.
Generic models of occupational stress management, such as those described
above, could not be readily found within the literature pertaining to the South African
context. Instead, management recommendations/interventions tended to be specific
to the findings of individual studies (as described in section 2.8.).

17
2.8. Studies specific to the South African setting
In terms of specific studies related to the South African setting, a literature search
was conducted in an attempt to identify possible trends. Specifically, a search using
the PubMed (www.ncbi.nlm.nih.gov/pubmed) and Directory of Open Access Journals
(DOAJ) (www.doaj.org) engines was undertaken.
A total 45 studies were identified in PubMed and 17 in the DOAJ; however, three of
these over-lapped, leaving 59 studies. A distribution of the studies, according to
relevant categories, is given in table 3. As can be seen, most (53%) of the studies
fell into the ‗not applicable‘ category (because of they did not appear to focus on
occupational stress and/or the South African setting).
Table 3: Results of search relating to occupational stress studies
(Database: PubMed and DOAJ;* term used: ‗occupational stress in South Africa‘*)
Profession-specific studies
Not specific
to a
profession
Not applicable
Health Security
services Education
Other
professions
n = 13 n = 5 n = 3 n = 4 n = 3 n = 31
22 % 8 % 5 % 7 % 5 % 53 %
* Search undertaken on 18 February 2014
18
Of the studies that were applicable, most were specific to a professional category,
with health, security service (such as police personnel) and education being mostly
represented. Selected studies, that give some representation of the range and type
analyses undertaken in each of these main professional groups, are outlined below.
2.8.1. Occupational stress and health professionals
In a 2006 study, Thomas and Valli assessed the levels of occupational stress
amongst doctors in a public sector setting.7 They analyzed data from a sample of
doctors (n=50) working in the same public sector hospital. The sample represented a
range of clinical disciplines, and included doctors completing their internship and
community service as well as heads of departments. The results showed that
doctors had lower job satisfaction and higher levels of perceived mental ill health as
compared to normative mean scores. They also had higher levels of stressors
across all sources of pressure measured as compared to normative means, with the
differences being statistically significant (p < 0.05).7
Moving to the domain of nursing, Van der Colff and Rothmann examined the
complex relationship between the following five factors: occupational stress, (a
sense of) coherence, burnout, coping and work engagement.55 Their study sample
consisted of registered nurses (n=818) mainly from the Gauteng province. It was
found that high levels of occupational stress, a low level of a sense of coherence and
passive coping mechanisms (such as the venting of emotions) predicted both
burnout and poor work engagement.55
19
2.8.2. Occupational stress in policing services
Literature on workplace stress experienced by police personnel in the South Africa
setting can also be found. A germane study, undertaken by Pienaar and Rothmann
in 2006, considered occupational stress in the South African Police Service (SAPS).
The specific study objective was to develop (and validate) an instrument that could
measure stressors experienced by SAPS officers. A cross-sectional design was
selected and stratified random samples of police officer (n=2145) from eight out of
the nine provinces in South Africa were obtained. Using a novel Police Stress
Inventory, the study found there to be three ―internally consistent‖ factors relating to
occupational stress amongst SAPS personnel, namely: job demands, lack of support
and crime-related stressors.10
2.8.3. Occupational stress in education settings
In terms of basic education, Emsley et al. undertook research involving school
teachers (n=81) in Cape Town who had been declared permanently disabled due to
a psychiatric illness. Most (66.8%) indicated that work-related stress had been an
important contributing factor to their condition.56
Studies have also been conducted at the higher education level. Coetzee and
Rothmann, for example, undertook a cross-sectional study of academic and support
staff (n=372) at a South African university and found that physical and psychological
stress levels among the study group to be higher than international norms.8 A
summary of key elements of the selected studies is provided in table 4.

20
Table 4: Summary of selected occupational stress studies in South Africa
Author(s) Category Participants Assessment tools/methods Main findings Implications/recommendations
Thomas and
Valli7
Health
(Medicine)
Doctors
representing a
range of clinical
disciplines in a
public sector
hospital (n = 50)
- Occupational Stress Indicator
(OSI)
- Higher levels of perceived
mental ill health and lower
levels of job satisfaction as
compared to normative scores.
- Higher levels of stressors
across all sources of pressure
measures.
- Increase in organisational
support/resources.
- Introduction of targeted
stress management.
Van der Colff
and
Rothmann 55
Health
(Nursing)
Registered nurses
mainly from the
Gauteng province
(n = 818)
- Nursing Stress Inventory
- Orientation to Life Questionnaire
- Coping Orientation for Problem
Experienced Questionnaire
- Maslach Burnout Inventory-
Human Services Survey (MBI-
HSS)
- Utrecht Work Engagement Scale
- Occupational stress was due
to high work demands and
poor organisational support
- Stress was, in turn,
associated with emotional
depletion and a sense of
depersonalization
- Increase in organisational
support/resources.
- Introduction of stress
management (specifically
coping strategies).
- Provision of clear information
with regards to work
expectations.
- Reduction of job demands.
- Education related to coping
strategies.
- Enhancement of relationships
with the professional team
(e.g. with doctors).
Pienaar and
Rothmann10
Police SAPS personnel
from eight
provinces
(n = 2145)
- Police Service Inventory - Three ―internally consistent‖
factors related to occupational
stress were identified, these
were: job demands, lack of
support and crime-related
- Increase in organisational
support/resources.
- Introduction of targeted
stress management.

21
stressors.
. Education
(Basic)
Teachers in Cape
Town (who had
been declared
permanently
disabled due to
psychiatric
condition) (n = 81)
- Semi-structured
psychiatric interview
- Patient record review
- Collateral information
- Relatively young participants
(mean: 44 years; SD: 6.1);
most (67%) indicated that
work-related stress had been
an important contributing factor
to their condition.
- Reduction of job demands
(decrease workload)
- Better discipline in class-
room (reduced stressor).
- Early identification of
vulnerable staff members.
Coetzee and
Rothman8
Education
(Higher)
Academic and
support staff at a
higher education
institution (n = 372)
- An Organisational Stress
Screening Tool (ASSET)
- They were higher levels of
occupational stress as
compared to international
norms.
- Increase in organisational
support.
- Changes in decision-making
processes (e.g. ―consensual
decision-making‖)..
- Increased organisational
commitment (individuals‘
commitment to organisation &
vice versa).
- Development of a equitable
reward and resource
distribution system.

22
2.9. Summary of literature review
This brief survey has endeavoured to provide a description of some of the key
literature relevant to occupational stress. Epidemiological studies have revealed a
relatively high prevalence of occupational stress within different country settings, with
prevalences varying by age-group and industry type.
Occupational stress was shown to be multi-factorial in terms of risks, and its
outcomes could be categorized into physiological, psychological and behavioural
sequelae (with the latter having implications for both the individual and the
organisation). While a range of measurement tools were identified in the literature,
particular attention was given to the COPSOQ due to its wide use and extensive
reliability testing. Finally, generic models of occupational stress management were
identified, and importance of assessing psychosocial risks was highlighted.
Finally, key research gaps pertaining to the South African setting that have been
revealed through the literature review process are:
1. Lack of specific instrument (questionnaire) reliability studies. Studies
that concentrate mainly on the reliability testing of occupational stress
questionnaires in international settings were discovered in the literature (e.g.
Thorsen and Bjorner48). However, there has not been a similar focus within
the South African setting.

23
2. Limited general prevalence data and occupational focus within the
South African setting. There are no nationally representative
epidemiological data available for occupational stress. Furthermore, local
studies have tended to focus on stress in specific professions (such as
education, health and police services). The consideration of other occupations
would allow for better comparative analysis as well as delineation of the
extent of occupational stress in the country.
3. Paucity of occupational stress intervention analysis within the South
Africa setting. There appears to be a need for more studies on the
development of work-related stress management models appropriate to South
African workforces. An important step towards this would be greater analysis
of contextual psychosocial risk factors related to occupational stress.
The research gaps identified above articulate, to a considerable extent, with the
study objectives of instrument testing, prevalence measurement and risk factor
analysis in a South African workforce setting.

24
CHAPTER THREE
3. Methodology
3.1. Chapter overview
This chapter will provide details of the methodological approach adopted in the
study. It will include a description of the study‘s design and setting; will provide
information on the target population and sampling technique undertaken, and will
discuss the data collection and analysis employed in terms of instrument reliability
testing, prevalence measurement and risk factor analysis.
3.2. Study design
A cross-sectional descriptive and analytical study was undertaken using primary
data.
3.3. Study setting
The study was based at Chris Hani Baragwanath Academic Hospital (CHBAH), a
large tertiary healthcare facility based in Soweto, Johannesburg. Opened in
September of 1942, CHBAH is one of the largest hospitals in the world. It occupies
0.70 km2 of land, has approximately 6760 members of staff and 3200 hospital
beds.57,58 Along with Charlotte Maxeke Johannesburg Academic Hospital, Rahima
Moosa Mother and Child Hospital and Helen Joseph Hospital, CHBAH is one of the

25
teaching hospital of the University of the Witwatersrand, and is funded and
administered by the Gauteng Department of Health.57
Figure 2: View of Chris Hani Bargawanath Academic Hospital
Aerial image, with insert of Administration Building
(Sources: Google Maps;59 University of the Witwatersrand60)
3.4. Target population
The target population was the administrative staff of CHBAH as of 31 December
2012. The administrative component of the staff establishment was selected
because it was assumed that the findings would be more generalizable to other
South African administrative workforce settings in many industries (as compared to,
for example, focusing on medical doctors or nurses where the results may have only
been applicable to other health workforces).

26
3.5. Study period
Primary data were collected between February and September of 2013.
3.6. Sampling approach
A stratified sample technique was undertaken. Data of administrative staff were
provided by the human resources department of the hospital. Data fields included
the names, job titles and paypoint descriptions of staff. Using these data, staff
members were then stratified into:
Front line staff: these were staff members who were assumed to engage
regularly with patients/clients. Examples include ward clerks and patient
affairs staff.
Back office staff: these were staff members who dealt with administrative
duties that were assumed to seldom involve direct patient/customer interface.
Examples include staff members from the revenue or asset management
departments.
Managers: this included only staff members with the title ‗middle manager‘ in
the job description field. Other categories of management were too few to
provide an adequate sample size.

27
Distinctions between these categories of staff can be found in the literature.61
Moreover, the rationale for the stratification approach was that the different groups
sampled would, potentially, have different experiences with regards to workplace
stress. Differences in stressors and coping mechanisms have, for example, been
demonstrated between managerial and clerical staff.62,63
Simple random sampling was undertaken for the selection of front line and back
office staff. Details of the sizes of the total, sampled and respondent groups are
given in table 5 below. The slight differences in the target population and study
sample proportions resulted from the exclusion of certain potential participants from
the sampling frame, as is discussed in section 3.7. Furthermore, because the
management stratum was relatively small (n=31), the entire group was sampled.
Table 5: Number of employees in the target population and sampling groups
Job category/strata
Target population
Sampled
group
Final respondents
Final
response
Front line staff 347 147 54 37 %
Back office staff
409 173 90 52 %
Managers 31 31 22 71 %
Total 787 351 166 47 %
3.7. Sample size calculation
Sample sizes need to be calculated in order to give an acceptable margin of error
and statistical power (1-β).64,65 With regards to this study, a margin of error of 10%
(at the 95% confidence level) with a statistical power of 0.80 for detecting the
outcome of stress was determined to be acceptable. The sample size was calculated

28
on the margin of error estimates prospectively, and power was then calculated
retrospectively (as there was no baseline prevalence data for the target population).
An online statistical tool (http://www.raosoft.com/samplesize.html) and STATA
(version 12) were used to carry out the calculations.
According to data provided by CHBAH, a total of 838 employees were on the
administration staff establishment as of 31 December 2012. Of these 51 were
excluded from the sampling frame either because their numbers, in terms of job type,
were too small or because their work activities did not readily fit into one of the three
job categories identified for the purposes of stratification. The final study population
was therefore 787. Using this number, a sample size of 350 would have been
required to achieve a margin of error of 3.9 % - the lower margin of error reflected of
an anticipated low response rate (351 potential participants were included in the
sampled group).
The total response rate was 48.4% (n=170). Four participants were also excluded
from the respondent group either because their actual activities did not fit into one of
the strata or because basic data (such as age group and sex) were missing. This
gave a final response rate of 47.3% (n=166). Using this number, the margin of error
was recalculated to be 6.8% (at the 95% confidence level) with a post-hoc
calculation of power > 0.90; these values were well within the set level of
acceptability.
29
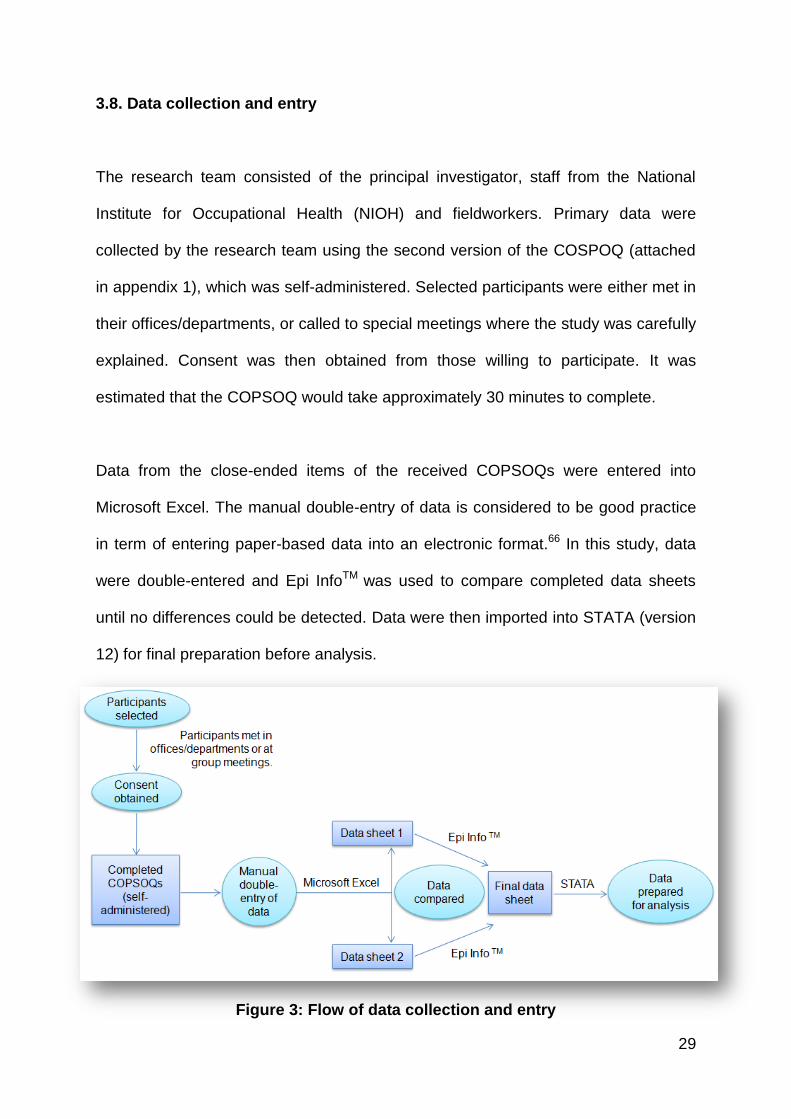
3.8. Data collection and entry
The research team consisted of the principal investigator, staff from the National
Institute for Occupational Health (NIOH) and fieldworkers. Primary data were
collected by the research team using the second version of the COSPOQ (attached
in appendix 1), which was self-administered. Selected participants were either met in
their offices/departments, or called to special meetings where the study was carefully
explained. Consent was then obtained from those willing to participate. It was
estimated that the COPSOQ would take approximately 30 minutes to complete.
Data from the close-ended items of the received COPSOQs were entered into
Microsoft Excel. The manual double-entry of data is considered to be good practice
in term of entering paper-based data into an electronic format.66 In this study, data
were double-entered and Epi InfoTM was used to compare completed data sheets
until no differences could be detected. Data were then imported into STATA (version
12) for final preparation before analysis.
Figure 3: Flow of data collection and entry

30
3.9 Data analysis
3.9.1. Software used for statistical analysis
Data were analyzed using STATA (version 12) and Microsoft Excel.
3.9.2. Variables
Table 6 provides a description of the variables used in data analysis.
3.9.2.a. Demographic variables
Gender
This was a simple dichotomous variable of male or female.
Age group
Categories/groups were used as described in the COPSOQ:
o Under 30 years
o 30 to 39 years
o 40 to 49 years
o 50 to 59 years
o 60 years or more
Job categories
These were the categories used during the stratification process:
o Front line staff
o Back office staff
o Managers

31
Table 6: Demographic, exposure and outcome variables used in analysis
Variable group Variable name Variable type Data source
Demographics
Gender Categorical (nominal)
COPSOQ data field
Age group Categorical
(nominal) COPSOQ data field
Job category Categorical
(nominal) Added during stratification
Exposures
Quantitative demands Numerical COPSOQ scale
Work pace Numerical COPSOQ scale
Emotional demands Numerical COPSOQ scale
Influence Numerical COPSOQ scale
Possibilities for development
Numerical COPSOQ scale
Meaning of work Numerical COPSOQ scale
Commitment to workplace Numerical COPSOQ scale
Predictability Numerical COPSOQ scale
Rewards (recognition) Numerical COPSOQ scale
Role clarity Numerical COPSOQ scale
Role conflicts Numerical COPSOQ scale
Quality of leadership Numerical COPSOQ scale
Social support from colleagues
Numerical COPSOQ scale
Social support from supervisors
Numerical COPSOQ scale
Social community at work Numerical COPSOQ scale
Job satisfaction Numerical COPSOQ scale
Work-family conflict Numerical COPSOQ scale
Mutual trust between employees
Numerical COPSOQ scale
Trust regarding management
Numerical COPSOQ scale
Justice and respect Numerical COPSOQ scale
Offensive behaviour Numerical Composite of COPSOQ scales
Outcomes
Self-rated health Numerical COPSOQ scale
Sleeping troubles Numerical COPSOQ scale
Burnout Numerical COPSOQ scale
Stress Numerical COPSOQ scale

32
3.9.2.b. Exposure and outcome variables
Exposure and outcome variables were selected from the COPSOQ scales.
Descriptions of these scales are provided in the medium-size questionnaire guidance
document (appendix 2). As is detailed in the document, each scale is comprises one
to four of questions/items. Each item, in turn, is arranged in a Likert scale of four or
five points. The points are equally weighted and assigned a score between 0 and
100 in an ordinal progression (for example, scores on a 5-point item would be 0, 25,
50, 75 and 100). The scores from each item in a scale can then be averaged, and
individual and/or group means can be calculated for each scale. In this way, the
ordinal data of the scales are effectively transformed into numerical data.
Exposure variables
Mean values from the following scales were used as exposure variables in the study
(the variables are arranged into groups as identified by Thorsen and Bjorner48, with
the number of items in each variable/scale used provided in brackets).
―Demands at work‖ variables:48 quantitative demands (4), work pace (3) and
emotional demands (4)
―Work organisation and job contents‖ variables:48 influence (4), possibilities for
development (4), meaning of work (3) and commitment to workplace (4).
―Interpersonal relations and leadership‖ variables:48 predictability (2), rewards
(recognition) (3), role clarity (3), role conflicts (4), quality of leadership (4),

33
social support from colleagues (3), social support from supervisors (3) and
social community at work (3).
―Work-individual interface‖ variables:48 job satisfaction (4) and work-family
conflict (4).
―Values at the workplace‖ variables:48 trust regarding management (4), mutual
trust between employees (3) and justice and respect (4).
In addition to the above, an offensive behaviour variable was included.
Offensive behaviour does not appear as a single scale in the COPSOQ scales
guidance document (appendix 2), but rather as description of a group
comprising individual scales which assessed if any of the following had been
experienced in the last year: physical violence, threats of violence, bullying
and sexual harassment.43 However, because data from these items showed
such a low prevalence (as detailed in the section 4.4) they were, for the
purposes of this study, combined to form a single outcome variable.
Outcome variables
Mean values of the following variables were used to describe outcomes (details of
these COPSOQ scales can be found in appendix 2)
Self-rated health:

34
This was composed of a single item, and is the only positive outcome
variable.
Sleeping troubles:
Items related mainly to issues of insomnia.
Burnout:
Items pertain to burnout symptoms experienced in the last four weeks.
Stress:
Items, again, relate only to symptoms experienced in the last four weeks. This
is, by definition, the primary variable of concern in the study. In terms of
measuring stress as an effect, the concept of a minimal important difference
(MID) needs to be briefly explained. Shi et al. have defined the MID as:
―… the smallest change in a score for a patient that indicates an actual
change between two time points; that is, the MID is the minimum change
in a score that likely reflects actual change rather than a variation in
measurement.‖ 67 (p.1)
The MID has frequently been used as a measure in quality of life studies.68,69
In terms of the COPSOQ, a study related to the first version of the
questionnaire found that, for most of the scales, 0.5 of the standard deviation
(SD) represented a MID. This value is, therefore, used to calculate the effect
measure in this study.
35
As there is no baseline measure of stress in the target population, the
average values presented in the COPSOQ scales guidance document
(appendix 2) and the original study by Pejtersen et al.43 were used as the
references/baselines. As they reported an average score for stress of 26.7
and a SD of 17.7, any score above 35.55 (that is, the reference mean of
stress + MID) was considered to be indicative of the presence of stress.
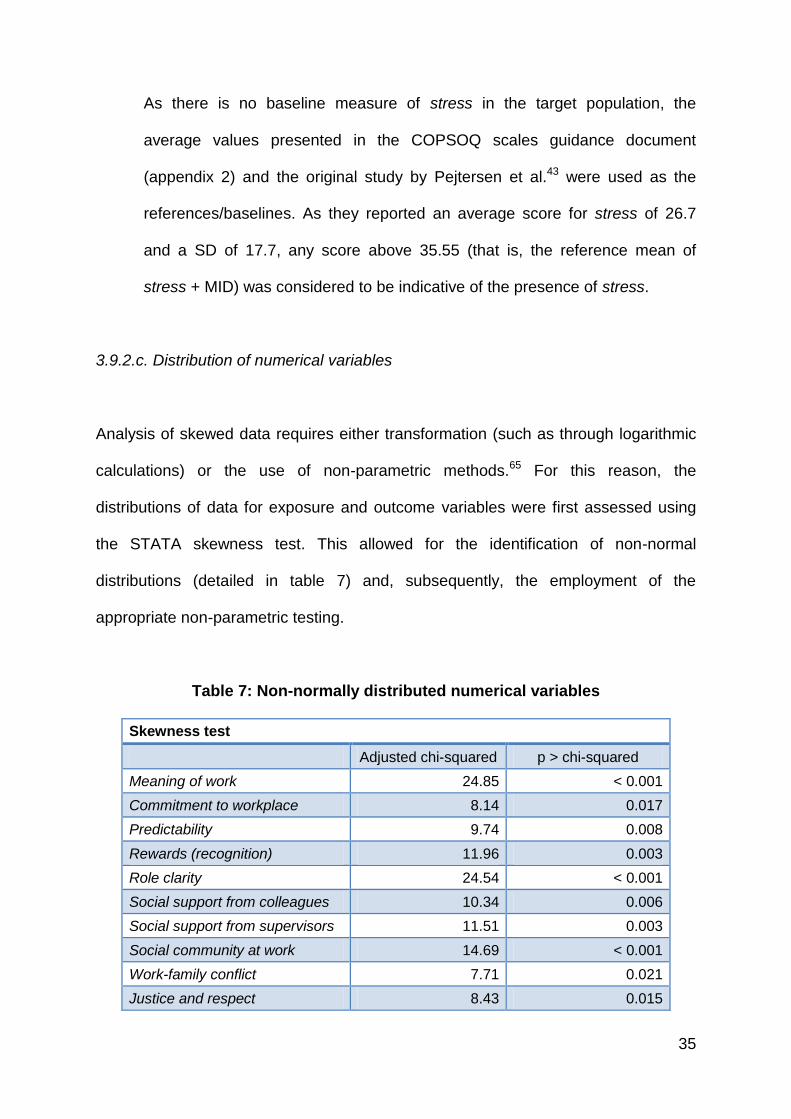
3.9.2.c. Distribution of numerical variables
Analysis of skewed data requires either transformation (such as through logarithmic
calculations) or the use of non-parametric methods.65 For this reason, the
distributions of data for exposure and outcome variables were first assessed using
the STATA skewness test. This allowed for the identification of non-normal
distributions (detailed in table 7) and, subsequently, the employment of the
appropriate non-parametric testing.
Table 7: Non-normally distributed numerical variables
Skewness test
Adjusted chi-squared p > chi-squared
Meaning of work 24.85 < 0.001
Commitment to workplace 8.14 0.017
Predictability 9.74 0.008
Rewards (recognition) 11.96 0.003
Role clarity 24.54 < 0.001
Social support from colleagues 10.34 0.006
Social support from supervisors 11.51 0.003
Social community at work 14.69 < 0.001
Work-family conflict 7.71 0.021
Justice and respect 8.43 0.015

36
3.9.3. Description of study sample
The analysis commenced with a brief description of the study sample. Frequencies,
proportions and ratios were used for describing the demographic variables of sex,
age group and job category (as these are appropriate measures of nominal data).65
3.9.4. Reliability testing
In terms of meeting the first research objective, an analysis of the reliability of the
COPSOQ in the study setting was undertaken. Internal consistency, or the extent to
components of an instrument relate to one another and measure the same
characteristic, is an important gauge of the reliability of a questionnaire.65
With regards to this, the Cronbach‘s alpha was used to assess the reliability of the
COPSOQ in the study setting. Cronbach‘s alpha is a numerical coefficient (ranging
from 0 to 1) that is frequently used to test internal consistency70,71 and has, indeed,
been utilized in assessments of the COPSOQ.49,51 Data from the study sample were
used to calculate alpha values for all of the scales, which were then compared to the
original alpha values of the second version of the COPSOQ reported by Pejtersen et
al.43
A number of suggestions have been made with regards to limits of acceptability in
terms of alpha values. An alpha ≥ 0.7 has generally been considered to be
indicative of reliability, while levels < 0.5 have been deemed unacceptable.71–73 On
the upper end, it has been argued that although higher alpha levels are desirable,

37
values above 0.9 may actually indicate redundancy and could suggest a need to
reduce the length of the test (by, for example, removing potentially repetitive
items).72 Table 8 shows the values that will be used as a reference for this study.
Table 8: Threshold guideline for Cronbach’s alpha values
(sources: Tavakol and Dennick;72Gliem and Gliem73)
alpha value
Possible redundancy >0.9
Good >0.8 to ≤0.9
Acceptable >0.7 to ≤0.8
Questionable >0.6 to ≤0.7
Poor >0.5 to ≤0.6
Unacceptable <0.5
3.9.5. Prevalence measurement
3.9.5.a. Variable analysis
An analysis of all of the exposure and outcome variables was undertaken. Moreover,
differences between the study outcome and exposure variables and the reference
values provided by the COPSOQ scales guidance document (appendix 2) were then
analyzed. This involved one sample t-tests for normally distributed data and the
Wilcoxon signed-rank test (non-parametric) test for non-normally distributed
data.65,74In keeping with the conventional reporting of measures of central tendency
and spread, variables with normally distributed data were described in terms of
means with SD, while non-normally data were reported as medians with the inter-
quartile range (IQR).65
38
3.9.5.b. Description of stress data
Data relating to stress were then analyzed in greater detail. Stress was described in
relation to the demographic variables, and key findings (in terms of higher
prevalences) were reported.
3.9.5.c. Stress and other outcome variables
Stress was further related to the other outcomes of burnout, sleeping troubles and
self-rated health using paired t-tests. To determine if there was a linear relationship
between stress and these variables, the Pearson product moment, or correlation
coefficient (r), was also calculated.65
3.9.5.d. Analysis of variance in relation to stress
The variance of stress with regards to the demographic variables was assessed. As
these independent variables were all categorical and the dependent variable (stress)
was a normally distributed continuous, numerical variable, a two sample t-test was
used for sex and a one-way analysis of variance (ANOVA) was conducted for age
group and job category.74 Where a significant difference was detected, the
demographic variable concerned was also tested in relation to each of the exposure
variables (using either the one-way ANOVA or the Kruskal-Wallis test for normally or
non-normally distributed data, respectively74). This was because an association with
both the outcome and exposure variables would suggest potential confounding.65

39
Finally, a test for homogeneity was conducted to determine if there was any effect
modification by the relevant variable(s).75
3.9.6. Analysis of risk factors
3.9.6.a. Test for multicollinearity.
Multicollinearity describes a linear relationship between exposure variables, and is
an important consideration in multivariate regression modelling.76 To assess the
presence, or level, of multicollinearity, all of the exposures were first regressed
against stress, and variance inflation factors (VIFs) were measured. The suggested
cut-off of 𝑉𝐼𝐹 = 2 was used as the upper limit (any value above this would be
considered to indicate an unacceptable level of collinearity).77
3.9.6.b. Logistic regression
Logistic regression allows for the analysis of potential associations between a single
categorical dependent variable and a one or more independent exposure variables;
these associations can be expressed in terms of odds ratios (ORs).78 The simple
logistic regression undertaken in this study involved the following steps:
Creation of binary variables: Binary variables were created for all of the
exposure variables. In all instances (expect for one) this involved using the
reference values in the COPSOQ scales guidance document (appendix 2) as
cut-off points. For example, the binary of the quantitative demands variable

40
would be 0 if less than or equal to 40.2, and 1 if greater than this value. The
exception to this was the offensive behaviour variable where exposure to any
physical violence, threats of violence, bullying and/or sexual harassment was
given the value of 1 while no exposure was 0. This was because there was a
relatively low prevalence of the individual components of offensive behaviour
(as described in 4.4).
A stress binary was created as the dependent variable for the logistic
regression modelling. The reference mean plus the MID (0.5 SD) was used as
the threshold for stress. As a result, any value greater than or equal to 35.55
was 1, and any value less than this was 0.
Bivariate logistic regression: Bivariate analysis was then carried out to
determine ORs between stress and individual exposures. The null hypothesis
was that no such relationship existed – only in instances where this could be
rejected with a p-value < 0.2 were the exposure variables carried over into
multivariate analysis. Furthermore, any variable derived from a COPSOQ
scale with a Cronbach‘s alpha value < 0.5 was also excluded at this stage
because this level of reliability was considered to be too low for inclusion in
final modelling.73
Multivariate logistic regression: Exposure variables that survived the bivariate
round of analysis were then entered into a forward step-wise regression
model. Step-wise regression involves both the forward and backward
selection of variables to be entered into the prediction equation.65,79 The
41
variable removal cut-off was set at a significance level p ≥ 0.2, and the
variable addition level at p < 0.05. For all multivariate analyses, the STATA
‗lockterm‘ command was used to keep job category in the modelling.
Because differences in terms of exposures and responses to occupational
stress have been described between males and females,80–82 further logistic
regression was conducted to assess if there were any dissimilarities in risk
factors by sex.
Goodness-of-fit of the model: The final multivariate logistic model was
subjected to the Hosmer and Lemeshow‘s goodness of fit test. A value of p ≥
0.05 was interpreted to be acceptable with regards to the model‘s fit to the
data.65
Predictive performance of the model: Receiver operating characteristic (ROC)
curve analysis was also undertaken. ROC curves can be used to test the
predictive performance of logistic models.83,84
For this test, the model‘s ability to predict stress (using the binary definition)
based on statistically significantly exposures was determined by calculating,
and graphically displaying, the area under the ROC curve.
It is important to note that an a priori argument was applied here: stress would only
be defined as being work-related, or occupational, if a statistically significant harmful
relationship, in terms of OR, was shown between at least one of the exposure

42
variables (which were all work-based) and stress. Indeed, if no such relationship
existed, then the stress described in the study could not be labeled as occupational
stress.
3.9.6.c. Ordinal logistic regression
Ordinal logistic regression applies when the dependent variable data are in the form
of a number of ordered categories.78 This was used an additional analytical approach
for the purpose of examining potential associations related to different levels of
stress. Moreover, while the initial logistic regression modelling sought to answer the
question of which variables would be significant between no stress and stress (in
terms of MID), the ordinal regression aimed to identify variables that would be
significant between a lower level of stress and a higher one.
In order to conduct this type of regression, orders/levels of stress had to first be
determined. This involved clustering the employees who had stress into distinct
groups of at least 30 people each (so as to avoid the statistical challenges of dealing
with smaller group sizes).85
Using MIDs as basic units, a low stress group (≥ 1 MID and < 3 MID) and a high
stress group (≥ 3 MID) were, ultimately, utilized as the dependent variables in the
ordinal regression - this allowed for the analysis of two groups of appropriate size.

43
Figure 4: Flow of data analysis
3.10. Ethical considerations
3.10.1. Permission
Ethical approval to conduct the research was obtained from the Human Research
Ethics Committee (Medical) of the University of the Witwatersrand (clearance
certificate: M120920) on 28 September 2012 (appendix 3). Permission to conduct to
research was also sought, and obtained, from the Medical Advisory Committee of
CHBAH of 23 January 2013 (appendix 4).

44
3.10.2. Consent and anonymity
Kristensen has developed ―soft guidelines‖ for surveys that use the COPSOQ.86 One
of the recommendations is that all participants should be made anonymous, and that
active consent be obtained if the study group consists of less than 15 persons. Part
of the rationale behind this is that, given the small size of the group, individuals may
be concerned about their anonymnity.86
Even though the aim was to obtain a sample size substantially larger than 15, active
consent was still sought from individuals participating in this study. Respondents
were asked to sign a consent form (appendix 5) before completing the questionnaire.
Furthermore, a study information sheet, explaining the nature of the research and
addressing some of the possible questions that may be asked, was also provided
(appendix 6). With regards to anonymity, unique study numbers were assigned to
participants and these were recorded (instead of names) on the consent form and
the questionnaire. In this way, the identities of the respondents were kept secure.

45
CHAPTER FOUR
4. Results
4.1. Chapter overview
This chapter will detail the main findings of the study. It will begin by reporting on
summative data of the study sample. Results of the reliability testing of the COPSOQ
will then be described, followed by prevalence measurement findings related to
stress and other variables. Finally, the data produced through analysis of risk factors
will be presented; this will include key findings of both the simple and ordinal logistic
regression modelling.
4.2 Description of the study sample
The study sample was described in terms of the demographic variables of age
group, sex and job category. Most respondents (84.3% of the total sample) were
between 30 and 59 years of age, with the largest single group being females in the
30 to 39 years age group (21.7%). There was a greater female:male employee ratio
in the overall sample (1.8:1), a general pattern that held true in all job categories
except for the managers group, were the female:male ratio was almost reversed
(1:1.75). Indeed, a chi-squared test revealed a statistically significant difference
between job category and gender (p = 0.007).

46
Managers represented the smallest job category group (13.3%), while back office
staff was the largest (54.2%). Details of distributions according to demographic
variables are given in tables 9 and 10.
Table 9: Sex distribution by age group
Females Males
Group % of total sample
Age group n % of total sample
n % of total sample
Under 30 years 12 7.2% 7 4.2% 11.4%
30 to 39 years 36 21.7% 19 11.4% 33.1%
40 to 49 years 27 16.3% 17 10.2% 26.5%
50 to 59 years 26 15.7% 15 9.0% 24.7%
Over 60 years 6 3.6% 1 0.6% 4.2%
Total 107 64.5% 59 35.5% 100.0%
Table 10: Sex and age group distribution by job category
Front line staff (n)
Back office staff (n)
Managers (n)
Total (n)
Gender
Male 20 25 14 59
Female 34 65 8 107
Age group
Under 30 years 5 14 0 19
30 to 39 years 11 42 2 55
40 to 49 years 18 17 9 44
50 to 59 years 18 13 10 41
Over 60 years 2 4 1 7
Job category total 54 90 22 166
Job category total (%) 32.5% 54.2% 13.3% 100.0%

47
4.3. Reliability testing
The reliability scores of the COPSOQ within the study setting, in terms of Cronbach‘s
alpha values, are given in table 11. A score for self-rated health was not included as
this was a single-item scale; an alpha value could, therefore, not be calculated.
Table 11: Reliability of scales using Cronbach’s alpha
Scale groups
(from Thorsen and Bjorner
48)
Scale Respondents
(n)
Study sample (alpha)
Reference
(alpha)*
Demands at work
Quantitative demands 160 0.61 0.82
Work pace 160 0.68 0.84
Emotional demands 162 0.52 0.87
Work organisation and job contents
Influence 160 0.54 0.73
Possibilities for development
161 0.31 0.77
Meaning of work 164 0.39 0.74
Commitment to workplace
162 0.65 0.77
Interpersonal relations and
leadership
Predictability 164 0.55 0.74
Rewards (recognition) 165 0.75 0.83
Role clarity 162 0.58 0.78
Role conflicts 163 0.60 0.67
Quality of leadership 165 0.85 0.89
Social support from colleagues
165 0.70 0.70
Social support from supervisors
164 0.82 0.79
Social community at work
165 0.60 0.86
Work-individual interface
Job satisfaction 162 0.72 0.82
Work-family conflict 165 0.71 0.80
Values at the workplace
Mutual trust between employees
164 0.56 0.77
Trust regarding management
164 0.62 0.80
Justice and respect 163 0.76 0.83
Health and well-being
Sleeping troubles 164 0.82 0.86
Burnout 163 0.83 0.83
Stress 163 0.80 0.81
*COPSOQ scales guidance document (appendix 2).

48
As is demonstrated, there was a wide range of alpha values in the study sample data
(0.31 to 0.85) as compared to the reference data (0.67 to 0.89). Low alpha values
were seen in the ‗work organisation and job contents‘ group of scales in the sample
data, which were also relatively low in the reference values, while high alpha values
were observed in the ‗health and well-being‘ group of scales (which consist of most
of the measures used as outcome variables, including stress). The offensive
behaviour scale is not included in table 11 because it was composed of individual,
single-item COPSOQ scales (as described in section 3.9.2.b) and, therefore, did not
have a reference value. However, an alpha of 0.56 was calculated for this scale.
Table 12 shows the percentages of scales using the alpha acceptability thresholds
(discussed in section 3.9.4). A graphical display of the sample and reference alpha
values, against the lower threshold value of 0.5 and the upper limit at 0.9, is given in
figure 5. As can be seen, the scales of possibilities for development and meaning of
work in the study sample fall below the lower threshold of reliability.
Table 12: Performance of scales in terms of reliability thresholds
(sources: Tavakol and Dennick;72Gliem and Gliem73)
Proportion of scales from
study sample
Possible redundancy (> 0.9) 0%
Good (>0.8 to ≤0.9) 16.7%
Acceptable (>0.7 to ≤0.8) 20.8%
Questionable (>0.6 to ≤0.7) 20.8%
Poor (>0.5 to ≤0.6) 33.3%
Unacceptable (< 0.5) 8.3%

49
Figure 5: Cronbach’s alpha values with upper and lower threshold limits
0.00
0.10
0.20
0.30
0.40
0.50
0.60
0.70
0.80
0.90
1.00
Study sample alpha
Reference value alpha
Lower limit
Upper limit
Cro
nb
ach
‘s a
lpha

50
4.4. Prevalence measurement
4.4.1. Variable analysis
Before focusing on prevalence with regards to the stress variable, a ‗snapshot‘ of the
sample data related to all of the exposure and outcome variables will be provided.
This is shown in table 13. The variable data are statistically significantly different
(p < 0.05) compared to the reference average for all of the variables except for
predictability, rewards (recognition), quality of leadership and social community at
work.
In terms of exposure variables, the employees reported a higher work pace and
greater emotional demands at work as compared to the reference values. They
reported that they had less influence, and that there were greater role conflicts.
There were also lower levels of job satisfaction, mutual trust between employees,
trust regarding management and justice and respect in the workplace. Although
there was no reference mean for offensive behaviour, prevalence values for the
individual components were available. This is shown in table 14. As can be seen,
there was a higher exposure to all of the types of offensive behaviour in the study
sample, especially with regards to physical violence and bullying.
Finally, the means of all of the outcome variables (including stress) were statistically
significantly higher in the sample data, except for self-rated health, which was
significantly lower.

51
Table 13: Results of exposure and outcome variable analysis
Scale groups
(from Thorsen and Bjorner
48)
Variable Study
sample
Reference values,
mean (+/-SD)*
p-value
Demands at work
Quantitative demands
37.2 (20.5) i 40.2 (20.5) 0.034
Work pace 64.6 (23.3) i 59.5 (19.1) 0.003
Emotional demands 46.2 (21.4) i 40.7 (24.3) 0.001
Work organisation and job contents
Influence 46.5 (22.4) i 49.8 (21.2) 0.032
Possibilities for development
69.2 (17.7) i 65.9 (17.6) 0.010
Meaning of work 83.3 (66.7-91.7) ii 73.8 (15.8) < 0.001
Commitment to workplace
68.8 (50.0-87.5) ii 60.9 (20.4) < 0.001
Interpersonal relations and
leadership
Predictability 50.0 (37.5-75.0) ii 57.7 (20.9) 0.2414
Rewards (recognition)
58.3 (41.7-83.3) ii 66.2 (19.9) 0.4364
Role clarity 83.3 (66.7-91.7) ii 73.5 (16.4) < 0.001
Role conflicts 46.8 (21.4) i 42.0 (16.6) 0.002
Quality of leadership
58.3 (25.4) i 55.3 (21.1) 0.069
Social support from colleagues
66.7 (41.7-83.3) ii 57.3 (19.7) 0.001
Social support from supervisors
75.0 (33.3-91.7) ii 61.6 (22.4) < 0.001
Social community at work
83.3 (66.7-100.0) ii 78.7 (18.9) 0.756
Work-individual interface
Job satisfaction 60.0 (18.6) i 65.3 (18.2) < 0.001
Work-family conflict 25.0 (16.7-50.0) ii 33.5 (24.3) 0.008
Values at the workplace
Mutual trust between employees
51.0 (18.4) i 68.6 (16.9) < 0.001
Trust regarding management
58.7 (17.8) i 67.0 (17.7) < 0.001
Justice and respect 50.0 (31.3-68.8) ii 59.2 (17.7) < 0.001
Health and well-being
Self-rated health 50.6 (24.1) i 66.0 (20.9) < 0.001
Sleeping troubles 36.4 (21.9) i 21.3 (19.0) < 0.001
Burnout 45.6 (21.1) i 34.1 (18.2) < 0.001
Stress 38.8 (19.7) i 26.7 (17.7) < 0.001
i. Normally distributed, expressed as mean (+/- SD) and one sample t-test used.
ii. Non-normally distributed, expressed as median (IQR) and Wilcoxon signed-rank test used.
*COPSOQ scales guidance document (appendix 2).
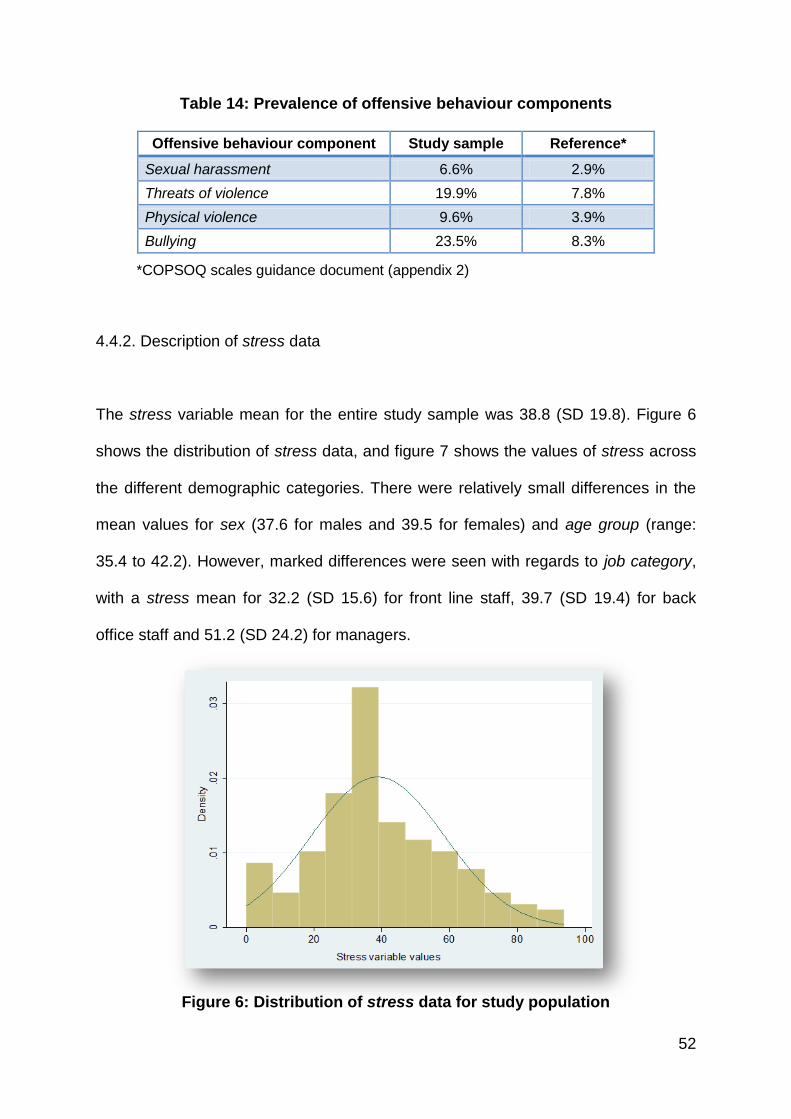
52
Table 14: Prevalence of offensive behaviour components
Offensive behaviour component Study sample Reference*
Sexual harassment 6.6% 2.9%
Threats of violence 19.9% 7.8%
Physical violence 9.6% 3.9%
Bullying 23.5% 8.3%
*COPSOQ scales guidance document (appendix 2)
4.4.2. Description of stress data
The stress variable mean for the entire study sample was 38.8 (SD 19.8). Figure 6
shows the distribution of stress data, and figure 7 shows the values of stress across
the different demographic categories. There were relatively small differences in the
mean values for sex (37.6 for males and 39.5 for females) and age group (range:
35.4 to 42.2). However, marked differences were seen with regards to job category,
with a stress mean for 32.2 (SD 15.6) for front line staff, 39.7 (SD 19.4) for back
office staff and 51.2 (SD 24.2) for managers.
Figure 6: Distribution of stress data for study population
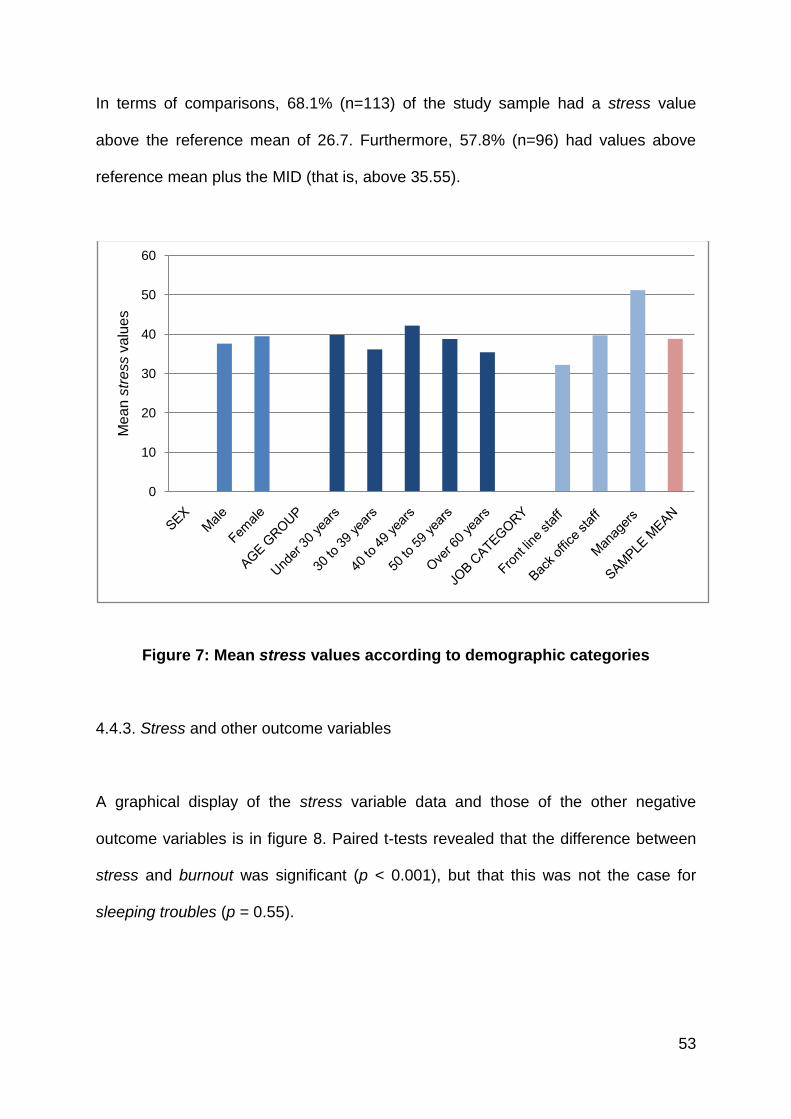
53
In terms of comparisons, 68.1% (n=113) of the study sample had a stress value
above the reference mean of 26.7. Furthermore, 57.8% (n=96) had values above
reference mean plus the MID (that is, above 35.55).
Figure 7: Mean stress values according to demographic categories
4.4.3. Stress and other outcome variables
A graphical display of the stress variable data and those of the other negative
outcome variables is in figure 8. Paired t-tests revealed that the difference between
stress and burnout was significant (p < 0.001), but that this was not the case for
sleeping troubles (p = 0.55).
0
10
20
30
40
50
60
Me
an
str
ess
va
lue
s

54
Figure 8: Box plots of outcome variables
Linear relationships between stress and the other negative outcome variables are
shown in figures 9 and 10. As can be seen, a positive correlation existed between
stress and burnout (r=0.71), and stress and sleeping troubles (r=0.65). As could be
anticipated, stress was negatively correlated to self-rated health (r= - 0.28).
Figure 9: Two way scatter plot of stress and burnout data

55
Figure 10: Two way scatter plot of stress and sleeping troubles data
4.4.4. Analysis of variance in relation to stress
Variance in relation to the stress variable was not significant for sex (p = 0.57) and
age group (p = 0.65); these two variables were, therefore, excluded as potential
confounders. However, ANOVA testing found there to be a statistically significant
difference for job category (p < 0.001). Further testing found significant differences in
the variance of job category with the following exposure variables: quantitative
demands (p = 0.005), emotional demands (p < 0.001), commitment to workplace
(p = 0.006) and work-family conflict (p = 0.009). Job category was, therefore,
included as a potential confounder in multivariate analyses (described in section 4.5)
In order to determine if job category was also an effect modifier with regards to
stress, a test of homogeneity was carried.75 Specifically the homogeneity of odds
was assessed using job category and the binary of stress. As the stress binary used
the reference value plus MID as a cut-off, a significant test finding would indicate that

56
job category had at least a minimally important modifying effect on stress. However,
as the test found a p-value of 0.09, it was concluded that job category was not a
significant effect modifier with regards to (the MID measure of) stress.
4.5. Analysis of risk factors
4.5.1. Test for multicollinearity
Table 15: Results of multicollinearity testing
Exposure variable VIF 𝑽𝑰𝑭
Quantitative demands 1.2 1.1
Work pace 1.3 1.2
Emotional demands 1.3 1.1
Influence 1.2 1.1
Possibilities for development 1.7 1.3
Meaning of work 1.6 1.3
Commitment to workplace 1.7 1.3
Predictability 1.4 1.2
Rewards (recognition) 2.2 1.5
Role clarity 1.4 1.2
Role conflicts 1.4 1.2
Quality of leadership 1.6 1.3
Social support from colleagues 1.5 1.2
Social support from supervisors 1.7 1.3
Social community at work 1.4 1.2
Job satisfaction 1.4 1.2
Work-family conflict 1.3 1.2
Mutal trust between employees 1.2 1.1
Trust regarding management 1.4 1.2
Justice and respect 1.7 1.3
Offensive behaviour 1.4 1.2
Range 1.2 – 2.2 1.1 – 1.5
Mean 1.5 1.2

57
The results of VIF testing are shown in table 15. The level of multicollinearity was
deemed to be acceptably low as none of the 𝑉𝐼𝐹 values were above 2.77
4.5.2. Logistic regression
4.5.2.a. Bivariate analysis
The bivariate logistic regression findings are displayed in table 16. The most harmful
associations were seen in exposures to offensive behaviour (OR 4.00, 95% CI: 1.97
– 8.13), work-family conflict (OR 3.25, 95% CI 1.65 – 6.40) and high emotional
demands in the workplace (OR 1.58 – 5.78). Variables that were most protective
were social support from supervisors 0.27 (0.13 – 0.56), rewards (recognition) (OR
0.29, 95% CI: 0.15 – 0.55) and the perceived quality of leadership of immediate
supervisors (OR 0.33, 95% CI: 0.17 – 0.64).
4.5.2.b. Multivariate analysis
The findings of multivariate logistic regression can also be seen in table 16. Along
with variables that didn‘t meet the p-value cut-off of p < 0.2, meaning of work was
excluded because of low scale reliability (alpha = 0.39).
Adjusting for job category, risks of stress in the main multivariate logistic regression
model were exposure to any type of offensive behaviour (OR 3.38, 95% CI: 1.54 –
7.43) as well as quantitative demands (OR 2.83, 95% CI: 1.35 – 5.92) and emotional

58
demands (OR 2.32, 95% CI: 1.08 – 4.96), while the only protective factor was the
perceived quality of leadership (OR 0.32, 95% CI: 0.15 – 0.67).
Table 16: Findings of the main logistic regression model
Variable Bivariate Regression Multivariate Regression*
OR 95% CI: Low
to High p-value OR
95% CI: Low to High
p-value
Quantitative demands
2.83 1.47 - 5.46 0.002 2.83 1.35 - 5.92 0.006
Work pace 0.95 0.51 - 1.77 0.882
Emotional demands 3.02 1.58 - 5.78 0.001 2.32 1.08 - 4.96 0.030
Influence 0.79 0.43 - 1.48 0.467
Possibilities for development
0.90 0.48 - 1.70 0.750
Meaning of work 0.46 0.21 - 0.97 0.041
Commitment to workplace
0.38 0.19 - 0.76 0.006
Predictability 0.55 0.30 - 1.03 0.061
Rewards (recognition)
0.29 0.15 - 0.55 < 0.001
Role clarity 0.61 0.31 - 1.22 0.163
Role conflicts 2.05 1.07 - 3.89 0.029
Quality of leadership 0.33 0.17 - 0.64 0.001 0.32 0.15 - 0.67 0.002
Social support from colleagues
0.38 0.19 - 0.75 0.005
Social support from supervisors
0.27 0.13 - 0.56 < 0.001
Social community at work
0.46 0.24 - 0.86 0.016
Job satisfaction 0.38 0.20 - 0.72 0.003
Work-family conflict 3.25 1.65 - 6.40 0.001
Mutual trust between employees
0.47 0.20 - 1.11 0.085
Trust regarding management
0.35 0.18 - 0.68 0.002
Justice and respect 0.53 0.27 - 1.01 0.054
Offensive behaviour 4.00 1.97 - 8.13 < 0.001 3.38 1.54 - 7.43 0.002
* Adjusted for job category.

59
In addition to the main logistic regression model, further analysis showed differences
by sex, as detailed in table 17. Again adjusting for job category, the greatest risk
factor of stress for females was work-family conflict (OR 4.03; 95% CI: 1.45 - 11.21)
while the most protective factor was social support from supervisors (OR 0.28; 95%
CI: 0.08 - 0.93). For males, exposure to offensive behaviour was a significant risk
factor (OR 4.63; 95% CI: 1.15 - 18.63), while the social community at work was
protective (OR 0.18; 95 CI: 0.05 - 0.67).
Table 17: Further multivariate logistic regression, by sex.
Variable Females* Males*
OR 95% CI: Low
to High p-value OR
95% CI: Low to High
p-value
Emotional demands 3.61 1.26 - 10.36 0.017
Rewards (recognition)
0.30 0.10 - 0.89 0.030
Social support from supervisors
0.28 0.08 - 0.93 0.038
Social community at work
0.18 0.05 - 0.67 0.010
Work-family conflict 4.03 1.45 - 11.21 0.008
Offensive behaviour 4.63 1.15 - 18.63 0.031
* Adjusted for job category
4.5.2.c. Goodness-of-fit of the model
Post-estimation application of the Hosmer and Lemeshow‘s goodness of fit test
found a p-value of 0.57, indicating that the main multivariate logistic regression
model fit the data at a level that was acceptable (as the was p-value was ≥ 0.05) .65

60
4.5.2.d. Predictive performance of the model
The result of the ROC curve analysis – which describes the main multivariate logistic
regression model‘s ability to predict stress – is shown in figure 11. The area under
the ROC curve was 0.79 (95% CI 0.72 – 0.86). The curve was, thus, considered to
be significant as the area under it did not cross 0.5.65
Figure 11: ROC curve analysis of main multivariate logistic regression model
4.5.3 Ordinal logistic regression
4.5.3.a. Bivariate analysis (ordinal)
The dependent ordinal variable of stress incorporated no stress (n=70), low stress
(n=50) and high stress (n=39). Bivariate analysis showed that the harmful exposures
identified in ordinal regression were similar to those detected in the main bivariate
logistic regression model (as seen in table 18). Protective exposures were also

61
comparable, with the addition of commitment to workplace (OR 0.42, 95% CI: 0.23 –
0.76).
Table 18: Findings of the ordinal logistic regression model
Variable Bivariate Regression Multivariate Regression*
OR 95% CI: Low
to High p-value OR
95% CI: Low to High
p-value
Quantitative demands
2.64 1.47- 1.47 0.001 2.38 1.27 - 4.46 0.007
Work pace 1.13 0.64 - 1.98 0.681
Emotional demands 2.85 1.55 - 5.27 0.001
Influence 0.77 0.44 - 1.35 0.359
Possibilities for development
0.94 0.53 - 1.67 0.828
Meaning of work 0.48 0.25 - 0.92 0.026
Commitment to workplace
0.42 0.23 - 0.76 0.004 0.46 0.24 - 0.86 0.014
Predictability 0.59 0.33 - 1.05 0.073
Rewards (recognition)
0.31 0.17 - 0.56 < 0.001
Role clarity 0.69 0.37 - 1.27 0.231
Role conflicts 2.44 1.33 - 4.46 0.004
Quality of leadership 0.42 0.24 - 0.75 0.004
Social support from colleagues
0.46 0.25 - 0.83 0.009
Social support from supervisors
0.37 0.20 - 0.67 0.001
Social community at work
0.47 0.27 - 0.84 0.010
Job satisfaction 0.43 0.24 - 0.76 0.004
Work-family conflict 3.25 1.78 - 5.91 < 0.001
Mutual trust between employees
0.63 0.27 - 1.46 0.283
Trust regarding management
0.42 0.23 - 0.79 0.007
Justice and respect 0.53 0.28 - 0.97 0.040
Offensive behaviour 3.88 2.10 - 7.17 < 0.001 3.60 1.92 - 6.75 < 0.001
* Adjusted for job category.

62
4.5.3.b. Multivariate analysis (ordinal)
The results of ordinal multivariate regression modelling indicated that employees
with low stress were at risk of developing high stress if there was exposure to
offensive behaviour (OR 3.60; 95% CI: 1.92 - 6.75) or high quantitative demands
(OR: 2.38; 95% CI: 1.27 - 4.46). Conversely, this transition could be prevented by a
commitment to workplace (OR 0.46; 95% CI: 0.24 - 0.86).
4.6. Summary of results
This chapter has reported on the salient findings of the study. After a brief
description of the study sample, the results of the reliability testing were presented. It
was found that only two (out of 24 scales tested) fell below the unacceptability alpha
threshold. In terms of variable analysis, it was demonstrated that almost all exposure
and outcome variables (including stress) were statistically significantly different from
the reference values. Stress was also correlated with the other outcome variables
(positively with burnout and sleeping troubles, and negatively with self-rated health).
Finally, a significant variation of job category was found in relation to stress and a
number of the exposure variables - job category was, ultimately, adjusted for as a
potential confounding factor.
The main multivariate logistic regression model found three significant risk factors
(exposure to offensive behaviour, quantitative demands and emotional demands) but
only one significant protective factor (quality of leadership). Further analysis found
differences in risk factors with regards to sex, with work-family conflict being most

63
harmful for females, while support from supervisors was the most protective. For
males, exposure to offensive behaviour was a significant risk factor, whereas the
social community at work was protective. Finally, ordinal regression demonstrated
that further exposure to offensive behaviour and quantitative demands were risks for
moving employees from a low stress to high stress, but that a commitment to work
place could help to prevent this escalation.

64
CHAPTER FIVE
5. Discussion
5.1. Chapter overview
This chapter will provide a discussion of the key research findings. Issues related to
the reliability of the COPSOQ within the study setting will be explored, with an
emphasis on possible reasons for (and potential ways of improving) the lower
Cronbach‘s alpha values. The prevalence measurement findings will then be
examined and this, together with a discussion of the risk factor analysis, will allow for
a consideration of the implications of the study findings. Finally, a delineation of
study limitations will be undertaken.
5.2. Reliability testing
5.2.1. Cronbach‘s alpha values
Although the majority of the scales were above the unacceptability threshold of 0.5,
only 37.5% were within the categories ‗acceptable‘ or ‗good.‘ The study sample‘s
alpha range (0.31 to 0.85) may be cause for concern, especially given the relatively
high Cronbach‘s values reported in the COPSOQ scales guidance document (alpha
range: 0.67 to 0.89, as detailed in appendix 2). Furthermore, a number studies in
other countries have found the levels of reliability of the questionnaire to be
acceptable; Moncada et al. showed that the reliability of scales for a Spanish version

65
of the COPSOQ ranged from 0.59 to 0.90, and Dupret‘s assessment of a French
version questionnaire (using measures that included the internal consistency of the
scales) found the results to be satisfactory, with an alpha range of 0.54 to 0.87.49,51
There has, however, been a recognition that not all of the scales necessarily meet
the internal consistency assumption (that is, the assumption that items on a scale
only measure one, uni-dimensional construct).48 While aspects of the assumption
itself have been questioned (Yu, for example, has argued that internal consistency
does not necessarily entail uni-dimensality87) it has, nonetheless, been used as a
guide for subjecting scales to the Cronbach‘s alpha statistic.48
In light of this, Thorsen and Bjorner identified only eight COPSOQ scales for which,
they believed, the internal consistency assumption held. These are: work pace,
meaning of work, commitment to the workplace, role clarity, work-family conflict,
sleeping troubles, burnout and stress.48 Table 19 shows a comparison of the
Cronbach‘s alpha values for these scales. As is demonstrated, the study sample‘s
COPSOQ scales (with the exception of meaning of work) are above the acceptability
threshold of 0.5, and several have alpha values that are similar to the other studies.
There are, of course, a number of other possible explanations for the low alpha
values in the some of the scales. Reasons could relate to the configuration of the
questionnaire. Tavakol and Dennick, for example, cite a paucity of, or poor inter-
relatedness between, items as well as diversity within constructs as being possible
factors to consider in cases of low reliability.72

66
Table 19: Comparison of scales that meet the internal consistency assumption
Exposure variable Alpha values
Thorsen and
Bjorner48 Dupret et al.49 Study values
Work pace 0.85 0.69 0.68
Meaning of work 0.68 0.80 0.39
Commitment to the workplace 0.75 N/A 0.65
Role clarity 0.77 0.87 0.58
Work-family conflict 0.80 0.82 0.71
Sleeping troubles 0.84 N/A 0.82
Burnout 0.81 0.76 0.83
Stress 0.85 0.71 0.80
5.2.2. Potential improvement of scale reliability
In terms of enhancing reliability, the individual scales themselves could be re-
designed. A possible approach for this could be to adjust or re-configure the scales
using factor analysis. Factor analysis is a technique of reducing data that involves
the identification of latent variables (which can be described as underlying
‗factors‘).88–90
Using the factor analysis guidelines developed Torres-Reyna,89 the two
unacceptably unreliable scales of possibilities for development and meaning of work
can be combined into one scale and assessed, as is shown table 20 (details of the
items listed can be found in appendix 2). By rotating the data and removing the
variable that is the least relevant to factor 1 (that is the take initiative item) a new six-
item scale can be formed. On testing, this new scale (which could perhaps be called
development and meaning at work) has a Cronbach‘s alpha value of 0.64, which is

67
not only higher than either of the original scales but is also well within the threshold
of acceptable reliability used in this study.
There are, certainly, a number of problems with this approach. Firstly, although these
items are all related to the same underlying factor, they, together, represent an
entirely new scale. This, of course, raises questions with regards to (testing) the
scale‘s validity - in fact, it is for this reason that the new scale was not used in this
study. Secondly, factor analysis aims at reducing the number of items, thereby
making the data more manageable.90 In this instance, the items are actually
increased and result in a more complex scale.
Table 20: Rotated factor loadings
Item name (item number) Factor 1 Factor 2 Factor3
Take initiative (35.4) -0.03 0.03 0.25
Possibility of learning (35.31) 0.62 0.18 0.02
Use skills (35.20) 0.29 0.12 0.36
Develop skills (35.36) 0.33 0.40 -0.03
Meaningful work (35.5) 0.21 0.40 0.23
Important work (35.13) 0.21 0.36 0.07
Motivated in work (35.52) 0.65 0.09 0.10
The above notwithstanding, using data from the study sample, a more reliable scale
was produced. Furthermore, the scale contains items that all belong to the ‗work
organisation and job contents‘ group, as defined by Thorsen and Bjorner.48 Factor
analysis could, therefore, be a possible way of improving the questionnaire for future
use within the local context.
68
5.3. Prevalence measurement
5.3.1. Managers as a vulnerable group
It is noteworthy that the study sample‘s stress mean value of 38.8 (SD 19.7) was
higher than the reference value plus the MID (that is > 35.55). Although this high
value needs to be interpreted with caution (as discussed in section 5.6.3), it does
make the identification of particularly vulnerable groups an imperative.
ANOVA testing in relation to stress had found a significant variation in job category,
with the highest mean value of stress, 51.2 (SD 24.2), being seen in the managers
category. Managers may, therefore, represent a group that warrants special
attention.
The pattern of a higher stress level amongst managers as compared to other
categories of staff was not immediately apparent in the literature. For example,
Caplan undertook a study in the United Kingdom‘s National Health Service (NHS)
which examined anxiety, depression and stress as experienced by general
practitioners, consultants and hospital managers and demonstrated that there was
no significant difference between these groups in relation to the anxiety component
of the measurement scale used.91 Furthermore, a comparative analysis of female
managers and female clerical workers in a Canadian setting found that there was, in
fact, a higher level of distress and poorer coping strategies amongst the clerical
workers.63 A study undertaken by Turnage and Spielberger of managers (n=68),
professionals (n=171) and clerical workers (n=69) in a manufacturing firm found that

69
the managers experienced job pressures more frequently than the professionals;
however, less intensity was attributed to these pressures by this group.62
This raises important questions with regards to the managers group in the study.
Indeed, the question of why stress in this group was so markedly higher than the rest
of the study sample cannot be easily answered by referring to the evidence base. In
terms of a possible further investigations, conducting in-depth interviews directly with
managers would provide for qualitative data collection and analysis,92 which, in turn,
could shed light on the underlying factors at play here.
In terms of risk and protective factors that are particular to managers, a number of
studies provide salient information. Manshor et al., undertook a study of managers
(n=440) in Malaysia and found that high workloads and poor relationships in the
workplace were among the variables that were positively correlated with stress.93 A
large study of divisional/sectional managers (n=3870) and foreman (n=2666) in a
Japanese setting found that long working hours (≥ 10 hours) was significantly
associated with perceived stress for both groups.94 Finally, a study of managers in a
restaurant chain in the United States found positive correlations between job stress
(anxiety) and conflict in job role, number of hours worked in a week and the sense
that management, at the corporate level, was ―out of touch.‖ Negative correlations
were, however, found with job stability and opportunities for career development.95
All of these factors would be important to consider when designing interventions
bespoke to the managers group in the target population.

70
5.3.2. Relationship with other outcomes
5.3.2.a. Burnout
The study showed a strong correlation between stress and burnout (r=0.71). A
number of potential risk factors could be considered here. Gillespie and Cohen, for
example, have described perceived causes of employee burnout in terms of three,
inter-related categories, namely: work/responsibility overload, insufficient recognition
and difficulties in communication (with, for example, supervisors).96
With regards to protective variables, a factor that is of relevance to burnout is the
development of coping strategies. With reference to athlete burnout, Raedeke and
Smith discuss two categories of coping resources that may have a moderating effect
on the relationship between stress and burnout, namely internal resources/coping
behaviours and external resources/social support.97
While the study sample showed relatively high median values of social support from
both colleagues (66.7; IQR: 41.7 - 83.3) and supervisors (75.0; IQR: 33.3 - 91.7),
there was no scale that directly measured individual coping behaviour. Further
investigation into such behaviour may need to be undertaken (using relevant tools
such as the Response to Stress Questionnaire98 or the Coping Strategies
Inventory99). This could provide evidence for the development of specific coping
interventions to complement existing social support resources.

71
5.3.2.b. Sleeping troubles
Stress was also positively correlated with sleeping troubles (r=0.65). Of relevance to
this finding, a large study (n=5720) undertaken in Stockholm found that ‗disturbed
sleep‘ was associated with the stressors of ‗high work demands‘ (OR 2.15; 95% CI:
1.29 – 3.58) and ‗high physical load‘ (OR 1.94; 95% CI: 1.30 – 2.88) as well as the
protective factor of ‗high social support‘ (OR 0.44; 95% CI: 0.27–0.72).37
Furthermore, Fahlén et al. showed that an effort-reward imbalance at work had
significantly adverse consequences in terms of sleep disturbances.100 With respect
to this, efforts to mitigate quantitative demands (as will be discussed in section 5.4.1)
and to enhance the social support experienced by employees in the target
population would be pertinent. Furthermore, attention would also need to be paid to
the provision rewards (recognition) so as to maintain an effort-reward balance.
In view of the points that have been raised above, table 21 is an attempt to match
some of the variables to possible interventions aimed at preventing stress in
managers, as well as reducing burnout and sleeping troubles related to stress.
Table 21: Variables that may require special emphases for certain groups
Exposure variable Managers Employees with burnout
or sleeping troubles
Quantitative demands X X
Possibilities for development X
Rewards (recognition)
X
Role conflicts X
Social support from colleagues
X
Social support from supervisors
X
Social community at work X
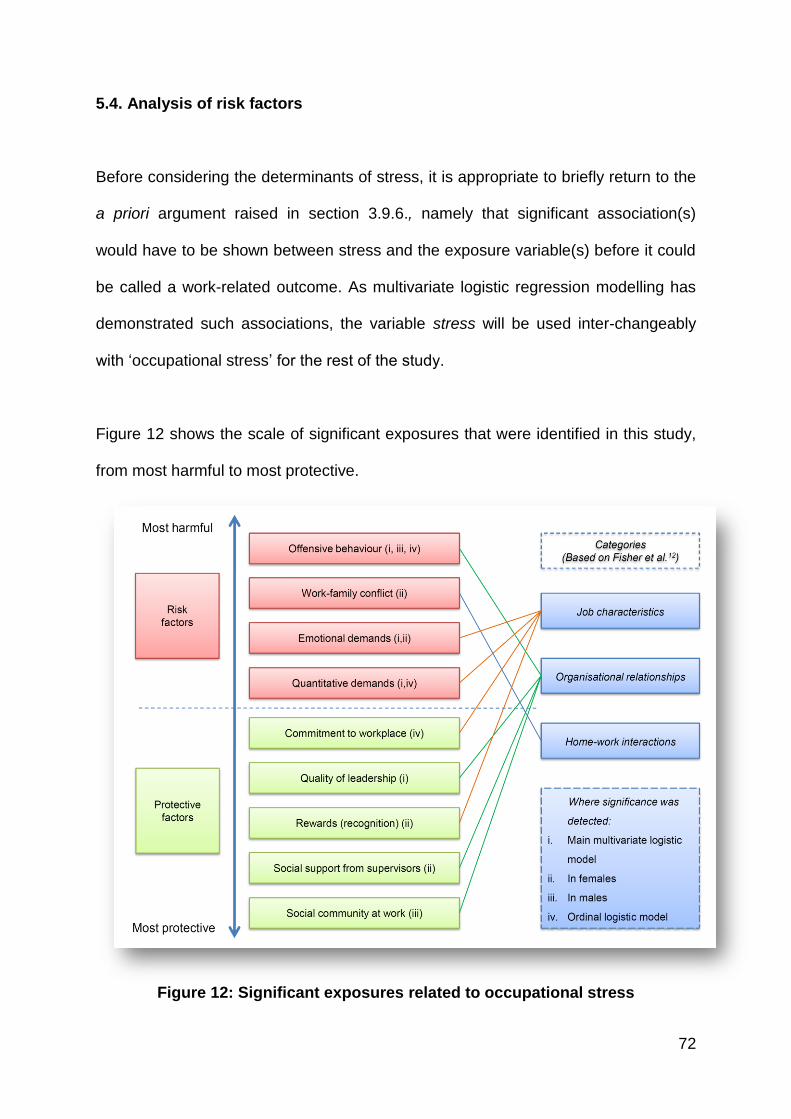
72
5.4. Analysis of risk factors
Before considering the determinants of stress, it is appropriate to briefly return to the
a priori argument raised in section 3.9.6., namely that significant association(s)
would have to be shown between stress and the exposure variable(s) before it could
be called a work-related outcome. As multivariate logistic regression modelling has
demonstrated such associations, the variable stress will be used inter-changeably
with ‗occupational stress‘ for the rest of the study.
Figure 12 shows the scale of significant exposures that were identified in this study,
from most harmful to most protective.
Figure 12: Significant exposures related to occupational stress

73
Furthermore, with reference to the categories of stressors identified by Fisher et al,
these exposures can be grouped into: (1) job characteristics; (2) work relationships
and (3) home-work interface – this is also included in figure 12. Each of these
exposures will now be considered in turn.
5.4.1. Risk factors related to job characteristics
5.4.1.a. Emotional demands
Emotional demands were associated with occupational stress in the main logistic
model (OR 2.32; 95% CI: 1.08 – 4.96, p < 0.05) and in females (OR 3.61; 95% CI:
1.26 – 10.36, p < 0.05). Emotional demands have been identified as an integral part
of the demands component in the ‗job demands-resources model.‘101,102 Specifically,
it has been postulated that job resources ―buffer‖ the effects of job demands on the
strain experienced in the workplace (as discussed by Bakker and Demerouti).102(p.314)
The manifestation of stress may therefore occur when (emotional) demands exceed
the available job resources.
In order to address stress, then, it is important to ensure that there are sufficient job
resources available. In terms of identifying specific types of resources, Bakker et al.
have described the following: social support in the workplace, coaching by
supervisors, the provision of feedback with regards to job performance and the ability
of employees to control their time.101 Given the high levels of risk detected, it would
be important that more of these resources be made available to the administrative
staff at CHBAH.

74
5.4.1.b. Quantitative demands
Quantitative demands were significant in both the main (OR= 2.83; 95% CI: 1.35 –
5.92, p < 0.01) and ordinal (OR = 2.38; 95% CI: 1.27 – 4.46, p < 0.05) regression
models. Quantitative demands have been placed alongside emotional demands in
the ‗job resources-demands model‘ (with the need for sufficient job resources again
being of pertinence).101
Another important consideration here is the relationship between workplace
demands and job control. Germane to this is Karasek‘s ‗demands-control model,‘
which hypothesizes that high job strain will occur when there are high job demands
but low job control (where job control refers to the employee‘s autonomy with
regards to work tasks as well as their ability to control which skills they use).103,104 In
terms of related research, Dwyer and Ganster undertook a study of employees in the
manufacturing industry (n=90) and found that job demands (which included a
measure of quantitative workload) were associated with sickness absence and
tardiness only when job control was perceived to be low.105 A more detailed
exploration of the interplay between job control, quantitative demands and
occupational stress in the target population may, therefore, be warranted (for the
purposes of both further analysis and intervention design).
5.4.1.c. Commitment to the workplace
Commitment to workplace was found to be a significant in terms of preventing the
transition from low stress to high stress, as demonstrated in the ordinal regression

75
(OR 0.46; 95% CI: 0.24 – 0.86; p < 0.05). Similar relationships have been found in
other studies. A study in the United Kingdom involving a sample of teachers (n=95)
found an inverse relationship between occupational commitment and perceived
stress.106 Furthermore, a Hong Kong-based study using data from two samples of
employees (n=386 and n=145) found that, in the first sample, organisational
commitment protected the employees against the adverse effects of stress and also
moderated the relationship between stress and job performance.107
In terms of evidence for developing interventions, the role of emotional intelligence
(EI) may need to be explored. Indeed, a study by Nikolaou and Tsoausis involving
professionals employed in mental health institutions (n=212) found that overall EI (as
measured by relevant instruments) was positively correlated with the employees‘
commitment to the organization (r=0.53), and that the high EI group had a
significantly lower job stress index mean than the low EI group.108 Exploring the
relatively novel area of EI interventions may, therefore, be of benefit in terms of
improving commitment to workplace.
5.4.1.d. Rewards (recognition)
Rewards (recognition) was identified as a significant protective factor in females (OR
0.30; 95% CI: 0.10 – 0.89, p < 0.05). Here the relationship between effort and reward
in the workplace (mentioned in section 5.3.2.b) is of relevance. With regards to this,
Siegrist has forwarded an ‗effort-reward imbalance‘ model in which high costs with a
low gains in the workplace result in chronic stress which, in turn, contributes to poor
health outcomes (particularly cardiovascular disease).109 This model has

76
considerable empirical support; indeed, a review of 45 studies by van Vegchel et al.
found substantial evidence to support the hypothesis that high efforts in combination
with low rewards increased health risks.110
In order to reduce occupational stress in the target population, then, it would be
important to actively maintain a balance between efforts and rewards. In terms of the
actual types of rewards that can be explored, Siegrist et al. has identified the
following three categories: financial rewards, ‗esteem awards‘ (such as respect and
recognition from supervisors and colleagues for work done) and career-development
awards (such as promotions).111
5.4.2. Risk factors related to organisational relationships
5.4.2.a. Offensive behaviour
Exposure to offensive behaviour was shown to be a significant risk for stress in the
main (OR 3.38; 95% CI: 1.54 – 7.43, p < 0.01) and ordinal (OR 3.60; 95% CI: 1.92 –
6.75, p < 0.001) logistic regression models, and in males (OR 4.63; 95% CI: 1.15 –
18.63, p < 0.05). The components of sexual harassment, physical violence, threats
of violence and bullying will each be considered in turn.
The prevalence of sexual harassment was more than double that of the reference
prevalence value (6.6% compared to 2.9%). The consequences of this type of
offensive behaviour are myriad and severe. These include symptoms related to post-
traumatic stress, a decline in work productivity and diminished self-confidence.112,113
77
For example, a study undertaken by Schneider et al. included a sample of female
university employees (n=300) and found, within this group, positive partial
correlations between sexual harassment and withdrawal from work (0.19) and PTSD
symptoms (0.19), as well as a partial negative correlation with a ‗Satisfaction With
Life‘ scale (-0.20), all at the p < 0.01 level of confidence.112 Efforts to address this
form of offensive behaviour should include the development of anti-harassment
policies, clear grievance procedures and appropriate support services for victims.114
There were also relatively high levels of threats of violence (19.9%) and actual
workplace physical violence (9.6%). In addition to the obvious risk of physical injury,
such violence can produce adverse psychological/emotional outcomes which may, in
severe cases, result in post-traumatic stress disorder (PTSD).115,116 However, it
should be noted that the psychological/emotional impact on the victim of physical
violence may not necessarily relate to the severity of the exposure.115 Therefore,
every case of physical violence in the target workplace, no matter what the perceived
seriousness, would need to be carefully addressed.
Finally, almost a quarter of employees in the study sample reported being bullied in
the last year. Although this is alarmingly high (the reference prevalence for bullying
was 8.3%) other studies have shown similar levels of this offensive behaviour. A
study based in a community NHS trust, for example, found that 38% of the
participants had experienced bullying in the last year, and that bullied staff had
higher levels of work-related stress (as well as anxiety and depression) and a greater
intention to leave their jobs.117 Furthermore, a Finnish study involving municipal
workers found bullying to be experienced by 10% of the participants. The study also

78
found those participants who had been exposed to bullying (either directly or
observed) had significantly higher levels of general stress and greater usage of
sleep-inducing medication.118
5.4.2.b Quality of leadership
The quality of leadership was significantly protective in the main logistic model (OR
0.32; 95% CI: 0.15 – 0.67, p < 0.01). In terms of leadership style, the possible
relationships between abusive and passive (such as laissez-faire) leadership and
increased occupational stress has been described.119 Conversely, a study
undertaken by Kelloway and McKee indicated that transformational leadership
(which consists of ―idealized influence, inspirational motivation, intellectual
stimulation, and individualized consideration‖) was associated with the psychological
well-being of employees.120 (p.193)
Caution will be need in addressing quality of leadership in the target population. A
focus only on the negative components of leadership may be interpreted as being
accusatory; this may, in turn, alienate staff in key roles. Given the vital role that
support from managers has in introducing occupational stress interventions,54 careful
planning and sensitivity will be required here.
5.4.2.c. Social support from supervisors
Social support from supervisors was a significantly protective factor in females (OR
0.28; 95% CI: 0.08 – 0.93; p < 0.05). Such support is, of course, closely related to
79
the quality of leadership. Indeed, Offermann and Hellmann found that emotional
supportive behaviours of leaders (such as approachability, developing trust and
showing interest in employee growth) were significantly negatively correlated with
employee stress.121
It has also been postulated that social support helps to protect individuals from the
adverse health outcomes of stressful life events (the so-called ―buffer effect‖).122,123
More specifically, in a study undertaken by Beehr et al. involving registered nurses
(n=225) it was found that social support from supervisors (especially communication
not related to the job) acted as a moderator, or buffer, in terms of the occupational
stressor-strain relationship.124 The appropriate training of supervisors with regards to
supportive behaviour and communication may, therefore, be of value.
5.4.2.d. Social community at work
The social community at work was found to be protective against occupational stress
in males (OR 0.18; 95% CI: 0.05 – 0.67; p < 0.05). Studies have explored the
relationship between collegiality and (the reduction of) stress. A perceived lack of
collegial support has, for example, been associated with stress in teachers125 and
nurses.126 More broadly, integration into social networks has been shown to have an
overall beneficial effect on employee health, regardless of whether or not stress is
being experienced.122
From the individual perspective, an ‗integrative‘ personal style of conflict resolution
(as opposed to an approach that is either dominating or avoiding) has been shown to
80
improve relationships at work, which, in turn, reduces stress.127 Finally, at a
collective level, Cropanzano et al. found that organisational politics (characterized by
the formation of competitive groups in the workplace) and organisational support
were positively and negatively correlated with stress variables, respectively.128
Interventions in the target population could thus focus on encouraging collegial
support and social integration, educating employees on constructive conflict
resolution styles, and fostering a more supportive environment in the workplace.
5.4.3. Risk factors related to home-work interactions
5.4.3.a. Work-family conflict
The impact of work-family conflict was shown to be significant in females (OR 4.03;
1.45 – 11.21, p < 0.01). Byron has grouped variables that directly impact on the
work-family interface into those that relate to the workplace (such as hours at, and
flexibility of, work) and those that relate to the individual (such as coping skills).129
According to Allen et al., once work-family conflict has been experienced, its
corollaries can be categorized into work-related (such as absenteeism and poor job
performance), non-work related (such as a lack of ‗life satisfaction‘) and specifically
stress-related (including somatic and psychological symptoms).130 Introducing
measures that mitigate work-family strain (such as introducing flexible working
schedules129) could, therefore, be important in the target population.
81
5.5. Contextual factors
Before moving on to the study‘s limitations, two important contextual factors need to
be briefly discussed, namely the resource restraints in the study setting, and the
effects of HIV/AIDS.
5.5.1. Resource constraints
As has already been discussed in section 1.1, occupational stress poses a
substantial economic burden. This effect may be felt particularly acutely in public
sector hospitals such as CHBAH, where resource constraints are often
experienced.131 An evaluation of the impact that occupational stress has on the
resources of the institution (in the form of, for example, a costing analysis of
absenteeism related to occupational stress) could provide for a valuable
complementary study.
5.5.2. HIV/AIDS
The high prevalence of people living with HIV/AIDS in South Africa has had a
substantial and sustained impact on health service delivery.132 This has had
implications for the occupational stress experienced by workers within the health
system. Van Dyk, for example, carried out a study amongst caregivers involved in
HIV/AIDS services, and found that they viewed their work to be highly stressful (due
to factors such as an overload of bereavement).133

82
While staff in the study sample were not involved in the direct care of people living
with HIV/AIDS, it is very likely that they interacted with these patients while carrying
out their administrative duties (especially those in the front line category). An
examination of the possible contribution that this has made to the occupational
stress experienced by the staff could potentially provide for important additional
insights.
5.6. Limitations
5.6.1. Response rate
The response rate of 47.3% was less than optimal. Although the study power and
margin of error were still maintained at acceptable levels (as discussed in section
3.7), a higher response rate would have been desirable. Moreover, this exposed the
study to possible volunteer bias134 in that those who participated may have done so
because of a higher level of perceived stress. This could have potentially resulted in
a stress mean that was above the value that actually existed in the target population.
Efforts were made to engage with selected staff (such as recruiting more
fieldworkers) which did improve questionnaire response rate. However, the overall
response rate could have been even higher had there been an earlier engagement
with the institution‘s management. Indeed, assistance from management in the latter
stages of the fieldwork process resulted in the arrangement of special meetings with
selected staff; these meetings, in turn, dramatically improved the response rate.

83
5.6.2. Need for COPSOQ adaptation
The fact that the English-version of the COPSOQ was used ‗as is‘ in the study was
also a considerable limitation. It is important to highlight that the testing of the
COPSOQ by both Dupret et al. (in France) and Moncada (in Spain) involved
adaption to the local context. In the case of the latter, this involved adjustments for
― … the labor market, cultural, and linguistic setting of Spain.‖ 51 (p. 98)
The COPSOQ was not translated into multiple languages in this study because of
resource constraints as well as the assumption (based on discussions with the
human resources department) that the selected participants would have an
appropriate level of English literacy. Nonetheless, a lack of such adaptation may
have impeded the interpretation of questions and, consequently, affected the
reliability of scales.
5.6.3. Likert scale interpretation
Likert scales use ordinal data in which individual items have a rank order.135
However, the presumption that such items can also be measured on an interval
scale (that is, with equal values assumed to be between each item) has been
strongly challenged as there may differential levels of intensity between these
items.135,136 Nonetheless, given that the COPSOQ scales guidance document gave
clear guidelines on an interval approach to calculating the averages (appendix 2),
this method was used in the study. Indeed, an alternative approach would have

84
distorted the reference values, and made it difficult to compare the findings with
other studies.
5.6.4. Reliability testing technique
Furthermore, the choice of the reliability testing could also be questioned. While the
Cronbach‘s alpha has been widely used, alternatives could be considered.
Specifically, Thorsen and Bjorner found that the test-retest design was more
appropriate for testing the reliability of the COPSOQ.48 This was because it
potentially reduced the error due to transient factors (such as the disposition of the
participant on the particular day of testing).48 Also this wasn‘t carried out due to the
challenges around recruiting participants, as reflected in the low response rate,
employing such a test-retest study design could have, nonetheless, resulted in more
robust reliability testing.
5.6.5. Lack of baseline data
There was no setting-specific baseline data for this study. As a consequence,
reference values had to be imported from the COPSOQ scales guidance document
(appendix 2). As these values are based on a sample from considerably different
context (the workplace dynamics in the Danish context, for example, are likely to be
dissimilar to those in the South African setting) this was a research limitation. While
the use of the MID addition was made in an attempt to mitigate this, it certainly
conceded that the availability of local baseline data would have made for more
robust results.

85
CHAPTER SIX
6. Conclusions and recommendations
6.1. Chapter overview
This final chapter will begin with a summary of the occupational stress study, which
will be followed by a brief discussion around the issue of its generalizability. In light
of the evidence that has been presented, a description of key recommendations will
be made - it is hoped that these recommendations can form the basis for future
strategies aimed at measurably reducing stress in workplaces. The chapter, and the
dissertation, will then close with a few concluding thoughts.
6.2. Study summary
This study has focused on stress experienced in the workplace. Specifically, it has
tested the reliability of an established occupational stress instrument (the COPSOQ)
within a South African workface setting; measured the prevalence of stress in that
setting and described risk (and protective) factors in the workplace that could be
associated with stress.
In terms of reliability, the Cronbach‘s alpha statistic was used to test the internal
consistency of the COPSOQ scales. The result was a wide range of alpha values,
with the majority falling above a minimally acceptable threshold. On a tentative basis,

86
it was suggested that factor analysis techniques88 may be of utility in re-designing
scales in the questionnaire.
The prevalence of occupational stress was measured, generally across the sample
and, then, specifically in relation to a number of demographic variables. It was found
that the occupational stress level in the study sample as a whole was high (as
compared to the reference value) and that there was a significant variance in terms
of job category. Moreover, the managers group appeared to be particularly
vulnerable. Occupational stress was also found to correlate positively with burnout
and sleeping troubles, and negatively with self-rated health.
An analysis of risk factors was undertaken using logistic modelling. In the main
multivariate model, variables that were identified as being significantly harmful were
offensive behaviour, emotional demands and quantitative demands, while perceived
quality of leadership was significantly protective. Analysis by sex showed that work-
family conflict and emotional demands were risk factors for occupational stress in
females, while rewards (recognition) and social support from supervisors were
protective. In males, offensive behaviour was a risk while the social community at
work afforded significant protection against stress.
Ordinal regression modelling considered the transition from low stress to high stress.
It showed that offensive behaviour and quantitative demands were, again,
significantly harmful while a commitment to workplace could, potentially, prevent this
progression of stress. Finally, it was found that all of the significant variables could

87
be group into three main categories. These were: (1) job characteristics, (2)
organisational relationships and (3) home-work interactions.
After exploring each of the significant risk factors in considerable detail, the
contextual importance of resource constraints and HIV/AIDS was briefly discussed.
Finally, the following study limitations were identified: a low response rate; the need
for (or lack of) questionnaire adaption; the use of an interval approach to Likert scale
interpretation, the choice of the statistic to measure reliability and the unavailability of
local baseline data.
6.3. Generalizability of the study
Before presenting the recommendations, it is appropriate to consider the issue of the
generalizability of the study findings. Generalizability hinges on the question of
external validity, that is: can the study‘s findings on occupational stress be applied to
other (target) populations?46 Greenberg et al. have argued that to answer questions
on external validity involves a judgement in which types of participants in the study,
and differences between these and participants in other populations, are pertinent.46
In this study, administrative staff members were deliberately chosen as it was
assumed that counterparts could be found in many other public institutions. It is
plausible that the vast majority of these organisations have some form of
management, employ a category of staff that deals with back office duties, and have
another group of employees involved with customer interface at the front line.

88
Indeed, forms of this typology are mentioned in both peer-reviewed studies61 and the
grey literature.137
While is also reasonable to assume that, in some organisations, the same
employees may fulfill more than one of these roles, and that, in many others, there
are different categories (such as highly specialized professional staff), it was
believed that the core groups identified allowed for at least some generalizability to
other South African workforces.
6.4. Recommendations
Recommendations will be divided into: 1) instrument adaption, 2) intervention
development, and 3) priorities for further research.
6.4.1. Instrument adaptation
While the validity and reliability of the COPSOQ has been tested within the
international context,48,49,51 there appears to be a need for further adaption of the tool
so that it is better matched to examining the complex problem of occupational stress
within the South African context. Each of scales of the COPSOQ should, ideally, be
re-assessed, and possibly modified. Primary data collection may first be needed to
identify issues that are relevant to local context (such as having to work in a
resource-constrained setting). Focus groups may be of particular value here, not
only in terms questionnaire content development, but also for involving members of
(potential) study populations.138

89
Confirmatory factor analysis can then be undertaken to simplify and/or refine the
scales.89 A testing of both the reliability and the validity of the modified scales could
follow. For reliability analysis, the test-retest design is recommended.48 For validity
testing, assessing both content validity (by asking mental health professionals to give
their opinion on the modified scales) and construct validity (by comparing scales with
those of other occupational stress instruments) may be of merit.46 Finally, the
modified COPSOQ should be translated into languages that participants would be
most comfortable with, with each translated version undergoing reliability and validity
re-assessment.139
6.4.2. Intervention design
Given the elevated levels of occupational stress detected amongst the administrative
staff at CHBAH, the design and implementation of an occupational stress
intervention programme is highly recommended. This could be undertaken in
partnership with relevant organisations, such as the NIOH. The intervention process
could also incorporate elements of the WHO ‗step-wise‘ model,32 the PRIMA-EF
model54 and the NIOSH prevention model, as outlined below.
6.4.2.a. Establishing a working committee
A suggested initial step in the intervention process is the establishment of a working
committee comprised of managers and employees as this provides the platform for a
participatory approach to occupational stress management.30 Such a committee
would, in this instance, include representatives from CHBAH‘s management and

90
affected employees as well as staff of the hospital‘s Employee Wellness Programme
(EWP). All subsequent steps in the intervention process should be carried be out in
conjunction with this committee.
6.4.2.a. Assessing risks
Assessing psychosocial risks in the workplace should be an essential part of the
intervention model.54 At the individual level, this could involve the administration of a
modified COPSOQ as well as the use of complementary instruments, such as
burnout-related questionnaires, to assess related conditions. Where high stress is
detected, employees may undergo further clinical assessments, allowing for the
screening/detection of both psychological sequelae (such as depression and anxiety)
and physiological sequelae (such as hypertension and diabetes).
At the organisational level, data from individual assessments could be collated (and
complemented with data from group discussions30). The analysis of these data could
form the basis of a risk assessment focused on identifying psychosocial hazards and
their associated outcomes.54
6.4.2.b. Developing and implementing interventions
Primary prevention: primary prevention of occupational stress involves
modifying the manner in which work is organised.54 With regards to the
administrative staff at CHBAH, such interventions should start by focusing on:
91
o preventing offensive behaviour (example: developing and implementing
anti-bullying policies140).
o Preventing work-family conflict (example: negotiating around flexible
working schedules129)
o reducing emotional demands (example: ensuring that there are
adequate job resources available101).
o mitigating quantitative demands (example: improving the level of job
control that employees‘ have103)
o enhancing the quality of leadership (example: providing education with
regards to the transformational style of leadership120).
o providing rewards/recognition (example: ensuring that there are
opportunities for recognition and, where appropriate, promotion111).
o strengthening the social support of supervisors (example: providing
training with regards to supervisory coaching101).
o improving the social community at work (example: facilitating
‗integrative‘ conflict resolution within the workplace127).
Given the high level of occupational stress amongst managers, it is
recommended that they be prioritized. Interventions that may be of particular
relevance to this group are ones that: reduce role conflicts, improve
opportunities for development and enhance the experience of the community
at work.93,95
Secondary prevention: secondary prevention shifts the focus to the individual
development of skills that reduce occupational stress.54 Ensuring that

92
employees have adequate coping resources97 would, therefore, be important
here. Further reduction of offensive behaviour and quantitative demands are
particularly important as these are risk factors that can escalate the condition
of those who already have (a low level of) stress. Furthermore, the
improvement of commitment to workplace (through, for example, appropriate
EI training108) would be of benefit here.
Tertiary prevention: This level of prevention involves occupational stress
rehabilitation interventions.54 Data from psychological/clinical assessments of
employees with high stress can be analysed to identify risks related to stress
and its sequelae. These data can then be used to develop appropriate
interventions.
6.4.2.c. Evaluating intervention outcomes
The evaluation of the occupational stress programme should seek to determine if the
intervention goals were reached, what the employees perceptions of the
occupational stress interventions were and if there were any unexpected
outcomes.30,32 It has been recommended that such evaluations be conducted in two-
parts: one within the first few months after implementation and the other after at least
one year.32 Evaluation findings should be used to refine the occupational stress
programme at CHBAH, thereby forming a cycle of improvement.30
93
6.4.3. Priorities for further research
6.4.3.a. Occupational stress and HIV/AIDS:
Perceived stress in relation to HIV/AIDS care has been described in the South
African setting.133 Further investigation into to the impact of the HIV/AIDS burden on
the target population (through, for example, adding a scale related to HIV/AIDS and
stressors in the questionnaire) is recommended.
6.4.3.b. Economic evaluation of occupational stress
Given the substantial economic cost of occupational stress25 and the resource
constraints in public sector hospitals,131 an economic evaluation may be of value.
This could be in the form of a cost-effectiveness analysis,141 whereby the costs and
effect (in terms a MID reduction) between the occupational stress programme and
current EWP practice can be compared.
6.4.3.c. Occupational stress research in other groups/settings
While the rationale for focus on the administrative component of the staff
establishment has been explained, future research could begin to incorporate other
groups, such as health professionals. Furthermore, the study methodology could be
further developed so that it can be used in other institutional settings. This would
allow for comparative analyses and the detection of broader trends with regards to
occupational stress. It would also be important to ensure that study groups are large

94
enough in size and appropriately stratified (the latter would, for example, allow for
better assessment of potential effect modifiers75).
6.4.3.d. Development of occupational stress guidelines
Research from the comparative analyses, together with data from other studies,
could help to form an evidence-base for the development of occupational stress
guidelines. Such guidelines could relate to both suggested research approaches and
occupational stress management practices. Guidelines could be developed by an
inter-disciplinary team of researchers, mental health professionals, occupational
physicians and public health specialists.
6.5. Concluding thoughts
This study has sought to provide a better understanding of occupational stress in a
South African workforce. After raising certain considerations with regards to
instrument testing, it has described the distribution of occupational stress within the
workforce and has suggested a focus on reducing certain risks and enhancing
specific protective factors. It is hoped that the study will be of at least some value in
preventing the occurrence of stress-related illnesses amongst (and, ultimately,
improving the work experience of) fellow employees.

95
REFERENCES
1. World Health Organization. Mental Health Action Plan 2013 - 2020. Geneva:
World Health Organization; 2013.
2. World Health Organization. The World Health Report 2001 - Mental Health:
New Understanding, New Hope. Geneva: World Health Organization; 2001.
3. Herman AA, Stein DJ, Seedat S, Heeringa SG, Moomal H, Williams DR. The
South African Stress and Health (SASH) study: 12-month and lifetime
prevalence of common mental disorders. South African Medical Journal 2009;
99(5):339–344.
4. Kofoworola OH, Alayode AM. Strategies for Managing Stress for Optimal Job
Performance. International Journal of Psychological Studies. 2012; 4(2):162–
168.
5. American Psychological Association. Stress in America 2009. Washington,
D.C.: American Psychological Association; 2009.
6. European Foundation for the Improvement of Living and Working Conditions.
Fourth European Working Conditions Survey. Luxembourg: Office for Official
Publications of the European Communities; 2006.

96
7. Thomas LS, Valli A. Levels of occupational stress in doctors working in a
South African public-sector hospital. South African Medical Journal 2006;
96(11):1162–11688.
8. Coetzee SE, Rothmann S. Occupational stress, organisational commitment
and ill-health of employees at a higher education institution in South Africa. SA
Journal of Industrial Psychology 2005; 31(1):47–54.
9. Bowen P, Edwards P, Lingard H. Workplace Stress Experienced by
Construction Professionals in South Africa. Journal of Construction
Engineering and Management 2013; 139(4):393–403.
10. Pienaar J, Rothmann S. Occupational stress in the South African police
service. SA Journal of Industrial Psychology 2006; 32(3):63–71.
11. Botha C, Pienaar J. South African correctional official occupational stress: The
role of psychological strengths. Journal of Criminal Justice 2006 Jan; 34(1):73–
84.
12. Fischer J, Katz LA, Miller K, Thatcher A. South Africa at Work. Applying
Psychology to Organisations. Johannesburg: Witwatersrand University Press;
2003.
13. Michie S. Causes and management of stress at work. Occupational and
Environmental Medicine. 2002; 59(1):67–72.
97
14. Pickering T. The effects of occupational stress on blood pressure in men and
women. Acta physiologica scandinavica. Supplementum 1997;640:125–128.
15. Kivimäki M, Virtanen M, Elovainio M, Kouvonen A, Väänänen A, Vahtera J.
Work stress in the etiology of coronary heart disease—a meta-analysis.
Scandinavian Journal of Work, Environment & Health. 2006; 32(6):431–442.
16. Heraclides A, Chandola T, Witte DR, Brunner EJ. Psychosocial stress at work
doubles the risk of Type 2 diabetes in middle-aged women Evidence from the
Whitehall II Study. Diabetes Care 2009; 32(12):2230–2235.
17. Maslach C. Burnout: A multidimensional perspective. In: Schaufeli WB,
Maslach C, Marek T. (eds.) Professional burnout: Recent developments in
theory and research. Philadelphia: Taylor & Francis; 1993. p.19–32.
18. Weinberg A, Creed F. Stress and psychiatric disorder in healthcare
professionals and hospital staff. The Lancet 2000; 355(9203):533–537.
19. Tennant C. Work-related stress and depressive disorders. Journal of
Psychosomatic Research 2001; 51(5):697–704.
20. McCafferty FL, McCafferty E, McCafferty MA. Stress and suicide in police
officers: paradigm of occupational stress. Southern Medical Journal 1992;
85(3):233–43.

98
21. Motowidlo SJ, Packard JS, Manning MR. Occupational Stress: Its Causes and
Consequences for Job Performance. Journal of Applied Psychology; 71(4):
618–629.
22. Jacobson BH, Aldana SG, Goetzel RZ, Vardell KD, Adams TB, Pietras RJ. The
Relationship Between Perceived Stress and Self-reported Illness-related
Absenteeism. American Journal of Health Promotion. 1996;11(1):54–61.
23. European Agency for Safety and Health at Work. OSH in figures: stress at
work - facts and figures. Luxembourg: Office for Official Publications of the
European Communities; 2009.
24. Brun J-P. Work-related stress: scientific evidence-base of risk factors,
prevention and costs.
http://www.who.int/occupational_health/topics/brunpres0307.pdf (accessed 18
February 2014).
25. HR future. Stressed workforce is ready to crack.
http://www.hrfuture.net/performance-and-productivity/stressed-workforce-is-
ready-to-crack.php (accessed 18 February 2014).
26. LaMontage AD, Louie AM. A Systematic Review of the Job-stress Intervention
Evaluation Literature, 1990–2005. International Journal of Occupational and
Environmental Health 2007; 13(3):268–280.
99
27. Leka S, Jain A. Health Impact of Psychosocial Hazards at Work: An Overview.
Geneva: World Health Organization; 2010.
28. Health and Safety Executive. Working together to reduce stress at work.
London: Health and Safety Executive; 2008.
29. European Commission. Guidance on work-related stress, Spice of life or kiss
of death? Luxembourg: Office for Official Publications of the European
Communities; 2000.
30. National Institute for Occupational Safety and Health. Stress … at work.
Cincinnati: National Institute for Occupational Safety and Health: 1999.
31. National Institute for Occupational Safety and Health. Worker Health
Chartbook 2004. Cincinnati: National Institute for Occupational Safety and
Health; 2004.
32. Houtman I, Jettinghoff K. Raising awareness of Stress at Work in Developing
Countries. Geneva: World Health Organization; 2007.
33. Becerril LAC, Monteverde GG. Trends in the Employment Market in Hermosillo
- Sonora, Mexico and Analysis of Psychosocial Risk Factors.
http://workhealth.org/2005%20ICOH/fri%20presentations/F23%20cedillo.pdf
(accessed 19 February 2014).
100
34. Kortum E, Leka S, Cox T. Psychosocial risks and work-related stress in
developing countries: health impact, priorities, barriers and solutions.
International Journal of Occupational Medicine and Environmental Health
2010; 23(3):225–38.
35. Baker DB. The study of stress at work. Annual Review of Public Health 1985;
6(1):367–81.
36. Robbins SP, Judge TA. Organizational Behavior. 12th ed. Upper Saddle River:
Prentice Hall; 2007.
37. Âkerstedt T. Psychosocial stress and impaired sleep. Scandinavian Journal of
Work, Environment & Health 2006; 32(6):493–501.
38. Rodenbeck A, Huether G, Rüther E, Hajak G. Interactions between evening
and nocturnal cortisol secretion and sleep parameters in patients with severe
chronic primary insomnia. Neuroscience Letters 2002; 324(2):159–63.
39. Leproult R, Copinschi G, Buxton O, Van Cauter E. Sleep loss results in an
elevation of cortisol levels the next evening. Sleep: Journal of Sleep Research
& Sleep Medicine1997; 20(10):865–70.
40. Maslach C, Schaufeli WB, Leiter MP. Job Burnout. Annual Review of
Psychology 2001; 52(1):397–422.

101
41. Falkum E. [What is burnout?]. Tidsskr Nor Laegeforen 2000; 120(10):1122–8.
42. Kristensen TS, Hannerz H, Høgh A, Borg V. The Copenhagen Psychosocial
Questionnaire - a tool for the assessment and improvement of the
psychosocial work environment. Scandinavian Journal of Work, Environment &
Health 2005; 31(6):438–49.
43. Pejtersen JH, Kristensen TS, Borg V, Bjorner JB. The second version of the
Copenhagen Psychosocial Questionnaire. Scandinavian Journal of Public
Health 2010; 38(3 suppl):8–24.
44. National Research Centre for the Working Environment. The Copenhagen
Psychosocial Questionnaire (COPSOQ).
http://www.arbejdsmiljoforskning.dk/en/projekter/amis-spoergeskema-om-
psykisk-arbejdsmiljoe (accessed 26 February 2014).
45. National Research Centre for the Working Environment. Overview of scales
and number of questions in the three COPSOQ II questionnaires.
http://www.arbejdsmiljoforskning.dk/~/media/Spoergeskemaer/copsoq/uk/3d-ii-
english-1-p-overview-of-concept.pdf (accessed 26 February 2014).
46. Daniels S, Greenberg R, Flanders W, Eley J, Boring J. Medical Epidemiology.
4th ed. New York: Lange Medical Books/McGraw-Hill Medical; 2004.

102
47. MJ Miller. Reliability and Validity.
michaeljmillerphd.com/res500_lecturenotes/reliability_and_validity.pdf
(accessed 26 February 2014).
48. Thorsen SV, Bjorner JB. Reliability of the Copenhagen Psychosocial
Questionnaire. Scandinavian Journal of Public Health 2010; 38(3 Suppl):25-32.
49. Dupret E, Bocéréan C, Teherani M, Feltrin M, Pejtersen JH. Psychosocial risk
assessment: French validation of the Copenhagen Psychosocial Questionnaire
(COPSOQ). Scandinavian Journal of Public Health 2012; 40(5):482–90.
50. Nübling M. Measuring psychological stress and strain at work-Evaluation of the
COPSOQ Questionnaire in Germany. GMS Psycho-Social Medicine 2006; 3.
51. Moncada S, Utzet M, Molinero E, Llorens C, Moreno N, Galtés A, et al. The
copenhagen psychosocial questionnaire II (COPSOQ II) in Spain—A tool for
psychosocial risk assessment at the workplace. American Journal of Industrial
Medicine. 2014; 57(1):97–107.
52. Tei-Tominaga M. Factors related to the intention to leave and the decision to
resign among newly graduated nurses: a complete survey in a selected
prefecture in Japan. Environmental Health and Preventive Medicine. 2013;
18(4): 293–305.

103
53. Coopmans JWM. Stress related causes of presenteeism amongst South
African managers. MBA dissertation. University of Pretoria; 2007.
54. Leka S, Cox T. PRIMA-EF. The European Framework for Psychosocial Risk
Management. Nottingham: Institute of Work, Health & Organisations; 2008.
55. Van der Colff JJ, Rothmann S. Occupational stress, sense of coherence,
coping, burnout and work engagement of registered nurses in South Africa. SA
Journal of Industrial Psychology 2009; 35(1).
56. Emsley R, Emsley L, Seedat S. Occupational disability on psychiatric grounds
in South African school-teachers. African Journal of Psychiatry 2009;
12(3):223–6.
57. Chris Hani Baragwanath Hospital. General Information.
http://www.chrishanibaragwanathhospital.co.za (accessed 26 February 2014).
58. Chris Hani Baragwanath Hospital. The History of the Chris Hani Baragwanath
Hospital. http://www.chrishanibaragwanathhospital.co.za/history (accessed 26
February 2014).
59. Google Maps. Chris Hani Baragwanath Hospital, Soweto, South Africa.
https://maps.google.co.za/maps (accessed 26 February 2014).
104
60. University of the Witwatersrand. Chris Hani Baragwanath Hospital.
http://www.wits.ac.za/academic/health/clinicalmed/internalmedicine/hospitals/9
544/chris_hani_baragwanath.html (accessed 26 February 2014).
61. Korczynski M. Back-office service work: bureaucracy challenged? Work,
Employment & Society 2004; 18(1):97–114.
62. Turnage JJ, Spielberger CD. Job stress in managers, professionals, and
clerical workers. Work & Stress 1991; 5(3):165–76.
63. Long BC. Coping with workplace stress: A multiple-group comparison of
female managers and clerical workers. Journal of Counseling Psychology
1998;45(1):65–78.
64. Scheuren F. What is a Survey? Alexandria: American Statistical Association;
2004. http://www.amstat.org/sections/srms/pamphlet.pdf (accessed 26
February 2014).
65. Dawson B, Trapp RG. Basic & Clinical Biostatistics. 4th ed. New York: Lange
Medical Books/McGraw-Hill New York; 2004.
66. Paulsen A, Overgaard S, Lauritsen JM. Quality of Data Entry Using Single
Entry, Double Entry and Automated Forms Processing–An Example Based on
a Study of Patient-Reported Outcomes. PLoS ONE. 2012; 7(4):e35087.

105
67. Shi H-Y, Chang J-K, Wong C-Y, Wang J-W, Tu Y-K, Chiu H-C, Lee K-T.
Responsiveness and minimal important differences after revision total hip
arthroplasty. BMC Musculoskeletal Disorders. 2010;11(1):261.
68. Walters SJ, Brazier JE. Comparison of the minimally important difference for
two health state utility measures: EQ-5D and SF-6D. Quality of Life Research
2005; 14(6):1523–32.
69. Hays RD, Farivar SS, Liu H. Approaches and recommendations for estimating
minimally important differences for health-related quality of life measures.
COPD: Journal of Chronic Obstructive Pulmonary Disease 2005; 2(1): 63-67.
70. Santos JRA. Cronbach‘s alpha: A tool for assessing the reliability of scales.
Journal of Extension 1999; 37(2):1–5.
71. Bland JM, Altman DG. Statistics notes: Cronbach‘s alpha. BMJ 1997;
314(7080):572.
72. Tavakol M, Dennick R. Making sense of Cronbach‘s alpha. International
Journal of Medical Education 2011; 2:53–5.
73. Gliem JA, Gliem RR. Calculating, interpreting, and reporting Cronbach‘s alpha
reliability coefficient for Likert-type scales. Midwest Research-to-Practice
Conference in Adult, Continuing, and Community Education. Columbus, 2003.

106
74. University of California. What statistical analysis should I use?
http://www.ats.ucla.edu/stat/stata/whatstat/whatstat.htm (accessed 26
February 2014).
75. A Tobias. Test for homogeniety effect modification.
www.stata.com/meeting/spain12/abstracts/materials/Tobias.pdf (accessed 26
February 2014).
76. Golder M, Golder S. Lecture 11: Multiple Regression Multicollinearity.
https://files.nyu.edu/mrg217/public/multicollinearity_handouts.pdf (accessed 26
February 2014).
77. York University. Collinearity in regression (the dreaded disease, and how to
live with it). www.psych.yorku.ca/lab/psy6140/lectures/Collinearity2x2.pdf
(accessed 26 February 2014).
78. Kirkwood BR, Sterne JAC, Kirkwood BR. Essential Medical Statistics. Malden:
Blackwell Science; 2003.
79. NCSS Statistical Software. Stepwise Regression.
http://ncss.wpengine.netdna-cdn.com/wp-
content/themes/ncss/pdf/Procedures/NCSS/Stepwise_Regression.pdf
(accessed 26 February 2014).

107
80. Jick TD, Mitz LF. Sex Differences in Work Stress. The Academy of
Management Review 1985;10(3):408-420.
81. Brown J, Fielding J. Qualitative differences in men and women police officers‘
experience of occupational stress. Work & Stress 1993; 7(4):327–40.
82. McCarty WP, Garland BE. Occupational stress and burnout between male and
female police officers: Are there any gender differences? Policing: An
International Journal of Police Strategies & Management 2007; 30(4):672–91.
83. Corbett P. Accuracy of logistic models and receiver operating characteristic
curves. PhD thesis. University of Warwick; 2001.
84. Johns Hopkins University. Topic 2 logistic regression.
www.biostat.jhsph.edu/~ejohnson/regression/topic2.pdf (accessed 26 February
2014).
85. Ninness C, Newton R, Saxon J, Rumph R, Bradfield A, Harrison C, Vasquez
III, E, Ninness SK. Small Group Statistics: A Monte Carlo Comparison of
Parametric and Randomization Tests. Behavior and Social Issues
2002;12(1):53–63.

108
86. Kristensen TS. The soft guidelines of NIOH, Copenhagen. How to go from
survey to action.
www.arbejdsmiljoforskning.dk/~/media/Spoergeskemaer/copsoq/soft-
guidelines-of-copsoq.pdf (accessed 26 February 2014).
87. Yu CH. An introduction to computing and interpreting Cronbach coefficient
alpha in SAS. www2.sas.com/proceedings/sugi26/p246-26.pdf (accessed 26
February 2014).
88. Muthén LK, Muthén BM. Exploratory factor analysis, confirmatory factor
analysis, and structural equation modeling for continuous outcomes. Los
Angeles: Mplus; 2008.
89. Torres-Reyna O. Getting started in factor analysis (using stata 10).
dss.princeton.edu/training/Factor.pdf (accessed 26 February 2014).
90. Garrett-Mayer E. Factor Analysis I.
http://ocw.jhsph.edu/courses/statisticspsychosocialresearch/pdfs/lecture8.pdf
(accessed 26 February 2014).
91. Caplan RP. Stress, anxiety, and depression in hospital consultants, general
practitioners, and senior health service managers. BMJ 1994; 309(6964):1261.
92. Guion LA, Diehl DC, McDonald D. Conducting an In-depth Interview.
Gainesville: University of Florida; 2011.

109
93. Manshor AT, Fontaine R, Choy CS. Occupational stress among managers: a
Malaysian survey. Journal of Managerial Psychology 2003;18(6):622–8.
94. Maruyama S, Morimoto K. Effects of long work hours on life-style, stress and
quality of life among intermediate Japanese managers. Scandinavian Journal
of Work, Environment & Health 1996; 22(5):353–9.
95. Parker DF, DeCotiis TA. Organizational determinants of job stress.
Organizational Behavior and Human Performance 1983; 32(2):160–77.
96. Gillespie DF, Cohen SE. Causes of worker burnout. Children and Youth
Services Review 1984;6(2):115–24.
97. Raedeke TD, Smith AL. Coping Resources and Athlete Burnout: An
Examination of Stress Mediated and Moderation Hypotheses. Journal of Sport
& Exercise Psychology 2004;26(4): 525-541.
98. Vanderbilt University. Responses to Stress Questionnaire.
http://vkc.mc.vanderbilt.edu/stressandcoping/rsq/ (accessed 27 February
2014).
99. Tobin, DL, Holroyd KA, Reynolds RVC. Coping strategies inventory.
Columbus: University of Ohio; 1984.

110
100. Fahlén G, Knutsson A, Peter R, Åkerstedt T, Nordin M, Alfredsson L,
Westerholm P. Effort–reward imbalance, sleep disturbances and fatigue.
International Archives of Occupational and Environmental Health 2006;
79(5):371–8.
101. Bakker A, Demerouti E, Schaufeli W. Dual processes at work in a call centre:
An application of the job demands–resources model. European Journal of
Work and Organizational Psychology 2003;12(4):393–417.
102. Bakker AB, Demerouti E. The Job Demands-Resources model: state of the art.
Journal of Managerial Psychology 2007 Apr 3;22(3):309–28.
103. Karasek R. Demand/control model: A social, emotional, and physiological
approach to stress risk and active behaviour development. Encyclopedia of
Occupational Health and Safety 1998; 2:34–6.
104. Karasek RA. Job Demands, Job Decision Latitude, and Mental Strain:
Implications for Job Redesign. Administrative Science Quarterly 1979;
24(2):285–308.
105. Dwyer DJ, Ganster DC. The effects of job demands and control on employee
attendance and satisfaction. Journal of Organizational Behavior 1991;
12(7):595–608.

111
106. Jepson E, Forrest S. Individual contributory factors in teacher stress: The role
of achievement striving and occupational commitment. British Journal of
Educational Psychology 2006; 76(1):183–97.
107. Siu O. Job stress and job performance among employees in Hong Kong: The
role of Chinese work values and organizational commitment. International
Journal of Psychology 2003;38(6):337–47.
108. Nikolaou I, Tsaousis I. Emotional intelligence in the workplace: Exploring its
effects on occupational stress and organizational commitment. International
Journal of Organizational Analysis 2002;10(4):327–42.
109. Siegrist J. Adverse health effects of high-effort/low-reward conditions. Journal
of Occupational Health Psychology 1996; 1(1):27-41.
110. Van Vegchel N, de Jonge J, Bosma H, Schaufeli W. Reviewing the effort–
reward imbalance model: drawing up the balance of 45 empirical studies.
Social Science & Medicine 2005;60(5):1117–31.
111. Siegrist J, Starke D, Chandola T, Godin I, Marmot M, Niedhammer I, et al. The
measurement of effort–reward imbalance at work: European comparisons.
Social Science & Medicine 2004; 58(8):1483–99.

112
112. Schneider KT, Swan S, Fitzgerald LF. Job-related and psychological effects of
sexual harassment in the workplace: Empirical evidence from two
organizations. Journal of Applied Psychology 1997; 82(3):401–15.
113. Crull P. Stress effects of sexual harassment on the job: Implications for
counseling. American Journal of Orthopsychiatry 1982; 52(3):539–44.
114. Livingston JA. Responses to sexual harassment on the job: Legal,
organizational, and individual actions. Journal of Social Issues 1982; 38(4):5–
22.
115. Mayhew C, Chappell D. Workplace violence: an overview of patterns of risk
and the emotional/stress consequences on targets. International Journal of
Law and Psychiatry 2007; 30(4):327–39.
116. Matthiesen SB, Einarsen S. Psychiatric distress and symptoms of PTSD
among victims of bullying at work. British Journal of Guidance & Counselling
2004; 32(3):335–56.
117. Quine L. Workplace bullying in NHS community trust: staff questionnaire
survey. BMJ 1999; 318(7178):228–32.
118. Vartia MA. Consequences of workplace bullying with respect to the well-being
of its targets and the observers of bullying. Scandinavian Journal of Work,
Environment & Health 2001;27(1):63–9.

113
119. Kelloway EK, Sivanathan N, Francis L, Barling J. Poor leadership. In: Barling J,
Kelloway EK, Frone MR (eds.) Thousand Oaks:Handbook of Work Stress;
2005. p.89-112.
120. Arnold KA, Turner N, Barling J, Kelloway EK, McKee MC. Transformational
leadership and psychological well-being: the mediating role of meaningful
work. Journal of Occupational Health Psychology 2007;12(3):193.
121. Offermann LR, Hellmann PS. Leadership behavior and subordinate stress: A
360" view. Journal of Occupational Health Psychology 1996; 1(4):382–90.
122. Cohen S, Wills TA. Stress, social support, and the buffering hypothesis.
Psychological Bulletin 1985; 98(2):310–57.
123. Thoits PA. Conceptual, Methodological, and Theoretical Problems in Studying
Social Support as a Buffer Against Life Stress. Journal of Health and Social
Behavior 1982;23(2):145.
124. Beehr TA, King LA, King DW. Social support and occupational stress: Talking
to supervisors. Journal of Vocational Behavior 1990;36(1):61–81.
125. Chen M, Miller G. Teacher Stress: A Review of the International Literature.
Washington, DC: Education Resources Information Center, Institute of
Education Sciences; 1997.

114
126. Chapman J. Collegial support linked to reduction of job stress. Nursing
Management 1993; 24(5):52–7.
127. Friedman RA, Tidd ST, Currall SC, Tsai JC. What goes around comes around:
The impact of personal conflict style on work conflict and stress. International
Journal of Conflict Management 2000; 11(1):32–55.
128. Cropanzano R, Howes JC, Grandey AA, Toth P. The relationship of
organizational politics and support to work behaviors, attitudes, and stress.
Journal of Organizational Behavior 1997; 18(2):159–80.
129. Byron K. A meta-analytic review of work–family conflict and its antecedents.
Journal of Vocational Behavior 2005; 67(2):169–98.
130. Allen TD, L E, Bruck CS, Sutton M. Consequences associated with work-to-
family conflict: A review and agenda for future research. Journal of
Occupational Health Psychology 2000; 5(2):278–308.
131. Von Holdt K, Murphy M. Public hospitals in South Africa: Stressed institutions,
disempowered management. In Buhlungu S, Daniel J, Southall R, Lutchman J
(eds.) State of the nation: South Africa 2007. Cape Town: HSRC Press; 2007.
132. Benatar SR. Health Care Reform and the Crisis of HIV and AIDS in South
Africa. The New England Journal of Medicine 2004; 351(1):81–92.

115
133. Van Dyk AC. Occupational stress experienced by caregivers working in the
HIV/AIDS field in South Africa. African Journal of AIDS Research 2007;
6(1):49–66.
134. Robert L. Boughner. Volunteer Bias. http://srmo.sagepub.com/view/encyc-of-
research-design/n492.xml (accessed 27 February 2014).
135. Jamieson S. Likert scales: how to (ab) use them. Medical Education 2004;
38(12):1217–8.
136. Cohen L, Manion L, Morrison K. Research Methods in Education. 6th ed.
Oxford: Routledge; 2007.
137. Foundation Trust Network. Back office efficiency and management
optimization. London: Foundation Trust Network; 2010.
138. O‘Brien K. Improving survey questionnaires through focus groups. In: Morgan
DL (ed.) Successful Focus Groups: Advancing the State of the Art.
London:Sage Publications; 1993. p.105-117.
139. EMGO+ Institute for Health and Care Research. Questionnaires: selecting,
translating and validating. Amsterdam: EMGO+ Institute for Health and Care
Research; 2010.
116
140. Lutgen-Sandvik P, Namie G, Namie R. Workplace bullying. Causes,
Consequences and Corrections. In: Lutgen-Sandvik P, Sypher BD (eds.)
Destructive Organizational Communication: Processes, Consequences, and
Constructive Ways of Organizing. New York: Routledge; 2009. p.27-52.
141. Drummond M, Sculpher M, Torrance G, O‘Brien B, Stoddart G. Methods for
the Economic Evaluation of Health Care Programmes. 3rd ed. Oxford: Oxford
University Press; 2005.

117
APPENDICES
Appendix 1: The Copenhagen Psychosocial Questionnaire (medium size)
Appendix 2: The scales of the medium size COPSOQ II questionnaire
Appendix 3: Ethics clearance certificate
Appendix 4: Medical Advisory Committee permission letter
Appendix 5: Consent form
Appendix 6: Study information sheet

118
Appendix 1:
The Copenhagen Psychosocial Questionnaire
(medium size)
Questionnaire on psychosocial factors at work
This space is for company logo or name

2
Which department do you work in? __________________________________________ What is your job? __________________________________________
Are you:
□ Woman
□ Man
How old are you?
□ Under 30 years
□ 30-39 years
□ 40-49 years
□ 50-59 years
□ 60 years or more
Psychosocial factors at work The following questions are about your psychosocial work environment and job satisfaction. Some of the questions may fit better to your work than others, but please answer all questions. Always Often Some-
times Seldom Never/
hardly ever
Is your work unevenly distributed so it piles up?
□ □ □ □ □
Does your work put you in emotionally disturbing situations?
□ □ □ □ □
Do you have a large degree of influence concerning your work?
□ □ □ □ □
Do you have to work very fast? □ □ □ □ □
Is there a good atmosphere between you and your colleagues?
□ □ □ □ □

3
Always Often Some-times
Seldom Never/ hardly ever
Do you have to relate to other people’s personal problems as part of your work?
□ □ □ □ □
Do you have a say in choosing who you work with?
□ □ □ □ □
Do you have any influence on what you do at work?
□ □ □ □ □
Do you get behind with your work? □ □ □ □ □
Is there good co-operation between the colleagues at work?
□ □ □ □ □
How often do you not have time to complete all your work tasks?
□ □ □ □ □
Do you have enough time for your work tasks? □ □ □ □ □
Do you feel part of a community at your place of work?
□ □ □ □ □
Can you influence the amount of work assigned to you?
□ □ □ □ □
How often do you consider looking for work elsewhere?
□ □ □ □ □
How often do you get help and support from your colleagues?
□ □ □ □ □
How often are your colleagues willing to listen to your problems at work?
□ □ □ □ □
How often do your colleagues talk with you about how well you carry out your work?
□ □ □ □ □

4
To a very
large extent
To a large extent
Some-what
To a small extent
To a very small extent
Is it necessary to keep working at a high pace?
□ □ □ □ □
Is your work emotionally demanding? □ □ □ □ □
Does your work require you to take the initiative?
□ □ □ □ □
Is your work meaningful? □ □ □ □ □
At your place of work, are you informed well in advance concerning for example important decisions, changes, or plans for the future?
□ □ □ □ □
Does your work have clear objectives? □ □ □ □ □
Are contradictory demands placed on you at work?
□ □ □ □ □
Is your work recognised and appreciated by the management?
□ □ □ □ □
Do you feel that the work you do is important? □ □ □ □ □
Would you recommend a good friend to apply for a position at your workplace?
□ □ □ □ □
Do you know exactly which areas are your responsibility?
□ □ □ □ □
Does the management at your workplace respect you?
□ □ □ □ □
Do you get emotionally involved in your work? □ □ □ □ □
Can you use your skills or expertise in your work?
□ □ □ □ □
Do you enjoy telling others about your place of work?
□ □ □ □ □
Do you receive all the information you need in order to do your work well?
□ □ □ □ □

5
To a very
large extent
To a large extent
Some-what
To a small extent
To a very small extent
Do you do things at work, which are accepted by some people but not by others?
□ □ □ □ □
Are you treated fairly at your workplace? □ □ □ □ □
Do you know exactly what is expected of you at work?
□ □ □ □ □
Do you sometimes have to do things, which ought to have been done in a different way? (
□ □ □ □ □
Do you have the possibility of learning new things through your work?
□ □ □ □ □
Do you feel motivated and involved in your work?
□ □ □ □ □
Do you sometimes have to do things, which seem to be unnecessary?
□ □ □ □ □
Do you work at a high pace throughout the day?
□ □ □ □ □
Does your work give you the opportunity to develop your skills?
□ □ □ □ □
Do you feel that your place of work is of great importance to you?
□ □ □ □ □
Regarding your work in general. How pleased are you with: Very
satisfied Satisfied Un-
satisfied Very
unsatisfied
- your work prospects? □ □ □ □
- the physical working conditions? □ □ □ □
- the way your abilities are used? □ □ □ □
- your job as a whole, everything taken into consideration?
□ □ □ □

6
The workplace as a whole
The next questions are not about your own job but about the workplace as a whole. To a very
large extent
To a large extent
Some-what
To a small extent
To e very small extent
Does the management trust the employees to do their work well?
□ □ □ □ □
Can you trust the information that comes from the management?
□ □ □ □ □
Are conflicts resolved in a fair way? □ □ □ □ □
Does the management withhold important information from the employees?
□ □ □ □ □
Are employees appreciated when they have done a good job?
□ □ □ □ □
Do the employees withhold information from each other?
□ □ □ □ □
Do the employees withhold information from the management?
□ □ □ □ □
Do the employees in general trust each other? □ □ □ □ □
Are all suggestions from employees treated seriously by the management?
□ □ □ □ □
Are the employees able to express their views and feelings?
□ □ □ □ □
Is the work distributed fairly? □ □ □ □ □

7
The next questions concern your relationship to your nearest superior. Always Often Some-
times Seldom Never/
hardly ever
How often is your nearest superior willing to listen to your problems at work?
□ □ □ □ □
How often do you get help and support from your nearest superior?
□ □ □ □ □
How often does your nearest superior talk with you about how well you carry out your work?
□ □ □ □ □
To what extent would you say that your immediate superior… To a very
large extent
To a large extent
Some-what
To a small extent
To a very small extent
- makes sure that the individual member of staff has good development opportunities?
□ □ □ □ □
- gives high priority to job satisfaction? □ □ □ □ □
- is good at work planning? □ □ □ □ □
- is good at solving conflicts? □ □ □ □ □
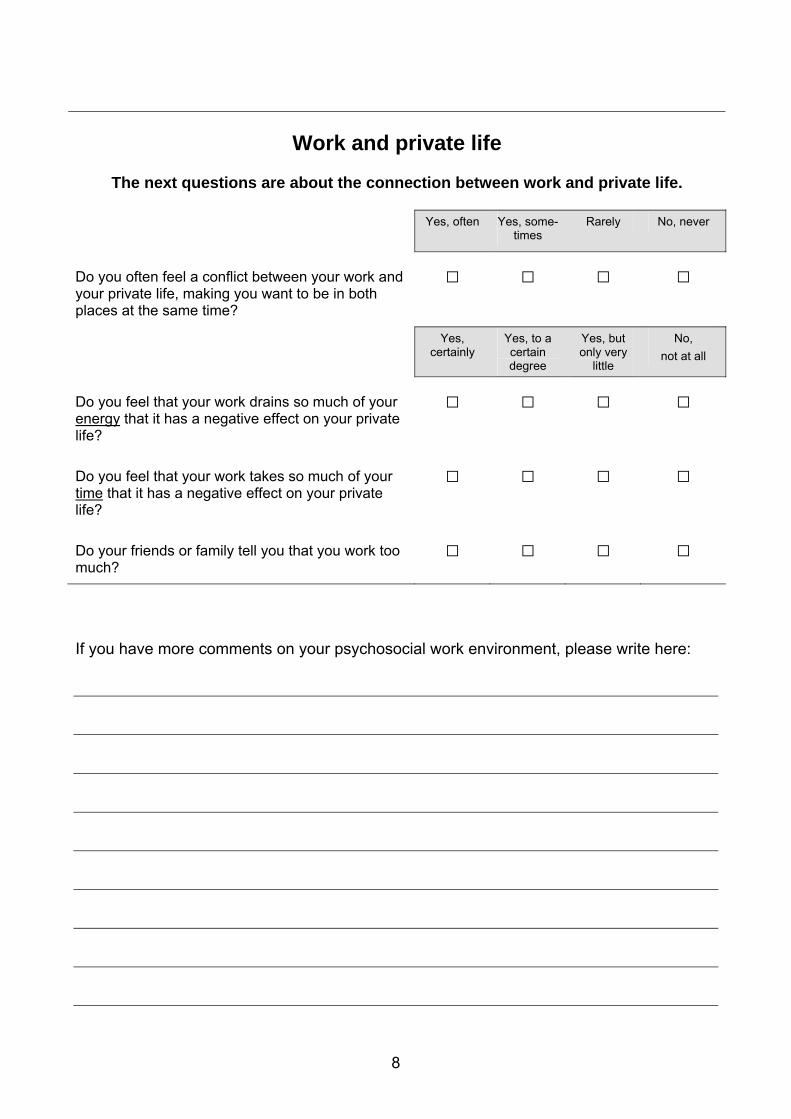
8
Work and private life
The next questions are about the connection between work and private life.
Yes, often Yes, some-
times Rarely No, never
Do you often feel a conflict between your work and your private life, making you want to be in both places at the same time?
□ □ □ □
Yes,
certainly Yes, to a certain degree
Yes, but only very
little
No, not at all
Do you feel that your work drains so much of your energy that it has a negative effect on your private life?
□ □ □ □
Do you feel that your work takes so much of your time that it has a negative effect on your private life?
□ □ □ □
Do your friends or family tell you that you work too much?
□ □ □ □
If you have more comments on your psychosocial work environment, please write here:

9
Health and well-being
These questions are about how you have been during the last 4 weeks.
All the
time A large part of
the time
Part of the time
A small part of
the time
Not at all
How often have you slept badly and restlessly? □ □ □ □ □
How often have you felt worn out? □ □ □ □ □
How often have you found it hard to go to sleep?
□ □ □ □ □
How often have you been physically exhausted? □ □ □ □ □
How often have you been emotionally exhausted?
□ □ □ □ □
How often have you woken up too early and not been able to get back to sleep?
□ □ □ □ □
How often have you felt tired? □ □ □ □ □
How often have you woken up several times and found it difficult to get back to sleep?
□ □ □ □ □
How often have you had problems relaxing? □ □ □ □ □
How often have you been irritable? □ □ □ □ □
How often have you been tense? □ □ □ □ □
How often have you been stressed? □ □ □ □ □
Excellent Very
good Good Fair Poor
In general, would you say your health is: □ □ □ □ □

10
Conflicts and offensive behaviours Yes,
daily Yes,
weekly Yes,
monthly Yes, a
few times No
Have you been exposed to undesired sexual attention at your workplace during the last 12 months?
□ □ □ □ □
Collea-gues
Manager/ superior
Sub-ordinates
Clients/ customers/
patients
If yes, from whom? (You may tick off more than one) □ □ □ □
Yes, daily
Yes, weekly
Yes, monthly
Yes, a few times
No
Have you been exposed to threats of violence at your workplace during the last 12 months?
□ □ □ □ □ Collea-
gues Manager/ superior
Sub-ordinates
Clients/ customers/
patients
If yes, from whom? (You may tick off more than one) □ □ □ □
Yes, daily
Yes, weekly
Yes, monthly
Yes, a few times
No
Have you been exposed to physical violence at your workplace during the last 12 months?
□ □ □ □ □ Collea-
gues Manager/ superior
Sub-ordinates
Clients/ customers/
patients
If yes, from whom? (You may tick off more than one) □ □ □ □
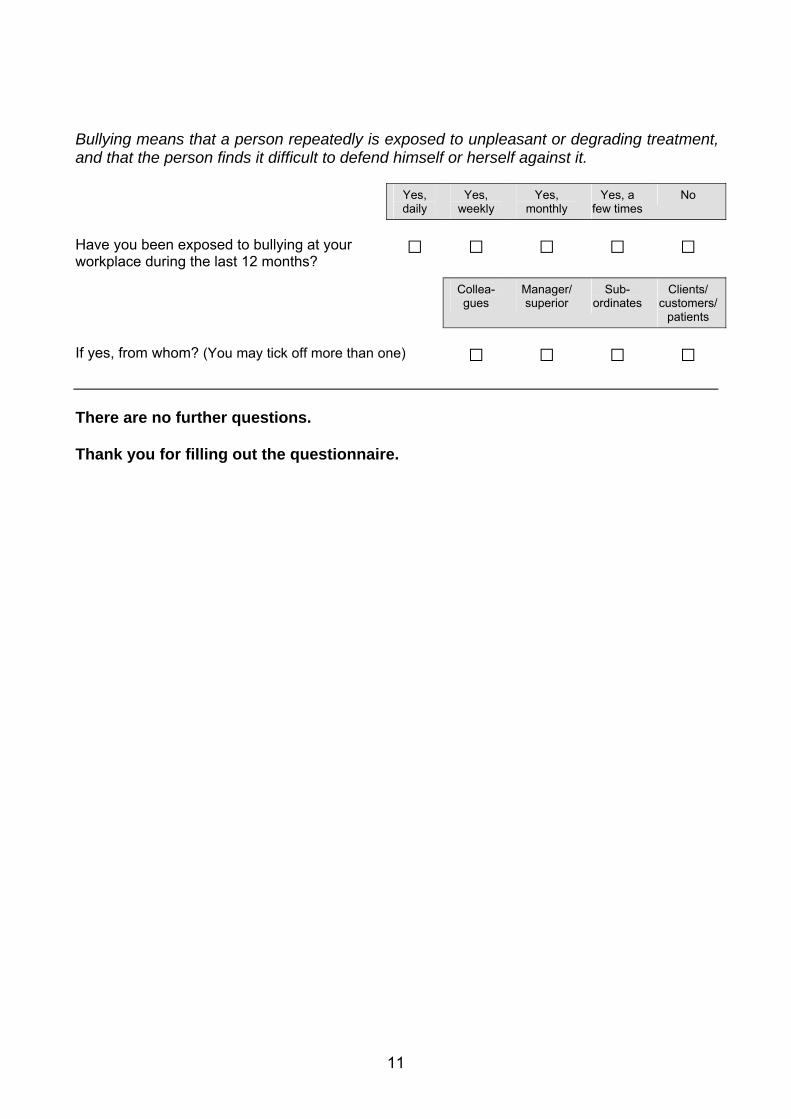
11
Bullying means that a person repeatedly is exposed to unpleasant or degrading treatment, and that the person finds it difficult to defend himself or herself against it. Yes,
daily Yes,
weekly Yes,
monthly Yes, a
few times No
Have you been exposed to bullying at your workplace during the last 12 months?
□ □ □ □ □ Collea-
gues Manager/ superior
Sub-ordinates
Clients/ customers/
patients
If yes, from whom? (You may tick off more than one) □ □ □ □ There are no further questions. Thank you for filling out the questionnaire.

130
Appendix 2:
The scales of the medium size COPSOQ II questionnaire

27.8.2007
COPSOQ II The scales of the MEDIUM SIZE COPSOQ II questionnaire.
The purpose of this paper is to describe the scales and items of the medium size questionnaire of the COPSOQ II. The questionnaire was developed on the basis of a survey of a representative sample of adult Danes aged 20-59 years. A total of 4,732 persons responded of whom 3,517 were employees. The response rate was 60.4% and 52% of the respondents were women. The population of 3,517 employees comprise the study base for the analyses described in the following. As a rule we have been aiming for scales with 3-4 questions (items) per scale. It is our experience that this gives sufficient reliability and precision. New items and scales, which were not part of COPSOQ I, are in italics. The numbers correspond to consecutive numbers in the original test-questionnaire. Most of the questions in COPSOQ II have five response options. These are: 1. Always, Often, Sometimes, Seldom, Never/hardly ever. (Called (Always …) in this paper). 2. To a very large extent, To a large extent, Somewhat, To a small extent, To a very small extent. (Called (To a very large …) in this paper). Scoring of the scales All the scales of COPSOQ are scored 0-100 points. (The exception is the short questionnaire in which a very simple scoring system is used). The five response options are scored 100, 75, 50, 25, 0. In case of only four response options the scores are 100, 66.7, 33.3, 0. The total score on a scale for a respondent is the average of the scores on the individual items. A person is considered missing if less than half of the questions in a scale have been answered. High scores correspond to high values on the respective dimensions. Thus, a high score on burnout means a high burnout level, and a low score on influence means a low level of influence at work. In most cases high levels are “good” or “healthy”. The exceptions are quantitative demands, work pace, emotional demands, role conflicts, work-family conflict, burnout, stress, and sleeping problems. A few of the questions are scored with “reversed scoring”. This is indicated in the text below at all the relevant places.

2
Quantitative demands: 32.1 Is your workload unevenly distributed so it piles up? (Always…) 32.20 How often do you not have time to complete all your work tasks? (Always…) 32.14 Do you get behind with your work? (Always…) 32.23 Do you have enough time for your work tasks? (Always…). (Reversed scoring) Scale characteristics: Non-response: 77. Average 40.2. SD: 20.5. Cronbach’s alpha = 0.82. Item-correlations with total scale: 0.58 – 0.73. Inter-item correlations: 0.45 – 0.65. Tempo, Work pace: 32.6 Do you have to work very fast? (Always…) 35.35 Do you work at a high pace throughout the day? (To a very large…) 35.2 Is it necessary to keep working at a high pace? (To a very large…) Scale characteristics: Nonresponders: 79. Average: 59.5. SD: 19.1. Cronbach’s alpha: 0.84. Item correlations with total scale: 0.67 – 0.74. Inter-item correlations: 0.58 – 0.67. Cognitive demands: There is no scale on cognitive demands in the medium size questionnaire. Emotional demands: 32.3 Does your work put you in emotionally disturbing situations? (Always…) 32.8 Do you have to relate to other people’s personal problems as part of your work? (Always…) 35.3 Is your work emotionally demanding? (To a very large…) 35.19 Do you get emotionally involved in your work? (To a very large…) Scale characteristics: Non responders: 76. Average: 40.7. SD: 24.3. Cronbach’s alpha: 0.87. Item-correlations with the total scale: 0.65 – 0.80. Inter-item correlations: 0.54 – 0.70. Demands for hiding emotions: There is no scale on demands for hiding emotions in the medium size questionnaire. Sensory demands. There is no scale for sensory demands in COPSOQ II. Influence at work: 32.4 Do you have a large degree of influence concerning your work? (Always…)

3
32.9 Do you have a say in choosing who you work with? (Always…) 32.24 Can you influence the amount of work assigned to you? (Always…) 32.13 Do you have any influence on what you do at work? (Always…) Scale characteristics: Non responders: 78. Average: 49.8. SD: 21.2. Cronbach’s alpha: 0.73. Item correlations with total scale: 0.43 – 0.59. Inter-item correlations: 0.31 – 0.49. Possibilities for development (Skill discretion): 35.4 Does your work require you to take the initiative? (To a very large…) 35.31 Do you have the possibility of learning new things through your work? (To a very large…) 35.20 Can you use your skills or expertise in your work? (To a very large…) 35.36 Does your work give you the opportunity to develop your skills? (To a very large…) Scale characteristics: Non responders: 91. Average: 65.9. SD: 17.6. Cronbach’s alpha: 0.77. Item correlations with the total scale: 0.47 – 0.70. Inter-item correlations: 0.34 – 0.70. Variation of work: There is no scale on variation of work in the medium size questionnaire. Degrees of freedom at work: There is no scale on degrees of freedom at work in COPSOQ II. Meaning of work: 35.5 Is your work meaningful? (To a very large…) 35.13 Do you feel that the work you do is important? (To a very large…) 35.32 Do you feel motivated and involved in your work? (To a very large…) Scale characteristics: Non responders: 97. Average: 73.8. SD: 15.8. Cronbach’s alpha: 0.74. Item correlations with total scale: 0.55 – 0.57. Inter item correlations: 0.48 – 0.49. Commitment to the workplace: 35.21 Do you enjoy telling others about your place of work? (To a very large…) 35.37 Do you feel that your place of work is of great importance to you? (To a very large…) 35.14 Would you recommend a good friend to apply for a position at your workplace? (To a very large…) 32.28 How often do you consider looking for work elsewhere? (Always…) (Reversed scoring). Scale characteristics: Non responders: 78. Average: 60.9. SD: 20.4. Cronbach’s alpha: 0.77. Item correlations with the total scale: 0.55 – 0.61. Inter item correlationers: 0.38 – 0.51.
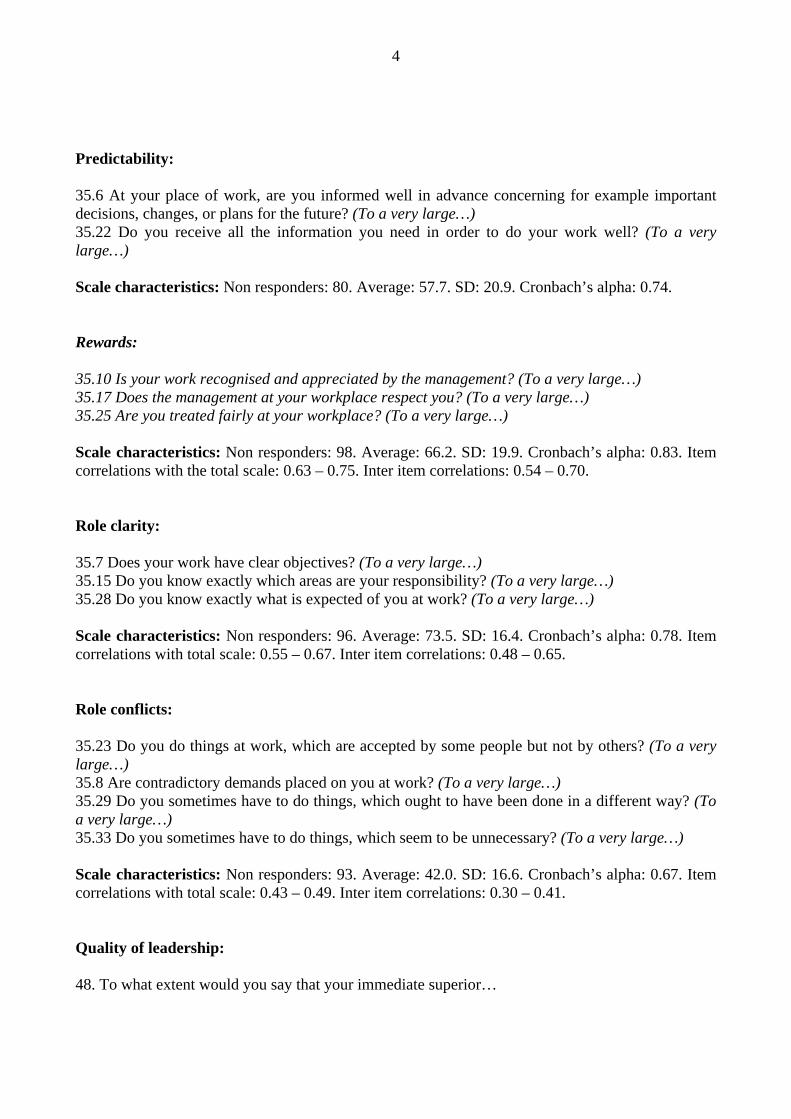
4
Predictability: 35.6 At your place of work, are you informed well in advance concerning for example important decisions, changes, or plans for the future? (To a very large…) 35.22 Do you receive all the information you need in order to do your work well? (To a very large…) Scale characteristics: Non responders: 80. Average: 57.7. SD: 20.9. Cronbach’s alpha: 0.74. Rewards: 35.10 Is your work recognised and appreciated by the management? (To a very large…) 35.17 Does the management at your workplace respect you? (To a very large…) 35.25 Are you treated fairly at your workplace? (To a very large…) Scale characteristics: Non responders: 98. Average: 66.2. SD: 19.9. Cronbach’s alpha: 0.83. Item correlations with the total scale: 0.63 – 0.75. Inter item correlations: 0.54 – 0.70. Role clarity: 35.7 Does your work have clear objectives? (To a very large…) 35.15 Do you know exactly which areas are your responsibility? (To a very large…) 35.28 Do you know exactly what is expected of you at work? (To a very large…) Scale characteristics: Non responders: 96. Average: 73.5. SD: 16.4. Cronbach’s alpha: 0.78. Item correlations with total scale: 0.55 – 0.67. Inter item correlations: 0.48 – 0.65. Role conflicts: 35.23 Do you do things at work, which are accepted by some people but not by others? (To a very large…) 35.8 Are contradictory demands placed on you at work? (To a very large…) 35.29 Do you sometimes have to do things, which ought to have been done in a different way? (To a very large…) 35.33 Do you sometimes have to do things, which seem to be unnecessary? (To a very large…) Scale characteristics: Non responders: 93. Average: 42.0. SD: 16.6. Cronbach’s alpha: 0.67. Item correlations with total scale: 0.43 – 0.49. Inter item correlations: 0.30 – 0.41. Quality of leadership: 48. To what extent would you say that your immediate superior…

5
2. makes sure that the individual member of staff has good development opportuni-ties? (To a very large…)
4. gives high priority to job satisfaction? (To a very large…) 5. is good at work planning? (To a very large…) 7. is good at solving conflicts? (To a very large…) Scale characteristics: Non responders: 852. Average: 55.3. SD: 21.1. Cronbach’s alpha: 0.89. Item correlations with total scale: 0.73 – 0.79. Inter item correlations: 0.60 – 0.71. Social support: Scale for social support from colleagues: 33.1 How often do you get help and support from your colleagues? (Always …). 33.2 How often are your colleagues willing to listen to your problems at work? (Always …). 33.3 How often do your colleagues talk with you about how well you carry out your work? (Always …). (For these items an extra response option: “Not relevant” has been added for those employees who might work alone without contact to colleagues. These respondents were scored as missing on this scale). Scale characteristics: Non responders: 187. Average: 57.3. SD: 19.7. Cronbach’s alpha: 0.70. Item correlations with the total scale: 0.48 – 0.56. Inter item correlations: 0.39 – 0.49. Scale for social support from supervisors: 47.1 How often is your nearest superior willing to listen to your problems at work? (Always …). 47.2 How often do you get help and support from your nearest superior? (Always …). 47.3 How often does your nearest superior talk with you about how well you carry out your work? (Always …). (These questions were only addressed to respondents who were not supervisors themselves and who had a supervisor). Scale characteristics: Non responders: 852. Average: 61.6. SD: 22.4. Cronbach’s alpha: 0.79. Item correlations with total scale: 0.59 – 0.68. Inter item correlations: 0.49 – 0.61. Correlation between the two scales on social support from colleagues and supervisors, respectively, is 0.46 (rather low). Feedback: There is no scale on feedback in COPSOQ II.

6
Social relations: There is no scale for social relations in COPSOQ II. Social community at work: 33.4 Is there a good atmosphere between you and your colleagues? (Always…) 33.5 Is there good co-operation between the colleagues at work? (Always…) 33.6 Do you feel part of a community at your place of work? (Always…) Scale characteristics: Non responders: 127. Average: 78.7. SD: 18.9. Cronbach’s alpha: 0.86. Item correlations with total scale: 0.71 – 0.74. Inter item correlations: 0.65 – 0.68. Job insecurity: There is no scale on job insecurity in the medium size questionnaire. Satisfaction with work – job satisfaction: 34. Regarding your work in general. How pleased are you with -
1. your work prospects? (Very satisfied. Satisfied. Unsatisfied. Very unsatisfied. Not relevant) 2. the physical working conditions? (Very satisfied. Satisfied. Unsatisfied. Very unsatisfied. Not relevant) 4. the way your abilities are used? (Very satisfied. Satisfied. Unsatisfied. Very unsatisfied. Not relevant) 6. your job as a whole, everything taken into consideration? (Very satisfied. Satisfied. Unsatisfied. Very unsatisfied. Not relevant)
Scale characteristics: Non responders: 122. Average: 65.3. SD: 18.2. Cronbach’s alpha: 0.82. Item correlations with total scale: 0.57 – 0.71. Inter item correlations: 0.46 – 0.62. Work family conflict: 29. Do you often feel a conflict between your work and your private life, making you want to be in both places at the same time? (Yes, often. Yes, sometimes. Rarely. No, never). 30.1 Do you feel that your work drains so much of your energy that it has a negative effect on your private life? (Yes, certainly. Yes, to a certain degree. Yes, but only very little. No, not at all). 30.2 Do you feel that your work takes so much of your time that it has a negative effect on your private life? (Yes, certainly. Yes, to a certain degree. Yes, but only very little. No, not at all). 30.3 Do your friends or family tell you that you work too much? (Yes, certainly. Yes, to a certain degree. Yes, but only very little. No, not at all).

7
Scale characteristics: Non responders: 101. Average: 33.5. SD: 24.3. Cronbach’s alpha: 0.80. Item correlations with total scale: 0.52 – 0.74. Inter item correlations: 0.39 – 0.69. Family work conflict There is no scale on family-work conflict in the medium size questionnaire. Trust: Top of the page: The next questions are not about your own job but about the workplace as a whole. Scale for “horizontal trust”: 36.10 Do the employees withhold information from each other? (To a very large…) (Reversed scoring) 36.11 Do the employees withhold information from the management? (To a very large…) (Reversed scoring) 36.15 Do the employees in general trust each other? (To a very large…) Scale characteristics: Non-responders: 113. Average: 68.6. SD: 16.9. Cronbach’s alpha: 0.77. Item correlations with total scale: 0.48 – 0.69. Inter item correlations: 0.41 – 0.68. Scale for ”vertical trust”: 36.1 Does the management trust the employees to do their work well? (To a very large…) 36.4 Can you trust the information that comes from the management? (To a very large…) 36.7 Does the management withhold important information from the employees? (To a very large...) (Reversed scoring). 36.19 Are the employees able to express their views and feelings? (To a very large…) Scale characteristics: Non responders: 87. Average: 67.0. SD: 17.7. Cronbach’s alpha = 0.80. Item correlations with the total scale: 0.55 – 0.69. Inter item correlations: 0.40 – 0.56. The two scales for trust have a correlation of 0.57, which confirms that they do not measure the same thing. Justice and respect: These items were under the same heading on the top of the page as the items on trust. 36.5 Are conflicts resolved in a fair way? (To a very large…) 36.8 Are employees appreciated when they have done a good job? (To a very large…) 36.18 Are all suggestions from employees treated seriously by the management? (To a very large...) 36.25 Is the work distributed fairly? (To a very large…)
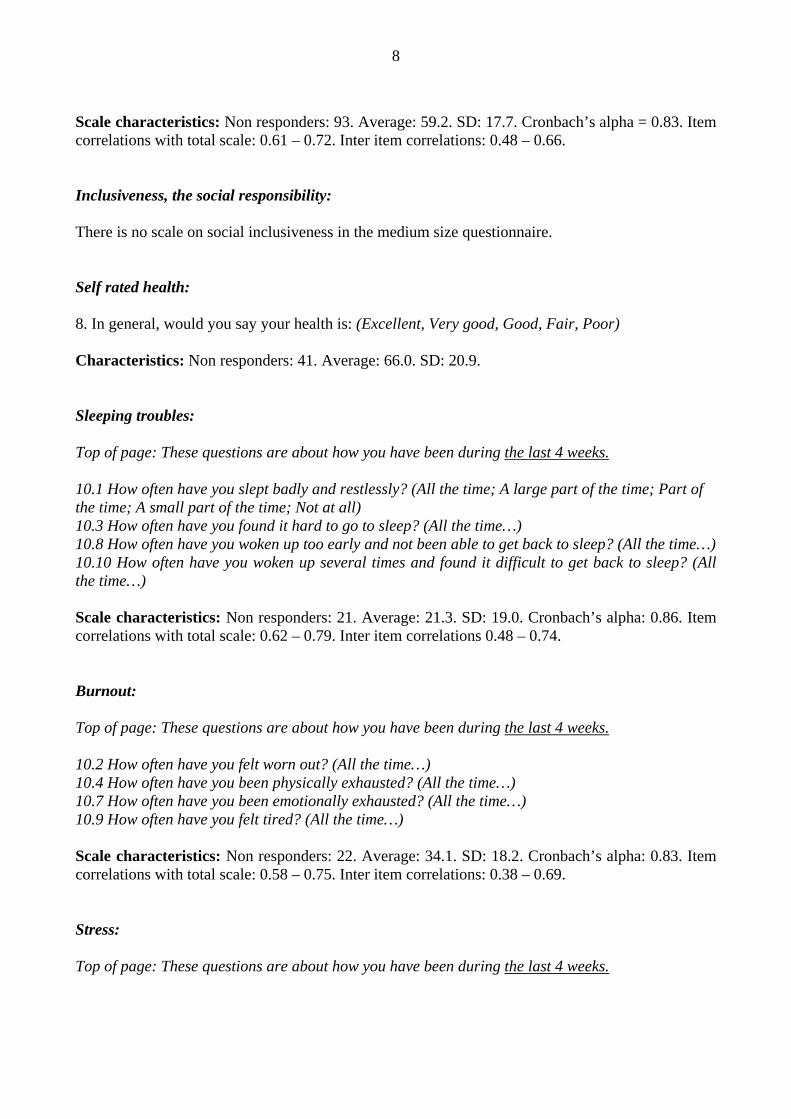
8
Scale characteristics: Non responders: 93. Average: 59.2. SD: 17.7. Cronbach’s alpha = 0.83. Item correlations with total scale: 0.61 – 0.72. Inter item correlations: 0.48 – 0.66. Inclusiveness, the social responsibility: There is no scale on social inclusiveness in the medium size questionnaire. Self rated health: 8. In general, would you say your health is: (Excellent, Very good, Good, Fair, Poor) Characteristics: Non responders: 41. Average: 66.0. SD: 20.9. Sleeping troubles: Top of page: These questions are about how you have been during the last 4 weeks. 10.1 How often have you slept badly and restlessly? (All the time; A large part of the time; Part of the time; A small part of the time; Not at all) 10.3 How often have you found it hard to go to sleep? (All the time…) 10.8 How often have you woken up too early and not been able to get back to sleep? (All the time…) 10.10 How often have you woken up several times and found it difficult to get back to sleep? (All the time…) Scale characteristics: Non responders: 21. Average: 21.3. SD: 19.0. Cronbach’s alpha: 0.86. Item correlations with total scale: 0.62 – 0.79. Inter item correlations 0.48 – 0.74. Burnout: Top of page: These questions are about how you have been during the last 4 weeks. 10.2 How often have you felt worn out? (All the time…) 10.4 How often have you been physically exhausted? (All the time…) 10.7 How often have you been emotionally exhausted? (All the time…) 10.9 How often have you felt tired? (All the time…) Scale characteristics: Non responders: 22. Average: 34.1. SD: 18.2. Cronbach’s alpha: 0.83. Item correlations with total scale: 0.58 – 0.75. Inter item correlations: 0.38 – 0.69. Stress: Top of page: These questions are about how you have been during the last 4 weeks.
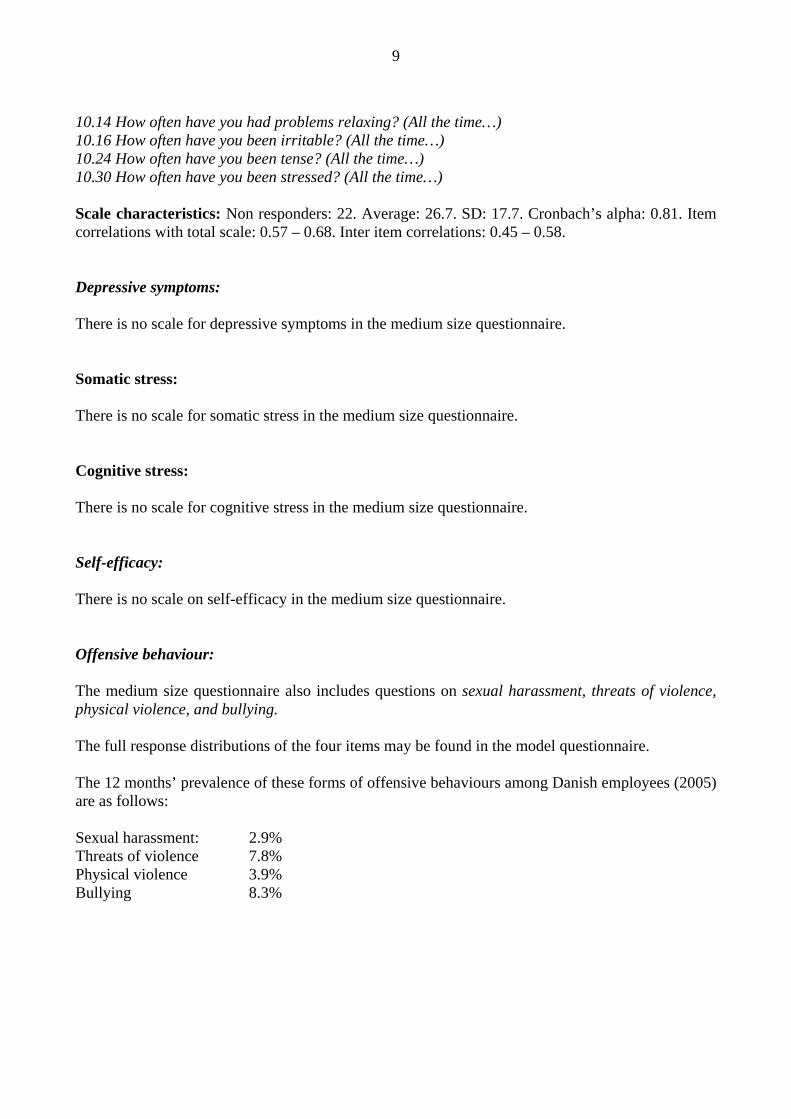
9
10.14 How often have you had problems relaxing? (All the time…) 10.16 How often have you been irritable? (All the time…) 10.24 How often have you been tense? (All the time…) 10.30 How often have you been stressed? (All the time…) Scale characteristics: Non responders: 22. Average: 26.7. SD: 17.7. Cronbach’s alpha: 0.81. Item correlations with total scale: 0.57 – 0.68. Inter item correlations: 0.45 – 0.58. Depressive symptoms: There is no scale for depressive symptoms in the medium size questionnaire. Somatic stress: There is no scale for somatic stress in the medium size questionnaire. Cognitive stress: There is no scale for cognitive stress in the medium size questionnaire. Self-efficacy: There is no scale on self-efficacy in the medium size questionnaire. Offensive behaviour: The medium size questionnaire also includes questions on sexual harassment, threats of violence, physical violence, and bullying. The full response distributions of the four items may be found in the model questionnaire. The 12 months’ prevalence of these forms of offensive behaviours among Danish employees (2005) are as follows: Sexual harassment: 2.9% Threats of violence 7.8% Physical violence 3.9% Bullying 8.3%

10
Overview of scales and number of questions in the three COPSOQ II questionnaires
Questionnaire
Long Medium Short Quantitative demands Work pace Cognitive demands Emotional demands Demands for hiding emotions
4 3 4 4 3
4 3 - 4 -
2 2 - 2 -
Influence Possibilities for development Variation Meaning of work Commitment to the workplace
4 4 2 3 4
4 4 - 3 4
2 2 - 2 2
Predictability Rewards (recognition) Role clarity Role conflicts Quality of leadership Social support from supervisor Social support from colleagues Social community at work
2 3 3 4 4 3 3 3
2 3 3 4 4 3 3 3
2 2 2 - 2 2 - -
Job insecurity Job satisfaction Work-family conflict Family-work conflict
4 4 4 3
- 4 4 -
- 1 2 -
Trust regarding management Mutual trust between employees Justice and respect Social inclusiveness
4 3 4 4
4 3 4 -
2 - 2 -
Self rated health Burnout Stress Sleeping troubles Depressive symptoms Somatic stress symptoms Cognitive stress symptoms
1 4 4 4 4 4 4
1 4 4 4 - - -
1 2 2 - - - -
Self-efficacy
6 - -
Sexual harassment Threats of violence Physical violence
1 1 1
1 1 1
1 1 1

11
Bullying Unpleasant teasing Conflicts and quarrels Gossip and slander
1 1 1 1
1 - - -
1 - - -
Number of dimensions
41 28 23
Number of questions 128 87 40

142
Appendix 3:
Ethics clearance certificate

144
Appendix 4:
Medical Advisory Committee permission letter

146
Appendix 5:
Consent form
CONSENT FORM
CONSENT FOR THE USE OF COMPLETED QUESTIONNAIRE DATA
Proposed Study Title: Occupational Stress in a South African Workforce
DATE: / / 2012 Study Number:
We are currently undertaking a research study on workplace stress (this is being done with through
the National Institute for Occupational Health and the University of the Witwatersrand). If you would
like to participate in this study, we would ask you to please complete the provided Copenhagen
Psychosocial Questionnaire. Data from completed questionnaires will be used for research
purposes. Approval for this study has been granted by the Human Research Ethics Committee
(Medical) of the University of the Witwatersrand.
Please note that your personal information will kept securely and will remain confidential. .
If you choose not to consent, you will not be disadvantaged in any way.
Furthermore, if at any time you choose to withdraw your consent, you also will not be
disadvantaged.
I have been provided with and have read the Study Information Sheet related to this research.
I consent to my completed questionnaires being used for research purposes.
Signature of Participant:
Date:
Researcher name:
Research signature:
Date:
Contact information
- Principal Investigator, Dr Heinrich Volmink:
Telephone: 0824586867 Email: [email protected]
- Human Research Ethics Committee (Medical) of the University of the Witwatersrand:
Telephone: 011-717-1234 Email: [email protected]

148
Appendix 6:
Study information sheet

1
STUDY INFORMATION SHEET
Proposed Study Title: Occupational Stress in a South African Workforce
Introduction
Hello, my name is Heinrich Volmink and I am part of team conducting research into
occupational stress. This type of stress is a substantial health challenge in many workplaces
in South Africa. The research is being carried out through the National Institute for
Occupational Health (NIOH) and the University of the Witwatersrand (Wits). One of the
reasons why we are conducting this research is so that we can establish risk factors for
occupational stress in a hospital setting. We hope to recruit at least 250 participants from
Chris Hani Baragwanath Academic Hospital.
What will the study involve?
The study will involve you completing a questionnaire called the Copenhagen Psychosocial
Questionnaire which will include questions relating to occupational stress. This questionnaire
should take about 30 minutes of your time to complete. You will be asked to complete the
questionnaire at a specific time and venue convenient to you. One of the members of the
research team will be available during this time, to answer any questions that you may have,
and to collect your questionnaires once completed. All of the data obtained from completed
questionnaires will be analyzed through a scientific research process.
Please note that you will be asked to complete this questionnaire again after approximately
one month. This is because we are also assessing the questionnaire itself, and therefore
need two completed questionnaires per person.
Why have I been chosen to participate?
You have been randomly selected from a list of personnel provided by Chris Hani
Baragwanath Academic Hospital - your selection was not based on any prior knowledge of
your health.
What will be done the ensure confidentiality?
Please rest assured that your identity will be protected. You will be assigned a unique study
number and the link between this number and your name will be kept securely by myself. All
you will be asked for is your signature on a consent form. In this way you will remain
anonymous. Data that may be used in reports will not include any information that identifies
you as a participant in this study. Only collective results will be published.
What if the questionnaire shows that I have a high level of occupational stress?
If significant health risks are detected by this study we will contact you directly and may
advise you to seek further support from the Employee Wellness Programme staff (contact
person: Gayle Schmidt, 011 933 8913 or # 7105) or a suitable health care provider of your
choice.

2
Will the study put anyone at risk?
The questionnaire may detect high levels of stress or burnout, and may make you more
aware of the underlying causes of this. In instances where this occurs we may advise you to
consult an appropriate health care provider of your choice.
What will the benefits of the study be?
While you may not experience any direct benefits, it is hoped that the study will contribute to
knowledge that may help the research team and the hospital to gain a better understanding
of occupational stress and how to address it. This will involve making recommendations for
the delivery of appropriate health services.
What if I don’t want to participate in the study?
Your participation in this study is entirely voluntary and you may choose stop at any time
without any consequences.
Who can I contact if I have any questions?
If you have any questions regarding the study, please contact Dr HC Volmink on
0824586867 or [email protected]. If there are any further concerns relating to
the research process, please contact the Health Research Ethics Committee at Wits on
011 7171234.