Occupational Safety and Health PH 150 10/24/11. Population Health Focuses on improving health of...
55
Occupational Safety and Health PH 150 10/24/11
-
Upload
norma-park -
Category
Documents
-
view
214 -
download
1
Transcript of Occupational Safety and Health PH 150 10/24/11. Population Health Focuses on improving health of...

OccupationalSafety and Health
PH 15010/24/11

Population Health
Focuses on improving health of communities – saves lives millions at a time, not just one at a time
Prevents disease and disability Promotes healthy environments
and behaviors Assures high quality, cost-effective
health care

Linkages and Overlaps
Public Health/ Health Care Systems
Population Health
Personal Health
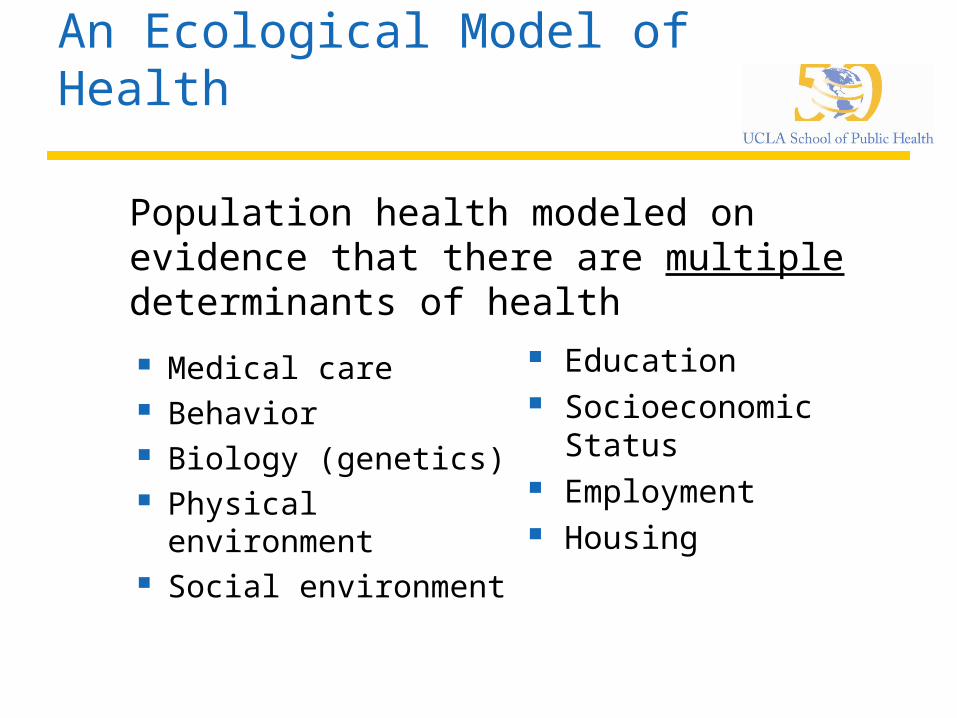
An Ecological Model of Health
Medical care Behavior Biology (genetics) Physical
environment Social environment
Education Socioeconomic
Status Employment Housing
Population health modeled on evidence that there are multiple determinants of health
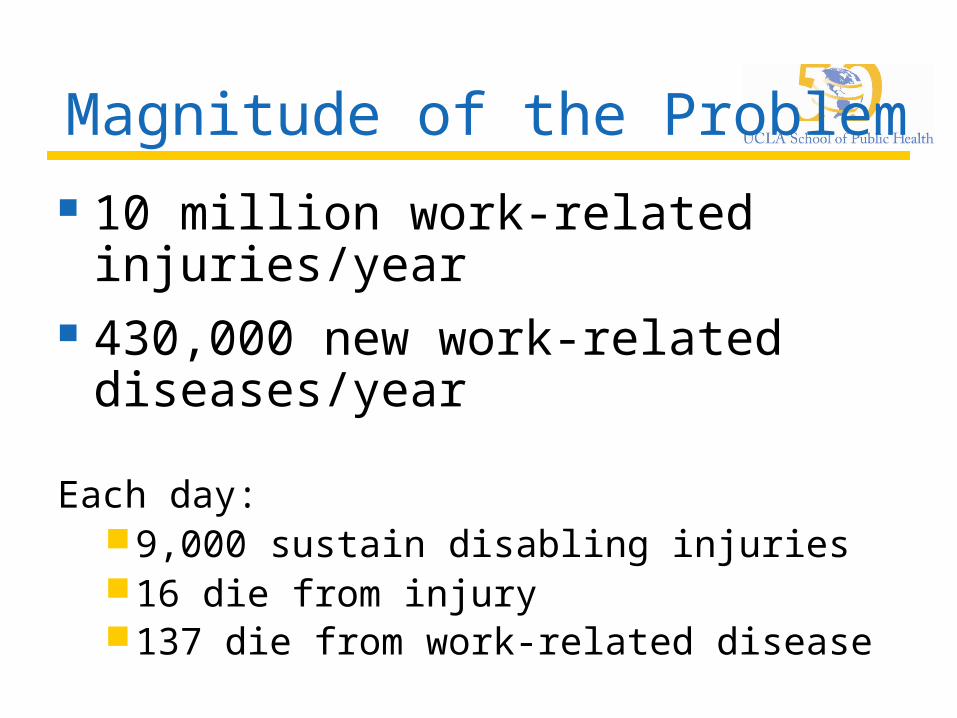
Magnitude of the Problem 10 million work-related
injuries/year 430,000 new work-related
diseases/year
Each day:9,000 sustain disabling injuries16 die from injury137 die from work-related disease
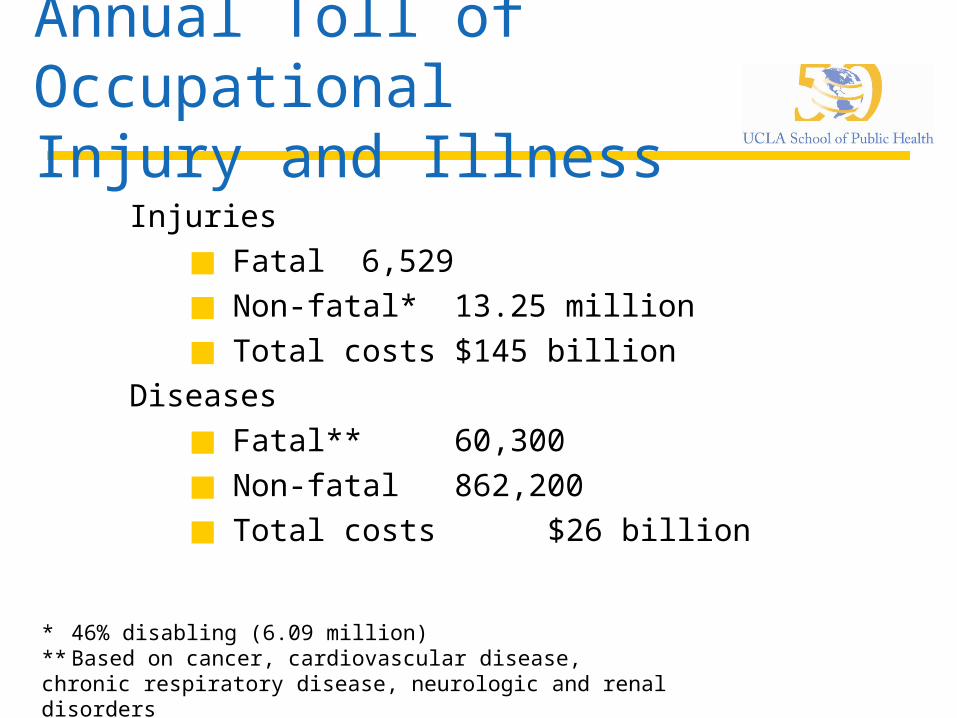
Annual Toll of Occupational Injury and Illness
Injuries Fatal 6,529 Non-fatal* 13.25 million Total costs $145 billion
Diseases Fatal** 60,300 Non-fatal 862,200 Total costs $26 billion
* 46% disabling (6.09 million)** Based on cancer, cardiovascular disease, chronic respiratory disease, neurologic and renal disorders
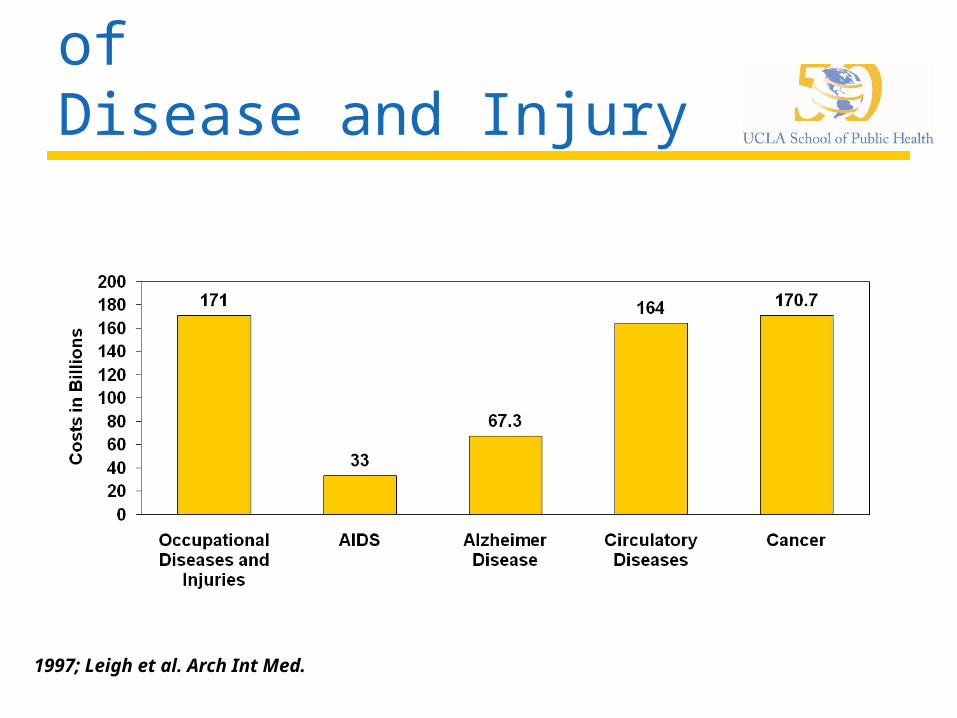
Annual Economic Burden of Disease and Injury
1997; Leigh et al. Arch Int Med.
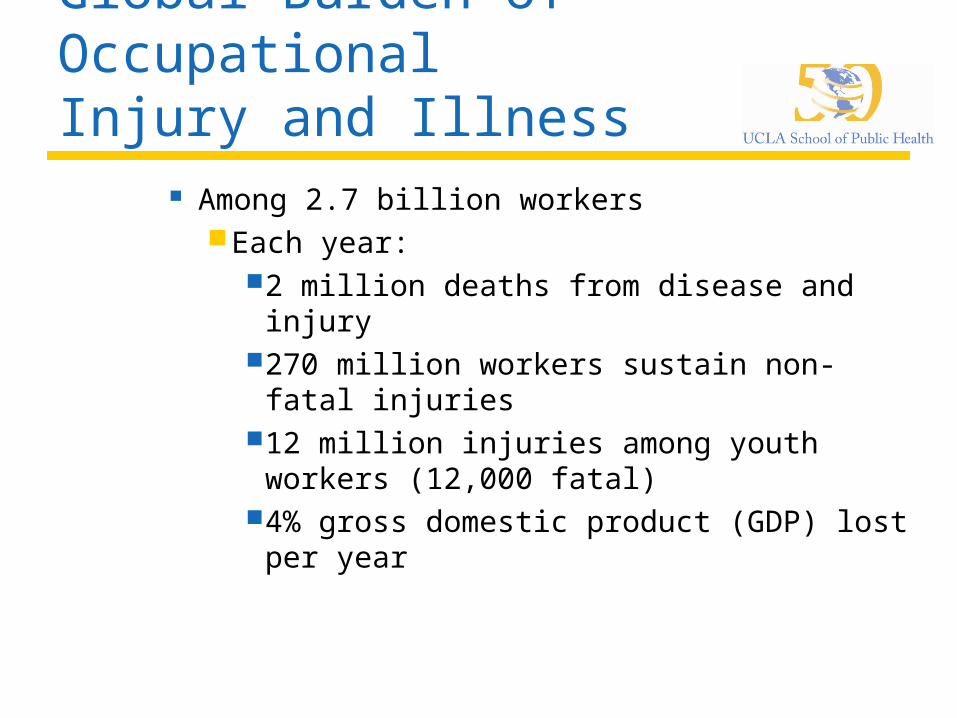
Global Burden of Occupational Injury and Illness
Among 2.7 billion workersEach year:
2 million deaths from disease and injury270 million workers sustain non-fatal
injuries12 million injuries among youth workers
(12,000 fatal)4% gross domestic product (GDP) lost
per year

Annual Global MortalityIn Millions
Low Income High Income Total
All Causes 48.4 7.9 56.3
Communicable Diseases
17.6 .56 18.2
Non-communicable Diseases
26.0 6.9 32.9
Injuries 4.7 .47 5.2

Occupational Risk Hazards
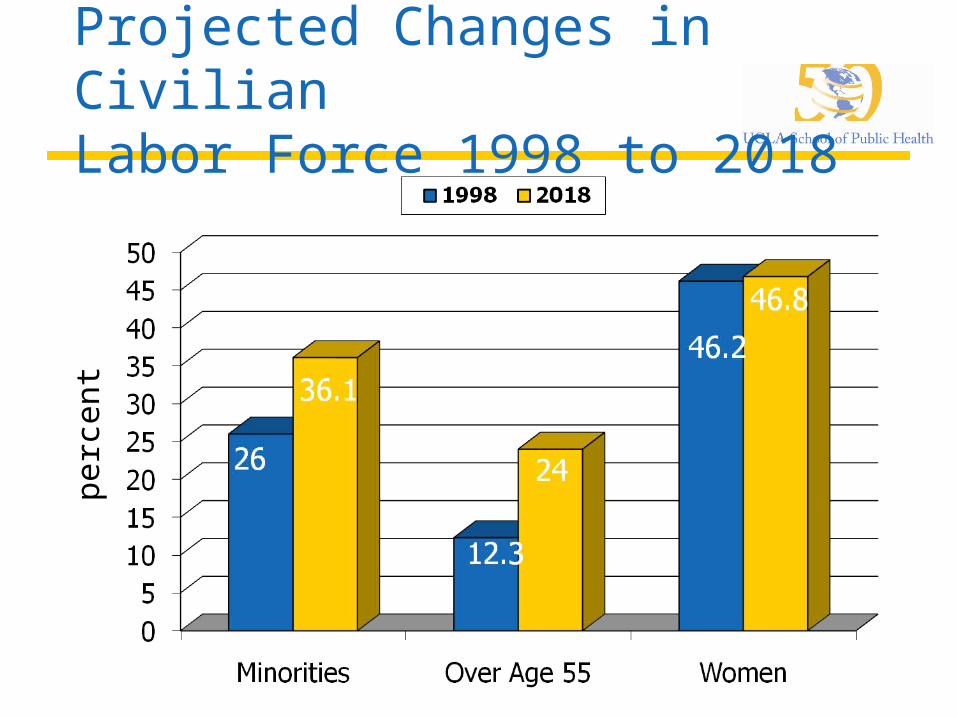
Projected Changes in Civilian Labor Force 1998 to 2018
p
erc
ent
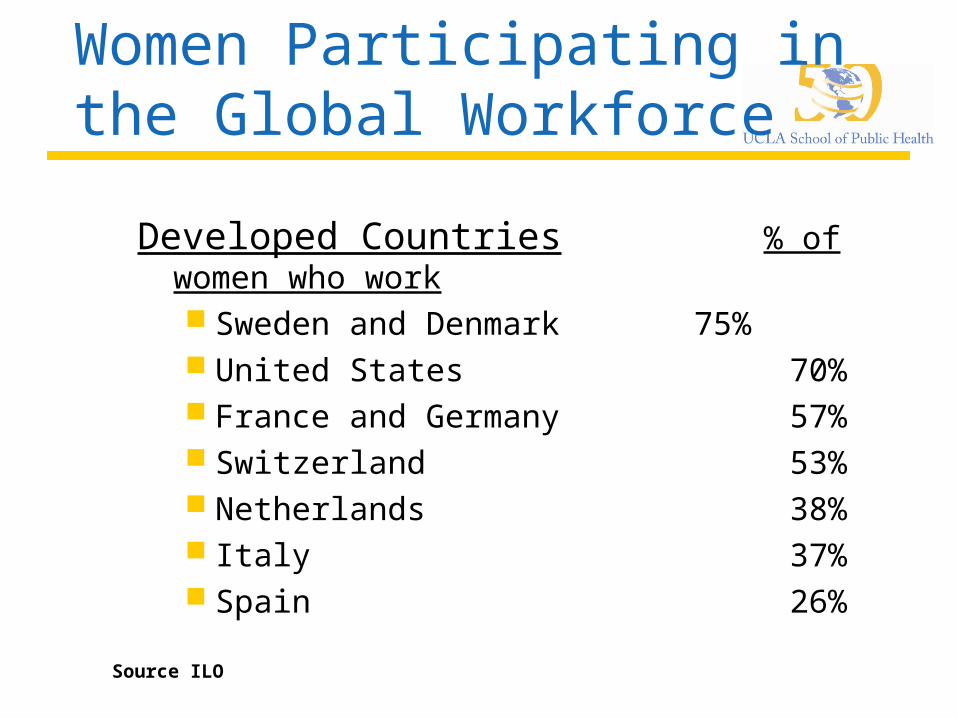
Women Participating in the Global Workforce
Developed Countries % of women who work Sweden and Denmark 75% United States 70% France and Germany 57% Switzerland 53% Netherlands 38% Italy 37% Spain 26%
Source ILO

Women Participating in the Global WorkforceDeveloping Countries % of women who work*
China 80% Mozambique 78% Vietnam 77% Thailand 67% Brazil and Chile 33% Mexico /Argentina 32% Egypt, Saudi Arabia, Oman, and Jordan 10% Algeria 8%
* Includes the informal workforce
Source, ILO

Aging Workforce
Source Health Affairs, May/June 2000
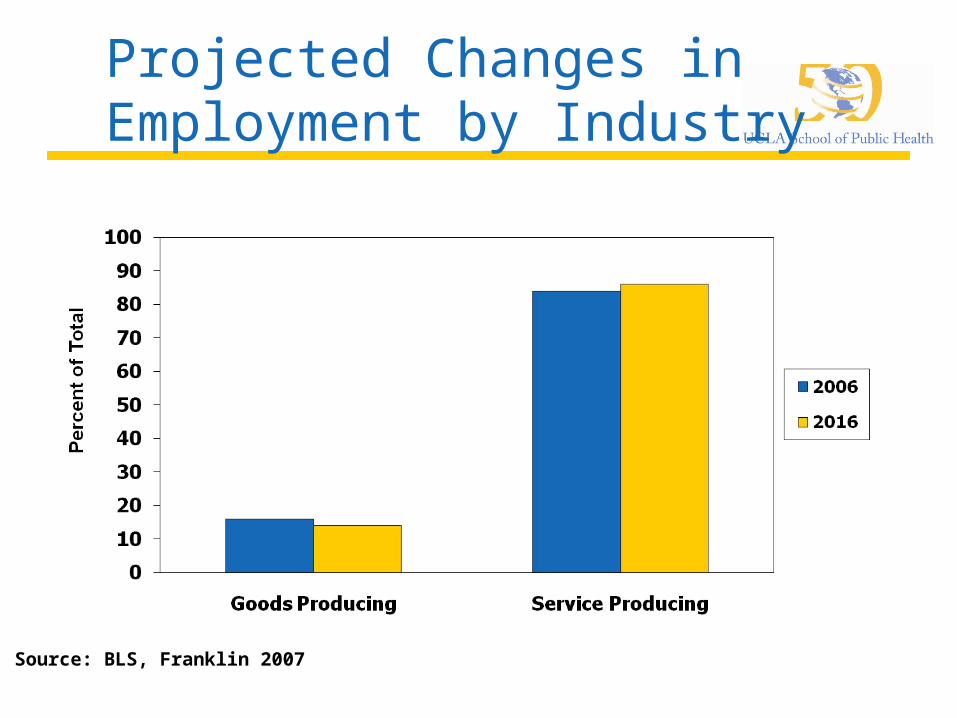
Projected Changes in Employment by Industry
Source: BLS, Franklin 2007
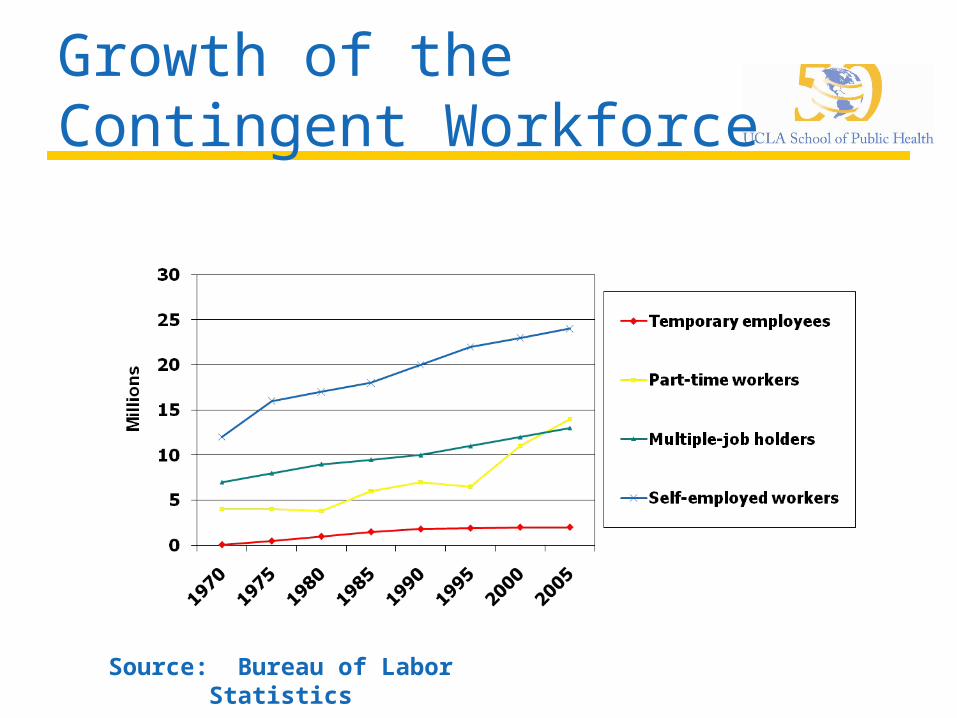
Growth of the Contingent Workforce
Source: Bureau of Labor Statistics
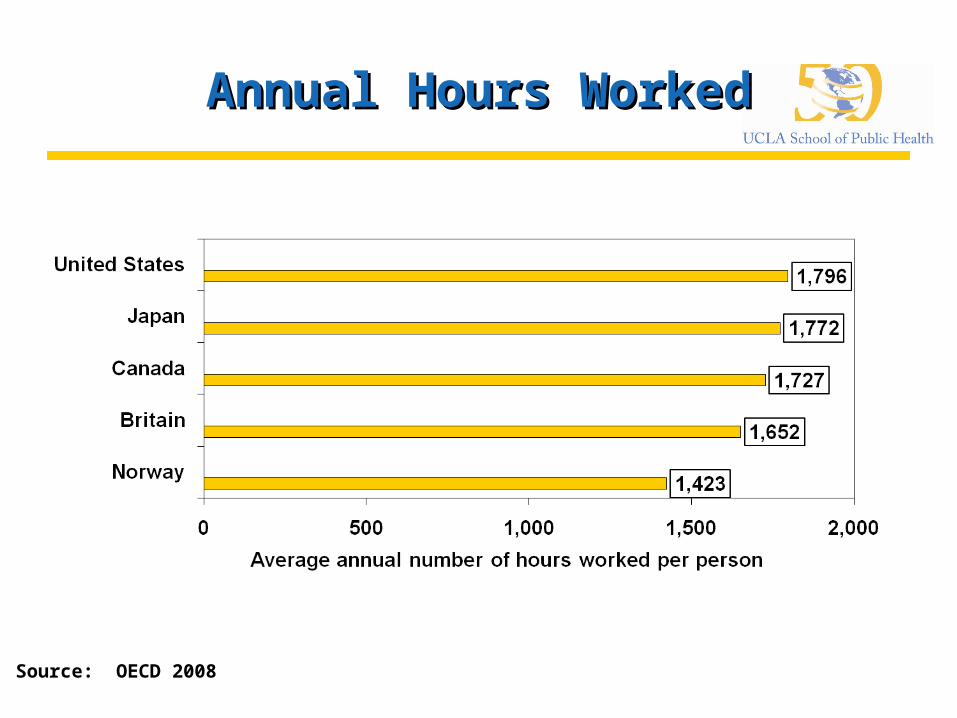
Annual Hours WorkedAnnual Hours Worked
Source: OECD 2008
Changing Nature of Work:Increased Stress
Three-fourths of employees believe the worker has more on-the-job stress than a generation ago
Work Organization/Stress - Severity of the Problem
No good surveillance systems and few studies in the U.S.
Estimated 13% of U.S. worker compensation claims are for stress-related disorders
27% of U.S. workers reported jobs are greatest single source of stress
60% sampled women workers cited job stress as biggest problem at work

Health Care Industry
Health care workers = 8% of U.S. workforce
1996-2006: among fastest growing industries (health services and health practitioners’ offices)
Health care services are growing at twice the rate of the overall economy
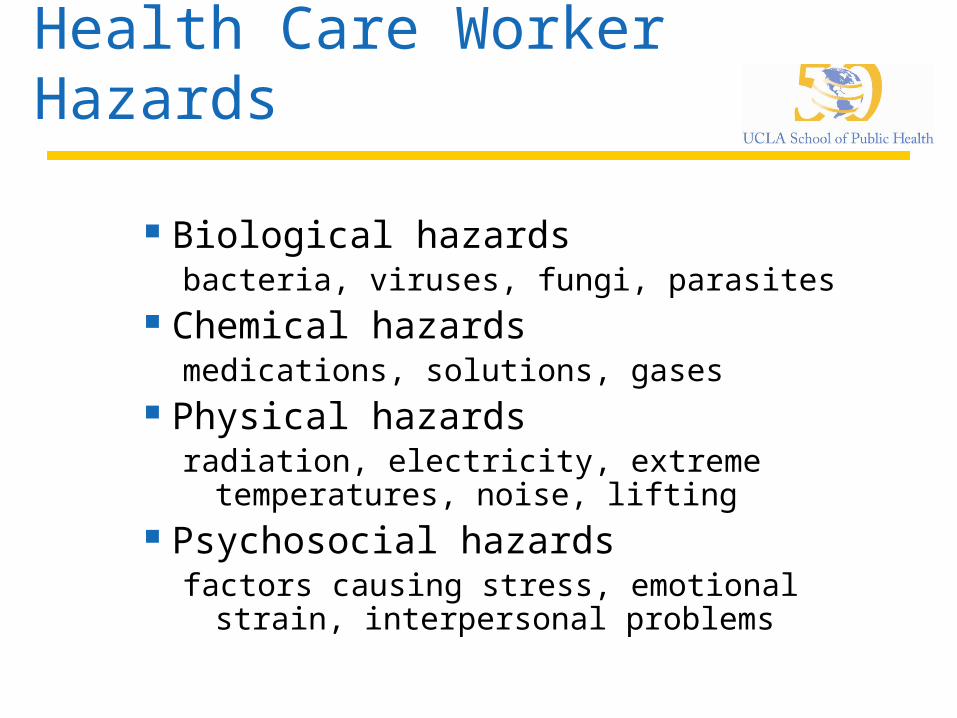
Health Care Worker Hazards
Biological hazardsbacteria, viruses, fungi, parasites
Chemical hazardsmedications, solutions, gases
Physical hazardsradiation, electricity, extreme temperatures,
noise, lifting Psychosocial hazards
factors causing stress, emotional strain, interpersonal problems
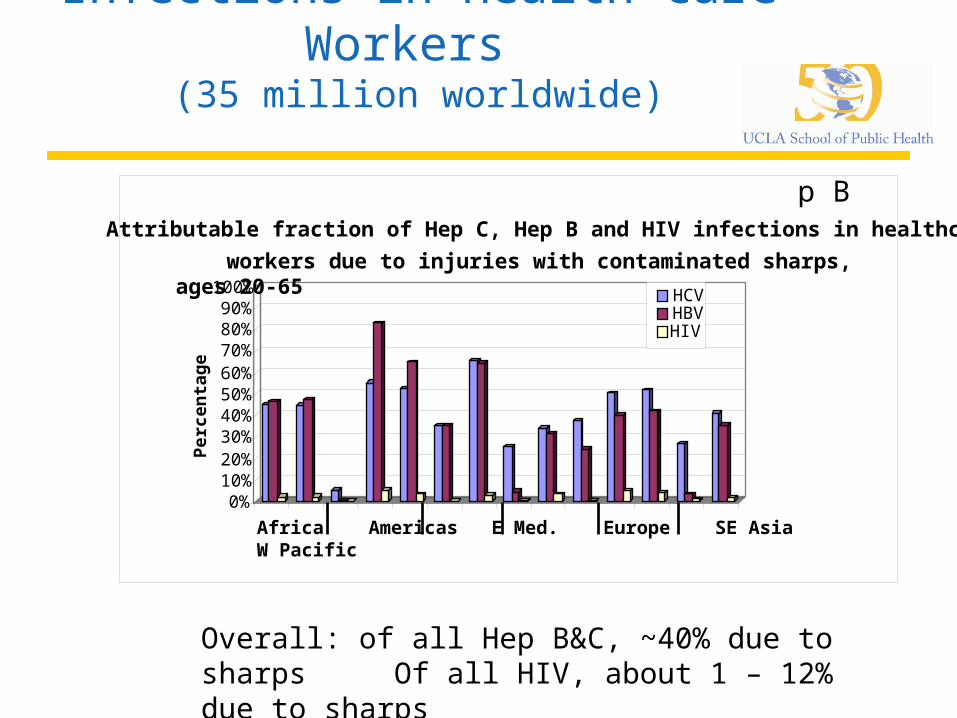
Infections in Health Care Workers
(35 million worldwide)
Attributable fraction of Hep C, Hep B and HIV infections in health care workers due to injuries with sharps, ages 20-65
Overall: of all Hep B&C, ~40% due to sharps Of all HIV, about 1 – 12% due to sharps
0%10%20%30%40%50%60%70%80%90%
100%
Per
cen
tag
e
Attributable fraction of Hep C, Hep B and HIV infections in healthcare
workers due to injuries with contaminated sharps, ages 20-65
HCVHBVHIV
Africa Americas E Med. Europe SE Asia W Pacific
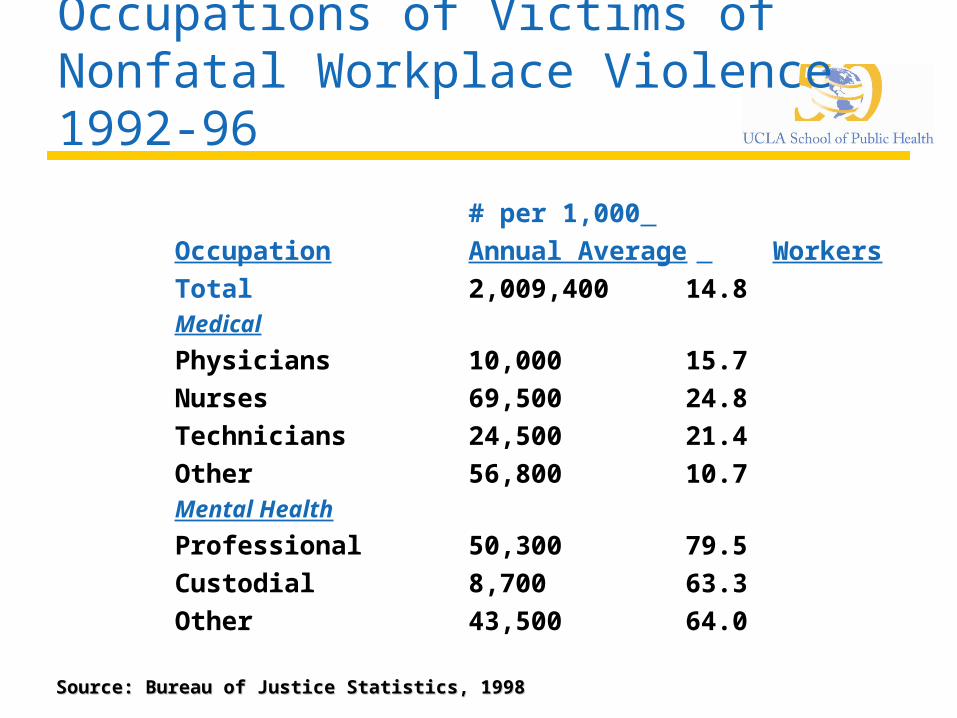
Occupations of Victims of Nonfatal Workplace Violence 1992-96
# per 1,000
Occupation Annual Average Workers
Total 2,009,400 14.8Medical
Physicians 10,000 15.7Nurses 69,500 24.8Technicians 24,500 21.4Other 56,800 10.7Mental Health
Professional 50,300 79.5Custodial 8,700 63.3Other 43,500 64.0Source: Bureau of Justice Statistics, 1998Source: Bureau of Justice Statistics, 1998
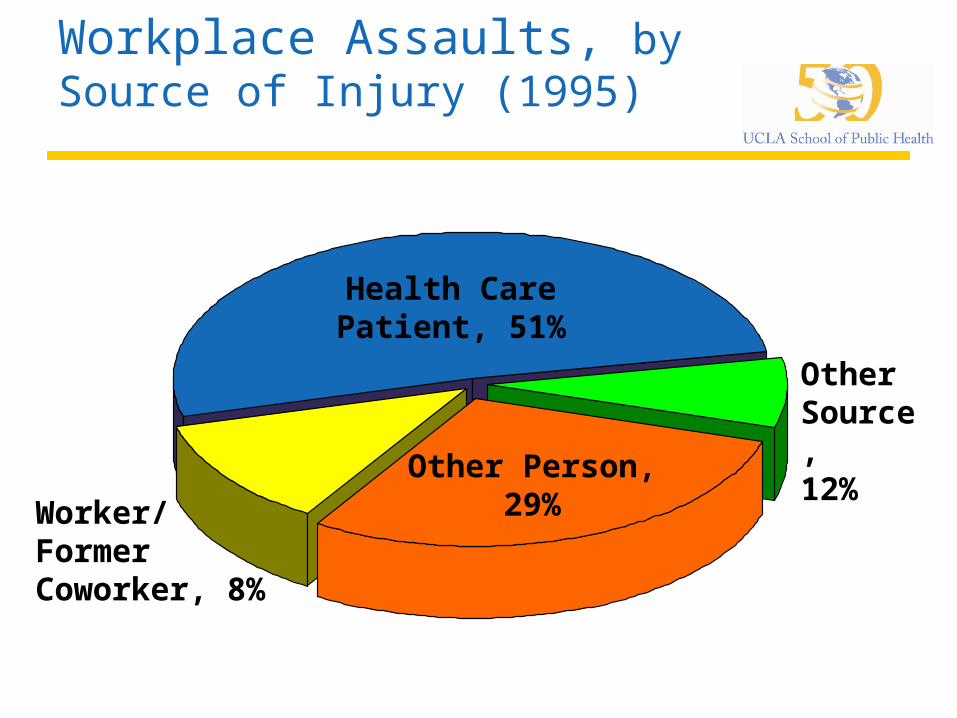
BLS Data on Nonfatal Workplace Assaults, by Source of Injury (1995)
Health CarePatient, 51%
OtherSource, 12%Other Person,
29%Worker/Former Coworker, 8%
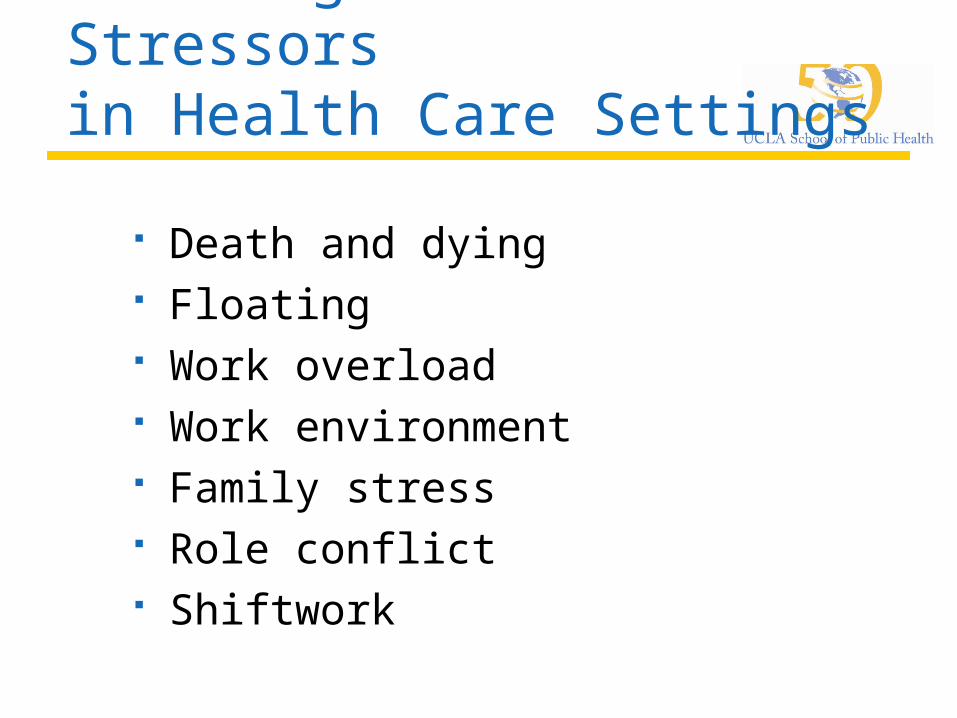
Work Organization Stressors in Health Care Settings
Death and dying Floating Work overload Work environment Family stress Role conflict Shiftwork
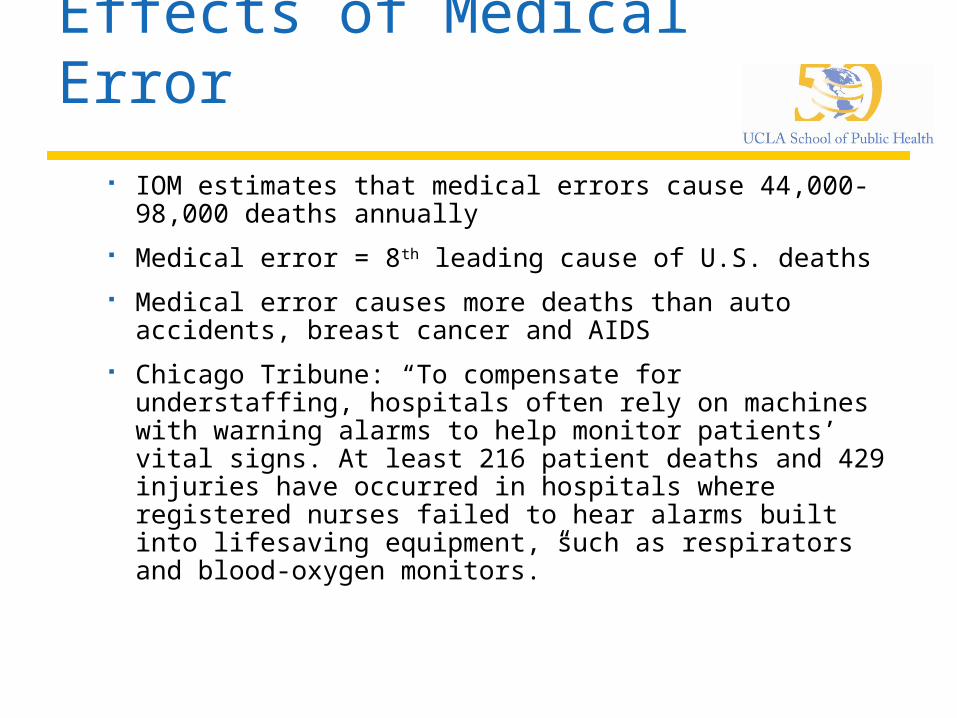
Effects of Medical Error
IOM estimates that medical errors cause 44,000-98,000 deaths annually
Medical error = 8th leading cause of U.S. deaths
Medical error causes more deaths than auto accidents, breast cancer and AIDS
Chicago Tribune: “To compensate for understaffing, hospitals often rely on machines with warning alarms to help monitor patients’ vital signs. At least 216 patient deaths and 429 injuries have occurred in hospitals where registered nurses failed to hear alarms built into lifesaving equipment, such as respirators and blood-oxygen monitors.”
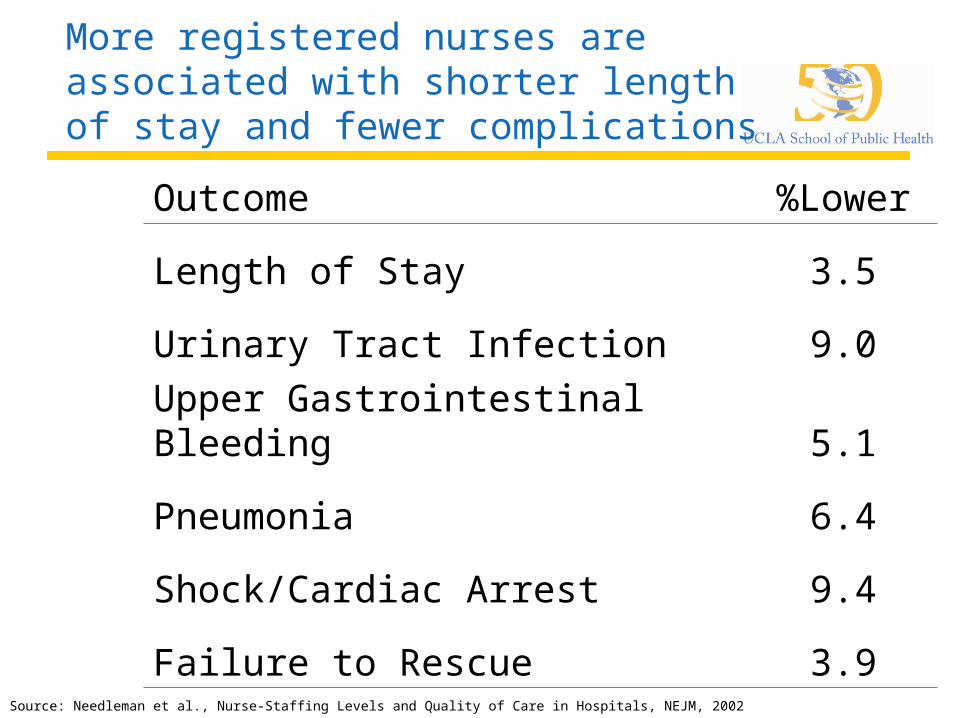
More registered nurses are associated with shorter length of stay and fewer complications
Outcome %Lower
Length of Stay 3.5
Urinary Tract Infection 9.0
Upper Gastrointestinal Bleeding 5.1
Pneumonia 6.4
Shock/Cardiac Arrest 9.4
Failure to Rescue 3.9Source: Needleman et al., Nurse-Staffing Levels and Quality of Care in Hospitals, NEJM, 2002
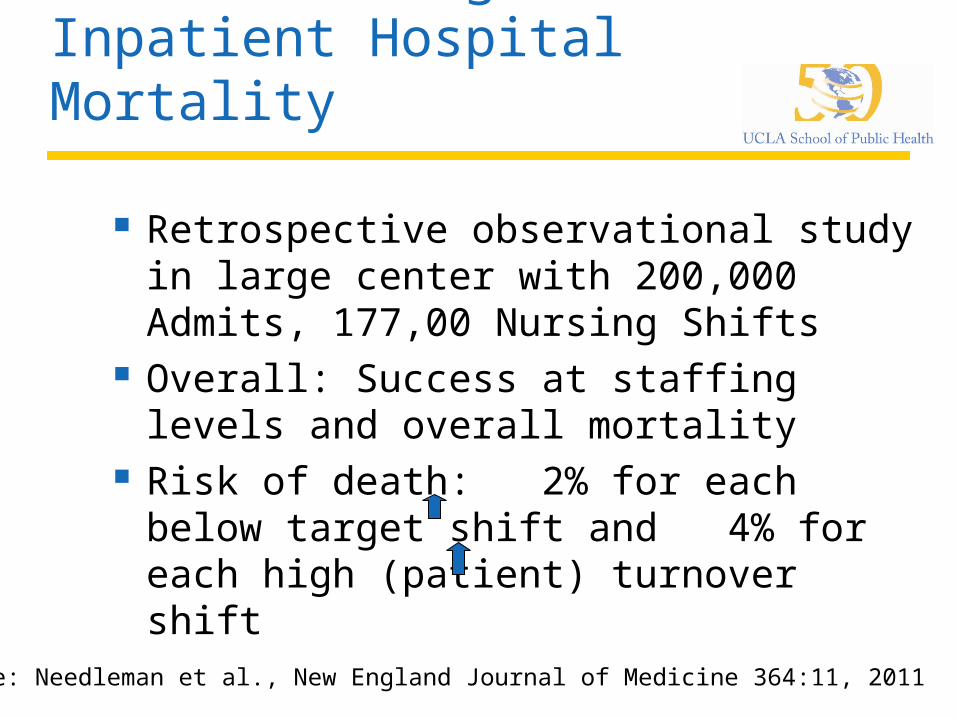
Nurse Staffing and Inpatient Hospital Mortality
Retrospective observational study in large center with 200,000 Admits, 177,00 Nursing Shifts
Overall: Success at staffing levels and overall mortality
Risk of death: 2% for each below target shift and 4% for each high (patient) turnover shift
Source: Needleman et al., New England Journal of Medicine 364:11, 2011
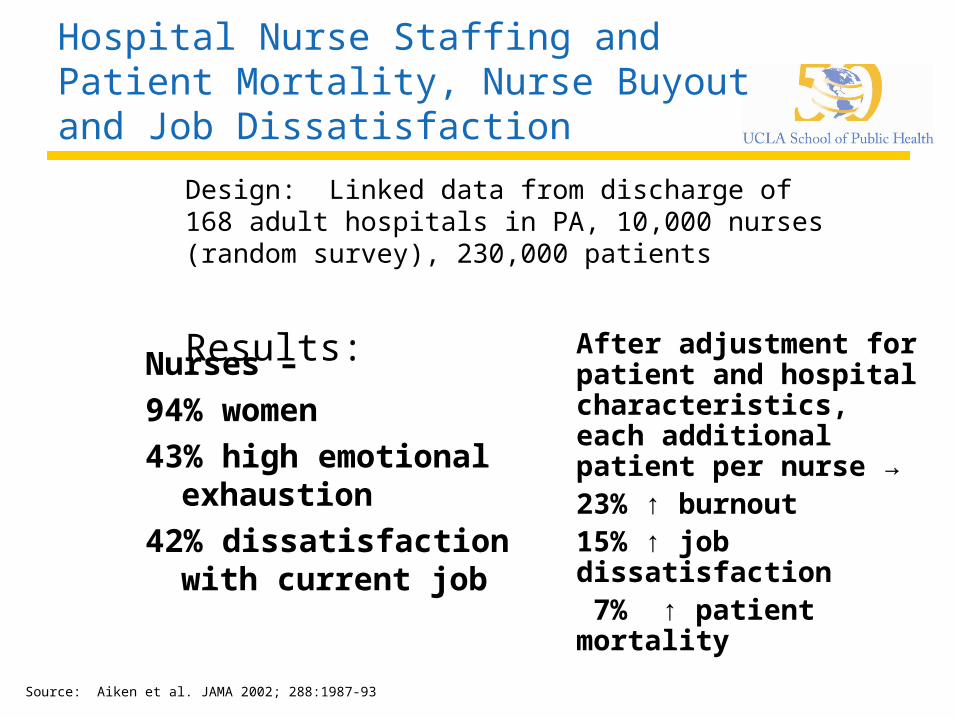
Hospital Nurse Staffing and Patient Mortality, Nurse Buyout and Job Dissatisfaction
Nurses –
94% women
43% high emotional exhaustion
42% dissatisfaction with current job
After adjustment for patient and hospital characteristics, each additional patient per nurse →23% ↑ burnout15% ↑ job dissatisfaction 7% ↑ patient mortality
Design: Linked data from discharge of 168 adult hospitals in PA, 10,000 nurses (random survey), 230,000 patients
Results:
Source: Aiken et al. JAMA 2002; 288:1987-93
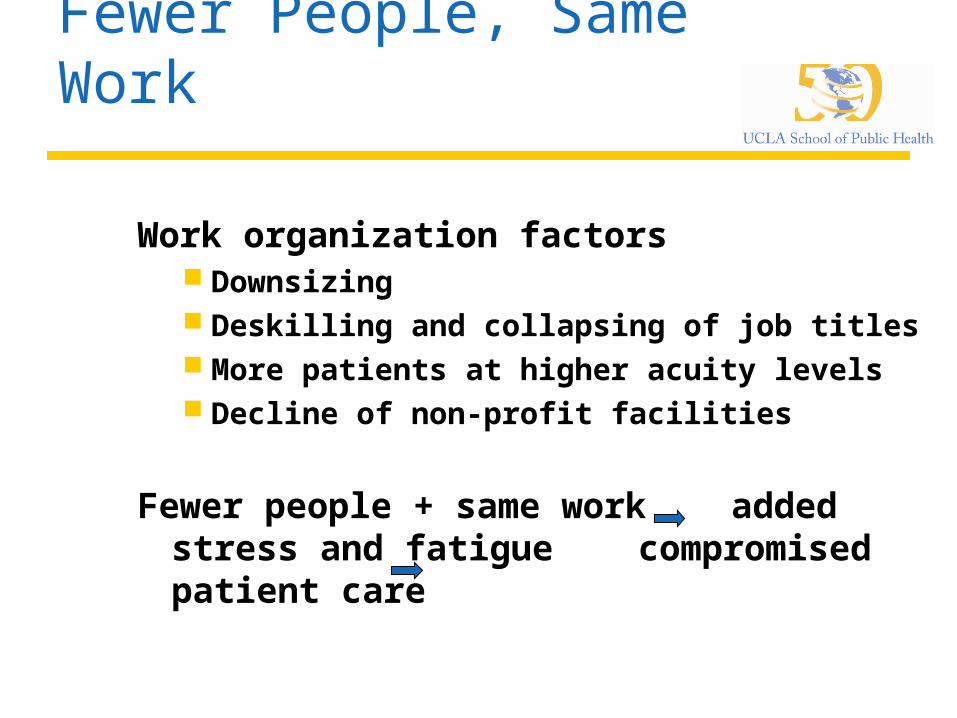
Fewer People, Same Work
Work organization factors Downsizing Deskilling and collapsing of job titles More patients at higher acuity levels Decline of non-profit facilities
Fewer people + same work added stress and fatigue compromised patient care

Improving Worker Health
and Safety Leads To:
Improved health status
Decreased health care/related costs
Increased productivity Increased quality

THE US WORKFORCE 2010
Size of workforce: 150 millionUnionized: 12%Unemployed: 9.5%Effectively Unemployed 17%
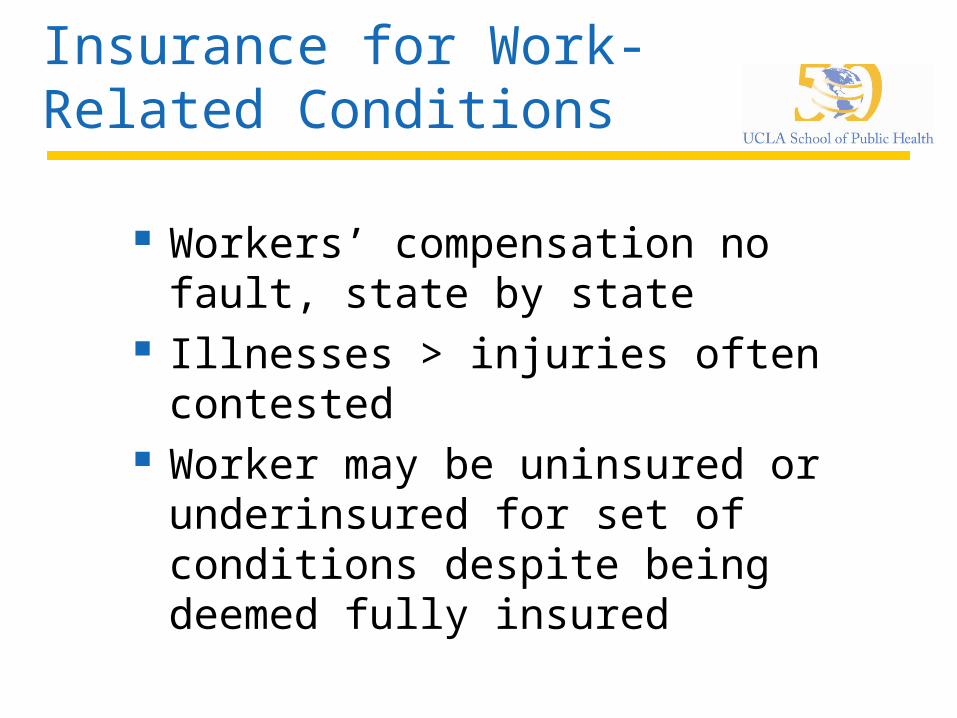
Insurance for Work-Related Conditions
Workers’ compensation no fault, state by state
Illnesses > injuries often contested Worker may be uninsured or
underinsured for set of conditions despite being deemed fully insured

U.S. Health System:You Don’t Get What You Pay For
Highly fragmented at all levels Most expensive (16.3% of gross
domestic product) One of least accessible (50 million
uninsured, more underinsured) U.S. pays for half of all personal
health care (e.g., Medicare/Medicaid, DOD, VA, federal worker insurance)

Employer-Sponsored Health Insurance
Source: US Census Bureau/Kaiser Family Foundation
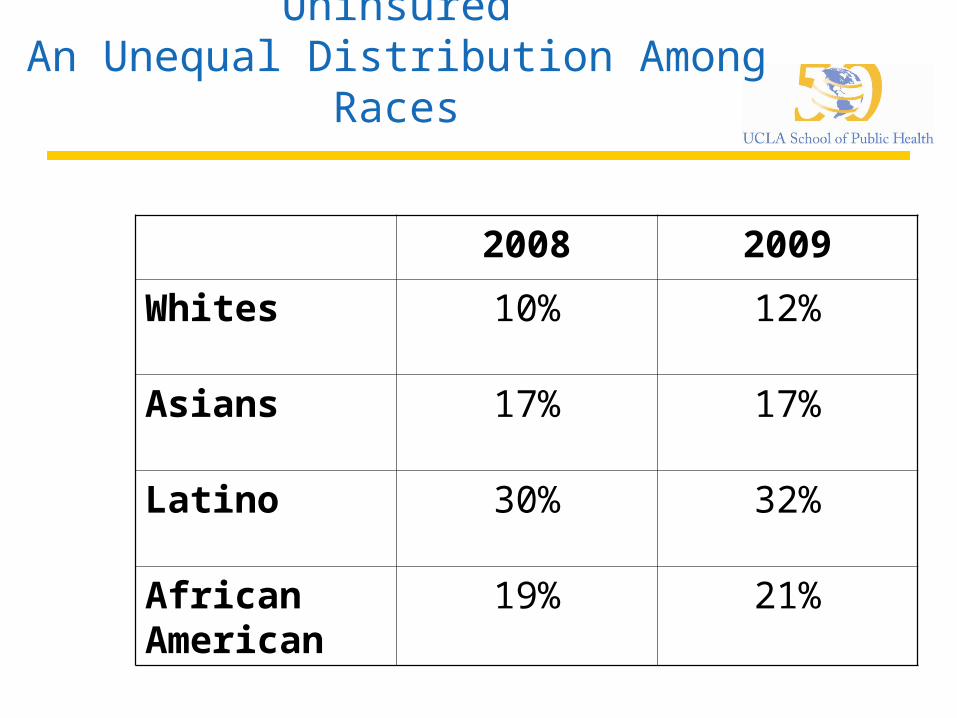
UninsuredAn Unequal Distribution Among
Races
2008 2009
Whites 10% 12%
Asians 17% 17%
Latino 30% 32%
African American
19% 21%

2000 - 2008
Worker productivity (2000-2007)
20% Real income working, middle-class
households ( $2,000) 3%
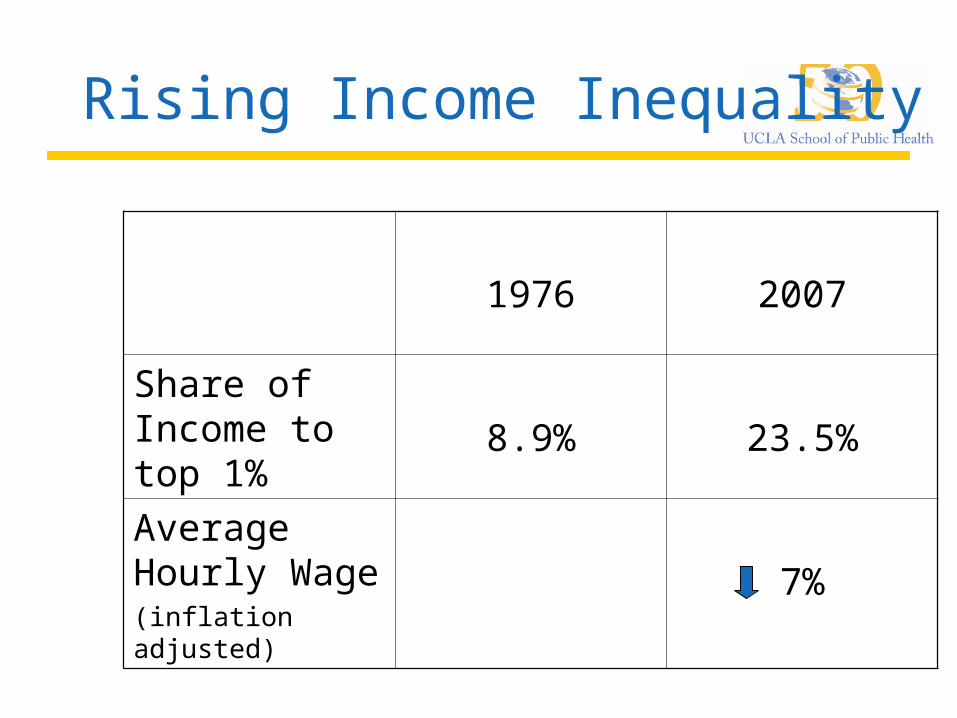
Rising Income Inequality
1976 2007
Share of Income to top 1%
8.9% 23.5%
Average Hourly Wage(inflation adjusted)
7%
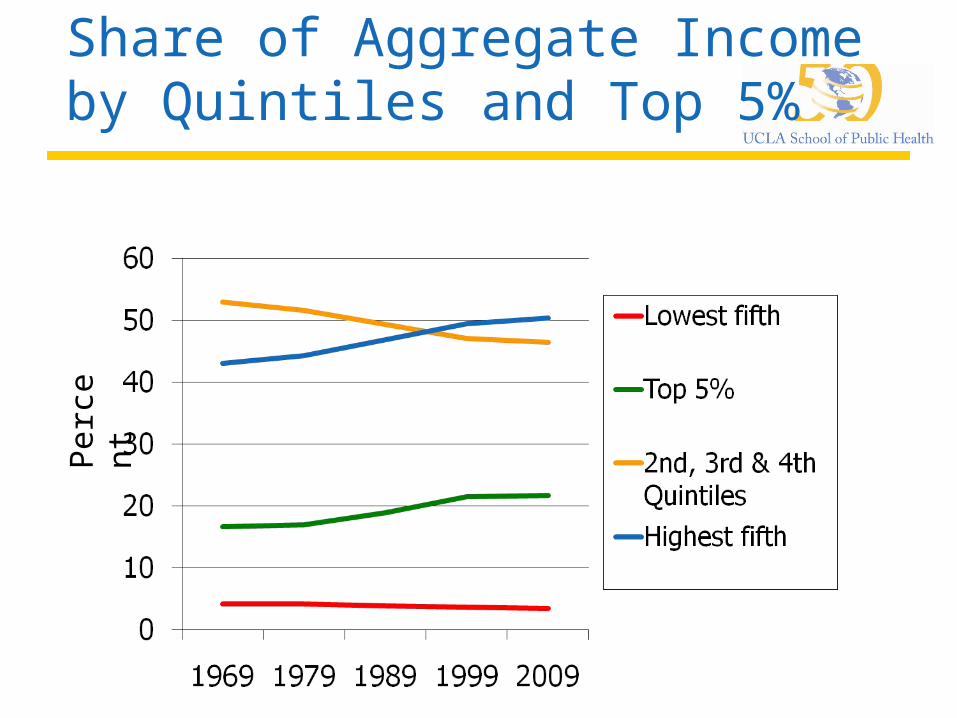
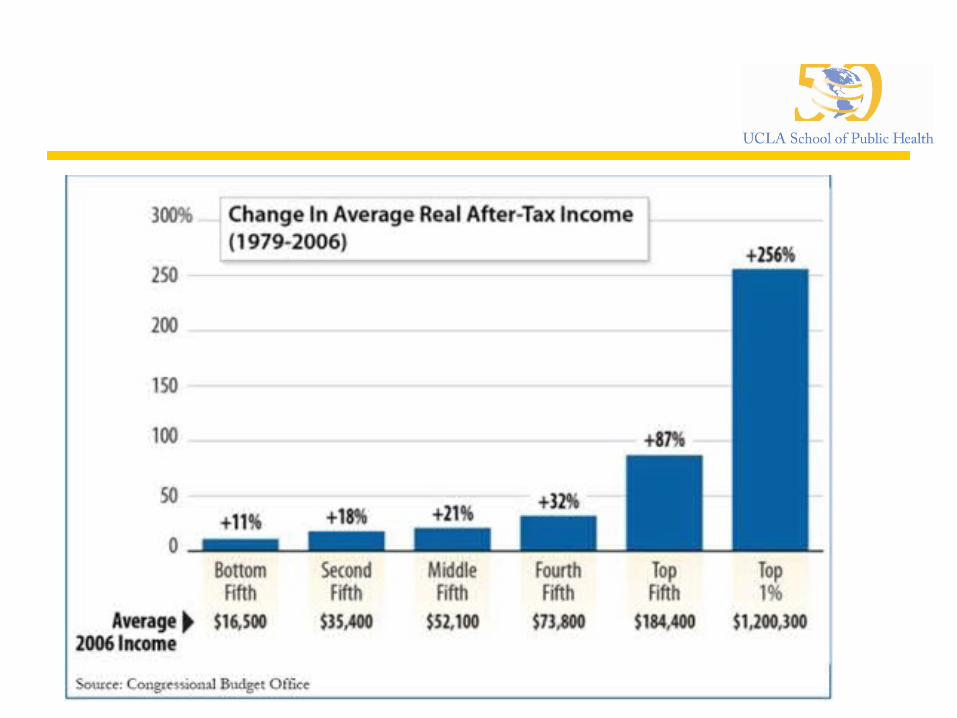
Share of Aggregate Income by Quintiles and Top 5%
Perc
en
t
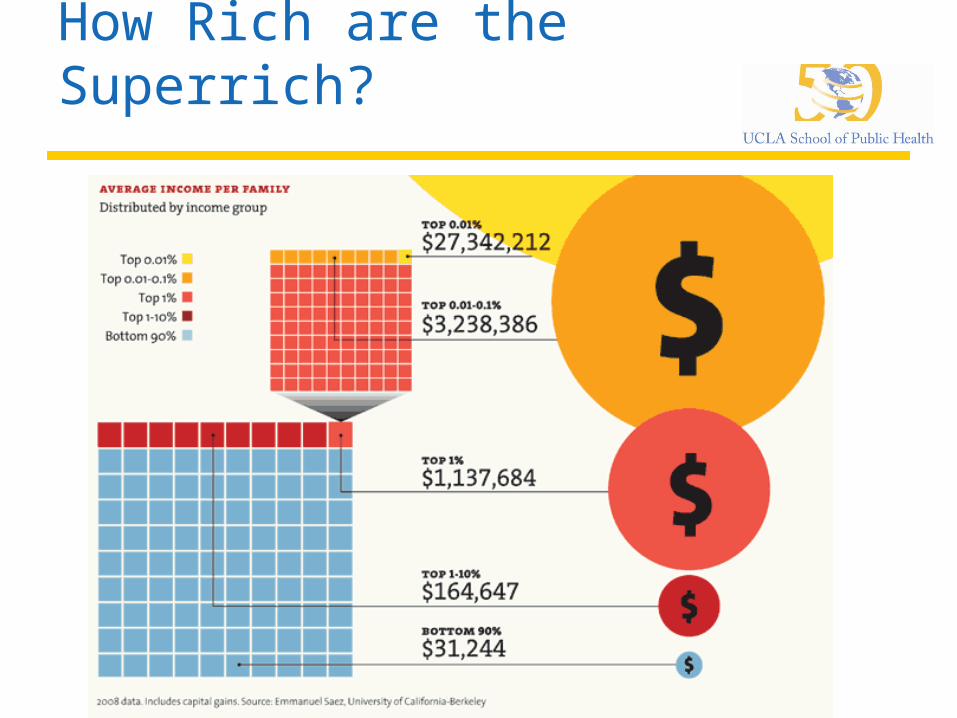
How Rich are the Superrich?
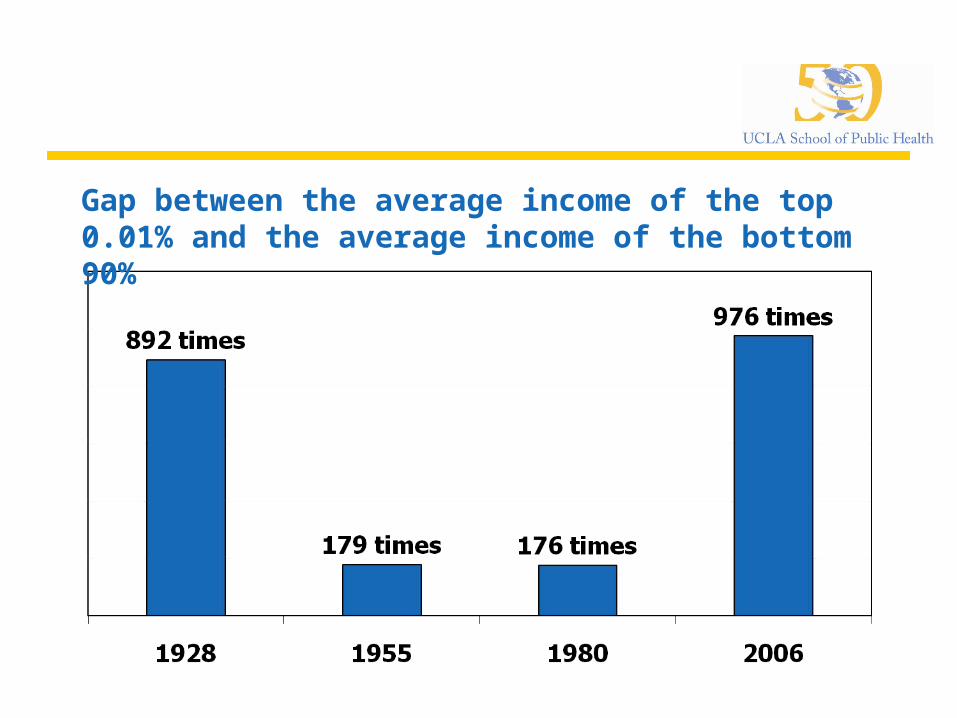
Gap between the average income of the top 0.01% and the average income of the bottom 90%
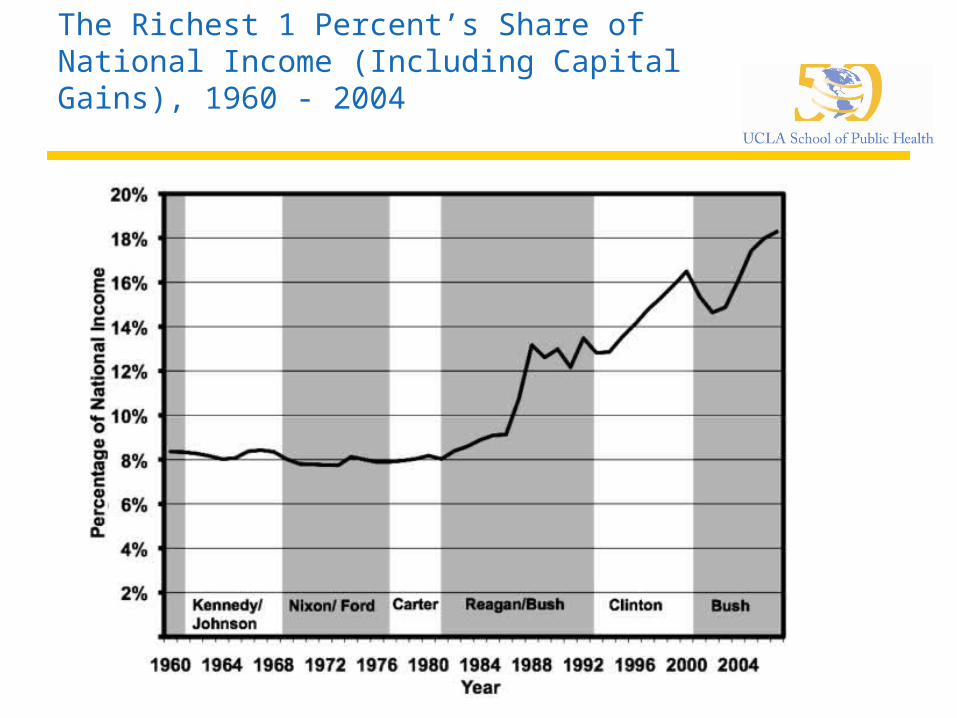
The Richest 1 Percent’s Share of National Income (Including Capital Gains), 1960 - 2004
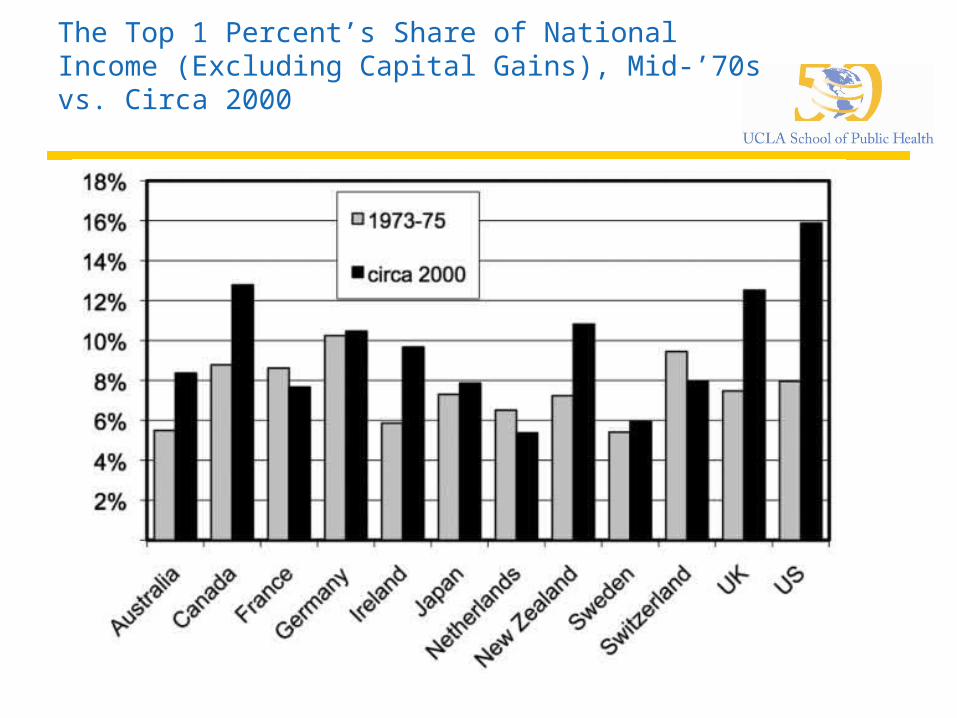
The Top 1 Percent’s Share of National Income (Excluding Capital Gains), Mid-’70s vs. Circa 2000
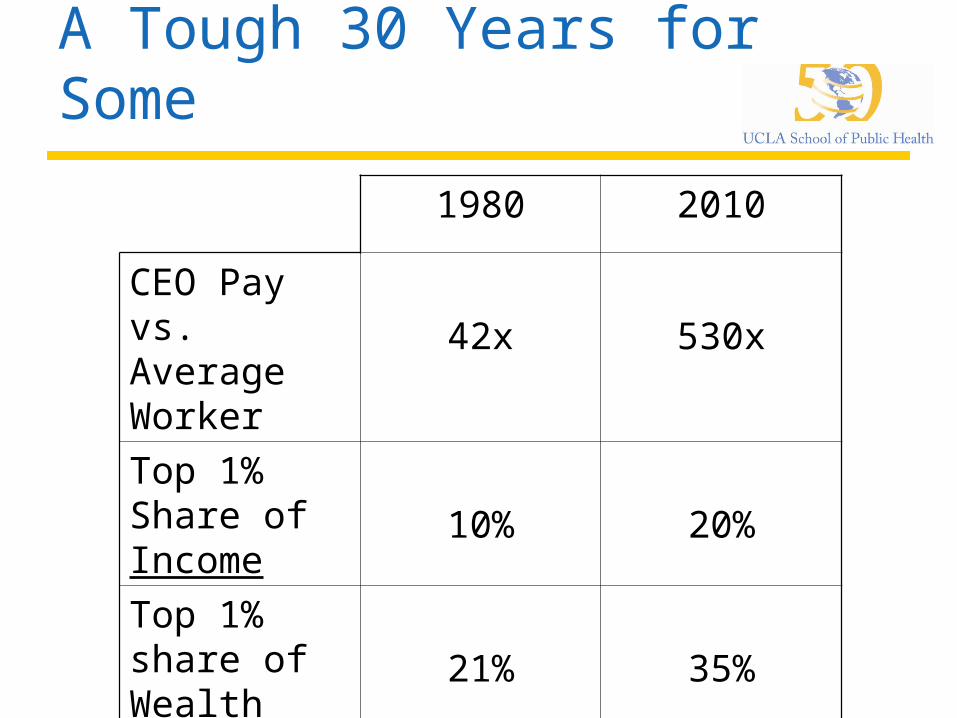
A Tough 30 Years for Some
1980 2010
CEO Pay vs. Average Worker
42x 530x
Top 1% Share of Income
10% 20%
Top 1% share of Wealth
21% 35%
The More Wealth Concentrates
The slower the economy growsThe more corrupt politics becomeThe less leisure timeThe less generous the social safety netThe more children in povertyThe more environmental degradationThe less healthy the workplaceThe lower the voter turnout
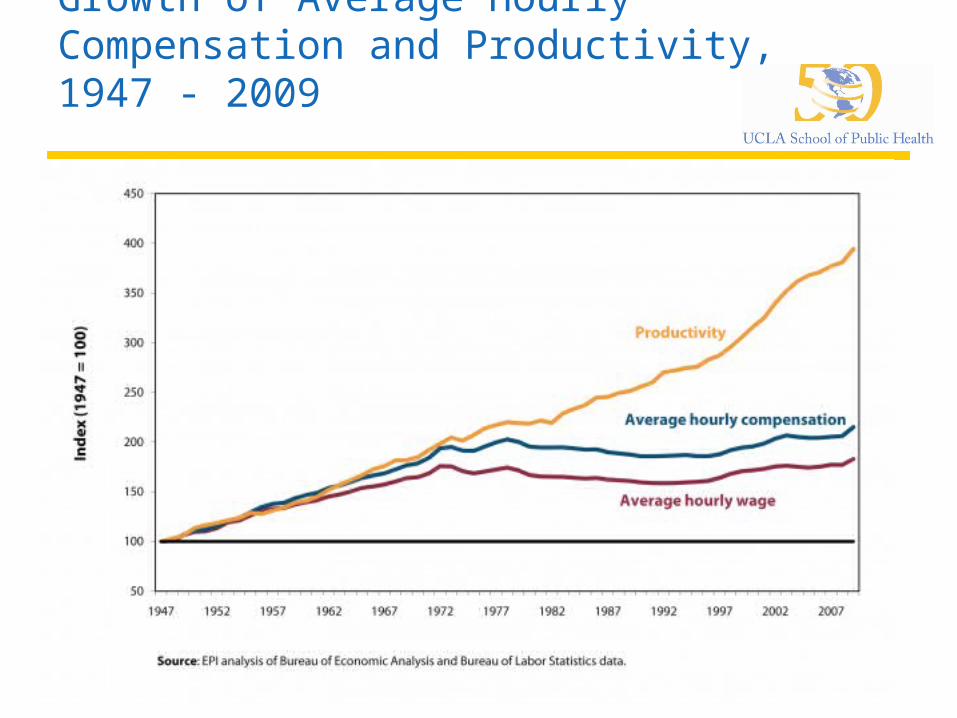
Growth of Average Hourly Compensation and Productivity, 1947 - 2009
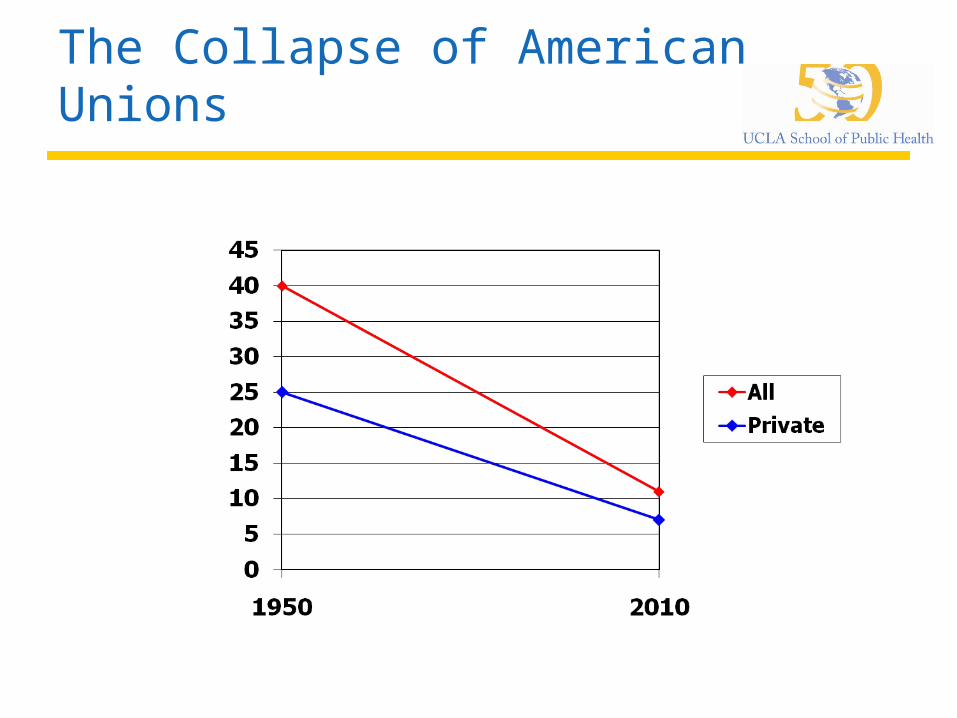
The Collapse of American Unions
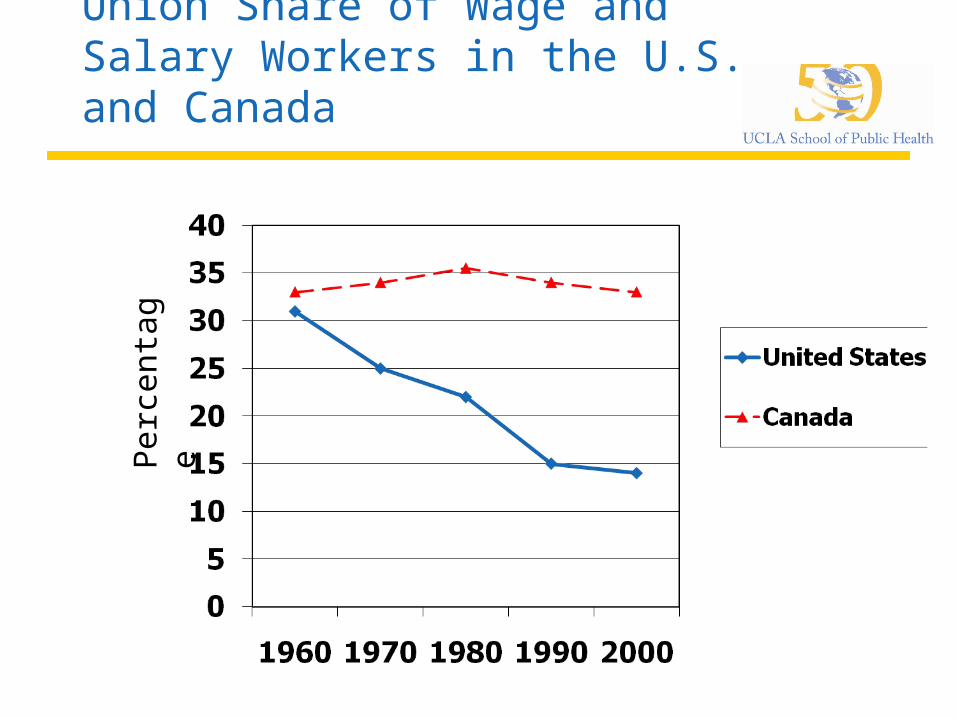
Union Share of Wage and Salary Workers in the U.S. and Canada
Perc
en
tag
e
Why Declining Unionization Matters
Wages and benefits more equal when unions operate, especially for less educated Blunt erosion of wages due to health insurance Protect attacks on pensions
Labor is only major force focused on broad economic concerns of those with modest means
Major force for worker health and safety One of few forces challenging unfettered clout
of financial sector and top executives VOTE MORE

Average Annual Worker and Employer Contributions to Premiums and Total Premiums for Family Coverage, 1999-2010
* Estimate is statistically different from estimate for the previous year shown (p<.05).
Source: Kaiser/HRET Survey of Employer-Sponsored Health Benefits, 1999-2010.
$5,791
$6,438*
$7,061*
$8,003*
$9,068*
$9,950*
$10,880*
$11,480*
$12,106*
$12,680*
$13,375*
$13,770*
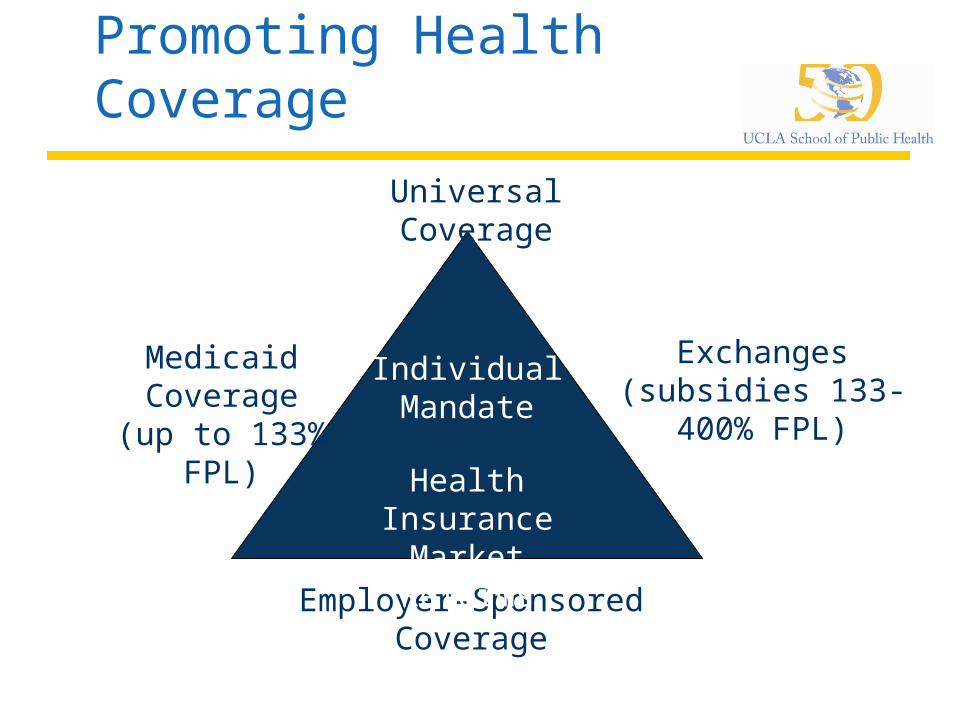
Promoting Health Coverage
Medicaid Coverage
(up to 133% FPL)
Employer-Sponsored Coverage
Exchanges(subsidies 133-
400% FPL)
IndividualMandate
Health Insurance
Market Reforms
Universal Coverage
Figure 3
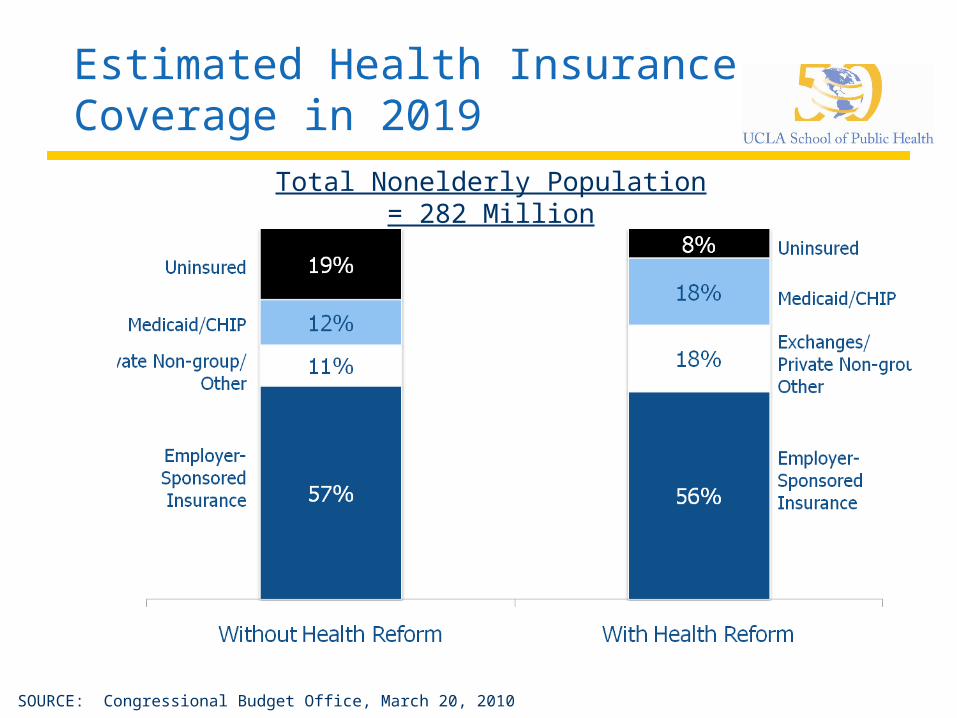
Estimated Health Insurance Coverage in 2019
SOURCE: Congressional Budget Office, March 20, 2010
Total Nonelderly Population = 282 Million
Figure 6
Health Reform and Delivery System Changes
Promoting primary care and prevention
Improving provider supply
Developing new models for coordinating and delivering care
Making use of information technology
Reforming provider payments to promote quality
Figure 11