Occupational employment in the not-for-profit sector
33
Monthly Labor Review • November 2008 11 Not-For-Profit Sector Zack Warren O ver the last few years, not-for-profit employment has expanded rapidly. Employment in not-for-profit es- tablishments increased by over 5 percent in 2 years between 2002 and 2004; 1 over the same period, total private employment in- creased by less than 1 percent. 2 Likewise, the number of not-for-profit establishments has increased by more than 36 percent in the last 10 years. 3 is rapid employment growth, combined with the unique nature of not-for-profit activities, has generated sig- nificant interest in employment patterns of not-for-profit establishments. Although there are a fair number of sta- tistics relating to the number and type of not-for-profit establishments in the United States, there are surprisingly few employ- ment and wage data on the people who work in this sector. Among the most comprehen- sive analyses of not-for-profit employment was a study by Lester M. Salamon and S. Wojciech Sokolowski, who detailed the size and urban nature of not-for-profit work and described not-for-profit employment by industry. 4 is article seeks to further their analysis by identifying the kinds of jobs found in the not-for-profit sector, as well as by comparing the wages of those work- ing for not-for-profits with the wages of those working in for-profit establishments. It also examines differences in occupational staffing patterns between for-profit and not- for-profit establishments within the same industry. is is accomplished by combining data from the 2006 Occupational Employ- ment Statistics (OES) survey of the Bureau of Labor Statistics with tax-exempt-status information from the Internal Revenue Service’s Business Master File of the Statis- tics of Income program. 5 For the purposes of this article, a not-for- profit establishment is defined as one with 501(c) tax-exemption status. Not-for-profit organizations include “corporations, and any community chest, fund, or foundation, orga- nized and operated exclusively for religious, charitable, scientific, testing for public safety, literary, or educational purposes…no part of the net wages of which inures to the benefit of any private shareholder or individual.” Not-for-profit establishments also consist of some labor and agricultural organizations, business leagues, clubs and fraternal organi- zations, employee benefit organizations, and credit unions. 6 In order to maintain not-for- profit status, not-for-profit establishments must not contribute to political campaigns. As the aforementioned definition shows, the not-for-profit sector consists of much more than interest groups and charities. Al- though the 501(c) status does not encom- pass all not-for-profit work, it does cover a broad range of activities. e definition of not-for-profit employment based on 501(c) status excludes government workers; in this article, occupational employment and wage data for government workers are presented alongside the private for-profit and private not-for-profit establishments in industries where government employment is signifi- cant. When cross-industry government es- timates are included, they comprise State-, local-, and Federal-level data. Industry-spe- cific government estimates are for State and local government only. Occupational employment in the not-for-profit sector e for-profit and not-for-profit sectors differ in regards to the industries with the most employees and the types of jobs that employees most commonly hold; the average wage of each sector is similar, but in a given occupation, the profit sector is generally more highly remunerative Zack Warren is an economist in the Occu- pational Employment Statistics program, Bureau of Labor Sta- tistics. E-mail: warren. [email protected]
Transcript of Occupational employment in the not-for-profit sector

Monthly Labor Review • November 2008 11
Not-For-Profit Sector
Zack Warren
Over the last few years, not-for-profit employment has expanded rapidly. Employment in not-for-profit es-
tablishments increased by over 5 percent in 2 years between 2002 and 2004;1 over the same period, total private employment in-creased by less than 1 percent.2 Likewise, the number of not-for-profit establishments has increased by more than 36 percent in the last 10 years.3 This rapid employment growth, combined with the unique nature of not-for-profit activities, has generated sig-nificant interest in employment patterns of not-for-profit establishments.
Although there are a fair number of sta-tistics relating to the number and type of not-for-profit establishments in the United States, there are surprisingly few employ-ment and wage data on the people who work in this sector. Among the most comprehen-sive analyses of not-for-profit employment was a study by Lester M. Salamon and S. Wojciech Sokolowski, who detailed the size and urban nature of not-for-profit work and described not-for-profit employment by industry.4 This article seeks to further their analysis by identifying the kinds of jobs found in the not-for-profit sector, as well as by comparing the wages of those work-ing for not-for-profits with the wages of those working in for-profit establishments. It also examines differences in occupational staffing patterns between for-profit and not-for-profit establishments within the same industry. This is accomplished by combining data from the 2006 Occupational Employ-ment Statistics (OES) survey of the Bureau of Labor Statistics with tax-exempt-status
information from the Internal Revenue Service’s Business Master File of the Statis-tics of Income program.5
For the purposes of this article, a not-for-profit establishment is defined as one with 501(c) tax-exemption status. Not-for-profit organizations include “corporations, and any community chest, fund, or foundation, orga-nized and operated exclusively for religious, charitable, scientific, testing for public safety, literary, or educational purposes…no part of the net wages of which inures to the benefit of any private shareholder or individual.” Not-for-profit establishments also consist of some labor and agricultural organizations, business leagues, clubs and fraternal organi-zations, employee benefit organizations, and credit unions.6 In order to maintain not-for-profit status, not-for-profit establishments must not contribute to political campaigns.
As the aforementioned definition shows, the not-for-profit sector consists of much more than interest groups and charities. Al-though the 501(c) status does not encom-pass all not-for-profit work, it does cover a broad range of activities. The definition of not-for-profit employment based on 501(c) status excludes government workers; in this article, occupational employment and wage data for government workers are presented alongside the private for-profit and private not-for-profit establishments in industries where government employment is signifi-cant. When cross-industry government es-timates are included, they comprise State-, local-, and Federal-level data. Industry-spe-cific government estimates are for State and local government only.
Occupational employment in the not-for-profit sectorThe for-profit and not-for-profit sectors differ in regards to the industrieswith the most employees and the types of jobs that employees mostcommonly hold; the average wage of each sector is similar, but in a givenoccupation, the profit sector is generally more highly remunerative
Zack Warren is an economist in the Occu-pational Employment Statistics program, Bureau of Labor Sta-tistics. E-mail: [email protected]
Not-For-Profit Sector
12 Monthly Labor Review • November 2008
Description of the data set
The OES program surveys 1.2 million business establish-ments in six semiannual collection panels over a period of 3 years. Each establishment is asked to provide occupation and wage information on each of its workers. The data are used to create employment and wage estimates for the 801 occupations in the Standard Occupational Classification system; the estimates are for the Nation, States, all metro-politan and nonmetropolitan areas, and almost 400 indus-tries defined according to the North American Industry Classification System (NAICS). The sample is stratified and weighted by the establishments’ 4- or 5-digit NAICS industry, by State or territory (including Puerto Rico, the Virgin Islands and Guam), by metropolitan or nonmet-ropolitan area, and by size. Because the OES survey does not ask whether establishments are for profit or not for profit, the original OES sample weights, which represent individual establishments’ probability of selection, are not adjusted for profit-status.
The estimates presented in this article were created by pairing 2006 survey year OES establishment records with the 501(c)-firm master list from the IRS Business Master
File. Records were linked on the basis of the Employer Identification Number (EIN), which is an identifier as-signed by the IRS to all employers that file taxes. In this article, it is assumed that all establishments under a tax-exempt EIN are tax exempt, because EINs are firm spe-cific and not establishment specific. This methodology produced a sample of approximately 80,000 OES units identified as tax exempt, out of the total OES sample of 1.2 million establishments. Although the OES sample does not target not-for-profit establishments specifi-cally, the large size and deep stratification of the sample are sufficient to produce estimates for the not-for-profit sector nationally and for industries with a relatively large percentage of not-for-profit employment. This matching process is similar to, but less robust than, the one used by Salamon and Sokolowski to identify not-for-profit estab-lishments within the Quarterly Census of Employment and Wages.7
Industries in the not-for-profit sector
Overall, not-for-profit employees make up approximately 8 percent of the total weighted employment in the OES
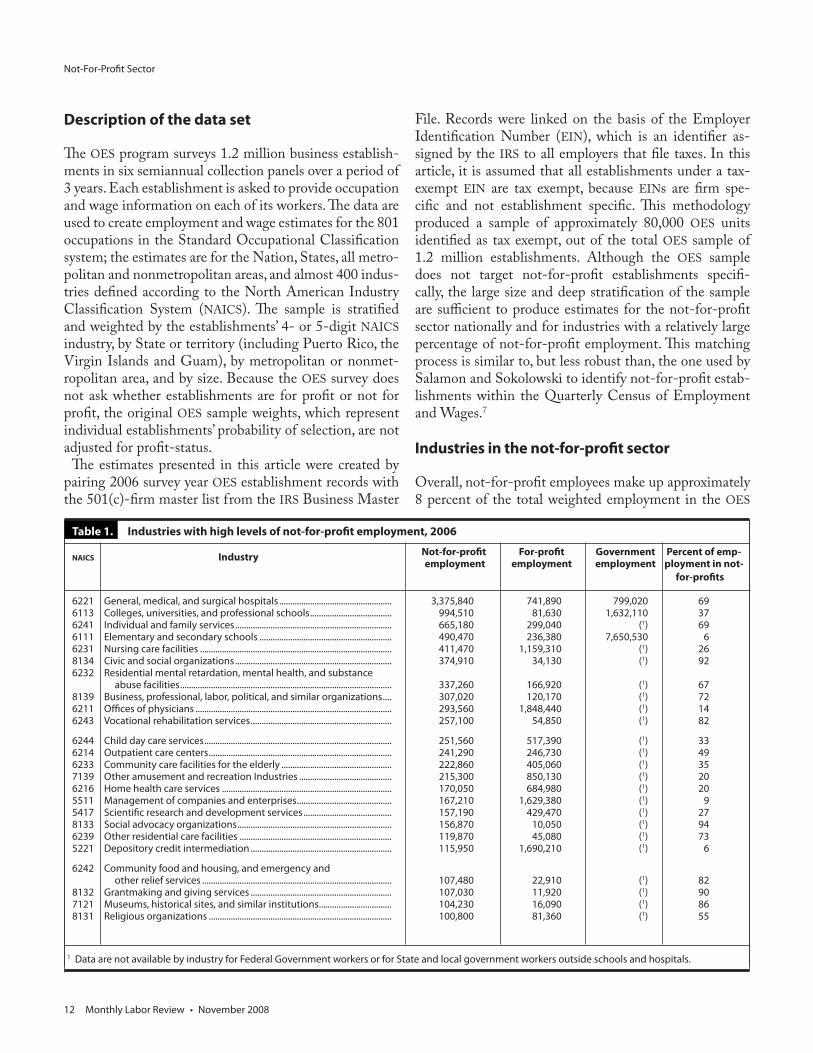
Table 1. Industries with high levels of not-for-profit employment, 2006
NAICS Industry Not-for-profit For-profit Government Percent of emp- employment employment employment ployment in not- for-profits
6221 General, medical, and surgical hospitals ................................................... 3,375,840 741,890 799,020 69 6113 Colleges, universities, and professional schools ..................................... 994,510 81,630 1,632,110 37 6241 Individual and family services ....................................................................... 665,180 299,040 (1) 69 6111 Elementary and secondary schools ............................................................ 490,470 236,380 7,650,530 6 6231 Nursing care facilities ....................................................................................... 411,470 1,159,310 (1) 26 8134 Civic and social organizations ....................................................................... 374,910 34,130 (1) 92 6232 Residential mental retardation, mental health, and substance abuse facilities ................................................................................................ 337,260 166,920 (1) 67 8139 Business, professional, labor, political, and similar organizations .... 307,020 120,170 (1) 72 6211 Offices of physicians ......................................................................................... 293,560 1,848,440 (1) 14 6243 Vocational rehabilitation services ................................................................ 257,100 54,850 (1) 82
6244 Child day care services ..................................................................................... 251,560 517,390 (1) 33 6214 Outpatient care centers ................................................................................... 241,290 246,730 (1) 49 6233 Community care facilities for the elderly .................................................. 222,860 405,060 (1) 35 7139 Other amusement and recreation Industries .......................................... 215,300 850,130 (1) 20 6216 Home health care services ............................................................................. 170,050 684,980 (1) 20 5511 Management of companies and enterprises ........................................... 167,210 1,629,380 (1) 9 5417 Scientific research and development services ........................................ 157,190 429,470 (1) 27 8133 Social advocacy organizations ...................................................................... 156,870 10,050 (1) 94 6239 Other residential care facilities ..................................................................... 119,870 45,080 (1) 73 5221 Depository credit intermediation ................................................................ 115,950 1,690,210 (1) 6
6242 Community food and housing, and emergency and other relief services ...................................................................................... 107,480 22,910 (1) 82 8132 Grantmaking and giving services ................................................................ 107,030 11,920 (1) 90 7121 Museums, historical sites, and similar institutions ................................. 104,230 16,090 (1) 86 8131 Religious organizations ................................................................................... 100,800 81,360 (1) 55
1 Data are not available by industry for Federal Government workers or for State and local government workers outside schools and hospitals.
Monthly Labor Review • November 2008 13
sample, whereas for-profit employment is over 75 percent of the total; the remaining 16 percent of employees are in the public sector. Table 1 shows the 4-digit NAICS indus-tries in the OES sample with the highest levels of not-for-profit employment, as well as the for-profit employment in the same industries. In agreement with previous studies, the table reveals that not-for-profits participate mostly in healthcare, educational, or community support activities.
Occupations in the not-for-profit sector
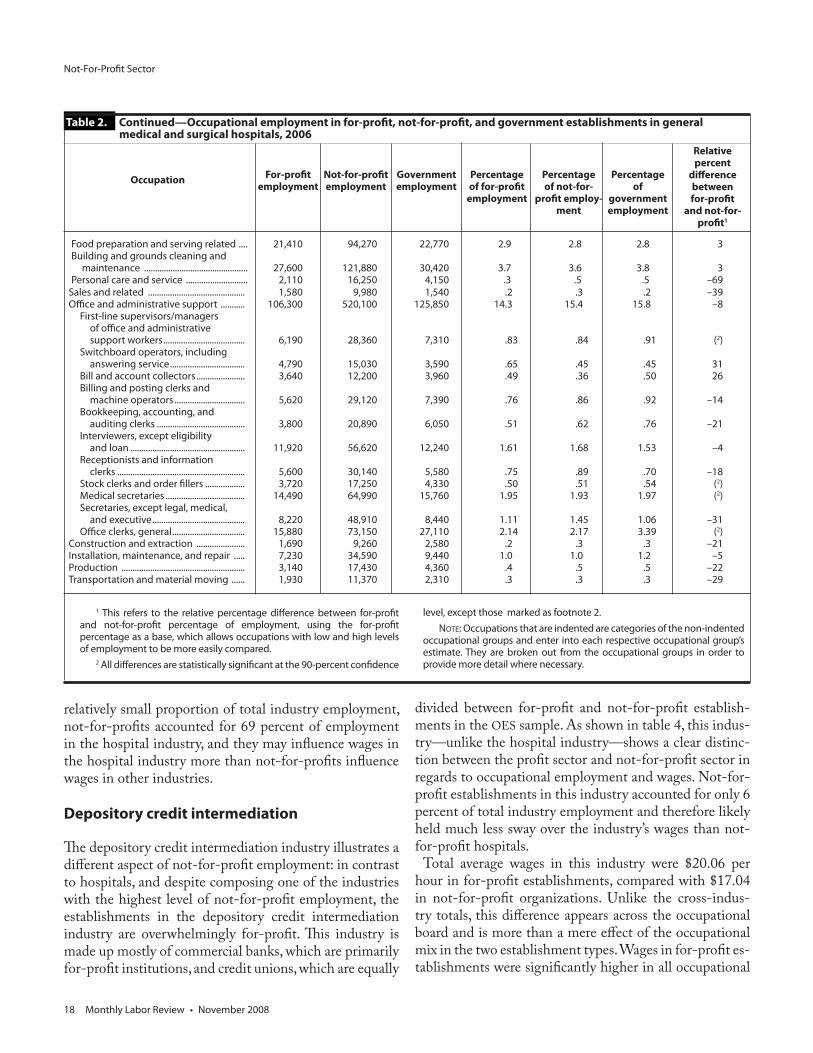
The occupational composition of for-profit, not-for-profit, and government employment is shown in chart 1, with the share of employment in each of the 22 major occupational groups shown along the x-axis. For example, community and social services occupations represent only 0.3 percent of for-profit employment, but this occupational group represents about 7 percent of not-for-profit employment.
The occupational mix of not-for-profits is influenced by the industries in which not-for-profits are concentrated. Compared with for-profit establishments, not-for-profits tend to employ more community and social service work-ers, teachers, healthcare workers, and personal care and service workers. These occupations are concentrated in the healthcare and social assistance industry and the education industry, which have the largest not-for-profit employ-ment. They also employ far smaller shares of sales workers, food service workers, construction and extraction workers, maintenance workers, production workers, and transpor-tation workers, because these occupational categories are more commonly associated with profit-seeking activities: a not-for-profit organization that is not manufacturing or selling a product will understandably require fewer sales and production workers than a for-profit establishment.
Wages in the not-for-profit sector
Across all industries, for-profit employees earned an aver-age hourly wage of $18.13, while not-for-profit employees had a slightly higher average wage of $19.93. Although the total average wages were higher for not-for-profit workers, this was often primarily due to the occupational composition and the relative lack of very low paying oc-cupations in these establishments. It is also possible that the duties performed by people employed in these low-paying occupations are also performed in not-for-profit establishments, but by volunteers instead of paid workers. Because unpaid workers are excluded from the OES sur-vey, their work was not captured by this study.
Chart 2 shows in more detail how occupational mix
contributes to the difference in average wages. Despite the higher average wages in not-for-profit establishments compared with for-profit establishments, not-for-profits paid less for the same type of work: occupation by oc-cupation, for-profit workers had higher average wages than not-for profit workers in 12 of the 22 occupational groups, including most of the higher paying occupational groups with more highly skilled workers. For many of the occupational groups, these wage differences are relatively small;8 however, in the instances where there is a large gap in wages for the same occupational group, the gap gener-ally favors the for-profit workers. Some occupations had higher wages in not-for-profit establishments, including education-related occupations, architecture and engineer-ing occupations, healthcare support workers, food service occupations, and building service occupations. Overall, government workers out-earned both for-profit and not-for-profit workers in production and service occupations, whereas for-profit workers out-earned government work-ers and not-for-profit workers in professional occupa-tions.
In the few major occupational groups where not-for-profit employees earned considerably higher wages than for-profit employees, the comparisons may not be espe-cially meaningful because of the small employment totals or, in the case of education workers, may be somewhat misleading. For example, the construction and extraction and farming, fishing, and forestry occupational groups both show an advantage for not-for-profit employees; however, not-for-profit workers in these groups are ex-tremely rare. Although education workers earned higher wages in not-for-profit establishments, the premium is magnified by differences in the detailed occupational com-position within this group. Education workers are shown to have had higher wages in part because postsecondary teachers, who generally earn more than elementary and secondary school teachers, made up a larger part of not-for-profit employment, and in part because teachers of all types earned more in private not-for-profits than they did in private for-profit establishments, as shown below.
Not-for-profit For-profit Government
Postsecondary ........... $69,581 $53,254 $63,596 Primary and Secondary ................. $37,968 $29,761 $50,117
Salamon and Sokolowski demonstrated that, contrary to the conventional wisdom, workers in educational ser-vices earned higher wages in not-for-profits than in for-profit establishments;9 by examining occupational data

Not-For-Profit Sector
14 Monthly Labor Review • November 2008
Chart 1. Distribution of employment in not-for-profit, for-profit, and government establishments
Percentage of the sector in occupational group1
Occupational group
Management
Business and financial operations
Computer and mathematical
Architecture and engineering
Life, physical, and social science
Community and social services
Legal
Education, training, and library
Arts, design, entertainment, sports, and media
Healthcare practitioners and technical operations
Healthcare support
Food preparation and serving related
Protective service
Building and grounds cleaning and maintenance
Personal care and service
Office and administrative support
Farming, fishing, and forestry
Construction and extraction
Installation, maintenance, and repair
Production
Transportation and material moving
Sales and related
Not-for-profit For-profit Government
0 5 10 15 20 25 30 35
0 5 10 15 20 25 30 35Percentage of the sector in occupational group1
1 This refers to the percentage of the sector (not-for-profit, for-profit, or government) that is represented by the occupational group in question, across all industries. For example, community and social services occupations represents 7 percent of not-for-profit employment.

Monthly Labor Review • November 2008 15
Chart 2. Mean hourly wages in not-for-profit, for-profit, and government establishments
Occupational group
0 5 10 15 20 25 30 35 40 45 50
Hourly wage, in dollars
Not-for-profitFor-profitGovernment
Management
Business and financial operations
Computer and mathematical
Architecture and engineering
Life, physical, and social science
Community and social services
Legal
Education, training, and library
Arts, design, entertainment, sports, and media
Healthcare practitioners and technical
Healthcare support
Food preparation and serving related
Protective service
Building and grounds cleaning and maintenance
Personal care and service
Office and adminstrative support
Farming, fishing, and forestry
Construction and extraction
Installation, maintenance and repair
Production
Transportation and material moving
Sales and related
0 5 10 15 20 25 30 35 40 45 50
Hourly wage, in dollars

Not-For-Profit Sector
16 Monthly Labor Review • November 2008
one can see exactly why. Postsecondary education teachers’ wages were generally lower in the government sector than in not-for-profits, whereas government wages were usu-ally higher for elementary and secondary school teachers than teachers’ wages in both for-profits and not-for-prof-its. Full employment and wage data for all detailed oc-cupations are shown in appendix table A–1 at the end of this article.
Managers and employees in legal occupations had much higher wages in for-profit establishments. This holds true for all detailed management occupations except education administrators and food service managers. The premium for legal occupations is due in part to the much higher wages for lawyers and law clerks in for-profit establish-ments, as well as to the larger share of legal occupation employment that lawyers and law clerks constitute. Man-agers and employees in legal occupations have the highest wage premiums in for-profit establishments in part be-cause, compared with people in other occupations, these two groups have by far the widest range of wages and therefore more room for differentiation compared with low-paying occupations, which feature very narrow wage ranges.
Because an establishment’s industry is a major deter-minant of its occupational composition, comparing for-profit and not-for-profit establishments within the same industry provides the best means of examining the effects of profit status on occupational staffing patterns. The next section examines three industries with high levels of not-for-profit employment: the hospital industry, which is the largest employer of not-for-profit workers; deposi-tory credit intermediation, which has the majority of its employment in for-profits; and social advocacy, which has the majority of its employment in not-for-profits.
General medical and surgical hospitals
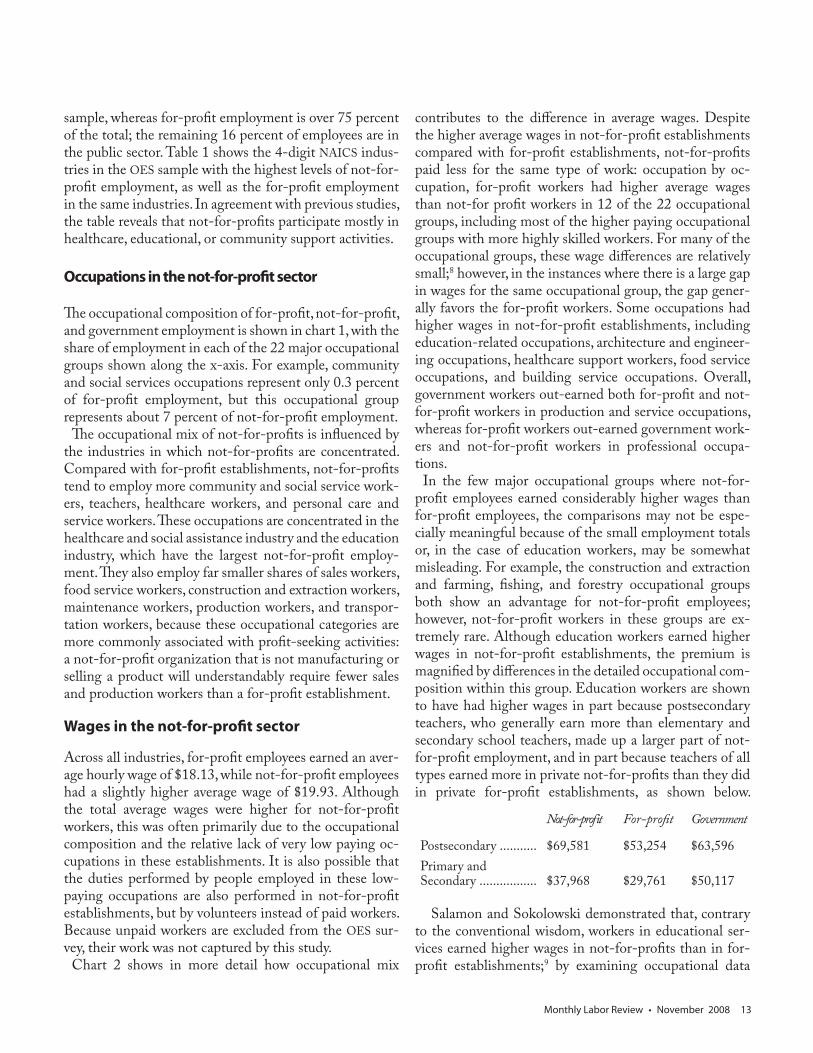
Of the industries shown in table 1, general medical and surgical hospitals had the highest level of not-for-profit employment. “This industry comprises establishments known and licensed as general medical and surgical hospitals primarily engaged in providing diagnostic and medical treatment (both surgical and nonsurgical) to inpatients with any of a wide variety of medical condi-tions.”10 Among the industries examined in this study, the general medical and surgical hospital industry is notable for its lack of differentiation between for-profit and not-for-profit establishments. By most measures other than total employment, the for-profit and not-for-profit sec-tors of this industry are very similar, because each sector
employs relatively the same types of workers, as shown in table 2.
The only two occupational groups with more than a per-centage point difference in employment share are health-care practitioners and technical workers, representing 55 percent of for-profit employment and about 53 percent of not-for-profit employment, and office and administrative support workers, with approximate shares of 15 percent of not-for-profit employment and 14 percent of for-profit employment. Within the healthcare practitioner occupa-tional group, the distribution of employment among the occupations is also very similar. The biggest differences are found in employment shares of physicians and surgeons and the nursing occupations. Physicians and surgeons account for 2.2 percent of employment in not-for-profit hospitals, 1.2 percent in for-profit hospitals, and 2.5 per-cent in State and local government hospitals.
This may in part reflect differences in how the doctors are employed rather than in the number of doctors working at the hospital: private, for-profit hospitals may be more likely to have doctors who are self employed and would not be captured by the OES survey. Private for-profit hospitals employed relatively more registered nurses and licensed practical nurses than private not-for-profit hos-pitals and government hospitals. Not-for-profit hospitals also had about 8 percent more office and administrative support workers. The difference in office and administra-tive support employment is not due to a large difference in any single occupation, but rather to an accumulation of small differences in most occupations between for-profit and not-for-profit hospitals.
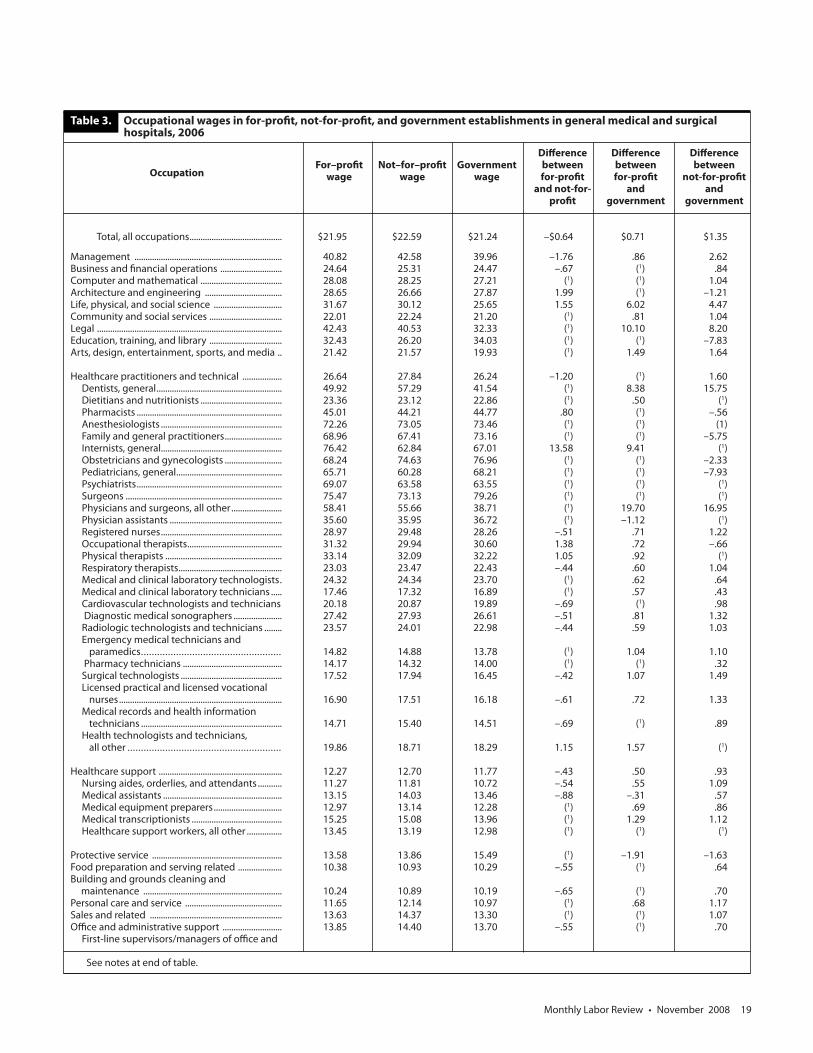
Average wages across all occupations in this industry were $21.95 per hour in the for-profit sector and $22.59 per hour in the not-for-profit sector—a marginal but sta-tistically significant 64-cent advantage for not-for-profit employees. Average wages for all occupations were similar in part because the staffing patterns were similar, and in part because the wages for individual occupations were similar. As with employment, the biggest differences in wages were in nursing occupations, because registered nurses, licensed practical nurses, and nursing aides earned between 2 percent and 5 percent more in not-for-profit hospitals, as shown in table 3.
The similarities between the two sectors are due to sever-al reasons, not least of which is that the nature of hospital activities demands an adherence to standards of patient care and welfare that may limit the ability of profit-seek-ing hospitals to distinguish themselves from not-for-profit hospitals in terms of production and staffing. Also, in contrast to industries where not-for-profits make up a

Monthly Labor Review • November 2008 17
Table 2. Occupational employment in for-profit, not-for-profit, and government establishments in general medical and surgical hospitals, 2006
For-profit Not-for-profit Government Percentage Percentage Percentage
Occupation employment employment employment of for-profit of not-for- of
employment profit employ- government ment employment
Total, all occupations ....................... 741,890 3,375,840 799,020 100.0 100.0 100.0 ...Management ................................................... 26,410 112,450 27,660 3.6 3.3 3.5 6 Business and financial operations ............ 11,310 59,330 14,150 1.5 1.8 1.8 –15 Computer and mathematical ..................... 5,490 33,650 8,560 .7 1.0 1.1 –35 Architecture and engineering ................... 640 3,540 760 .1 .1 .1 –22 Life, physical, and social science ............... 2,500 16,260 3,380 .3 .5 .4 –43 Community and social services ................. 11,900 63,380 16,010 1.6 1.9 2.0 –17 Legal .................................................................... 90 800 230 .0 .0 .0 –105 Education, training, and library ................. 2,530 13,550 4,050 .3 .4 .5 –18 Arts, design, entertainment, sports, and media ....................................................... 780 6,670 1,460 .1 .2 .2 –88
Healthcare practitioners and technical ... 408,210 1,773,890 408,780 55.0 52.5 51.2 5 Dentists, general ......................................... 50 500 270 .01 .01 .03 –120 Dietitians and nutritionists ..................... 2,400 12,280 2,800 .32 .36 .35 –13 Pharmacists .................................................. 8,080 35,930 8,340 1.09 1.06 1.04 2 Anesthesiologists ....................................... 390 2,500 820 .05 .07 .10 –42 Family and general practitioners .......... 1,780 11,730 2,610 .24 .35 .33 –45 Internists, general....................................... 590 5,230 760 .08 .16 .10 –95 Obstetricians and gynecologists .......... 260 1,630 310 .03 .05 .04 –38 Pediatricians, general ................................ 300 2,320 540 .04 .07 .07 –71 Psychiatrists .................................................. 260 2,670 560 .04 .08 .07 –122 Surgeons ....................................................... 560 3,860 510 .08 .11 .06 –52 Physicians and surgeons, all other ....... 4,970 42,750 14,030 .67 1.27 1.76 –89 Physician assistants ................................... 1,280 11,250 2,010 .17 .33 .25 –93 Registered nurses ....................................... 218,950 951,140 211,300 29.51 28.17 26.45 5 Occupational therapists ........................... 3,810 16,100 3,440 .51 .48 .43 7 Physical therapists ..................................... 7,150 31,390 6,530 .96 .93 .82 4 Respiratory therapists ............................... 14,260 50,120 10,670 1.92 1.48 1.34 23 Medical and clinical laboratory technologists ........................................... 14,020 68,710 14,640 1.89 2.04 1.83 –8 Medical and clinical laboratory technicians ............................................... 9,000 43,620 9,670 1.21 1.29 1.21 –7 Cardiovascular technologists and technicians ............................................... 4,980 23,480 4,570 .67 .70 .57 –4 Diagnostic medical sonographers ....... 4,130 18,450 3,480 .56 .55 .44 (2) Radiologic technologists and technicians ............................................... 19,360 78,780 17,130 2.61 2.33 2.14 11 Emergency medical technicians and paramedics ............................................... 6,260 24,110 9,230 .84 .71 1.16 15 Pharmacy technicians............................... 7,880 33,410 7,790 1.06 .99 .98 7 Surgical technologists .............................. 10,740 40,390 8,790 1.45 1.20 1.10 17 Licensed practical and licensed vocational nurses ................................... 33,940 107,210 33,870 4.57 3.18 4.24 31 Medical records and health information technicians ...................... 9,970 41,250 10,380 1.34 1.22 1.30 9 Health technologists and technicians, all other ............................ 4,530 24,250 4,320 .61 .72 .54 –18
Healthcare support ........................................ 94,130 430,380 103,980 12.7 12.7 13.0 (2) Nursing aides, orderlies, and attendants ................................................ 59,330 259,860 64,520 8.00 7.70 8.07 4 Medical assistants ...................................... 5,920 33,240 8,950 .80 .98 1.12 –23 Medical equipment preparers ............... 3,710 20,950 3,950 .50 .62 .49 –24 Medical transcriptionists ......................... 5,330 27,490 5,470 .72 .81 .68 –13 Healthcare support workers, all other 10,080 48,820 9,190 1.36 1.45 1.15 –6 Protective service ........................................... 4,910 26,800 6,600 .7 .8 .8 –20
Relative per-cent difference
between for-profit and not-
for-profit1
See note at end of table.
Not-For-Profit Sector
18 Monthly Labor Review • November 2008
relatively small proportion of total industry employment, not-for-profits accounted for 69 percent of employment in the hospital industry, and they may influence wages in the hospital industry more than not-for-profits influence wages in other industries.
Depository credit intermediation
The depository credit intermediation industry illustrates a different aspect of not-for-profit employment: in contrast to hospitals, and despite composing one of the industries with the highest level of not-for-profit employment, the establishments in the depository credit intermediation industry are overwhelmingly for-profit. This industry is made up mostly of commercial banks, which are primarily for-profit institutions, and credit unions, which are equally
Table 2. Continued—Occupational employment in for-profit, not-for-profit, and government establishments in general medical and surgical hospitals, 2006
For-profit Not-for-profit Government Percentage Percentage Percentage
Occupation employment employment employment of for-profit of not-for- of
employment profit employ- government ment employment
Sales and related ............................................ 1,580 9,980 1,540 .2 .3 .2 –39 Office and administrative support ........... 106,300 520,100 125,850 14.3 15.4 15.8 –8 First-line supervisors/managers of office and administrative support workers ..................................... 6,190 28,360 7,310 .83 .84 .91 (2) Switchboard operators, including answering service .................................. 4,790 15,030 3,590 .65 .45 .45 31 Bill and account collectors ...................... 3,640 12,200 3,960 .49 .36 .50 26 Billing and posting clerks and machine operators ................................ 5,620 29,120 7,390 .76 .86 .92 –14 Bookkeeping, accounting, and auditing clerks ........................................ 3,800 20,890 6,050 .51 .62 .76 –21 Interviewers, except eligibility and loan .................................................... 11,920 56,620 12,240 1.61 1.68 1.53 –4 Receptionists and information clerks .......................................................... 5,600 30,140 5,580 .75 .89 .70 –18 Stock clerks and order fillers .................. 3,720 17,250 4,330 .50 .51 .54 (2) Medical secretaries .................................... 14,490 64,990 15,760 1.95 1.93 1.97 (2) Secretaries, except legal, medical, and executive .......................................... 8,220 48,910 8,440 1.11 1.45 1.06 –31 Office clerks, general ................................. 15,880 73,150 27,110 2.14 2.17 3.39 (2)Construction and extraction ...................... 1,690 9,260 2,580 .2 .3 .3 –21 Installation, maintenance, and repair ..... 7,230 34,590 9,440 1.0 1.0 1.2 –5 Production ........................................................ 3,140 17,430 4,360 .4 .5 .5 –22 Transportation and material moving ...... 1,930 11,370 2,310 .3 .3 .3 –29
Relative percent
difference between for-profit
and not-for-profit1
Food preparation and serving related .... 21,410 94,270 22,770 2.9 2.8 2.8 3 Building and grounds cleaning and maintenance ............................................... 27,600 121,880 30,420 3.7 3.6 3.8 3 Personal care and service ............................ 2,110 16,250 4,150 .3 .5 .5 –69
1 This refers to the relative percentage difference between for-profit and not-for-profit percentage of employment, using the for-profit percentage as a base, which allows occupations with low and high levels of employment to be more easily compared.
2 All differences are statistically significant at the 90-percent confidence
level, except those marked as footnote 2.NOTE: Occupations that are indented are categories of the non-indented
occupational groups and enter into each respective occupational group’s estimate. They are broken out from the occupational groups in order to provide more detail where necessary.
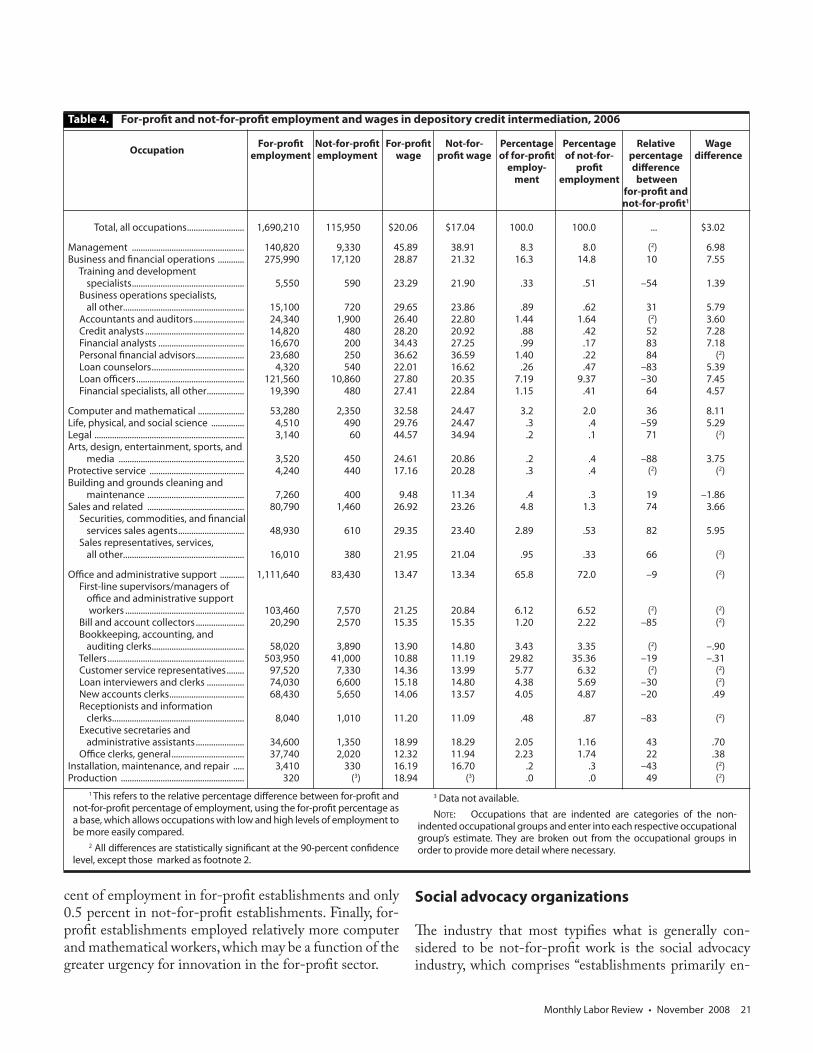
divided between for-profit and not-for-profit establish-ments in the OES sample. As shown in table 4, this indus-try—unlike the hospital industry—shows a clear distinc-tion between the profit sector and not-for-profit sector in regards to occupational employment and wages. Not-for-profit establishments in this industry accounted for only 6 percent of total industry employment and therefore likely held much less sway over the industry’s wages than not-for-profit hospitals.
Total average wages in this industry were $20.06 per hour in for-profit establishments, compared with $17.04 in not-for-profit organizations. Unlike the cross-indus-try totals, this difference appears across the occupational board and is more than a mere effect of the occupational mix in the two establishment types. Wages in for-profit es-tablishments were significantly higher in all occupational
Monthly Labor Review • November 2008 19
Table 3. Occupational wages in for-profit, not-for-profit, and government establishments in general medical and surgical hospitals, 2006
Difference Difference
Occupation For–profit Not–for–profit Government between between
wage wage wage for-profit for-profit and not-for- and profit government
Total, all occupations .......................................... $21.95 $22.59 $21.24 –$0.64 $0.71 $1.35
Management ................................................................... 40.82 42.58 39.96 –1.76 .86 2.62Business and financial operations ............................ 24.64 25.31 24.47 –.67 (1) .84Computer and mathematical ..................................... 28.08 28.25 27.21 (1) (1) 1.04Architecture and engineering ................................... 28.65 26.66 27.87 1.99 (1) –1.21Life, physical, and social science ............................... 31.67 30.12 25.65 1.55 6.02 4.47Community and social services ................................. 22.01 22.24 21.20 (1) .81 1.04Legal .................................................................................... 42.43 40.53 32.33 (1) 10.10 8.20Education, training, and library ................................. 32.43 26.20 34.03 (1) (1) –7.83Arts, design, entertainment, sports, and media .. 21.42 21.57 19.93 (1) 1.49 1.64
Healthcare practitioners and technical .................. 26.64 27.84 26.24 –1.20 (1) 1.60 Dentists, general ......................................................... 49.92 57.29 41.54 (1) 8.38 15.75 Dietitians and nutritionists ..................................... 23.36 23.12 22.86 (1) .50 (1) Pharmacists .................................................................. 45.01 44.21 44.77 .80 (1) –.56 Anesthesiologists ....................................................... 72.26 73.05 73.46 (1) (1) (1) Family and general practitioners .......................... 68.96 67.41 73.16 (1) (1) –5.75 Internists, general....................................................... 76.42 62.84 67.01 13.58 9.41 (1) Obstetricians and gynecologists .......................... 68.24 74.63 76.96 (1) (1) –2.33 Pediatricians, general ................................................ 65.71 60.28 68.21 (1) (1) –7.93 Psychiatrists .................................................................. 69.07 63.58 63.55 (1) (1) (1) Surgeons ....................................................................... 75.47 73.13 79.26 (1) (1) (1) Physicians and surgeons, all other ....................... 58.41 55.66 38.71 (1) 19.70 16.95 Physician assistants ................................................... 35.60 35.95 36.72 (1) –1.12 (1) Registered nurses ....................................................... 28.97 29.48 28.26 –.51 .71 1.22 Occupational therapists ........................................... 31.32 29.94 30.60 1.38 .72 –.66 Physical therapists ..................................................... 33.14 32.09 32.22 1.05 .92 (1) Respiratory therapists ............................................... 23.03 23.47 22.43 –.44 .60 1.04 Medical and clinical laboratory technologists . 24.32 24.34 23.70 (1) .62 .64 Medical and clinical laboratory technicians ..... 17.46 17.32 16.89 (1) .57 .43 Cardiovascular technologists and technicians 20.18 20.87 19.89 –.69 (1) .98 Diagnostic medical sonographers ...................... 27.42 27.93 26.61 –.51 .81 1.32 Radiologic technologists and technicians ........ 23.57 24.01 22.98 –.44 .59 1.03 Emergency medical technicians and paramedics .................................................... 14.82 14.88 13.78 (1) 1.04 1.10 Pharmacy technicians ............................................. 14.17 14.32 14.00 (1) (1) .32 Surgical technologists .............................................. 17.52 17.94 16.45 –.42 1.07 1.49 Licensed practical and licensed vocational nurses .......................................................................... 16.90 17.51 16.18 –.61 .72 1.33 Medical records and health information technicians ................................................................ 14.71 15.40 14.51 –.69 (1) .89 Health technologists and technicians, all other ......................................................... 19.86 18.71 18.29 1.15 1.57 (1)
Healthcare support ........................................................ 12.27 12.70 11.77 –.43 .50 .93 Nursing aides, orderlies, and attendants ........... 11.27 11.81 10.72 –.54 .55 1.09 Medical assistants ...................................................... 13.15 14.03 13.46 –.88 –.31 .57 Medical equipment preparers ............................... 12.97 13.14 12.28 (1) .69 .86 Medical transcriptionists ......................................... 15.25 15.08 13.96 (1) 1.29 1.12 Healthcare support workers, all other ................ 13.45 13.19 12.98 (1) (1) (1)
Protective service ........................................................... 13.58 13.86 15.49 (1) –1.91 –1.63Food preparation and serving related .................... 10.38 10.93 10.29 –.55 (1) .64Building and grounds cleaning and maintenance ............................................................... 10.24 10.89 10.19 –.65 (1) .70Personal care and service ............................................ 11.65 12.14 10.97 (1) .68 1.17Sales and related ............................................................ 13.63 14.37 13.30 (1) (1) 1.07Office and administrative support ........................... 13.85 14.40 13.70 –.55 (1) .70 First-line supervisors/managers of office and
See notes at end of table.
Difference between
not-for-profitand
government
Not-For-Profit Sector
20 Monthly Labor Review • November 2008
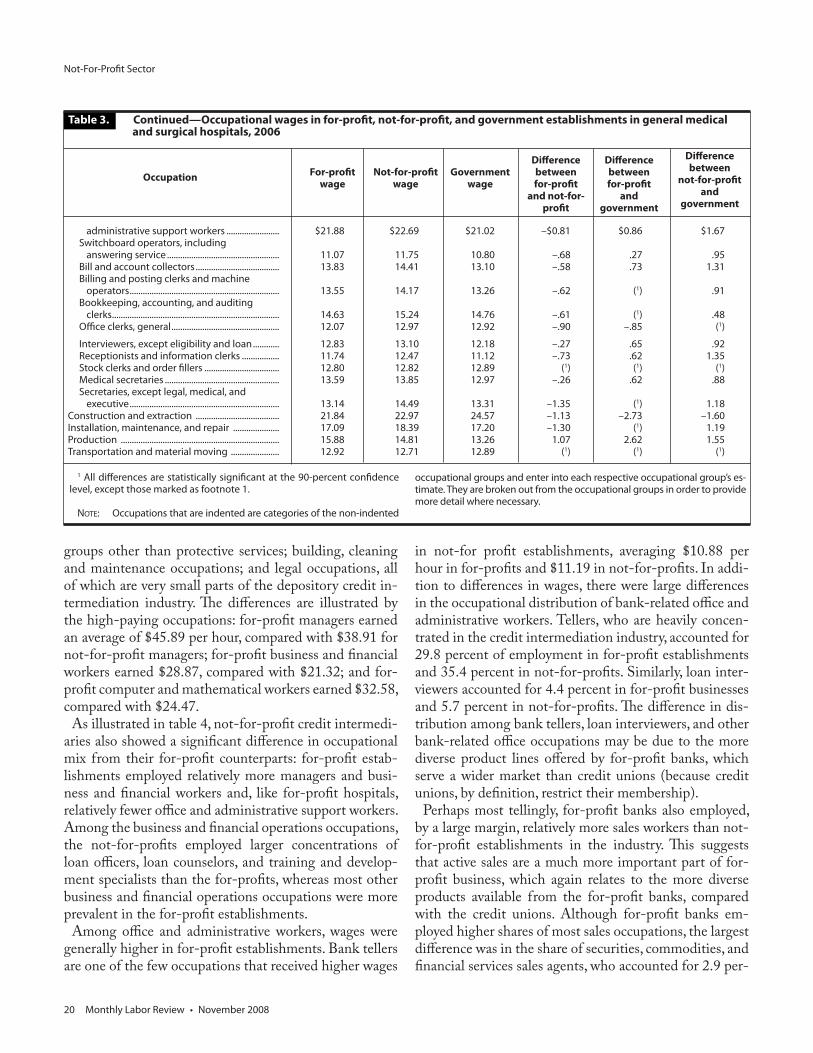
groups other than protective services; building, cleaning and maintenance occupations; and legal occupations, all of which are very small parts of the depository credit in-termediation industry. The differences are illustrated by the high-paying occupations: for-profit managers earned an average of $45.89 per hour, compared with $38.91 for not-for-profit managers; for-profit business and financial workers earned $28.87, compared with $21.32; and for-profit computer and mathematical workers earned $32.58, compared with $24.47.
As illustrated in table 4, not-for-profit credit intermedi-aries also showed a significant difference in occupational mix from their for-profit counterparts: for-profit estab-lishments employed relatively more managers and busi-ness and financial workers and, like for-profit hospitals, relatively fewer office and administrative support workers. Among the business and financial operations occupations, the not-for-profits employed larger concentrations of loan officers, loan counselors, and training and develop-ment specialists than the for-profits, whereas most other business and financial operations occupations were more prevalent in the for-profit establishments.
Among office and administrative workers, wages were generally higher in for-profit establishments. Bank tellers are one of the few occupations that received higher wages
in not-for profit establishments, averaging $10.88 per hour in for-profits and $11.19 in not-for-profits. In addi-tion to differences in wages, there were large differences in the occupational distribution of bank-related office and administrative workers. Tellers, who are heavily concen-trated in the credit intermediation industry, accounted for 29.8 percent of employment in for-profit establishments and 35.4 percent in not-for-profits. Similarly, loan inter-viewers accounted for 4.4 percent in for-profit businesses and 5.7 percent in not-for-profits. The difference in dis-tribution among bank tellers, loan interviewers, and other bank-related office occupations may be due to the more diverse product lines offered by for-profit banks, which serve a wider market than credit unions (because credit unions, by definition, restrict their membership).
Perhaps most tellingly, for-profit banks also employed, by a large margin, relatively more sales workers than not-for-profit establishments in the industry. This suggests that active sales are a much more important part of for-profit business, which again relates to the more diverse products available from the for-profit banks, compared with the credit unions. Although for-profit banks em-ployed higher shares of most sales occupations, the largest difference was in the share of securities, commodities, and financial services sales agents, who accounted for 2.9 per-
administrative support workers ........................ $21.88 $22.69 $21.02 –$0.81 $0.86 $1.67 Switchboard operators, including answering service ................................................... 11.07 11.75 10.80 –.68 .27 .95 Bill and account collectors ...................................... 13.83 14.41 13.10 –.58 .73 1.31 Billing and posting clerks and machine operators .................................................................... 13.55 14.17 13.26 –.62 (1) .91 Bookkeeping, accounting, and auditing clerks ............................................................................ 14.63 15.24 14.76 –.61 (1) .48 Office clerks, general ................................................. 12.07 12.97 12.92 –.90 –.85 (1)
Interviewers, except eligibility and loan ............ 12.83 13.10 12.18 –.27 .65 .92 Receptionists and information clerks ................. 11.74 12.47 11.12 –.73 .62 1.35 Stock clerks and order fillers .................................. 12.80 12.82 12.89 (1) (1) (1) Medical secretaries .................................................... 13.59 13.85 12.97 –.26 .62 .88 Secretaries, except legal, medical, and executive .................................................................... 13.14 14.49 13.31 –1.35 (1) 1.18Construction and extraction ...................................... 21.84 22.97 24.57 –1.13 –2.73 –1.60Installation, maintenance, and repair ..................... 17.09 18.39 17.20 –1.30 (1) 1.19Production ........................................................................ 15.88 14.81 13.26 1.07 2.62 1.55Transportation and material moving ...................... 12.92 12.71 12.89 (1) (1) (1)
Table 3. Continued—Occupational wages in for-profit, not-for-profit, and government establishments in general medical and surgical hospitals, 2006
Difference Difference Occupation For-profit Not-for-profit Government between between wage wage wage for-profit for-profit and not-for- and profit government
1 All differences are statistically significant at the 90-percent confidence level, except those marked as footnote 1.
NOTE: Occupations that are indented are categories of the non-indented
occupational groups and enter into each respective occupational group’s es-timate. They are broken out from the occupational groups in order to provide more detail where necessary.
Difference between
not-for-profitand
government
Monthly Labor Review • November 2008 21
Table 4. For-profit and not-for-profit employment and wages in depository credit intermediation, 2006
Occupation For-profit Not-for-profit For-profit Not-for- Percentage Percentage Relative Wage
employment employment wage profit wage of for-profit of not-for- percentage difference employ- profit difference ment employment between for-profit and not-for-profit1
Total, all occupations .......................... 1,690,210 115,950 $20.06 $17.04 100.0 100.0 ... $3.02
Management ................................................... 140,820 9,330 45.89 38.91 8.3 8.0 (2) 6.98Business and financial operations ............ 275,990 17,120 28.87 21.32 16.3 14.8 10 7.55 Training and development specialists ................................................... 5,550 590 23.29 21.90 .33 .51 –54 1.39 Business operations specialists, all other....................................................... 15,100 720 29.65 23.86 .89 .62 31 5.79 Accountants and auditors ....................... 24,340 1,900 26.40 22.80 1.44 1.64 (2) 3.60 Credit analysts ............................................. 14,820 480 28.20 20.92 .88 .42 52 7.28 Financial analysts ....................................... 16,670 200 34.43 27.25 .99 .17 83 7.18 Personal financial advisors ...................... 23,680 250 36.62 36.59 1.40 .22 84 (2) Loan counselors .......................................... 4,320 540 22.01 16.62 .26 .47 –83 5.39 Loan officers ................................................. 121,560 10,860 27.80 20.35 7.19 9.37 –30 7.45 Financial specialists, all other ................. 19,390 480 27.41 22.84 1.15 .41 64 4.57
Computer and mathematical ..................... 53,280 2,350 32.58 24.47 3.2 2.0 36 8.11Life, physical, and social science ............... 4,510 490 29.76 24.47 .3 .4 –59 5.29Legal .................................................................... 3,140 60 44.57 34.94 .2 .1 71 (2)Arts, design, entertainment, sports, and media ......................................................... 3,520 450 24.61 20.86 .2 .4 –88 3.75Protective service ........................................... 4,240 440 17.16 20.28 .3 .4 (2) (2)Building and grounds cleaning and maintenance ............................................ 7,260 400 9.48 11.34 .4 .3 19 –1.86Sales and related ............................................ 80,790 1,460 26.92 23.26 4.8 1.3 74 3.66 Securities, commodities, and financial services sales agents .............................. 48,930 610 29.35 23.40 2.89 .53 82 5.95 Sales representatives, services, all other....................................................... 16,010 380 21.95 21.04 .95 .33 66 (2)
Office and administrative support ........... 1,111,640 83,430 13.47 13.34 65.8 72.0 –9 (2) First-line supervisors/managers of office and administrative support workers ...................................................... 103,460 7,570 21.25 20.84 6.12 6.52 (2) (2) Bill and account collectors ...................... 20,290 2,570 15.35 15.35 1.20 2.22 –85 (2) Bookkeeping, accounting, and auditing clerks .......................................... 58,020 3,890 13.90 14.80 3.43 3.35 (2) –.90 Tellers .............................................................. 503,950 41,000 10.88 11.19 29.82 35.36 –19 –.31 Customer service representatives ........ 97,520 7,330 14.36 13.99 5.77 6.32 (2) (2) Loan interviewers and clerks ................. 74,030 6,600 15.18 14.80 4.38 5.69 –30 (2) New accounts clerks .................................. 68,430 5,650 14.06 13.57 4.05 4.87 –20 .49 Receptionists and information clerks ............................................................ 8,040 1,010 11.20 11.09 .48 .87 –83 (2) Executive secretaries and administrative assistants ...................... 34,600 1,350 18.99 18.29 2.05 1.16 43 .70 Office clerks, general ................................. 37,740 2,020 12.32 11.94 2.23 1.74 22 .38Installation, maintenance, and repair ..... 3,410 330 16.19 16.70 .2 .3 –43 (2)Production ........................................................ 320 (3) 18.94 (3) .0 .0 49 (2)
cent of employment in for-profit establishments and only 0.5 percent in not-for-profit establishments. Finally, for-profit establishments employed relatively more computer and mathematical workers, which may be a function of the greater urgency for innovation in the for-profit sector.
Social advocacy organizations
The industry that most typifies what is generally con-sidered to be not-for-profit work is the social advocacy industry, which comprises “establishments primarily en-
1 This refers to the relative percentage difference between for-profit and not-for-profit percentage of employment, using the for-profit percentage as a base, which allows occupations with low and high levels of employment to be more easily compared.
2 All differences are statistically significant at the 90-percent confidence level, except those marked as footnote 2.
3 Data not available.NOTE: Occupations that are indented are categories of the non-
indented occupational groups and enter into each respective occupational group’s estimate. They are broken out from the occupational groups in order to provide more detail where necessary.
Not-For-Profit Sector
22 Monthly Labor Review • November 2008
Table 5. For-profit and not-for-profit employment and wages in social advocacy organizations, 2006
Occupation For-profit Not-for-profit For-profit Not-for- Percentage Percentage of Relative Wage employment employment wage profit wage of for-profit not-for-profit percentage difference employ- employment difference ment between for- profit and not-for-profit1
Total, all occupations .............................. 10,050 156,870 $18.68 $17.95 100.0 100.0 ... $0.73
Management .......................................................... 930 17,190 36.80 34.42 9.3 11.0 –18 (2) Public relations managers .............................. 60 1,260 33.36 37.17 .56 .80 –44 –3.81 Financial managers ........................................... 90 720 39.39 37.57 .85 .46 46 (2) Social and community service managers ......................................................... 350 5,210 31.11 26.46 3.44 3.32 (2) (2) General and operations managers ............. 230 5,290 41.32 40.98 2.25 3.37 –50 (2) Business and financial operations ................... 920 11,590 27.62 23.22 9.2 7.4 20 4.40 Meeting and convention planners ............. (3) 660 25.68 19.92 (3) .42 (2) 5.76 Business operations specialists, all other .............................................................. 430 5,370 26.58 22.05 4.27 3.42 20 4.53 Accountants and auditors .............................. 130 2,420 26.16 26.67 1.28 1.54 –21 (2) Community and social services ........................ 2,350 27,500 16.49 15.93 23.4 17.5 25 (2) Mental health counselors ............................... 170 330 12.05 16.89 1.70 .21 87 –4.84 Child, family, and school social workers.... 220 5,650 21.20 16.37 2.21 3.60 –63 4.83 Medical and public health social workers ............................................................. 130 1,600 25.03 18.72 1.31 1.02 22 6.31 Mental health and substance abuse social workers ................................................. 440 1,540 16.87 16.44 4.39 .98 78 (2) Social workers, all other .................................. 100 1,070 23.59 18.28 .98 .68 30 5.31 Health educators ............................................... 50 1,470 12.30 19.16 .45 .93 –108 –6.86 Social and human service assistants .......... 750 8,380 12.50 12.86 7.46 5.34 28 (2) Community and social service specialists, all other ...................................... 390 5,220 17.89 17.61 3.89 3.33 14 (2) Arts, design, entertainment, sports, and media .................................................................... 500 7,730 29.54 24.28 5.0 4.9 (2) (2) Healthcare practitioners and technical ......... 70 1,730 33.60 21.24 .7 1.1 –63 12.36 Building and grounds cleaning and maintenance ...................................................... 140 3,510 11.43 10.61 1.4 2.2 –60 (2) Personal care and service ................................... 1,480 19,570 8.94 9.72 14.7 12.5 15 –.78 Office and administrative support .................. 1,850 32,260 14.40 14.40 18.4 2.6 –11 (2) Computer and mathematical ............................ 170 2,150 25.39 27.08 1.7 1.4 18 (2) Life, physical, and social science ...................... 500 4,340 21.02 27.43 5.0 2.8 45 –6.41 Legal ........................................................................... 70 1,710 24.10 32.99 .7 1.1 –51 –8.89 Education, training, and library ........................ 290 11,000 12.37 13.34 2.8 7.0 –147 (2) Healthcare support ............................................... 20 800 11.41 10.21 .2 .5 –116 (2) Food preparation and serving related ........... 120 2,990 9.08 8.84 1.2 1.9 –65 (2) Sales and related ................................................... 160 3,740 15.03 19.89 1.6 2.4 –45 –4.86 Farming, fishing, and forestry ........................... 40 440 15.20 12.12 .4 .3 32 (2) Construction and extraction ............................. 60 500 22.31 15.92 .6 .3 50 6.39 Installation, maintenance, and repair ............ 80 1,490 17.31 14.36 .8 1.0 –15 2.95 Transportation and material moving ............. 80 3,480 11.17 10.36 .8 2.2 –173 (2)
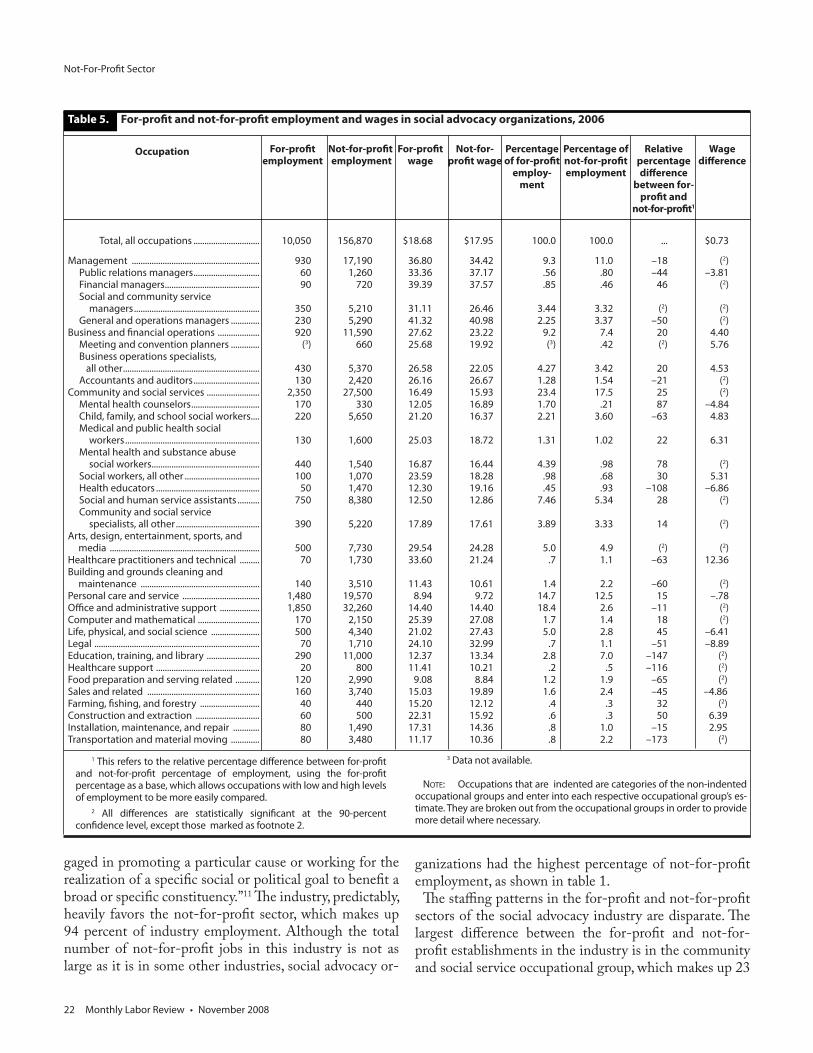
gaged in promoting a particular cause or working for the realization of a specific social or political goal to benefit a broad or specific constituency.”11 The industry, predictably, heavily favors the not-for-profit sector, which makes up 94 percent of industry employment. Although the total number of not-for-profit jobs in this industry is not as large as it is in some other industries, social advocacy or-
ganizations had the highest percentage of not-for-profit employment, as shown in table 1.
The staffing patterns in the for-profit and not-for-profit sectors of the social advocacy industry are disparate. The largest difference between the for-profit and not-for-profit establishments in the industry is in the community and social service occupational group, which makes up 23
1 This refers to the relative percentage difference between for-profit and not-for-profit percentage of employment, using the for-profit percentage as a base, which allows occupations with low and high levels of employment to be more easily compared.
2 All differences are statistically significant at the 90-percent confidence level, except those marked as footnote 2.
3 Data not available.
NOTE: Occupations that are indented are categories of the non-indented occupational groups and enter into each respective occupational group’s es-timate. They are broken out from the occupational groups in order to provide more detail where necessary.

Monthly Labor Review • November 2008 23
percent of for-profit social advocacy employment and only 18 percent of not-for-profit social advocacy employment. (See table 5.) The difference in this group is driven by two mental-health-related occupations and by the assistants to the people in those occupations. The two occupations are mental health and substance abuse social workers and mental health counselors. Mental health and substance abuse workers accounted for 4.4 percent of employment in for-profit social advocacy establishments and one per-cent in not-for-profit social advocacy establishments. Mental health counselors accounted for 1.7 percent of employment in for-profits and 0.2 percent in not-for-profits. Social and human service assistants accounted for 7.5 percent of not-for-profit employment and 5.3 percent of for-profit employment. The not-for-profit sector em-ployed a higher concentration of education, training, and library workers, and a lower concentration of business and financial occupations. As it was in other industries, the share of office and administrative workers was higher in the not-for-profit sector.
Despite having fairly similar total average wages of $18.68 per hour in for-profit establishments and $17.95 per hour in not-for-profit establishments, the social advocacy in-dustry had relative wages that differed greatly depending on the occupation. Major differences in wages appear as large premiums for employees of for-profit establishments in business and financial, healthcare practitioner, and con-struction and extraction occupations. In contrast, the life, physical, and social science; legal; and sales occupational groups all show a sizeable wage premium for the not-for-
profits. Together, these differences in opposite directions produce similar average wages, though some of the varia-tion can be explained by the low level of for-profit em-ployment in certain occupations in this industry. Three of the four social work occupations had much higher wages in for-profits, whereas other community and social ser-vice occupations earned much lower wages in for-profits. Meeting and convention planners and business operations specialists also earned higher wages in for-profits.
THIS ARTICLE EXAMINED EMPLOYMENT AND WAGES in for-profit and not-for-profit establishments, using data from the Occupational Employment Statistics survey and the IRS Business Master File, which was used to iden-tify not-for-profit establishments that appeared in the OES sample. This article showed that average wages were slightly higher in not-for-profit establishments but that this is because not-for-profit organizations generally do not have the same employment patterns as for-profit busi-nesses, not because not-for-profits pay more for the same work. The article demonstrates that, in general, not-for-profit workers earned less for a given occupation, especially among the highest paying occupations. Occupational dif-ferences between for-profit and not-for-profit establish-ments vary greatly from industry to industry, but not-for-profit establishments on the whole employed many fewer production, construction, transportation, sales, and food service workers, yet more scientists, healthcare workers, community workers, and personal care workers.
Notes
1 Lester M. Salamon and S. Wojciech Sokolowski, “Employment in America’s Charities: A Profile,” Johns Hopkins Center for Civil Soci-ety Studies Nonprofit Employment Bulletin, December 2006, p. 9.
2 Total private employment 2002–2004 was calculated using “Table 1. Total coverage (UI and UCFE) by ownership: Establishments, em-ployment, and wages, 1997-2006 annual averages,” from the Quarterly Census of Employment and Wages, Bureau of Labor Statistics, Sept. 17, 2007, on the Internet at www.bls.gov/cew/ew06table1.pdf (visited Nov. 24, 2008).
3 “Number of Nonprofit Organizations in the United States, 1996 – 2006,” National Center for Charitable Statistics, on the Internet at http://nccsdataweb.urban.org/PubApps/profile1.php?state=US (visited Nov. 24, 2008). 4 Lester M. Salamon and S. Wojciech Sokolowski, “Nonprofit orga-nizations: new insights from the QCEW data,” Monthly Labor Review, September 2005, pp. 21–23. 5 “SOI Tax Stats - Exempt Organizations: IRS Master File Data,” In-ternal Revenue Service, on the Internet at www.irs.gov/taxstats/char-
itablestats/article/0,,id=97186,00.html (visited Nov. 24, 2008).
6 “Exemption from tax on corporations, certain trusts, etc,” Govern-ment Printing Office, 26 U.S. Code 501, Jan. 3, 2006. Visit www.gpoac-cess.gov/uscode (visited Nov. 24, 2008) and search for 26USC501.
7 Salamon and Sokolowski, “Employment in America’s Charities,” p. 21.
8 The difference is, like all comparisons in the text, statistically signifi-cant at the 90-percent confidence interval for all occupations except for the arts, design, entertainment, sports, and media occupational group.
9 Salamon and Sokolowski, pp. 24–25.
10 See North American Industry Classification System, United States, 2002 (Office of Management and Budget), NAICS 622110, p. 820. Available on the Internet at www.census.gov/eos/www/naics/ (visited Nov. 24, 2008).
11 Ibid, NAICS 813310, p. 893. Available on the Internet at www.cen-sus.gov/eos/www/naics/ (visited Nov. 24, 2008).

Not-For-Profit Sector
24 Monthly Labor Review • November 2008
Percentageof not-for-
profitemploy-
ment
See notes at end of table.
Percentageof for-profit
employ-ment
Percent-age of
govern-ment
employ-ment
Table A–1. For-profit, not-for-profit, and government employment and wages, by detailed occupation, 2006
For-profit Not-for-profit Govern-
For-profit Not-for- Govern-
Occupation employ- employ-
ment
wage profit wage
ment
ment ment employ-
wage
ment
Chief executives .............................................. 228,750 28,170 45,190 0.23 0.26 0.21 $73.70 $66.26 $49.15General and operations managers .......... 1,427,710 117,840 124,850 1.41 1.09 .58 48.65 42.78 41.09Advertising and promotions managers . 33,670 4,090 810 .03 .04 .00 41.82 34.01 32.12Marketing managers ..................................... 150,130 8,880 2,080 .15 .08 .01 52.46 40.73 37.81Sales managers ............................................... 306,590 4,320 640 .30 .04 .00 49.26 45.62 36.69Public relations managers ........................... 22,420 15,630 6,190 .02 .14 .03 50.19 38.78 36.66Administrative services managers ........... 146,580 34,630 52,910 .14 .32 .25 35.85 33.11 33.64Computer and information systems managers...................................................... 210,130 17,270 25,030 .21 .16 .12 53.03 46.27 42.20Financial managers........................................ 388,550 36,070 48,030 .38 .33 .22 50.14 42.59 40.56Compensation and benefits managers .. 37,570 5,170 4,180 .04 .05 .02 40.29 36.12 35.03Training and development managers .... 20,330 3,940 3,330 .02 .04 .02 43.45 38.34 34.05
Human resources managers, all other .... 39,010 6,110 11,160 .04 .06 .05 47.29 41.35 40.63Industrial production managers ............... 152,810 1,020 1,080 .15 .01 .01 40.40 38.43 36.50Purchasing managers ................................... 57,230 2,720 7,100 .06 .03 .03 41.28 39.52 41.79Transportation, storage, and distribution managers ............................. 73,510 1,090 15,200 .07 .01 .07 37.54 34.67 38.56Farm, ranch, and other agricultural managers..................................................... 2,630 160 520 .00 .00 .00 28.39 24.00 28.18Farmers and ranchers ................................... 230 (1) 50 .00 (1) .00 21.91 16.00 17.67Construction managers ............................... 197,060 1,710 9,770 .19 .02 .05 40.04 38.11 33.91Education administrators, preschool and child care center/program ............ 22,520 18,370 6,230 .02 .17 .03 18.48 20.78 29.65Education administrators, elementary and secondary school .............................. 8,780 18,500 190,270 .01 .17 .88 65,880 72,610 80,060Education administrators, postsecondary ............................................ 8,560 31,840 63,840 .01 .29 .30 33.39 39.51 40.61Education administrators, all other ......... 7,110 6,290 14,260 .01 .06 .07 30.33 34.20 35.62
Engineering managers ................................. 165,720 3,200 15,940 .16 .03 .07 53.21 54.98 48.52Food service managers ................................ 175,440 6,630 8,290 .17 .06 .04 22.36 25.13 22.08Funeral directors ............................................. 22,450 30 390 .02 .00 .00 27.47 25.41 29.47Gaming managers ......................................... 2,330 80 1,060 .00 .00 .00 32.89 20.51 31.08Lodging managers ......................................... 30,200 700 590 .03 .01 .00 23.81 23.23 25.11Medical and health services managers .. 93,810 96,940 42,830 .09 .89 .20 38.05 39.80 39.24Natural sciences managers ......................... 19,820 4,770 14,190 .02 .04 .07 57.49 51.67 44.07Property, real estate, and community association managers .............................. 142,200 5,910 9,530 .14 .05 .04 24.82 25.65 28.93Social and community service managers...................................................... 17,490 65,800 29,390 .02 .61 .14 26.24 25.77 29.98Managers, all other ........................................ 181,050 31,210 123,790 .18 .29 .58 44.40 37.37 38.05Agents and business managers of artists, performers, and athletes ..... 10,330 780 (1) .01 .01 (1) 41.37 27.78 40.73Purchasing agents and buyers, farm products ............................................. 12,630 250 300 .01 .00 .00 25.99 21.77 20.46
Wholesale and retail buyers, except farm products.............................. 135,490 1,700 790 .13 .02 .00 24.52 23.62 21.59Purchasing agents, except wholesale, retail, and farm products ........................ 218,070 11,730 48,310 .22 .11 .22 25.55 23.45 28.39Claims adjusters, examiners, and investigators ................................................ 225,550 6,130 49,130 .22 .06 .23 24.67 22.91 28.60Insurance appraisers, auto damage ........ 12,660 80 (1) .01 .00 (1) 23.91 27.73 20.32Compliance officers, except agriculture, construction, health and safety, and transportation ............................................ 71,360 8,630 145,560 .07 .08 .68 28.10 25.38 22.48Cost estimators ............................................... 215,610 880 910 .21 .01 .00 27.30 28.45 26.44Emergency management specialists ...... 2,730 1,040 7,740 .00 .01 .04 27.29 26.13 22.65Employment, recruitment, and placement specialists ...................... 143,560 18,910 24,520 .14 .17 .11 25.07 21.11 20.36Compensation, benefits, and job analysis specialists .................................... 73,030 12,430 18,750 .07 .11 .09 26.27 24.39 24.29
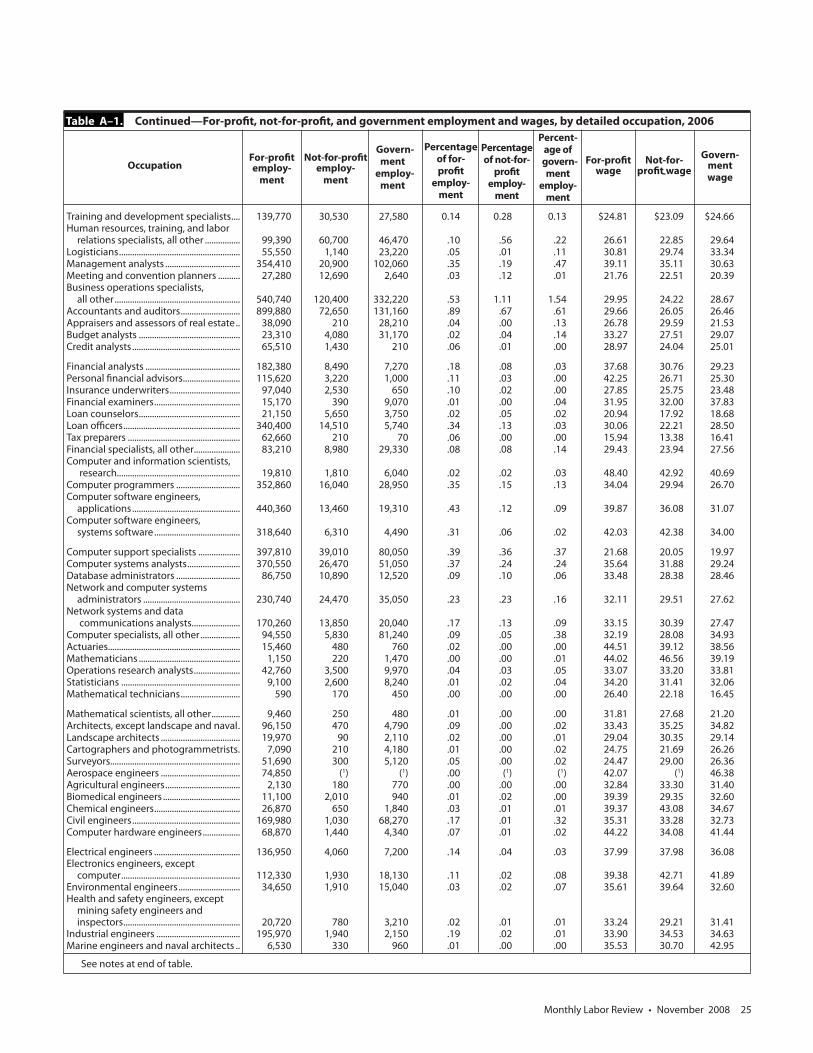
Monthly Labor Review • November 2008 25
Training and development specialists .... 139,770 30,530 27,580 0.14 0.28 0.13 $24.81 $23.09 $24.66Human resources, training, and labor relations specialists, all other ................ 99,390 60,700 46,470 .10 .56 .22 26.61 22.85 29.64Logisticians ....................................................... 55,550 1,140 23,220 .05 .01 .11 30.81 29.74 33.34Management analysts .................................. 354,410 20,900 102,060 .35 .19 .47 39.11 35.11 30.63Meeting and convention planners .......... 27,280 12,690 2,640 .03 .12 .01 21.76 22.51 20.39Business operations specialists, all other ......................................................... 540,740 120,400 332,220 .53 1.11 1.54 29.95 24.22 28.67Accountants and auditors ........................... 899,880 72,650 131,160 .89 .67 .61 29.66 26.05 26.46Appraisers and assessors of real estate .. 38,090 210 28,210 .04 .00 .13 26.78 29.59 21.53Budget analysts .............................................. 23,310 4,080 31,170 .02 .04 .14 33.27 27.51 29.07Credit analysts ................................................. 65,510 1,430 210 .06 .01 .00 28.97 24.04 25.01
Financial analysts ........................................... 182,380 8,490 7,270 .18 .08 .03 37.68 30.76 29.23Personal financial advisors .......................... 115,620 3,220 1,000 .11 .03 .00 42.25 26.71 25.30Insurance underwriters ................................ 97,040 2,530 650 .10 .02 .00 27.85 25.75 23.48Financial examiners ....................................... 15,170 390 9,070 .01 .00 .04 31.95 32.00 37.83Loan counselors .............................................. 21,150 5,650 3,750 .02 .05 .02 20.94 17.92 18.68Loan officers ..................................................... 340,400 14,510 5,740 .34 .13 .03 30.06 22.21 28.50Tax preparers ................................................... 62,660 210 70 .06 .00 .00 15.94 13.38 16.41Financial specialists, all other ..................... 83,210 8,980 29,330 .08 .08 .14 29.43 23.94 27.56Computer and information scientists, research........................................................ 19,810 1,810 6,040 .02 .02 .03 48.40 42.92 40.69Computer programmers ............................. 352,860 16,040 28,950 .35 .15 .13 34.04 29.94 26.70Computer software engineers, applications ................................................. 440,360 13,460 19,310 .43 .12 .09 39.87 36.08 31.07Computer software engineers, systems software ....................................... 318,640 6,310 4,490 .31 .06 .02 42.03 42.38 34.00
Computer support specialists ................... 397,810 39,010 80,050 .39 .36 .37 21.68 20.05 19.97Computer systems analysts ........................ 370,550 26,470 51,050 .37 .24 .24 35.64 31.88 29.24Database administrators ............................. 86,750 10,890 12,520 .09 .10 .06 33.48 28.38 28.46Network and computer systems administrators ............................................ 230,740 24,470 35,050 .23 .23 .16 32.11 29.51 27.62Network systems and data communications analysts...................... 170,260 13,850 20,040 .17 .13 .09 33.15 30.39 27.47Computer specialists, all other .................. 94,550 5,830 81,240 .09 .05 .38 32.19 28.08 34.93Actuaries ............................................................ 15,460 480 760 .02 .00 .00 44.51 39.12 38.56Mathematicians .............................................. 1,150 220 1,470 .00 .00 .01 44.02 46.56 39.19Operations research analysts ..................... 42,760 3,500 9,970 .04 .03 .05 33.07 33.20 33.81Statisticians ...................................................... 9,100 2,600 8,240 .01 .02 .04 34.20 31.41 32.06Mathematical technicians ........................... 590 170 450 .00 .00 .00 26.40 22.18 16.45
Mathematical scientists, all other ............. 9,460 250 480 .01 .00 .00 31.81 27.68 21.20Architects, except landscape and naval . 96,150 470 4,790 .09 .00 .02 33.43 35.25 34.82Landscape architects .................................... 19,970 90 2,110 .02 .00 .01 29.04 30.35 29.14Cartographers and photogrammetrists . 7,090 210 4,180 .01 .00 .02 24.75 21.69 26.26Surveyors........................................................... 51,690 300 5,120 .05 .00 .02 24.47 29.00 26.36Aerospace engineers .................................... 74,850 (1) (1) .00 (1) (1) 42.07 (1) 46.38Agricultural engineers .................................. 2,130 180 770 .00 .00 .00 32.84 33.30 31.40Biomedical engineers ................................... 11,100 2,010 940 .01 .02 .00 39.39 29.35 32.60Chemical engineers ....................................... 26,870 650 1,840 .03 .01 .01 39.37 43.08 34.67Civil engineers ................................................. 169,980 1,030 68,270 .17 .01 .32 35.31 33.28 32.73Computer hardware engineers ................. 68,870 1,440 4,340 .07 .01 .02 44.22 34.08 41.44
Electrical engineers ....................................... 136,950 4,060 7,200 .14 .04 .03 37.99 37.98 36.08Electronics engineers, except computer ...................................................... 112,330 1,930 18,130 .11 .02 .08 39.38 42.71 41.89Environmental engineers ............................ 34,650 1,910 15,040 .03 .02 .07 35.61 39.64 32.60Health and safety engineers, except mining safety engineers and inspectors ..................................................... 20,720 780 3,210 .02 .01 .01 33.24 29.21 31.41Industrial engineers ...................................... 195,970 1,940 2,150 .19 .02 .01 33.90 34.53 34.63Marine engineers and naval architects .. 6,530 330 960 .01 .00 .00 35.53 30.70 42.95
See notes at end of table.
Percentageof for-profit
employ-ment
Percentageof not-for-
profitemploy-
ment
Percent-age of
govern-ment
employ-ment
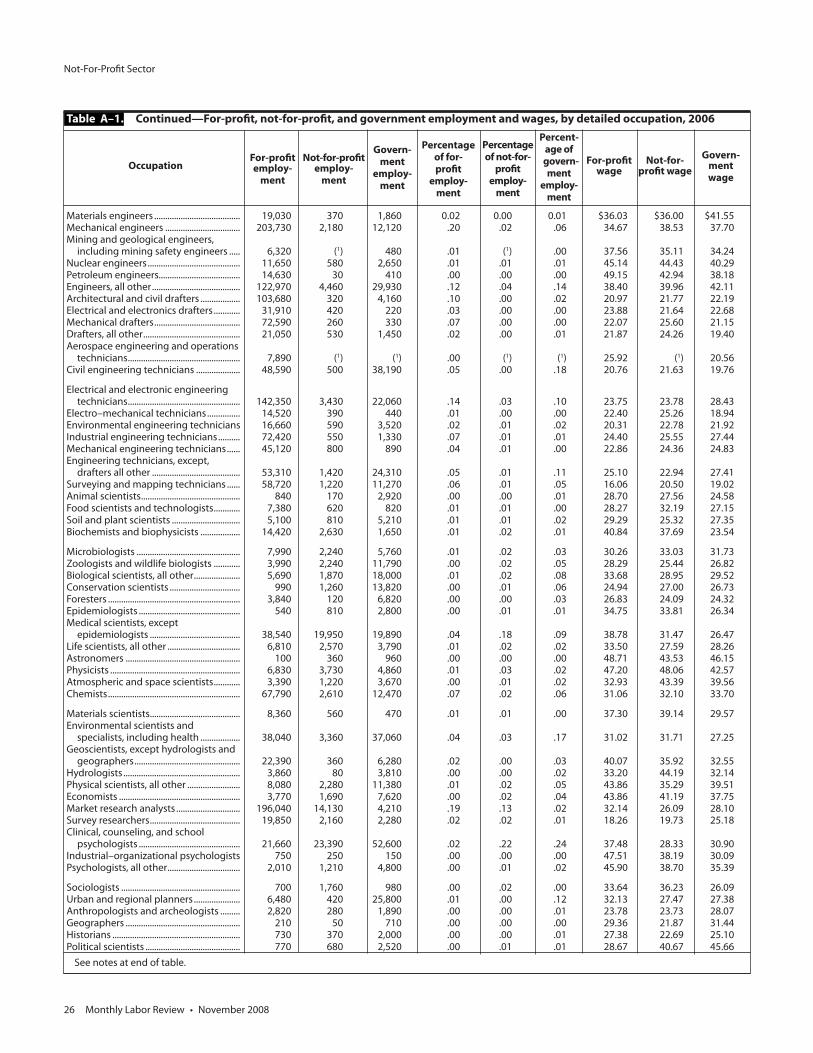
Table A–1. Continued—For-profit, not-for-profit, and government employment and wages, by detailed occupation, 2006
For-profit Not-for-profit Govern-
For-profit Not-for- Govern-
Occupation employ- employ-
ment
wage profit wage
ment
ment ment employ-
- wage
ment
Not-For-Profit Sector
26 Monthly Labor Review • November 2008
Materials engineers ....................................... 19,030 370 1,860 0.02 0.00 0.01 $36.03 $36.00 $41.55Mechanical engineers .................................. 203,730 2,180 12,120 .20 .02 .06 34.67 38.53 37.70Mining and geological engineers, including mining safety engineers ..... 6,320 (1) 480 .01 (1) .00 37.56 35.11 34.24Nuclear engineers .......................................... 11,650 580 2,650 .01 .01 .01 45.14 44.43 40.29Petroleum engineers..................................... 14,630 30 410 .00 .00 .00 49.15 42.94 38.18Engineers, all other ........................................ 122,970 4,460 29,930 .12 .04 .14 38.40 39.96 42.11Architectural and civil drafters .................. 103,680 320 4,160 .10 .00 .02 20.97 21.77 22.19Electrical and electronics drafters ............ 31,910 420 220 .03 .00 .00 23.88 21.64 22.68Mechanical drafters ....................................... 72,590 260 330 .07 .00 .00 22.07 25.60 21.15Drafters, all other ............................................ 21,050 530 1,450 .02 .00 .01 21.87 24.26 19.40Aerospace engineering and operations technicians ................................................... 7,890 (1) (1) .00 (1) (1) 25.92 (1) 20.56Civil engineering technicians .................... 48,590 500 38,190 .05 .00 .18 20.76 21.63 19.76
Electrical and electronic engineering technicians ................................................... 142,350 3,430 22,060 .14 .03 .10 23.75 23.78 28.43Electro–mechanical technicians ............... 14,520 390 440 .01 .00 .00 22.40 25.26 18.94Environmental engineering technicians 16,660 590 3,520 .02 .01 .02 20.31 22.78 21.92Industrial engineering technicians .......... 72,420 550 1,330 .07 .01 .01 24.40 25.55 27.44Mechanical engineering technicians ...... 45,120 800 890 .04 .01 .00 22.86 24.36 24.83Engineering technicians, except, drafters all other ........................................ 53,310 1,420 24,310 .05 .01 .11 25.10 22.94 27.41Surveying and mapping technicians ...... 58,720 1,220 11,270 .06 .01 .05 16.06 20.50 19.02Animal scientists ............................................. 840 170 2,920 .00 .00 .01 28.70 27.56 24.58Food scientists and technologists ............ 7,380 620 820 .01 .01 .00 28.27 32.19 27.15Soil and plant scientists ............................... 5,100 810 5,210 .01 .01 .02 29.29 25.32 27.35Biochemists and biophysicists .................. 14,420 2,630 1,650 .01 .02 .01 40.84 37.69 23.54
Microbiologists ............................................... 7,990 2,240 5,760 .01 .02 .03 30.26 33.03 31.73Zoologists and wildlife biologists ............ 3,990 2,240 11,790 .00 .02 .05 28.29 25.44 26.82Biological scientists, all other ..................... 5,690 1,870 18,000 .01 .02 .08 33.68 28.95 29.52Conservation scientists ................................ 990 1,260 13,820 .00 .01 .06 24.94 27.00 26.73Foresters ............................................................ 3,840 120 6,820 .00 .00 .03 26.83 24.09 24.32Epidemiologists .............................................. 540 810 2,800 .00 .01 .01 34.75 33.81 26.34Medical scientists, except epidemiologists ......................................... 38,540 19,950 19,890 .04 .18 .09 38.78 31.47 26.47Life scientists, all other ................................. 6,810 2,570 3,790 .01 .02 .02 33.50 27.59 28.26Astronomers .................................................... 100 360 960 .00 .00 .00 48.71 43.53 46.15Physicists ........................................................... 6,830 3,730 4,860 .01 .03 .02 47.20 48.06 42.57Atmospheric and space scientists ............ 3,390 1,220 3,670 .00 .01 .02 32.93 43.39 39.56Chemists ............................................................ 67,790 2,610 12,470 .07 .02 .06 31.06 32.10 33.70
Materials scientists......................................... 8,360 560 470 .01 .01 .00 37.30 39.14 29.57Environmental scientists and specialists, including health .................. 38,040 3,360 37,060 .04 .03 .17 31.02 31.71 27.25Geoscientists, except hydrologists and geographers ................................................ 22,390 360 6,280 .02 .00 .03 40.07 35.92 32.55Hydrologists ..................................................... 3,860 80 3,810 .00 .00 .02 33.20 44.19 32.14Physical scientists, all other ........................ 8,080 2,280 11,380 .01 .02 .05 43.86 35.29 39.51Economists ....................................................... 3,770 1,690 7,620 .00 .02 .04 43.86 41.19 37.75Market research analysts ............................. 196,040 14,130 4,210 .19 .13 .02 32.14 26.09 28.10Survey researchers ......................................... 19,850 2,160 2,280 .02 .02 .01 18.26 19.73 25.18Clinical, counseling, and school psychologists .............................................. 21,660 23,390 52,600 .02 .22 .24 37.48 28.33 30.90Industrial–organizational psychologists 750 250 150 .00 .00 .00 47.51 38.19 30.09Psychologists, all other ................................. 2,010 1,210 4,800 .00 .01 .02 45.90 38.70 35.39
Sociologists ...................................................... 700 1,760 980 .00 .02 .00 33.64 36.23 26.09Urban and regional planners ..................... 6,480 420 25,800 .01 .00 .12 32.13 27.47 27.38Anthropologists and archeologists ......... 2,820 280 1,890 .00 .00 .01 23.78 23.73 28.07Geographers .................................................... 210 50 710 .00 .00 .00 29.36 21.87 31.44Historians .......................................................... 730 370 2,000 .00 .00 .01 27.38 22.69 25.10Political scientists ........................................... 770 680 2,520 .00 .01 .01 28.67 40.67 45.66
See notes at end of table.
Table A–1. Continued—For-profit, not-for-profit, and government employment and wages, by detailed occupation, 2006
For-profit Not-for-profit
Govern-
For-profit Not-for-
Govern- Occupation
employ- employ- ment
wage profit wage ment
ment ment
employ-
wage ment
Percentageof for-profit
employ-ment
Percentageof not-for-
profitemploy-
ment
Percent-age of
govern-ment
employ-ment

Monthly Labor Review • November 2008 27
Social scientists and related workers, all other ......................................................... 9,080 4,880 17,470 0.01 0.04 0.08 $33.47 $34.55 $31.29Agricultural and food science technicians ................................................... 10,380 1,730 7,210 .01 .02 .03 16.23 16.78 15.94Biological technicians ................................... 28,180 18,340 25,530 .03 .17 .12 19.60 18.89 16.57Chemical technicians .................................... 56,620 2,050 2,420 .06 .02 .01 19.69 18.47 19.06Geological and petroleum technicians .. 10,790 60 430 .01 .00 .00 25.03 18.63 18.74Nuclear technicians ....................................... 5,990 320 100 .01 .00 .00 31.31 30.22 23.80Social science research assistants ............ 5,160 5,770 4,910 .01 .05 .02 18.69 16.50 16.54Environmental science and protection technicians, including health ............... 19,310 2,050 13,700 .02 .02 .06 18.77 16.37 20.48Forensic science technicians ...................... 1,700 220 10,540 .00 .00 .05 24.08 24.12 22.82Forest and conservation technicians ...... 980 380 29,240 .00 .00 .14 18.14 17.95 16.16Life, physical, and social science technicians, all other ............................... 22,730 11,080 25,410 .02 .10 .12 20.53 19.96 18.39
Substance abuse and behavioral disorder counselors .................................. 18,830 43,520 13,710 .02 .40 .06 17.13 16.63 19.54Educational, vocational, and school counselors .................................................... 21,780 45,840 161,300 .02 .42 .75 19.81 19.22 25.70Marriage and family therapists ................. 6,200 9,080 6,080 .01 .08 .03 20.31 20.09 24.73Mental health counselors ............................ 23,810 54,330 13,770 .02 .50 .06 18.83 16.87 22.27Rehabilitation counselors ........................... 23,980 71,700 26,030 .02 .66 .12 16.52 13.92 20.32Counselors, all other ..................................... 3,580 9,170 11,920 .00 .08 .06 18.26 17.28 20.98Child, family, and school social workers .......................................................... 22,230 95,170 149,570 .02 .88 .70 17.56 16.64 21.52Medical and public health social workers .......................................................... 35,820 58,820 22,670 .04 .54 .11 21.69 21.14 21.81Mental health and substance abuse social workers ............................................. 23,510 67,100 24,450 .02 .62 .11 19.04 17.37 19.87Social workers, all other ............................... 8,050 20,310 33,980 .01 .19 .16 19.31 18.76 23.61Health educators ............................................ 10,260 29,170 18,740 .01 .27 .09 21.12 20.23 24.51
Probation officers and correctional treatment specialists ............................... 1,720 900 87,880 .00 .01 .41 15.32 14.26 22.31Social and human service assistants ....... 54,270 167,890 103,070 .05 1.55 .48 12.58 12.13 14.68Community and social service specialists, all other ................................... 14,640 45,900 48,640 .01 .42 .23 16.64 16.55 19.51Clergy ................................................................. 15,050 19,400 3,520 .01 .18 .02 19.91 20.65 24.08Directors, religious activities and education ..................................................... 6,890 7,460 420 .01 .07 .00 16.93 18.47 29.33Religious workers, all other......................... 2,280 3,610 130 .00 .03 .00 13.15 14.48 19.40Lawyers .............................................................. 418,460 17,210 115,270 .41 .16 .54 58.09 41.08 43.50Arbitrators, mediators, and conciliators . 2,900 2,620 2,710 .00 .02 .01 27.59 28.07 28.70Paralegals and legal assistants .................. 191,480 5,160 33,550 .19 .05 .16 21.61 20.37 23.35Court reporters ............................................... 6,370 (1) 10,290 .00 (1) .00 21.31 (1) 24.55Law clerks .......................................................... 18,270 370 13,350 .02 .00 .06 18.38 13.98 19.62
Title examiners, abstractors, and searchers ....................................................... 61,640 220 1,740 .06 .00 .01 19.53 18.60 19.85Legal support workers, all other ............... 12,920 1,180 24,980 .01 .01 .12 22.59 18.14 25.42Business teachers, postsecondary ........... 6,020 22,300 39,700 .01 .21 .18 60,110 72,810 69,890Computer science teachers, postsecondary ........................................... 4,820 8,030 24,000 .00 .07 .11 58,780 73,950 63,050Mathematical science teachers, postsecondary ........................................... 1,660 10,320 32,870 .00 .10 .15 61,290 65,490 61,930Architecture teachers, postsecondary .... 300 1,810 3,760 .00 .02 .02 64,340 71,870 65,020Engineering teachers, postsecondary .... 890 7,700 23,580 .00 .07 .11 78,170 87,320 80,200Agricultural sciences teachers, postsecondary ............................................ 80 950 9,120 .00 .01 .04 61,480 72,470 77,750Biological science teachers, postsecondary ............................................ 880 15,610 35,700 .00 .14 .17 73,770 81,840 82,260Forestry and conservation science teachers, postsecondary ........................ (1) 440 2,170 (1) .00 .00 (1) 58,360 68,990
See notes at end of table.
Table A–1. Continued—For-profit, not-for-profit, and government employment and wages, by detailed occupation, 2006
For-profit Not-for-profit Govern-
For-profit Not-for- Govern-
Occupation employ- employ-
ment
wage profit wage
ment
ment ment employ-
wage
ment
Percentageof for-profit
employ-ment
Percentageof not-for-
profitemploy-
ment
Percent-age of
govern-ment
employ-ment

Not-For-Profit Sector
28 Monthly Labor Review • November 2008
Atmospheric, earth, marine, and space sciences teachers, postsecondary ....... 260 1,970 6,480 0.00 0.02 0.03 $73,290 $78,260 $73,890Chemistry teachers, postsecondary ........ 1,010 6,870 11,840 .00 .06 .06 68,680 72,440 68,680Environmental science teachers, postsecondary ............................................ 110 1,650 2,570 .00 .02 .01 60,500 69,490 73,970Physics teachers, postsecondary .............. 210 4,190 8,000 .00 .04 .04 77,480 78,370 72,500Anthropology and archeology teachers, postsecondary ............................................ 70 1,710 3,300 .00 .02 .02 70,240 72,800 65,770Area, ethnic, and cultural studies teachers, postsecondary ......................... 180 2,860 4,340 .00 .03 .02 62,920 67,580 61,200Economics teachers, postsecondary ....... 300 4,340 7,770 .00 .04 .04 72,890 85,730 75,810Geography teachers, postsecondary ...... 130 780 3,170 .00 .01 .01 60,180 64,710 62,500Political science teachers, p ostsecondary............................................... 330 5,030 8,520 .00 .05 .04 71,400 71,750 67,270Psychology teachers, postsecondary ...... 1,250 10,350 18,190 .00 .10 .08 65,150 66,490 63,380
Sociology teachers, postsecondary ......... 430 5,720 9,990 .00 .05 .05 62,310 67,400 60,730Social sciences teachers, postsecondary, all other ........................................................ 430 1,590 3,830 .00 .00 .00 49,620 73,510 70,130Health specialties teachers, postsecondary ........................................... 8,720 41,080 68,140 .01 .38 .32 61,590 95,580 91,680Nursing instructors and teachers, postsecondary ........................................... 4,090 11,190 24,270 .00 .10 .11 55,420 60,870 58,070Education teachers, postsecondary ........ 3,740 17,760 32,370 .00 .16 .15 53,090 56,110 58,600Library science teachers, postsecondary ............................................ 40 880 2,950 .00 .01 .01 56,630 53,960 58,490Criminal justice and law enforcement teachers, postsecondary ......................... 400 2,080 7,960 .00 .02 .04 55,330 53,030 55,880Law teachers, postsecondary .................... 940 6,240 4,790 .00 .06 .02 71,870 95,680 96,300Social work teachers, postsecondary ...... 110 2,620 5,170 .00 .02 .02 54,710 59,630 57,190Art, drama, and music teachers, postsecondary ............................................ 6,230 29,980 36,120 .01 .28 .17 55,630 59,630 57,500
Communications teachers, postsecondary ............................................ 1,010 6,790 15,910 .00 .06 .07 52,110 57,510 56,480English language and literature teachers, postsecondary ......................... 2,600 15,800 41,220 .00 .15 .19 56,410 59,650 56,430Foreign language and literature teachers, postsecondary ......................... 2,290 9,470 13,120 .00 .09 .06 41,180 66,700 58,340History teachers, postsecondary .............. 550 7,570 12,940 .00 .07 .06 63,760 67,470 60,560Philosophy and religion teachers, postsecondary ............................................ 930 10,430 6,570 .00 .10 .03 54,710 59,750 61,520Graduate teaching assistants ..................... 960 25,550 86,620 .00 .24 .40 28,320 32,600 29,480Home economics teachers, postsecondary ............................................ 130 500 3,720 .00 .00 .02 46,500 62,050 60,890Recreation and fitness studies teachers, postsecondary ............................................ 1,440 4,370 11,380 .00 .04 .05 47,630 50,130 56,330Vocational education teachers, postsecondary ............................................ 43,660 12,880 54,690 .04 .12 .25 20.25 24.61 23.81Postsecondary teachers, all other ............ 14,570 77,750 182,640 .01 .72 .85 69,280 77,640 70,060Preschool teachers, except special education ..................................................... 195,330 119,920 48,640 .19 1.11 .23 10.50 12.45 20.17
Kindergarten teachers, except special education ..................................................... 11,740 14,550 140,080 .01 .13 .65 32,220 36,730 49,250Elementary school teachers, except special education ...................................... 66,520 86,710 1,379,610 .07 .80 6.41 38,520 41,150 49,330Middle school teachers, except special and vocational education ........ 19,890 42,800 594,870 .02 .39 2.77 40,950 44,210 49,960Vocational education teachers, ................. middle school ............................................. 290 1,020 14,550 .00 .01 .07 38,190 40,540 47,180Secondary school teachers, except special and vocational education ........ 28,960 76,490 938,890 .03 .70 4.37 46,060 47,250 51,310
See notes at end of table.
Table A–1. Continued—For-profit, not-for-profit, and government employment and wages, by detailed occupation, 2006
For-profit Not-for-profit Govern-
For-profit Not-for- Govern-
Occupation employ- employ-
ment
wage profit wage
ment
ment ment employ-
- wage
ment
Percentageof for-profit
employ-ment
Percentageof not-for-
profitemploy-
ment
Percent-age of
govern-ment
employ-ment
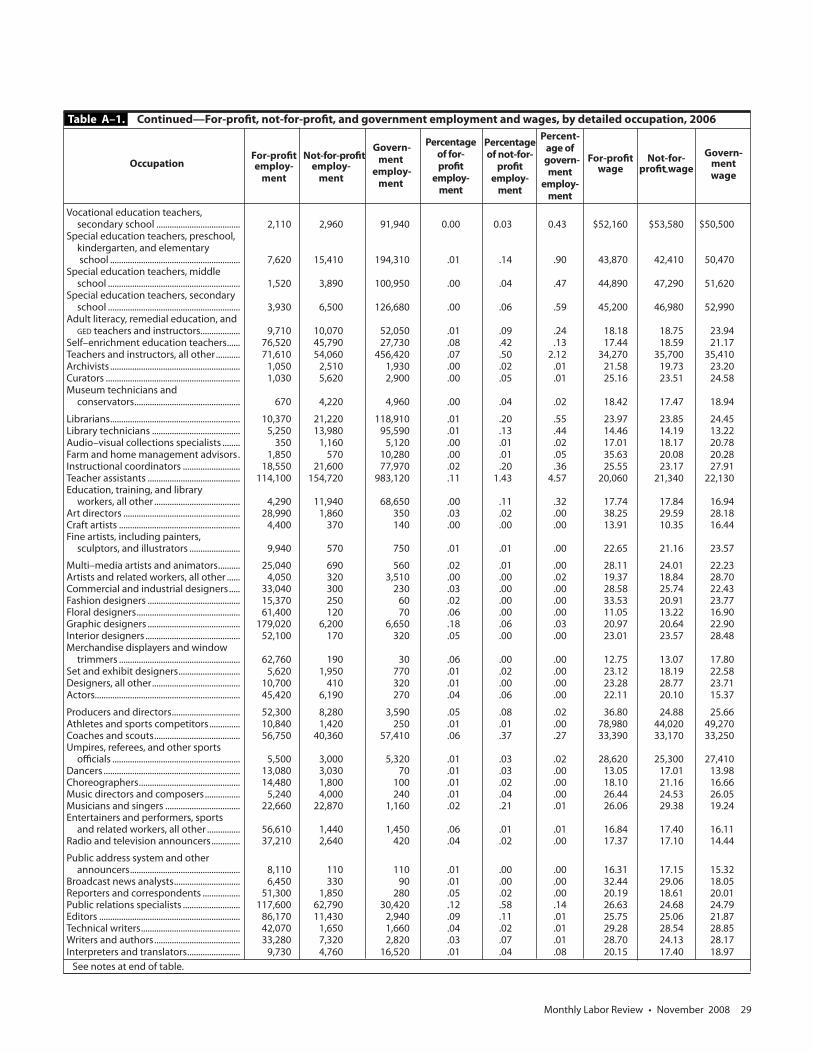
Monthly Labor Review • November 2008 29
Vocational education teachers, secondary school ...................................... 2,110 2,960 91,940 0.00 0.03 0.43 $52,160 $53,580 $50,500Special education teachers, preschool, kindergarten, and elementary school ........................................................... 7,620 15,410 194,310 .01 .14 .90 43,870 42,410 50,470Special education teachers, middle school ............................................................ 1,520 3,890 100,950 .00 .04 .47 44,890 47,290 51,620Special education teachers, secondary school ............................................................ 3,930 6,500 126,680 .00 .06 .59 45,200 46,980 52,990Adult literacy, remedial education, and GED teachers and instructors .................. 9,710 10,070 52,050 .01 .09 .24 18.18 18.75 23.94Self–enrichment education teachers ...... 76,520 45,790 27,730 .08 .42 .13 17.44 18.59 21.17Teachers and instructors, all other ........... 71,610 54,060 456,420 .07 .50 2.12 34,270 35,700 35,410Archivists ........................................................... 1,050 2,510 1,930 .00 .02 .01 21.58 19.73 23.20Curators ............................................................. 1,030 5,620 2,900 .00 .05 .01 25.16 23.51 24.58Museum technicians and conservators ................................................ 670 4,220 4,960 .00 .04 .02 18.42 17.47 18.94
Librarians ........................................................... 10,370 21,220 118,910 .01 .20 .55 23.97 23.85 24.45Library technicians ........................................ 5,250 13,980 95,590 .01 .13 .44 14.46 14.19 13.22Audio–visual collections specialists ........ 350 1,160 5,120 .00 .01 .02 17.01 18.17 20.78Farm and home management advisors . 1,850 570 10,280 .00 .01 .05 35.63 20.08 20.28Instructional coordinators .......................... 18,550 21,600 77,970 .02 .20 .36 25.55 23.17 27.91Teacher assistants .......................................... 114,100 154,720 983,120 .11 1.43 4.57 20,060 21,340 22,130Education, training, and library workers, all other ....................................... 4,290 11,940 68,650 .00 .11 .32 17.74 17.84 16.94Art directors ..................................................... 28,990 1,860 350 .03 .02 .00 38.25 29.59 28.18Craft artists ....................................................... 4,400 370 140 .00 .00 .00 13.91 10.35 16.44Fine artists, including painters, sculptors, and illustrators ....................... 9,940 570 750 .01 .01 .00 22.65 21.16 23.57
Multi–media artists and animators .......... 25,040 690 560 .02 .01 .00 28.11 24.01 22.23Artists and related workers, all other ...... 4,050 320 3,510 .00 .00 .02 19.37 18.84 28.70Commercial and industrial designers ..... 33,040 300 230 .03 .00 .00 28.58 25.74 22.43Fashion designers .......................................... 15,370 250 60 .02 .00 .00 33.53 20.91 23.77Floral designers ............................................... 61,400 120 70 .06 .00 .00 11.05 13.22 16.90Graphic designers .......................................... 179,020 6,200 6,650 .18 .06 .03 20.97 20.64 22.90Interior designers ........................................... 52,100 170 320 .05 .00 .00 23.01 23.57 28.48Merchandise displayers and window trimmers ....................................................... 62,760 190 30 .06 .00 .00 12.75 13.07 17.80Set and exhibit designers ............................ 5,620 1,950 770 .01 .02 .00 23.12 18.19 22.58Designers, all other ........................................ 10,700 410 320 .01 .00 .00 23.28 28.77 23.71Actors.................................................................. 45,420 6,190 270 .04 .06 .00 22.11 20.10 15.37
Producers and directors ............................... 52,300 8,280 3,590 .05 .08 .02 36.80 24.88 25.66Athletes and sports competitors .............. 10,840 1,420 250 .01 .01 .00 78,980 44,020 49,270Coaches and scouts ....................................... 56,750 40,360 57,410 .06 .37 .27 33,390 33,170 33,250Umpires, referees, and other sports officials .......................................................... 5,500 3,000 5,320 .01 .03 .02 28,620 25,300 27,410Dancers .............................................................. 13,080 3,030 70 .01 .03 .00 13.05 17.01 13.98Choreographers .............................................. 14,480 1,800 100 .01 .02 .00 18.10 21.16 16.66Music directors and composers ................ 5,240 4,000 240 .01 .04 .00 26.44 24.53 26.05Musicians and singers .................................. 22,660 22,870 1,160 .02 .21 .01 26.06 29.38 19.24Entertainers and performers, sports and related workers, all other ............... 56,610 1,440 1,450 .06 .01 .01 16.84 17.40 16.11Radio and television announcers ............. 37,210 2,640 420 .04 .02 .00 17.37 17.10 14.44
Public address system and other announcers .................................................. 8,110 110 110 .01 .00 .00 16.31 17.15 15.32Broadcast news analysts .............................. 6,450 330 90 .01 .00 .00 32.44 29.06 18.05Reporters and correspondents ................. 51,300 1,850 280 .05 .02 .00 20.19 18.61 20.01Public relations specialists .......................... 117,600 62,790 30,420 .12 .58 .14 26.63 24.68 24.79Editors ................................................................ 86,170 11,430 2,940 .09 .11 .01 25.75 25.06 21.87Technical writers ............................................. 42,070 1,650 1,660 .04 .02 .01 29.28 28.54 28.85Writers and authors ....................................... 33,280 7,320 2,820 .03 .07 .01 28.70 24.13 28.17Interpreters and translators ........................ 9,730 4,760 16,520 .01 .04 .08 20.15 17.40 18.97
See notes at end of table.
Table A–1. Continued—For-profit, not-for-profit, and government employment and wages, by detailed occupation, 2006
For-profit Not-for-profit Govern-
For-profit Not-for- Govern-
Occupation employ- employ-
ment
wage profit wage
ment
ment ment employ-
- wage
ment
Percentageof for-profit
employ-ment
Percentageof not-for-
profitemploy-
ment
Percent-age of
govern-ment
employ-ment

Not-For-Profit Sector
30 Monthly Labor Review • November 2008
Media and communication workers, all other ......................................................... 16,010 3,010 4,170 0.02 .03 0.02 $23.11 $21.09 $19.46Audio and video equipment technicians .................................................. 30,840 4,150 5,840 .03 .04 .03 19.03 16.57 17.21Broadcast technicians ................................... 27,180 2,700 2,680 .03 .02 .01 16.63 17.69 19.71Radio operators .............................................. 470 40 930 .00 .00 .00 17.68 20.08 16.71Sound engineering technicians ................ 12,970 990 220 .01 .01 .00 24.45 20.16 19.25Photographers ................................................ 58,280 1,080 1,180 .06 .01 .01 15.09 21.76 19.75Camera operators, television, video, and motion picture ................................... 19,970 1,310 1,140 .02 .01 .01 22.50 15.13 23.13Film and video editors .................................. 16,900 410 130 .02 .00 .00 28.17 18.19 19.76Media and communication equipment workers, all other ....................................... 9,460 2,170 6,350 .01 .02 .03 22.58 23.97 30.22Chiropractors ................................................... 24,870 510 90 .02 .00 .00 39.09 35.93 24.86
Dentists, general ............................................. 80,710 3,260 2,350 .08 .03 .01 68.76 55.55 47.14Oral and maxillofacial surgeons................ 5,030 250 50 .00 .00 .00 80.94 50.56 47.32Orthodontists .................................................. 5,120 (1) (1) .01 (1) (1) 85.64 53.80 (1)Prosthodontists ............................................... 450 (1) (1) .00 (1) (1) 78.39 47.26 (1)Dentists, all other specialists ...................... 1,880 200 2,530 .00 .00 .01 74.59 40.17 36.15Dietitians and nutritionists ......................... 19,780 19,000 12,980 .02 .18 .06 23.22 22.84 22.67Optometrists .................................................... 22,910 1,040 410 .02 .01 .00 47.47 49.02 31.09Pharmacists ...................................................... 181,900 41,510 18,220 .18 .38 .08 45.17 44.18 42.73Anesthesiologists ........................................... 24,420 4,440 1,210 .02 .04 .01 91.74 76.56 64.78Family and general practitioners .............. 69,750 27,880 12,580 .07 .26 .06 76.00 68.08 56.96Internists, general .......................................... 34,750 12,450 1,670 .03 .11 .01 81.79 66.30 62.94
Obstetricians and gynecologists .............. 18,010 3,900 650 .02 .04 .00 88.00 78.53 59.79Pediatricians, general.................................... 19,230 8,390 1,450 .02 .08 .01 70.07 63.47 64.46Psychiatrists ...................................................... 10,260 8,380 6,170 .01 .08 .03 77.59 70.35 65.11Surgeons ........................................................... 41,780 8,060 2,140 .04 .07 .01 91.04 79.51 72.79Physicians and surgeons, all other ........... 99,800 62,410 48,110 .10 .58 .22 84.26 59.60 45.83Physician assistants ....................................... 39,570 17,430 6,060 .04 .16 .03 35.59 35.90 35.65Podiatrists ......................................................... 7,640 730 670 .01 .01 .00 58.92 50.73 41.53Registered nurses ........................................... 829,950 1,164,360 439,300 .82 10.73 2.04 28.34 29.07 27.88Audiologists ..................................................... 6,920 2,170 1,830 .01 .02 .01 30.21 28.37 27.43Occupational therapists............................... 40,730 29,160 18,910 .04 .27 .09 31.88 28.93 27.69
Physical therapists ......................................... 91,700 48,910 16,130 .09 .45 .07 33.37 31.98 30.56Radiation therapists ...................................... 4,150 8,240 1,920 .00 .08 .01 34.86 31.78 30.33Recreational therapists ................................ 8,420 8,570 7,200 .01 .08 .03 16.11 17.02 19.85Respiratory therapists................................... 33,350 54,080 12,360 .03 .50 .06 23.32 23.45 22.60Speech–language pathologists ................ 26,610 18,240 53,950 .03 .17 .25 33.41 29.60 27.06Therapists, all other ....................................... 4,730 5,390 1,590 .00 .05 .01 21.92 20.35 25.14Veterinarians .................................................... 46,310 1,140 2,380 .05 .01 .01 39.53 33.90 34.55Health diagnosing and treating practitioners, all other ............................. 19,480 17,740 16,130 .02 .16 .08 52.94 29.75 35.42Medical and clinical laboratory technologists .............................................. 55,940 81,320 27,110 .06 .75 .13 23.86 24.20 23.99Medical and clinical laboratory technicians ................................................... 63,480 59,570 22,180 .06 .55 .10 15.90 17.20 17.13
Dental hygienists ............................................ 162,610 2,310 1,570 .16 .02 .01 30.11 27.13 23.32Cardiovascular technologists and technicians .......................................... 14,010 24,920 5,210 .01 .23 .02 21.65 20.94 20.20Diagnostic medical sonographers ........... 20,140 20,330 4,080 .02 .19 .02 27.89 27.99 27.09Nuclear medicine technologists ............... 7,460 10,000 1,940 .01 .09 .01 30.70 30.16 28.58Radiologic technologists and technicians ................................................... 81,230 87,830 22,720 .08 .81 .11 23.25 24.06 23.09Emergency medical technicians and paramedics .................................................. 76,080 49,380 73,080 .08 .46 .34 13.15 13.76 15.23Dietetic technicians ....................................... 8,540 11,440 4,560 .01 .11 .02 11.85 12.99 12.64Pharmacy technicians .................................. 230,410 38,300 15,680 .23 .35 .07 12.29 14.34 15.10
See notes at end of table.
Table A–1. Continued—For-profit, not-for-profit, and government employment and wages, by detailed occupation, 2006
For-profit Not-for-profit Govern-
For-profit Not-for- Govern-
Occupation employ- employ-
ment
wage profit wage
ment
ment ment employ-
wage
ment
Percentageof for-profit
employ-ment
Percentageof not-for-
profitemploy-
ment
Percent-age of
govern-ment
employ-ment

Monthly Labor Review • November 2008 31
Psychiatric technicians ................................. 15,120 13,620 30,340 0.01 0.13 0.14 $12.90 $13.27 $16.11Respiratory therapy technicians ............... 5,360 10,490 3,300 .01 .10 .02 18.62 19.44 17.86Surgical technologists .................................. 31,630 43,180 10,220 .03 .40 .05 18.20 18.00 16.44Veterinary technologists and technicians ................................................... 65,350 1,930 2,560 .06 .02 .01 13.15 15.03 16.92Licensed practical and licensed vocational nurses ...................................... 419,690 212,350 96,550 .41 1.96 .45 18.28 17.78 16.77Medical records and health information technicians .......................... 80,470 63,590 21,710 .08 .59 .10 13.66 14.89 16.12Opticians, dispensing ................................... 64,490 1,180 130 .06 .01 .00 15.41 17.49 16.01Orthotists and prosthetists ......................... 4,100 630 590 .00 .01 .00 30.83 24.29 28.68Health technologists and technicians, all other ......................................................... 33,360 28,890 10,360 .03 .27 .05 17.64 18.77 19.46Occupational health and safety specialists ..................................................... 19,130 3,300 20,160 .02 .03 .09 29.23 28.78 27.60Occupational health and safety technicians ................................................... 5,710 1,330 3,020 .01 .01 .01 22.32 18.40 20.64Athletic trainers .............................................. 7,370 4,470 3,620 .01 .04 .02 36,890 38,520 43,250Healthcare practitioners and technical workers, all other ....................................... 21,040 19,150 10,650 .02 .18 .05 20.65 20.83 25.18Home health aides ......................................... 471,040 245,180 36,690 .46 2.26 .17 9.27 9.97 12.45
Nursing aides, orderlies, and attendants .................................................... 727,130 499,070 152,340 .72 4.60 .71 10.58 11.47 11.79Psychiatric aides ............................................. 13,110 12,260 31,910 .01 .11 .15 10.52 11.36 12.84Occupational therapist assistants ............ 12,950 7,550 3,250 .01 .07 .02 21.20 18.90 19.43Occupational therapist aides ..................... 3,810 2,630 1,370 .00 .02 .01 13.62 12.40 14.35Physical therapist assistants ....................... 38,510 16,940 4,320 .04 .16 .02 20.08 19.37 19.47Physical therapist aides ................................ 31,770 10,690 3,110 .03 .10 .01 11.11 11.79 10.03Massage therapists ........................................ 40,140 1,590 390 .04 .01 .00 18.83 20.21 19.72Dental assistants ............................................. 266,370 6,400 7,190 .26 .06 .03 14.76 14.06 15.30Medical assistants .......................................... 315,340 75,720 19,060 .31 .70 .09 12.88 13.52 14.46Medical equipment preparers ................... 13,910 24,040 4,910 .01 .22 .02 12.78 13.15 12.51Medical transcriptionists ............................. 46,580 33,670 6,710 .05 .31 .03 14.61 15.00 14.22
Pharmacy aides ............................................... 46,080 3,070 930 .05 .03 .00 9.75 12.20 12.18Veterinary assistants and laboratory animal caretakers ...................................... 64,210 3,760 2,540 .06 .03 .01 9.88 12.23 12.98Healthcare support workers, all other .... 81,870 71,260 33,830 .08 .66 .16 13.05 13.43 14.86First–line supervisors/managers of correctional officers ............................. 1,060 80 36,410 .00 .00 .17 20.78 21.78 26.40First–line supervisors/managers of police and detectives .......................... 30 510 91,530 .00 .00 .43 28.27 31.34 33.20First–line supervisors/managers of fire fighting and prevention workers .......................................................... 580 200 50,370 .00 .00 .23 26.81 21.06 31.26First–line supervisors/managers, protective service workers, all other ......................................................... 31,110 4,320 10,840 .03 .04 .05 20.20 21.64 27.39Fire fighters ....................................................... 5,290 2,630 277,940 .01 .02 1.29 16.84 13.34 20.44Fire inspectors and investigators .............. 1,280 60 12,120 .00 .00 .06 22.20 21.77 24.13Forest fire inspectors and prevention specialists ..................................................... 30 (1) 1,680 .00 (1) .00 14.08 (1) 17.28
Correctional officers and jailers................. 15,110 960 409,010 .01 .01 1.90 13.56 12.70 18.48Detectives and criminal investigators .... (1) 60 (1) (1) .00 (1) (1) 30.40 (1)Parking enforcement workers ................... 330 290 9,500 .00 .00 .04 14.70 10.81 15.16Police and sheriff’s patrol officers............. 230 3,640 642,600 .00 .03 2.99 20.22 21.45 22.93Transit and railroad police........................... (1) (1) 3,870 (1) (1) .00 23.81 (1) 23.74Animal control workers ................................ 80 1,470 13,070 .00 .01 .06 13.88 12.37 14.31Private detectives and investigators ....... 31,810 560 3,730 .03 .01 .02 17.91 24.29 21.51Gaming surveillance officers and gaming investigators ...................... 4,070 50 4,520 .00 .00 .02 13.64 14.55 15.42
See notes at end of table.
Percentageof for-profit
employ-ment
Percentageof not-for-
profitemploy-
ment
Percent-age of
govern-ment
employ-ment
Occupation
Table A–1. Continued—For-profit, not-for-profit, and government employment and wages, by detailed occupation, 2006
For-profit Not-for-profit
Govern-
For-profit Not-for-
Govern- employ- employ-
ment
wage profit wage
ment
ment ment employ-
wage
ment
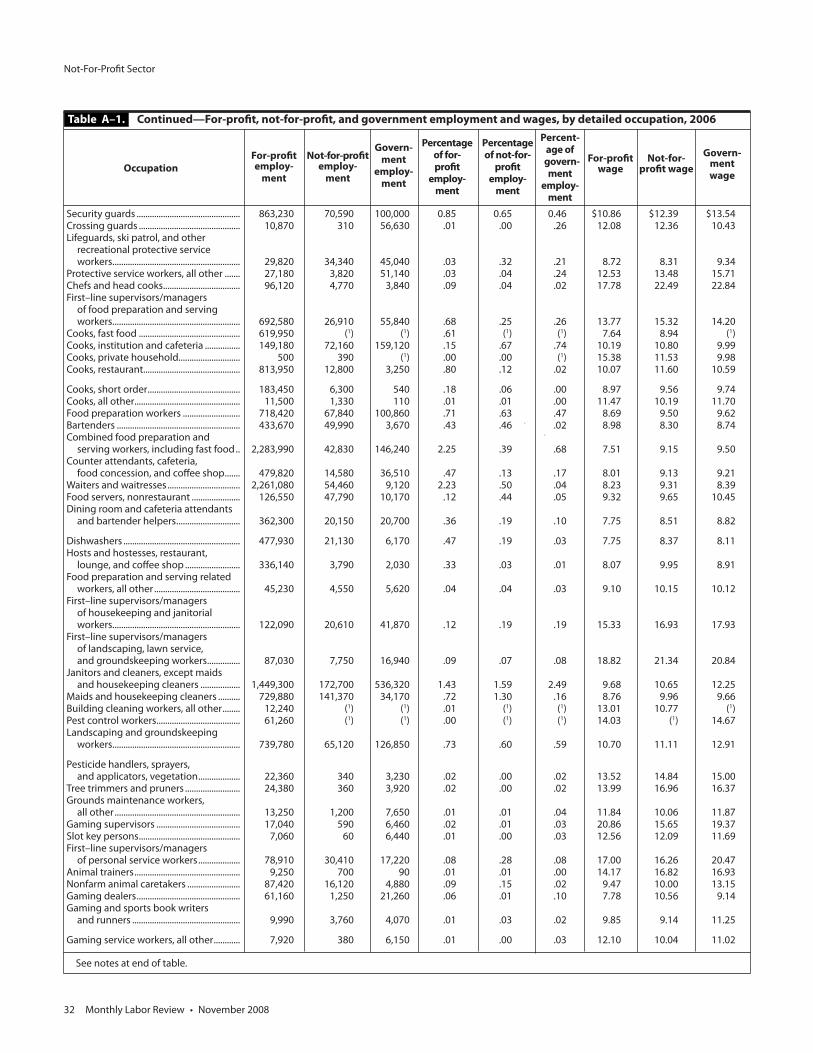
Not-For-Profit Sector
32 Monthly Labor Review • November 2008
Security guards ............................................... 863,230 70,590 100,000 0.85 0.65 0.46 $10.86 $12.39 $13.54Crossing guards .............................................. 10,870 310 56,630 .01 .00 .26 12.08 12.36 10.43Lifeguards, ski patrol, and other recreational protective service workers .......................................................... 29,820 34,340 45,040 .03 .32 .21 8.72 8.31 9.34Protective service workers, all other ....... 27,180 3,820 51,140 .03 .04 .24 12.53 13.48 15.71Chefs and head cooks ................................... 96,120 4,770 3,840 .09 .04 .02 17.78 22.49 22.84First–line supervisors/managers of food preparation and serving workers .......................................................... 692,580 26,910 55,840 .68 .25 .26 13.77 15.32 14.20Cooks, fast food .............................................. 619,950 (1) (1) .61 (1) (1) 7.64 8.94 (1)Cooks, institution and cafeteria ................ 149,180 72,160 159,120 .15 .67 .74 10.19 10.80 9.99Cooks, private household............................ 500 390 (1) .00 .00 (1) 15.38 11.53 9.98Cooks, restaurant............................................ 813,950 12,800 3,250 .80 .12 .02 10.07 11.60 10.59
Cooks, short order .......................................... 183,450 6,300 540 .18 .06 .00 8.97 9.56 9.74Cooks, all other ................................................ 11,500 1,330 110 .01 .01 .00 11.47 10.19 11.70Food preparation workers .......................... 718,420 67,840 100,860 .71 .63 .47 8.69 9.50 9.62Bartenders ........................................................ 433,670 49,990 3,670 .43 .46 .02 8.98 8.30 8.74Combined food preparation and serving workers, including fast food .. 2,283,990 42,830 146,240 2.25 .39 .68 7.51 9.15 9.50Counter attendants, cafeteria, food concession, and coffee shop ....... 479,820 14,580 36,510 .47 .13 .17 8.01 9.13 9.21Waiters and waitresses ................................. 2,261,080 54,460 9,120 2.23 .50 .04 8.23 9.31 8.39Food servers, nonrestaurant ...................... 126,550 47,790 10,170 .12 .44 .05 9.32 9.65 10.45Dining room and cafeteria attendants and bartender helpers ............................. 362,300 20,150 20,700 .36 .19 .10 7.75 8.51 8.82
Dishwashers ..................................................... 477,930 21,130 6,170 .47 .19 .03 7.75 8.37 8.11Hosts and hostesses, restaurant, lounge, and coffee shop ......................... 336,140 3,790 2,030 .33 .03 .01 8.07 9.95 8.91Food preparation and serving related workers, all other ....................................... 45,230 4,550 5,620 .04 .04 .03 9.10 10.15 10.12First–line supervisors/managers of housekeeping and janitorial workers .......................................................... 122,090 20,610 41,870 .12 .19 .19 15.33 16.93 17.93First–line supervisors/managers of landscaping, lawn service, and groundskeeping workers ............... 87,030 7,750 16,940 .09 .07 .08 18.82 21.34 20.84Janitors and cleaners, except maids and housekeeping cleaners .................. 1,449,300 172,700 536,320 1.43 1.59 2.49 9.68 10.65 12.25Maids and housekeeping cleaners .......... 729,880 141,370 34,170 .72 1.30 .16 8.76 9.96 9.66Building cleaning workers, all other ........ 12,240 (1) (1) .01 (1) (1) 13.01 10.77 (1)Pest control workers ...................................... 61,260 (1) (1) .00 (1) (1) 14.03 (1) 14.67Landscaping and groundskeeping workers .......................................................... 739,780 65,120 126,850 .73 .60 .59 10.70 11.11 12.91
Pesticide handlers, sprayers, and applicators, vegetation ................... 22,360 340 3,230 .02 .00 .02 13.52 14.84 15.00Tree trimmers and pruners ......................... 24,380 360 3,920 .02 .00 .02 13.99 16.96 16.37Grounds maintenance workers, all other ......................................................... 13,250 1,200 7,650 .01 .01 .04 11.84 10.06 11.87Gaming supervisors ...................................... 17,040 590 6,460 .02 .01 .03 20.86 15.65 19.37Slot key persons .............................................. 7,060 60 6,440 .01 .00 .03 12.56 12.09 11.69First–line supervisors/managers of personal service workers ................... 78,910 30,410 17,220 .08 .28 .08 17.00 16.26 20.47Animal trainers ................................................ 9,250 700 90 .01 .01 .00 14.17 16.82 16.93Nonfarm animal caretakers ........................ 87,420 16,120 4,880 .09 .15 .02 9.47 10.00 13.15Gaming dealers ............................................... 61,160 1,250 21,260 .06 .01 .10 7.78 10.56 9.14Gaming and sports book writers and runners ................................................. 9,990 3,760 4,070 .01 .03 .02 9.85 9.14 11.25
Gaming service workers, all other ............ 7,920 380 6,150 .01 .00 .03 12.10 10.04 11.02
See notes at end of table.
Table A–1. Continued—For-profit, not-for-profit, and government employment and wages, by detailed occupation, 2006
For-profit Not-for-profit Govern-
For-profit Not-for- Govern-
employ- employ- ment
wage profit wage ment
ment ment
employ-
wage ment
Percentageof for-profit
employ-ment
Percentageof not-for-
profitemploy-
ment
Percent-age of
govern-ment
employ-ment
Occupation

Monthly Labor Review • November 2008 33
Motion picture projectionists .................... 10,370 360 (1) 0.01 0.00 (1) $9.58 $11.68 $15.04Ushers, lobby attendants, and ticket takers ........................................ 88,650 9,600 4,440 .09 .09 .02 8.24 9.34 9.26Amusement and recreation attendants .................................................... 164,180 24,950 47,270 .16 .23 .22 8.15 8.44 9.37Costume attendants ..................................... 2,630 1,190 330 .00 .01 .00 14.44 14.11 12.61Locker room, coatroom, and dressing room attendants ........................................ 14,120 3,850 860 .01 .04 .00 9.33 9.93 10.29Entertainment attendants and related workers, all other ............... (1) 5,630 (1) (1) .00 (1) (1) 8.36 10.59Embalmers ........................................................ 8,780 80 (1) .01 .00 (1) 19.44 18.07 17.95Funeral attendants......................................... 32,620 90 (1) .03 .00 (1) 10.52 12.95 (1)Barbers ............................................................... 11,360 50 180 .01 .00 .00 12.68 13.00 15.67Hairdressers, hairstylists, and cosmetologists .................................. 345,940 990 360 .34 .01 .00 11.78 12.08 12.93
Makeup artists, theatrical and performance ....................................... 1,080 190 (1) .00 .00 (1) 16.98 21.43 (1)Manicurists and pedicurists........................ 47,640 (1) (1) .05 (1) (1) 10.22 11.78 (1)Shampooers ..................................................... 15,660 (1) (1) .00 (1) (1) 8.19 (1) (1)Skin care specialists ....................................... 23,080 110 (1) .02 .00 (1) 14.06 15.79 16.50Baggage porters and bellhops .................. 47,330 400 1,110 .05 .00 .01 10.33 10.26 11.08Concierges ........................................................ 18,040 620 740 .02 .01 .00 12.62 11.08 10.08Tour guides and escorts ............................... 16,640 11,150 3,040 .02 .10 .01 11.02 9.72 12.56Travel guides .................................................... 3,100 120 60 .00 .00 .00 14.92 12.93 11.17Flight attendants ............................................ 96,940 (1) (1) .00 (1) (1) (1) (1) (1)Transportation attendants, except flight attendants and baggage porters ............................... 16,490 370 4,340 .02 .00 .02 10.00 9.72 10.57
Child care workers ......................................... 272,180 175,890 127,020 .27 1.62 .59 8.39 9.23 10.15Personal and home care aides ................... 370,210 193,230 19,010 .37 1.78 .09 8.28 9.45 9.85Fitness trainers and aerobics instructors .................................................... 149,740 48,730 8,040 .15 .45 .04 15.70 13.95 14.07Recreation workers ........................................ 76,200 83,070 115,720 .08 .77 .54 10.73 10.44 11.62Residential advisors ....................................... 8,980 27,800 11,760 .01 .26 .05 11.48 11.39 12.95Personal care and service workers, all other ......................................................... 38,770 10,870 9,190 .04 .10 .04 10.18 10.39 11.24First–line supervisors/managers of retail sales workers ............................... 1,107,610 9,760 7,300 1.09 .09 .03 18.62 16.34 18.98First–line supervisors/managers of non–retail sales workers .................... 269,790 3,400 14,450 .27 .03 .07 37.35 31.43 28.29Cashiers .............................................................. 3,429,260 37,620 44,370 3.38 .35 .21 8.55 9.50 12.11Gaming change persons and booth cashiers ................................... 18,820 460 7,660 .02 .00 .04 10.53 9.72 9.79
Counter and rental clerks ............................ 465,360 4,980 1,080 .46 .05 .01 11.21 10.13 11.39Parts salespersons .......................................... 236,960 40 40 .23 .00 .00 14.37 18.75 16.55Retail salespersons ........................................ 4,376,750 30,980 13,220 4.32 .29 .06 11.48 9.69 11.66Advertising sales agents .............................. 156,990 2,900 180 .15 .03 .00 24.68 24.75 16.71Insurance sales agents ................................. 307,360 (1) (1) .30 (1) (1) 28.08 27.39 (1)Securities, commodities, and financial services sales agents ................................ 259,800 1,510 100 .26 .01 .00 43.42 34.01 35.19Travel agents .................................................... 87,500 910 90 .09 .01 .00 15.06 15.57 11.43Sales representatives, services, all other ......................................................... 489,920 11,850 1,310 .48 .11 .01 27.17 24.35 23.59Sales representatives, wholesale and manufacturing, technical and scientific products ............................ 391,050 1,740 260 .39 .02 .00 34.90 33.85 20.82
Sales representatives, wholesale and manufacturing, except technical and scientific products ............................ 1,492,150 3,770 510 1.47 .03 .00 28.08 27.38 22.10
See notes at end of table.
Table A–1. Continued—For-profit, not-for-profit, and government employment and wages, by detailed occupation, 2006
For-profit Not-for-profit
Govern-
For-profit Not-for-
Govern- employ- employ-
ment
wage profit wage
ment
ment ment employ-
wage
ment
Percentageof for-profit
employ-ment
Percentageof not-for-
profitemploy-
ment
Percent-age of
govern-ment
employ-ment
Occupation

Not-For-Profit Sector
34 Monthly Labor Review • November 2008
Demonstrators and product promoters .................................................... 83,440 650 80 0.08 0.01 0.00 $12.32 $13.38 $17.25Models ................................................................ 690 210 570 .00 .00 .00 13.31 13.68 13.50Real estate brokers ........................................ 46,670 360 90 .05 .00 .00 38.58 33.77 28.33Real estate sales agents ............................... 161,630 2,260 4,880 .16 .02 .02 26.09 22.14 28.49Sales engineers ............................................... 74,900 300 90 .07 .00 .00 39.92 39.01 36.00Telemarketers .................................................. 378,230 10,050 150 .37 .09 .00 11.61 10.99 12.68Door–to–door sales workers, news and street vendors, and related workers ... 10,960 (1) (1) .01 (1) (1) 12.84 12.12 (1)Sales and related workers, all other ......... 140,690 19,230 3,380 .14 .18 .02 19.23 21.21 23.27First–line supervisors/managers of office and administrative support workers......................................................... 1,100,580 116,310 148,660 1.09 1.07 .69 22.25 22.23 22.76Switchboard operators, including answering service ..................................... 129,360 30,680 13,330 .13 .28 .06 11.17 11.63 12.38Telephone operators ..................................... 23,480 2,150 1,040 .02 .02 .00 15.90 13.60 14.44Communications equipment operators, all other .................................... 1,950 460 1,840 .00 .00 .01 14.65 11.98 18.21Bill and account collectors .......................... 387,110 28,110 11,750 .38 .26 .05 14.66 14.87 14.89Billing and posting clerks and machine operators .................................... 430,380 64,960 26,740 .42 .60 .12 14.38 14.30 13.78
Bookkeeping, accounting, and auditing clerks ........................................... 1,545,730 131,990 191,410 1.52 1.22 .89 15.18 15.15 15.83Gaming cage workers ................................... 12,910 100 5,140 .01 .00 .02 11.82 10.93 11.11Payroll and timekeeping clerks ................. 164,880 14,830 28,150 .16 .14 .13 15.75 16.12 16.54Procurement clerks ........................................ 47,220 5,560 22,270 .05 .05 .10 15.51 15.17 17.51Tellers .................................................................. 564,980 42,220 430 .56 .39 .00 10.92 11.20 13.35Brokerage clerks ............................................. 72,290 170 160 .07 .00 .00 18.88 18.65 21.59Correspondence clerks ................................ 13,090 1,150 2,050 .01 .01 .01 14.56 14.15 13.11Court, municipal, and license clerks ........ 3,140 60 103,970 .00 .00 .48 12.16 16.37 15.76Credit authorizers, checkers, and clerks ..................................................... 65,020 (1) (1) .06 (1) (1) 15.15 15.49 (1)Customer service representatives ............ 2,010,600 93,250 56,810 1.98 .86 .26 14.59 14.24 14.98Eligibility interviewers, government programs ...................................................... 2,400 3,030 101,720 .00 .03 .47 16.37 14.29 18.29File clerks ........................................................... 172,010 26,760 25,490 .17 .25 .12 11.12 11.53 12.33
Hotel, motel, and resort desk clerks ........ 213,500 1,010 810 .21 .01 .00 9.35 9.93 9.86Interviewers, except eligibility and loan ........................................................ 102,720 76,860 32,480 .10 .71 .15 12.44 13.28 14.50Library assistants, clerical ............................ 4,000 15,660 89,660 .00 .14 .42 11.85 11.39 10.93Loan interviewers and clerks ..................... 240,550 8,860 910 .24 .08 .00 15.67 15.11 14.74New accounts clerks...................................... 76,130 5,840 (1) .08 .05 (1) 14.17 13.61 10.39Order clerks ...................................................... 261,330 3,190 690 .26 .03 .00 13.51 13.43 14.85Human resources assistants, except payroll and timekeeping ........................ 99,740 18,280 42,900 .10 .17 .20 16.43 15.89 17.53Receptionists and information clerks ..... 921,160 130,070 66,410 .91 1.20 .31 11.39 11.40 12.08Reservation and transportation ticket agents and travel clerks .......................... 158,570 1,270 530 .16 .01 .00 14.48 12.62 15.81All other information and record clerks .............................................................. 107,700 14,330 110,700 .11 .13 .51 14.75 15.44 16.86Cargo and freight agents ............................ 84,060 470 680 .08 .00 .00 18.45 19.62 22.99
Couriers and messengers ............................ 93,980 7,800 6,890 .09 .07 .03 10.92 11.18 12.51Police, fire, and ambulance dispatchers .................................................. 6,200 2,450 86,160 .01 .02 .40 14.53 14.26 15.78Dispatchers, except police, fire, and ambulance .......................................... 166,990 4,980 14,660 .16 .05 .07 16.57 14.92 16.43Meter readers, utilities .................................. 22,920 3,140 19,800 .02 .03 .09 16.40 14.26 14.42Production, planning, and expediting clerks .............................................................. 259,740 10,900 17,210 .26 .10 .08 19.13 16.71 21.82Shipping, receiving, and traffic clerks ..... 743,210 10,250 14,060 .73 .09 .07 13.11 12.41 18.55
See notes at end of table.
Table A–1. Continued—For-profit, not-for-profit, and government employment and wages, by detailed occupation, 2006
For-profit Not-for-profit
Govern-
For-profit Not-for-
Govern- employ- employ-
ment
wage profit wage
ment
ment ment employ-
wage
ment
Percentageof for-profit
employ-ment
Percentageof not-for-
profitemploy-
ment
Percent-age of
govern-ment
employ-ment
Occupation
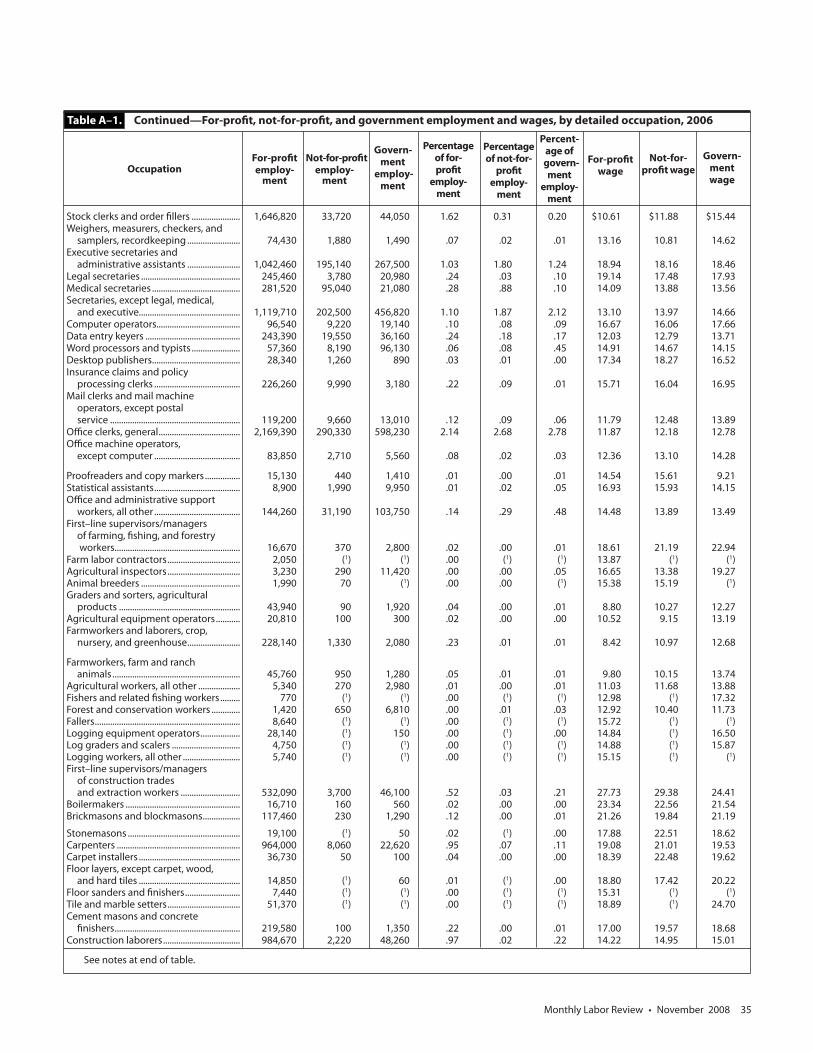
Monthly Labor Review • November 2008 35
Stock clerks and order fillers ...................... 1,646,820 33,720 44,050 1.62 0.31 0.20 $10.61 $11.88 $15.44Weighers, measurers, checkers, and samplers, recordkeeping ........................ 74,430 1,880 1,490 .07 .02 .01 13.16 10.81 14.62Executive secretaries and administrative assistants ........................ 1,042,460 195,140 267,500 1.03 1.80 1.24 18.94 18.16 18.46Legal secretaries ............................................. 245,460 3,780 20,980 .24 .03 .10 19.14 17.48 17.93Medical secretaries ........................................ 281,520 95,040 21,080 .28 .88 .10 14.09 13.88 13.56Secretaries, except legal, medical, and executive.............................................. 1,119,710 202,500 456,820 1.10 1.87 2.12 13.10 13.97 14.66Computer operators...................................... 96,540 9,220 19,140 .10 .08 .09 16.67 16.06 17.66Data entry keyers ........................................... 243,390 19,550 36,160 .24 .18 .17 12.03 12.79 13.71Word processors and typists ...................... 57,360 8,190 96,130 .06 .08 .45 14.91 14.67 14.15Desktop publishers ........................................ 28,340 1,260 890 .03 .01 .00 17.34 18.27 16.52Insurance claims and policy processing clerks ....................................... 226,260 9,990 3,180 .22 .09 .01 15.71 16.04 16.95Mail clerks and mail machine operators, except postal service ........................................................... 119,200 9,660 13,010 .12 .09 .06 11.79 12.48 13.89Office clerks, general ..................................... 2,169,390 290,330 598,230 2.14 2.68 2.78 11.87 12.18 12.78Office machine operators, except computer ....................................... 83,850 2,710 5,560 .08 .02 .03 12.36 13.10 14.28
Proofreaders and copy markers ................ 15,130 440 1,410 .01 .00 .01 14.54 15.61 9.21Statistical assistants ....................................... 8,900 1,990 9,950 .01 .02 .05 16.93 15.93 14.15Office and administrative support workers, all other ....................................... 144,260 31,190 103,750 .14 .29 .48 14.48 13.89 13.49First–line supervisors/managers of farming, fishing, and forestry workers......................................................... 16,670 370 2,800 .02 .00 .01 18.61 21.19 22.94Farm labor contractors ................................. 2,050 (1) (1) .00 (1) (1) 13.87 (1) (1)Agricultural inspectors ................................. 3,230 290 11,420 .00 .00 .05 16.65 13.38 19.27Animal breeders ............................................. 1,990 70 (1) .00 .00 (1) 15.38 15.19 (1)Graders and sorters, agricultural products ....................................................... 43,940 90 1,920 .04 .00 .01 8.80 10.27 12.27Agricultural equipment operators ........... 20,810 100 300 .02 .00 .00 10.52 9.15 13.19Farmworkers and laborers, crop, nursery, and greenhouse ........................ 228,140 1,330 2,080 .23 .01 .01 8.42 10.97 12.68
Farmworkers, farm and ranch animals .......................................................... 45,760 950 1,280 .05 .01 .01 9.80 10.15 13.74Agricultural workers, all other ................... 5,340 270 2,980 .01 .00 .01 11.03 11.68 13.88Fishers and related fishing workers ......... 770 (1) (1) .00 (1) (1) 12.98 (1) 17.32Forest and conservation workers ............. 1,420 650 6,810 .00 .01 .03 12.92 10.40 11.73Fallers .................................................................. 8,640 (1) (1) .00 (1) (1) 15.72 (1) (1)Logging equipment operators .................. 28,140 (1) 150 .00 (1) .00 14.84 (1) 16.50Log graders and scalers ............................... 4,750 (1) (1) .00 (1) (1) 14.88 (1) 15.87Logging workers, all other .......................... 5,740 (1) (1) .00 (1) (1) 15.15 (1) (1)First–line supervisors/managers of construction trades and extraction workers ........................... 532,090 3,700 46,100 .52 .03 .21 27.73 29.38 24.41Boilermakers .................................................... 16,710 160 560 .02 .00 .00 23.34 22.56 21.54Brickmasons and blockmasons ................. 117,460 230 1,290 .12 .00 .01 21.26 19.84 21.19
Stonemasons ................................................... 19,100 (1) 50 .02 (1) .00 17.88 22.51 18.62Carpenters ........................................................ 964,000 8,060 22,620 .95 .07 .11 19.08 21.01 19.53Carpet installers .............................................. 36,730 50 100 .04 .00 .00 18.39 22.48 19.62Floor layers, except carpet, wood, and hard tiles .............................................. 14,850 (1) 60 .01 (1) .00 18.80 17.42 20.22Floor sanders and finishers ......................... 7,440 (1) (1) .00 (1) (1) 15.31 (1) (1)Tile and marble setters ................................. 51,370 (1) (1) .00 (1) (1) 18.89 (1) 24.70Cement masons and concrete finishers ......................................................... 219,580 100 1,350 .22 .00 .01 17.00 19.57 18.68Construction laborers ................................... 984,670 2,220 48,260 .97 .02 .22 14.22 14.95 15.01
Table A–1. Continued—For-profit, not-for-profit, and government employment and wages, by detailed occupation, 2006
For-profit Not-for-profit
Govern-
Not-for-
employ- employ- ment
profit wage
ment ment
employ-
ment
See notes at end of table.
Percentageof for-profit
employ-ment
Percentageof not-for-
profitemploy-
ment
Percent-age of
govern-ment
employ-ment
OccupationFor-profit
wageGovern-
mentwage

Not-For-Profit Sector
36 Monthly Labor Review • November 2008
Paving, surfacing, and tamping equipment operators ............................... 48,040 (1) (1) 0.00 (1) (1) $16.62 (1) $15.74Pile–driver operators .................................... 5,040 (1) (1) .00 (1) (1) 24.16 (1) 20.40Operating engineers and other construction equipment operators .... 326,970 1,320 68,960 .32 0.01 0.32 19.95 20.01 16.77Drywall and ceiling tile installers .............. 140,530 150 60 .14 .00 .00 18.66 13.80 19.79Electricians ........................................................ 584,680 6,120 31,060 .58 .06 .14 22.28 23.30 23.20Glaziers ............................................................... 51,770 (1) 310 .05 (1) .00 18.25 24.78 23.02Insulation workers, floor, ceiling, and wall ......................................................... 31,110 600 70 .03 .01 .00 16.44 14.01 18.87Insulation workers, mechanical ................ 27,550 30 570 .03 .00 .00 19.87 14.57 23.89Painters, construction and maintenance ...................................... 244,650 3,930 16,360 .24 .04 .08 16.13 18.60 19.99Paperhangers................................................... 6,120 (1) (1) .01 (1) (1) 17.41 21.98 18.49Pipelayers .......................................................... 47,800 160 10,680 .05 .00 .05 16.33 15.25 15.59Plumbers, pipefitters, and steamfitters .. 409,960 3,290 25,420 .40 .03 .12 22.03 22.55 20.76Plasterers and stucco masons .................... 50,190 50 780 .05 .00 .00 17.79 20.41 22.64Reinforcing iron and rebar workers ......... 30,980 (1) (1) .00 (1) (1) 20.01 (1) 23.71Roofers ............................................................... 124,960 100 660 .12 .00 .00 16.92 20.05 20.72Sheet metal workers ..................................... 170,800 270 7,090 .17 .00 .03 19.43 21.93 22.87
Helpers––brickmasons, blockmasons, stonemasons, and tile and marble setters ............................................................ 62,540 (1) 110 .00 (1) .00 13.34 (1) 19.52Helpers––carpenters ..................................... 107,410 330 400 .11 .00 .00 11.45 12.65 11.03Helpers––electricians ................................... 102,070 210 1,240 .10 .00 .01 11.85 15.71 16.47Helpers––painters, paperhangers, plasterers, and stucco masons .............. 23,320 40 170 .02 .00 .00 10.81 13.59 15.92Helpers––pipelayers, plumbers, pipefitters, and steamfitters .................. 81,250 150 1,450 .08 .00 .01 12.04 14.89 19.64Helpers, construction trades, all other ......................................................... 34,630 140 1,700 .03 .00 .01 11.74 14.77 14.14Construction and building inspectors .... 41,140 700 55,520 .04 .01 .26 23.82 20.20 22.95Elevator installers and repairers ................ 21,400 30 600 .02 .00 .00 29.62 25.13 27.70Fence erectors ................................................. 24,470 (1) (1) .00 (1) (1) 13.53 (1) 10.62Hazardous materials removal workers ... 37,350 340 1,440 .04 .00 .01 18.24 19.29 20.56Highway maintenance workers ................ 5,460 40 136,940 .01 .00 .64 15.51 14.97 15.32
Rail–track laying and maintenance equipment operators ............................... 13,180 (1) (1) .00 (1) (1) 18.91 (1) 22.65Construction and related workers, all other ......................................................... 46,660 720 8,950 .05 .01 .04 15.75 17.56 15.90Derrick operators, oil and gas .................... 16,910 (1) (1) .00 (1) (1) 18.23 (1) (1)Rotary drill operators, oil and gas ............ 18,010 (1) (1) .00 (1) (1) 20.36 (1) (1)Earth drillers, except oil and gas ............... 19,200 (1) 150 .00 (1) .00 17.66 (1) 21.11Explosives workers, ordnance handling experts, and blasters ................................ 3,600 (1) (1) .00 (1) (1) 20.24 (1) 18.76Mine cutting and channeling machine operators ...................................................... 7,730 (1) (1) .00 (1) (1) 18.68 (1) (1)Rock splitters, quarry .................................... 3,830 (1) (1) .00 (1) (1) 13.85 (1) (1)Helpers––extraction workers ..................... 24,000 (1) (1) .00 (1) (1) 14.59 (1) (1)Extraction workers, all other ...................... 8,690 (1) 210 .00 (1) .00 18.40 (1) 20.78
First–line supervisors/managers of mechanics, installers, and repairers ............................................... 385,310 12,340 56,250 .38 .11 .26 27.04 25.99 26.28Computer, automated teller, and office machine repairers................. 135,450 1,070 4,510 .13 .01 .02 18.20 18.05 18.98Radio mechanics ............................................ 5,240 40 960 .01 .00 .00 18.55 19.95 22.55Telecommunications equipment installers and repairers, except line installers ........................................................ 185,020 2,620 3,610 .18 .02 .02 24.39 20.77 21.67Avionics technicians ...................................... 13,200 50 2,120 .01 .00 .01 22.80 21.80 22.65
See notes at end of table.
Table A–1. Continued—For-profit, not-for-profit, and government employment and wages, by detailed occupation, 2006
For-profit
Govern-
For-profit Not-for-
Govern- employ-
ment
wage profit wage
ment
ment employ-
wage
ment
Percentageof for-profit
employ-ment
Percentageof not-for-
profitemploy-
ment
Percent-age of
govern-ment
employ-ment
Not-for-profitemploy-
mentOccupation

Monthly Labor Review • November 2008 37
Electric motor, power tool, and related repairers ................................ 21,740 150 340 0.02 0.00 0.00 $16.67 $13.83 $20.72Electrical and electronics installers and repairers, transportation equipment ................................................... 16,660 280 (1) .02 .00 (1) 20.42 19.80 (1)Electrical and electronics repairers, commercial and industrial equipment ................................................... 64,760 630 13,610 .06 .01 .06 21.48 22.84 23.87Electrical and electronics repairers, powerhouse, substation, and relay ....................................................... 18,510 1,400 2,410 .02 .01 .01 27.62 25.72 25.01Electronic equipment installers and repairers, motor vehicles................ 19,380 (1) (1) .00 (1) (1) 14.82 (1) 22.61Electronic home entertainment equipment installers and repairers ..... 35,070 60 270 .03 .00 .00 15.20 14.70 19.67Security and fire alarm systems installers ........................................................ 51,980 140 510 .05 .00 .00 17.35 19.65 19.77Aircraft mechanics and service technicians ................................................... 99,900 650 18,250 .10 .01 .08 23.77 21.64 23.37Automotive body and related repairers ....................................................... 154,690 70 1,670 .15 .00 .01 18.29 20.18 21.00Automotive glass installers and repairers ............................................... 18,790 (1) (1) .00 (1) (1) 15.35 (1) (1)
Automotive service technicians and mechanics ........................................... 607,850 2,740 35,890 .60 .03 .17 17.15 17.94 19.56Bus and truck mechanics and diesel engine specialists ...................................... 216,120 1,240 38,900 .21 .01 .18 18.31 18.61 19.12Farm equipment mechanics ...................... 29,200 40 300 .03 .00 .00 14.56 15.57 16.06Mobile heavy equipment mechanics, except engines ........................................... 100,460 260 19,340 .10 .00 .09 19.58 19.75 21.06Rail car repairers ............................................. 19,860 (1) (1) .00 (1) (1) 19.85 (1) (1)Motorboat mechanics .................................. 18,450 80 100 .00 .00 .00 16.53 15.90 18.67Outdoor power equipment and other small engine mechanics ......................... 24,610 240 730 .02 .00 .00 13.28 15.54 17.78Bicycle repairers .............................................. 8,320 (1) (1) .00 (1) (1) 10.86 (1) (1)Recreational vehicle service technicians ................................................... 13,520 30 (1) .01 .00 (1) 16.00 12.86 14.37Tire repairers and changers ........................ 103,840 (1) 370 .10 (1) .00 10.90 11.59 15.53
Mechanical door repairers .......................... 15,070 (1) 100 .00 (1) .00 16.34 (1) 17.55Control and valve installers and repairers, except mechanical door ................................................................ 33,140 1,470 7,860 .03 .01 .04 22.17 19.89 20.26Heating, air conditioning, and refrigeration mechanics and installers ............................................... 229,340 4,470 19,100 .23 .04 .09 18.83 21.23 20.83Home appliance repairers ........................... 43,160 150 150 .04 .00 .00 16.91 19.98 18.97Industrial machinery mechanics .............. 243,080 1,290 10,100 .24 .01 .05 20.28 20.62 22.95Maintenance and repair workers, general .......................................................... 999,240 95,320 226,040 .99 .88 1.05 16.02 15.12 16.67Maintenance workers, machinery ............ 73,170 890 8,030 .07 .01 .04 17.33 17.97 18.63Millwrights ........................................................ 53,020 70 250 .05 .00 .00 22.99 24.74 22.61Electrical power–line installers and repairers ............................................... 79,470 16,940 15,250 .08 .16 .07 24.17 23.35 23.25Telecommunications line installers and repairers ............................................... 155,850 1,590 1,000 .15 .01 .00 21.91 20.96 22.44
Camera and photographic equipment repairers ........................................................ 3,130 140 230 .00 .00 .00 17.81 17.64 15.53Medical equipment repairers .................... 24,770 6,020 1,490 .02 .06 .01 20.50 21.27 20.67Musical instrument repairers and tuners .................................................... 4,980 60 90 .00 .00 .00 15.15 21.03 21.15
See notes at end of table.
Table A–1. Continued—For-profit, not-for-profit, and government employment and wages, by detailed occupation, 2006
For-profit Not-for-profit
Govern-
For-profit Not-for-
Govern- employ- employ-
ment
wage profit wage
ment
ment ment employ-
wage
ment
Percentageof for-profit
employ-ment
Percentageof not-for-
profitemploy-
ment
Percent-age of
govern-ment
employ-ment
Occupation
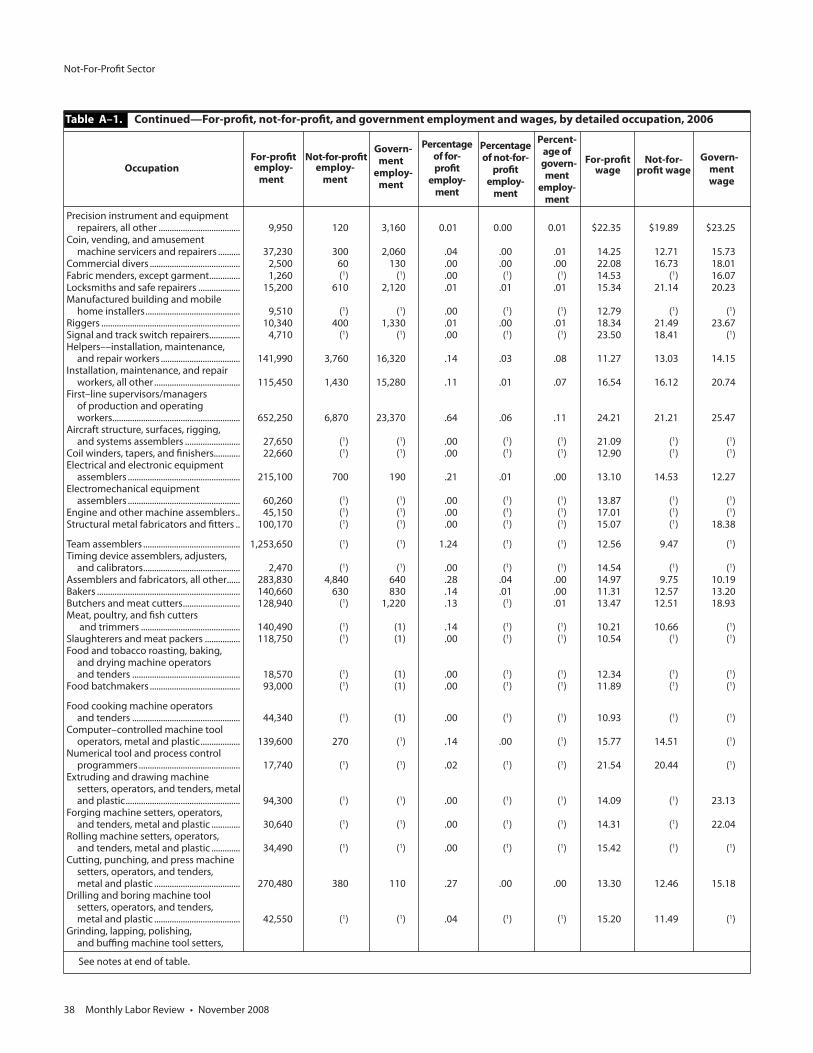
Not-For-Profit Sector
38 Monthly Labor Review • November 2008
Precision instrument and equipment repairers, all other ..................................... 9,950 120 3,160 0.01 0.00 0.01 $22.35 $19.89 $23.25Coin, vending, and amusement machine servicers and repairers .......... 37,230 300 2,060 .04 .00 .01 14.25 12.71 15.73Commercial divers ......................................... 2,500 60 130 .00 .00 .00 22.08 16.73 18.01Fabric menders, except garment .............. 1,260 (1) (1) .00 (1) (1) 14.53 (1) 16.07Locksmiths and safe repairers ................... 15,200 610 2,120 .01 .01 .01 15.34 21.14 20.23Manufactured building and mobile home installers ........................................... 9,510 (1) (1) .00 (1) (1) 12.79 (1) (1)Riggers ............................................................... 10,340 400 1,330 .01 .00 .01 18.34 21.49 23.67Signal and track switch repairers .............. 4,710 (1) (1) .00 (1) (1) 23.50 18.41 (1)Helpers––installation, maintenance, and repair workers .................................... 141,990 3,760 16,320 .14 .03 .08 11.27 13.03 14.15Installation, maintenance, and repair workers, all other ....................................... 115,450 1,430 15,280 .11 .01 .07 16.54 16.12 20.74First–line supervisors/managers of production and operating workers .......................................................... 652,250 6,870 23,370 .64 .06 .11 24.21 21.21 25.47Aircraft structure, surfaces, rigging, and systems assemblers ......................... 27,650 (1) (1) .00 (1) (1) 21.09 (1) (1)Coil winders, tapers, and finishers............ 22,660 (1) (1) .00 (1) (1) 12.90 (1) (1)Electrical and electronic equipment assemblers ................................................... 215,100 700 190 .21 .01 .00 13.10 14.53 12.27Electromechanical equipment assemblers ................................................... 60,260 (1) (1) .00 (1) (1) 13.87 (1) (1)Engine and other machine assemblers .. 45,150 (1) (1) .00 (1) (1) 17.01 (1) (1)Structural metal fabricators and fitters .. 100,170 (1) (1) .00 (1) (1) 15.07 (1) 18.38
Team assemblers ............................................ 1,253,650 (1) (1) 1.24 (1) (1) 12.56 9.47 (1)Timing device assemblers, adjusters, and calibrators ............................................ 2,470 (1) (1) .00 (1) (1) 14.54 (1) (1)Assemblers and fabricators, all other ...... 283,830 4,840 640 .28 .04 .00 14.97 9.75 10.19Bakers ................................................................. 140,660 630 830 .14 .01 .00 11.31 12.57 13.20Butchers and meat cutters .......................... 128,940 (1) 1,220 .13 (1) .01 13.47 12.51 18.93Meat, poultry, and fish cutters and trimmers ............................................. 140,490 (1) (1) .14 (1) (1) 10.21 10.66 (1)Slaughterers and meat packers ................ 118,750 (1) (1) .00 (1) (1) 10.54 (1) (1)Food and tobacco roasting, baking, and drying machine operators and tenders ................................................. 18,570 (1) (1) .00 (1) (1) 12.34 (1) (1)Food batchmakers ......................................... 93,000 (1) (1) .00 (1) (1) 11.89 (1) (1)
Food cooking machine operators and tenders ................................................. 44,340 (1) (1) .00 (1) (1) 10.93 (1) (1)Computer–controlled machine tool operators, metal and plastic .................. 139,600 270 (1) .14 .00 (1) 15.77 14.51 (1)Numerical tool and process control programmers .............................................. 17,740 (1) (1) .02 (1) (1) 21.54 20.44 (1)Extruding and drawing machine setters, operators, and tenders, metal and plastic .................................................... 94,300 (1) (1) .00 (1) (1) 14.09 (1) 23.13Forging machine setters, operators, and tenders, metal and plastic ............. 30,640 (1) (1) .00 (1) (1) 14.31 (1) 22.04Rolling machine setters, operators, and tenders, metal and plastic ............. 34,490 (1) (1) .00 (1) (1) 15.42 (1) (1)Cutting, punching, and press machine setters, operators, and tenders, metal and plastic ....................................... 270,480 380 110 .27 .00 .00 13.30 12.46 15.18Drilling and boring machine tool setters, operators, and tenders, metal and plastic ....................................... 42,550 (1) (1) .04 (1) (1) 15.20 11.49 (1)Grinding, lapping, polishing, and buffing machine tool setters,
See notes at end of table.
Table A–1. Continued—For-profit, not-for-profit, and government employment and wages, by detailed occupation, 2006
For-profit Not-for-profit
Govern-
For-profit Not-for-
employ- employ- ment
wage profit wage
ment ment
employ-
ment
Percentageof for-profit
employ-ment
Percentageof not-for-
profitemploy-
ment
Percent-age of
govern-ment
employ-ment
OccupationGovern-
mentwage
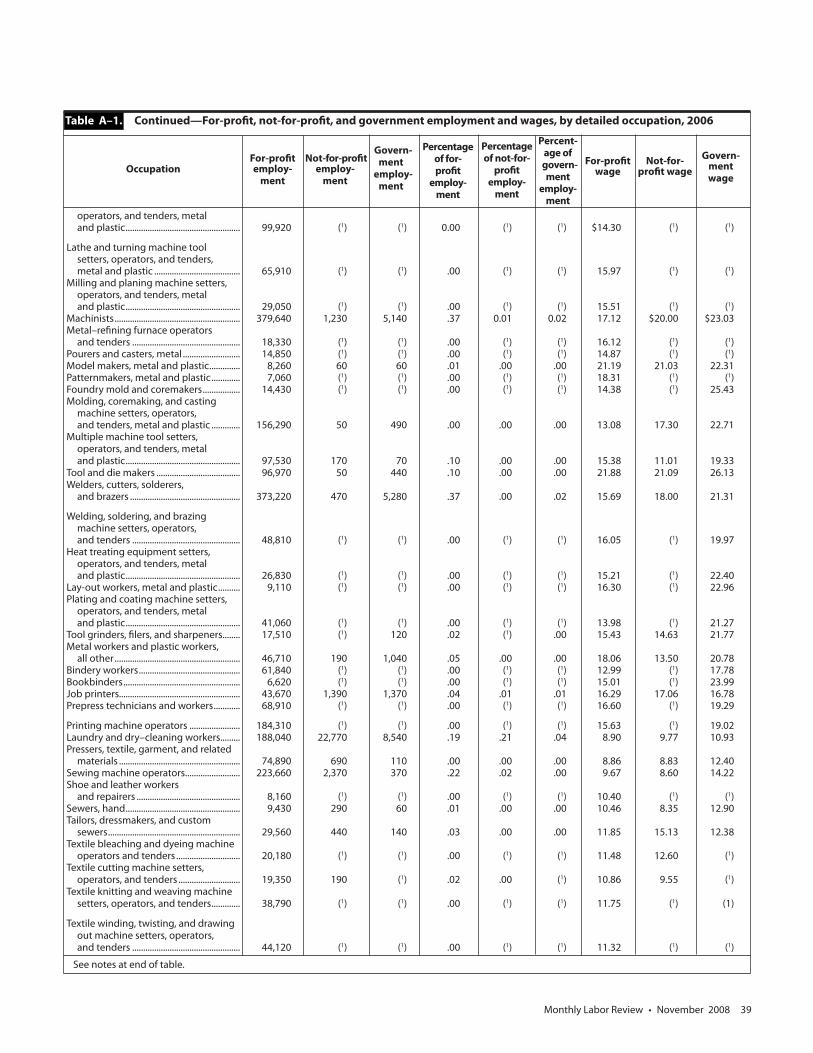
Monthly Labor Review • November 2008 39
operators, and tenders, metal and plastic .................................................... 99,920 (1) (1) 0.00 (1) (1) $14.30 (1) (1)
Lathe and turning machine tool setters, operators, and tenders, metal and plastic ....................................... 65,910 (1) (1) .00 (1) (1) 15.97 (1) (1)Milling and planing machine setters, operators, and tenders, metal and plastic .................................................... 29,050 (1) (1) .00 (1) (1) 15.51 (1) (1)Machinists ......................................................... 379,640 1,230 5,140 .37 0.01 0.02 17.12 $20.00 $23.03Metal–refining furnace operators and tenders ................................................. 18,330 (1) (1) .00 (1) (1) 16.12 (1) (1)Pourers and casters, metal .......................... 14,850 (1) (1) .00 (1) (1) 14.87 (1) (1)Model makers, metal and plastic .............. 8,260 60 60 .01 .00 .00 21.19 21.03 22.31Patternmakers, metal and plastic ............. 7,060 (1) (1) .00 (1) (1) 18.31 (1) (1)Foundry mold and coremakers ................. 14,430 (1) (1) .00 (1) (1) 14.38 (1) 25.43Molding, coremaking, and casting machine setters, operators, and tenders, metal and plastic ............. 156,290 50 490 .00 .00 .00 13.08 17.30 22.71Multiple machine tool setters, operators, and tenders, metal and plastic .................................................... 97,530 170 70 .10 .00 .00 15.38 11.01 19.33Tool and die makers ...................................... 96,970 50 440 .10 .00 .00 21.88 21.09 26.13Welders, cutters, solderers, and brazers .................................................. 373,220 470 5,280 .37 .00 .02 15.69 18.00 21.31
Welding, soldering, and brazing machine setters, operators, and tenders ................................................. 48,810 (1) (1) .00 (1) (1) 16.05 (1) 19.97Heat treating equipment setters, operators, and tenders, metal and plastic .................................................... 26,830 (1) (1) .00 (1) (1) 15.21 (1) 22.40Lay-out workers, metal and plastic .......... 9,110 (1) (1) .00 (1) (1) 16.30 (1) 22.96Plating and coating machine setters, operators, and tenders, metal and plastic .................................................... 41,060 (1) (1) .00 (1) (1) 13.98 (1) 21.27Tool grinders, filers, and sharpeners........ 17,510 (1) 120 .02 (1) .00 15.43 14.63 21.77Metal workers and plastic workers, all other ......................................................... 46,710 190 1,040 .05 .00 .00 18.06 13.50 20.78Bindery workers .............................................. 61,840 (1) (1) .00 (1) (1) 12.99 (1) 17.78Bookbinders ..................................................... 6,620 (1) (1) .00 (1) (1) 15.01 (1) 23.99Job printers....................................................... 43,670 1,390 1,370 .04 .01 .01 16.29 17.06 16.78Prepress technicians and workers ............ 68,910 (1) (1) .00 (1) (1) 16.60 (1) 19.29
Printing machine operators ....................... 184,310 (1) (1) .00 (1) (1) 15.63 (1) 19.02Laundry and dry–cleaning workers......... 188,040 22,770 8,540 .19 .21 .04 8.90 9.77 10.93Pressers, textile, garment, and related materials ....................................................... 74,890 690 110 .00 .00 .00 8.86 8.83 12.40Sewing machine operators ......................... 223,660 2,370 370 .22 .02 .00 9.67 8.60 14.22Shoe and leather workers and repairers ............................................... 8,160 (1) (1) .00 (1) (1) 10.40 (1) (1)Sewers, hand .................................................... 9,430 290 60 .01 .00 .00 10.46 8.35 12.90Tailors, dressmakers, and custom sewers ............................................................ 29,560 440 140 .03 .00 .00 11.85 15.13 12.38Textile bleaching and dyeing machine operators and tenders ............................. 20,180 (1) (1) .00 (1) (1) 11.48 12.60 (1)Textile cutting machine setters, operators, and tenders ............................ 19,350 190 (1) .02 .00 (1) 10.86 9.55 (1)Textile knitting and weaving machine setters, operators, and tenders ............. 38,790 (1) (1) .00 (1) (1) 11.75 (1) (1)
Textile winding, twisting, and drawing out machine setters, operators, and tenders ................................................. 44,120 (1) (1) .00 (1) (1) 11.32 (1) (1)
See notes at end of table.
Table A–1. Continued—For-profit, not-for-profit, and government employment and wages, by detailed occupation, 2006
For-profit Not-for-profit
Govern-
For-profit Not-for-
Govern- employ- employ-
ment
wage profit wage
ment
ment ment employ-
wage
ment
Percentageof for-profit
employ-ment
Percentageof not-for-
profitemploy-
ment
Percent-age of
govern-ment
employ-ment
Occupation
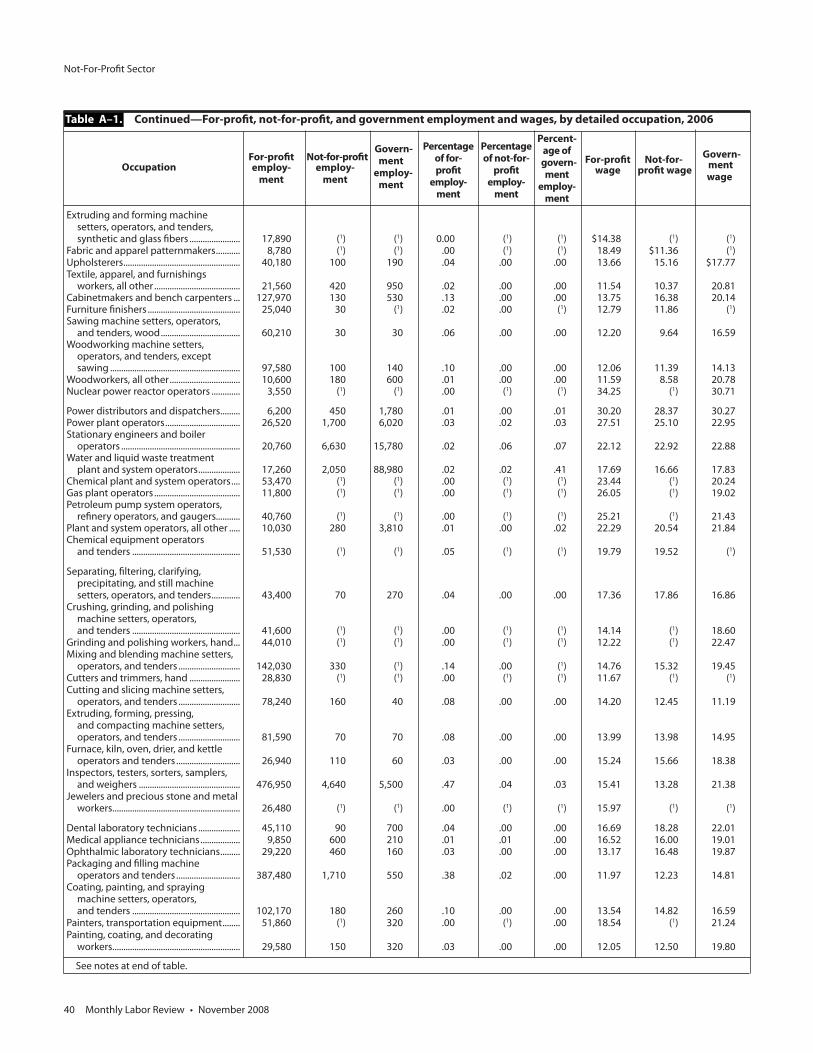
Not-For-Profit Sector
40 Monthly Labor Review • November 2008
Extruding and forming machine setters, operators, and tenders, synthetic and glass fibers ....................... 17,890 (1) (1) 0.00 (1) (1) $14.38 (1) (1)Fabric and apparel patternmakers ........... 8,780 (1) (1) .00 (1) (1) 18.49 $11.36 (1)Upholsterers ..................................................... 40,180 100 190 .04 .00 .00 13.66 15.16 $17.77Textile, apparel, and furnishings workers, all other ....................................... 21,560 420 950 .02 .00 .00 11.54 10.37 20.81Cabinetmakers and bench carpenters ... 127,970 130 530 .13 .00 .00 13.75 16.38 20.14Furniture finishers .......................................... 25,040 30 (1) .02 .00 (1) 12.79 11.86 (1)Sawing machine setters, operators, and tenders, wood .................................... 60,210 30 30 .06 .00 .00 12.20 9.64 16.59Woodworking machine setters, operators, and tenders, except sawing ........................................................... 97,580 100 140 .10 .00 .00 12.06 11.39 14.13Woodworkers, all other ................................ 10,600 180 600 .01 .00 .00 11.59 8.58 20.78Nuclear power reactor operators ............. 3,550 (1) (1) .00 (1) (1) 34.25 (1) 30.71
Power distributors and dispatchers ......... 6,200 450 1,780 .01 .00 .01 30.20 28.37 30.27Power plant operators .................................. 26,520 1,700 6,020 .03 .02 .03 27.51 25.10 22.95Stationary engineers and boiler operators ...................................................... 20,760 6,630 15,780 .02 .06 .07 22.12 22.92 22.88Water and liquid waste treatment plant and system operators ................... 17,260 2,050 88,980 .02 .02 .41 17.69 16.66 17.83Chemical plant and system operators .... 53,470 (1) (1) .00 (1) (1) 23.44 (1) 20.24Gas plant operators ....................................... 11,800 (1) (1) .00 (1) (1) 26.05 (1) 19.02Petroleum pump system operators, refinery operators, and gaugers........... 40,760 (1) (1) .00 (1) (1) 25.21 (1) 21.43Plant and system operators, all other ..... 10,030 280 3,810 .01 .00 .02 22.29 20.54 21.84Chemical equipment operators and tenders ................................................. 51,530 (1) (1) .05 (1) (1) 19.79 19.52 (1)
Separating, filtering, clarifying, precipitating, and still machine setters, operators, and tenders ............. 43,400 70 270 .04 .00 .00 17.36 17.86 16.86Crushing, grinding, and polishing machine setters, operators, and tenders ................................................. 41,600 (1) (1) .00 (1) (1) 14.14 (1) 18.60Grinding and polishing workers, hand ... 44,010 (1) (1) .00 (1) (1) 12.22 (1) 22.47Mixing and blending machine setters, operators, and tenders ............................ 142,030 330 (1) .14 .00 (1) 14.76 15.32 19.45Cutters and trimmers, hand ....................... 28,830 (1) (1) .00 (1) (1) 11.67 (1) (1)Cutting and slicing machine setters, operators, and tenders ............................ 78,240 160 40 .08 .00 .00 14.20 12.45 11.19Extruding, forming, pressing, and compacting machine setters, operators, and tenders ............................ 81,590 70 70 .08 .00 .00 13.99 13.98 14.95Furnace, kiln, oven, drier, and kettle operators and tenders ............................. 26,940 110 60 .03 .00 .00 15.24 15.66 18.38Inspectors, testers, sorters, samplers, and weighers .............................................. 476,950 4,640 5,500 .47 .04 .03 15.41 13.28 21.38Jewelers and precious stone and metal workers .......................................................... 26,480 (1) (1) .00 (1) (1) 15.97 (1) (1)
Dental laboratory technicians ................... 45,110 90 700 .04 .00 .00 16.69 18.28 22.01Medical appliance technicians .................. 9,850 600 210 .01 .01 .00 16.52 16.00 19.01Ophthalmic laboratory technicians ......... 29,220 460 160 .03 .00 .00 13.17 16.48 19.87Packaging and filling machine operators and tenders ............................. 387,480 1,710 550 .38 .02 .00 11.97 12.23 14.81Coating, painting, and spraying machine setters, operators, and tenders ................................................. 102,170 180 260 .10 .00 .00 13.54 14.82 16.59Painters, transportation equipment ........ 51,860 (1) 320 .00 (1) .00 18.54 (1) 21.24Painting, coating, and decorating workers .......................................................... 29,580 150 320 .03 .00 .00 12.05 12.50 19.80
See notes at end of table.
Table A–1. Continued—For-profit, not-for-profit, and government employment and wages, by detailed occupation, 2006
For-profit Not-for-profit
Govern-
For-profit Not-for-
Govern- employ- employ-
ment
wage profit wage
ment
ment ment employ-
wage
ment
Percentageof for-profit
employ-ment
Percentageof not-for-
profitemploy-
ment
Percent-age of
govern-ment
employ-ment
Occupation

Monthly Labor Review • November 2008 41
Photographic process workers .................. 23,560 380 310 0.02 0.00 0.00 $12.79 $12.56 $15.95Photographic processing machine operators ...................................................... 49,930 220 100 .05 .00 .00 10.33 13.31 14.10Semiconductor processors ......................... 41,390 (1) (1) .00 (1) (1) 16.70 (1) (1)Cementing and gluing machine operators and tenders ............................. 23,630 (1) (1) .00 (1) (1) 12.89 (1) (1)Cleaning, washing, and metal pickling equipment operators and tenders ...... 15,530 (1) (1) .00 (1) (1) 12.20 (1) (1)Cooling and freezing equipment operators and tenders ............................. 10,100 (1) (1) .01 (1) (1) 12.42 13.12 (1)Etchers and engravers .................................. 11,290 (1) (1) .00 (1) (1) 13.21 (1) 34.77Molders, shapers, and casters, except metal and plastic ....................................... 42,580 (1) 290 .04 (1) .00 12.80 16.17 16.75Paper goods machine setters, operators, and tenders ............................ 114,320 120 (1) .11 .00 (1) 15.66 14.46 (1)Helpers—production workers ................... 537,470 3,610 1,700 .53 .03 .01 10.61 10.33 12.26Production workers, all other .................... 291,380 6,000 2,890 .29 .06 .01 13.72 9.85 17.22Aircraft cargo handling supervisors ........ 5,440 (1) 230 .01 (1) .00 21.55 21.34 28.50First–line supervisors/managers of helpers, laborers, and material movers, hand .............................................. 174,310 2,040 4,240 .17 .02 .02 20.12 17.73 20.08First–line supervisors/managers of transportation and material– moving machine and vehicle operators ...................................................... 189,100 2,580 30,580 .19 .02 .14 24.16 20.08 26.47Airline pilots, copilots, and flight engineers ...................................................... 72,750 340 2,850 .00 .00 .00 (1) (1) (1)
Commercial pilots .......................................... 25,250 980 1,030 .02 .01 .00 67,570 52,800 56,180Airfield operations specialists .................... 3,060 60 1,660 .00 .00 .01 18.67 17.03 22.30Ambulance drivers and attendants, except emergency medical technicians ................................................... 13,960 3,640 3,800 .01 .03 .02 10.30 10.12 11.53Bus drivers, transit and intercity ............... 73,090 3,950 115,360 .07 .04 .54 13.40 11.45 17.55Bus drivers, school ......................................... 166,340 26,030 265,490 .16 .24 1.23 12.54 10.61 11.91Driver/sales workers ...................................... 397,090 1,580 250 .39 .01 .00 11.71 10.81 12.29Truck drivers, heavy and tractor– trailer .............................................................. 1,651,430 2,430 32,990 1.63 .02 .15 17.42 15.84 16.04Truck drivers, light or delivery services .......................................................... 917,570 12,550 19,130 .91 .12 .09 13.18 11.64 14.30Taxi drivers and chauffeurs ......................... 128,130 19,720 8,110 .13 .18 .04 10.60 10.04 11.74Motor vehicle operators, all other ............ 53,630 2,170 16,320 .05 .02 .08 11.48 12.38 17.05
Locomotive engineers .................................. 35,260 30 1,580 .03 .00 .01 29.93 14.04 25.69Railroad brake, signal, and switch operators ...................................................... 22,200 (1) (1) .00 (1) (1) 25.06 (1) (1)Railroad conductors and yardmasters .... 35,670 (1) (1) .00 (1) (1) 28.33 (1) (1)Subway and streetcar operators ............... (1) (1) 6,180 (1) (1) .00 20.65 (1) 22.34Rail transportation workers, all other ..... 5,630 (1) (1) .00 (1) (1) 18.15 (1) 20.66Sailors and marine oilers ............................. 28,360 250 3,380 .03 .00 .02 15.51 15.30 17.16Captains, mates, and pilots of water vessels............................................................ 26,720 820 1,960 .00 .00 .00 27.43 24.12 27.81Motorboat operators .................................... 1,830 80 560 .00 .00 .00 15.25 13.77 21.78Ship engineers ................................................ 12,640 100 1,500 .01 .00 .01 28.70 23.14 27.31Bridge and lock tenders ............................... 670 50 2,980 .00 .00 .01 14.33 13.50 18.01
Parking lot attendants .................................. 122,730 4,320 6,260 .12 .04 .03 8.77 9.26 10.04Service station attendants .......................... 93,340 110 2,690 .09 .00 .01 8.99 12.27 15.21Traffic technicians .......................................... (1) (1) 5,820 (1) (1) .00 17.57 (1) 18.77Transportation inspectors ........................... 13,190 80 10,600 .01 .00 .05 23.18 25.29 30.86Transportation workers, all other ............. 37,740 320 4,390 .04 .00 .02 15.40 14.71 16.40Conveyor operators and tenders .............. 50,150 (1) (1) .05 (1) (1) 13.43 17.93 (1)Crane and tower operators ......................... 44,630 100 1,280 .04 .00 .01 19.85 19.58 20.74
See notes at end of table.
Table A–1. Continued—For-profit, not-for-profit, and government employment and wages, by detailed occupation, 2006
For-profit Not-for-profit
Govern-
For-profit Not-for-
Govern- employ- employ-
ment
wage profit wage
ment
ment ment employ-
wage
ment
Percentageof for-profit
employ-ment
Percentageof not-for-
profitemploy-
ment
Percent-age of
govern-ment
employ-ment
Occupation

Not-For-Profit Sector
42 Monthly Labor Review • November 2008
Dredge operators ........................................... 1,650 (1) (1) 0.00 (1) (1) $17.62 (1) $20.44Excavating and loading machine and dragline operators ............................ 65,670 290 2,410 .06 .00 .01 17.12 $21.26 15.86Hoist and winch operators ......................... 2,670 (1) (1) .00 (1) (1) 17.94 (1) 20.37Industrial truck and tractor operators .... 620,160 2,340 9,180 .61 .02 .04 13.89 13.87 18.63Cleaners of vehicles and equipment ....... 329,580 (1) (1) .33 (1) (1) 9.55 11.56 (1)
Laborers and freight, stock, and material movers, hand .................... 2,296,910 31,760 66,790 2.27 .29 .31 11.04 10.62 11.62Machine feeders and offbearers ............... 148,740 (1) (1) .00 (1) (1) 11.57 (1) 11.34Packers and packagers, hand..................... 826,770 6,860 1,130 .82 .06 .01 9.27 8.26 17.12Gas compressor and gas pumping station operators ....................................... 3,860 (1) (1) .00 (1) (1) 21.53 (1) (1)Pump operators, except wellhead pumpers ....................................................... 9,580 (1) 550 .00 (1) .00 19.65 (1) 16.66Refuse and recyclable material collectors ...................................................... 78,320 340 49,880 .08 .00 .23 14.86 11.82 14.73Shuttle car operators .................................... 2,800 50 (1) .00 .00 (1) 18.98 16.24 (1)Tank car, truck, and ship loaders ............... 15,440 (1) (1) .00 (1) (1) 16.40 (1) (1)Material moving workers, all other .......... 47,140 650 4,450 .05 .01 .02 15.89 13.77 15.71Bailiffs ................................................................. (1) (1) 18,800 (1) (1) .00 (1) (1) 17.21Postal service clerks ....................................... 120 (1) 82,410 .00 (1) .00 7.50 (1) 21.15
Postal service mail sorters, processors, and processing machine operators .... 80 (1) 203,900 .00 (1) .00 16.66 (1) 19.74Hunters and trappers .................................... (1) (1) 30 (1) (1) .00 (1) (1) 15.24Terrazzo workers and finishers .................. 6,640 (1) (1) .00 (1) (1) 16.72 (1) (1)Tapers ................................................................. 40,090 (1) (1) .00 (1) (1) 20.48 (1) (1)Structural iron and steel workers ............. 68,100 (1) 500 .00 (1) .00 20.89 (1) 26.08Helpers––roofers ............................................ 21,140 (1) (1) .00 (1) (1) 10.92 (1) (1)Septic tank servicers and sewer pipe cleaners ............................................... 17,390 (1) 4,960 .00 (1) .00 15.12 (1) 17.26Segmental pavers .......................................... 880 (1) (1) .00 (1) (1) 13.80 (1) (1)Service unit operators, oil, gas, and mining .................................................. 25,360 (1) (1) .00 (1) (1) 17.37 (1) (1)Continuous mining machine operators . 9,610 (1) (1) .00 (1) (1) 19.38 (1) (1)Mining machine operators, all other ....... 2,880 (1) (1) .00 (1) (1) 18.49 (1) (1)
Roof bolters, mining ...................................... 4,240 (1) (1) .00 (1) (1) 20.29 (1) (1)Roustabouts, oil and gas ............................. 41,120 (1) (1) .00 (1) (1) 12.93 (1) (1)Motorcycle mechanics ................................. 16,720 (1) (1) .00 (1) (1) 15.37 (1) 23.09Refractory materials repairers, except brickmasons.................................. 3,340 (1) (1) .00 (1) (1) 19.61 (1) (1)Watch repairers ............................................... 3,100 (1) (1) .00 (1) (1) 15.64 (1) (1)Fiberglass laminators and fabricators ..... 32,520 (1) (1) .00 (1) (1) 12.96 (1) (1)Shoe machine operators and tenders .... 4,210 (1) (1) .00 (1) (1) 10.83 (1) (1)Model makers, wood .................................... 1,870 (1) 50 .00 (1) .00 15.62 (1) 23.70Patternmakers, wood .................................... 2,240 (1) 40 .00 (1) .00 16.03 (1) 25.51Tire builders ...................................................... 23,240 (1) (1) .00 (1) (1) 18.36 (1) (1)Air traffic controllers ...................................... 2,540 (1) 20,850 .00 (1) .00 32.55 (1) 55.39
Locomotive firers ............................................ 530 (1) (1) .00 (1) (1) 22.08 (1) (1)Rail yard engineers, dinkey operators, and hostlers ................................................. 5,710 (1) 100 .00 (1) .00 19.15 (1) 24.17Loading machine operators, underground mining ............................... 2,490 (1) (1) .00 (1) (1) 19.35 (1) (1)Wellhead pumpers ........................................ 13,270 (1) (1) .00 (1) (1) 17.67 (1) (1)Legislators ......................................................... (1) (1) 62,150 (1) (1) .00 (1) (1) 32,780.00Postmasters and mail superintendents . (1) (1) 26,670 (1) (1) .00 (1) (1) 26.76Tax examiners, collectors, and revenue agents ............................................................ (1) (1) 75,980 (1) (1) .00 (1) (1) 23.81Administrative law judges, adjudicators, and hearing officers ....... (1) (1) 14,540 (1) (1) .00 (1) (1) 37.36
Table A–1. Continued—For-profit, not-for-profit, and government employment and wages, by detailed occupation, 2006
For-profit Not-for-profit
Govern-
For-profit Not-for-
Govern- Occupation
employ- employ- ment
wage profit wage ment
ment ment
employ-
wage ment
Percentageof for-profit
employ-ment
Percentageof not-for-
profitemploy-
ment
Percent-age of
govern-ment
employ-ment
See notes at end of table.
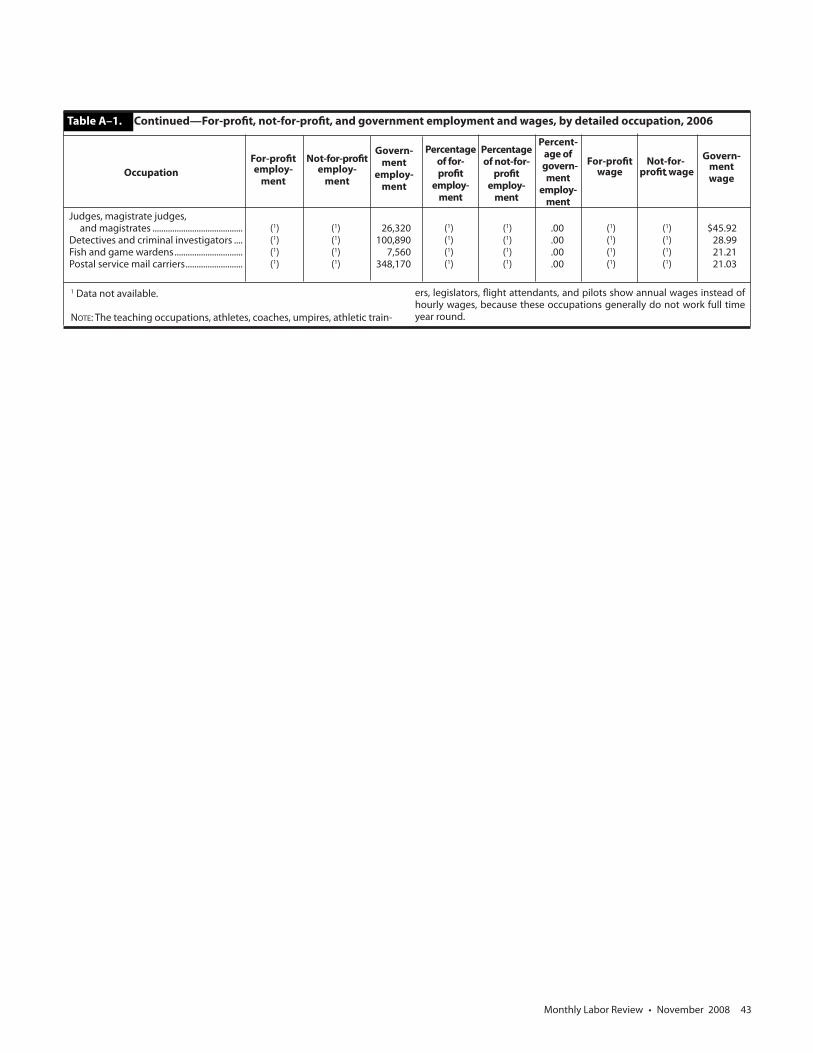
Monthly Labor Review • November 2008 43
1 Data not available.
NOTE: The teaching occupations, athletes, coaches, umpires, athletic train-
Judges, magistrate judges, and magistrates ......................................... (1) (1) 26,320 (1) (1) .00 (1) (1) $45.92Detectives and criminal investigators .... (1) (1) 100,890 (1) (1) .00 (1) (1) 28.99Fish and game wardens ............................... (1) (1) 7,560 (1) (1) .00 (1) (1) 21.21Postal service mail carriers .......................... (1) (1) 348,170 (1) (1) .00 (1) (1) 21.03
Table A–1. Continued—For-profit, not-for-profit, and government employment and wages, by detailed occupation, 2006
For-profit Not-for-profit
Govern-
For-profit Not-for-
Govern- employ- employ-
ment
wage profit wage
ment
ment ment employ-
- wage
ment
ers, legislators, flight attendants, and pilots show annual wages instead of hourly wages, because these occupations generally do not work full time year round.
Percentageof for-profit
employ-ment
Percentageof not-for-
profitemploy-
ment
Percent-age of
govern-ment
employ-ment
Occupation