OCC's Quarterly Derivatives Report on Bank Trading and ... · 12/31/2013 · OCC’s Quarterly...
41
OCC’s Quarterly Report on Bank Trading and Derivatives Activities Fourth Quarter 2013 Executive Summary • Insured U.S. commercial banks and savings associations reported trading revenue of $2.9 billion in the fourth quarter, $1.5 billion lower (34%) than $4.5 billion in the third quarter, and $1.4 billion lower (32%) than $4.4 billion in the fourth quarter of 2012. • Credit exposure from derivatives decreased in the fourth quarter. Net current credit exposure (NCCE) fell 2%, or $7 billion, to $298 billion, the lowest level since the end of 2007. • Low volatility continues to reduce trading risk exposure, as measured by Value-at-Risk (VaR). Total average VaR was $381 million at the five largest trading companies in 2013, $153 million lower (29%) than $534 million in 2012. • Notional derivatives fell $3.0 trillion, or 1%, to $237.0 trillion. Derivative contracts remain concentrated in interest rate products, which comprise 82% of total derivative notional amounts. Credit derivatives, which represent 5% of total derivatives notionals, declined 12% from the third quarter to $11.2 trillion. The OCC’s quarterly report on trading revenue and bank derivatives activities is based on Call Report information provided by all insured U.S. commercial banks and trust companies, reports filed by U.S. financial holding companies, and other published data. Beginning in the first quarter of 2012, savings associations reported their financial results in the Call Reports. As a result, their trading and derivatives activity is now included in the OCC’s quarterly derivatives report. A total of 1,383 insured U.S. commercial banks and savings associations reported derivatives activities at the end of the fourth quarter, 34 fewer than in the third quarter. Derivatives activity in the U.S. banking system continues to be dominated by a small group of large financial institutions. Four large commercial banks represent 93% of the total banking industry notional amounts and 82% of industry NCCE. The OCC and other supervisors have examiners on-site at the largest banks to evaluate continuously the credit, market, operational, reputation, and compliance risks of bank derivatives activities. In addition to the OCC’s on- site supervisory activities, the OCC continues to work with other financial supervisors and major market participants to address infrastructure, clearing, and margining issues in over-the-counter (OTC) derivatives. Activities include development of objectives and milestones for stronger trade processing and improved market transparency across all OTC derivatives categories, migration of certain, highly-liquid products to clearinghouses, and requirements for posting and collecting margin. Revenue Insured U.S. commercial banks and savings associations reported $2.9 billion in trading revenue in the fourth quarter, $1.5 billion lower (34%) than third quarter revenue of $4.5 billion, and $1.4 billion lower (32%) than $4.4 billion in the fourth quarter of 2012. Client demand was weak, due to the expected seasonal slowdown that typically occurs at the end of the year. Since 2000, trading revenue has fallen in the fourth quarter 11 of 14 times. Moreover, the fourth quarter is nearly always the weakest quarter of the year for trading revenue, as investors tend to reduce trading and risk management activity at year-end. Since 2000, there has been only one year (2004) when the fourth quarter was not the weakest revenue quarter of the year. The $1.5 billion decline in revenue in the fourth quarter was led by lower combined interest rate and foreign exchange revenue, which fell $1.6 billion to $2.0 billion. Revenue from equity contracts rose $0.2 billion to $0.5 billion, while commodity revenue fell $0.2 billion to $0.3 billion. Revenue from credit contracts was virtually unchanged at $0.2 billion.
Transcript of OCC's Quarterly Derivatives Report on Bank Trading and ... · 12/31/2013 · OCC’s Quarterly...

OCC’s Quarterly Report on Bank Trading and Derivatives Activities Fourth Quarter 2013
Executive Summary
• Insured U.S. commercial banks and savings associations reported trading revenue of $2.9 billion in the fourth quarter, $1.5 billion lower (34%) than $4.5 billion in the third quarter, and $1.4 billion lower (32%) than $4.4 billion in the fourth quarter of 2012.
• Credit exposure from derivatives decreased in the fourth quarter. Net current credit exposure (NCCE) fell 2%, or $7 billion, to $298 billion, the lowest level since the end of 2007.
• Low volatility continues to reduce trading risk exposure, as measured by Value-at-Risk (VaR). Total average VaR was $381 million at the five largest trading companies in 2013, $153 million lower (29%) than $534 million in 2012.
• Notional derivatives fell $3.0 trillion, or 1%, to $237.0 trillion. Derivative contracts remain concentrated in interest rate products, which comprise 82% of total derivative notional amounts. Credit derivatives, which represent 5% of total derivatives notionals, declined 12% from the third quarter to $11.2 trillion.
The OCC’s quarterly report on trading revenue and bank derivatives activities is based on Call Report information provided by all insured U.S. commercial banks and trust companies, reports filed by U.S. financial holding companies, and other published data. Beginning in the first quarter of 2012, savings associations reported their financial results in the Call Reports. As a result, their trading and derivatives activity is now included in the OCC’s quarterly derivatives report. A total of 1,383 insured U.S. commercial banks and savings associations reported derivatives activities at the end of the fourth quarter, 34 fewer than in the third quarter. Derivatives activity in the U.S. banking system continues to be dominated by a small group of large financial institutions. Four large commercial banks represent 93% of the total banking industry notional amounts and 82% of industry NCCE. The OCC and other supervisors have examiners on-site at the largest banks to evaluate continuously the credit, market, operational, reputation, and compliance risks of bank derivatives activities. In addition to the OCC’s on-site supervisory activities, the OCC continues to work with other financial supervisors and major market participants to address infrastructure, clearing, and margining issues in over-the-counter (OTC) derivatives. Activities include development of objectives and milestones for stronger trade processing and improved market transparency across all OTC derivatives categories, migration of certain, highly-liquid products to clearinghouses, and requirements for posting and collecting margin. Revenue Insured U.S. commercial banks and savings associations reported $2.9 billion in trading revenue in the fourth quarter, $1.5 billion lower (34%) than third quarter revenue of $4.5 billion, and $1.4 billion lower (32%) than $4.4 billion in the fourth quarter of 2012. Client demand was weak, due to the expected seasonal slowdown that typically occurs at the end of the year. Since 2000, trading revenue has fallen in the fourth quarter 11 of 14 times. Moreover, the fourth quarter is nearly always the weakest quarter of the year for trading revenue, as investors tend to reduce trading and risk management activity at year-end. Since 2000, there has been only one year (2004) when the fourth quarter was not the weakest revenue quarter of the year. The $1.5 billion decline in revenue in the fourth quarter was led by lower combined interest rate and foreign exchange revenue, which fell $1.6 billion to $2.0 billion. Revenue from equity contracts rose $0.2 billion to $0.5 billion, while commodity revenue fell $0.2 billion to $0.3 billion. Revenue from credit contracts was virtually unchanged at $0.2 billion.
2
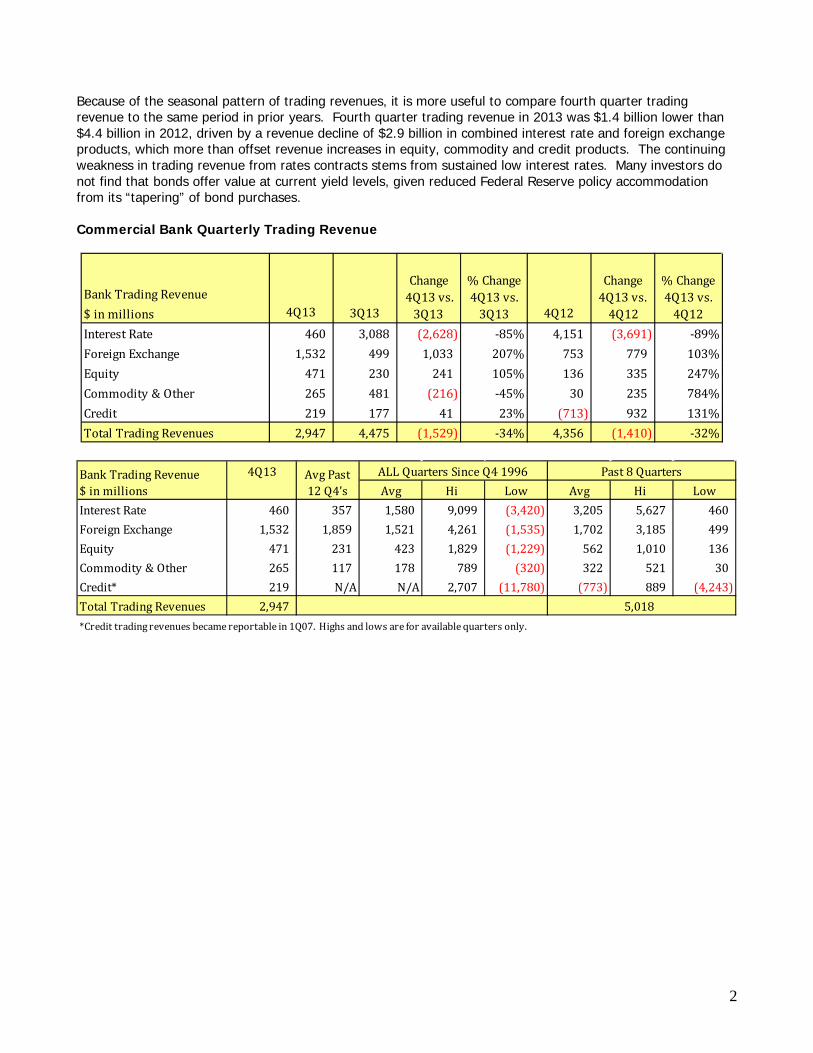
Because of the seasonal pattern of trading revenues, it is more useful to compare fourth quarter trading revenue to the same period in prior years. Fourth quarter trading revenue in 2013 was $1.4 billion lower than $4.4 billion in 2012, driven by a revenue decline of $2.9 billion in combined interest rate and foreign exchange products, which more than offset revenue increases in equity, commodity and credit products. The continuing weakness in trading revenue from rates contracts stems from sustained low interest rates. Many investors do not find that bonds offer value at current yield levels, given reduced Federal Reserve policy accommodation from its “tapering” of bond purchases. Commercial Bank Quarterly Trading Revenue
Bank Trading Revenue$ in millions 4Q13 3Q13 4Q12Interest Rate 460 3,088 (2,628) -85% 4,151 (3,691) -89%Foreign Exchange 1,532 499 1,033 207% 753 779 103%Equity 471 230 241 105% 136 335 247%Commodity & Other 265 481 (216) -45% 30 235 784%Credit 219 177 41 23% (713) 932 131%Total Trading Revenues 2,947 4,475 (1,529) -34% 4,356 (1,410) -32%
Change 4Q13 vs.
4Q12
% Change 4Q13 vs.
4Q12
Change 4Q13 vs.
3Q13
% Change 4Q13 vs.
3Q13
4Q13Avg Hi Low Avg Hi Low
Interest Rate 460 357 1,580 9,099 (3,420) 3,205 5,627 460Foreign Exchange 1,532 1,859 1,521 4,261 (1,535) 1,702 3,185 499Equity 471 231 423 1,829 (1,229) 562 1,010 136Commodity & Other 265 117 178 789 (320) 322 521 30Credit* 219 N/A N/A 2,707 (11,780) (773) 889 (4,243)Total Trading Revenues 2,947*Credit trading revenues became reportable in 1Q07. Highs and lows are for available quarters only.
Bank Trading Revenue $ in millions
Avg Past 12 Q4's
ALL Quarters Since Q4 1996 Past 8 Quarters
5,018
3
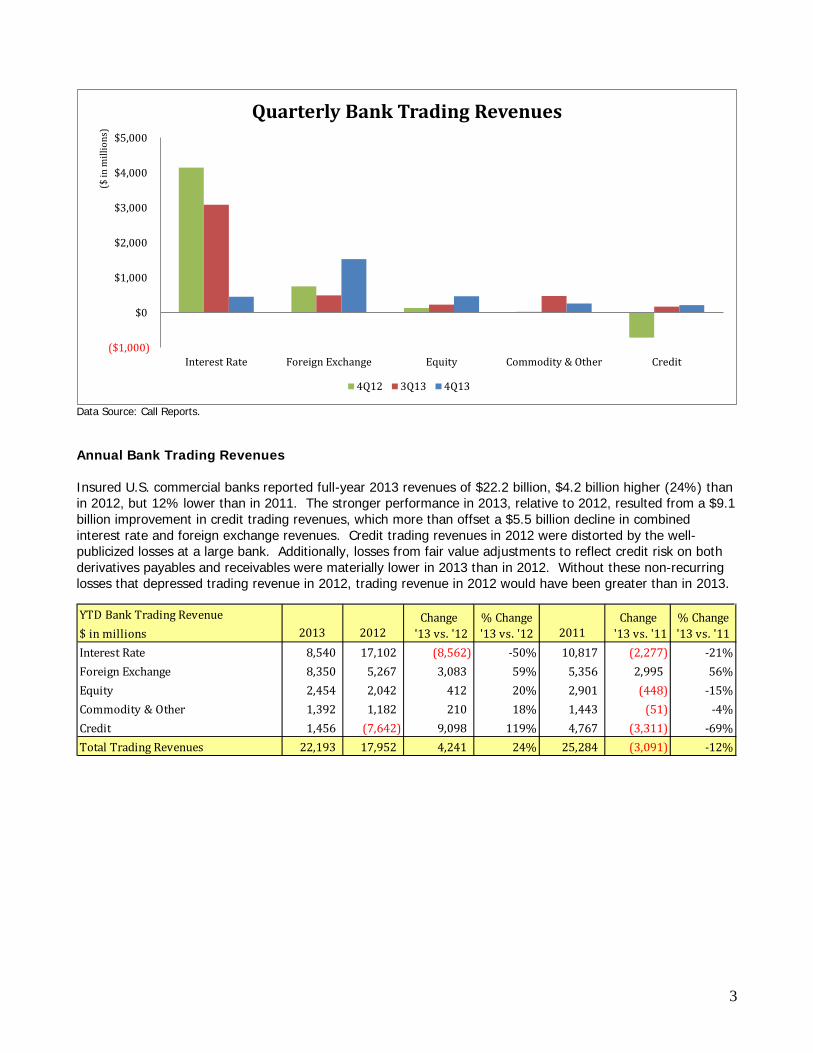
Data Source: Call Reports. Annual Bank Trading Revenues Insured U.S. commercial banks reported full-year 2013 revenues of $22.2 billion, $4.2 billion higher (24%) than in 2012, but 12% lower than in 2011. The stronger performance in 2013, relative to 2012, resulted from a $9.1 billion improvement in credit trading revenues, which more than offset a $5.5 billion decline in combined interest rate and foreign exchange revenues. Credit trading revenues in 2012 were distorted by the well-publicized losses at a large bank. Additionally, losses from fair value adjustments to reflect credit risk on both derivatives payables and receivables were materially lower in 2013 than in 2012. Without these non-recurring losses that depressed trading revenue in 2012, trading revenue in 2012 would have been greater than in 2013.
($1,000)
$0
$1,000
$2,000
$3,000
$4,000
$5,000
Interest Rate Foreign Exchange Equity Commodity & Other Credit
($ in
mill
ions
)Quarterly Bank Trading Revenues
4Q12 3Q13 4Q13
YTD Bank Trading Revenue$ in millions 2013 2012 2011Interest Rate 8,540 17,102 (8,562) -50% 10,817 (2,277) -21%Foreign Exchange 8,350 5,267 3,083 59% 5,356 2,995 56%Equity 2,454 2,042 412 20% 2,901 (448) -15%Commodity & Other 1,392 1,182 210 18% 1,443 (51) -4%Credit 1,456 (7,642) 9,098 119% 4,767 (3,311) -69%Total Trading Revenues 22,193 17,952 4,241 24% 25,284 (3,091) -12%
% Change '13 vs. '11
Change '13 vs. '12
% Change '13 vs. '12
Change '13 vs. '11
4
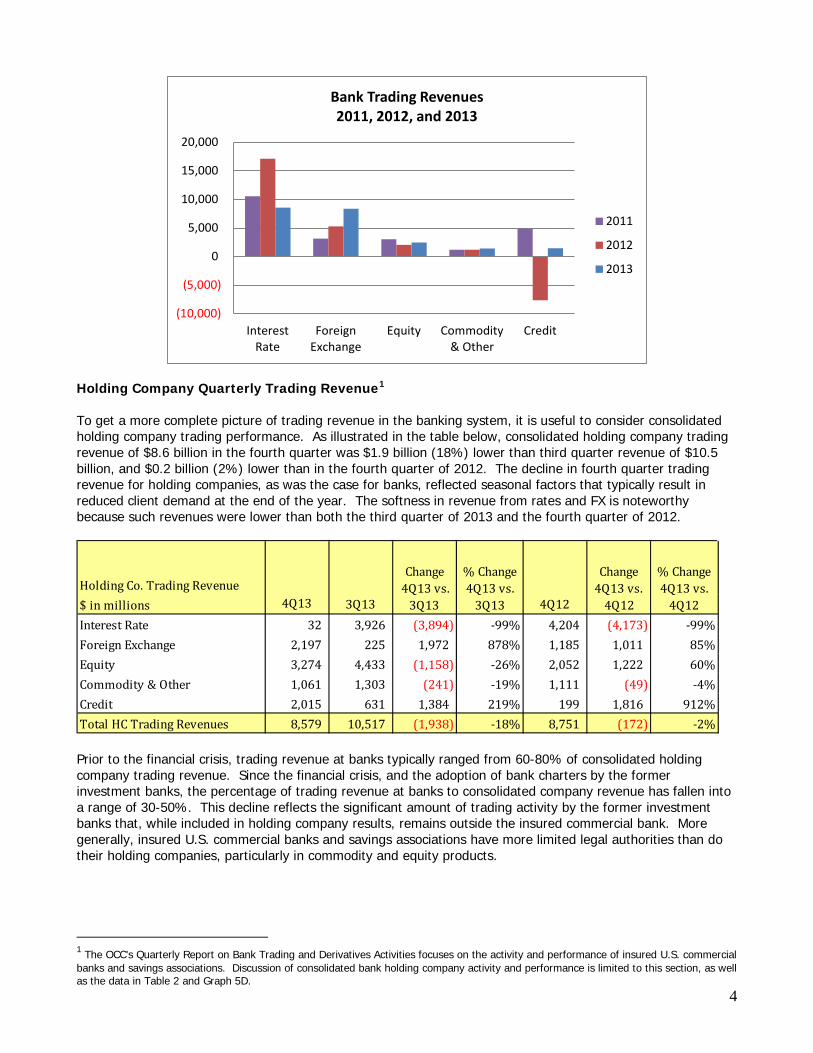
Holding Company Quarterly Trading Revenue1 To get a more complete picture of trading revenue in the banking system, it is useful to consider consolidated holding company trading performance. As illustrated in the table below, consolidated holding company trading revenue of $8.6 billion in the fourth quarter was $1.9 billion (18%) lower than third quarter revenue of $10.5 billion, and $0.2 billion (2%) lower than in the fourth quarter of 2012. The decline in fourth quarter trading revenue for holding companies, as was the case for banks, reflected seasonal factors that typically result in reduced client demand at the end of the year. The softness in revenue from rates and FX is noteworthy because such revenues were lower than both the third quarter of 2013 and the fourth quarter of 2012.
Prior to the financial crisis, trading revenue at banks typically ranged from 60-80% of consolidated holding company trading revenue. Since the financial crisis, and the adoption of bank charters by the former investment banks, the percentage of trading revenue at banks to consolidated company revenue has fallen into a range of 30-50%. This decline reflects the significant amount of trading activity by the former investment banks that, while included in holding company results, remains outside the insured commercial bank. More generally, insured U.S. commercial banks and savings associations have more limited legal authorities than do their holding companies, particularly in commodity and equity products.
1 The OCC’s Quarterly Report on Bank Trading and Derivatives Activities focuses on the activity and performance of insured U.S. commercial banks and savings associations. Discussion of consolidated bank holding company activity and performance is limited to this section, as well as the data in Table 2 and Graph 5D.
(10,000)
(5,000)
0
5,000
10,000
15,000
20,000
InterestRate
ForeignExchange
Equity Commodity& Other
Credit
Bank Trading Revenues 2011, 2012, and 2013
2011
2012
2013
Holding Co. Trading Revenue$ in millions 4Q13 3Q13 4Q12Interest Rate 32 3,926 (3,894) -99% 4,204 (4,173) -99%Foreign Exchange 2,197 225 1,972 878% 1,185 1,011 85%Equity 3,274 4,433 (1,158) -26% 2,052 1,222 60%Commodity & Other 1,061 1,303 (241) -19% 1,111 (49) -4%Credit 2,015 631 1,384 219% 199 1,816 912%Total HC Trading Revenues 8,579 10,517 (1,938) -18% 8,751 (172) -2%
Change 4Q13 vs.
4Q12
% Change 4Q13 vs.
4Q12
Change 4Q13 vs.
3Q13
% Change 4Q13 vs.
3Q13
5
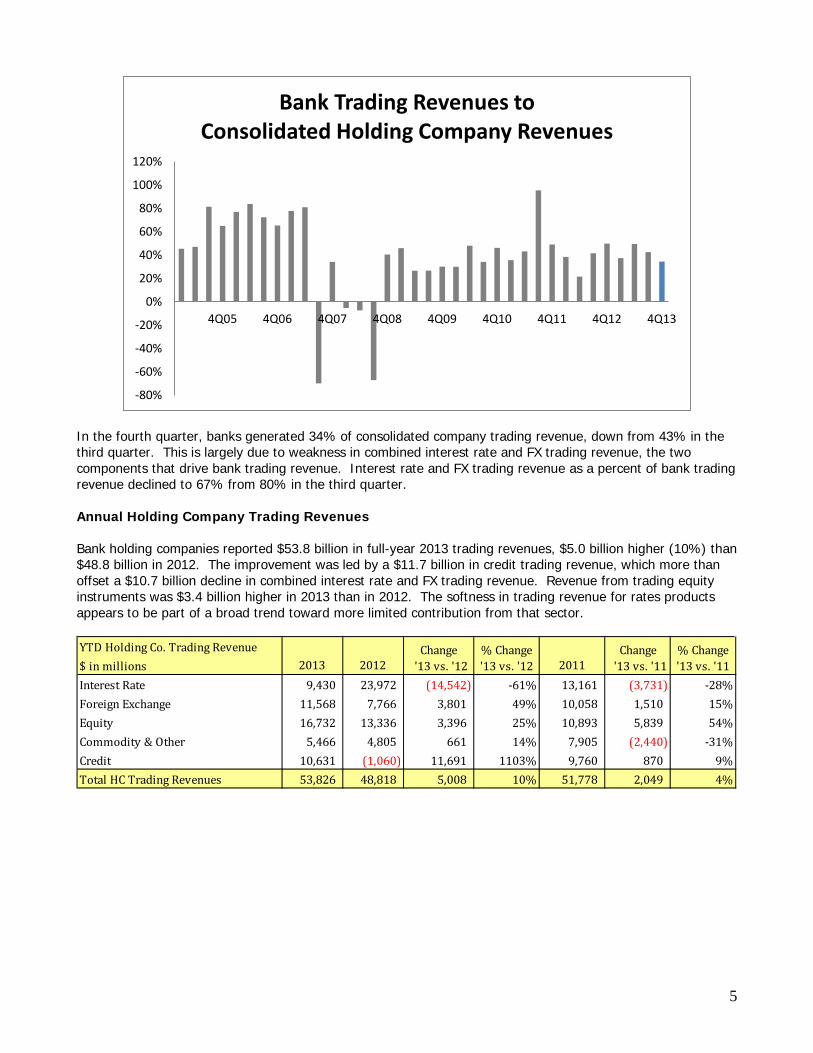
In the fourth quarter, banks generated 34% of consolidated company trading revenue, down from 43% in the third quarter. This is largely due to weakness in combined interest rate and FX trading revenue, the two components that drive bank trading revenue. Interest rate and FX trading revenue as a percent of bank trading revenue declined to 67% from 80% in the third quarter. Annual Holding Company Trading Revenues Bank holding companies reported $53.8 billion in full-year 2013 trading revenues, $5.0 billion higher (10%) than $48.8 billion in 2012. The improvement was led by a $11.7 billion in credit trading revenue, which more than offset a $10.7 billion decline in combined interest rate and FX trading revenue. Revenue from trading equity instruments was $3.4 billion higher in 2013 than in 2012. The softness in trading revenue for rates products appears to be part of a broad trend toward more limited contribution from that sector.
-80%
-60%
-40%
-20%
0%
20%
40%
60%
80%
100%
120%
4Q05 4Q06 4Q07 4Q08 4Q09 4Q10 4Q11 4Q12 4Q13
Bank Trading Revenues toConsolidated Holding Company Revenues
YTD Holding Co. Trading Revenue$ in millions 2013 2012 2011Interest Rate 9,430 23,972 (14,542) -61% 13,161 (3,731) -28%Foreign Exchange 11,568 7,766 3,801 49% 10,058 1,510 15%Equity 16,732 13,336 3,396 25% 10,893 5,839 54%Commodity & Other 5,466 4,805 661 14% 7,905 (2,440) -31%Credit 10,631 (1,060) 11,691 1103% 9,760 870 9%Total HC Trading Revenues 53,826 48,818 5,008 10% 51,778 2,049 4%
Change '13 vs. '11
% Change '13 vs. '11
Change '13 vs. '12
% Change '13 vs. '12

6
Credit Risk Credit risk is a significant risk in bank derivatives trading activities. The notional amount of a derivative contract is a reference amount that determines contractual payments, but it is generally not an amount at risk. The credit risk in a derivative contract is a function of a number of variables, such as whether counterparties exchange notional principal, the volatility of the underlying market factors (interest rate, currency, commodity, equity or corporate reference entity), the maturity and liquidity of the contract, and the creditworthiness of the counterparty. Credit risk in derivatives differs from credit risk in loans due to the more uncertain nature of the potential credit exposure. With a funded loan, the amount at risk is the amount advanced to the borrower. The credit risk is unilateral; the bank faces the credit exposure of the borrower. However, in most derivatives transactions, such as swaps (which make up the bulk of bank derivatives contracts), the credit exposure is bilateral. Each party to the contract may (and, if the contract has a long enough tenor, probably will) have a current credit exposure to the other party at various points in time over the contract’s life. Moreover, because the credit exposure is a function of movements in market factors, banks do not know, and can only estimate, how much the value of the derivative contract might be at various points of time in the future. The first step to measuring credit exposure in derivative contracts involves identifying those contracts where a bank would lose value if the counterparty to a contract defaulted today. The total of all contracts with positive value (i.e., derivatives receivables) to the bank is the gross positive fair value (GPFV) and represents an initial measurement of credit exposure. The total of all contracts with negative value (i.e., derivatives payables) to the bank is the gross negative fair value (GNFV) and represents a measurement of the exposure the bank poses to its counterparties.
(5,000)
0
5,000
10,000
15,000
20,000
25,000
30,000
InterestRate
ForeignExchange
Equity Commodity& Other
Credit
Holding Company Trading Revenues2011, 2012, and 2013
2011
2012
2013
$ in billions 4Q13 3Q13 Change %Change 4Q13 3Q13 Change %Change
Interest Rates 2,822 2,820 1 0% 2,751 2,756 (5) 0%FX 453 444 9 2% 446 454 (8) -2%Equity 100 97 4 4% 101 99 2 2%Commodity 41 44 (4) -9% 39 43 (4) -9%Credit 186 198 (12) -6% 183 194 (11) -6%Total 3,602 3,603 (2) 0% 3,519 3,545 (26) -1%
Gross Positive Fair Values Gross Negative Fair Values

7
Low volatility in the fourth quarter resulted in only a $2 billion change in GPFV, one of the smallest changes on record. GPFV (i.e., derivatives receivables) remained at $3.6 trillion. Receivables from interest rate contracts, which make up 78% of gross derivatives receivables (and hence are the dominant source of credit exposure), edged 0.1% higher ($1 billion). Because banks hedge the market risk of their derivatives portfolios, the very small change in GPFV was matched by a similarly small decline in gross negative fair values (i.e., derivatives payables). Derivatives payables decreased 1% to $3.5 trillion. A legally enforceable netting agreement with a counterparty creates a single legal obligation for all transactions (called a “netting set”) under the agreement. Therefore, when banks have such agreements with their counterparties, contracts with negative values (an amount a bank would pay to its counterparty), can offset contracts with positive values (an amount owed by the counterparty to the bank), leaving a NCCE as shown in the example below:
Bank A Portfolio with Counterparty B
# of Contracts
Value of Contracts Credit Measure/Metric
Contracts With Positive Value to Bank A
6 $500 Gross Positive Fair Value
Contracts With Negative Value to Bank A
4 $350 Gross Negative Fair Value
Total Contracts 10 $150 Net Current Credit Exposure (NCCE) to Bank A from Counterparty B
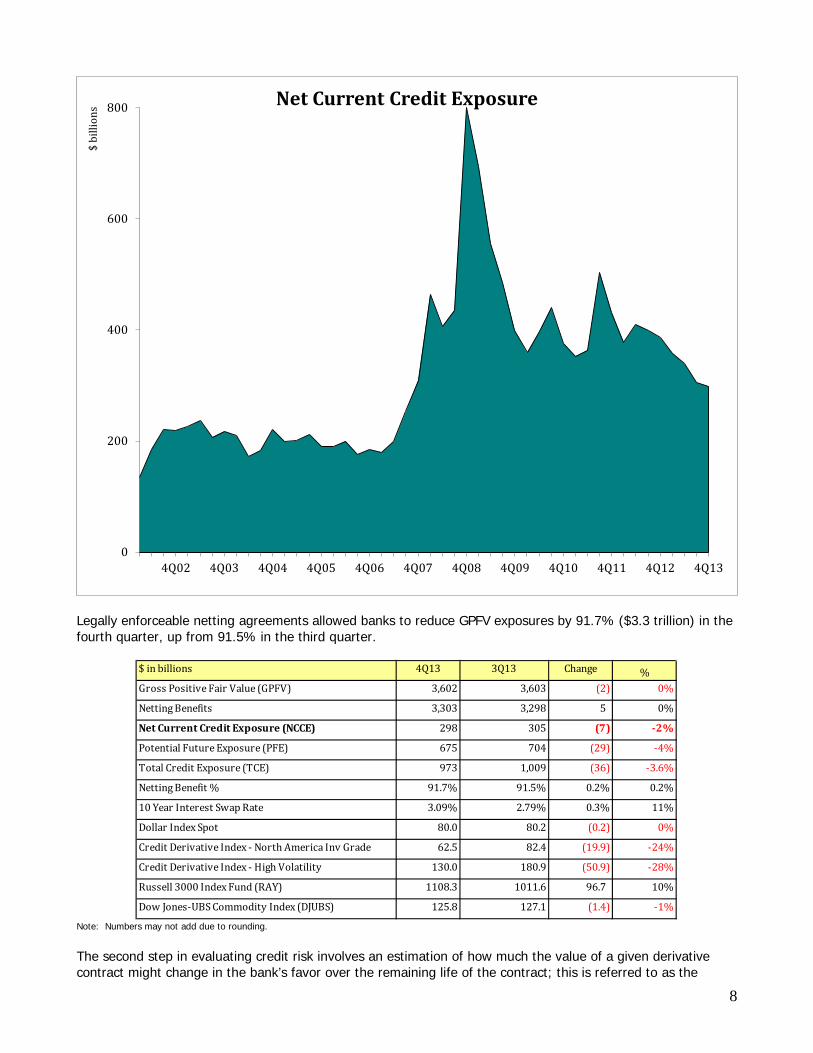
Most, but not necessarily all, derivatives transactions a bank has with an individual counterparty are subject to a legally enforceable netting agreement. For example, some transactions may be subject to the laws of a jurisdiction that does not provide legal certainty of netting agreements, in which case such transactions must be regarded as separate from the netting set. Other transactions may involve non-standard contractual documentation. Transactions that are not subject to the same legally enforceable netting agreement become unique “netting sets” that have distinct values that cannot be netted, for which the appropriate current credit measure is the gross exposure to the bank, if that amount is positive. In some cases, transactions that fall under separate netting sets may be tied together under a separate legally enforceable netting agreement. While banks can net exposures within a netting set under the same netting agreement, they cannot net exposures across netting sets without a separate legally enforceable netting agreement. As a result, a bank’s NCCE to a particular counterparty equals the sum of the credit exposures across all netting sets with that counterparty. A bank’s NCCE across all counterparties equals the sum of its NCCE to each of its counterparties. NCCE is the primary metric used by the OCC to evaluate credit risk in bank derivatives activities. NCCE for insured U.S. commercial banks and saving associations decreased 2% ($7 billion) to $298 billion in the fourth quarter, the lowest level since the fourth quarter of 2007. The very small change in NCCE resulted from a similarly small change in GPFV. NCCE peaked at $800 billion at the end of 2008, during the financial crisis, when interest rates had plunged and credit spreads were very high. Although market interest rates are now lower than back in 2008, NCCE is well below the $800 billion peak in 2008. The difference between very low current market swap rates and prevailing swap rates in dealers’ interest rate books, which creates credit exposure, has narrowed due to the extended period of low interest rates and the substantial growth in notional derivatives that has occurred during this low-rate period. The yield on the 10-year Treasury note, although up sharply in 2013, has generally been below 3% since the fourth quarter of 2008, at the peak of the financial crisis. Unlike 2008, credit spreads are now very low and the contribution to GPFV from credit contracts has fallen sharply. At December 31, 2013, exposure from credit contracts of $186 billion is $914 billion lower (83%) than $1.1 trillion at December 31, 2008.
8
Legally enforceable netting agreements allowed banks to reduce GPFV exposures by 91.7% ($3.3 trillion) in the fourth quarter, up from 91.5% in the third quarter.
Note: Numbers may not add due to rounding.
The second step in evaluating credit risk involves an estimation of how much the value of a given derivative contract might change in the bank’s favor over the remaining life of the contract; this is referred to as the
0
200
400
600
800
4Q02 4Q03 4Q04 4Q05 4Q06 4Q07 4Q08 4Q09 4Q10 4Q11 4Q12 4Q13
$ bi
llion
s Net Current Credit Exposure
$ in billions 4Q13 3Q13 Change %Gross Positive Fair Value (GPFV) 3,602 3,603 (2) 0%
Netting Benefits 3,303 3,298 5 0%
Net Current Credit Exposure (NCCE) 298 305 (7) -2%
Potential Future Exposure (PFE) 675 704 (29) -4%
Total Credit Exposure (TCE) 973 1,009 (36) -3.6%
Netting Benefit % 91.7% 91.5% 0.2% 0.2%
10 Year Interest Swap Rate 3.09% 2.79% 0.3% 11%
Dollar Index Spot 80.0 80.2 (0.2) 0%
Credit Derivative Index - North America Inv Grade 62.5 82.4 (19.9) -24%
Credit Derivative Index - High Volatility 130.0 180.9 (50.9) -28%
Russell 3000 Index Fund (RAY) 1108.3 1011.6 96.7 10%
Dow Jones-UBS Commodity Index (DJUBS) 125.8 127.1 (1.4) -1%
9
“potential future exposure” (PFE). PFE fell 4% ($29 billion) in the fourth quarter to $675 billion, as derivatives notionals fell. Total credit exposure (PFE plus the NCCE) fell $36 billion (3.6%) to $0.97 trillion in the fourth quarter. The distribution of NCCE in the banking system is concentrated in banks/securities firms (57%) and corporations (34%). Exposure to hedge funds, sovereign governments and monoline financial firms is very small (9% in total). However, the sheer size of aggregate counterparty exposures results in the potential for major losses even in sectors where credit exposure is a small percentage of the total. For example, notwithstanding the minimal share of NCCE to monolines, banks suffered material losses on these exposures during the credit crisis. Because banks have taken credit charges (via credit valuation adjustments) to completely write down their monoline exposures, current credit exposures to monolines are now virtually 0% of total NCCE. Sovereign credit exposures are also a small component (7%) of NCCE and, like monoline exposures before the financial crisis, are largely unsecured. Sovereign exposures are an increasing area of focus for bank supervisors as they review counterparty credit risk.
A more risk sensitive measure of credit exposure would also consider the value of collateral held against counterparty exposures. Commercial banks and savings associations with total assets greater than $10 billion report the fair value of collateral held against various classifications of counterparty exposure. Reporting banks held collateral against 82% of total NCCE at the end of the fourth quarter, up from 80% in the third quarter. Credit exposures to banks/securities firms and hedge funds remain very well secured; banks held collateral against 96% of their current exposure to banks and securities firms, up from 95% in the third quarter. Collateral held against hedge fund exposures was essentially unchanged at 345% in the fourth quarter. Hedge fund exposures have always been very well secured, because banks take “initial margin” on transactions with hedge funds, in addition to fully securing any current credit exposure. Collateral coverage of corporate, monoline and sovereign exposures is much less than for financial institutions and hedge funds, although coverage of corporate exposures has increased significantly over the past year. At the end of the fourth quarter, banks held collateral against 57% of corporate counterparty exposures, up from 52% in the third quarter and 41% a year ago.
Collateral quality held by banks is very high and liquid, with 75.2% held in cash (both U.S. dollar and non-dollar), and an additional 8.3% held in U.S. Treasuries and government agencies. Supervisors assess changes in the quality of collateral held as a key early warning indicator of potential easing in credit terms. Indeed, the quality of collateral held to secure derivatives exposures has slipped slightly over the past year. Cash collateral has fallen from 77.8% of total collateral at December 31, 2012 to 75.2% currently, while “other” collateral has increased from 11.6% to 13.5% over the same period. Examiners review the collateral management practices of derivatives dealers as a regular part of their ongoing supervision activities.
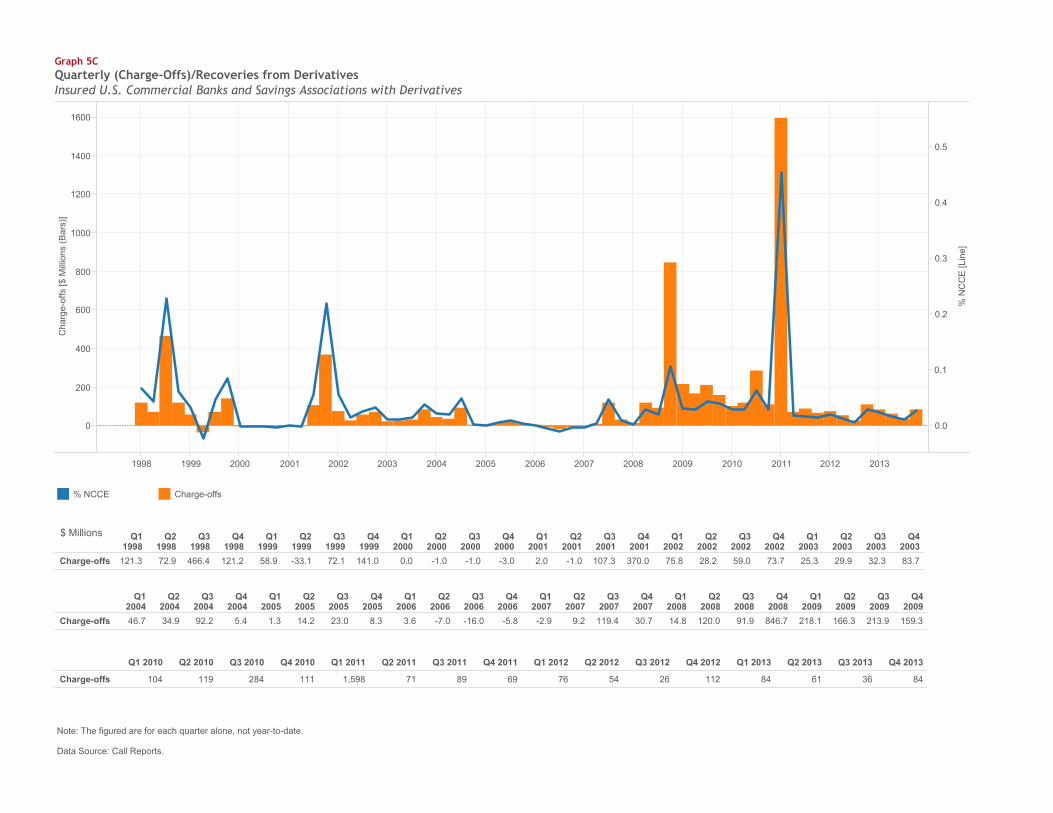
Key credit performance metrics for derivatives receivables slipped in the fourth quarter, with higher charge-offs and past-due contracts. The fair value of derivatives contracts 30 or more days past due increased $7 million to $14.0 million. Past-due derivative contracts represent less than 0.01% of NCCE. Credit performance metrics for both commercial lending and derivatives exposures have improved materially since the end of the financial crisis. During the fourth quarter, 18 banks reported $89 million in charge-offs of derivatives exposures, up from $43 million (17 banks) in the third quarter. Charge-offs in the fourth quarter of 2013 represented 0.03% of the
Net Current Credit ExposureBy Counterparty Type as a % of Total NCCE Banks & Securities
FirmsMonoline
Financial FirmsHedge Funds
Sovereign Governments
Corp and All Other Counterparties Total
Total Commercial Banks 57% 0% 2% 7% 34% 100% Top 4 Commercial Banks 60% 0% 2% 8% 30% 100%
FV of Collateral to Net Current Credit Exposure
Banks & Securities Firms
Monoline Financial Firms
Hedge Funds
Sovereign Governments
Corp and All Other Counterparties
OverallFV/NCCE
Total Commercial Banks 96% 7% 345% 14% 57% 82%
Fair Value of Collateral CashU.S. Dollar
CashOther
U.S. TreasSecurities
U.S. Gov't Agency
CorpBonds
EquitySecurities
All OtherCollateral
Total
Collateral Compostion (%) 45.5% 29.7% 3.1% 5.2% 1.1% 2.0% 13.5% 100.0%
10
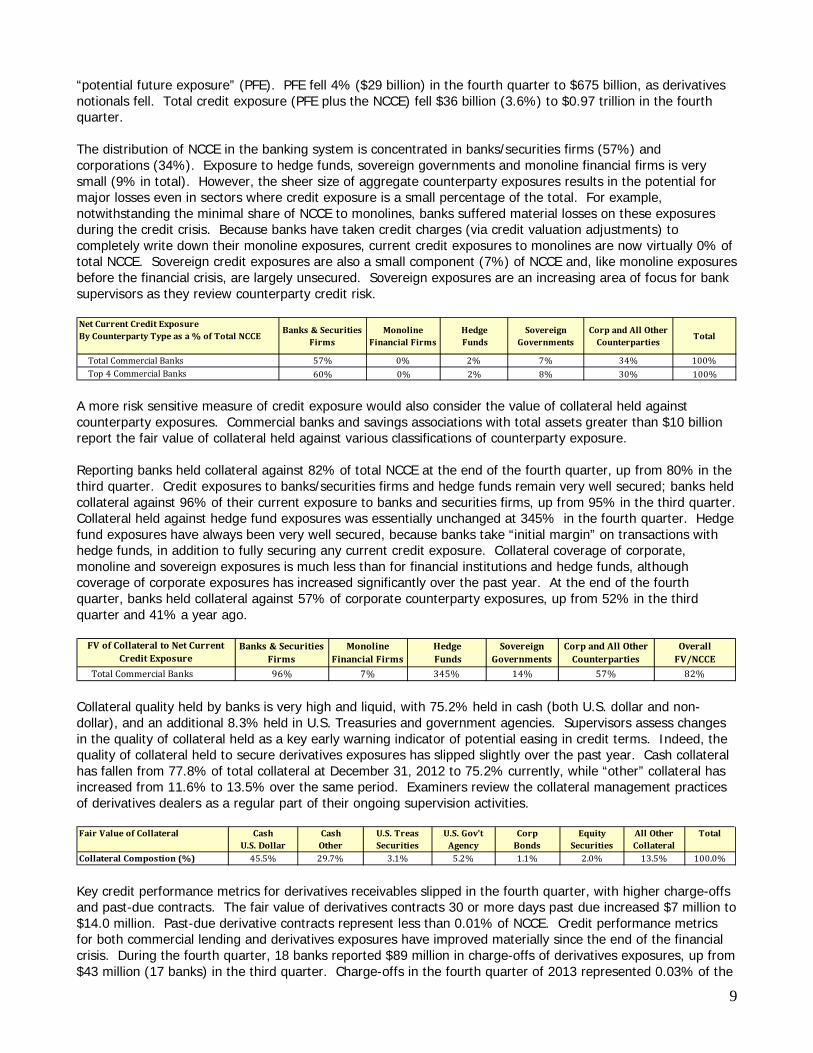
NCCE from derivative contracts. [See Graph 5C.] For comparison purposes, Commercial and Industrial (C&I) loan net charge-offs increased $78 million, or 7%, to $1.2 billion. Net C&I charge-offs were 0.074% of total C&I loans in the fourth quarter, up from 0.07% in the third quarter. Charge-offs of derivatives exposures typically are associated with problem commercial lending exposures, where the borrower has an associated swap transaction. The level of charge-offs of derivatives credit exposures is typically much less than for C&I exposures. Two factors account for the historically favorable charge-off performance of derivatives. First, the credit quality of the typical derivatives counterparty is higher than the credit quality of the typical C&I borrower. Second, most of the large credit exposures from derivatives, whether from other dealers, large non-dealer banks, or hedge funds, are collateralized daily, typically by cash and/or government securities. Market Risk Value-at-Risk Banks control market risk in trading operations primarily by establishing limits against potential losses. VaR is a statistical measure that banks use to quantify the maximum expected loss, over a specified horizon and at a certain confidence level, in normal markets. It is important to emphasize that VaR is not the maximum potential loss; it provides a loss estimate at a specified confidence level. A VaR of $50 million at 99% confidence measured over one trading day, for example, indicates that a trading loss of greater than $50 million in the next day on that portfolio should occur only once in every 100 trading days under normal market conditions. Since VaR does not measure the maximum potential loss, banks stress test trading portfolios to assess the potential for loss beyond the VaR measure. Banks and supervisors have been working to expand the use of stress analyses to complement the VaR risk measurement process that is typically used when assessing a bank’s exposure to market risk.
Data Source: 10K & 10Q Securities and Exchange Commission (SEC) Reports. The large trading banks disclose average VaR data in published financial reports. To provide perspective on the market risk of trading activities, it is useful to compare the VaR numbers over time, and to equity capital and net income. As shown in the table above, market risks reported by the five largest banking companies, as measured by VaR, are small as a percentage of their capital. Because of mergers, and VaR measurement systems incorporating higher volatility price changes throughout the credit crisis (compared to the very low volatility environment prior to the crisis), bank VaR measures had generally increased throughout the credit crisis. After the peak of the financial crisis, as more normal market conditions emerged and Federal Reserve policy accommodation continued, volatility declined and bank VaR measures have broadly trended lower. The VaR data in the table above reflect the VaR of all trading, hedging and risk management activities in the large dealer firms. In the past, our reports have used only the VaR related to trading/intermediation activities. The large dealers also measure risk, using VaR, for non-trading activities such as hedging mortgage servicing rights. Beginning with the first quarter 2012 Quarterly Derivatives Report, the VaR data above reflect the aggregate VaR of each dealer firm, for both trading and non-trading activities. Low market volatility throughout 2012 continued in 2013, and has led to sharply lower VaR measures. While volatility measures increased
$ in millions JPMorgan Chase & Co.
Citigroup Inc.
Bank of America Corp.
The Goldman Sachs Group
Morgan Stanley
Average VaR 2013 $52 $121 $69 $80 $59Average VaR 2012 $152 $148 $75 $86 $73Change in Avg VaR 2013 vs. 2012 ($100) ($27) ($6) ($6) ($14)% Change in Avg VaR 2013 vs. 2012 -66% -18% -8% -7% -19%12-31-13 Equity Capital $211,178 $204,574 $232,685 $78,467 $65,9212013 Net Income $17,923 $13,908 $11,431 $8,040 $2,932Avg VaR 2013 / Equity 0.02% 0.06% 0.03% 0.10% 0.09%Avg VaR 2013 / 2013 Net Income 0.3% 0.9% 0.6% 1.0% 2.0%
11
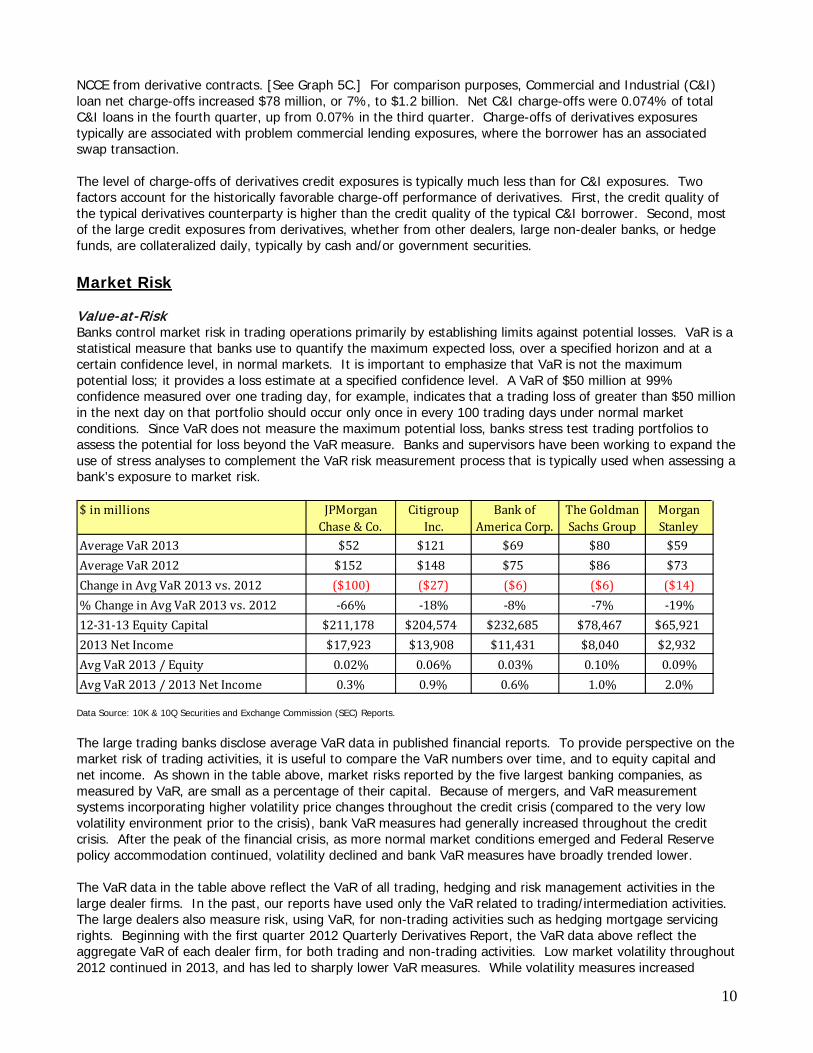
somewhat toward the end of the second quarter, due to concerns about the potential for a federal government shutdown, it has resumed its downward trend through the end of the year. Aggregate average VaR measures across the five largest dealer firms fell $153 million (29%) in 2013 to $381 million. Because of methodological differences in calculating VaR, readers are cautioned that a higher VaR figure at a particular bank may not necessarily imply that the bank has more trading risk than another bank with a lower VaR. For example, JPMorgan, Goldman Sachs and Morgan Stanley calculate VaR using a 95% confidence interval. If those firms used a 99% confidence interval, as does Bank of America and Citigroup, their VaR estimates would be meaningfully higher. The data series used to measure risk also is an important factor in the calculated risk measure. The VaR measure for a single portfolio of exposures will be different if the time period used to measure risk is not the same. Firms using a longer period over which to measure risk may include the higher volatility period of the financial crisis, and therefore their measured VaR will be higher than firms that use a less volatile data series. Indeed, one major reason for the decline in VaR at large trading firms is the sharply lower volatility environment that has prevailed since the end of the financial crisis. While some firms may have reduced their appetite to take market risk, consistent with tepid client demand, the material decline in measured risk across the banking industry is largely a function of the sustained, extremely low, volatility environment. The chart below of the VIX index, which measures the market’s expectation of stock market volatility of S&P 500 index options over the next 30-day period, illustrates the extended period of low volatility.
Source: Bloomberg
To test the effectiveness of VaR measurement systems, trading institutions track the number of times that daily losses exceed VaR estimates. Under the Market Risk Rule, which establishes regulatory capital requirements for U.S. commercial banks and savings associations with significant trading activities, a bank’s capital requirement for market risk is based on its VaR measured at a 99% confidence level and assuming a 10-day holding period. Banks back-test their VaR measure by comparing the actual daily profit or loss to the VaR measure. The results of the back-test determine the size of the multiplier applied to the VaR measure in the risk-based capital calculation. The multiplier adds a safety factor to the capital requirements. An “exception” occurs when a dealer has a daily loss in excess of its VaR measure. Some banks disclose the number of such “exceptions” in their published financial reports. Because of the unusually high market volatility and large write-downs in Collateralized Debt Obligations (CDOs) during the financial crisis, as well as poor market liquidity, a number of banks experienced back-test exceptions and therefore an increase in their capital multiplier. Currently, however, none of the top 4 trading banks are required to hold additional capital for market risk due to back-test exceptions. Level 3 Trading Assets Another measure used to assess market risk is the volume of, and changes in, level 3 trading assets. Since the peak of the financial crisis at the end of 2008, major dealers have sharply reduced the volume of level 3 trading assets. Because the fair value of these illiquid exposures cannot be determined by using observable measures,
0102030405060708090
4Q07 4Q08 4Q09 4Q10 4Q11 4Q12 4Q13
VIX
12
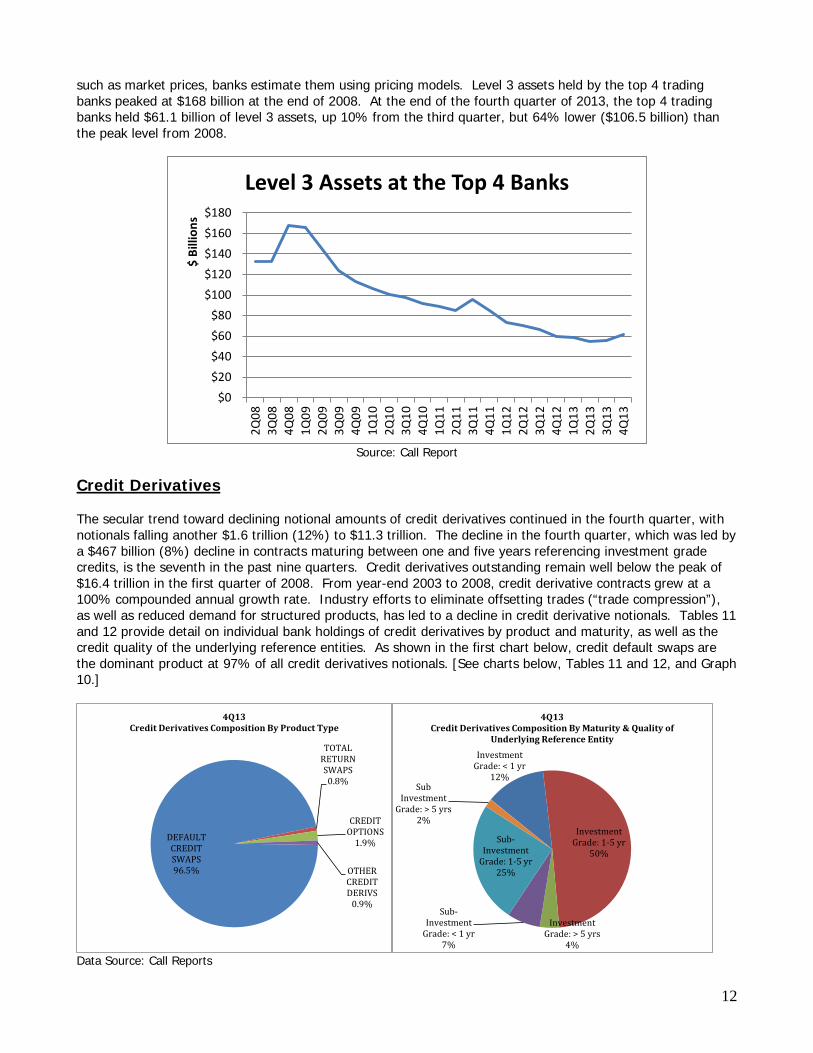
such as market prices, banks estimate them using pricing models. Level 3 assets held by the top 4 trading banks peaked at $168 billion at the end of 2008. At the end of the fourth quarter of 2013, the top 4 trading banks held $61.1 billion of level 3 assets, up 10% from the third quarter, but 64% lower ($106.5 billion) than the peak level from 2008.
Source: Call Report
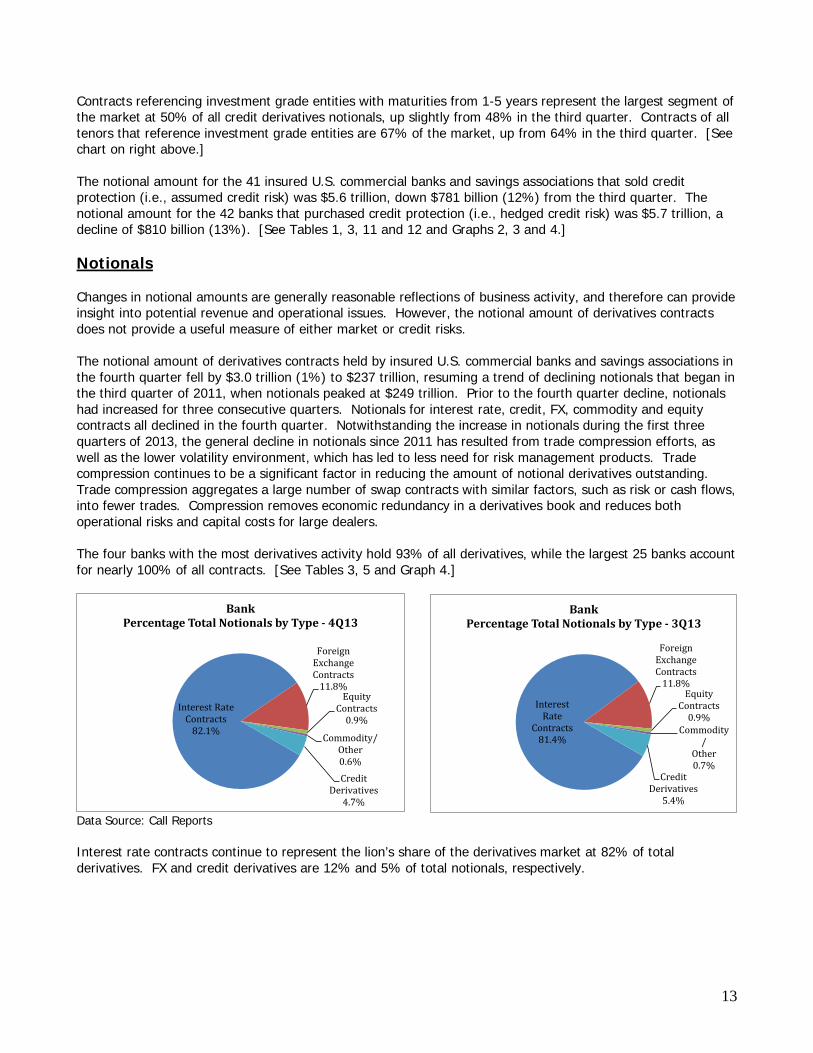
Credit Derivatives The secular trend toward declining notional amounts of credit derivatives continued in the fourth quarter, with notionals falling another $1.6 trillion (12%) to $11.3 trillion. The decline in the fourth quarter, which was led by a $467 billion (8%) decline in contracts maturing between one and five years referencing investment grade credits, is the seventh in the past nine quarters. Credit derivatives outstanding remain well below the peak of $16.4 trillion in the first quarter of 2008. From year-end 2003 to 2008, credit derivative contracts grew at a 100% compounded annual growth rate. Industry efforts to eliminate offsetting trades (“trade compression”), as well as reduced demand for structured products, has led to a decline in credit derivative notionals. Tables 11 and 12 provide detail on individual bank holdings of credit derivatives by product and maturity, as well as the credit quality of the underlying reference entities. As shown in the first chart below, credit default swaps are the dominant product at 97% of all credit derivatives notionals. [See charts below, Tables 11 and 12, and Graph 10.]
Data Source: Call Reports
$0$20$40$60$80
$100$120$140$160$180
2Q08
3Q08
4Q08
1Q09
2Q09
3Q09
4Q09
1Q10
2Q10
3Q10
4Q10
1Q11
2Q11
3Q11
4Q11
1Q12
2Q12
3Q12
4Q12
1Q13
2Q13
3Q13
4Q13
$ Bi
llion
sLevel 3 Assets at the Top 4 Banks
DEFAULT CREDIT SWAPS96.5%
TOTAL RETURN SWAPS
0.8%
CREDIT OPTIONS
1.9%
OTHER CREDIT DERIVS
0.9%
4Q13Credit Derivatives Composition By Product Type
Investment Grade: < 1 yr
12%
Investment Grade: 1-5 yr
50%
Investment Grade: > 5 yrs
4%
Sub-Investment
Grade: < 1 yr7%
Sub-Investment
Grade: 1-5 yr25%
Sub Investment
Grade: > 5 yrs2%
4Q13Credit Derivatives Composition By Maturity & Quality of
Underlying Reference Entity
13
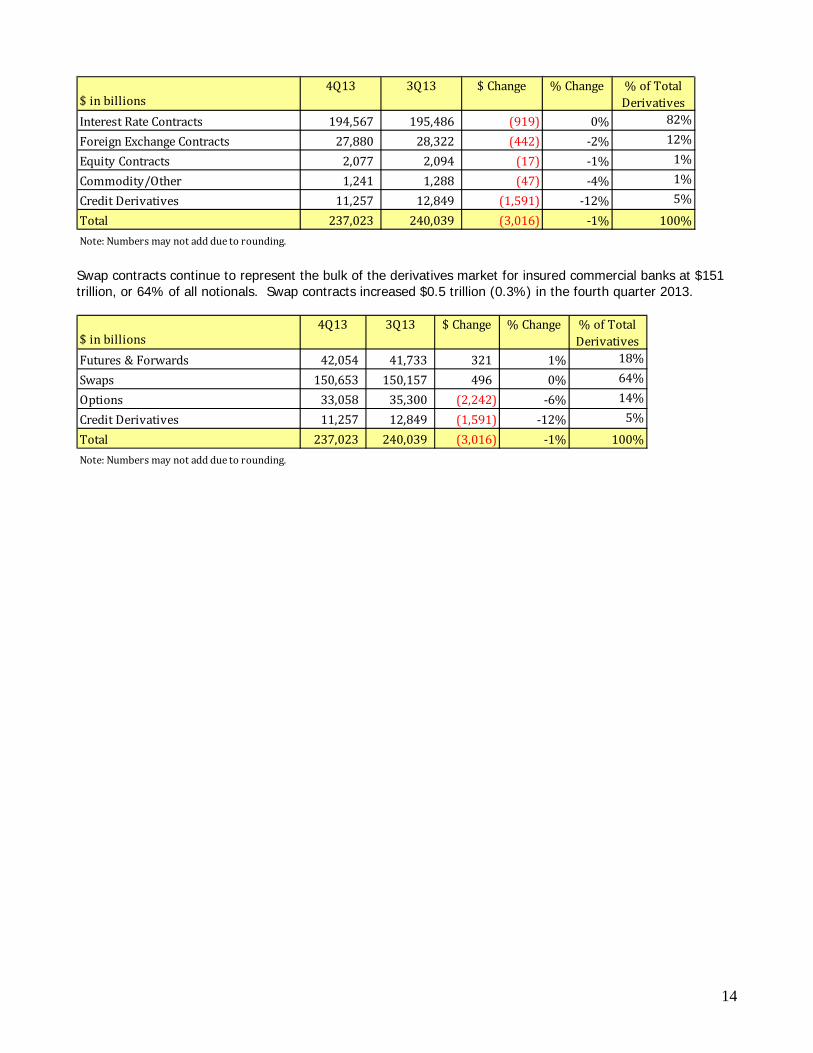
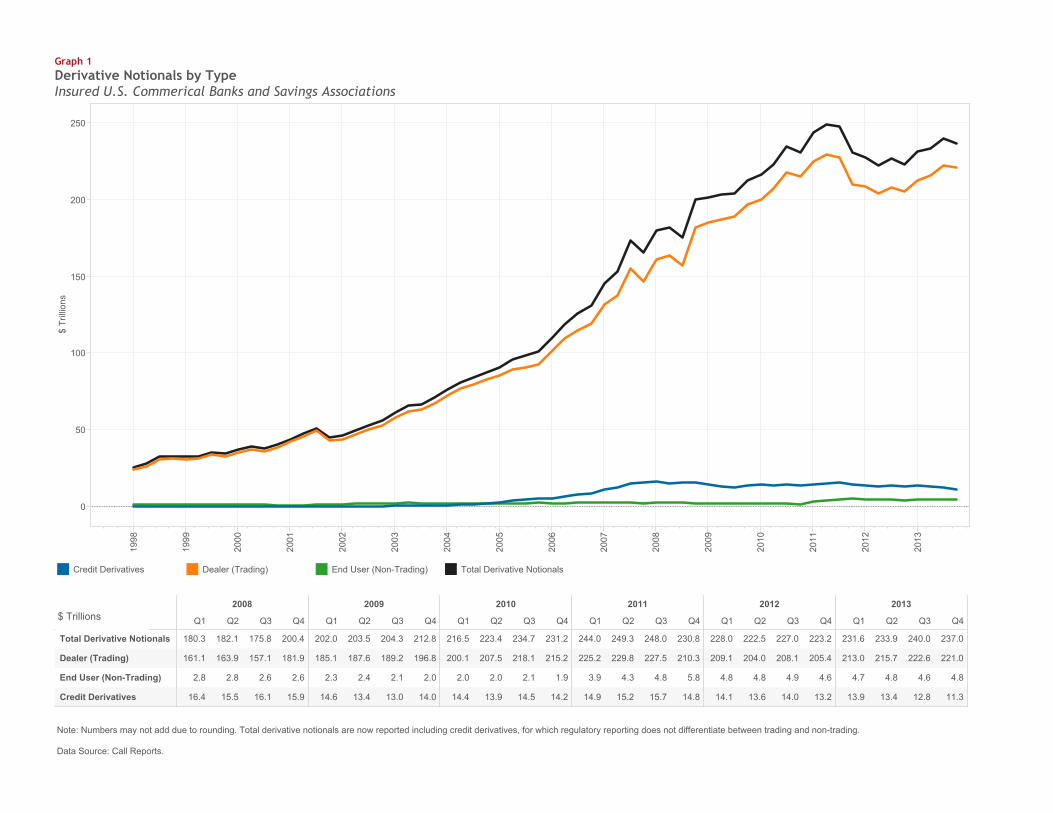
Contracts referencing investment grade entities with maturities from 1-5 years represent the largest segment of the market at 50% of all credit derivatives notionals, up slightly from 48% in the third quarter. Contracts of all tenors that reference investment grade entities are 67% of the market, up from 64% in the third quarter. [See chart on right above.] The notional amount for the 41 insured U.S. commercial banks and savings associations that sold credit protection (i.e., assumed credit risk) was $5.6 trillion, down $781 billion (12%) from the third quarter. The notional amount for the 42 banks that purchased credit protection (i.e., hedged credit risk) was $5.7 trillion, a decline of $810 billion (13%). [See Tables 1, 3, 11 and 12 and Graphs 2, 3 and 4.] Notionals Changes in notional amounts are generally reasonable reflections of business activity, and therefore can provide insight into potential revenue and operational issues. However, the notional amount of derivatives contracts does not provide a useful measure of either market or credit risks. The notional amount of derivatives contracts held by insured U.S. commercial banks and savings associations in the fourth quarter fell by $3.0 trillion (1%) to $237 trillion, resuming a trend of declining notionals that began in the third quarter of 2011, when notionals peaked at $249 trillion. Prior to the fourth quarter decline, notionals had increased for three consecutive quarters. Notionals for interest rate, credit, FX, commodity and equity contracts all declined in the fourth quarter. Notwithstanding the increase in notionals during the first three quarters of 2013, the general decline in notionals since 2011 has resulted from trade compression efforts, as well as the lower volatility environment, which has led to less need for risk management products. Trade compression continues to be a significant factor in reducing the amount of notional derivatives outstanding. Trade compression aggregates a large number of swap contracts with similar factors, such as risk or cash flows, into fewer trades. Compression removes economic redundancy in a derivatives book and reduces both operational risks and capital costs for large dealers. The four banks with the most derivatives activity hold 93% of all derivatives, while the largest 25 banks account for nearly 100% of all contracts. [See Tables 3, 5 and Graph 4.]
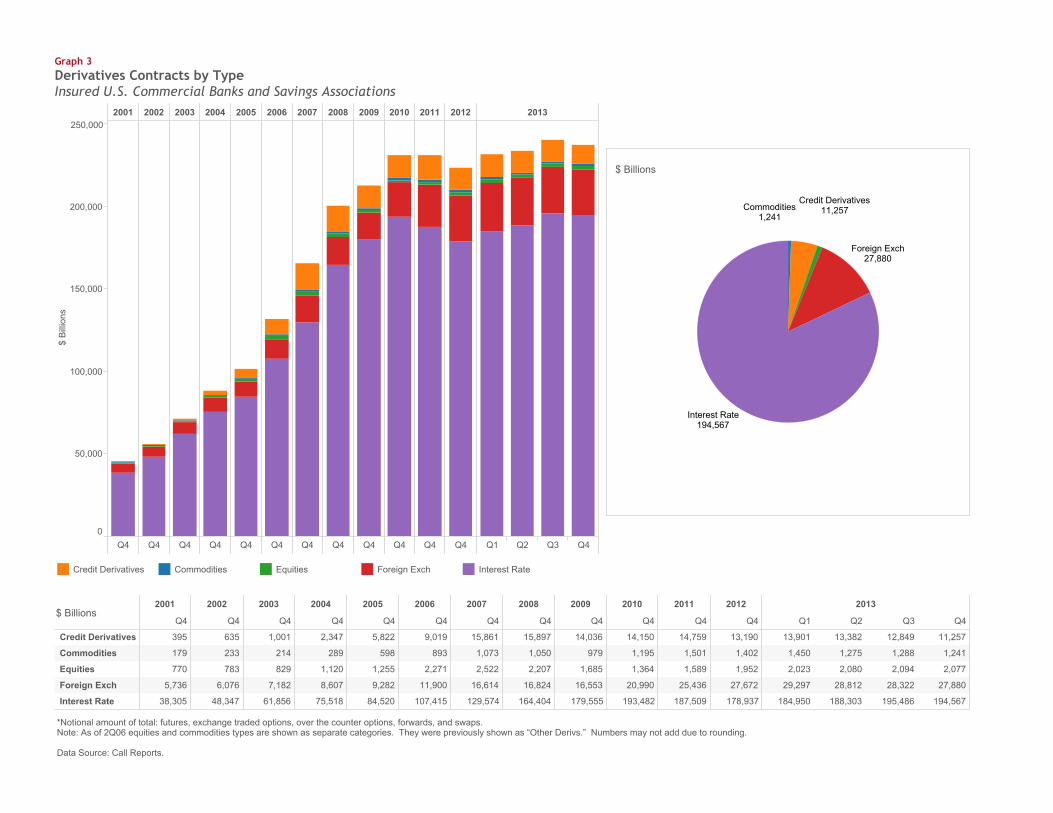
Data Source: Call Reports Interest rate contracts continue to represent the lion’s share of the derivatives market at 82% of total derivatives. FX and credit derivatives are 12% and 5% of total notionals, respectively.
Interest Rate Contracts
82.1%
Foreign Exchange Contracts
11.8%Equity
Contracts0.9%
Commodity/Other0.6%Credit
Derivatives4.7%
BankPercentage Total Notionals by Type - 4Q13
Interest Rate
Contracts81.4%
Foreign Exchange Contracts
11.8%Equity
Contracts0.9%
Commodity/
Other0.7%
Credit Derivatives
5.4%
BankPercentage Total Notionals by Type - 3Q13
14
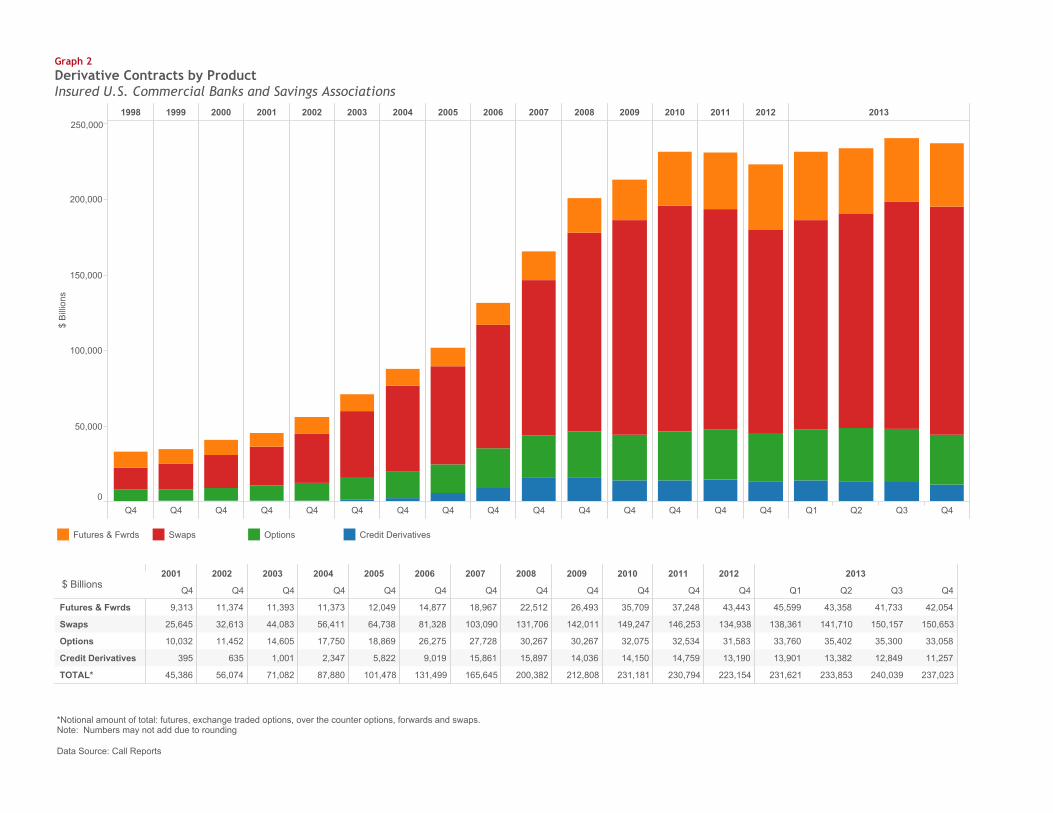
Swap contracts continue to represent the bulk of the derivatives market for insured commercial banks at $151 trillion, or 64% of all notionals. Swap contracts increased $0.5 trillion (0.3%) in the fourth quarter 2013.
$ in billions4Q13 3Q13 $ Change % Change % of Total
DerivativesInterest Rate Contracts 194,567 195,486 (919) 0% 82%
Foreign Exchange Contracts 27,880 28,322 (442) -2% 12%
Equity Contracts 2,077 2,094 (17) -1% 1%
Commodity/Other 1,241 1,288 (47) -4% 1%
Credit Derivatives 11,257 12,849 (1,591) -12% 5%
Total 237,023 240,039 (3,016) -1% 100%Note: Numbers may not add due to rounding.
$ in billions4Q13 3Q13 $ Change % Change % of Total
DerivativesFutures & Forwards 42,054 41,733 321 1% 18%
Swaps 150,653 150,157 496 0% 64%
Options 33,058 35,300 (2,242) -6% 14%
Credit Derivatives 11,257 12,849 (1,591) -12% 5%
Total 237,023 240,039 (3,016) -1% 100%Note: Numbers may not add due to rounding.
15
GLOSSARY OF TERMS Bilateral Netting: A legally enforceable arrangement between a bank and a counterparty that creates a single legal obligation covering all included individual contracts. This means that a bank’s receivable or payable, in the event of the default or insolvency of one of the parties, would be the net sum of all positive and negative fair values of contracts included in the bilateral netting arrangement. Credit Derivative: A financial contract that allows a party to take, or reduce, credit exposure (generally on a bond, loan or index). Our derivatives survey includes over-the-counter (OTC) credit derivatives, such as credit default swaps, total return swaps, and credit spread options. Derivative: A financial contract whose value is derived from the performance of underlying market factors, such as interest rates, currency exchange rates, commodity, credit, and equity prices. Derivative transactions include a wide assortment of financial contracts including structured debt obligations and deposits, swaps, futures, options, caps, floors, collars, forwards and various combinations thereof. Gross Negative Fair Value (GNFV): The sum total of the fair values of contracts where the bank owes money to its counterparties, without taking into account netting. This represents the maximum losses the bank’s counterparties would incur if the bank defaults and there is no netting of contracts, and no bank collateral was held by the counterparties. Gross negative fair values associated with credit derivatives are included. Gross Positive Fair Value (GPFV): The sum total of the fair values of contracts where the bank is owed money by its counterparties, without taking into account netting. This represents the maximum losses a bank could incur if all its counterparties default and there is no netting of contracts, and the bank holds no counterparty collateral. Gross positive fair values associated with credit derivatives are included. Net Current Credit Exposure (NCCE): For a portfolio of derivative contracts, NCCE is the gross positive fair value of contracts less the dollar amount of netting benefits. On any individual contract, current credit exposure (CCE) is the fair value of the contract if positive, and zero when the fair value is negative or zero. NCCE is also the net amount owed to banks if all contracts were immediately liquidated. Notional Amount: The nominal or face amount that is used to calculate payments made on swaps and other risk management products. This amount generally does not change hands and is thus referred to as notional. Over-the-Counter Derivative Contracts: Privately negotiated derivative contracts that are transacted off organized exchanges. Potential Future Exposure (PFE): An estimate of what the current credit exposure (CCE) could be over time, based upon a supervisory formula in the agencies’ risk-based capital rules. PFE is generally determined by multiplying the notional amount of the contract by a credit conversion factor that is based upon the underlying market factor (e.g., interest rates, commodity prices, equity prices, etc.) and the contract’s remaining maturity. However, the risk-based capital rules permit banks to adjust the formulaic PFE measure by the “net to gross ratio,” which proxies the risk-reduction benefits attributable to a valid bilateral netting contract. PFE data in this report uses the amounts upon which banks hold risk-based capital. Total Credit Exposure (TCE): The sum total of net current credit exposure (NCCE) and potential future exposure (PFE). Total Risk-Based Capital: The sum of tier 1 plus tier 2 capital. Tier 1 capital consists of common shareholders’ equity, perpetual preferred shareholders’ equity with noncumulative dividends, retained earnings, and minority interests in the equity accounts of consolidated subsidiaries. Tier 2 capital consists of subordinated debt, intermediate-term preferred stock, cumulative and long-term preferred stock, and a portion of a bank’s allowance for loan and lease losses.
1998
1999
2000
2001
2002
2003
2004
2005
2006
2007
2008
2009
2010
2011
2012
2013
0
50
100
150
200
250
$ Trillions
Graph 1
Derivative Notionals by TypeInsured U.S. Commerical Banks and Savings Associations
2008
Q1 Q2 Q3 Q4
2009
Q1 Q2 Q3 Q4
2010
Q1 Q2 Q3 Q4
2011
Q1 Q2 Q3 Q4
2012
Q1 Q2 Q3 Q4
2013
Q1 Q2 Q3 Q4
Total Derivative Notionals
Dealer (Trading)
End User (Non-Trading)
Credit Derivatives 15.9
2.6
181.9
200.4
16.1
2.6
157.1
175.8
15.5
2.8
163.9
182.1
16.4
2.8
161.1
180.3
14.0
2.0
196.8
212.8
13.0
2.1
189.2
204.3
13.4
2.4
187.6
203.5
14.6
2.3
185.1
202.0
14.2
1.9
215.2
231.2
14.5
2.1
218.1
234.7
13.9
2.0
207.5
223.4
14.4
2.0
200.1
216.5
14.8
5.8
210.3
230.8
15.7
4.8
227.5
248.0
15.2
4.3
229.8
249.3
14.9
3.9
225.2
244.0
13.2
4.6
205.4
223.2
14.0
4.9
208.1
227.0
13.6
4.8
204.0
222.5
14.1
4.8
209.1
228.0
11.3
4.8
221.0
237.0
12.8
4.6
222.6
240.0
13.4
4.8
215.7
233.9
13.9
4.7
213.0
231.6
Credit Derivatives Dealer (Trading) End User (Non-Trading) Total Derivative Notionals
Note: Numbers may not add due to rounding. Total derivative notionals are now reported including credit derivatives, for which regulatory reporting does not differentiate between trading and non-trading. Data Source: Call Reports.
$ Trillions
1998 1999 2000 2001 2002 2003 2004 2005 2006 2007 2008 2009 2010 2011 2012 2013
Q4 Q4 Q4 Q4 Q4 Q4 Q4 Q4 Q4 Q4 Q4 Q4 Q4 Q4 Q4 Q1 Q2 Q3 Q4
0
50,000
100,000
150,000
200,000
250,000
$ Billions
Graph 2
Derivative Contracts by ProductInsured U.S. Commercial Banks and Savings Associations
2001
Q4
2002
Q4
2003
Q4
2004
Q4
2005
Q4
2006
Q4
2007
Q4
2008
Q4
2009
Q4
2010
Q4
2011
Q4
2012
Q4
2013
Q1 Q2 Q3 Q4
Futures & Fwrds
Swaps
Options
Credit Derivatives
TOTAL* 45,386
395
10,032
25,645
9,313
56,074
635
11,452
32,613
11,374
71,082
1,001
14,605
44,083
11,393
87,880
2,347
17,750
56,411
11,373
101,478
5,822
18,869
64,738
12,049
131,499
9,019
26,275
81,328
14,877
165,645
15,861
27,728
103,090
18,967
200,382
15,897
30,267
131,706
22,512
212,808
14,036
30,267
142,011
26,493
231,181
14,150
32,075
149,247
35,709
230,794
14,759
32,534
146,253
37,248
223,154
13,190
31,583
134,938
43,443
237,023
11,257
33,058
150,653
42,054
240,039
12,849
35,300
150,157
41,733
233,853
13,382
35,402
141,710
43,358
231,621
13,901
33,760
138,361
45,599
Futures & Fwrds Swaps Options Credit Derivatives
*Notional amount of total: futures, exchange traded options, over the counter options, forwards and swaps.Note: Numbers may not add due to rounding Data Source: Call Reports
$ Billions
2001 2002 2003 2004 2005 2006 2007 2008 2009 2010 2011 2012 2013
Q4 Q4 Q4 Q4 Q4 Q4 Q4 Q4 Q4 Q4 Q4 Q4 Q1 Q2 Q3 Q4
0
50,000
100,000
150,000
200,000
250,000
$ Billions
Graph 3
Derivatives Contracts by TypeInsured U.S. Commercial Banks and Savings Associations
2001
Q4
2002
Q4
2003
Q4
2004
Q4
2005
Q4
2006
Q4
2007
Q4
2008
Q4
2009
Q4
2010
Q4
2011
Q4
2012
Q4
2013
Q1 Q2 Q3 Q4
Credit Derivatives
Commodities
Equities
Foreign Exch
Interest Rate 38,305
5,736
770
179
395
48,347
6,076
783
233
635
61,856
7,182
829
214
1,001
75,518
8,607
1,120
289
2,347
84,520
9,282
1,255
598
5,822
107,415
11,900
2,271
893
9,019
129,574
16,614
2,522
1,073
15,861
164,404
16,824
2,207
1,050
15,897
179,555
16,553
1,685
979
14,036
193,482
20,990
1,364
1,195
14,150
187,509
25,436
1,589
1,501
14,759
178,937
27,672
1,952
1,402
13,190
194,567
27,880
2,077
1,241
11,257
195,486
28,322
2,094
1,288
12,849
188,303
28,812
2,080
1,275
13,382
184,950
29,297
2,023
1,450
13,901
Credit Derivatives Commodities Equities Foreign Exch Interest Rate
Commodities1,241
Credit Derivatives11,257
Foreign Exch27,880
Interest Rate194,567
*Notional amount of total: futures, exchange traded options, over the counter options, forwards, and swaps. Note: As of 2Q06 equities and commodities types are shown as separate categories. They were previously shown as “Other Derivs.” Numbers may not add due to rounding. Data Source: Call Reports.
$ Billions
$ Billions

0 20,000 40,000 60,000 80,000 100,000 120,000 140,000 160,000 180,000 200,000 220,000 240,000$ Billions
Futures &Fwrds
Swaps
Options
CreditDerivatives
TOTAL*
Graph 4
Four Banks Dominate in DerivativesInsured U.S. Commercial Banks and Savings Associations
$ Top 4 Banks % Top 4 Banks Tot Derivs $ All Other Banks% All Other Banks Tot
Derivs $ All Banks % All BanksTot Derivs
Futures & Fwrds
Swaps
Options
Credit Derivatives
TOTAL* 100
5
14
64
18
237,023
11,257
33,058
150,653
42,054
7
0
1
4
2
17,224
440
2,113
9,940
4,731
93
5
13
59
16
219,799
10,817
30,946
140,713
37,323
Concentration of Derivative Contracts
$ Top 4 Banks $ All Other Banks
*Notional amount of total: futures, exchange traded options, over the counter options, forwards, and swaps. Data Source: Call Reports.
$ Billions

2009
Q1 Q2 Q3 Q4
2010
Q1 Q2 Q3 Q4
2011
Q1 Q2 Q3 Q4
2012
Q1 Q2 Q3 Q4
2013
Q1 Q2 Q3 Q4
JPMORGAN CHASE
BANK OF AMERICA
CITIBANK
GOLDMAN
% Top 4 Banks 284.3
766.4
179.8
150.7
264.8
310.9
858.0
202.5
134.7
289.7
206.8
921.1
209.1
136.8
283.0
286.5
1,047.7
212.8
169.4
322.8
260.5
629.1
179.7
173.7
264.8
288.5
637.7
193.8
172.2
266.9
292.8
690.1
171.3
162.2
257.3
266.6
671.8
179.8
161.2
265.7
316.4
794.0
177.1
176.0
255.9
333.7
801.4
195.1
186.7
285.2
323.1
787.8
202.6
182.3
274.5
317.6
780.6
182.8
181.5
275.4
309.9
704.8
174.5
132.4
228.0
321.8
727.2
174.4
139.3
246.3
325.1
738.3
174.1
141.4
246.4
330.7
751.2
172.2
148.6
250.7
298.4
740.9
151.9
117.4
183.2
302.7
719.2
164.9
121.3
205.5
300.2
692.5
167.2
124.6
216.5
305.0
703.5
169.3
129.3
218.0
2009 2010 2011 2012 2013
Q1 Q2 Q3 Q4 Q1 Q2 Q3 Q4 Q1 Q2 Q3 Q4 Q1 Q2 Q3 Q4 Q1 Q2 Q3 Q4
0
100
200
300
%
JPMorgan Chase Bank, N.A.2009 2010 2011 2012 2013
Q1 Q2 Q3 Q4 Q1 Q2 Q3 Q4 Q1 Q2 Q3 Q4 Q1 Q2 Q3 Q4 Q1 Q2 Q3 Q4
0
50
100
150
%
Bank of America, N.A.
2009 2010 2011 2012 2013
Q1 Q2 Q3 Q4 Q1 Q2 Q3 Q4 Q1 Q2 Q3 Q4 Q1 Q2 Q3 Q4 Q1 Q2 Q3 Q4
0
50
100
150
200
%
Citibank, N.A.F1
2008 2009 2010 2011 2012 2013
Q1Q2Q3Q4Q1Q2Q3Q4Q1Q2Q3Q4Q1Q2Q3Q4Q1Q2Q3Q4Q1Q2Q3Q4
0
500
1000
%
Goldman Sachs Bank USA
Total Credit Exposure to Risk Based Capital (%)
Graph 5A
Credit Exposure to Risk Based CapitalTop 4 Insured U.S. Commercial Banks and Savings Associations by Derivative Holdings
Note: The methodology to calculate the Credit Risk Exposure to Capital ratio for the Top 4 category uses a weighted average of total current credit exposure. Data Source: Call Reports.

1997 Q1
1999 Q1
2001 Q1
2003 Q1
2005 Q1
2007 Q1
2009 Q1
2011 Q1
2013 Q1
0
20
40
60
80
Netting Benefit [%]
Graph 5BNetting Benefit: Amount of Gross Credit Exposure Eliminated Through Bilateral NettingTop 4 Insured U.S. Commercial Banks and Savings Associations by Derivative Holdings
1998
Q1 Q2 Q3 Q4
1999
Q1 Q2 Q3 Q4
2000
Q1 Q2 Q3 Q4
2001
Q1 Q2 Q3 Q4
61.7358.9354.6450.57 60.9462.7462.9561.51 69.3065.3766.8061.98 73.8075.5271.4770.42
Netting Benefit (%)*
2002
Q1 Q2 Q3 Q4
2003
Q1 Q2 Q3 Q4
2004
Q1 Q2 Q3 Q4
2005
Q1 Q2 Q3 Q4
81.5079.8976.1675.66 81.6883.7983.2981.68 83.6884.2883.0884.17 84.9084.7186.8683.95
2006
Q1 Q2 Q3 Q4
2007
Q1 Q2 Q3 Q4
2008
Q1 Q2 Q3 Q4
2009
Q1 Q2 Q3 Q4
84.69185.45085.38584.886 84.75983.94386.35785.240 88.73484.29385.26785.648 90.16989.65788.04389.016
2010
Q1 Q2 Q3 Q4
2011
Q1 Q2 Q3 Q4
2012
Q1 Q2 Q3 Q4
2013
Q1 Q2 Q3 Q4
91.05692.10391.92791.036 92.21391.62690.77590.438 91.89991.94391.86591.818 91.72091.52990.95691.565
*The netting benefit is defined as: $ amount of netting benefits/gross positive fair value. Data Source: Call Reports.
1998 1999 2000 2001 2002 2003 2004 2005 2006 2007 2008 2009 2010 2011 2012 2013
0
200
400
600
800
1000
1200
1400
1600
Charge-offs [$ Millions (Bars)]
0.0
0.1
0.2
0.3
0.4
0.5
% NCCE [Line]
Graph 5CQuarterly (Charge-Offs)/Recoveries from DerivativesInsured U.S. Commercial Banks and Savings Associations with Derivatives
Q11998
Q21998
Q31998
Q41998
Q11999
Q21999
Q31999
Q41999
Q12000
Q22000
Q32000
Q42000
Q12001
Q22001
Q32001
Q42001
Q12002
Q22002
Q32002
Q42002
Q12003
Q22003
Q32003
Q42003
Charge-offs 83.732.329.925.373.759.028.275.8370.0107.3-1.02.0-3.0-1.0-1.00.0141.072.1-33.158.9121.2466.472.9121.3
% NCCE Charge-offs
Q12004
Q22004
Q32004
Q42004
Q12005
Q22005
Q32005
Q42005
Q12006
Q22006
Q32006
Q42006
Q12007
Q22007
Q32007
Q42007
Q12008
Q22008
Q32008
Q42008
Q12009
Q22009
Q32009
Q42009
Charge-offs 159.3213.9166.3218.1846.791.9120.014.830.7119.49.2-2.9-5.8-16.0-7.03.68.323.014.21.35.492.234.946.7
Q1 2010 Q2 2010 Q3 2010 Q4 2010 Q1 2011 Q2 2011 Q3 2011 Q4 2011 Q1 2012 Q2 2012 Q3 2012 Q4 2012 Q1 2013 Q2 2013 Q3 2013 Q4 2013
Charge-offs 843661841122654766989711,598111284119104
Note: The figured are for each quarter alone, not year-to-date. Data Source: Call Reports.
$ Millions

Q2 2002 Q2 2003 Q2 2004 Q2 2005 Q2 2006 Q2 2007 Q2 2008 Q2 2009 Q2 2010 Q2 2011 Q2 2012 Q2 2013
0
500
1,000
1,500
$ Millions
Graph 5DQuarterly (Charge-Offs)/Recoveries from DerivativesInsured U.S. Commercial Banks and Savings Associations with Derivatives Compared with Holding Companies
2002
Q1 Q2 Q3 Q4
2003
Q1 Q2 Q3 Q4
2004
Q1 Q2 Q3 Q4
2005
Q1 Q2 Q3 Q4
Banks
Holding Companies 73.7
70.0
66.0
70.0
21.2
25.1
75.8
67.9
127.8
10.0
31.4
32.3
32.9
25.5
25.3
29.7
9.0
5.4
93.2
91.5
39.4
-39.0
51.2
120.0
18.1
8.3
45.1
23.0
3.6
14.2
54.9
1.3
2006
Q1 Q2 Q3 Q4
2007
Q1 Q2 Q3 Q4
2008
Q1 Q2 Q3 Q4
2009
Q1 Q2 Q3 Q4
Banks
Holding Companies -7
-6
-28
-16
5
-7
35
4
32
31
119
119
10
9
-3
-3
1,191
847
93
92
120
120
15
15
164
159
266
214
477
166
1,570
218
2010
Q1 Q2 Q3 Q4
2011
Q1 Q2 Q3 Q4
2012
Q1 Q2 Q3 Q4
2013
Q1 Q2 Q3 Q4
Banks
Holding Companies 87
111
181
284
288
119
122
104
73
69
92
89
68
71
1,617
1,598
133
112
35
26
64
55
85
76
115
84
43
36
65
61
85
84
Banks Holding Companies
Note: The figures are for each quarter alone, not year-to-date. Data Source: Call Reports & Y-9.
$ Millions

2009
Q1 Q2 Q3 Q4
2010
Q1 Q2 Q3 Q4
2011
Q1 Q2 Q3 Q4
2012
Q1 Q2 Q3 Q4
2013
Q1 Q2 Q3 Q4
Comdty & Other
Credit
Equity
Foreign Exchange
Interest Rate
Total Trading Revenue* 1,932
-1,188
2,560
144
27
389
5,720
5,451
-1,535
154
1,204
446
5,172
1,108
2,132
-279
1,930
281
9,768
9,099
2,437
1,042
-3,154
344
3,479
1,469
1,905
338
-485
252
4,176
4,215
-1,047
371
543
94
6,600
145
4,261
378
1,840
-25
8,263
333
3,962
965
2,707
297
2,525
253
1,940
-119
193
258
8,484
2,125
2,595
1,442
1,764
558
7,357
4,320
491
736
1,507
304
7,409
4,587
35
743
1,729
315
4,356
4,151
753
136
-713
30
5,264
4,457
890
638
-1,242
521
1,976
2,870
2,120
1,010
-4,243
219
6,359
5,627
1,505
260
-1,444
412
2,947
460
1,532
471
219
265
4,475
3,088
499
230
177
481
7,276
2,768
3,135
921
170
282
7,486
2,217
3,185
831
889
364
Q4 2008 Q2 2009 Q4 2009 Q2 2010 Q4 2010 Q2 2011 Q4 2011 Q2 2012 Q4 2012 Q2 2013 Q4 2013
-10,000
-5,000
0
5,000
10,000
$ Millions
Graph 6AQuarterly Trading Revenues Cash & Derivative PositionsInsured U.S. Commercial Banks and Savings Associations
Comdty & Other Credit Equity Foreign Exchange Interest Rate Total Trading Revenue*
*The trading revenue figures above are for cash and derivative activities. Revenue figures are for each quarter alone, not year-to-date.Note: Numbers may not add due to rounding. Data Source: Call Reports
$ Millions
2009
Q1 Q2 Q3 Q4
2010
Q1 Q2 Q3 Q4
2011
Q1 Q2 Q3 Q4
2012
Q1 Q2 Q3 Q4
2013
Q1 Q2 Q3 Q4
JPMorgan Chase (JPM)
Bank America (BAC)
Citibank (C)
Goldman Sachs (GS)
Total % (Top 4 Banks)
Total % (All Banks) 1.29
1.20
72.41
-12.40
2.19
2.99
3.77
5.38
58.96
-1.53
2.67
13.82
3.19
3.63
62.83
-1.75
-0.77
8.93
5.95
12.05
68.54
8.36
8.34
12.84
2.31
3.72
7.04
2.11
2.17
6.35
2.74
6.39
60.63
4.76
5.24
5.39
4.29
11.04
53.14
14.35
4.23
11.74
5.24
9.65
71.25
12.00
5.78
15.57
1.75
2.50
30.93
1.18
0.07
4.33
5.67
13.99
56.57
14.79
9.48
14.82
4.89
11.60
57.61
11.06
5.60
14.32
4.93
11.12
54.26
9.31
6.34
14.34
2.71
5.72
17.68
3.94
1.35
10.50
3.26
8.16
33.26
5.74
1.28
14.56
1.26
2.45
12.48
5.36
4.16
-2.51
3.93
8.53
65.27
10.23
0.67
10.24
1.91
2.79
24.45
7.33
-1.58
1.23
2.94
6.68
11.54
6.30
2.14
10.61
4.56
9.57
37.30
11.80
-5.97
18.66
4.60
10.43
32.65
7.49
3.39
18.59
Trading Revenue to Gross Revenue (%)*
2009 2010 2011 2012 2013
Q1 Q2 Q3 Q4 Q1 Q2 Q3 Q4 Q1 Q2 Q3 Q4 Q1 Q2 Q3 Q4 Q1 Q2 Q3 Q4
0
10
%
JPMorgan Chase Bank, N.A.2009 2010 2011 2012 2013
Q1 Q2 Q3 Q4 Q1 Q2 Q3 Q4 Q1 Q2 Q3 Q4 Q1 Q2 Q3 Q4 Q1 Q2 Q3 Q4
-5
0
5
10
Bank America (BAC)
Bank of America, N.A.
2009 2010 2011 2012 2013
Q1 Q2 Q3 Q4 Q1 Q2 Q3 Q4 Q1 Q2 Q3 Q4 Q1 Q2 Q3 Q4 Q1 Q2 Q3 Q4
0
20
40
60
%
Goldman Sachs Bank USA2009 2010 2011 2012 2013
Q1 Q2 Q3 Q4 Q1 Q2 Q3 Q4 Q1 Q2 Q3 Q4 Q1 Q2 Q3 Q4 Q1 Q2 Q3 Q4
-10
0
10
%
Citibank, N.A.
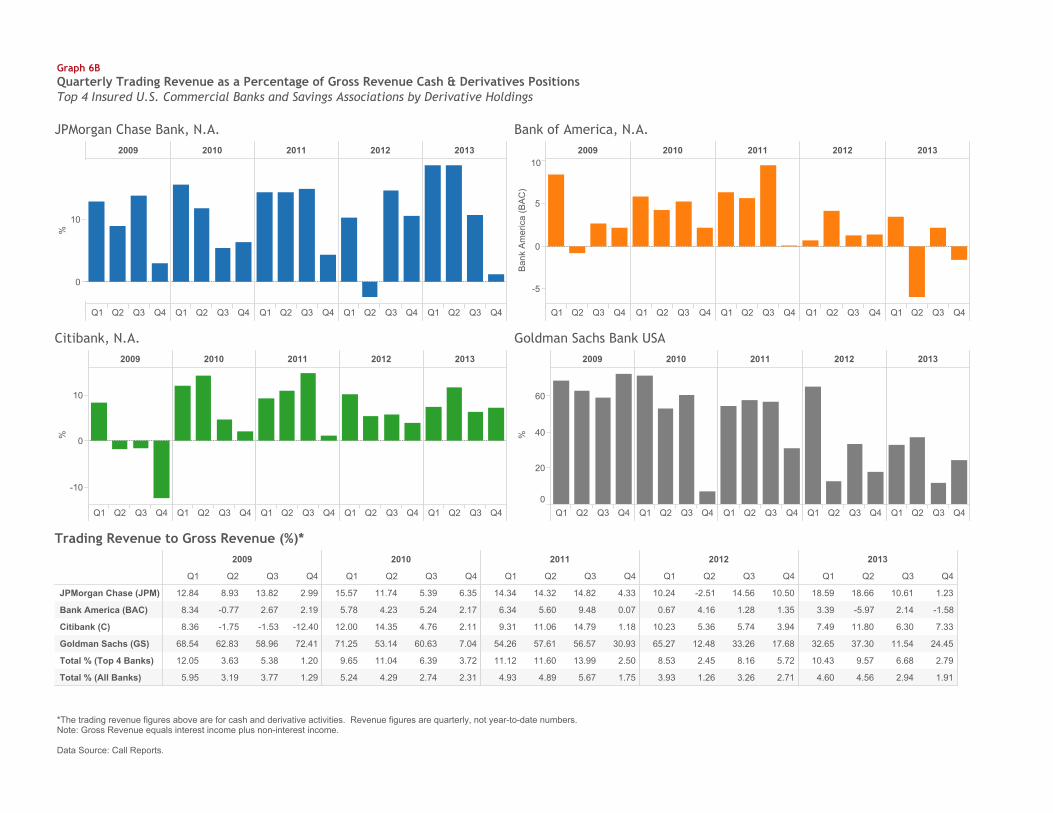
Graph 6BQuarterly Trading Revenue as a Percentage of Gross Revenue Cash & Derivatives PositionsTop 4 Insured U.S. Commercial Banks and Savings Associations by Derivative Holdings
*The trading revenue figures above are for cash and derivative activities. Revenue figures are quarterly, not year-to-date numbers.Note: Gross Revenue equals interest income plus non-interest income. Data Source: Call Reports.
2000 2001 2002 2003 2004 2005 2006 2007 2008 2009 2010 2011 2012 2013
Q4 Q4 Q4 Q4 Q4 Q4 Q4 Q4 Q4 Q4 Q4 Q4 Q4 Q1 Q2 Q3 Q4
0
10,000
20,000
$ Billions
Foreign Exchange
2000 2001 2002 2003 2004 2005 2006 2007 2008 2009 2010 2011 2012 2013
Q4 Q4 Q4 Q4 Q4 Q4 Q4 Q4 Q4 Q4 Q4 Q4 Q4 Q1 Q2 Q3 Q4
0
50,000
100,000
150,000
$ Billions
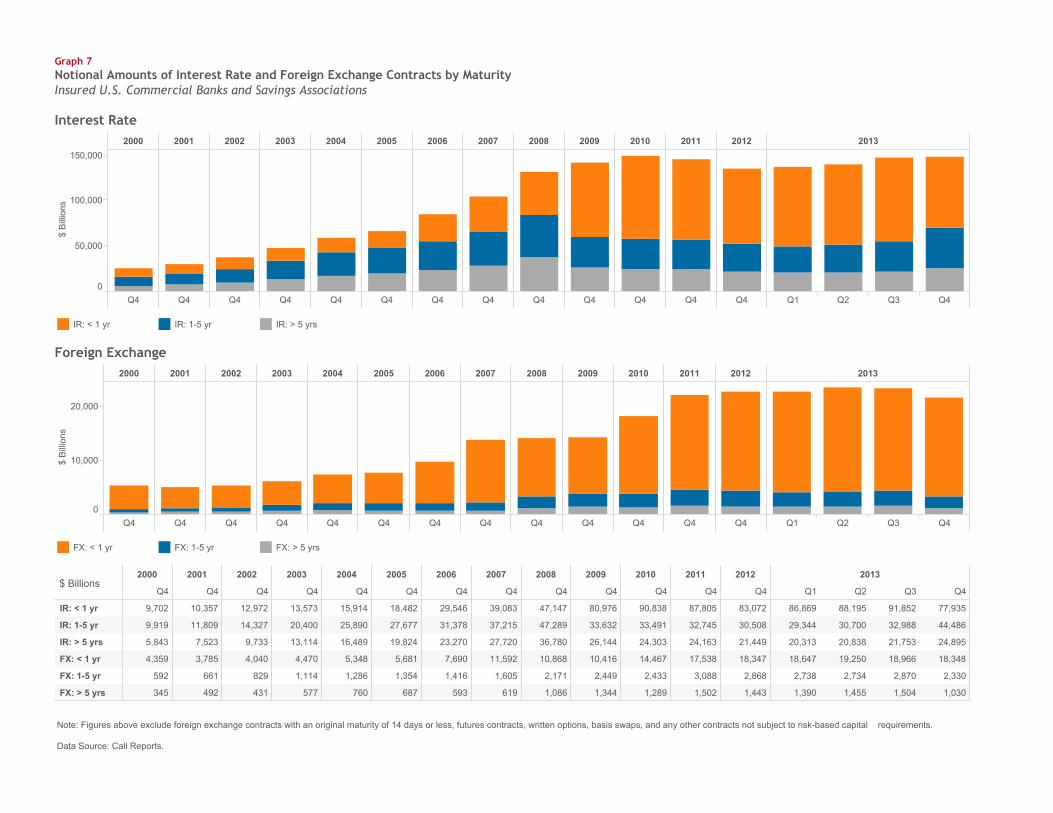
Graph 7Notional Amounts of Interest Rate and Foreign Exchange Contracts by MaturityInsured U.S. Commercial Banks and Savings Associations Interest Rate
2000
Q4
2001
Q4
2002
Q4
2003
Q4
2004
Q4
2005
Q4
2006
Q4
2007
Q4
2008
Q4
2009
Q4
2010
Q4
2011
Q4
2012
Q4
2013
Q1 Q2 Q3 Q4
IR: < 1 yr
IR: 1-5 yr
IR: > 5 yrs
FX: < 1 yr
FX: 1-5 yr
FX: > 5 yrs 345
592
4,359
5,843
9,919
9,702
492
661
3,785
7,523
11,809
10,357
431
829
4,040
9,733
14,327
12,972
577
1,114
4,470
13,114
20,400
13,573
760
1,286
5,348
16,489
25,890
15,914
687
1,354
5,681
19,824
27,677
18,482
593
1,416
7,690
23,270
31,378
29,546
619
1,605
11,592
27,720
37,215
39,083
1,086
2,171
10,868
36,780
47,289
47,147
1,344
2,449
10,416
26,144
33,632
80,976
1,289
2,433
14,467
24,303
33,491
90,838
1,502
3,088
17,538
24,163
32,745
87,805
1,443
2,868
18,347
21,449
30,508
83,072
1,030
2,330
18,348
24,895
44,486
77,935
1,504
2,870
18,966
21,753
32,988
91,852
1,455
2,734
19,250
20,838
30,700
88,195
1,390
2,738
18,647
20,313
29,344
86,869
FX: < 1 yr FX: 1-5 yr FX: > 5 yrs
IR: < 1 yr IR: 1-5 yr IR: > 5 yrs
Note: Figures above exclude foreign exchange contracts with an original maturity of 14 days or less, futures contracts, written options, basis swaps, and any other contracts not subject to risk-based capital requirements. Data Source: Call Reports.
$ Billions

2000
Q4
2001
Q4
2002
Q4
2003
Q4
2004
Q4
2005
Q4
2006
Q4
2007
Q4
2008
Q4
2009
Q4
2010
Q4
2011
Q4
2012
Q4
2013
Q1 Q2 Q3 Q4
Gold: < 1 yr
Gold: 1-5 yr
Gold: > 5 yrs
Prec Met: < 1 yr
Prec Met: 1-5 yr
Prec Met: > 5 yrs 0.2
0.2
2.5
15.2
33.6
38.7
0.0
0.2
2.4
7.4
25.6
30.5
0.0
0.5
2.7
7.5
28.4
35.8
0.0
0.3
3.9
4.9
31.9
40.2
0.0
0.5
4.0
2.3
30.9
34.9
0.1
1.3
8.6
1.4
26.6
41.6
0.3
1.7
10.4
1.2
36.0
39.8
0.0
2.2
10.8
3.4
37.1
71.9
0.0
1.5
7.5
2.0
26.8
78.1
0.0
1.2
11.6
1.4
24.7
73.8
0.0
1.9
17.5
1.2
28.9
162.0
0.1
4.7
21.1
0.6
28.4
94.0
0.0
5.8
27.7
0.2
27.1
100.5
0.0
3.8
20.2
0.0
16.1
78.7
0.0
5.3
24.8
0.0
19.5
88.7
0.0
4.7
23.5
0.0
18.2
103.1
0.0
6.2
34.9
0.1
24.2
123.5
2000 2001 2002 2003 2004 2005 2006 2007 2008 2009 2010 2011 2012 2013
Q4 Q4 Q4 Q4 Q4 Q4 Q4 Q4 Q4 Q4 Q4 Q4 Q4 Q1 Q2 Q3 Q4
0
50
100
150
200
$ Billions
Graph 8Notional Amounts of Gold and Precious Metals Contracts by MaturityInsured U.S. Commercial Banks and Savings Associations Gold
2000 2001 2002 2003 2004 2005 2006 2007 2008 2009 2010 2011 2012 2013
Q4 Q4 Q4 Q4 Q4 Q4 Q4 Q4 Q4 Q4 Q4 Q4 Q4 Q1 Q2 Q3 Q4
0
10
20
30
40
$ Billions
Precious Metals
Gold: < 1 yr Gold: 1-5 yr Gold: > 5 yrs
Note: Figures above exclude foreign exchange contracts with an original maturity of 14 days or less, futures contracts, written options, basis swaps, and any other contracts not subject to risk-based capital requirements. Data Source: Call Reports.
Prec Met: < 1 yr Prec Met: 1-5 yr Prec Met: > 5 yrs
$ Billions

2000 2001 2002 2003 2004 2005 2006 2007 2008 2009 2010 2011 2012 2013
Q4 Q4 Q4 Q4 Q4 Q4 Q4 Q4 Q4 Q4 Q4 Q4 Q4 Q1 Q2 Q3 Q4
0
1,000
2,000
$ Billions
Equity
2000 2001 2002 2003 2004 2005 2006 2007 2008 2009 2010 2011 2012 2013
Q4 Q4 Q4 Q4 Q4 Q4 Q4 Q4 Q4 Q4 Q4 Q4 Q4 Q1 Q2 Q3 Q4
0
500
1,000
$ Billions
Graph 9Notional Amounts of Commodity and Equity Contracts by MaturityInsured U.S. Commercial Banks and Savings Associations Commodity
2000
Q4
2001
Q4
2002
Q4
2003
Q4
2004
Q4
2005
Q4
2006
Q4
2007
Q4
2008
Q4
2009
Q4
2010
Q4
2011
Q4
2012
Q4
2013
Q1 Q2 Q3 Q4
Oth Comm: < 1 yr
Oth Comm: 1-5 yr
Oth Comm: > 5 yrs
Equity: < 1 yr
Equity: 1-5 yr
Equity: > 5 yrs 38
180
162
11
27
36
23
195
124
2
23
28
25
249
127
9
35
55
84
674
197
14
102
41
140
736
273
40
206
68
383
1,428
321
175
714
165
45
221
341
20
235
185
70
297
473
23
298
205
72
256
409
43
233
179
82
228
312
33
198
176
85
191
296
25
209
203
94
210
427
46
209
261
82
262
627
29
209
263
136
292
661
6
144
235
88
312
707
16
150
262
81
271
661
15
140
298
75
256
649
21
149
322
Oth Comm: < 1 yr Oth Comm: 1-5 yr Oth Comm: > 5 yrs
Equity: < 1 yr Equity: 1-5 yr Equity: > 5 yrs
Note: Figures above exclude foreign exchange contracts with an original maturity of 14 days or less, futures contracts, written options, basis swaps, and any other contracts not subject to risk-based capital requirements. Data Source: Call Reports.
$ Billions

2009
Q1 Q2 Q3 Q4
2010
Q1 Q2 Q3 Q4
2011
Q1 Q2 Q3 Q4
2012
Q1 Q2 Q3 Q4
2013
Q1 Q2 Q3 Q4
Investment Grade: < 1 yr
Investment Grade: 1-5 yr
Investment Grade: > 5 yrs
Subtotal Investment Grade
Sub-Investment Grade: < 1 yr
Sub-Investment Grade: 1-5 yr
Sub-Investment Grade: > 5 yrs
Subtotal Sub-Investment Grade
Overall Total 14,036
5,005
1,121
3,248
635
9,030
2,063
5,888
1,079
12,986
4,827
1,086
3,167
575
8,158
2,087
5,202
869
13,440
4,701
989
3,098
615
8,739
2,221
5,520
997
14,389
5,665
1,492
3,660
513
8,724
2,432
5,527
765
14,150
6,118
1,254
4,073
791
8,033
1,446
5,731
856
14,472
6,157
1,400
4,004
753
8,315
1,645
5,800
870
13,876
4,823
968
3,267
587
9,053
1,767
6,320
966
14,364
4,876
1,101
3,201
574
9,489
2,275
6,229
985
14,759
6,017
885
3,797
1,335
8,742
1,220
5,963
1,559
15,661
6,336
1,180
4,131
1,024
9,326
1,699
6,507
1,119
15,227
6,076
1,081
4,056
939
9,151
1,586
6,564
1,002
14,899
6,452
1,401
4,217
833
8,447
1,614
5,927
905
13,190
4,865
352
3,473
1,040
8,326
736
5,832
1,757
13,998
5,275
623
3,349
1,303
8,723
1,200
5,580
1,943
13,624
5,032
541
3,139
1,353
8,592
1,104
5,567
1,921
14,051
5,538
835
3,413
1,290
8,513
1,386
5,519
1,607
11,257
3,748
191
2,792
765
7,509
447
5,678
1,385
12,849
4,565
262
3,424
879
8,284
590
6,145
1,549
13,382
4,786
197
3,656
933
8,596
492
6,554
1,550
13,901
5,015
434
3,491
1,090
8,886
928
6,168
1,790
2008 2009 2010 2011 2012 2013
Q1 Q2 Q3 Q4 Q1 Q2 Q3 Q4 Q1 Q2 Q3 Q4 Q1 Q2 Q3 Q4 Q1 Q2 Q3 Q4 Q1 Q2 Q3 Q4
0
2,000
4,000
6,000
8,000
10,000
12,000
14,000
16,000
$ Billions
Graph 10Notional Amounts of Credit Derivative Contracts by Credit Quality and MaturityInsured U.S. Commercial Banks and Savings Associations
Investment Grade: < 1 yr Investment Grade: 1-5 yr Investment Grade: > 5 yrs Sub-Investment Grade: < 1 yr Sub-Investment Grade: 1-5 yr Sub-Investment Grade: > 5 yrs
Note: Figures above exclude foreign exchange contracts with an original maturity of 14 days or less, futures contracts, written options, basis swaps, and any other contracts not subject to risk-based capital requirements.Notional amounts as reported in Schedules RC-L and RC-R of Call reports. Data Source: Call Reports
$ Billions

TABLE 1
TOTALTOTAL TOTAL TOTAL TOTAL TOTAL CREDIT
TOTAL TOTAL FUTURES OPTIONS FORWARDS SWAPS OPTIONS DERIVATIVES SPOTRANK BANK NAME STATE ASSETS DERIVATIVES (EXCH TR) (EXCH TR) (OTC) (OTC) (OTC) (OTC) FX1 JPMORGAN CHASE BANK NA OH $1,945,467 $70,088,625 $1,261,949 $1,360,844 $13,532,965 $39,282,217 $9,261,423 $5,389,227 $61,0852 CITIBANK NATIONAL ASSN SD 1,346,747 62,247,698 659,311 753,010 8,372,554 40,604,400 9,284,822 2,573,601 564,5833 GOLDMAN SACHS BANK USA NY 105,616 48,611,684 891,142 968,241 3,680,899 36,074,902 6,731,224 265,276 3,3614 BANK OF AMERICA NA NC 1,433,716 38,850,900 2,081,877 123,605 6,842,601 24,751,362 2,462,451 2,589,004 252,6525 HSBC BANK USA NATIONAL ASSN VA 179,772 5,404,721 85,337 122,136 716,080 3,862,985 250,765 367,417 52,1936 WELLS FARGO BANK NA SD 1,373,600 4,856,295 144,714 93,772 1,282,836 2,801,015 487,288 46,670 6,0447 MORGAN STANLEY BANK NA UT 102,602 2,644,807 71,399 85,197 421,803 1,476,196 586,623 3,589 35,8178 BANK OF NEW YORK MELLON NY 296,626 1,199,069 23,121 6,734 334,474 650,547 184,092 101 46,9869 STATE STREET BANK&TRUST CO MA 239,051 1,133,281 3,282 0 1,095,392 6,418 28,048 141 30,05910 PNC BANK NATIONAL ASSN DE 310,000 387,294 54,198 69,700 19,372 221,424 17,727 4,872 57411 NORTHERN TRUST CO IL 102,659 233,523 0 0 217,070 16,392 61 0 22,07812 SUNTRUST BANK GA 171,262 225,957 19,127 12,113 10,286 130,085 50,771 3,575 19913 TD BANK NATIONAL ASSN DE 217,626 139,269 0 0 18,718 119,414 569 567 614 U S BANK NATIONAL ASSN OH 360,478 107,516 255 3,350 38,102 53,288 8,561 3,961 1,49315 REGIONS BANK AL 116,609 76,964 2,611 0 11,579 58,433 3,303 1,038 1416 KEYBANK NATIONAL ASSN OH 90,440 64,743 6,423 0 7,284 43,157 6,969 910 25517 UNION BANK NATIONAL ASSN CA 105,286 63,772 5,110 0 3,327 43,156 12,028 150 66718 BRANCH BANKING&TRUST CO NC 179,126 63,354 74 0 7,091 46,157 10,032 0 1819 FIFTH THIRD BANK OH 128,186 62,883 929 0 9,297 36,878 14,341 1,438 23620 CAPITAL ONE NATIONAL ASSN VA 238,483 39,082 0 0 759 37,203 36 1,084 221 RBS CITIZENS NATIONAL ASSN RI 94,717 36,733 0 0 7,591 25,639 2,430 1,072 3122 BOKF NATIONAL ASSN OK 26,795 28,576 581 551 22,514 3,199 1,732 0 3023 HUNTINGTON NATIONAL BANK OH 59,305 27,621 3 0 2,720 23,705 353 840 324 COMERICA BANK TX 65,202 21,494 0 0 1,593 15,623 3,406 872 21625 MANUFACTURERS&TRADERS TR CO NY 84,347 21,408 0 0 2,716 16,515 2,177 0 177
TOP 25 COMMERCIAL BANKS, SAs & TCs WITH DERIVATIVES $9,373,717 $236,637,271 $5,311,443 $3,599,253 $36,659,625 $150,400,312 $29,411,232 $11,255,405 $1,078,780OTHER COMMERCIAL BANKS, SAs & TCs WITH DERIVATIVES 3,683,344 385,792 17,026 618 66,086 252,947 47,141 1,974 699TOTAL COMMERCIAL BANKS, SAs & TCs WITH DERIVATIVES 13,057,060 237,023,063 5,328,469 3,599,871 36,725,711 150,653,259 29,458,373 11,257,379 1,079,479
Note: Before the first quarter of 1995 total derivatives included spot foreign exchange. Beginning in the first quarter, 1995, spot foreign exchange was reported separately.Note: Numbers may not add due to rounding.Data source: Call Reports, schedule RC-L
NOTIONAL AMOUNT OF DERIVATIVE CONTRACTS
Note: Credit derivatives have been included in the sum of total derivatives. Credit derivatives have been included as an "over the counter" category, although the Call Report does not differentiate by market currently.
TOP 25 COMMERCIAL BANKS, SAVINGS ASSOCIATIONS AND TRUST COMPANIES IN DERIVATIVESDECEMBER 31, 2013, $ MILLIONS
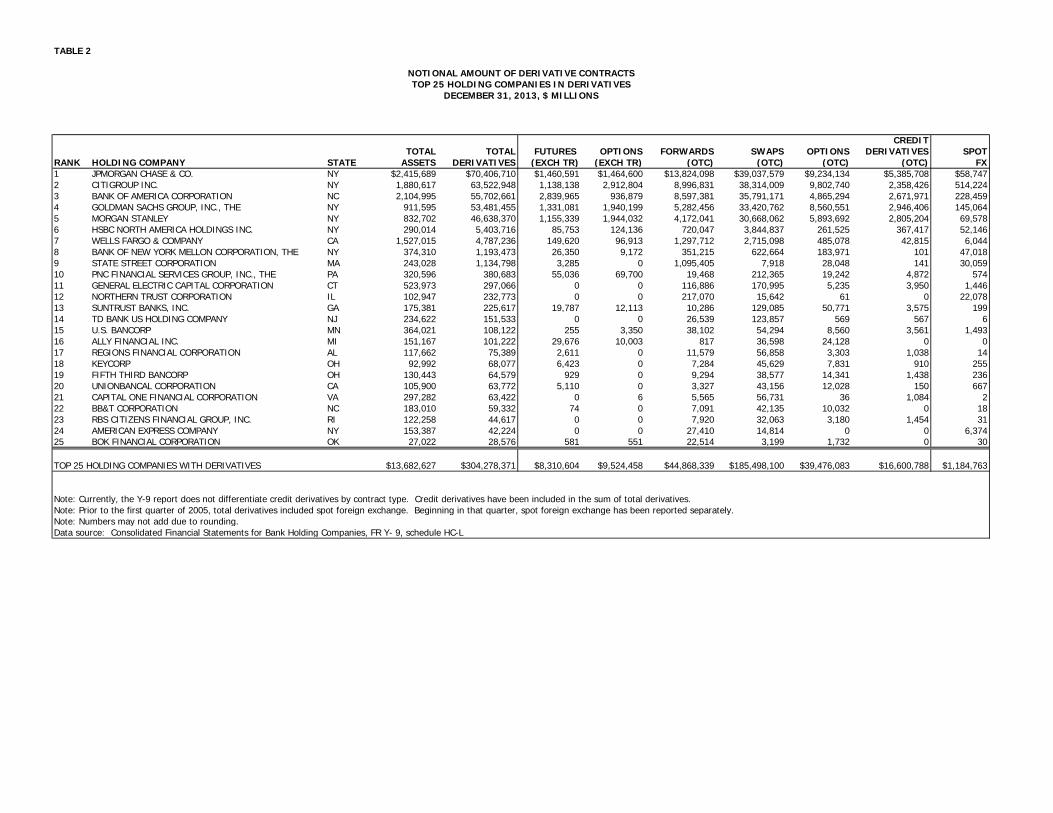
TABLE 2
CREDITTOTAL TOTAL FUTURES OPTIONS FORWARDS SWAPS OPTIONS DERIVATIVES SPOT
RANK HOLDING COMPANY STATE ASSETS DERIVATIVES (EXCH TR) (EXCH TR) (OTC) (OTC) (OTC) (OTC) FX1 JPMORGAN CHASE & CO. NY $2,415,689 $70,406,710 $1,460,591 $1,464,600 $13,824,098 $39,037,579 $9,234,134 $5,385,708 $58,7472 CITIGROUP INC. NY 1,880,617 63,522,948 1,138,138 2,912,804 8,996,831 38,314,009 9,802,740 2,358,426 514,2243 BANK OF AMERICA CORPORATION NC 2,104,995 55,702,661 2,839,965 936,879 8,597,381 35,791,171 4,865,294 2,671,971 228,4594 GOLDMAN SACHS GROUP, INC., THE NY 911,595 53,481,455 1,331,081 1,940,199 5,282,456 33,420,762 8,560,551 2,946,406 145,0645 MORGAN STANLEY NY 832,702 46,638,370 1,155,339 1,944,032 4,172,041 30,668,062 5,893,692 2,805,204 69,5786 HSBC NORTH AMERICA HOLDINGS INC. NY 290,014 5,403,716 85,753 124,136 720,047 3,844,837 261,525 367,417 52,1467 WELLS FARGO & COMPANY CA 1,527,015 4,787,236 149,620 96,913 1,297,712 2,715,098 485,078 42,815 6,0448 BANK OF NEW YORK MELLON CORPORATION, THE NY 374,310 1,193,473 26,350 9,172 351,215 622,664 183,971 101 47,0189 STATE STREET CORPORATION MA 243,028 1,134,798 3,285 0 1,095,405 7,918 28,048 141 30,05910 PNC FINANCIAL SERVICES GROUP, INC., THE PA 320,596 380,683 55,036 69,700 19,468 212,365 19,242 4,872 57411 GENERAL ELECTRIC CAPITAL CORPORATION CT 523,973 297,066 0 0 116,886 170,995 5,235 3,950 1,44612 NORTHERN TRUST CORPORATION IL 102,947 232,773 0 0 217,070 15,642 61 0 22,07813 SUNTRUST BANKS, INC. GA 175,381 225,617 19,787 12,113 10,286 129,085 50,771 3,575 19914 TD BANK US HOLDING COMPANY NJ 234,622 151,533 0 0 26,539 123,857 569 567 615 U.S. BANCORP MN 364,021 108,122 255 3,350 38,102 54,294 8,560 3,561 1,49316 ALLY FINANCIAL INC. MI 151,167 101,222 29,676 10,003 817 36,598 24,128 0 017 REGIONS FINANCIAL CORPORATION AL 117,662 75,389 2,611 0 11,579 56,858 3,303 1,038 1418 KEYCORP OH 92,992 68,077 6,423 0 7,284 45,629 7,831 910 25519 FIFTH THIRD BANCORP OH 130,443 64,579 929 0 9,294 38,577 14,341 1,438 23620 UNIONBANCAL CORPORATION CA 105,900 63,772 5,110 0 3,327 43,156 12,028 150 66721 CAPITAL ONE FINANCIAL CORPORATION VA 297,282 63,422 0 6 5,565 56,731 36 1,084 222 BB&T CORPORATION NC 183,010 59,332 74 0 7,091 42,135 10,032 0 1823 RBS CITIZENS FINANCIAL GROUP, INC. RI 122,258 44,617 0 0 7,920 32,063 3,180 1,454 3124 AMERICAN EXPRESS COMPANY NY 153,387 42,224 0 0 27,410 14,814 0 0 6,37425 BOK FINANCIAL CORPORATION OK 27,022 28,576 581 551 22,514 3,199 1,732 0 30
TOP 25 HOLDING COMPANIES WITH DERIVATIVES $13,682,627 $304,278,371 $8,310,604 $9,524,458 $44,868,339 $185,498,100 $39,476,083 $16,600,788 $1,184,763
Note: Currently, the Y-9 report does not differentiate credit derivatives by contract type. Credit derivatives have been included in the sum of total derivatives.Note: Prior to the first quarter of 2005, total derivatives included spot foreign exchange. Beginning in that quarter, spot foreign exchange has been reported separately.Note: Numbers may not add due to rounding.Data source: Consolidated Financial Statements for Bank Holding Companies, FR Y- 9, schedule HC-L
NOTIONAL AMOUNT OF DERIVATIVE CONTRACTSTOP 25 HOLDING COMPANIES IN DERIVATIVES
DECEMBER 31, 2013, $ MILLIONS

TABLE 3
PERCENT PERCENT PERCENT PERCENT PERCENT PERCENTTOTAL TOTAL EXCH TRADED OTC INT RATE FOREIGN EXCH OTHER CREDIT
RANK BANK NAME STATE ASSETS DERIVATIVES CONTRACTS CONTRACTS CONTRACTS CONTRACTS CONTRACTS DERIVATIVES(%) (%) (%) (%) (%) (%)
1 JPMORGAN CHASE BANK NA OH $1,945,467 $70,088,625 3.7 96.3 77.6 12.2 2.5 7.72 CITIBANK NATIONAL ASSN SD 1,346,747 62,247,698 2.3 97.7 83.7 11.0 1.1 4.13 GOLDMAN SACHS BANK USA NY 105,616 48,611,684 3.8 96.2 95.0 4.4 0.1 0.54 BANK OF AMERICA NA NC 1,433,716 38,850,900 5.7 94.3 79.8 12.5 1.1 6.75 HSBC BANK USA NATIONAL ASSN VA 179,772 5,404,721 3.8 96.2 73.9 17.9 1.4 6.86 WELLS FARGO BANK NA SD 1,373,600 4,856,295 4.9 95.1 90.7 4.3 4.1 1.07 MORGAN STANLEY BANK NA UT 102,602 2,644,807 5.9 94.1 5.7 94.2 0.0 0.18 BANK OF NEW YORK MELLON NY 296,626 1,199,069 2.5 97.5 66.3 31.9 1.8 0.09 STATE STREET BANK&TRUST CO MA 239,051 1,133,281 0.3 99.7 0.7 97.1 2.2 0.010 PNC BANK NATIONAL ASSN DE 310,000 387,294 32.0 68.0 94.6 3.8 0.3 1.311 NORTHERN TRUST CO IL 102,659 233,523 0.0 100.0 4.4 95.6 0.0 0.012 SUNTRUST BANK GA 171,262 225,957 13.8 86.2 76.3 2.2 19.8 1.613 TD BANK NATIONAL ASSN DE 217,626 139,269 0.0 100.0 84.4 15.2 0.0 0.414 U S BANK NATIONAL ASSN OH 360,478 107,516 3.4 96.6 68.2 28.1 0.1 3.715 REGIONS BANK AL 116,609 76,964 3.4 96.6 96.7 1.4 0.5 1.316 KEYBANK NATIONAL ASSN OH 90,440 64,743 9.9 90.1 89.9 7.6 1.2 1.417 UNION BANK NATIONAL ASSN CA 105,286 63,772 8.0 92.0 76.6 7.8 15.3 0.218 BRANCH BANKING&TRUST CO NC 179,126 63,354 0.1 99.9 99.4 0.6 0.0 0.019 FIFTH THIRD BANK OH 128,186 62,883 1.5 98.5 59.0 30.9 7.8 2.320 CAPITAL ONE NATIONAL ASSN VA 238,483 39,082 0.0 100.0 96.6 0.6 0.0 2.821 RBS CITIZENS NATIONAL ASSN RI 94,717 36,733 0.0 100.0 76.9 20.2 0.0 2.922 BOKF NATIONAL ASSN OK 26,795 28,576 4.0 96.0 88.2 1.0 10.9 0.023 HUNTINGTON NATIONAL BANK OH 59,305 27,621 0.0 100.0 87.4 8.1 1.4 3.024 COMERICA BANK TX 65,202 21,494 0.0 100.0 62.6 8.4 25.0 4.125 MANUFACTURERS&TRADERS TR CO NY 84,347 21,408 0.0 100.0 94.2 5.8 0.0 0.0
TOP 25 COMMERCIAL BANKS, SAs & TCs WITH DERIVATIVES $9,373,717 $236,637,271 $8,910,696 $227,726,575 $194,240,384 $27,833,883 $3,307,598 $11,255,405OTHER COMMERCIAL BANKS, SAs & TCs WITH DERIVATIVES 3,683,344 385,792 17,644 368,147 326,703 46,582 10,534 1,974TOTAL FOR COMMERCIAL BANKS, SAs & TCs WITH DERIVATIVES 13,057,060 237,023,063 8,928,341 228,094,722 194,567,087 27,880,465 3,318,132 11,257,379
(%) (%) (%) (%) (%) (%) (%)TOP 25 COMMERCIAL BANKS, SAs & TCs: % OF TOTAL COMMERCIAL BANKS, SAs & TCs WITH DERIVATIVES 99.8 3.8 96.1 81.9 11.7 1.4 4.7OTHER COMMERCIAL BANKS, SAs & TCs: % OF TOTAL COMMERCIAL BANKS, SAs & TCs WITH DERIVATIVES 0.2 0.0 0.2 0.1 0.0 0.0 0.0TOTAL FOR COMMERCIAL BANKS, SAs & TCs: % OF TOTAL COMMERCIAL BANKS, SAs & TCs WITH DERIVATIVES 100.0 3.8 96.2 82.1 11.8 1.4 4.7
Note: "Foreign Exchange" does not include spot fx.
Note: "Other" is defined as the sum of commodity and equity contracts.Note: Numbers may not add due to rounding.Data source: Call Reports, schedule RC-L
Note: Currently, the Call Report does not differentiate credit derivatives by over the counter or exchange traded. Credit derivatives have been included in the "over the counter" category as well as in the sum of total derivatives here.
DISTRIBUTION OF DERIVATIVE CONTRACTSTOP 25 COMMERCIAL BANKS, SAVINGS ASSOCIATIONS AND TRUST COMPANIES IN DERIVATIVES
DECEMBER 31, 2013, $ MILLIONS

TABLE 4
BILATERALLY TOTAL CREDIT (%)TOTAL NETTED CURRENT POTENTIAL EXPOSURE TOTAL CREDIT
TOTAL TOTAL RISK-BASED CREDIT FUTURE FROM ALL EXPOSURERANK BANK NAME STATE ASSETS DERIVATIVES CAPITAL EXPOSURE EXPOSURE CONTRACTS TO CAPITAL1 JPMORGAN CHASE BANK NA OH $1,945,467 $70,088,625 $165,495 $124,239 $178,992 $303,231 1832 CITIBANK NATIONAL ASSN SD 1,346,747 62,247,698 141,341 55,176 159,497 214,673 1523 GOLDMAN SACHS BANK USA NY 105,616 48,611,684 20,202 12,260 137,421 149,681 7414 BANK OF AMERICA NA NC 1,433,716 38,850,900 140,830 49,492 115,887 165,379 1175 HSBC BANK USA NATIONAL ASSN VA 179,772 5,404,721 21,299 7,871 28,568 36,439 1716 WELLS FARGO BANK NA SD 1,373,600 4,856,295 136,449 14,955 16,382 31,337 237 MORGAN STANLEY BANK NA UT 102,602 2,644,807 12,468 1,492 10,535 12,027 968 BANK OF NEW YORK MELLON NY 296,626 1,199,069 14,538 5,864 5,313 11,177 779 STATE STREET BANK&TRUST CO MA 239,051 1,133,281 14,699 7,460 7,599 15,058 10210 PNC BANK NATIONAL ASSN DE 310,000 387,294 37,550 2,524 1,099 3,623 1011 NORTHERN TRUST CO IL 102,659 233,523 8,366 1,326 2,312 3,638 4312 SUNTRUST BANK GA 171,262 225,957 18,810 1,455 1,977 3,432 1813 TD BANK NATIONAL ASSN DE 217,626 139,269 15,062 2,265 2,224 4,489 3014 U S BANK NATIONAL ASSN OH 360,478 107,516 36,392 1,024 244 1,268 315 REGIONS BANK AL 116,609 76,964 14,341 508 147 655 516 KEYBANK NATIONAL ASSN OH 90,440 64,743 10,451 584 88 673 617 UNION BANK NATIONAL ASSN CA 105,286 63,772 12,990 736 520 1,256 1018 BRANCH BANKING&TRUST CO NC 179,126 63,354 17,872 864 447 1,311 719 FIFTH THIRD BANK OH 128,186 62,883 14,507 1,285 878 2,163 1520 CAPITAL ONE NATIONAL ASSN VA 238,483 39,082 21,739 444 391 835 421 RBS CITIZENS NATIONAL ASSN RI 94,717 36,733 11,581 626 332 958 822 BOKF NATIONAL ASSN OK 26,795 28,576 2,294 132 189 321 1423 HUNTINGTON NATIONAL BANK OH 59,305 27,621 6,520 322 199 521 824 COMERICA BANK TX 65,202 21,494 8,231 311 551 861 1025 MANUFACTURERS&TRADERS TR CO NY 84,347 21,408 9,470 290 143 433 5
TOP 25 COMMERCIAL BANKS, SAs & TCs WITH DERIVATIVES $9,373,717 $236,637,271 $913,499 $293,506 $671,933 $965,438 106OTHER COMMERCIAL BANKS, SAs & TCs WITH DERIVATIVES 3,683,344 385,792 410,333 4,724 2,976 7,700 2TOTAL AMOUNT FOR COMMERCIAL BANKS, SAs & TCs WITH DERIVATIVES 13,057,060 237,023,063 1,323,832 298,230 674,909 973,139 74
Commercial banks also hold on-balance sheet assets in volumes that are multiples of bank capital. For example:
EXPOSURES FROM OTHER ASSETS EXPOSURE TO RISKALL COMMERCIAL BANKS & SAVINGS ASSOCIATIONS BASED CAPITAL 1-4 FAMILY MORTGAGES 154% C&I LOANS 105% SECURITIES NOT IN TRADING ACCOUNT 197%
Note: Total credit exposure is defined as the credit equivalent amount from derivative contracts (RC-R line 54), which is the sum of netted current credit exposure and PFE.Note: The total credit exposure to capital ratio is calculated using risk based capital (tier one plus tier two capital). Note: Currently, the Call Report does not differentiate credit derivatives by contract type. Credit derivatives have been included in the sum of total derivatives here.Note: Numbers may not add due to rounding.Data source: Call Reports, Schedule RC-R.
CREDIT EQUIVALENT EXPOSURESTOP 25 COMMERCIAL BANKS, SAVINGS ASSOCIATIONS AND TRUST COMPANIES IN DERIVATIVES
DECEMBER 31, 2013, $ MILLIONS

TABLE 5
TOTAL % TOTAL %HELD FOR HELD FOR NOT FOR NOT FOR
TOTAL TOTAL TRADING TRADING TRADING TRADINGRANK BANK NAME STATE ASSETS DERIVATIVES & MTM & MTM MTM MTM1 JPMORGAN CHASE BANK NA OH $1,945,467 $64,699,398 $64,010,915 98.9 $688,483 1.12 CITIBANK NATIONAL ASSN SD 1,346,747 59,674,097 59,597,977 99.9 76,120 0.13 GOLDMAN SACHS BANK USA NY 105,616 48,346,408 48,328,833 100.0 17,575 0.04 BANK OF AMERICA NA NC 1,433,716 36,261,896 33,403,970 92.1 2,857,926 7.9
TOP 4 COMMERCIAL BANKS, SAs & TCs WITH DERIVATIVES $4,831,546 $208,981,799 $205,341,695 98.3 $3,640,104 1.7OTHER COMMERCIAL BANKS, SAs & TCs WITH DERIVATIVES 8,225,514 16,783,885 15,617,721 93.1 1,166,164 6.9TOTAL AMOUNT FOR COMMERCIAL BANKS, SAs & TCs WITH DERIVATIVES 13,057,060 225,765,684 220,959,416 97.9 4,806,268 2.1
Note: Currently, the Call Report does not differentiate between traded and not-traded credit derivatives. Credit derivatives have been excluded from the sum of total derivatives here.Note: Numbers may not add due to rounding.Data source: Call Reports, schedule RC-L
NOTIONAL AMOUNTS OF DERIVATIVE CONTRACTS HELD FOR TRADINGTOP 4 COMMERCIAL BANKS, SAVINGS ASSOCIATIONS AND TRUST COMPANIES IN DERIVATIVES
DECEMBER 31, 2013, $ MILLIONS

TABLE 6
GROSS GROSS GROSS GROSS GROSS GROSSTOTAL TOTAL POSITIVE NEGATIVE POSITIVE NEGATIVE POSITIVE NEGATIVE
RANK BANK NAME STATE ASSETS DERIVATIVES FAIR VALUE* FAIR VALUE** FAIR VALUE* FAIR VALUE** FAIR VALUE* FAIR VALUE**1 JPMORGAN CHASE BANK NA OH $1,945,467 $70,088,625 $1,078,160 $1,058,527 $11,362 $9,144 $83,725 $82,7362 CITIBANK NATIONAL ASSN SD 1,346,747 62,247,698 764,177 758,260 713 992 43,789 43,6003 GOLDMAN SACHS BANK USA NY 105,616 48,611,684 805,587 756,077 266 0 5,705 7,3874 BANK OF AMERICA NA NC 1,433,716 38,850,900 449,356 449,005 61,052 64,134 46,334 41,745
TOP 4 COMMERCIAL BANKS, SAs & TCs WITH DERIVATIVES $4,831,546 $219,798,907 $3,097,280 $3,021,869 $73,393 $74,270 $179,553 $175,468OTHER COMMERCIAL BANKS, SAs & TCs WITH DERIVATIVES 8,225,514 17,224,156 229,460 228,728 15,378 11,500 6,651 7,122TOTAL AMOUNT FOR COMMERCIAL BANKS, SAs & TCs WITH DERIVATIVES 13,057,060 237,023,063 3,326,740 3,250,597 88,771 85,770 186,204 182,590
Note: Currently, the Call Report does not differentiate between traded and non-traded credit derivatives. Credit derivatives have been included in the sum of total derivatives here. Numbers may not sum due to rounding.*Market value of contracts that have a positive fair value as of the end of the quarter.**Market value of contracts that have a negative fair value as of the end of the quarter.Data source: Call Reports, schedule RC-L
TRADING CREDIT DERIVATIVES
GROSS FAIR VALUES OF DERIVATIVE CONTRACTSTOP 4 COMMERCIAL BANKS, SAVINGS ASSOCIATIONS AND TRUST COMPANIES IN DERIVATIVES
DECEMBER 31, 2013, $ MILLIONS
NOT FOR TRADING

TABLE 7
TOTAL TRADING TRADING REV TRADING REV TRADING REV TRADING REV TRADING REVREV FROM CASH & FROM FROM FROM FROM FROM
TOTAL TOTAL OFF BAL SHEET INT RATE FOREIGN EXCH EQUITY COMMOD & OTH CREDITRANK BANK NAME STATE ASSETS DERIVATIVES POSITIONS POSITIONS POSITIONS POSITIONS POSITIONS POSITIONS1 JPMORGAN CHASE BANK NA OH $1,945,467 $70,088,625 $224 ($297) $242 $61 $178 $402 CITIBANK NATIONAL ASSN SD 1,346,747 62,247,698 1,184 849 486 (43) (27) (81)3 GOLDMAN SACHS BANK USA NY 105,616 48,611,684 243 342 (190) 0 0 914 BANK OF AMERICA NA NC 1,433,716 38,850,900 (241) (760) 279 35 18 187
TOP 4 COMMERCIAL BANKS, SAs & TCs WITH DERIVATIVES $4,831,546 $219,798,907 $1,410 $134 $817 $53 $169 $237OTHER COMMERCIAL BANKS, SAs & TCs WITH DERIVATIVES 8,225,514 17,224,156 1,537 326 715 418 96 (18)TOTAL AMOUNT FOR COMMERCIAL BANKS, SAs & TCs WITH DERIVATIVES 13,057,060 237,023,063 2,947 460 1,532 471 265 219
Note: Trading revenue is defined here as "trading revenue from cash instruments and off balance sheet derivative instruments."Note: Numbers may not sum due to rounding.Data source: Call Reports, schedule RI
Note: Effective in the first quarter of 2007, trading revenues from credit exposures are reported separately, along with the four other types of exposures. The total derivatives column includes credit exposures.
TRADING REVENUES FROM CASH INSTRUMENTS AND DERIVATIVESTOP 4 COMMERCIAL BANKS, SAVINGS ASSOCIATIONS AND TRUST COMPANIES IN DERIVATIVES
NOTE: REVENUE FIGURES ARE FOR THE QUARTER (NOT YEAR-TO-DATE)DECEMBER 31, 2013, $ MILLIONS
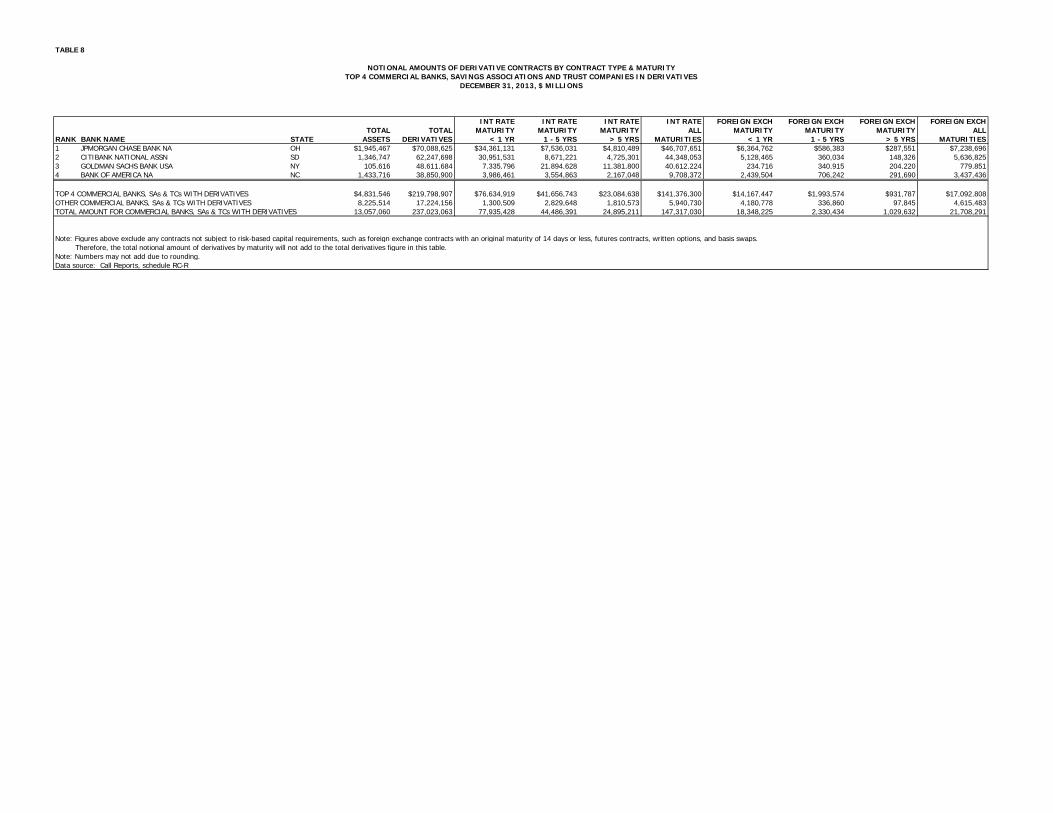
TABLE 8
INT RATE INT RATE INT RATE INT RATE FOREIGN EXCH FOREIGN EXCH FOREIGN EXCH FOREIGN EXCHTOTAL TOTAL MATURITY MATURITY MATURITY ALL MATURITY MATURITY MATURITY ALL
RANK BANK NAME STATE ASSETS DERIVATIVES < 1 YR 1 - 5 YRS > 5 YRS MATURITIES < 1 YR 1 - 5 YRS > 5 YRS MATURITIES1 JPMORGAN CHASE BANK NA OH $1,945,467 $70,088,625 $34,361,131 $7,536,031 $4,810,489 $46,707,651 $6,364,762 $586,383 $287,551 $7,238,6962 CITIBANK NATIONAL ASSN SD 1,346,747 62,247,698 30,951,531 8,671,221 4,725,301 44,348,053 5,128,465 360,034 148,326 5,636,8253 GOLDMAN SACHS BANK USA NY 105,616 48,611,684 7,335,796 21,894,628 11,381,800 40,612,224 234,716 340,915 204,220 779,8514 BANK OF AMERICA NA NC 1,433,716 38,850,900 3,986,461 3,554,863 2,167,048 9,708,372 2,439,504 706,242 291,690 3,437,436
TOP 4 COMMERCIAL BANKS, SAs & TCs WITH DERIVATIVES $4,831,546 $219,798,907 $76,634,919 $41,656,743 $23,084,638 $141,376,300 $14,167,447 $1,993,574 $931,787 $17,092,808OTHER COMMERCIAL BANKS, SAs & TCs WITH DERIVATIVES 8,225,514 17,224,156 1,300,509 2,829,648 1,810,573 5,940,730 4,180,778 336,860 97,845 4,615,483TOTAL AMOUNT FOR COMMERCIAL BANKS, SAs & TCs WITH DERIVATIVES 13,057,060 237,023,063 77,935,428 44,486,391 24,895,211 147,317,030 18,348,225 2,330,434 1,029,632 21,708,291
Note: Figures above exclude any contracts not subject to risk-based capital requirements, such as foreign exchange contracts with an original maturity of 14 days or less, futures contracts, written options, and basis swaps. Therefore, the total notional amount of derivatives by maturity will not add to the total derivatives figure in this table.Note: Numbers may not add due to rounding.Data source: Call Reports, schedule RC-R
NOTIONAL AMOUNTS OF DERIVATIVE CONTRACTS BY CONTRACT TYPE & MATURITYTOP 4 COMMERCIAL BANKS, SAVINGS ASSOCIATIONS AND TRUST COMPANIES IN DERIVATIVES
DECEMBER 31, 2013, $ MILLIONS
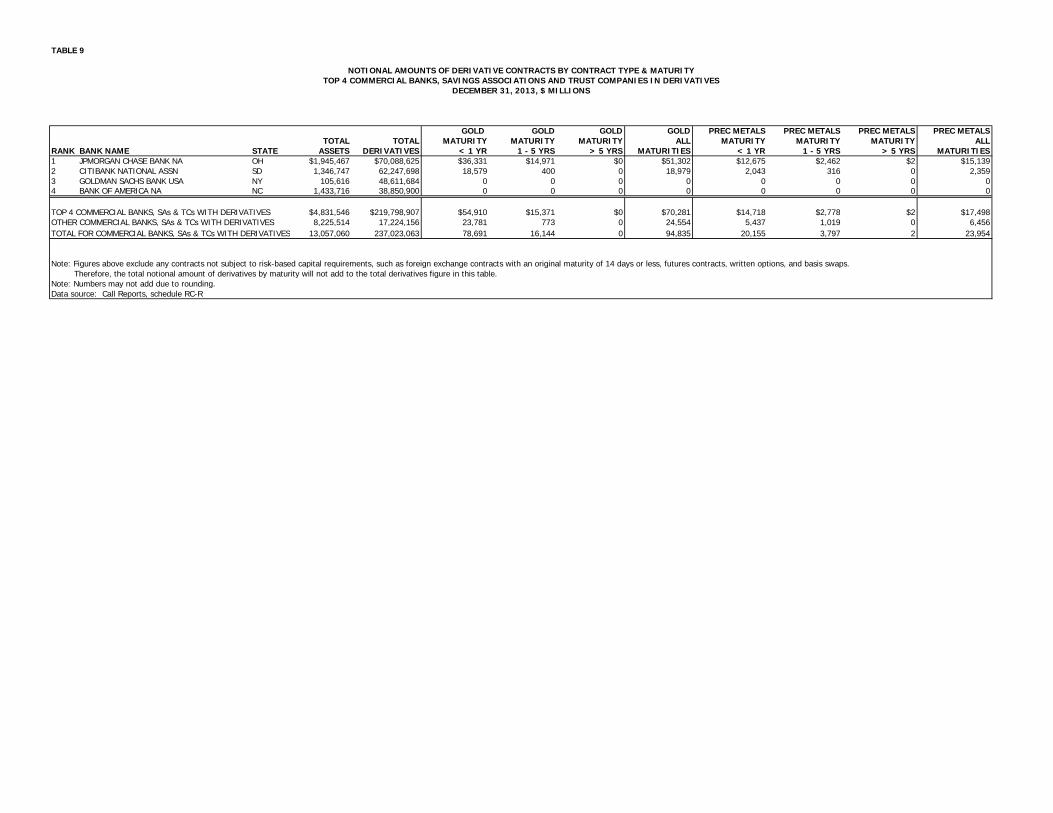
TABLE 9
GOLD GOLD GOLD GOLD PREC METALS PREC METALS PREC METALS PREC METALSTOTAL TOTAL MATURITY MATURITY MATURITY ALL MATURITY MATURITY MATURITY ALL
RANK BANK NAME STATE ASSETS DERIVATIVES < 1 YR 1 - 5 YRS > 5 YRS MATURITIES < 1 YR 1 - 5 YRS > 5 YRS MATURITIES1 JPMORGAN CHASE BANK NA OH $1,945,467 $70,088,625 $36,331 $14,971 $0 $51,302 $12,675 $2,462 $2 $15,1392 CITIBANK NATIONAL ASSN SD 1,346,747 62,247,698 18,579 400 0 18,979 2,043 316 0 2,3593 GOLDMAN SACHS BANK USA NY 105,616 48,611,684 0 0 0 0 0 0 0 04 BANK OF AMERICA NA NC 1,433,716 38,850,900 0 0 0 0 0 0 0 0
TOP 4 COMMERCIAL BANKS, SAs & TCs WITH DERIVATIVES $4,831,546 $219,798,907 $54,910 $15,371 $0 $70,281 $14,718 $2,778 $2 $17,498OTHER COMMERCIAL BANKS, SAs & TCs WITH DERIVATIVES 8,225,514 17,224,156 23,781 773 0 24,554 5,437 1,019 0 6,456TOTAL FOR COMMERCIAL BANKS, SAs & TCs WITH DERIVATIVES 13,057,060 237,023,063 78,691 16,144 0 94,835 20,155 3,797 2 23,954
Note: Figures above exclude any contracts not subject to risk-based capital requirements, such as foreign exchange contracts with an original maturity of 14 days or less, futures contracts, written options, and basis swaps. Therefore, the total notional amount of derivatives by maturity will not add to the total derivatives figure in this table.Note: Numbers may not add due to rounding.Data source: Call Reports, schedule RC-R
NOTIONAL AMOUNTS OF DERIVATIVE CONTRACTS BY CONTRACT TYPE & MATURITYTOP 4 COMMERCIAL BANKS, SAVINGS ASSOCIATIONS AND TRUST COMPANIES IN DERIVATIVES
DECEMBER 31, 2013, $ MILLIONS
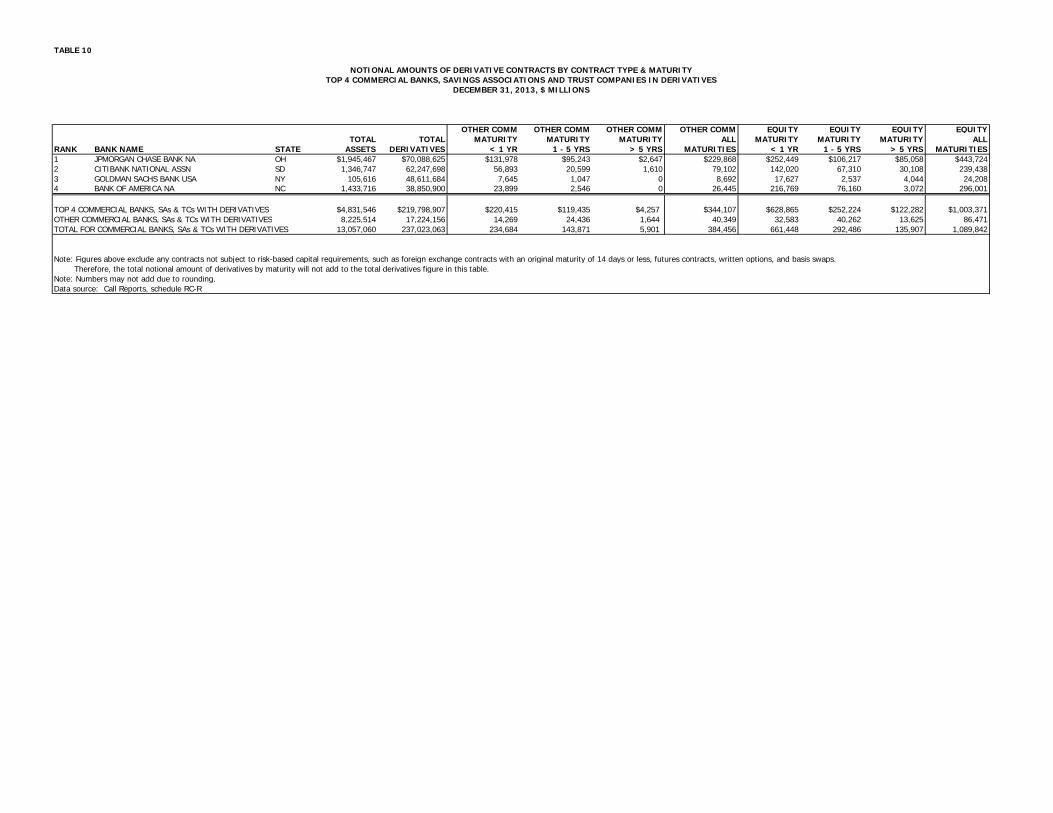
TABLE 10
OTHER COMM OTHER COMM OTHER COMM OTHER COMM EQUITY EQUITY EQUITY EQUITYTOTAL TOTAL MATURITY MATURITY MATURITY ALL MATURITY MATURITY MATURITY ALL
RANK BANK NAME STATE ASSETS DERIVATIVES < 1 YR 1 - 5 YRS > 5 YRS MATURITIES < 1 YR 1 - 5 YRS > 5 YRS MATURITIES1 JPMORGAN CHASE BANK NA OH $1,945,467 $70,088,625 $131,978 $95,243 $2,647 $229,868 $252,449 $106,217 $85,058 $443,7242 CITIBANK NATIONAL ASSN SD 1,346,747 62,247,698 56,893 20,599 1,610 79,102 142,020 67,310 30,108 239,4383 GOLDMAN SACHS BANK USA NY 105,616 48,611,684 7,645 1,047 0 8,692 17,627 2,537 4,044 24,2084 BANK OF AMERICA NA NC 1,433,716 38,850,900 23,899 2,546 0 26,445 216,769 76,160 3,072 296,001
TOP 4 COMMERCIAL BANKS, SAs & TCs WITH DERIVATIVES $4,831,546 $219,798,907 $220,415 $119,435 $4,257 $344,107 $628,865 $252,224 $122,282 $1,003,371OTHER COMMERCIAL BANKS, SAs & TCs WITH DERIVATIVES 8,225,514 17,224,156 14,269 24,436 1,644 40,349 32,583 40,262 13,625 86,471TOTAL FOR COMMERCIAL BANKS, SAs & TCs WITH DERIVATIVES 13,057,060 237,023,063 234,684 143,871 5,901 384,456 661,448 292,486 135,907 1,089,842
Note: Figures above exclude any contracts not subject to risk-based capital requirements, such as foreign exchange contracts with an original maturity of 14 days or less, futures contracts, written options, and basis swaps. Therefore, the total notional amount of derivatives by maturity will not add to the total derivatives figure in this table.Note: Numbers may not add due to rounding.Data source: Call Reports, schedule RC-R
DECEMBER 31, 2013, $ MILLIONS
NOTIONAL AMOUNTS OF DERIVATIVE CONTRACTS BY CONTRACT TYPE & MATURITYTOP 4 COMMERCIAL BANKS, SAVINGS ASSOCIATIONS AND TRUST COMPANIES IN DERIVATIVES

TABLE 11
TOTAL TOTAL TOTAL CREDIT MATURITY MATURITY MATURITY ALL MATURITY MATURITY MATURITY ALLRANK BANK NAME STATE ASSETS DERIVATIVES DERIVATIVES < 1 YR 1 - 5 YRS > 5 YRS MATURITIES < 1 YR 1 - 5 YRS > 5 YRS MATURITIES1 JPMORGAN CHASE BANK NA OH $1,945,467 $70,088,625 $5,389,227 $728,219 $2,990,441 $236,414 $3,955,074 $279,493 $1,088,971 $65,689 $1,434,1532 CITIBANK NATIONAL ASSN SD 1,346,747 62,247,698 2,573,601 209,448 871,161 116,122 1,196,731 254,812 1,075,042 47,016 1,376,8703 GOLDMAN SACHS BANK USA NY 105,616 48,611,684 265,276 14,548 114,727 11,965 141,240 27,844 91,843 4,349 124,0364 BANK OF AMERICA NA NC 1,433,716 38,850,900 2,589,004 386,055 1,569,049 71,248 2,026,352 132,854 384,928 44,870 562,652
TOP 4 COMMERCIAL BANKS, SAs & TCs WITH DERIVATIVES $4,831,546 $219,798,907 $10,817,108 $1,338,270 $5,545,378 $435,749 $7,319,397 $695,003 $2,640,784 $161,924 $3,497,711OTHER COMMERCIAL BANKS, SAs & TCs WITH DERIVATIVES 8,225,514 17,224,156 440,271 46,332 132,248 11,177 189,757 70,005 151,361 29,147 250,513TOTAL AMOUNT FOR COMMERCIAL BANKS, SAs & TCs WITH DERIVATIVES 13,057,060 237,023,063 11,257,379 1,384,602 5,677,626 446,926 7,509,154 765,008 2,792,145 191,071 3,748,224
Note: Figures above exclude any contracts not subject to risk-based capital requirements, such as foreign exchange contracts with an original maturity of 14 days or less, futures contracts, written options, and basis swaps. Therefore, the total notional amount of derivatives by maturity will not add to the total derivatives figure in this table.Note: Numbers may not add due to rounding.Data source: Call Reports, schedule RC-L and RC-R
SUB-INVESTMENT GRADEINVESTMENT GRADECREDIT DERIVATIVES
NOTIONAL AMOUNTS OF CREDIT DERIVATIVE CONTRACTS BY CONTRACT TYPE & MATURITYTOP 4 COMMERCIAL BANKS, SAVINGS ASSOCIATIONS AND TRUST COMPANIES IN DERIVATIVES
CREDIT DERIVATIVES
DECEMBER 31, 2013, $ MILLIONS
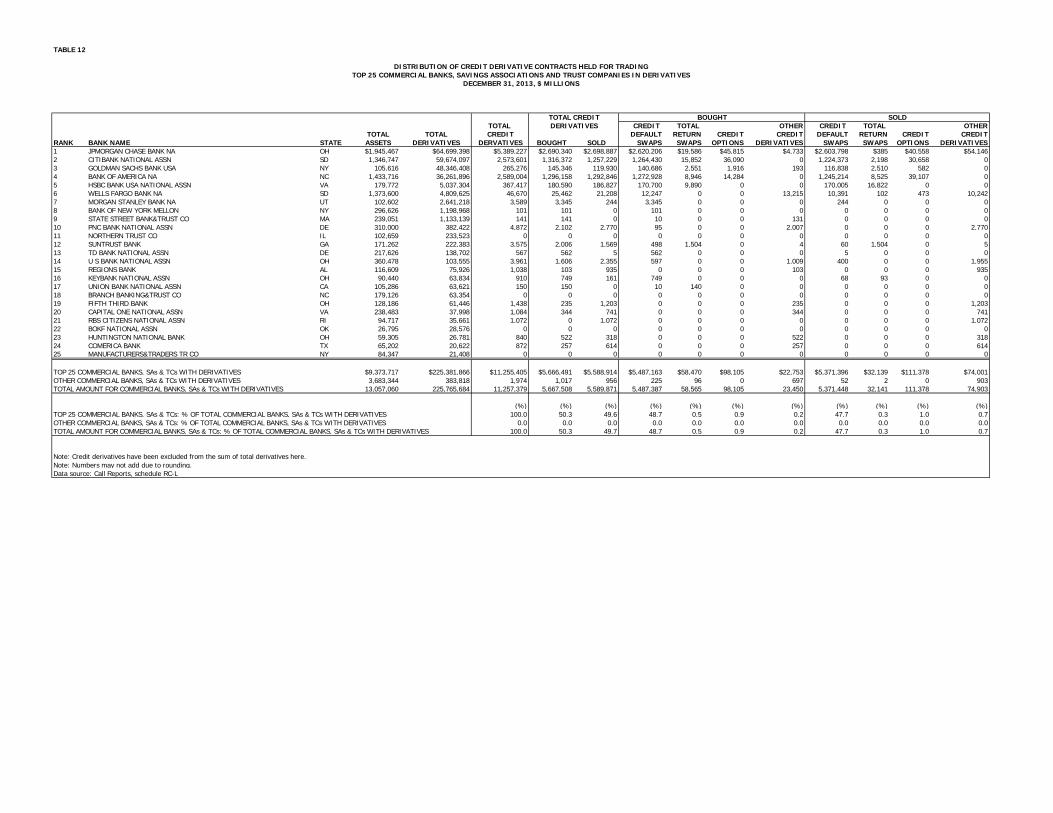
TABLE 12
TOTAL CREDIT TOTAL OTHER CREDIT TOTAL OTHERTOTAL TOTAL CREDIT DEFAULT RETURN CREDIT CREDIT DEFAULT RETURN CREDIT CREDIT
RANK BANK NAME STATE ASSETS DERIVATIVES DERVATIVES BOUGHT SOLD SWAPS SWAPS OPTIONS DERIVATIVES SWAPS SWAPS OPTIONS DERIVATIVES1 JPMORGAN CHASE BANK NA OH $1,945,467 $64,699,398 $5,389,227 $2,690,340 $2,698,887 $2,620,206 $19,586 $45,815 $4,733 $2,603,798 $385 $40,558 $54,1462 CITIBANK NATIONAL ASSN SD 1,346,747 59,674,097 2,573,601 1,316,372 1,257,229 1,264,430 15,852 36,090 0 1,224,373 2,198 30,658 03 GOLDMAN SACHS BANK USA NY 105,616 48,346,408 265,276 145,346 119,930 140,686 2,551 1,916 193 116,838 2,510 582 04 BANK OF AMERICA NA NC 1,433,716 36,261,896 2,589,004 1,296,158 1,292,846 1,272,928 8,946 14,284 0 1,245,214 8,525 39,107 05 HSBC BANK USA NATIONAL ASSN VA 179,772 5,037,304 367,417 180,590 186,827 170,700 9,890 0 0 170,005 16,822 0 06 WELLS FARGO BANK NA SD 1,373,600 4,809,625 46,670 25,462 21,208 12,247 0 0 13,215 10,391 102 473 10,2427 MORGAN STANLEY BANK NA UT 102,602 2,641,218 3,589 3,345 244 3,345 0 0 0 244 0 0 08 BANK OF NEW YORK MELLON NY 296,626 1,198,968 101 101 0 101 0 0 0 0 0 0 09 STATE STREET BANK&TRUST CO MA 239,051 1,133,139 141 141 0 10 0 0 131 0 0 0 010 PNC BANK NATIONAL ASSN DE 310,000 382,422 4,872 2,102 2,770 95 0 0 2,007 0 0 0 2,77011 NORTHERN TRUST CO IL 102,659 233,523 0 0 0 0 0 0 0 0 0 0 012 SUNTRUST BANK GA 171,262 222,383 3,575 2,006 1,569 498 1,504 0 4 60 1,504 0 513 TD BANK NATIONAL ASSN DE 217,626 138,702 567 562 5 562 0 0 0 5 0 0 014 U S BANK NATIONAL ASSN OH 360,478 103,555 3,961 1,606 2,355 597 0 0 1,009 400 0 0 1,95515 REGIONS BANK AL 116,609 75,926 1,038 103 935 0 0 0 103 0 0 0 93516 KEYBANK NATIONAL ASSN OH 90,440 63,834 910 749 161 749 0 0 0 68 93 0 017 UNION BANK NATIONAL ASSN CA 105,286 63,621 150 150 0 10 140 0 0 0 0 0 018 BRANCH BANKING&TRUST CO NC 179,126 63,354 0 0 0 0 0 0 0 0 0 0 019 FIFTH THIRD BANK OH 128,186 61,446 1,438 235 1,203 0 0 0 235 0 0 0 1,20320 CAPITAL ONE NATIONAL ASSN VA 238,483 37,998 1,084 344 741 0 0 0 344 0 0 0 74121 RBS CITIZENS NATIONAL ASSN RI 94,717 35,661 1,072 0 1,072 0 0 0 0 0 0 0 1,07222 BOKF NATIONAL ASSN OK 26,795 28,576 0 0 0 0 0 0 0 0 0 0 023 HUNTINGTON NATIONAL BANK OH 59,305 26,781 840 522 318 0 0 0 522 0 0 0 31824 COMERICA BANK TX 65,202 20,622 872 257 614 0 0 0 257 0 0 0 61425 MANUFACTURERS&TRADERS TR CO NY 84,347 21,408 0 0 0 0 0 0 0 0 0 0 0
TOP 25 COMMERCIAL BANKS, SAs & TCs WITH DERIVATIVES $9,373,717 $225,381,866 $11,255,405 $5,666,491 $5,588,914 $5,487,163 $58,470 $98,105 $22,753 $5,371,396 $32,139 $111,378 $74,001OTHER COMMERCIAL BANKS, SAs & TCs WITH DERIVATIVES 3,683,344 383,818 1,974 1,017 956 225 96 0 697 52 2 0 903TOTAL AMOUNT FOR COMMERCIAL BANKS, SAs & TCs WITH DERIVATIVES 13,057,060 225,765,684 11,257,379 5,667,508 5,589,871 5,487,387 58,565 98,105 23,450 5,371,448 32,141 111,378 74,903
(%) (%) (%) (%) (%) (%) (%) (%) (%) (%) (%)TOP 25 COMMERCIAL BANKS, SAs & TCs: % OF TOTAL COMMERCIAL BANKS, SAs & TCs WITH DERIVATIVES 100.0 50.3 49.6 48.7 0.5 0.9 0.2 47.7 0.3 1.0 0.7OTHER COMMERCIAL BANKS, SAs & TCs: % OF TOTAL COMMERCIAL BANKS, SAs & TCs WITH DERIVATIVES 0.0 0.0 0.0 0.0 0.0 0.0 0.0 0.0 0.0 0.0 0.0TOTAL AMOUNT FOR COMMERCIAL BANKS, SAs & TCs: % OF TOTAL COMMERCIAL BANKS, SAs & TCs WITH DERIVATIVES 100.0 50.3 49.7 48.7 0.5 0.9 0.2 47.7 0.3 1.0 0.7
Note: Credit derivatives have been excluded from the sum of total derivatives here.Note: Numbers may not add due to rounding.Data source: Call Reports, schedule RC-L
DISTRIBUTION OF CREDIT DERIVATIVE CONTRACTS HELD FOR TRADINGTOP 25 COMMERCIAL BANKS, SAVINGS ASSOCIATIONS AND TRUST COMPANIES IN DERIVATIVES
DERIVATIVESBOUGHT SOLDTOTAL CREDIT
DECEMBER 31, 2013, $ MILLIONS