
Observing Single, Heterogeneous, One-Electron Transfer ... · authors extended the study to high...
9
Observing Single, Heterogeneous, One-Electron Transfer Reactions Stephanie Zaleski, † M. Fernanda Cardinal, † Jordan M. Klingsporn, † and Richard P. Van Duyne* ,†,‡,§ † Department of Chemistry, Northwestern University, 2145 Sheridan Road, Evanston, Illinois 60208, United States ‡ Department of Biomedical Engineering, Northwestern University, 2145 Sheridan Road, Evanston, Illinois 60208, United States § Program in Applied Physics, Northwestern University, 2145 Sheridan Road, Evanston, Illinois 60208, United States * S Supporting Information ABSTRACT: Understanding electrochemical events on the single-molecule level is crucial for fields such as catalysis and biological systems. A variety of techniques exist to study the electrochemistry of single molecules, but few provide correlated chemical information. Herein, we study the electrochemistry of rhodamine 6G in nonaqueous conditions and demonstrate the first statistic electrochemical single-molecule SERS (EC-SMSERS) proof of single-electron transfer events. We find that the distribution of reduction events is broader than that in a bulk electrochemical experiment. The distribution of the reduction potentials can be explained by molecular reorientation and variations of the local surface site or chemical potential of the Ag nanoparticle. Our results contribute toward understanding electrochemical behavior of single molecules on the nanoscale monitored by SERS and the ultimate goal of controlling single-electron transfer processes. 1. INTRODUCTION The most fundamental event in electrochemistry is the chemically reversible, one-electron, heterogeneous electron transfer (HET) reaction. A HET reaction + ⇄ − O 1e R k k r f (1) involves the oxidized form of the analyte, O, being reduced to its reduced form, R. This reaction is characterized by its standard potential, E 0 , and rate constant, k 0 . To date, HET reactions have only been studied at the ensemble average level. Consequently, the measured E 0 and k 0 represent an average over many microscopic configurations of O and R and their interactions with the electrode surface. 1−4 Electrochemical reactions play a central role in numerous fields such as electrocatalysis, 5 energy storage, 6,7 materials synthesis, 8,9 and biological processes, 10−12 averaging different local conditions, i.e., molecule−molecule and molecule− substrate interactions, temperature, and transport properties among others. Single-molecule electrochemistry has been sought after for a long time in order to probe nanoscale local environments. The first demonstration of electrochemistry of a single molecule was reported by Fan and Bard in 1995 by trapping molecules between an insulated Pt/Ir scanning probe tip and an indium tin oxide (ITO) substrate; the bursts in current were attributed to redox of a single molecule moving in and out of the electrode-substrate gap. 13 There was a spike of interest in developing alternative methods to simultaneously detect single molecules and understand their electrochemis- try. 14−17 To this end, optical techniques have been combined with electrochemical measurements in order to observe the change in a single molecule as a function of applied potential. 18 Some studies have combined fluorescence spectroscopy with electrochemistry by correlating the fluorescence intensity of a single molecule with applied potential. 19,20 Others used electrochemical scanning tunneling microscopy (EC-STM) to monitor the conformational changes of molecules on a surface as a function of applied potential. 21 Despite the great amount of information gathered from these studies, the techniques used cannot provide detailed chemical information about the changes in electroactive species as a function of applied potential. Single-molecule SERS (SMSERS) is an ideal technique to investigate the electrochemistry of single molecules because it provides detailed chemical information about the molecular species in question. SMSERS was first claimed as strong intensity fluctuations in an ultralow concentration of Raman- active reporters and with laser excitation on resonance with the electronic absorption of the analyte. 22 Since then, the intensity fluctuation argument for SMSERS has been disproven and groups have explored different single-molecule proofs. The two most commonly used and widely accepted proofs for SMSERS detection are (i) the bianalyte method 23,24 and (ii) the frequency domain, or isotopologue, approach. 25 Both exper- imental approaches study the statistics of the relative intensities of two distinct molecules (bianalyte approach) or one molecule and its deuterated isotopologue (frequency domain approach) to infer the single-molecule nature of the SERS response. Further investigations focused on achieving (i) SMSERS on various substrates, including colloids, 1,24,26−32 lithographic Received: October 30, 2015 Revised: November 20, 2015 Published: November 23, 2015 Article pubs.acs.org/JPCC © 2015 American Chemical Society 28226 DOI: 10.1021/acs.jpcc.5b10652 J. Phys. Chem. C 2015, 119, 28226−28234
Transcript of Observing Single, Heterogeneous, One-Electron Transfer ... · authors extended the study to high...
Observing Single, Heterogeneous, One-Electron Transfer ReactionsStephanie Zaleski,† M. Fernanda Cardinal,† Jordan M. Klingsporn,† and Richard P. Van Duyne*,†,‡,§
†Department of Chemistry, Northwestern University, 2145 Sheridan Road, Evanston, Illinois 60208, United States‡Department of Biomedical Engineering, Northwestern University, 2145 Sheridan Road, Evanston, Illinois 60208, United States§Program in Applied Physics, Northwestern University, 2145 Sheridan Road, Evanston, Illinois 60208, United States
*S Supporting Information
ABSTRACT: Understanding electrochemical events on the single-molecule level iscrucial for fields such as catalysis and biological systems. A variety of techniques existto study the electrochemistry of single molecules, but few provide correlated chemicalinformation. Herein, we study the electrochemistry of rhodamine 6G in nonaqueousconditions and demonstrate the first statistic electrochemical single-molecule SERS(EC-SMSERS) proof of single-electron transfer events. We find that the distributionof reduction events is broader than that in a bulk electrochemical experiment. Thedistribution of the reduction potentials can be explained by molecular reorientationand variations of the local surface site or chemical potential of the Ag nanoparticle.Our results contribute toward understanding electrochemical behavior of singlemolecules on the nanoscale monitored by SERS and the ultimate goal of controllingsingle-electron transfer processes.
1. INTRODUCTIONThe most fundamental event in electrochemistry is thechemically reversible, one-electron, heterogeneous electrontransfer (HET) reaction. A HET reaction
+ ⇄−O 1e Rk
k
r
f
(1)
involves the oxidized form of the analyte, O, being reduced toits reduced form, R. This reaction is characterized by itsstandard potential, E0, and rate constant, k0. To date, HETreactions have only been studied at the ensemble average level.Consequently, the measured E0 and k0 represent an averageover many microscopic configurations of O and R and theirinteractions with the electrode surface.1−4
Electrochemical reactions play a central role in numerousfields such as electrocatalysis,5 energy storage,6,7 materialssynthesis,8,9 and biological processes,10−12 averaging differentlocal conditions, i.e., molecule−molecule and molecule−substrate interactions, temperature, and transport propertiesamong others. Single-molecule electrochemistry has beensought after for a long time in order to probe nanoscale localenvironments. The first demonstration of electrochemistry of asingle molecule was reported by Fan and Bard in 1995 bytrapping molecules between an insulated Pt/Ir scanning probetip and an indium tin oxide (ITO) substrate; the bursts incurrent were attributed to redox of a single molecule moving inand out of the electrode-substrate gap.13 There was a spike ofinterest in developing alternative methods to simultaneouslydetect single molecules and understand their electrochemis-try.14−17 To this end, optical techniques have been combinedwith electrochemical measurements in order to observe thechange in a single molecule as a function of applied potential.18
Some studies have combined fluorescence spectroscopy withelectrochemistry by correlating the fluorescence intensity of asingle molecule with applied potential.19,20 Others usedelectrochemical scanning tunneling microscopy (EC-STM) tomonitor the conformational changes of molecules on a surfaceas a function of applied potential.21 Despite the great amount ofinformation gathered from these studies, the techniques usedcannot provide detailed chemical information about thechanges in electroactive species as a function of appliedpotential.Single-molecule SERS (SMSERS) is an ideal technique to
investigate the electrochemistry of single molecules because itprovides detailed chemical information about the molecularspecies in question. SMSERS was first claimed as strongintensity fluctuations in an ultralow concentration of Raman-active reporters and with laser excitation on resonance with theelectronic absorption of the analyte.22 Since then, the intensityfluctuation argument for SMSERS has been disproven andgroups have explored different single-molecule proofs. The twomost commonly used and widely accepted proofs for SMSERSdetection are (i) the bianalyte method23,24 and (ii) thefrequency domain, or isotopologue, approach.25 Both exper-imental approaches study the statistics of the relative intensitiesof two distinct molecules (bianalyte approach) or one moleculeand its deuterated isotopologue (frequency domain approach)to infer the single-molecule nature of the SERS response.Further investigations focused on achieving (i) SMSERS onvarious substrates, including colloids,1,24,26−32 lithographic
Received: October 30, 2015Revised: November 20, 2015Published: November 23, 2015
Article
pubs.acs.org/JPCC
© 2015 American Chemical Society 28226 DOI: 10.1021/acs.jpcc.5b10652J. Phys. Chem. C 2015, 119, 28226−28234
substrates,33−35 and STM tips using TERS,36,37 (ii) non-resonant SMSERS,27 (iii) improved statistics, i.e., a largenumber of clearly demonstrated SMSERS events.38 Thefundamental aspects of SMSERS have been well-ex-plored,28,30,39−42 and the next step in SMSERS research is toprobe the chemical behavior of single molecules, such asmonitoring the pressure-sensitive behavior of single R6Gmolecules.43
The first use of SMSERS to explore electrochemical eventswas reported by Cortes et al. in 2010. Using the bianalyteapproach with dye molecules R6G and Nile blue (NB), theauthors demonstrated the feasibility of monitoring single-molecule electrochemistry of NB by SERS.1 In later work, theauthors extended the study to high resolution SMSERS spectraof NB by observing changes in the vibrational frequencies as afunction of applied potential. The vibrational changes wereattributed to reorientation of the NB molecule in theelectrochemical double layer and molecular orientation relativeto the nanoparticle surface.44 Another SMSERS studycombined with electrochemistry was reported by Wang et al.using ultralow concentrations of the hemin, an iron porphyrinmolecule. In this work, the authors proposed that local thermalfluctuations govern the single electron transfer dynamics ofhemin immobilized on Ag nanoparticles.45 More recently,Willets et al. have demonstrated SMSERS and electrochemistryof NB with a super-resolution microscopy approach, postulat-ing that the NB molecules are sequentially reduced/oxidized onthe nanoparticle surface.4
From our perspective, the aforementioned reports do not usethe most rigorous proof of SM sensitivity; that is, the frequencydomain or isotopologue approach,25 which is therefore ourchoice for this study. Herein, our primary goal is to understandthe electrochemical behavior of R6G on the nanoscale ascompared to a bulk electrochemical experiment. First, wecharacterize the one-electron transfer electrochemistry of R6Gboth in solution and adsorbed on Ag surfaces at highconcentration and coverage in a nonaqueous environment.Second, we demonstrate the first proof of nonaqueous, single-molecule electrochemistry optically monitored with theisotopologue approach of SMSERS. Last, we compare ourdistribution of EC-SMSERS-detected reduction events to thebulk and elaborate upon the origins of this behavior. Wepropose that the broadened distribution on the single molecule,single particle aggregate scale is primarily due to variations inthe surface site or chemical potential of the Ag nanoparticlewhere the R6G is bound. We believe that this work, togetherwith previously discussed works, demonstrates the power ofSERS as a tool to optically monitor various classes ofelectrochemical reactions at the single molecule level.
2. EXPERIMENTAL DETAILS
Chemicals. Trisodium citrate dihydrate 90%, silver nitrate+99.99% (AgNO3), sodium chloride +90% (NaCl), tetrabuty-lammonium perchlorate +99% (TBAP), hydrogen peroxidesolution 30% (H2O2), ammonium hydroxide solution 28−30%(NH4OH), (3-mercaptopropyl)trimethoxysilane (MPS) werepurchased from Sigma-Aldrich and used without furtherpurification. HPLC grade acetonitrile (≥99.5%) was purchasedfrom Avantor Performance Materials and further purified priorto use by passing through a Pure Process Technology solventdrying system. Milli-Q water with a resistivity higher than 18.2MΩ cm was used in all preparations.
Deuterated R6G. The synthesis of R6G-d4 is based onprevious conditions given by Zhang et al.46 and has beenreported elsewhere.25 Standard solutions of R6G-d0 and R6G-d4 were prepared and characterized with UV−vis absorbancespectroscopy (Figure S1).
Bulk Electrochemistry. Bulk electrochemical measure-ments were performed in a capped scintillation vial. An Agwire (0.25 mm diameter, Alfa Aesar) was utilized as theworking electrode and was submerged in solution approx-imately 1 cm above the Pt wire counter electrode. Thereference potential was determined by a nonaqueous Ag wirequasi-reference electrode (QRE) in a tetrabutylammoniumperchlorate (TBAP) solution in acetonitrile. A 1 mM R6Gsolution was prepared in 100 mM TBAP in acetonitrile. For thesurface cyclic voltammetry measurements, a polished 2 mmdiameter Ag disk electrode (CH Instruments) was incubated in150 μM R6G-d0 for 15 min and then gently rinsed withacetonitrile to remove any unbound molecules. The supportingelectrolyte solution was degassed with N2 for 30 min prior toobtaining electrochemical measurements. Electrochemicalmeasurements were performed using a CH Instrumentspotentiostat (CHI660D).
R6G Neutral Radical Absorbance Characterization.Thin layer cells were prepared by first attaching Ag wire to anITO coverslip using Ag colloidal paste (Ted Pella). Next, aclean glass coverslip was placed on top and the outsides weresealed with TorrSeal epoxy. The cell was clamped togetherusing reverse-close tweezers and allowed to cure overnight. Thecell was placed in a custom-made freeze−pump−thaw (FPT)spectroelectrochemical glass cell with 1 cm optic path length. A1 mM R6G solution was prepared in 100 mM TBAP inacetonitrile. Four FPT cycles were performed on the solutionprior to the measurements. Electrochemical potential wascontrolled with a CH Instruments potentiostat (CHI660D),and UV−vis extinction spectra were acquired using an AgilentCary 5000 spectrophotometer. Solution phase CVs weresimulated using the cyclic voltammetry fitting mode of DigiElch(version 6.0) simulation software.
Ag Nanoparticle Synthesis. Silver colloids were synthe-sized using the Lee and Miesel method.47 Briefly, 90 mg ofsilver nitrate was dissolved in 500 mL of water, stirred andbrought to boil. Once the solution was vigorously boiling, 10mL of a 1% w/v trisodium citrate solution was added understrong stirring. This solution was boiled for 30 min, removedfrom the heat, and allowed to cool to room temperature; thenthe final volume was topped off at 420 mL with ultrapure water.Transmission electron microscopy characterization of thecolloid showed spheroidal silver particles of approximately 56± 13 nm in diameter. The silver colloid was stored in darknessand used within 1 week.
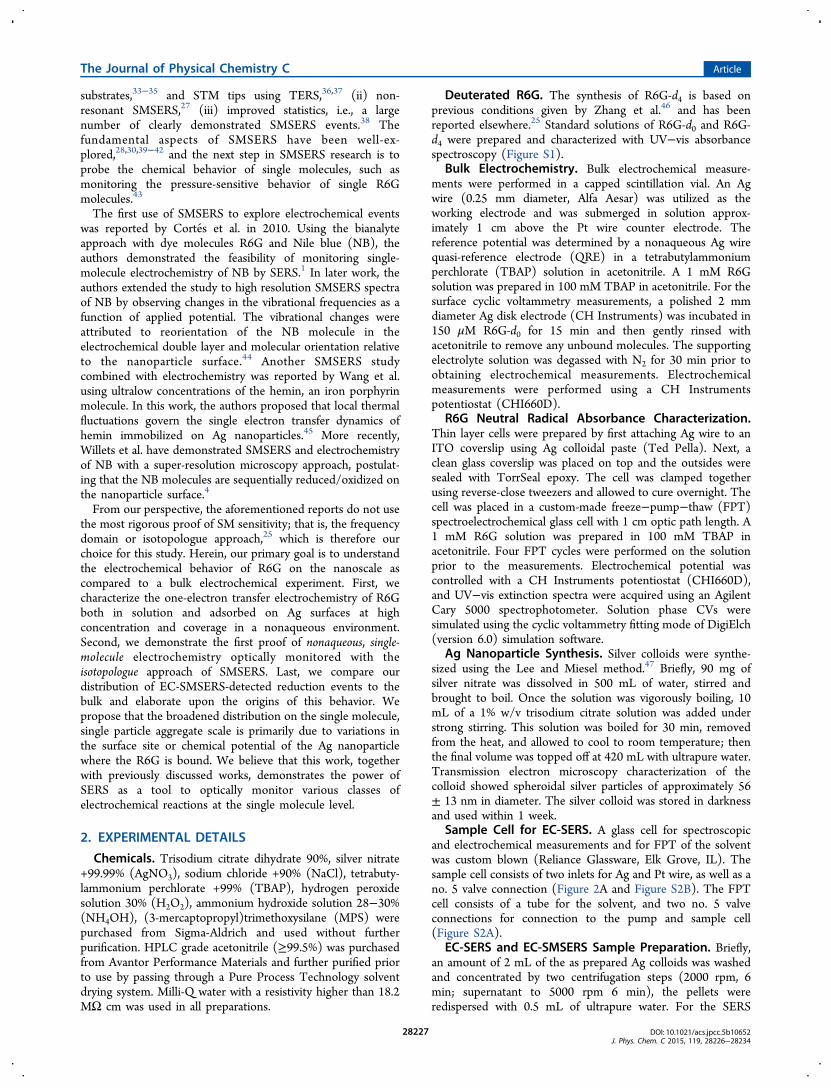
Sample Cell for EC-SERS. A glass cell for spectroscopicand electrochemical measurements and for FPT of the solventwas custom blown (Reliance Glassware, Elk Grove, IL). Thesample cell consists of two inlets for Ag and Pt wire, as well as ano. 5 valve connection (Figure 2A and Figure S2B). The FPTcell consists of a tube for the solvent, and two no. 5 valveconnections for connection to the pump and sample cell(Figure S2A).
EC-SERS and EC-SMSERS Sample Preparation. Briefly,an amount of 2 mL of the as prepared Ag colloids was washedand concentrated by two centrifugation steps (2000 rpm, 6min; supernatant to 5000 rpm 6 min), the pellets wereredispersed with 0.5 mL of ultrapure water. For the SERS
The Journal of Physical Chemistry C Article
DOI: 10.1021/acs.jpcc.5b10652J. Phys. Chem. C 2015, 119, 28226−28234
28227

sample, to the colloid 100 μL of 1 × 10⁻⁵ M total (50 μL of 0.5× 10⁻⁶ M each) of R6G-d0 and R6G d4 isotopologues wasadded and incubated with mild stirring for 1 h. For theSMSERS sample, to the colloid 100 μL of 1 × 10⁻⁷ M total (50μL of 0.5 × 10⁻⁸ M each) of R6G-d0 and R6G-d4 isotopologueswas added and incubated with mild stirring for 1 h. Wecalculated the maximum R6G/nanoparticle ratio at the SMconcentration regime as 3:1, assuming total reduction of silversalt to 30 nm spherical nanoparticles47 and complete (100%)adsorption of R6G molecules to the particles surface. Weassume that R6G/nanoparticle ratio is close to 1:1 in our finalexperimental conditions, since (i) during the incubation, not allthe R6G might adsorb,22 (ii) after incubation the samples werethoroughly rinsed, and (iii) further desorption of R6G mighttake place to the electrolyte solution. Later, 0.5 mL of 40 mMNaCl was added to induce nanoparticle aggregation and leftovernight before using the sample. ITO coverslips (22 × 22mm2, 8−12 Ω, copper busbar, SPI Supplies) were function-alized with (3-mercaptopropyl)trimethoxysilane to covalentlyattach the Ag nanoparticles. First, the ITO was sonicated inisopropanol for 5 min, then cleaned in a solution of 5:1:1 H2O/NH3OH/H2O2 for 12 min at 50 °C. Then, 0.5 mL of (3-mercaptopropyl)trimethoxysilane in 50 mL of isopropanol wasallowed to react at RT for 5 min. The Ag colloids were thendrop casted onto the ITO surface and allowed to dry in an N2environment, and then substrates were thoroughly washed toremove any unbound particle or salts. After the ITO is fullydried with N2, copper tape is placed on the ITO to allow forelectrical contact. The sample is then mounted on the SMSERSglass sample cell using TorrSeal epoxy (Duniway StockroomCorporation, Fremont, CA) and allowed to cure overnight.Next, the cell is placed under vacuum and the supportingelectrolyte is transferred in vacuum in order to remove oxygenand water, which quenches radical species and/or cause R6Gdegradation. The assembled cell was connected to the customFPT cell which is then connected to a custom built highvacuum line (base pressure of ∼10−6 Torr). The FPT cell isthen filled with 10−15 mL performed prior to solvent transferto the SMSERS cell. After solvent transfer, the SMSERS cell
valve was closed and was disconnected from the FPT cell forspectroscopic measurements.
EM Characterization. SEM images were obtained using aFEI Helios NanoLab 600 microscope operating at anacceleration voltage of 3.0 kV and an operating current of 1.4nA.
Raman Instrumentation. Samples were analyzed on aninverted microscope (Nikon Eclipse Ti-U) with a 100× oilimmersion objective and 0.5 numerical aperture. Particleaggregates are initially viewed under dark field illuminationwith a 0.8−0.95 numerical aperture condenser. To illuminatethe entire field of view for SMSERS measurements, a 532 nmCW laser (Millenia VIIIs, Spectra Physics) was focused ontothe sample using grazing incidence at an angle of 60° relative tothe surface normal. Scattered light was collected from SERSactive particles, laser light was filtered (RazorEdge long pass532 nm filter, Semrock) and focused onto a 1/3 m imagingspectrograph (SP2300, Princeton Instruments). The scatteredlight was then dispersed (1200 groove/mm grating, 500 nmblaze) and focused onto a liquid nitrogen-cooled CCD detector(Spec10:400BR, Princeton Instruments).
3. RESULTS AND DISCUSSION
I. Electrochemical Characterization of R6G System.Prior to SMSERS measurements, we characterized the bulkelectrochemistry of R6G in solution and adsorbed on silversurfaces. R6G undergoes a one-electron transfer, as shown inthe schematic in Figure 1A. The solution phase cyclicvoltammogram (CV) using a silver wire working electrode isdisplayed in Figure 1B. In this figure, a peak separation of 64mV is observed, which is common in diffusion-controlledprocesses, as well as a good correlation between theexperimental (solid line) and simulated (open circles) CVs.Also, we observed a linear relationship between the solutionphase CV cathodic peak current and the square root of the scanrate which indicates that this is a reversible, diffusion-controlledprocess (Figure S3). Next, we studied the electrochemicalbehavior of R6G adsorbed on Ag nanoparticles (NPs) on ITO,i.e., a high-coverage analog of the electrode used for SMSERS
Figure 1. (A) Schematic of heterogeneous one-electron transfer reaction for the reduction of rhodamine 6G cation (green box) to its neutral radicalproduct (red box). (B) 1 mM R6G solution phase CV on Ag working electrode (black trace) and fitted electrochemical simulation data (blackcircles). (C) Surface CV of high coverage R6G AgNPs on ITO.
The Journal of Physical Chemistry C Article
DOI: 10.1021/acs.jpcc.5b10652J. Phys. Chem. C 2015, 119, 28226−28234
28228
measurements as shown in Figure 1C. We note that themagnitudes of the reduction and oxidation peaks are not equal,suggesting electrochemical desorption of the R6G neutralradical species after reduction. Additionally, the difference inshape between the solution CV in Figure 1B and surface CV inFigure 1C is due to background capacitance, characteristic of asurface CV.48 In the case of Ag NPs on ITO as workingelectrode, when the CV scan rate is increased, we observe alinear relationship with the position of the peak cathodiccurrent, indicative of uncompensated solution resistance(Figure S4, black trace).48 Also, we confirm that R6G is thesurface-bound electroactive species by plotting the cathodicpeak current versus scan rate. This relationship is linear whichconfirms a surface-bound electroactive species48 (Figure S4, redtrace). These results show that R6G has well-behavedelectrochemistry as a surface-bound species on an Ag NPsurface. This thorough characterization of R6G electro-chemistry at high concentration and coverage gives us a solidplatform to compare multimolecule and single-moleculereduction potential data.Later, we characterized the absorbance of the R6G cation and
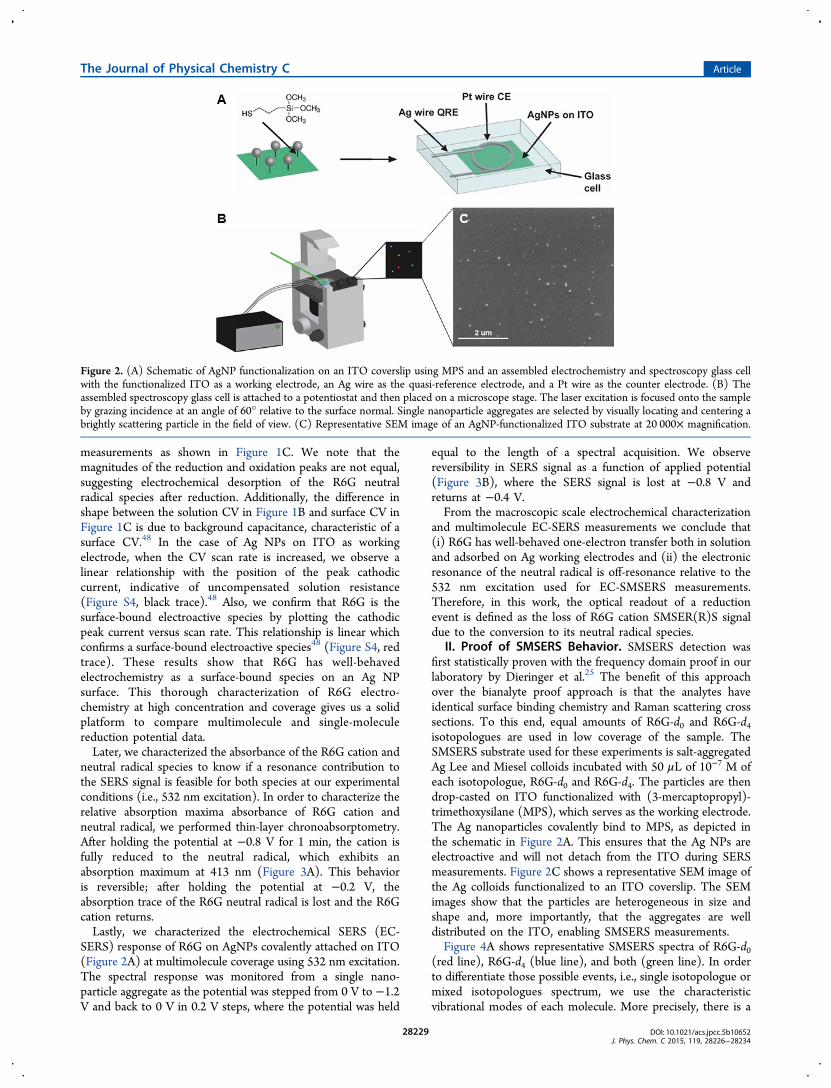
neutral radical species to know if a resonance contribution tothe SERS signal is feasible for both species at our experimentalconditions (i.e., 532 nm excitation). In order to characterize therelative absorption maxima absorbance of R6G cation andneutral radical, we performed thin-layer chronoabsorptometry.After holding the potential at −0.8 V for 1 min, the cation isfully reduced to the neutral radical, which exhibits anabsorption maximum at 413 nm (Figure 3A). This behavioris reversible; after holding the potential at −0.2 V, theabsorption trace of the R6G neutral radical is lost and the R6Gcation returns.Lastly, we characterized the electrochemical SERS (EC-
SERS) response of R6G on AgNPs covalently attached on ITO(Figure 2A) at multimolecule coverage using 532 nm excitation.The spectral response was monitored from a single nano-particle aggregate as the potential was stepped from 0 V to −1.2V and back to 0 V in 0.2 V steps, where the potential was held
equal to the length of a spectral acquisition. We observereversibility in SERS signal as a function of applied potential(Figure 3B), where the SERS signal is lost at −0.8 V andreturns at −0.4 V.From the macroscopic scale electrochemical characterization
and multimolecule EC-SERS measurements we conclude that(i) R6G has well-behaved one-electron transfer both in solutionand adsorbed on Ag working electrodes and (ii) the electronicresonance of the neutral radical is off-resonance relative to the532 nm excitation used for EC-SMSERS measurements.Therefore, in this work, the optical readout of a reductionevent is defined as the loss of R6G cation SMSER(R)S signaldue to the conversion to its neutral radical species.
II. Proof of SMSERS Behavior. SMSERS detection wasfirst statistically proven with the frequency domain proof in ourlaboratory by Dieringer et al.25 The benefit of this approachover the bianalyte proof approach is that the analytes haveidentical surface binding chemistry and Raman scattering crosssections. To this end, equal amounts of R6G-d0 and R6G-d4isotopologues are used in low coverage of the sample. TheSMSERS substrate used for these experiments is salt-aggregatedAg Lee and Miesel colloids incubated with 50 μL of 10−7 M ofeach isotopologue, R6G-d0 and R6G-d4. The particles are thendrop-casted on ITO functionalized with (3-mercaptopropyl)-trimethoxysilane (MPS), which serves as the working electrode.The Ag nanoparticles covalently bind to MPS, as depicted inthe schematic in Figure 2A. This ensures that the Ag NPs areelectroactive and will not detach from the ITO during SERSmeasurements. Figure 2C shows a representative SEM image ofthe Ag colloids functionalized to an ITO coverslip. The SEMimages show that the particles are heterogeneous in size andshape and, more importantly, that the aggregates are welldistributed on the ITO, enabling SMSERS measurements.Figure 4A shows representative SMSERS spectra of R6G-d0
(red line), R6G-d4 (blue line), and both (green line). In orderto differentiate those possible events, i.e., single isotopologue ormixed isotopologues spectrum, we use the characteristicvibrational modes of each molecule. More precisely, there is a
Figure 2. (A) Schematic of AgNP functionalization on an ITO coverslip using MPS and an assembled electrochemistry and spectroscopy glass cellwith the functionalized ITO as a working electrode, an Ag wire as the quasi-reference electrode, and a Pt wire as the counter electrode. (B) Theassembled spectroscopy glass cell is attached to a potentiostat and then placed on a microscope stage. The laser excitation is focused onto the sampleby grazing incidence at an angle of 60° relative to the surface normal. Single nanoparticle aggregates are selected by visually locating and centering abrightly scattering particle in the field of view. (C) Representative SEM image of an AgNP-functionalized ITO substrate at 20 000× magnification.
The Journal of Physical Chemistry C Article
DOI: 10.1021/acs.jpcc.5b10652J. Phys. Chem. C 2015, 119, 28226−28234
28229
clear spectral distinction between the 601 cm−1 peak of R6G-d0and the 610 cm−1 peak of R6G-d4; therefore, this spectralregion was used to differentiate the isotopologues (Figure 4B).Additionally, R6G-d4 exhibits a unique doublet feature at 1350and 1330 cm−1 which was also used for molecular identification.SMSERS spectra were acquired from 80 individual particleaggregates for which the events were classified as shown in thehistogram in Figure 5B. The ratio of R6G-d0/both/R6G-d4events is 35:5:40 or 7:1:8, confirming single-moleculedetection. Our results deviate from a theoretical binomialPoisson distribution for one molecule per particle with aprobability ratio of 2.5:1:2.5, and this deviation can beattributed to having less than one R6G molecule per particle,molecules located outside a hot spot during spectral acquisition,molecules not bound to the surface during the incubation time,and/or molecules desorbed in solution.25
III. EC-SMSERS Signal Potential Dependence. Forelectrochemical SMSERS (EC-SMSERS) measurements, theSMSERS signal of each single Ag nanoparticle aggregate wasmonitored as the potential was stepped from 0 to −1.2 V in 0.1V intervals and then swept positive from −1.2 to 0 V in 0.1 V
intervals. The potential was held constant for the length ofSMSERS spectral acquisition (pulse width of 3 s) and the totalacquisition time was relatively long (∼5 min). A representativetrace of the potential step function and the correspondingSMSER signal response are shown in Figure 5A and Figure 5C,respectively. The histogram in Figure 5D corresponds to theR6G SMSERS signal loss events that we understand as thepotential at which the R6G cation was reduced to the neutralradical species. Figure 5D only includes single isotopologuesignal loss events; we do not include “both” isotopologuesspectra. In our experiments, we do not observe SMSERSspectra of the neutral radical species with 532 nm excitationbecause of the absence of resonance enhancement. The totalnumber of events in Figure 5D (44) is less than that of thehistogram in Figure 5B due to signal loss prior to theelectrochemical measurements. Sporadic intensity fluctuations,“blinking”, and signal loss are common in SMSERS measure-ments as a result of molecular diffusion, variations of theelectric field enhancement, photobleaching, and photochemicaleffect among others,23,25 making data acquisition challenging.Figure 5D includes only those particle aggregates in whichSMSERS signal was stable for more than ∼1 min before thepotential step. Overall, it was found that there was significantlyless random blinking and signal loss in the liquid cell ascompared to previous SMSERS experiments performed in airor nitrogen.Not included in Figure 5D were 17 other studied particles
that did not undergo SMSERS signal loss with the appliedpotentials. More likely, these particles did not have electricalcontact due to defects on the ITO surface or to the particleaggregate requiring a much more negative potential tosufficiently reduce the R6G molecule.Only two SMSERS signal loss events in Figure 5D had a
corresponding signal return, or oxidation. In both cases, thesignal return occurred at −0.2 V, which is similar to thebehavior observed in the high coverage SERS data (Figure 3B).Possible sources for complete SMSERS signal loss include hotspot reshaping or particle desorption from the ITO, quenchingof the R6G radical with water or oxygen traces, or moleculardiffusion outside the hot spot. Additionally, this resultcorrelates strongly to the fact that the reduction and oxidationpeaks are not of equal magnitude in the surface CV of AgNPson ITO (Figure 1C) or R6G on polished Ag (Figure 5D). Wehypothesize that molecular diffusion or desorption away fromthe hot spot of the neutral radical species is the main cause ofcomplete SMSERS signal loss after a reduction event. It is alsopossible that the SMSERS signal is lost due to potential-induced structural changes to the nanoparticle aggregate andtherefore loss of SMSERS activity in the hot spot.49−51
We attempted to differentiate between possible non-electrochemical desorption of the R6G cation before thepotential step (eq 2) from electrochemical desorption of theneutral radical during or after the reduction (eq 3).
+ +X YoooR6G R6Gk
ksurf soln
d
ads
(2)
+ · ⇄ ·+ − X YoooR6G e R6G R6Gk
k
k
k
surf surf solnd
ads
a
d
(3)
For this, we repeated the measurements stepping thepotential only at the non-Faradaic region, from −0.1 to −0.7V as compared to the surface CV in Figure 1C. We chose tostep within this potential window because there should be few
Figure 3. (A) Thin-layer absorbance spectra of 1 mM R6G in 100 mMTBAP in MeCN with no potential applied (green) and after 1 min−0.8 V applied (red). The absorbance measurements were performedwith an ITO thin layer working electrode, Ag wire quasi-referenceelectrode, and a Pt wire counter electrode. (B) EC-SERS of R6G atmany molecule coverage where the potential is swept from 0 V (blacktrace) to −1.2 V (brown trace) in −0.2 V steps, then stepped back to 0V. The signal is lost at −0.8 V (first purple trace) and returns at −0.4V (second green trace). The starred peak is due to the acetonitrilesolution.
The Journal of Physical Chemistry C Article
DOI: 10.1021/acs.jpcc.5b10652J. Phys. Chem. C 2015, 119, 28226−28234
28230

electrochemical events occurring, and therefore there should beno SMSERS signal loss with the potential step. In thisexperiment, 16 of 20 SMSERS spectra collected showed nosignal loss during the potential step; the consistent SMSERSsignal indicates that neither R6G cation desorption (eq 2) norelectrochemical reduction followed by radical desorption (eq 3)occurred (Figure 6A). Of the 20 SMSERS spectra collected, 4showed signal loss between −0.4 V and −0.7 V as illustrated inFigure 6B, which could be caused by eq 2 or eq 3. We areinclined to think that these four cases were most likelyreduction events followed by diffusion of the radical as
represented by eq 3. Due to the fact that at this controlexperiment we do not observe any signal loss at −0.3 V, weassume that the loss events observed at −0.3 V in Figure 5D aremost likely caused by desorption of the R6G cation (eq 2) andwe hypothesize that the complete SMSERS signal loss between−0.6 V and −1.2 V, without signal return or oxidation, isprobably due to electrochemical desorption of the R6G neutralradical (eq 3).We observe a broadened SMSERS signal loss potential
distribution (Figure 5D) relative to the Faradaic region in thesurface CV. In light of this, we now discuss the origin of the
Figure 4. (A) Representative SMSERS spectra of R6G-d0 (red), both (green), and R6G-d4 (blue). (B) SMSERS spectra focused on the 600 cm−1
region, displaying the unique isotopologue spectral features for R6G-d0 (red) and R6G-d4 (blue). Data acquisition parameters for SMSERSmeasurements were the following: λex = 532 nm, Pex = 13.6 mW, tacq = 3 s.
Figure 5. (A) Representative trace of the potential step function applied in electrochemistry measurements to each single Ag nanoparticle aggregate,where Ei = 0 V, E1 = −0.1 V. The amplitude between steps is −0.1 V, and the pulse width is equivalent to the spectral acquisition time. (B)Histogram displaying all SMSERS events. (C) Representative SMSERS spectra from a single particle aggregate displaying signal change as a functionof applied potential. The SMSERS signal is lost at −1.2 V (center, dark blue trace) and returns at −0.2 V (bottom, red trace). (D) Surface CV ofhigh coverage R6G on a polished Ag disk electrode in 100 mM TBAP in MeCN (top) compared to the histogram of all SMSERS measured signalloss events (bottom).
The Journal of Physical Chemistry C Article
DOI: 10.1021/acs.jpcc.5b10652J. Phys. Chem. C 2015, 119, 28226−28234
28231

broadened distribution of the SMSERS R6G signal losspotential histogram. For example, a similar broadening effecthas been observed in a SMSERS experiment across a smallerpotential range for an aqueous two electron, two protontransfer of Nile blue (NB) from Cortes et al.1,44 The authorsfound a correlation between the peak positions of the 590 cm−1
ring breathing mode in NB to the reduction potential. Theyattribute this phenomenon to molecular orientation and themolecule’s relative interaction strength with the nanoparticlesurface. Additionally, another study by Salverda et al. found thatwhen azurin, a Cu protein, is bound on Au electrodes at lowcoverage, the electron transfer rates were broadly distributed,which they attributed to heterogeneous protein orientation.10
On the basis of these preceding studies and our experimentalresults, we propose two primary contributing factors to theobserved broadened potential distribution: molecular reor-ientation on the surface and variations in the local hot-spotnanostructure or surface chemical potential, including in theformer possible effects from varied curvatures and possibleoxide layers.We note that we do not attempt to extract information on
the molecular position on the surface from the relativeintensities of the SMSERS signal. Commonly, the intensity ofSERS spectra will decay accordingly with the distance of theRaman molecule to the substrate.52 Distinctly, at the singlemolecule level, the intensity of the peaks might change due tothe distance or relative position of the molecule to the hot spotor variations in its excited-state properties.53 To this end, weanalyze the R6G peak positions as a function of potential,which is sensitive to position relative to the Ag NP surface.To simplify the spectral analysis, we divide it into two
regions. First, we examine the 600 cm−1 region R6G peak,which has been determined by DFT calculations to be a ringbreathing mode.54 While the position of the mode varies fromspectrum to spectrum, we do not observe any correlationbetween the applied potential and peak position shift. Also,there is no connection between peak position and the potentialof an SMSERS signal loss event when correlating the data in
Figure 5D to that of Figure S6A. Then, we examined the 1350cm−1 region mode, determined by DFT calculations to have93.9% ethylamine moiety vibrational character and hypothe-sized as the anchoring moiety.54 If R6G binds to the Agnanoparticle surface via the ethylamine moiety, its correspond-ing vibrational mode peak position should therefore besensitive to changes in the orientation relative to the Agnanoparticle. In half of the spectra collected, there is a blue shiftof the 1350 cm−1 mode with increasingly applied negativepotential (Figure S5). Yet, there is no correlation between thepeak position and the reduction or signal loss potential whencorrelating the data from Figure 5D to Figure S6B. The shiftsobserved in the 1350 cm−1 mode could be attributed to avibrational Stark effect, which occurs when a molecular dipole isperturbed by a local electric field.55−57 Hence, the majordifference between our results and Cortes et al.44 is lack of adistinct correlation between Raman shift of either the 600 or1350 cm−1 modes and the applied or reduction potential.Disregarding the difference in the spectral resolution becauseour measurements were performed with a lower spectralresolution, our results suggest that molecular orientation andinteraction with the nanoparticle surface are not the onlycontributors to the broad SMSERS signal loss potentialhistogram.We hypothesize that the major contribution to the
broadened SMSERS signal loss potential distribution relativeto the bulk is due to the local radius of curvature, surface site,and corresponding surface chemical potential of the specific siteof the Ag nanoparticle where the R6G molecule is bound.Preceding theoretical and experimental studies indicate thestructure-dependent electrochemical behavior of Ag nanostruc-tures and that sharp, small radius of curvature features are themost electrochemically active.58−61 For example, Zhang et al.measured the electrochemical oxidation of Ag nanotrianglesand found that as a positive potential is applied to the substrate,the sharp, bottom edges first oxidize, followed by the morerounded triangular tip regions.62 This behavior was rationalizedbased on a previous statement that the work function of a small,metallic particle varies inversely with the radius of a metallicnanoparticle. Recent work has also demonstrated theheterogeneous chemical activity of various nanoparticle shapesand sizes on the single particle level and supports the idea thatelectrochemical activity is dependent on surface structure.63,64
We can extend these ideas to our findings, postulating thatparticles with smaller radii of curvature, or sharper nano-features, will be more electrochemically active and thereforelead to SMSERS underpotential events. For our SMSERSmeasurements, the subtle difference in local surface sitestructure, binding geometry, and overall nanoparticle shapeand size can be a possible explanation of the lack of correlationbetween the broad potential range of SMSERS signal lossevents and the Raman shifts observed.
4. CONCLUSIONSIn summary, we first characterize the bulk electrochemistry ofR6G, which undergoes single electron redox. Next, wecharacterize the spectroelectrochemical response of the R6Gelectron transfer reaction with absorbance spectroscopy andSERS at high R6G coverage. Finally, we demonstrate the firstobservation of single-electron transfer with EC-SMSERS. Thepotential distribution of SMSERS signal loss events is broaderthan of the bulk electrochemical system. We attribute thisbehavior to variations in molecular orientations and variations
Figure 6. SMSERS spectra from potential steps in the non-Faradaicregion (−0.1 to −0.7 V). (A) Spectra display no loss in SMSER signal,illustrative example of 16 out of 20 events, indicating that neither eq 2nor eq 3 took place. (B) Representative SMSERS spectra for 4 out of20 events where the potential step in the non-Faradaic region displaysa loss in SMSER signal, here at −0.6 V. These SMSERS signal lossevents are most likely due to electrochemical reduction of R6G andnot R6G cation desorption.
The Journal of Physical Chemistry C Article
DOI: 10.1021/acs.jpcc.5b10652J. Phys. Chem. C 2015, 119, 28226−28234
28232

in the radius of curvature, binding site, and/or chemicalpotential where the R6G molecule is bound to the Agnanoparticle substrate. Future efforts will address thecorrelation of SMSERS measurements with electron micros-copy to understand the impact of nanofeatures on thedistribution of reduction potentials together with densityfunctional theory calculations. Overall, this work has presentedchallenges involved in studying single-molecule single-electronelectrochemical events through SERS and pursuing electro-chemical control at the nanoscale.
■ ASSOCIATED CONTENT*S Supporting InformationThe Supporting Information is available free of charge on theACS Publications website at DOI: 10.1021/acs.jpcc.5b10652.
Additional spectral and electrochemical characterizationdata, photographs of the custom glass cell, supplemen-tary SMSERS spectra (PDF)
■ AUTHOR INFORMATIONCorresponding Author*E-mail: [email protected] ContributionsAll authors have given approval to the final version of themanuscript.NotesThe authors declare no competing financial interest.
■ ACKNOWLEDGMENTSThis work was supported by Air Force Office of ScientificResearch MURI (Grant FA9550-14-1-0003) and the NationalScience Foundation (MRSEC Grants NSF DMR-1121262 andNSF CHE-1152547). This work made use of the EPIC facility(NUANCE CenterNorthwestern University), which hasreceived support from the MRSEC program (Grant NSFDMR-1121262) at the Materials Research Center; theNanoscale Science and Engineering Center (Grant NSF EEC-0647560) at the International Institute for Nanotechnology;and the State of Illinois, through the International Institute forNanotechnology. M.F.C. acknowledges the access to thesolvent system of the Stoddart group at NorthwesternUniversity for the provided dried acetonitrile.
■ REFERENCES(1) Cortes, E.; Etchegoin, P. G.; Le Ru, E. C.; Fainstein, A.; Vela, M.E.; Salvarezza, R. C. Monitoring the Electrochemistry of SingleMolecules by Surface-Enhanced Raman Spectroscopy. J. Am. Chem.Soc. 2010, 132, 18034−18037.(2) Venkataraman, L.; Klare, J. E.; Nuckolls, C.; Hybertsen, M. S.;Steigerwald, M. L. Dependence of Single-Molecule JunctionConductance on Molecular Conformation. Nature 2006, 442, 904−907.(3) Shan, X.; Patel, U.; Wang, S.; Iglesias, R.; Tao, N. Imaging LocalElectrochemical Current Via Surface Plasmon Resonance. Science2010, 327, 1363−1366.(4) Wilson, A. J.; Willets, K. A. Visualizing Site-Specific RedoxPotentials on the Surface of Plasmonic Nanoparticle Aggregates withSuperlocalization SERS Microscopy. Nano Lett. 2014, 14, 939−45.(5) Mao, X.; Hatton, T. A. Recent Advances in ElectrocatalyticReduction of Carbon Dioxide Using Metal-Free Catalysts. Ind. Eng.Chem. Res. 2015, 54, 4033−4042.(6) Lipson, A. L.; Puntambekar, K.; Comstock, D. J.; Meng, X.;Geier, M. L.; Elam, J. W.; Hersam, M. C. Nanoscale Investigation of
Solid Electrolyte Interphase Inhibition on Li-Ion Battery MnOElectrodes Via Atomic Layer Deposition of Al2O3. Chem. Mater.2014, 26, 935−940.(7) Lipson, A. L.; Ginder, R. S.; Hersam, M. C. Nanoscale in situCharacterization of Li-Ion Battery Electrochemistry Via Scanning IonConductance Microscopy. Adv. Mater. 2011, 23, 5613−7.(8) Yu; Chang, S.-S.; Lee, C.-L.; Wang, C. R. C. Gold Nanorods:Electrochemical Synthesis and Optical Properties. J. Phys. Chem. B1997, 101, 6661−6664.(9) Taberna, P. L.; Mitra, S.; Poizot, P.; Simon, P.; Tarascon, J. M.High Rate Capabilities Fe3O4-Based Cu Nano-Architectured Electro-des for Lithium-Ion Battery Applications. Nat. Mater. 2006, 5, 567−573.(10) Salverda, J. M.; Patil, A. V.; Mizzon, G.; Kuznetsova, S.; Zauner,G.; Akkilic, N.; Canters, G. W.; Davis, J. J.; Heering, H. A.; Aartsma, T.J. Fluorescent Cyclic Voltammetry of Immobilized Azurin: DirectObservation of Thermodynamic and Kinetic Heterogeneity. Angew.Chem., Int. Ed. 2010, 49, 5776−9.(11) Davis, J. J.; Burgess, H.; Zauner, G.; Kuznetsova, S.; Salverda, J.;Aartsma, T.; Canters, G. W. Monitoring Interfacial Bioelectrochem-istry Using a FRET Switch. J. Phys. Chem. B 2006, 110, 20649−20654.(12) Goldsmith, R. H.; Tabares, L. C.; Kostrz, D.; Dennison, C.;Aartsma, T. J.; Canters, G. W.; Moerner, W. E. Redox Cycling andKinetic Analysis of Single Molecules of Solution-Phase NitriteReductase. Proc. Natl. Acad. Sci. U. S. A. 2011, 108, 17269−74.(13) Fan, F.-R. F.; Bard, A. J. Electrochemical Detection of SingleMolecules. Science 1995, 267, 871−874.(14) Huang, K.-C.; White, R. J. Random Walk on a Leash: A SimpleSingle-Molecule Diffusion Model for Surface-Tethered RedoxMolecules with Flexible Linkers. J. Am. Chem. Soc. 2013, 135,12808−12817.(15) Zhang, J.; Kuznetsov, A. M.; Medvedev, I. G.; Chi, Q.; Albrecht,T.; Jensen, P. S.; Ulstrup, J. Single-Molecule Electron Transfer inElectrochemical Environments. Chem. Rev. 2008, 108, 2737−2791.(16) Kang, S.; Nieuwenhuis, A. F.; Mathwig, K.; Mampallil, D.;Lemay, S. G. Electrochemical Single-Molecule Detection in AqueousSolution Using Self-Aligned Nanogap Transducers. ACS Nano 2013, 7,10931−10937.(17) Lemay, S. G.; Kang, S.; Mathwig, K.; Singh, P. S. Single-Molecule Electrochemistry: Present Status and Outlook. Acc. Chem.Res. 2013, 46, 369−377.(18) Hill, C. M.; Clayton, D. A.; Pan, S. Combined Optical andElectrochemical Methods for Studying Electrochemistry at the SingleMolecule and Single Particle Level: Recent Progress and Perspectives.Phys. Chem. Chem. Phys. 2013, 15, 20797−20807.(19) Lei, C.; Hu, D.; Ackerman, E. J. Single-Molecule FluorescenceSpectroelectrochemistry of Cresyl Violet. Chem. Commun. 2008,5490−2.(20) Chang, Y.-L.; Palacios, R. E.; Fan, F.-R. F.; Bard, A. J.; Barbara,P. F. Electrogenerated Chemiluminescence of Single ConjugatedPolymer Nanoparticles. J. Am. Chem. Soc. 2008, 130, 8906−8907.(21) Tao, N. J. Probing Potential-Tuned Resonant TunnelingThrough Redox Molecules with Scanning Tunneling Microscopy.Phys. Rev. Lett. 1996, 76, 4066−4069.(22) Nie, S.; Emory, S. R. Probing Single Molecules and SingleNanoparticles by Surface-Enhanced Raman Scattering. Science 1997,275, 1102−1106.(23) Blackie, E.; Le Ru, E. C.; Meyer, M.; Timmer, M.; Burkett, B.;Northcote, P.; Etchegoin, P. G. Bi-Analyte SERS with IsotopicallyEdited Dyes. Phys. Chem. Chem. Phys. 2008, 10, 4147−4153.(24) Etchegoin, P. G.; Le Ru, E. C.; Fainstein, A. Bi-Analyte SingleMolecule SERS Technique with Simultaneous Spatial Resolution. Phys.Chem. Chem. Phys. 2011, 13, 4500−4506.(25) Dieringer, J. A.; Lettan, R. B.; Scheidt, K. A.; Van Duyne, R. P. AFrequency Domain Existence Proof of Single-Molecule Surface-Enhanced Raman Spectroscopy. J. Am. Chem. Soc. 2007, 129,16249−16256.(26) Kleinman, S. L.; Ringe, E.; Valley, N.; Wustholz, K. L.; Phillips,E.; Scheidt, K. A.; Schatz, G. C.; Van Duyne, R. P. Single-Molecule
The Journal of Physical Chemistry C Article
DOI: 10.1021/acs.jpcc.5b10652J. Phys. Chem. C 2015, 119, 28226−28234
28233

Surface-Enhanced Raman Spectroscopy of Crystal Violet Isotopo-logues: Theory and Experiment. J. Am. Chem. Soc. 2011, 133, 4115−4122.(27) Blackie, E. J.; Ru, E. C. L.; Etchegoin, P. G. Single-MoleculeSurface-Enhanced Raman Spectroscopy of Nonresonant Molecules. J.Am. Chem. Soc. 2009, 131, 14466−14472.(28) Etchegoin, P. G.; Le Ru, E. C.; Meyer, M. Evidence of NaturalIsotopic Distribution from Single-Molecule SERS. J. Am. Chem. Soc.2009, 131, 2713−2716.(29) Stranahan, S. M.; Willets, K. A. Super-Resolution OpticalImaging of Single-Molecule SERS Hot Spots. Nano Lett. 2010, 10,3777−84.(30) Artur, C.; Le Ru, E. C.; Etchegoin, P. G. TemperatureDependence of the Homogeneous Broadening of Resonant RamanPeaks Measured by Single-Molecule Surface-Enhanced Raman Spec-troscopy. J. Phys. Chem. Lett. 2011, 2, 3002−3005.(31) Le Ru, E. C.; Etchegoin, P. G. Single-Molecule Surface-Enhanced Raman Spectroscopy. Annu. Rev. Phys. Chem. 2012, 63, 65−87.(32) Patra, P. P.; Chikkaraddy, R.; Tripathi, R. P.; Dasgupta, A.;Kumar, G. V. Plasmofluidic Single-Molecule Surface-Enhanced RamanScattering from Dynamic Assembly of Plasmonic Nanoparticles. Nat.Commun. 2014, 5, 4357.(33) Ahmed, A.; Gordon, R. Single Molecule Directivity EnhancedRaman Scattering Using Nanoantennas. Nano Lett. 2012, 12, 2625−2630.(34) Crozier, K. B.; Wenqi, Z.; Dongxing, W.; Shiyun, L.; Best, M.D.; Camden, J. P. Plasmonics for Surface Enhanced Raman Scattering:Nanoantennas for Single Molecules. IEEE J. Sel. Top. QuantumElectron. 2014, 20, 152−162.(35) Zrimsek, A. B.; Henry, A.-I.; Van Duyne, R. P. Single MoleculeSurface-Enhanced Raman Spectroscopy Without Nanogaps. J. Phys.Chem. Lett. 2013, 4, 3206−3210.(36) Sonntag, M. D.; Klingsporn, J. M.; Garibay, L. K.; Roberts, J. M.;Dieringer, J. A.; Seideman, T.; Scheidt, K. A.; Jensen, L.; Schatz, G. C.;Van Duyne, R. P. Single-Molecule Tip-Enhanced Raman Spectrosco-py. J. Phys. Chem. C 2012, 116, 478−483.(37) Steidtner, J.; Pettinger, B. Tip-Enhanced Raman Spectroscopyand Microscopy on Single Dye Molecules with 15 nm Resolution.Phys. Rev. Lett. 2008, 100, 236101.(38) Etchegoin, P. G.; Meyer, M.; Le Ru, E. C. Statistics of SingleMolecule SERS Signals: Is There a Poisson Distribution of Intensities?Phys. Chem. Chem. Phys. 2007, 9, 3006−3010.(39) Dieringer, J. A.; Wustholz, K. L.; Masiello, D. J.; Camden, J. P.;Kleinman, S. L.; Schatz, G. C.; Van Duyne, R. P. Surface-EnhancedRaman Excitation Spectroscopy of a Single Rhodamine 6G Molecule.J. Am. Chem. Soc. 2009, 131, 849−854.(40) Titus, E. J.; Weber, M. L.; Stranahan, S. M.; Willets, K. A. Super-Resolution SERS Imaging Beyond the Single-Molecule Limit: AnIsotope-Edited Approach. Nano Lett. 2012, 12, 5103−5110.(41) Mirsaleh-Kohan, N.; Iberi, V.; Simmons, P. D.; Bigelow, N. W.;Vaschillo, A.; Rowland, M. M.; Best, M. D.; Pennycook, S. J.; Masiello,D. J.; Guiton, B. S.; et al. Single-Molecule Surface-Enhanced RamanScattering: Can STEM/EELS Image Electromagnetic Hot Spots? J.Phys. Chem. Lett. 2012, 3, 2303−2309.(42) Galloway, C. M.; Le Ru, E. C.; Etchegoin, P. G. Single-MoleculeVibrational Pumping in SERS. Phys. Chem. Chem. Phys. 2009, 11,7372−7380.(43) Fu, Y.; Dlott, D. D. Single Molecules under High Pressure. J.Phys. Chem. C 2015, 119, 6373−6381.(44) Cortes, E.; Etchegoin, P. G.; Le Ru, E. C.; Fainstein, A.; Vela, M.E.; Salvarezza, R. C. Strong Correlation between MolecularConfigurations and Charge-Transfer Processes Probed at the Single-Molecule Level by Surface-Enhanced Raman Scattering. J. Am. Chem.Soc. 2013, 135, 2809−15.(45) Wang, Y.; Sevinc, P. C.; He, Y.; Lu, H. P. Probing Ground-StateSingle-Electron Self-Exchange across a Molecule−Metal Interface. J.Am. Chem. Soc. 2011, 133, 6989−6996.
(46) Zhang, D.; Xie, Y.; Deb, S. K.; Davison, V. J.; Ben-Amotz, D.Isotope Edited Internal Standard Method for Quantitative Surface-Enhanced Raman Spectroscopy. Anal. Chem. 2005, 77, 3563−3569.(47) Lee, P. C.; Meisel, D. Adsorption and Surface-Enhanced Ramanof Dyes on Silver and Gold Sols. J. Phys. Chem. 1982, 86, 3391−3395.(48) Bard, A. J.; Faulkner, L. R. Electrochemical Methods:Fundamentals and Applications, 2nd ed.; Wiley, 2000; p 864.(49) Jackel, F.; Kinkhabwala, A. A.; Moerner, W. E. Gold BowtieNanoantennas for Surface-Enhanced Raman Scattering underControlled Electrochemical Potential. Chem. Phys. Lett. 2007, 446,339−343.(50) Shegai, T.; Vaskevich, A.; Rubinstein, I.; Haran, G. RamanSpectroelectrochemistry of Molecules within Individual Electro-magnetic Hot Spots. J. Am. Chem. Soc. 2009, 131, 14390−8.(51) Redmond, P. L.; Hallock, A. J.; Brus, L. E. ElectrochemicalOstwald Ripening of Colloidal Ag Particles on Conductive Substrates.Nano Lett. 2005, 5, 131−5.(52) Dieringer, J. A.; McFarland, A. D.; Shah, N. C.; Stuart, D. A.;Whitney, A. V.; Yonzon, C. R.; Young, M. A.; Zhang, X.; Van Duyne,R. P. Surface Enhanced Raman Spectroscopy: New Materials,Concepts, Characterization Tools, and Applications. Faraday Discuss.2006, 132, 9−26.(53) Sonntag, M. D.; Chulhai, D.; Seideman, T.; Jensen, L.; VanDuyne, R. P. The Origin of Relative Intensity Fluctuations in Single-Molecule Tip-Enhanced Raman Spectroscopy. J. Am. Chem. Soc. 2013,135, 17187−17192.(54) Klingsporn, J. M.; Jiang, N.; Pozzi, E. A.; Sonntag, M. D.;Chulhai, D.; Seideman, T.; Jensen, L.; Hersam, M. C.; Van Duyne, R.P. Intramolecular Insight into Adsorbate-Substrate Interactions ViaLow-Temperature, Ultrahigh-Vacuum Tip-Enhanced Raman Spectros-copy. J. Am. Chem. Soc. 2014, 136, 3881−7.(55) Bublitz, G. U.; Boxer, S. G. Stark Spectroscopy: Applications inChemistry, Biology, and Materials Science. Annu. Rev. Phys. Chem.1997, 48, 213−242.(56) Andrews, S. S.; Boxer, S. G. Vibrational Stark Effects of NitrilesI. Methods and Experimental Results. J. Phys. Chem. A 2000, 104,11853−11863.(57) Andrews, S. S.; Boxer, S. G. Vibrational Stark Effects of NitrilesII. Physical Origins of Stark Effects from Experiment and PerturbationModels. J. Phys. Chem. A 2002, 106, 469−477.(58) Makov, G.; Nitzan, A.; Brus, L. E. On the Ionization Potential ofSmall Metal and Dielectric Particles. J. Chem. Phys. 1988, 88, 5076.(59) Plieth, W. J. Electrochemical Properties of Small Clusters ofMetal Atoms and Their Role in the Surface Enhanced RamanScattering. J. Phys. Chem. 1982, 86, 3166−3170.(60) Ivanova, O. S.; Zamborini, F. P. Electrochemical SizeDiscrimination of Gold Nanoparticles Attached to Glass/Indium−Tin-Oxide Electrodes by Oxidation in Bromide-Containing Electro-lyte. Anal. Chem. 2010, 82, 5844−5850.(61) Ivanova, O. S.; Zamborini, F. P. Size-Dependent Electro-chemical Oxidation of Silver Nanoparticles. J. Am. Chem. Soc. 2010,132, 70−72.(62) Zhang, X.; Hicks, E. M.; Zhao, J.; Schatz, G. C.; Van Duyne, R.P. Electrochemical Tuning of Silver Nanoparticles Fabricated byNanosphere Lithography. Nano Lett. 2005, 5, 1503−1507.(63) Shen, H.; Zhou, X.; Zou, N.; Chen, P. Single-Molecule KineticsReveals a Hidden Surface Reaction Intermediate in Single-Nano-particle Catalysis. J. Phys. Chem. C 2014, 118, 26902−26911.(64) Patil, A. V.; Davis, J. J. Visualizing and Tuning ThermodynamicDispersion in Metalloprotein Monolayers. J. Am. Chem. Soc. 2010, 132,16938−16944.
The Journal of Physical Chemistry C Article
DOI: 10.1021/acs.jpcc.5b10652J. Phys. Chem. C 2015, 119, 28226−28234
28234