Deep drivers of mesoscale circulation in the central Rockall Trough
Observed impact of mesoscale circulation on oceanicresponse to Typhoon Man-Yi (2007)
SungHyun Nam & Duk-jin Kim & Wooil M. Moon
Received: 3 March 2011 /Accepted: 8 August 2011# Springer-Verlag 2011
Abstract The oceanic response to a typhoon, where meso-scale ocean circulations co-exist, was investigated by analyz-ing the independent observations of profiling floats data atthree different locations, satellite altimetry data near the eye ofTyphoon Man-Yi (2007) before and after its passage, andsynthetic aperture radar data taken during the typhoon’spassage. In spite of the nearly symmetric wind pattern aroundthe eye, the distribution of mesoscale eddies had a majorimpact on the surface currents and mixed layer (ML) depths.As a result, the entrainment of the water below theML into theML was affected by the mesoscale circulation and becameasymmetric, which accounted for most of the changesobserved in the temperature profiles. Changes in the isothermswere driven primarily by the westward propagation of themesoscale pattern rather than by the typhoon-induced shoal-ing. The typhoon-induced shoaling could have played asignificant role in the generation of high-frequency (e.g., near-inertial) oscillations and/or sub-mesoscale structures. Al-though a similar or even greater energy flux was observed atthe surface, the entrainment within the anticyclonic circulationwas weaker than that within the cyclonic circulation and at the
edge of the anticyclonic circulation because of the thick pre-existing ML. A strong ocean response to Typhoon Man-Yi(2007) within a cyclonic circulation or at the edge of ananticyclonic circulation, rather than within an anticycloniceddy, has implications for the role of mesoscale oceancirculations in better understanding and forecasting thetyphoon intensity.
Keywords Typhoon/hurricane . Entrainment . Thermoclineshoaling .Mesoscale circulation . SAR . ARGO . Satellitealtimetry
1 Introduction
Tropical cyclones (hereafter referred to as “typhoons” or“hurricanes”) have a profound effect on the upper ocean,deepening the mixed layer (ML) by many tens of metersand cooling the sea surface temperature (SST) by severaldegrees (e.g., Zheng et al. (2010b) or Emanuel (2003)).Most (75–90%) of the cooling in the upper mixed layer is aresult of vertical mixing/entrainment (Jacob et al. 2000;Price 1981), and the impact of evaporative heat loss to theatmosphere on sea surface cooling is relatively weak (onlyapproximately 10–15%) (Price 1981). This entrainment,combined with typhoon-induced thermocline shoaling(upwelling), is particularly important not only because theresultant cooling plays a key role in the typhoon intensitychange (e.g., negative feedback (Lin et al. 2008)) but alsobecause it can bring nutrient-rich water up into the uppereuphotic zone, which stimulates biological production, asdeduced from several recent satellite measurements (Zhenget al. 2010a; Liu et al. 2009; Siswanto et al. 2008; Son et al.2006; Walker et al. 2005; Babin et al. 2004) and modelingstudies (Zheng et al. 2010a; Condie et al. 2009).
Responsible Editor: John Wilkin
S. NamScripps Institution of Oceanography,University of California at San Diego,La Jolla, CA 92093-0230, USA
D.-j. Kim (*) :W. M. MoonResearch Institute of Oceanography (RIO), School of Earth andEnvironmental Sciences, Seoul National University,Seoul 151-742, Republic of Koreae-mail: [email protected]
W. M. MoonGeophysics, Department of Geological Sciences,University of Manitoba,Winnipeg, MB R3T 2N2, Canada
Ocean DynamicsDOI 10.1007/s10236-011-0490-8
The entrainment process is caused by the turbulencegenerated by the strong shear of near-inertial currents acrossthe base of the ML, which is consistent with the well-documented rightward bias of the SST response (a strongresponse on the right side of a typhoon’s track in theNorthern Hemisphere). Price (1981) and Price et al. (1994)developed models to show that the clockwise turning of thewind stress on the right side roughly resonates with inertialoscillations in the ML. On the right side, the greatestcooling occurs when there is maximized surface divergenceand upwelling (Price 1981). However, our understanding ofsuch an asymmetric ocean response to typhoons is notalways clear, particularly in the presence of significantmesoscale ocean circulations and the associated heteroge-neity in the upper ocean pre-conditions (Zheng et al. 2010a,b; Ho et al. 2009; Zheng et al. 2008; Lin et al. 2008; Walkeret al. 2005; Lin et al. 2005) such as the ML thickness, MLtemperature, and ML current.
Although many efforts have been dedicated to under-stand the rapid intensification of a typhoon or hurricaneover warm ocean features, i.e., anticyclonic circulations(Lin et al. 2005, 2008; Shay et al. 2000), the underlyingdynamics of a pre-existing mesoscale circulation and itsimpact on the asymmetric upper ocean response to atyphoon and eventual influence on the typhoon intensityare still poorly understood. How do mesoscale oceancirculations, e.g., eddies and their propagations, affect theentrainment process and thermocline shoaling and thus theasymmetric ocean response to a typhoon? Observations inthe Gulf of Mexico showed rapid upwelling responses toHurricane Ivan (2004) along and east of the track where apre-existing cyclonic circulation was intensified (Walker etal. 2005). Zheng et al. (2008) and Ho et al. (2009) pointedout that the pre-existence of cyclonic circulation could haveplayed a crucial role in the extreme ocean response toTyphoon Hai-Tang (2005) along its track. More recently,Zheng et al. (2010b) carried out numerical simulations andsuggested the following mechanisms that result in enhancedcooling in thin MLs accompanying a pre-existing cycloniccirculation: proximity of cold water to the sea surface,stronger ML currents associated with larger shear at the MLbase, and a reduced thermal inertia. This study aims to shedsome light on this issue by using synthetic observationsmade during the passage of Typhoon Man-Yi (2007).
ARGO profiling float data obtained from differentlocations before and after the typhoon’s passage, combinedwith a synthetic aperture radar (SAR) image and multiplemission satellite altimetry (absolute sea surface height)data, were used to examine the ocean response to TyphoonMan-Yi (2007) under a significant mesoscale oceancirculation. The SAR image and radar altimetry data wereused because microwave sensors are not significantlyaffected by the thick clouds around the eye of a typhoon.
In this study, we examined the impact of a mesoscalecirculation on the asymmetric ocean response to a typhoonby contrasting the observations made at different locationsrelevant to the cyclonic and anticyclonic circulations.“Section 2” presents an overview of Typhoon Man-Yi(2007) and the data used in this study. Observations of thesurface wind and current, temperature profile changes, andmesoscale circulation are presented in “Section 3”. Theresults and discussion of the role of the mesoscalecirculations in the oceanic response to a typhoon are givenin “Section 4”. Finally, we summarize the implications in“Section 5”.
2 Typhoon Man-Yi (2007) and data
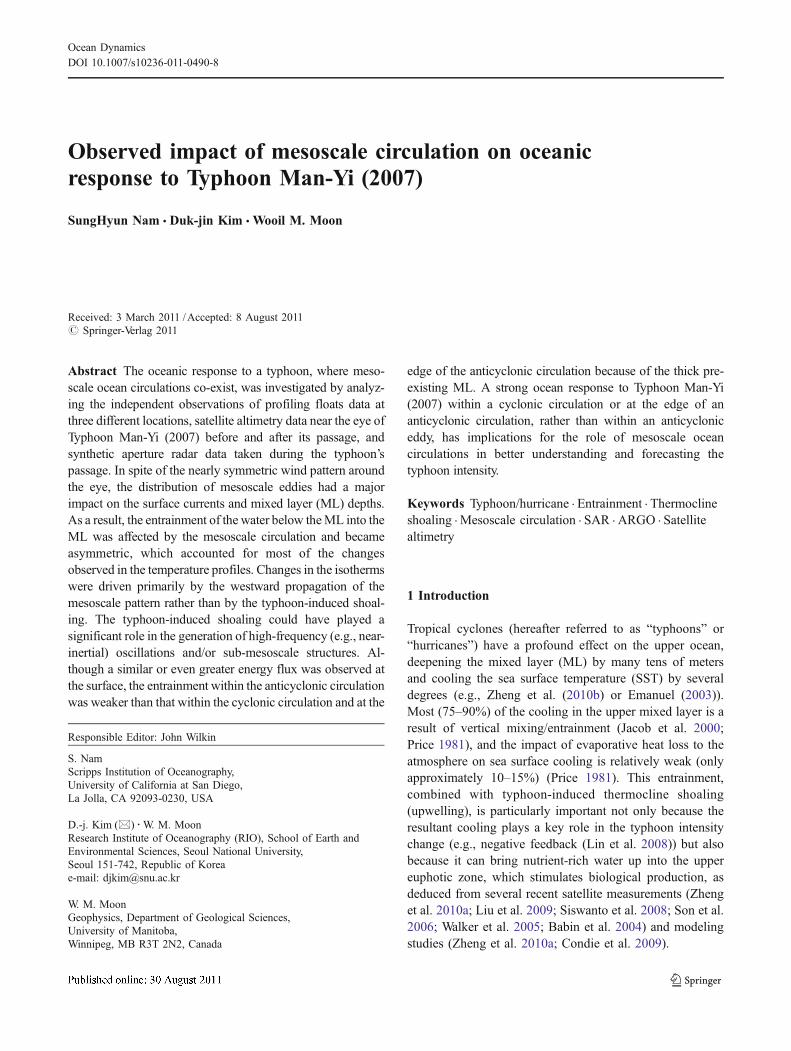
Typhoon Man-Yi was the fourth major typhoon in 2007. Itformed over the tropical western Pacific Ocean on July 10,2007 and then moved NW over the East China Sea at anaverage speed of 6.9 ms−1 (Fig. 1a). On July 12, themaximum wind speed and minimum atmospheric pressureof the typhoon were 47.5 ms−1 and 930 hPa, respectively(Typhoon Research Center, http://www.typhoon.or.kr). AfterJuly 13, the typhoon moved NE and ENE, diminishing inintensity (Fig. 1a).
We used ARGO profiling float data (data source:CORIOLIS operational oceanography, http://www.coriolis.eu.org/cdc/argo.htm) collected before (July 2, 3, and 7) andafter (July 12, 13, and 16) the typhoon’s passage at threedifferent locations (W1, W2, and E1) in the western tropicalPacific (Fig. 1b). In addition to the ARGO data, we usedweekly (absolute) sea surface height and geostrophic currentdata (SSALTO/DUACS) from multiple satellite altimeters(data source: AVISO, http://www.aviso.oceanobs.com/)to investigate the structure and temporal variation in themeso- and sub-mesoscale circulations before and after thetyphoon’s passage.
On July 11 (the typhoon being still in the forced stage), aRADARSAT-I SAR image that included the eye of thetyphoon was acquired at 21:13 UTC using the ScanSARmode; the image captured the distribution of the surfacemicrowave properties (C-band; 5.3-GHz frequency and HHpolarization) in great detail (Fig. 1b). Data on the seasurface wind fields were extracted from the SAR data usingthe CMOD5 geophysical model function (Hersbach et al.2007) and the Kirchhoff polarization ratio (Vachon andDobson 2000) (Fig. 2a). The wind directions required forthe CMOD5 wind retrieval model were derived from wind-aligned signatures, e.g., wind streaks and rain bands in theSAR image, and then interpolated to the entire image usingthe Kriging method. The EW (tilted clockwise by an angleof 10° as shown in Fig. 2b) components of the surfacecurrents were also extracted from the SAR data by
Ocean Dynamics
comparing the differences between the target Dopplercentroids and reference Doppler centroids (Hughes andvan der Kooij 2002). The reference Doppler centroids werethe centroids of fixed targets, which were calculated on thebasis of the geometry of a satellite and rotating Earth, alongwith the satellite’s state and attitude vectors. The targetcentroids were estimated by applying the correlationDoppler estimator to raw SAR data (Madsen 1989).
3 Observations
3.1 Sea surface wind and current
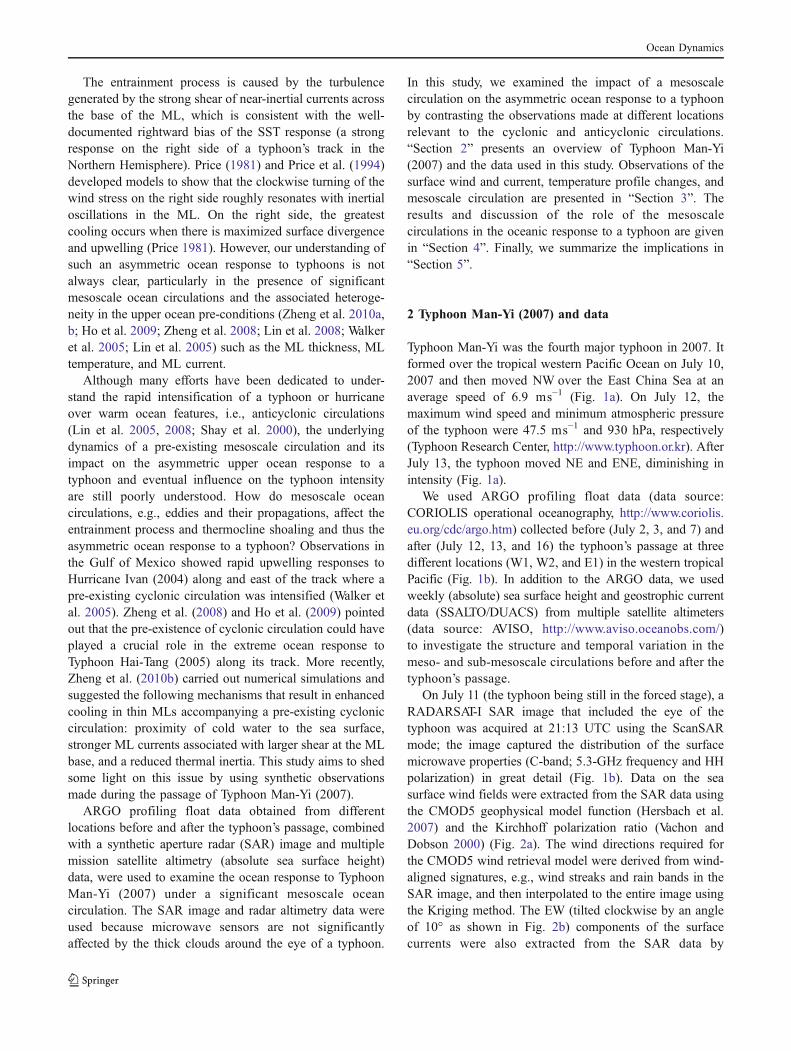
The distribution of the sea surface wind speed along line Con July 11 was nearly symmetric around the typhoon eye(Fig. 2a, c). In spite of a relatively high translation speed(6.9 ms−1), there was no clear indication of the biased windforcing itself, e.g., a stronger wind speed on the eastern sideof the eye as compared to the western side. Strong winds(speed exceeding 30 ms−1, especially in the Thompsonpolarization ratio model) were observed on both sides of theeye, blowing in opposite directions (Fig. 2a, c). As itapproached the eye, the wind speed gradually increased andabruptly decreased, as shown in Fig. 2c, thus following thetypical wind speed pattern around a typhoon. A comparisonof wind fields extracted using several different polarizationratios did not significantly alter this symmetric winddistribution (Fig. 2c). The contour of the EW component
of the wind vector also showed a clear symmetric patternwith negative (positive) values to the north (south) of theeye (see the colored areas in Fig. 2a).
In contrast to this symmetric wind pattern, the pattern of thesurface current around the typhoon (extracted from the SARimage) was rather asymmetric, at least in the zonal component(Fig. 2b). While the surface zonal currents aligned with thesurface zonal winds on the north and south sides of the eye,they were in opposite directions on the left and right sides(Fig. 2a vs. b). Both eastward (positive) and westward(negative) currents were found in the northern and southernparts (Fig. 2b). These did not coincide with the zonaldirections of the winds, which were only westward in thenorthern part and eastward in the southern part (Fig. 2a). Thecurrent and wind might have had the same meridionalcomponents or the meridional (zonal) current might havebeen consistent with the zonal (meridional) wind, as suggestedby the Ekman dynamics. However, this could be shownneither from the SAR data (the meridional current could notbe measured by this state-of-the-art technique) nor from thealtimeter-derived geostrophic current data (Fig. 2a vs. d).
This pattern of instantaneous surface current was moreconsistent with the mesoscale pattern of the surface geostrophiccurrent on July 11, which was obtained from weekly (July 8–14) sea surface height data derived by satellite altimetry(Fig. 2b vs. d). The anticyclonic circulation on the right sideof the eye, shown in Fig. 2d, corresponds to the strongeastward and westward currents in the northern and southernparts of the right side, respectively. The weak eastward and
Fig. 1 a Bathymetry in western Pacific and b RADARSAT-1 SARimage in which the location of typhoon eye (circle in color with windscale in a; Saffir–Simpson scale) and ARGO profiling floats before(red rectangles) and after (blue triangles) a typhoon’s passage are
superimposed with UTC data (and time for eye position in b). Thearea of the SAR image (white tilted box) and the three locations ofARGO profiling (W1, W2, and E1) are marked in a and b,respectively
Ocean Dynamics
westward currents in the northern and southern parts of theleft side in Fig. 2d are also consistent with those in Fig. 2b.Likewise, the SAR-derived instantaneous current was essen-tially in solid agreement with the altimetry-observed geo-strophic current apart from the eye, although significantlydifferent patterns still existed close to the eye (not surprisingconsidering the strong wind-driven ageostrophic componentunder typhoon conditions). In other words, in Fig. 2b, strongeast–west currents to the north and south of the eye can be
seen, which are not clear in Fig. 2d. This indicates that thesurface current field on July 11 was significantly affected bythe mesoscale ocean circulation, in spite of the strong typhoonwind-induced (ageostrophic) surface currents around the eye.
3.2 Changes in temperature profiles
The drastic change in the upper ocean temperature observedduring the typhoon’s passage was asymmetric. The temper-
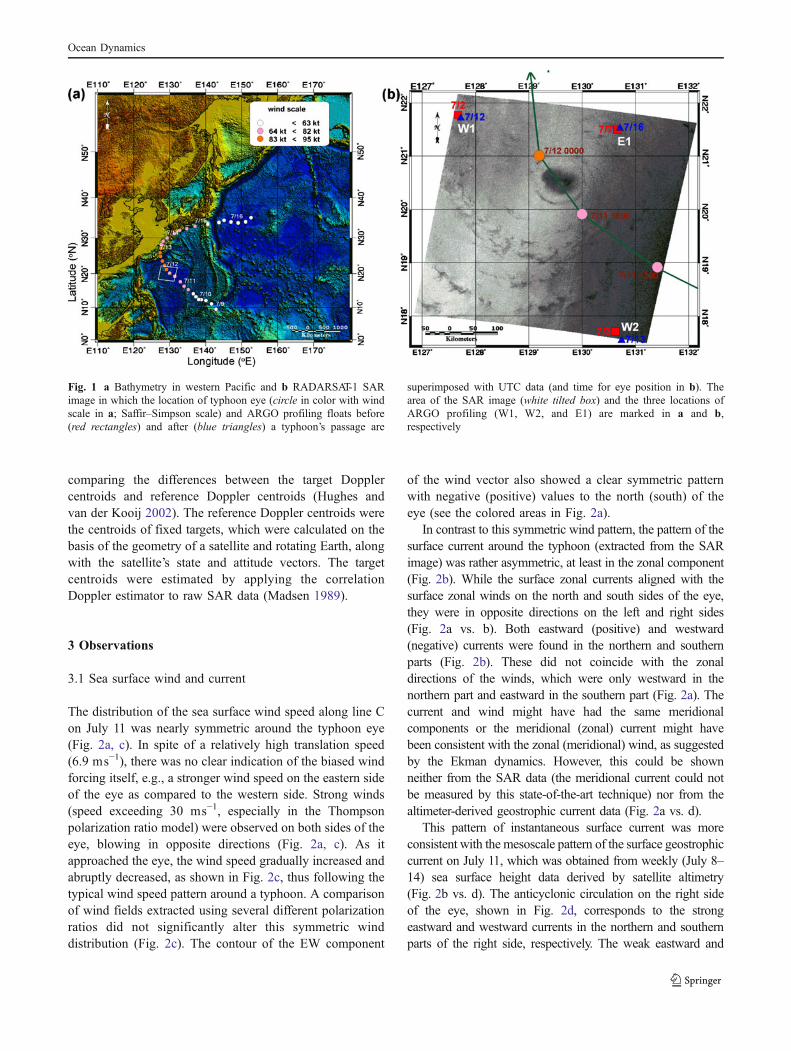
Fig. 2 a Surface wind speed in EW direction (color) and wind vectors(arrows), b EW component of surface current retrieved from SARimage, c wind speed distribution along line C (marked in a) across thetyphoon’s eye and perpendicular to its track, and d surface geostrophic
current vector (EW components are shown in color) estimated fromsatellite altimetry on July 11. Superimposed in a, b, and d are thetyphoon tracks (arrow), typhoon eye (box), and locations of profilingfloats (circle), respectively
Ocean Dynamics

ature profiles obtained from three ARGO floats at W1, W2,and E1 before and after the typhoon’s passage clearlyshowed this asymmetry, e.g., severe temperature changes atW1 and E1 in clear contrast to the negligible change at W2(Fig. 3; Table 1). The magnitudes of the temperaturechanges from the surface to 140-m depth were relativelysmall (<2°C) at W2, with a 0.6-°C change in the MLtemperature (Fig. 3; Table 1). In contrast, at both W1 andE1, the sea surface temperature decreased by 2–3°C,deepening the ML (defined here as the first depth at whichthe temperature becomes 1°C lower than the surfacetemperature, as used by Siswanto et al. (2008)) by 25–50 m with more than a 2-°C change in the ML temperature(Fig. 3; Table 1).
Moreover, the total amount of heat gained below thedepth of no temperature change during the typhoon’spassage (17 m at W1 and 28 m at E1, the first zerocrossing in the right plot of Fig. 3) roughly balanced thetotal amount of heat lost from the surface to that depth(17 m) at W1, which was not the case at E1 (the heat gainedbelow a depth of 28 m greatly exceeded the heat lost in theupper 28 m). This was a result of a significant temperatureincrease below the ML (at least down to 200 m) at E1, incontrast to the nonsignificant changes below the ML at W1and W2 (Fig. 3).
3.3 Mesoscale and sub-mesoscale patterns
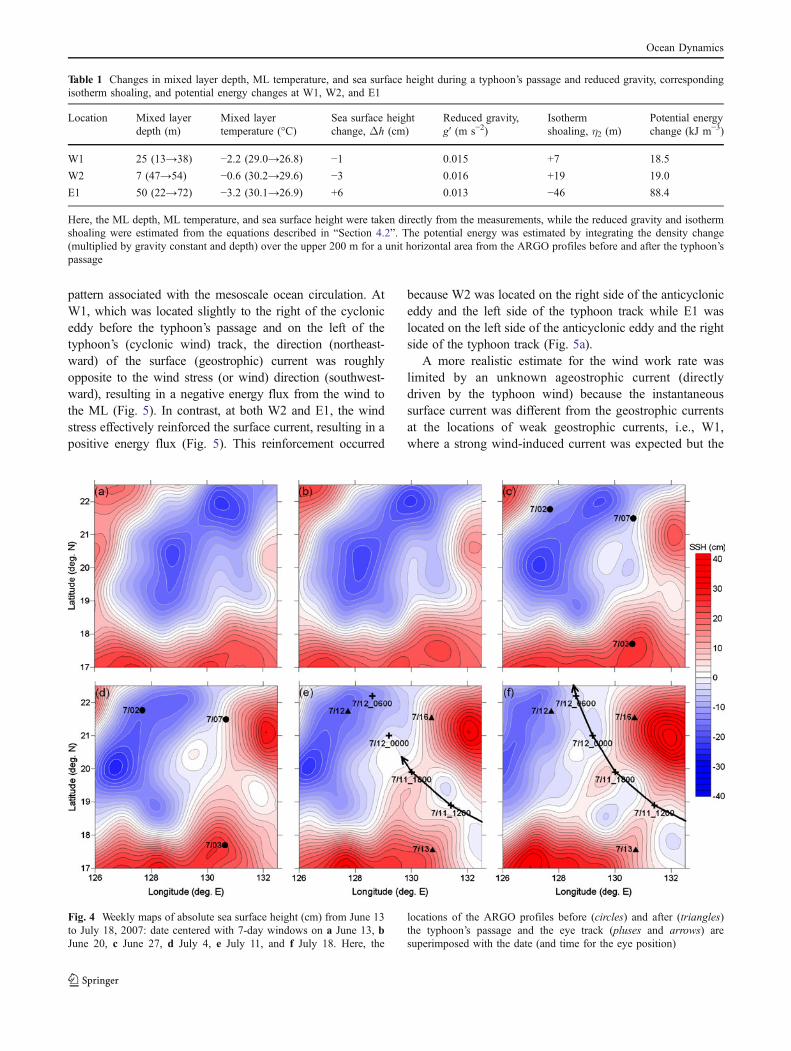
The temporal evolution of the mesoscale pattern accountedfor the different pre-typhoon conditions at W1, W2, and E1.Before the typhoon’s passage through the area where theSAR image was taken, E1 was positioned on the westernedge of an anticyclonic eddy as it propagated persistentlywestward (Fig. 4a–d). From July 1–7 (estimated for July 4,the last week before the typhoon’s passage), W1 and W2were located within cyclonic and anticyclonic circulations,respectively, where the geostrophic currents were weak;however, E1, which was located around the western edge ofthe anticyclonic eddy, yielded a relatively strong northwardgeostrophic current (Figs. 2d and 4d). After the typhoon’s
passage by the right sides of W1 and W2 and the leftside of E1, bothW1 andW2were positioned around the edges(of cyclonic and anticyclonic eddies, respectively) as theentire mesoscale pattern propagated westward; however, E1was within the anticyclonic eddy (Fig. 4). These differentconditions at the locations associated with the mesoscalecirculation were responsible for the asymmetric changes inthe temperature profiles, as will be discussed in the nextsection.
Sub-mesoscale (a scale smaller than 100 km) featuresalong the typhoon’s track during and after its passage werealso observed (Fig. 4e, f). These sub-mesoscale featuresexhibited an oscillating pattern, with both positive andnegative sea surface height anomalies along the typhoon’strack. Because this scale is considerably smaller than theinstrumental resolution, it is believed that either sub-mesoscale features or, more likely, enhanced mappingerrors from strong high-frequency (e.g., near-inertial)motions can cause these patterns sampled at different tracksand times to construct a weekly map. It should be noted thatsubstantial high frequency variability can lead to enhancedmapping errors between crossing and neighboring tracks,limiting their use in constructing weekly maps (e.g.,Nam et al. 2004).
4 Results and discussions
4.1 Rate of wind work at surface and entrainment
In spite of the symmetric wind distribution centered aroundthe eye, the wind work rate or the mechanical energy flux perunit area from the surface wind to the ML,Π (unit, J m−2 s−1
or W m−2), defined by the inner product of wind stress, τ,and surface current, u, as below, e.g., Alford (2001):
Π ¼ t � u; ð1Þ
was far from a symmetric pattern around the typhoon eye onJuly 11 because of a pre-existing asymmetric surface current
-6 -4 -2 0 2 4
Temperature Change (oC)post-typhoon minus pre-typhoon
W1W2E1
15 20 25 30 35
Temperature (oC)
200
160
120
80
40
0
Dep
th (
m)
pre-typhoonpost-typhoon
15 20 25 30 35
Temperature (oC)
15 20 25 30 35
Temperature (oC)
W1 W2 E1
Fig. 3 Temperature profiles col-lected before (gray) and after(black) a typhoon’s passage atW1, W2, and E1 and profiles oftemperature change (post-ty-phoon minus pre-typhoon pro-files) during a typhoon’s passageat W1 (dashed gray), W2 (solidgray), and E1 (black). Here, theplus symbol denotes the MLdepth
Ocean Dynamics
pattern associated with the mesoscale ocean circulation. AtW1, which was located slightly to the right of the cycloniceddy before the typhoon’s passage and on the left of thetyphoon’s (cyclonic wind) track, the direction (northeast-ward) of the surface (geostrophic) current was roughlyopposite to the wind stress (or wind) direction (southwest-ward), resulting in a negative energy flux from the wind tothe ML (Fig. 5). In contrast, at both W2 and E1, the windstress effectively reinforced the surface current, resulting in apositive energy flux (Fig. 5). This reinforcement occurred
because W2 was located on the right side of the anticycloniceddy and the left side of the typhoon track while E1 waslocated on the left side of the anticyclonic eddy and the rightside of the typhoon track (Fig. 5a).
A more realistic estimate for the wind work rate waslimited by an unknown ageostrophic current (directlydriven by the typhoon wind) because the instantaneoussurface current was different from the geostrophic currentsat the locations of weak geostrophic currents, i.e., W1,where a strong wind-induced current was expected but the
Table 1 Changes in mixed layer depth, ML temperature, and sea surface height during a typhoon’s passage and reduced gravity, correspondingisotherm shoaling, and potential energy changes at W1, W2, and E1
Location Mixed layerdepth (m)
Mixed layertemperature (°C)
Sea surface heightchange, Δh (cm)
Reduced gravity,g′ (m s−2)
Isothermshoaling, η2 (m)
Potential energychange (kJ m−3)
W1 25 (13→38) −2.2 (29.0→26.8) −1 0.015 +7 18.5
W2 7 (47→54) −0.6 (30.2→29.6) −3 0.016 +19 19.0
E1 50 (22→72) −3.2 (30.1→26.9) +6 0.013 −46 88.4
Here, the ML depth, ML temperature, and sea surface height were taken directly from the measurements, while the reduced gravity and isothermshoaling were estimated from the equations described in “Section 4.2”. The potential energy was estimated by integrating the density change(multiplied by gravity constant and depth) over the upper 200 m for a unit horizontal area from the ARGO profiles before and after the typhoon’spassage
Fig. 4 Weekly maps of absolute sea surface height (cm) from June 13to July 18, 2007: date centered with 7-day windows on a June 13, bJune 20, c June 27, d July 4, e July 11, and f July 18. Here, the
locations of the ARGO profiles before (circles) and after (triangles)the typhoon’s passage and the eye track (pluses and arrows) aresuperimposed with the date (and time for the eye position)
Ocean Dynamics
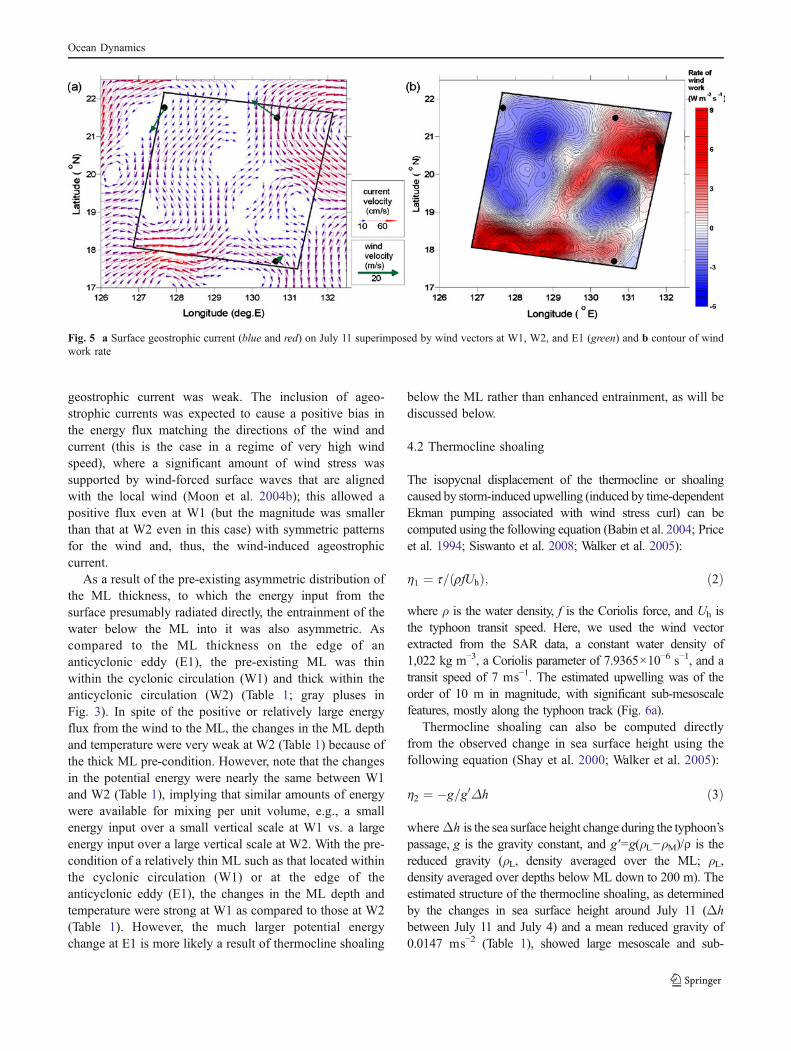
geostrophic current was weak. The inclusion of ageo-strophic currents was expected to cause a positive bias inthe energy flux matching the directions of the wind andcurrent (this is the case in a regime of very high windspeed), where a significant amount of wind stress wassupported by wind-forced surface waves that are alignedwith the local wind (Moon et al. 2004b); this allowed apositive flux even at W1 (but the magnitude was smallerthan that at W2 even in this case) with symmetric patternsfor the wind and, thus, the wind-induced ageostrophiccurrent.
As a result of the pre-existing asymmetric distribution ofthe ML thickness, to which the energy input from thesurface presumably radiated directly, the entrainment of thewater below the ML into it was also asymmetric. Ascompared to the ML thickness on the edge of ananticyclonic eddy (E1), the pre-existing ML was thinwithin the cyclonic circulation (W1) and thick within theanticyclonic circulation (W2) (Table 1; gray pluses inFig. 3). In spite of the positive or relatively large energyflux from the wind to the ML, the changes in the ML depthand temperature were very weak at W2 (Table 1) because ofthe thick ML pre-condition. However, note that the changesin the potential energy were nearly the same between W1and W2 (Table 1), implying that similar amounts of energywere available for mixing per unit volume, e.g., a smallenergy input over a small vertical scale at W1 vs. a largeenergy input over a large vertical scale at W2. With the pre-condition of a relatively thin ML such as that located withinthe cyclonic circulation (W1) or at the edge of theanticyclonic eddy (E1), the changes in the ML depth andtemperature were strong at W1 as compared to those at W2(Table 1). However, the much larger potential energychange at E1 is more likely a result of thermocline shoaling
below the ML rather than enhanced entrainment, as will bediscussed below.
4.2 Thermocline shoaling
The isopycnal displacement of the thermocline or shoalingcaused by storm-induced upwelling (induced by time-dependentEkman pumping associated with wind stress curl) can becomputed using the following equation (Babin et al. 2004; Priceet al. 1994; Siswanto et al. 2008; Walker et al. 2005):
h1 ¼ t= rfUhð Þ; ð2Þ
where ρ is the water density, f is the Coriolis force, and Uh isthe typhoon transit speed. Here, we used the wind vectorextracted from the SAR data, a constant water density of1,022 kg m−3, a Coriolis parameter of 7.9365×10⁻⁶ s−1, and atransit speed of 7 ms−1. The estimated upwelling was of theorder of 10 m in magnitude, with significant sub-mesoscalefeatures, mostly along the typhoon track (Fig. 6a).
Thermocline shoaling can also be computed directlyfrom the observed change in sea surface height using thefollowing equation (Shay et al. 2000; Walker et al. 2005):
h2 ¼ �g=g0Δh ð3Þ
where Δh is the sea surface height change during the typhoon’spassage, g is the gravity constant, and g′=g(ρL−ρM)/ρ is thereduced gravity (ρL, density averaged over the ML; ρL,density averaged over depths below ML down to 200 m). Theestimated structure of the thermocline shoaling, as determinedby the changes in sea surface height around July 11 (Δhbetween July 11 and July 4) and a mean reduced gravity of0.0147 ms−2 (Table 1), showed large mesoscale and sub-
Fig. 5 a Surface geostrophic current (blue and red) on July 11 superimposed by wind vectors at W1, W2, and E1 (green) and b contour of windwork rate
Ocean Dynamics

mesoscale features, with magnitudes that easily exceededthose of η1 (Fig. 6b).
Although Walker et al. (2005) obtained consistent(approximately equal) estimates for η1 and η2, the twoquantities do not necessarily have to be in agreementbecause Eq. 2 was theoretically derived with the assump-tion of a homogeneous upper ocean reflecting only theeffects of wind stress curl. Because this is not the case for areal ocean, which includes significant pre-existing meso-scale patterns, the thermocline shoaling estimated from theobservation of η2 can differ greatly from that of η1 in spiteof the same order of magnitude. As observed in the satellitealtimeter data recorded during the typhoon’s passage, Δhwas not symmetric and neither was the thermoclineshoaling (Fig. 6b). The large-scale structures in η2 (positivein the northwestern and southeastern parts and negative inthe northeastern part) were more likely related to thewestward propagation of mesoscale patterns (Fig. 4) ratherthan the response to the typhoon. In contrast, the small-scale features (caused by the sub-mesoscale features and/orhigh-frequency oscillations such as near-inertial motions)were more likely a result of typhoon-induced upwellingalong the typhoon track and its rapid propagation viainternal waves, as observed in previous studies (Davidsonand Holloway 2003; Price 1981) (Figs. 4d–f and 6).
4.3 Changes in temperature profiles
Both the ML entrainment and thermocline shoaling wereresponsible for the changes observed in the temperature
profiles at W1, W2, and E1 during the typhoon’s passage.The temperature profiles obtained at these locations afterthe typhoon’s passage (solid black lines) were comparedwith the temperature profiles (dashed lines) estimated byadding (a) the entrainment effect only, (b) the thermoclineshoaling effect only, and (c) both effects to those observedbefore the typhoon’s passage (gray lines) (Fig. 7). Theentrainment effect was applied by homogenizing the watertemperature within the ML after the typhoon’s passage to avertically averaged value (from the surface to the MLdepth) before the typhoon’s passage and assuming that therewas complete vertical mixing within the ML. The thermo-cline shoaling effect was added by shifting the isothermbelow the ML by the amount of η2 estimated using thereduced gravity at each location (Table 1).
The temperature profiles obtained after the typhoon’spassage could mostly be reproduced using just theentrainment effect at W1 and W2, but with both effectsat E1 because of the significant thermocline shoalingonly at E1. The strong effect of thermocline shoaling atE1 was largely a result of the westward propagation ofthe anticyclonic eddy (Figs. 4 and 6b) rather than atyphoon-induced isopycnal displacement. This explainsthe large amount of heat gain below the depth of notemperature change (28 m at E1) as compared to the heatloss above that depth at E1. The westward propagation ofan anticyclonic eddy may increase the temperature atdepths below the ML, even during a typhoon’s passage (ornegative thermocline shoaling, as shown in the northeast-ern part; Fig. 6b).
Fig. 6 Map of isopycnal displacement (unit: m) of thermocline (a)caused by storm-induced upwelling estimated using Eq. 2 and b asestimated from sea surface height change during a typhoon’s passage.
Here, the eye positions are superimposed (by x in a and plus symbol inb with the date and time)
Ocean Dynamics
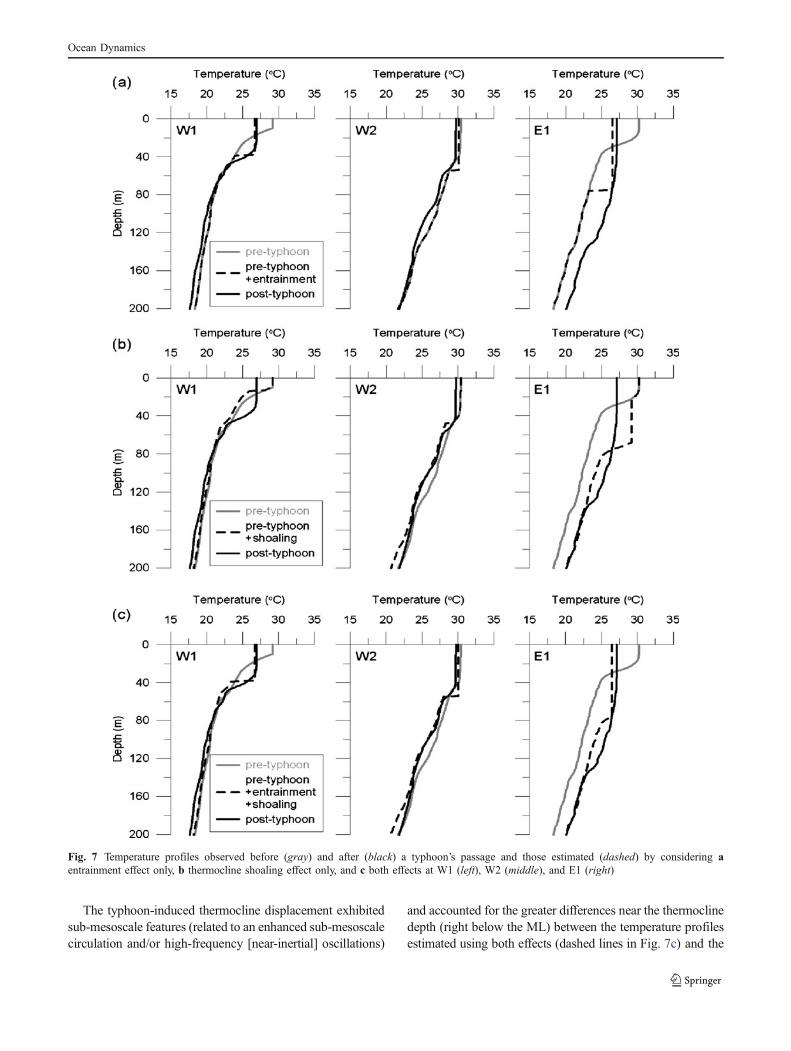
The typhoon-induced thermocline displacement exhibitedsub-mesoscale features (related to an enhanced sub-mesoscalecirculation and/or high-frequency [near-inertial] oscillations)
and accounted for the greater differences near the thermoclinedepth (right below the ML) between the temperature profilesestimated using both effects (dashed lines in Fig. 7c) and the
Fig. 7 Temperature profiles observed before (gray) and after (black) a typhoon’s passage and those estimated (dashed) by considering aentrainment effect only, b thermocline shoaling effect only, and c both effects at W1 (left), W2 (middle), and E1 (right)
Ocean Dynamics
observations after the typhoon’s passage (black solid lines inFig. 7c). This displacement was consistent with the energyradiated by typical low-mode, near-inertial wave propagation(the greatest variance in temperature is concentrated near thethermocline depth). Despite such significant differences nearthe thermocline, the temperature profiles were primarilyreproduced by asymmetrically distributed ML entrainmentand thermocline displacement, which were largely affectedby the mesoscale circulation.
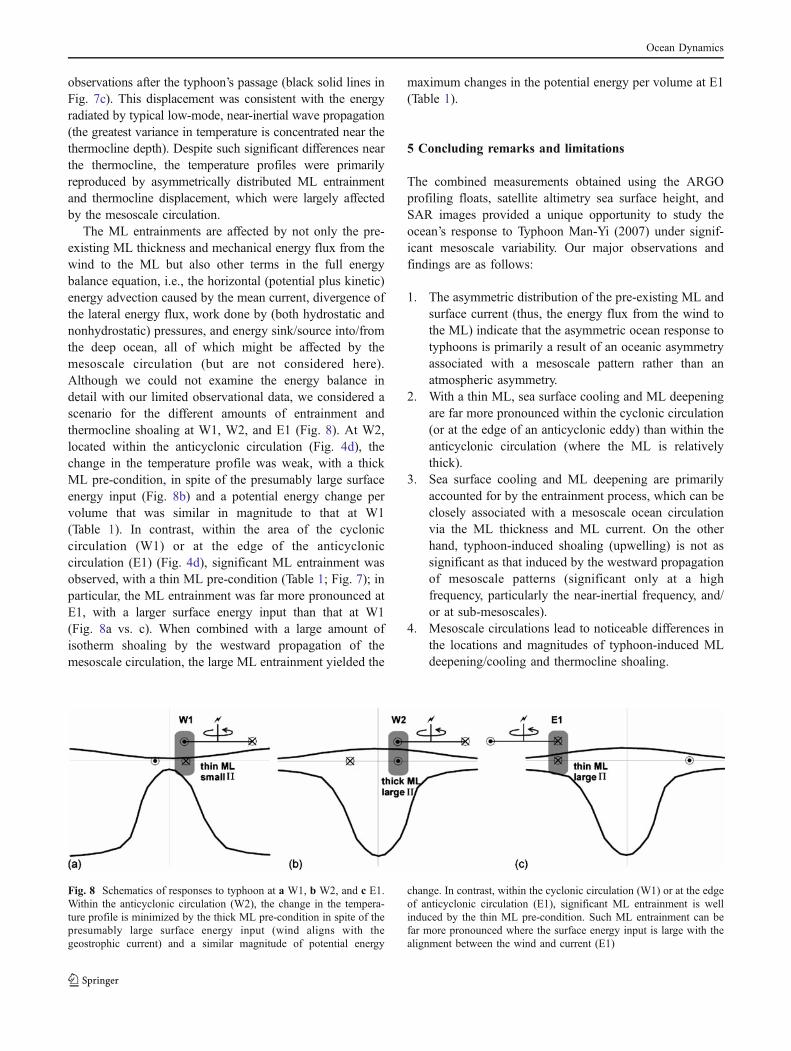
The ML entrainments are affected by not only the pre-existing ML thickness and mechanical energy flux from thewind to the ML but also other terms in the full energybalance equation, i.e., the horizontal (potential plus kinetic)energy advection caused by the mean current, divergence ofthe lateral energy flux, work done by (both hydrostatic andnonhydrostatic) pressures, and energy sink/source into/fromthe deep ocean, all of which might be affected by themesoscale circulation (but are not considered here).Although we could not examine the energy balance indetail with our limited observational data, we considered ascenario for the different amounts of entrainment andthermocline shoaling at W1, W2, and E1 (Fig. 8). At W2,located within the anticyclonic circulation (Fig. 4d), thechange in the temperature profile was weak, with a thickML pre-condition, in spite of the presumably large surfaceenergy input (Fig. 8b) and a potential energy change pervolume that was similar in magnitude to that at W1(Table 1). In contrast, within the area of the cycloniccirculation (W1) or at the edge of the anticycloniccirculation (E1) (Fig. 4d), significant ML entrainment wasobserved, with a thin ML pre-condition (Table 1; Fig. 7); inparticular, the ML entrainment was far more pronounced atE1, with a larger surface energy input than that at W1(Fig. 8a vs. c). When combined with a large amount ofisotherm shoaling by the westward propagation of themesoscale circulation, the large ML entrainment yielded the
maximum changes in the potential energy per volume at E1(Table 1).
5 Concluding remarks and limitations
The combined measurements obtained using the ARGOprofiling floats, satellite altimetry sea surface height, andSAR images provided a unique opportunity to study theocean’s response to Typhoon Man-Yi (2007) under signif-icant mesoscale variability. Our major observations andfindings are as follows:
1. The asymmetric distribution of the pre-existing ML andsurface current (thus, the energy flux from the wind tothe ML) indicate that the asymmetric ocean response totyphoons is primarily a result of an oceanic asymmetryassociated with a mesoscale pattern rather than anatmospheric asymmetry.
2. With a thin ML, sea surface cooling and ML deepeningare far more pronounced within the cyclonic circulation(or at the edge of an anticyclonic eddy) than within theanticyclonic circulation (where the ML is relativelythick).
3. Sea surface cooling and ML deepening are primarilyaccounted for by the entrainment process, which can beclosely associated with a mesoscale ocean circulationvia the ML thickness and ML current. On the otherhand, typhoon-induced shoaling (upwelling) is not assignificant as that induced by the westward propagationof mesoscale patterns (significant only at a highfrequency, particularly the near-inertial frequency, and/or at sub-mesoscales).
4. Mesoscale circulations lead to noticeable differences inthe locations and magnitudes of typhoon-induced MLdeepening/cooling and thermocline shoaling.
Fig. 8 Schematics of responses to typhoon at a W1, b W2, and c E1.Within the anticyclonic circulation (W2), the change in the tempera-ture profile is minimized by the thick ML pre-condition in spite of thepresumably large surface energy input (wind aligns with thegeostrophic current) and a similar magnitude of potential energy
change. In contrast, within the cyclonic circulation (W1) or at the edgeof anticyclonic circulation (E1), significant ML entrainment is wellinduced by the thin ML pre-condition. Such ML entrainment can befar more pronounced where the surface energy input is large with thealignment between the wind and current (E1)
Ocean Dynamics
A significant sub-mesoscale and/or high-frequency (pre-sumably near-inertial) response was found in both the satellitealtimetry observations (as enhanced mapping error along thetrack) and theoretical estimation (storm-induced upwelling),although most of the changes in the upper thermal structurecould be explained solely by vertical mixing (entrainment)and thermocline shoaling as a result of the westwardpropagation of the mesoscale pattern. Such sub-mesoscalefeatures along the track of Typhoon Man-Yi (2007) haveimportant implications for the generation of near-inertialoscillations under mesoscale variability and the propagationof low-mode internal waves, which are dynamically linked tothe convergence/divergence within the surface ML via theinteraction of the internal waves and mesoscale eddy (Parkand Watts 2005). For a better understanding of suchinteractions under typhoon conditions, subsurface observa-tions at a higher (both spatial and temporal) resolution areobviously vital, as exemplified by the case near the coastalboundary (Nam et al. 2007). A model may provide newinsights into the interactions that incorporate sediment,nutrient, and plankton dynamics (Condie et al. 2009).
The wind and current fields analyzed in this study wereobtained by SAR data processing techniques. However, thelack of ground-truth observations over ranges of extremetyphoon conditions makes it difficult to test these techni-ques. Although many studies have shown that wind andcurrent fields estimated from SAR data agree reasonablywell with observations (Chapron et al. 2005; Monaldo et al.2001; Schneiderhan et al. 2005), there is no guarantee thatthey will do so under extreme wind and large surface waveconditions in the case of a nonmonotonic increase in thedrag coefficient with wind speed and its strong dependencyon the surface wave field (Moon et al. 2004a, b). Theconsistent mesoscale patterns between the SAR-derivedcurrent fields and geostrophic currents derived fromsatellite altimetry could not be used to verify the state-of-the-art technique of current extraction from the SAR data.The wind and current fields estimated from the SAR dataunder extreme wind and large wave conditions were stillpoorly validated, making it necessary to carry out furtherinvestigations using data acquired simultaneously under thetyphoon/hurricane condition being investigated.
This study was limited to the single case of Typhoon Man-Yi (2007) at a single phase in its development stage with afixed translation speed. Future studies on response totyphoons under a mesoscale circulation would benefit froma statistical approach that uses data obtained under a historicaltyphoon/hurricane condition with more quantitative estima-tions. This is particularly true considering the sensitivity of thetyphoon intensity to the translation speed (Lin et al. 2009).Nevertheless, the results of this study clearly support theprevious assertions that extreme responses (ML deepening/cooling, entrainment, and therefore biological production)
can be expected within the cyclonic circulation or at the edgeof the anticyclonic circulation rather than within the anticy-clonic circulation (Zheng et al. 2010b; Ho et al. 2009; Zhenget al. 2008; Walker et al. 2005). Our observational results arealso consistent with the recent results of Zheng et al. (2010a),Condie et al. (2009), Liu et al. (2009), Siswanto et al. (2008),Son et al. (2006), and Walker et al. (2005), who suggestedthe considerable effect of pre-existing cyclonic circulationson the strength of the upper response to a hurricane ortyphoon and the development of a phytoplankton bloom.Furthermore, our results confirmed that the study andforecasting of typhoon intensity would greatly benefit fromthe inclusion of accurate mesoscale ocean circulations.
Acknowledgments This work was supported by the Korea Meteo-rological Administration Research and Development Program underGrant CATER 2009–3113. This research is also partially funded byNSERC Discovery Grant 7400 to WMM. The first author wassupported by a JIMO postdoctoral fellowship at the Scripps Institutionof Oceanography (SIO). The RADARSAT-1 SAR data used in thisstudy were provided by the Canadian Space Agency (CSA) throughthe Announcement of Opportunity for RADARSAT HurricaneApplications Project (RHAP) agreement with WMM.
References
Alford MH (2001) Internal swell generation: the spatial distribution ofenergy flux from the wind to mixed layer near-inertial motions. JPhys Oceanogr 31(8):2359–2368
Babin S, Carton J, Dickey T, Wiggert J (2004) Satellite evidence ofhurricane-induced phytoplankton blooms in an oceanic desert. JGeophys Res 109(C03043):doi:10.1029/2003JC001938
Chapron B, Collard F, Ardhuin F (2005) Direct measurements ofocean surface velocity from space: interpretation and validation. JGeophys Res 110(C07008):doi:10.1029/2004JC002809
Condie S, Herzfeld M, Margvelashvili N, Andrewartha J (2009)Modeling the physical and biogeochemical response of a marineshelf system to a tropical cyclone. Geophys Res Lett 36(22):L22603. doi:22610.21029/22009GL039563
Davidson F, Holloway P (2003) A study of tropical cyclone influenceon the generation of internal tides. J Geophys Res 108(C3):3082.doi:3010.1029/2000JC000783
Emanuel K (2003) Tropical cyclones. Annu Rev Earth Planet Sci 31(1):75–104
Hersbach H, Stoffelen A, De Haan S (2007) An improved C-bandscatterometer ocean geophysical model function: CMOD5. J Geo-phys Res 112(C3):C03006. doi:00310.01029/02006JC003743
Ho CR, Zheng Q, Zheng ZW, Kuo NJ, Tai CK, Su FC (2009) Reply tocomment by A. Wada et al. on “Importance of pre-existing oceanicconditions to upper ocean response induced by Super Typhoon Hai-Tang”. Geophys Res Lett 36:L09604. doi:09610.01029/02009GL037443
Hughes W, van der Kooij M (2002) Ocean current estimation usingScanSAR data. In: IGARSS2002, IEEE, pp 2132–2134
Jacob SD, Shay LK, Mariano AJ, Black PG (2000) The 3D oceanicmixed layer response to Hurricane Gilbert. J Phys Oceanogr 30(6):1407–1429
Lin I, Wu CC, Emanuel KA, Lee IH, Wu CR, Pun IF (2005) Theinteraction of Supertyphoon Maemi (2003) with a warm oceaneddy. Mon Weather Rev 133(9):2635–2649
Ocean Dynamics
Lin I, Wu CC, Pun IF, Ko DS (2008) Upper ocean thermal structureand the Western North Pacific category 5 typhoons. Part I: oceanfeatures and the category 5 typhoons' intensification. MonWeather Rev 136(9):3288–3306
Lin I, Pun IF, Wu CC (2009) Upper-ocean thermal structure and theWestern North Pacific category 5 typhoons. Part II: dependenceon translation speed. Mon Weather Rev 137(11):3744–3757
Liu X, Wang M, Shi W (2009) A study of a Hurricane Katrina-inducedphytoplankton bloom using satellite observations and modelsimulations. J Geophys Res 114(C3):C03023. doi:03010.01029/02008JC004934
Madsen S (1989) Estimating the Doppler centroid of SAR data. IEEETrans Aerosp Electron Syst 25(2):134–140
Monaldo F, Thompson D, Beal R, Pichel W, Clemente-Colon P (2001)Comparison of SAR-derived wind speed with model predictionsand ocean buoy measurements. IEEE Trans Geosci Remote Sens39(12):2587–2600
Moon I, Ginis I, Hara T (2004a) Effect of surface waves on Charnockcoefficient under tropical cyclones. Geophys Res Lett 31(20):L20302. doi:20310.21029/22004GL020988
Moon IJ, Ginis I, Hara T (2004b) Effect of surface waves on air–seamomentum exchange. Part II: behavior of drag coefficient undertropical cyclones. J Atmos Sci 61(19):2334–2348
Nam S, Lyu S, Kim Y, Kim K, Park J, Watts D (2004) Correction ofTOPEX/POSEIDON altimeter data for nonisostatic sea levelresponse to atmospheric pressure in the Japan/East Sea. GeophysRes Lett 31(2):L02304. doi:02310.01029/02003GL018487
Nam S, Kim D, Kim H, Kim Y (2007) Typhoon-induced, highly nonlinearinternal solitary waves off the east coast of Korea. Geophys Res Lett34(1):L01607. doi:01610.01029/02006GL028187
Park J, Watts D (2005) Near-inertial oscillations interacting withmesoscale circulation in the southwestern Japan/East Sea. Geo-phys Res Lett 32(10):L10611. doi:10610.11029/12005GL022936
Price J (1981) Upper ocean response to a hurricane. J Phys Oceanogr11(2):153–175
Price J, Sanford T, Forristall G (1994) Forced stage response to amoving hurricane. J Phys Oceanogr 24(2):233–260
Schneiderhan T, Lehner S, Schulz-Stellenfleth J, Horstmann J (2005)Comparison of offshore wind park sites using SAR windmeasurement techniques. Meteorol Appl 12(2):101–110
Shay L, Goni G, Black P (2000) Effects of a warm oceanic feature onHurricane Opal. Mon Weather Rev 128(5):1366–1383
Siswanto E, Ishizaka J, Morimoto A, Tanaka K, Okamura K,Kristijono A, Saino T (2008) Ocean physical and biogeochemicalresponses to the passage of Typhoon Meari in the East China Seaobserved from Argo float and multiplatform satellites. GeophysRes Lett 35(15):L15604. doi:15610.11029/12008GL035040
Son SH, Platt T, Bouman H, Lee DK, Sathyendranath S (2006)Satellite observation of chlorophyll and nutrients increaseinduced by Typhoon Megi in the Japan/East Sea. Geophys ResLett 33(5):L05607. doi:05610.01029/02005GL025065
Vachon P, Dobson F (2000) Wind retrieval from RADARSAT SARimages: selection of a suitable C-band HH polarization windretrieval model. Can J Remote Sens 26(4):306–313
Walker N, Leben R, Balasubramanian S (2005) Hurricane-forcedupwelling and chlorophyll a enhancement within cold-corecyclones in the Gulf of Mexico. Geophys Res Lett 32:L18610.doi:18610.11029/12005GL023716
Zheng ZW, Ho CR, Kuo NJ (2008) Importance of pre-existing oceanicconditions to upper ocean response induced by Super TyphoonHai-Tang. Geophys Res Lett 35(20):L20603. doi:20610.21029/22008GL035524
Zheng ZW, Ho CR, Zheng Q, Kuo NJ, Lo YT (2010a) Satelliteobservation and model simulation of upper ocean biophysicalresponse to Super Typhoon Nakri. Continent Shelf Res 30(13):1450–1457
Zheng ZW, Ho CR, Zheng Q, Lo YT, Kuo NJ, Gopalakrishnan G(2010b) Effects of preexisting cyclonic eddies on upper oceanresponses to category 5 typhoons in the western North Pacific. JGeophys Res 115(C9):doi:10.1029/2009JC005562
Ocean Dynamics


![Mesoscale circulation determines broad spatio-temporal ... · the formation and shedding of mesoscale eddies throughout the year displace the EAC separa- tion latitude [21, 22], and](https://static.fdocuments.in/doc/165x107/5d5b165c88c993133a8b74da/mesoscale-circulation-determines-broad-spatio-temporal-the-formation-and.jpg)