Observations of Unexpected Short-Term Heating in the...
26
1 International Journal of Oceanography Observations of Unexpected Short-Term Heating in the Uppermost Layer of the Dead Sea after a Sharp Decrease in 5 Solar Radiation Pavel Kishcha 1,* , Boris Starobinets 1 , Isaac Gertman 2 , Tal Ozer 2 , Pinhas Alpert 1 10 1 School of Geosciences, Tel Aviv University, Tel Aviv, Israel 2 Israel Oceanographic and Limnological Research, National Institute of Oceanography, Haifa, Israel Email address: 15 [email protected] (Pavel Kishcha), [email protected] (Boris Starobinets), [email protected] (Isaac Gertman), [email protected] (Tal Ozer), [email protected] (Pinhas Alpert) * Corresponding author: Pavel Kishcha 20 The authors declare that there is no conflict of interest regarding the publication of this paper. 25
Transcript of Observations of Unexpected Short-Term Heating in the...
1
International Journal of Oceanography
Observations of Unexpected Short-Term Heating in the
Uppermost Layer of the Dead Sea after a Sharp Decrease in 5
Solar Radiation
Pavel Kishcha1,*
, Boris Starobinets1, Isaac Gertman
2, Tal Ozer
2, Pinhas
Alpert1
10
1School of Geosciences, Tel Aviv University, Tel Aviv, Israel
2Israel Oceanographic and Limnological Research, National Institute of Oceanography,
Haifa, Israel
Email address: 15
[email protected] (Pavel Kishcha), [email protected] (Boris Starobinets),
[email protected] (Isaac Gertman), [email protected] (Tal Ozer), [email protected]
(Pinhas Alpert)
*Corresponding author: Pavel Kishcha
20
The authors declare that there is no conflict of interest regarding the publication of this
paper.
25

2
Abstract
The Dead Sea is one of the saltiest bodies of water in the world. Observational evidence
has been obtained of unexpected short-term water heating in the 2-m uppermost layer of
this hypersaline lake, following a sharp drop in solar radiation under weak winds. This
was carried out using Dead Sea buoy measurements. Passing frontal cloudiness mixed 30
with significant dust pollution over the Judean Mountains and the Dead Sea, which
occurred on March 22, 2013, led to a dramatic drop in noon solar radiation from 860 W
m-2
to 50 W m-2
. This drop in solar radiation caused a short-term (1-hour) pronounced
temperature rise in the uppermost layer of the sea down to 2 m depth. After the sharp
drop in noon solar radiation, in the absence of water mixing, buoy measurements 35
showed that the temperature rise in the uppermost layer of the Dead Sea took place for a
shorter time and was more pronounced than the temperature rise under the regular
diurnal solar cycle. The water heating could be explained by gravitational instability in
the skin-surface layer, when the warm surface water with the increased salinity and
density submerged, thereby increasing temperature in the layers below. 40
Keywords: Short-Term Heating, Hypersaline Lakes, Dead Sea, Gravitational Instability,
Water Submerging Process, Hypersaline Water Evaporation, Buoy Temperature
Measurements
45
3
1. Introduction
The Dead Sea, a unique place on Earth, is located at approximately 415 m below sea
level. This hypersaline terminal lake is 67 km long, up to 18 km wide, and 300m in
depth at its deepest point [1, 2]. The Dead Sea lies within one of a series of basins
aligned in a long (600 km) and narrow (10–20km) tectonic valley, which branches 50
northward from the trough of the Red Sea [3]. The Dead Sea is surrounded by the
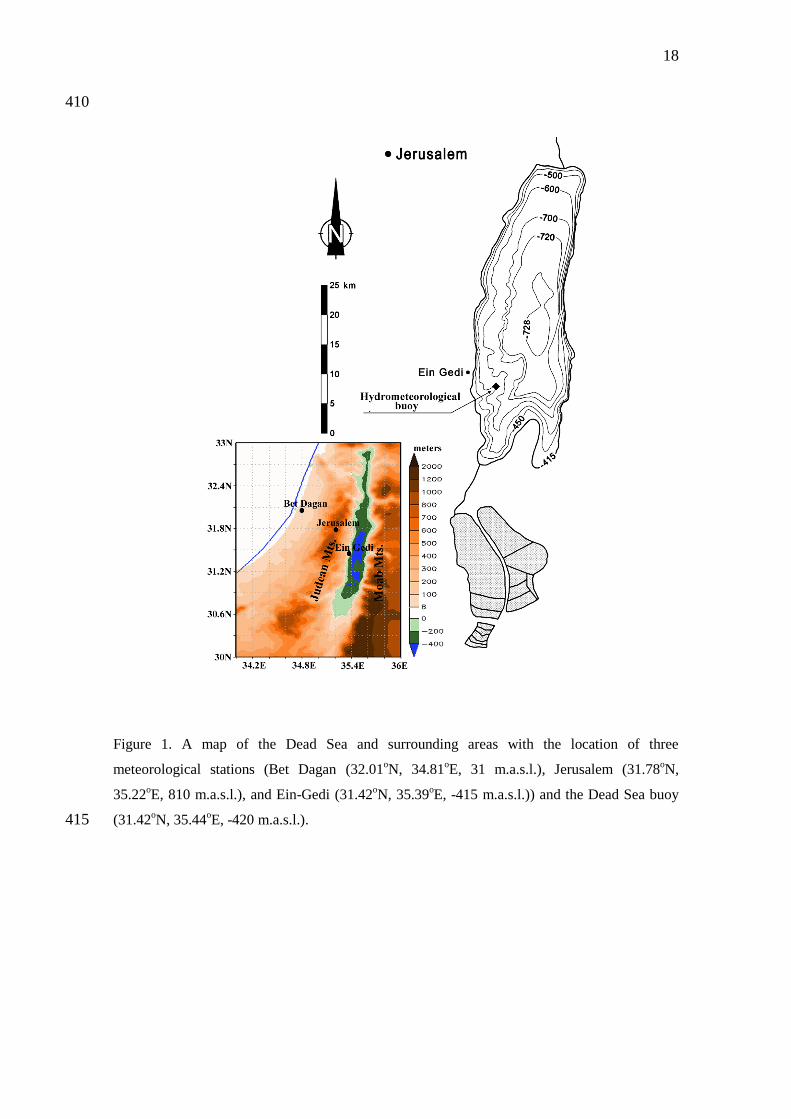
Judean Mountains to the west and by the Moab Mountains to the east (Fig. 1). This area
is characterized by changeable meteorological conditions, particularly by unsteady
winds blowing along or across the valley. The wind regime in the Dead Sea Basin is
governed by the general synoptic systems, such as Mediterranean cyclones, and by local 55
factors, such as Mediterranean breezes and winds originating from topographic
situations [4]. Hect and Gertman [5] found that strong winds greater than 10 m/s
consisted of less than 1% of the wind observations at the Dead Sea. These winds were
more prevalent in the winter than in the summer.
In the Dead Sea, solar radiation rapidly decreases with depth: at a depth of 2 m, 60
solar radiation is only 10% of its surface value [6]. Therefore, solar radiation heats
mainly the 2-m uppermost layer of the Dead Sea. Infrared and microwave radiation is
completely absorbed in the thin skin layer down to 2 mm [7].
Our knowledge of the thermal structure of the uppermost layer of the Dead Sea
has been gained from measurements in situ [1, 5, 8, 9], as well as from remote sensing 65
[10]. Despite the fact that solar radiation penetrates down to 2 m depth, temperature
diurnal variations in the Dead Sea were observed at greater depths [10]. Near-surface
temperature gradients of the air-sea interface result from three different processes: (1)
absorption of solar radiation in the first meters, (2) heat loss to the atmosphere by
4
evaporation and by emission of thermal radiation from the top millimeter of the sea, and 70
(3) subsurface turbulent mixing [7].
The Dead Sea is one of the world's saltiest bodies of water: the salinity can reach
235 g/kg [1]. Since the early 1980s, the Dead Sea has been halite supersaturated [11,
12]. Massive amounts of halite precipitate as halite crystals causing changes in the
chemical composition of the Dead Sea water [12, 13]. Arnon et al. [14] discussed the 75
salt-fingering convection in the Dead Sea at a depth of approximately 25 m, where the
basic conditions for salt-fingering occurred. This salt-fingering at the depth of ~25 m
led to halite precipitation.
In the current study, we focused on observational evidence of a phenomenon of
short-term (~1 hour) water heating in the uppermost layer of the Dead Sea after a sharp 80
drop in solar radiation under weak winds. The heating occurred after the passage of an
intensive Mediterranean cyclone with its frontal system over the Judean Mts. and over
the Dead Sea on March 22, 2013. This passage was accompanied by clouds mixed with
significant dust pollution and a foehn-like phenomenon over the Dead Sea valley. To
our knowledge, such a phenomenon of short-term heating in the uppermost layer of the 85
Dead Sea, following a sharp decrease in surface solar radiation, has not been discussed
in previous publications.
This study was carried out in the framework of the DESERVE (DEad SEa
Research Venue) project started in 2013 (www.deserve-vi.net). This project aims at
studying coupled lithospheric, hydrological, and atmospheric processes in the Dead Sea 90
region.

5
2. Method
To study the effect of a sharp decrease in solar radiation on Dead Sea water heating, we
used available meteorological and hydrographic measurements from a 95
hydrometeorological buoy, anchored in the Dead Sea, and from three meteorological
stations in Israel (Fig. 1). The buoy was operated by the Israel Oceanographic and
Limnological Research and located at approximately 5 km offshore from Ein Gedi
(Figs. 1 and 2). The exact position of the buoy was monitored by GPS. The
measurements, collected at the hydro-meteorological buoy at 3 m above the sea surface, 100
included meteorological parameters such as air temperature, air pressure, relative
humidity, wind speed and direction, as well as incoming solar radiation (global
radiation). Water temperatures were measured at 1, 2, 3, 4, 5, 7, 9, 14, 19, 24, 30 and 40
m below sea level. Measurements were obtained at 20-minute intervals with an
accuracy of 0.1oC. All the measurements with the exception of wind speed were 105
instantaneous. The measured wind speed was represented by both 20-minute mean
values and wind gusts. We also used 10-minute standard meteorological measurements
from the following three meteorological stations operated by the Israel Meteorological
Service: Bet Dagan located near the Mediteranean coastline; Jerusalem located at the
top of the Judean Mts.; and Ein Gedi located near the Dead Sea coastline (Fig. 1). 110
3. Sharp decrease in solar radiation on March 22, 2013
On March 22, 2013, a low-pressure system was observed over the Eastern
Mediterranean, as illustrated by the spatial distribution of sea level pressure based on
the NASA MERRA reanalysis data (Figs. 3 a and b). At 06 UTC, this low-pressure 115
system was characterized by sea level pressure of approximately 995 hPa at its center
6
near Cyprus (hereafter the Cyprus low) (Fig. 3a). It created favourable conditions for
dust uplifting from the Eastern Sahara and transport by south-west winds into the
Eastern Mediterranean (Fig. 3c). Then, this Cyprus low with its frontal system shifted
eastward, followed by increasing strong southwesterly to westerly winds over Israel. At 120
12 UTC, this low-pressure system was characterized by sea level pressure below 995
hPa at its centre near Cyprus (Fig. 3b). The passage of the Cyprus low with its frontal
system over Israel toward the Dead Sea valley was accompanied by a large amount of
dust pollution (Fig. 3d) and by significant cloudiness observed from space by the
MODIS spectroradiometer on board the NASA Aqua satellite (Fig. 3e). 125
The presence of desert dust is illustrated by dust forecasts from the operational
TAU/DREAM dust model, showing 10-m winds and surface dust concentration at 6
UTC and 12 UTC (Figs. 3 c and d) on March 22. On this date, available monitoring
sites in the southern part of the Dead Sea, which measure concentration of total
suspended particles (TSP), showed extremely high TSP concentrations (~7000 µg m-3) 130
of two orders of magnitude higher than their annual mean values [15].
Details of the passage of frontal clouds over the Dead Sea were analysed using
radar measurements of cloud heights (Fig. 4). This radar (C-band with the 5-cm
wavelength) is operated by the Israel Meteorological Service and located at Bet Dagan,
near the Mediterranean coast (Fig. 1). At 9 UTC, west winds brought significant 135
cloudiness to the upwind side of the Judean Mts. Radar showed multilayer clouds
characterized by cloud top heights from 1.5 to ~8 km, although, the clear-sky conditions
still remained on the downwind side of the mountain ridge (Fig. 4). One hour later
clouds of top height from 3 – 4 km covered the Dead Sea. At 10:30 UTC, the Dead Sea
was covered by frontal multilayer clouds of top heights from 1.5 to ~8 km (Fig. 4). 140
Solar radiation (SR), measured by the pyranometer at Dead Sea hydrometeorological
7
buoy, show an essential decrease in measured SR during the passage of frontal clouds
accompanied by dust pollution.
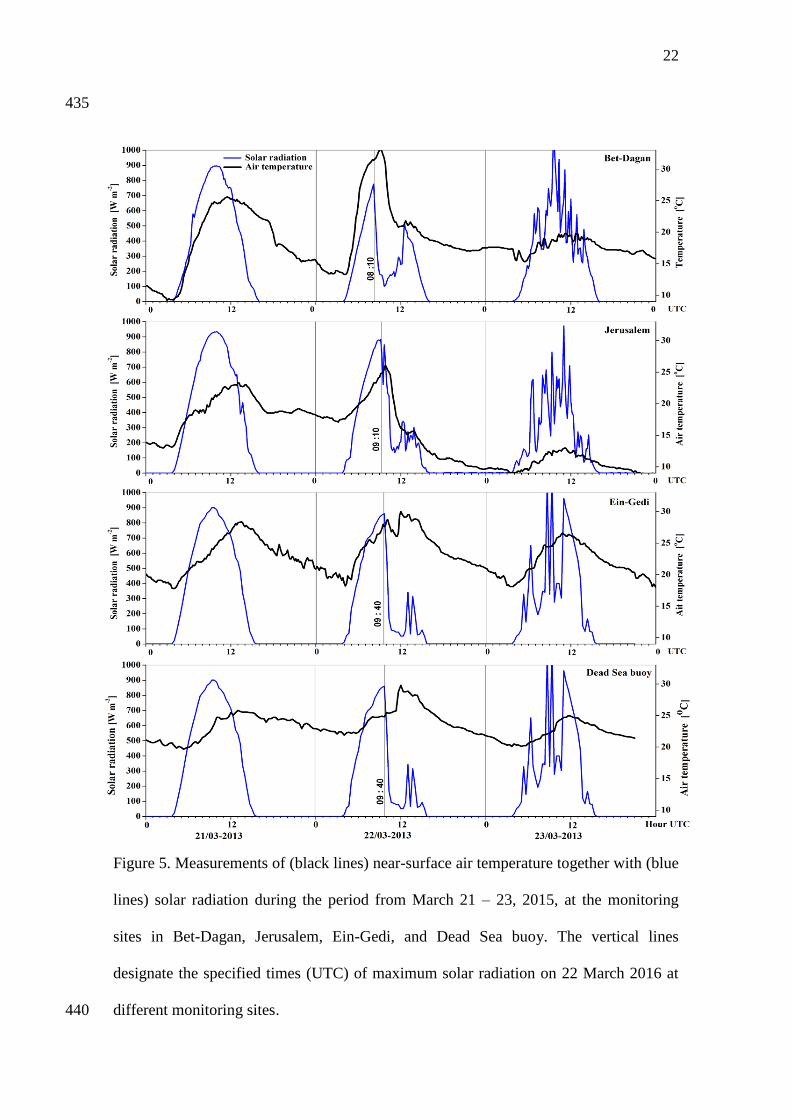
Figure 5 compares solar radiation reaching the surface over the Israel
Mediterranean coast, over the Judean Mts., and over the Dead Sea. In particular, in Bet 145
Dagan, the maximum solar radiation of 780 W m-2
was observed at 08:10 UTC and the
minimum solar radiation of 100 W m-2
was observed at 09:40 UTC (Fig. 5). In the Dead
Sea, the maximum solar radiation of 860 W m-2
was observed at 09:40 UTC, close to
local noon at 10 UTC. Then the solar radiation sharply dropped to 160 W m-2
at 10:20
UTC, followed by a further gradual decrease to 50 W m-2
by 12:00 UTC (Fig. 5). Solar 150
radiation measurements showed that the transition from clear-sky to overcast conditions
was sharper over the Dead Sea than over the Israel Mediterranean coast (Bet Dagan).
4. Air temperature variations after the sharp decrease in solar
radiation 155
A sharp decrease in solar radiation due to dust pollution and overcast conditions led to a
sharp decrease of approximately 10oC in surface air temperature over Israel on March
22, 2013 (as illustrated by temperature measurements in Bet Dagan and Jerusalem (Fig.
5)), with the exception of the Dead Sea. In Ein-Gedi (located near the Dead Sea
coastline) the air temperature dropped much less significantly than in Bet-Dagan and 160
Jerusalem (from 28.7oC at 10:10 UTC to 26.8
oC at 10:40 UTC) (Fig. 5). At the Dead
Sea, buoy measurements showed that the air temperature was not sensitive at all to this
sharp decrease in solar radiation (Fig. 5). Note that, over the Dead Sea, the sharp
decrease in solar radiation took place under weak winds with speed of less than 3 m s-1
(Fig. 6). Therefore, the buoy measurements provide us with observational evidence that, 165

8
under weak winds, air temperature near the surface of the Dead Sea is mainly
determined by sea surface temperature and not by short-term changes in solar radiation.
Moreover, despite the significant decrease in solar radiation over the Dead Sea, the
surface air temperature, measured at the buoy, surprisingly increased one hour later
from 25.4oC at 10:40 UTC to approximately 30
oC at 12:00 UTC (Fig. 5). This increase 170
in air temperature was accompanied by a decrease in relative humidity from 38% to
20%. This decrease in relative humidity in the bottom of the valley, accompanied by the
increase in air temperature, is a characteristic feature of the foehn phenomenon
produced by strong west winds blowing across the Judean Maintains [16]. Concurrently,
an increase in air temperature was observed in Ein-Gedi, near the Dead Sea shoreline 175
(Fig. 5). The appearance of this hot, dry air was accompanied by strong western foehn
winds blowing along the lee side of the Judean Mts. [16]. Buoy measurements showed
that winds significantly increased from 2.5 m s-1
(wind gusts up to 3 m s-1
) at 11 UTC
to 11 m s-1
(wind gust up to 20 m s-1
) at 12:40 UTC (Fig. 6).
5. Buoy measurements of water temperature after the sharp 180
decrease in solar radiation
On March 22, after sunrise and until the drop in solar radiation, the water temperature at
a depth of 1 m was noticeably higher than that at a depth of 2 m, based on buoy
measurements (Fig. 7). This took place under observed weak winds of approximately
2.5 m/s (Fig. 6). Therefore, the aforementioned temperature stratification in the 185
presence of solar radiation is evidence that these weak winds were incapable of
producing significant mixing in the 2-m uppermost layer. After the dramatic drop in
noon solar radiation, buoy measurements unexpectedly showed an increase in water
temperature at 1m depth (Tw1) from 24.1oC at 10:20 UTC to 25
oC at 11:40 UTC, and

9
an increase at 2m depth (Tw2) from 23.9oC to 24.4
oC (Figs. 6 and 7). Note that, despite 190
the drop in noon solar radiation, the maximum temperature Tw1 = 25oC on the day
under study, March 22, was even higher than the maximum temperature Tw1 = 24.7oC
on the previous day March 21 (Fig. 6). This occurred under the same level of noon solar
radiation and under similar weak winds in these two consecutive days. This illustrates
that the heating in the uppermost layer of the Dead Sea, following the sharp drop in 195
noon solar radiation, took place for shorter time and was even more pronounced than
the heating under the full regular diurnal solar cycle.
It is worth noting that the most pronounced heating at a depth of 1m (Tw1) from
10:20 UTC (24.1oC) to 10:40 UTC (24.5
oC) took place at approximately the same
temperature rate as that at a depth of 2m (Tw2) from 11:20 UTC (24.0 oC) to 11:40 200
(24.4 oC). As seen above, this heating at 2m depth occurred with a 1-hour delay
compared to the heating at 1 m depth.
Buoy measurements showed that, after the drop in solar radiation, the
temperature rise at the layers deeper than 2 m was also observed, although it was less
pronounced than that above 2 m (Fig. 7). The heat transfer to deep layers occurred with 205
a delay in time at each stage: the time delay in the maximum temperature with
increasing depth is clearly seen in the buoy data.
At 11:40 UTC, under winds of approximately 5 m s-1
(with wind gusts up to 7.2
m s-1
), mechanical mixing in the 2-m uppermost layer of the Dead Sea arose. As a result
of mechanical mixing between the upper warm layer and the lower cool layer, the upper 210
warm layer becomes colder while the lower cold layer becomes warmer. This mixing
switched off the mechanism of heating in the 2-m uppermost layer of the Dead Sea.
Specifically, by 12 UTC, Tw1 decreased to 24.8oC, while simultaneously Tw2 reached
its maximum of 24.6oC (Fig. 7). From 12 UTC to 12:40 UTC, winds increased from 5

10
m s-1
to 11 m s-1
(wind gusts from 8.4 m s-1
to 20 m s-1
) (Fig. 6). These strong winds 215
were able to mix water to a depth of 4 m, because of mechanical mixing. Specifically,
by 12:40 UTC, Tw1 and Tw2 simultaneously decreased from approximately 24.6oC at
12 UTC to 24.3oC at 12:40 UTC. At the same time, Tw3 and Tw4 increased from
approximately 23.9oC at 12 UTC to 24.2
oC at 12:40 UTC (Fig. 7). By 24 UTC, the
water temperature equalized in all layers down to 14 m. 220
As mentioned in Section 2, water temperature was measured by the Dead Sea
buoy with an accuracy of 0.1oC. On March 22, 2013, after the sharp drop in solar
radiation, buoy observations showed an increase in Tw1 of 10C and in Tw2 of 0.5
oC,
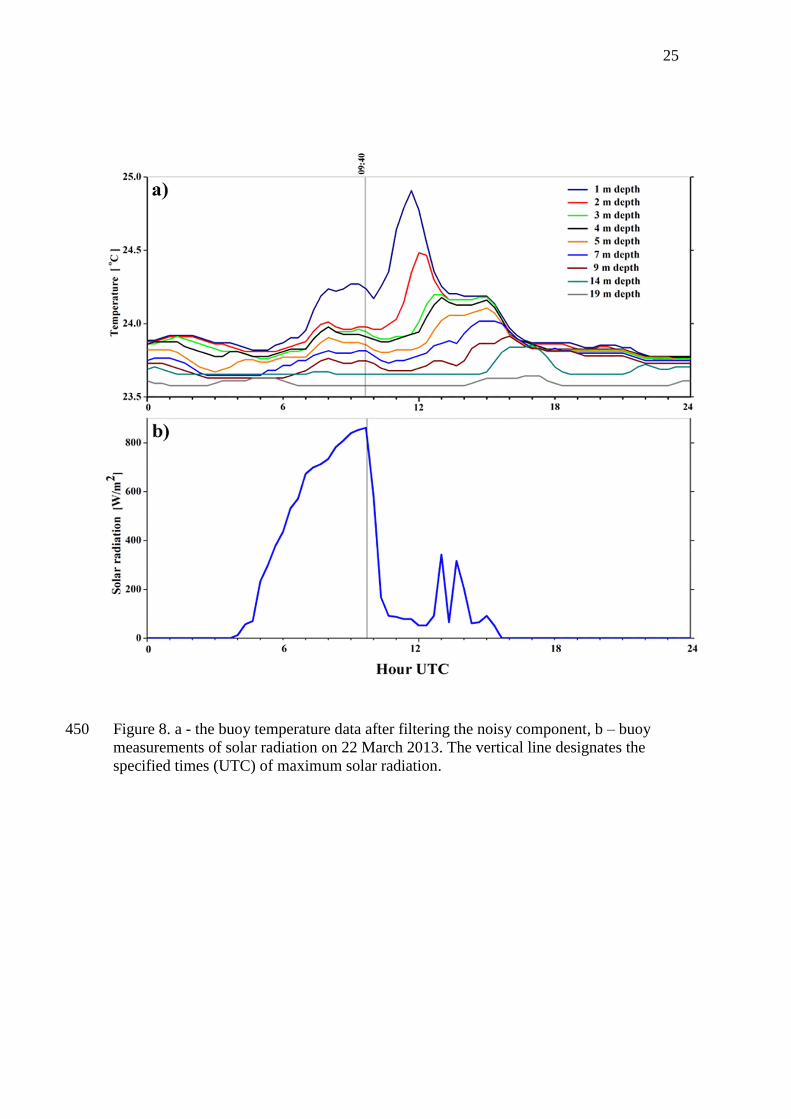
which indicates they are reliable. To remove the unwanted noisy component from the
buoy temperature data, a moving average filter can be used, which is optimal for 225
filtering random noise, while retaining a signal under investigation. In our study, a 3-
point moving average filter was applied to 20-min row data. Fig. 8a represents the buoy
temperature data after filtering the noisy component. One can see that, from 8 UTC to
the sharp drop in solar radiation at 9:40 UTC, there were some insignificant changes in
Tw1 and Tw2. After this sharp drop, a pronounced increase was observed in Tw1 and 230
Tw2 (Figs. 8 a and b).
6. Plausible mechanism of formation of pronounced heating in the top
layer of the Dead Sea
The pronounced temperature rise in the 2-m uppermost layer of the Dead Sea, on 22 235
March 2013, cannot be explained by mechanical water mixing under the observed weak
winds of less than 2.5 m/s (Fig. 6). This is because of the simultaneous temperature rise
at the depth of 1 m and 2m during the two-hour period from 9:40 UTC to 11:40 UTC
(Fig. 7). By contrast, the appearance of strong winds of up to 20 m/s after 11:40 UTC

11
led to mechanical mixing and, consequently, to water temperature equalizing at the 240
depth of 1m and 2m. As an additional illustration, Fig. 6 represents the case of
mechanical mixing, observed on 23 March 2013 under strong winds, when water
temperature equalized at all depths in the uppermost layer of the Dead Sea.
Moreover, neither thermal conductivity nor horizontal advection of warm water
could explain the observed phenomenon. Heating of seawater by thermal conductivity is 245
a slow process, which could be effective for some long-term phenomena such as weekly
or monthly changes, but not for the short-term (1 hour) temperature rise observed on the
specified day. Neither could horizontal advection of warm water explain the
phenomenon under consideration. As shown in Figs. 9 a and b, on 22 March, from 7:40
UTC to the maximum in solar radiation at 9:40 UTC, there was no noticeable increase 250
in Tw1 and Tw2, despite the observed increase in solar radiation. Starting at 9:40 UTC
on 22 March, under weak winds of less than 2.5 m/s, it is highly unlikely that the
observed pronounced increase in Tw1 and Tw2 following the sharp drop in solar
radiation was caused by some surge of warm water, which suddenly occurred and
propagated to the depth of 2m and even deeper. It is even more unlikely that the heating 255
at a depth of 2m with the most pronounced temperature rate occurred with a 1-hour
delay compared to that at a depth of 1m.
In the Dead Sea, solar radiation (SR) heats mainly the 2-m uppermost layer: at a
depth of 0.5 m, SR is ~50% of its surface value; at a depth of 1 m, SR is ~30% of its
surface value; and at a depth of 2 m, SR is only 10% of its surface value [6]. This 260
explains the observed temperature stratification at depths in the 2-m top layer of the
Dead Sea, consequently, the gravitational stability in the presence of solar radiation took
place (Fig. 7).

12
We consider that the following plausible mechanism could explain the observed
short-term heating in the uppermost layer of the Dead Sea, following the sharp drop in 265
noon solar radiation on the specified day under study. Let us consider the following
two-layer structure in the Dead Sea: a thin surface layer, where evaporation takes place,
with water density D1, and a similar thin layer below with water density D2. Following
a sharp drop in solar radiation on 22 March, evaporation from the thin surface layer of
the Dead Sea led to water cooling accompanied by an increase in water salinity in this 270
layer. As a result, the water density in this thin surface layer became higher than the
density in the layer below D1 > D2. Thus, the drop in solar radiation caused conditions
for gravitational instability in the thin surface layer. As a result of this instability, the
warm dense surface water submerged, thereby increasing temperature in the layers
below. 275
The above-mentioned mechanism is based on previous experimental and
theoretical studies of gravitational instability in fresh water induced by evaporative
cooling at the top surface. In particular, Spangenberg and Rowland [17] investigated
this phenomenon in a series of experiments. They experimentally showed that, when an
initially homogeneous layer of fluid is cooled at the top surface by evaporation, a cold 280
dense layer of fluid forms at this top surface. This top surface layer becomes unstable
(because of its higher density than in the layer below) and plunges in vertical sheets.
Thus, the fluid suddenly begins to manifest convective behaviour [17]. Forster [18]
theoretically analysed the results of the experiments conducted by Spangenberg and
Rowland [17]. Spangenberg and Rowland showed that, when the convective circulation 285
(induced by gravitational instability) started, the Rayleigh number exceeded some
critical value of the order 103.

13
In the case of the Dead Sea on 22 March 2013, after the sharp decrease in solar
radiation, we also have a thin surface layer, which is cooled by evaporation (leading to
an increase in density of this surface layer and, consequently, gravitational instability). 290
As estimated by Steinhorn [19], the evaporation rate for the Dead Sea hypersaline water
is approximately 40% higher than that for fresh water. Consequently, water cooling due
to evaporation for the Dead Sea water is more intensive than that for fresh water.
Not only does water density in the Dead Sea surface layer increase due to
cooling, but it also increases due to increasing salinity as a result of evaporation. Thus, 295
the formation of gravitational instability in the Dead Sea thin surface layer after the
sharp drop in solar radiation is indeed plausible.
According to Stern [20], in seawater, the molecular diffusivity of heat is two
orders of magnitude higher than the diffusivity of salt. This means that, as a result of
this low diffusivity of salt, the salinity of the submerging layer remains invariable 300
during the submergence process. This explains the submerging process of warm salt
surface water within cooler water in the layers below.
In accordance with Stern [20], laboratory experiments showed that the speed of descent
of warm salt water within cooler fresh water was approximately 40 cm/hour. In the case
of the Dead Sea on 22 March 2013, after the sharp decrease in solar radiation, we 305
observed that the most pronounced heating at a depth of 1m (Tw1) from 10:20 UTC
(24.1 oC) to 10:40 UTC (24.5
oC) took place at approximately the same temperature rate
as the heating at a depth of 2m (Tw2) from 11:20 UTC (24.0 oC) to 11:40 (24.4
oC).
This heating at 2m depth occurred with a 1-hour delay compared to the heating at 1 m
depth. This 1-hour delay indicates that the speed of descent of Dead Sea warm dense 310
surface water within cooler water in the layers below was approximately 100 cm/hour.
This speed is the same order as the above-mentioned speed observed in laboratory

14
experiments. This process explains why the submerging warm salt surface water could
heat water in the layers below, being the reason for the observed short-term temperature
rise at a depth of 1 m and 2 m following the drop in noon solar radiation. 315
7. Conclusions
In our study we present observational evidence of an unexpected short-term (1-hour)
pronounced temperature rise in the uppermost layer of the Dead Sea under weak winds:
this followed a sharp drop in solar radiation due to clouds mixed with significant dust 320
pollution over the region on 22 March 2013. This evidence was based on Dead Sea
buoy measurements. After the sharp drop in noon solar radiation, in the absence of
water mixing, buoy measurements showed that the temperature rise in the uppermost
layer took place for a much shorter time and was even more pronounced than the
temperature rise under the full regular diurnal solar cycle. 325
We consider that the phenomenon of short-term heating in the uppermost layer of the
Dead Sea can occur at times, but it usually remains unobserved. This is why this
phenomenon has not been discussed so far in previous publications.
Specific meteorological conditions (caused the sharp drop in solar radiation on
the date under study) and the temperature stratification in the uppermost layer of the 330
Dead Sea allowed us to detect this phenomenon of short-term heating. Under such
conditions, in the absence of solar radiation, continuing strong evaporation caused an
increase in water density in the thin surface layer due to cooling and increasing salinity.
This led to the gravitational instability in this surface layer caused the dense surface
water to submerge. As a result of low diffusivity of salt, the salinity of the submerging 335
layer remained invariable during the submergence process. This explains the

15
submerging process of warm salt surface water within cooler water in the layers below
and the pronounced heating in the 2-m uppermost layer of the Dead Sea.
To better understand the observed phenomenon of short-term heating, it would
be essential to conduct further research in the Dead Sea and other hypersaline lakes 340
using observational, model and theoretical approaches.
Acknowledgements
We would like to thank the Israel Meteorological Service for providing us with
meteorological data taken at Bet Dagan, Jerusalem, and Ein Gedi. The Tel-Aviv
University team acknowledges support from the international Virtual Institute 345
DESERVE (DEad SEa Research Venue), funded by the German Helmholtz
Association.

16
References
[1] Gertman, I., Hecht, A., 2002. The Dead Sea hydrography from 1992 to 2000. 350
Journal of Marine Systems. 35(3-4), 169–181, doi:10.1016/S0924-
7963(02)00079-9.
[2] Boss, E., Gildor, H., Slade, W., Sokoletsky, L. Oren, A., Loftin, J., 2013. Optical
properties of the Dead Sea. J. Geophys. Res. Oceans. 118,
doi:10.1002/jgrc.20109. 355
[3] Neev, D., Emery, K.O., 1967. The Dead Sea, depositional processes and
environments of evaporates. Geological Survey of Israel Bulletin. 41, 1–147.
[4] Shafir, H., Alpert, P., 2011. Regional and local climatic effects on the Dead Sea
evaporation. Climatic Change. 105, 455-468, doi:10.1007/s10584-010-9892-8.
[5] Hecht, A., Gertman, I., 2003. Dead Sea meteorological climate, in Nevo, E., 360
Oren, A., Wasser, S.P. (Eds.) Fungal Life in the Dead Sea. Oberreifenberg,
Germany, ISBN 978-3-906166-10-0, pp. 68 - 114.
[6] Oren, A., Shilo, M., 1982. Population dynamics of Dunaliella parva in the Dead
Sea, Limnology and Oceanography. 27(2), 201-211,
doi:10.4319/lo.1982.27.2.0201. 365
[7] Minnett, P, Kaiser-Weiss, A. (2012). Near-surface oceanic temperature
gradients. Group for High Resolution Sea-Surface Temperature (GHRSST)
Discussion Document, 7 p.
https://www.ghrsst.org/files/download.php?m=documents&f=120113121306-
SSTDefinitionsDiscussion.pdf. 370
[8] Stanhill, G., 1990. Changes in the surface temperature of the Dead Sea and its
heat storage. Int. J. Climatol. 10, 519 – 536, doi:10.1002/joc.3370100508.
[9] Nehorai, R., Lensky, N., Brenner, S., Lensky, I., 2013. The Dynamics of the
Skin Temperature of the Dead Sea. Advances in Meteorology. 2013, Article ID
296714, http://dx.doi.org/10.1155/2013/296714. 375
[10] Nehorai, R., Lensky, I.M., Lensky, N.G., Shiff, S., 2009. Remote sensing of the
Dead Sea surface temperature. J. Geophys. Res., 114, C05021,
doi:10.1029/2008JC005196.
[11] Steinhorn, I., 1983. In situ salt precipitation at the Dead Sea. Limnology and
Oceanography. 28, 580 – 583, doi:10.4319/lo.1983.28.3.0580. 380

17
[12] Gertman, I., Kress, N., Katsenelson, B., & Zavialov, P. (2010). Equations of
state for the Dead Sea and Aral Sea: searching for common approaches. Final
report of Russian-Israel cooperation project 3-3575. 31 p.
http://isramar.ocean.org.il/isramar2009/DeadSea/Gertman_et_al_2010_DeadSeaAralSea_R
eport.pdf 385
[13] Lensky, N., Arnon, A., Sirota, I., 2015. Halite precipitation rates in the Dead
Sea: Seasonal and spatial variations and their limnological and geological
implications. Geophysical Research Abstracts. 17, EGU2015-11848.
[14] Arnon, A., Selker, J., Lensky, N., 2016. Thermohaline stratification and double
diffusion diapycnal fluxes in the hypersaline Dead Sea. Limnology and 390
Oceanography. 61, 1214 - 1231. doi:10.1002/lno.10285.
[15] Kishcha, P., Rieger, D., Metzger, J., Starobinets, B., Bangert, M., Vogel, H.,
Schaettler, U., Corsmeier, U., Alpert, P., Vogel, B., 2016. Modeling of a strong
dust event in the complex terrain of the Dead Sea valley during the passage of a
gust front. Tellus B. 68, 29751, http://dx.doi.org/10.3402/tellusb.v68.29751. 395
[16] Kishcha, P., Starobinets, B., Savir, A., Alpert, P., Kaplan, A., 2017. Foehn-
induced effects on dust pollution, frontal clouds and solar radiation in the Dead
Sea valley. Meteorology and Atmospheric Physics, doi:10.1007/s00703-017-
0521-1.
[17] Spangenberg, W.G., Rowland, W.R., 1961. Convective circulation in water 400
induced by evaporation cooling. The Physics of Fluids. 4, 743 – 750,
http://dx.doi.org/10.1063/1.1706392
[18] Foster, T.D., 1965. Onset of convection in a layer of fluid cooled from above.
The Physics of Fluid. 8, 1770 – 1774, http://dx.doi.org/10.1063/1.1761108.
[19] Steinhorn, I., 1991. On the concept of evaporation from fresh and saline water 405
bodies. Water Resources Research. 27, 645 – 648, doi:10.1029/90WR02759.
[20] Stern, M.E., 1960. The “salt-fountain” and thermohaline convection. Tellus. 12,
172 – 175, doi: 10.1111/j.2153-3490.1960.tb01295.x.
18
410
Figure 1. A map of the Dead Sea and surrounding areas with the location of three
meteorological stations (Bet Dagan (32.01oN, 34.81
oE, 31 m.a.s.l.), Jerusalem (31.78
oN,
35.22oE, 810 m.a.s.l.), and Ein-Gedi (31.42
oN, 35.39
oE, -415 m.a.s.l.)) and the Dead Sea buoy
(31.42oN, 35.44
oE, -420 m.a.s.l.). 415

19
Figure 2. The Dead Sea hydrometeorological buoy.
420

20
Figure 3. a and b - maps of sea level pressure on March 22, 2013, at (a) 06 UTC and (b) 12
UTC, based on NASA MERRA reanalysis data. c and d – maps of 10-m winds and surface dust
concentration at (c) 06 UTC and (d) 12 UTC, based on DREAM dust model data. e – MODIS-425
Aqua satellite image of cloudiness taken on 22 March 2013 at 11:40 UTC.

21
Figure 4. Radar measurements of cloud top height from 09:00 UTC to 10:30 UTC on 22 430
March 2013. Solar radiation (SR), measured by the pyranometer at the
hydrometeorological buoy anchored in the Dead Sea, is represented by the numbers at
any specified time moment.
22
435
Figure 5. Measurements of (black lines) near-surface air temperature together with (blue
lines) solar radiation during the period from March 21 – 23, 2015, at the monitoring
sites in Bet-Dagan, Jerusalem, Ein-Gedi, and Dead Sea buoy. The vertical lines
designate the specified times (UTC) of maximum solar radiation on 22 March 2016 at
different monitoring sites. 440

23
Figure 6. Measurements of sea water temperature and meteorological parameters at the
Dead Sea buoy from March 21 - 23, 2013.

24
Figure 7. Measurements of seawater temperature and solar radiation at the Dead Sea 445
buoy on March 22, 2013. The vertical lines designate the specified times in UTC.
25
Figure 8. a - the buoy temperature data after filtering the noisy component, b – buoy 450
measurements of solar radiation on 22 March 2013. The vertical line designates the
specified times (UTC) of maximum solar radiation.

26
455
Figure 9. Measurements of (a) sea water temperature at 1m (Tw1) and 2m (Tw2) depth
and (b) solar radiation near its maximum during the 2-hour period from 7:40 UTC to
9:40 UTC at the Dead Sea buoy on 22 March 2013.


![Diurnal and Nocturnal Animals. Diurnal Animals Diurnal is a tricky word! Let’s all say that word together. Diurnal [dahy-ur-nl] A diurnal animal is an.](https://static.fdocuments.in/doc/165x107/56649dda5503460f94ad083f/diurnal-and-nocturnal-animals-diurnal-animals-diurnal-is-a-tricky-word-lets.jpg)