Pike, Christopher - Spooksville 18 - Attack of the Giant Crabs (Attack of the Killer Crabs)

BULLETIN OF MARINE SCIENCE, 86(1): 75–91, 2010
75Bulletin of Marine Science© 2010 Rosenstiel School of Marine and Atmospheric Science of the University of Miami
OBSERvATIONS OF dISTRIBUTION, SIzE, ANd SEx RATIO OF MATURE BLUE CRABS, CallineCteS SapiduS, FROM A ChESApEAkE BAy TRIBUTARy IN RELATION TO
OySTER hABITAT ANd ENvIRONMENTAL FACTORS
Juliana M. Harding and Roger Mann
ABSTRACTBlue crabs Callinectes sapidus (Rathbun, 1896) > 100 mm carapace width were
sampled from a constructed oyster reef (1996 and 1997), a sand bar (1997) and a natural oyster bar (1997) in the piankatank River, Chesapeake Bay, USA to describe habitat use, sex ratios, and demographics across a gradient of habitat types. patterns of blue crab catch-per-unit-effort (CpUE), and demographics were similar on the oyster reef in 1996 and 1997. Average annual CpUE on the reef was 6–8 crabs pot−1 with maximum CpUE of 15 crabs pot−1. daylength and water temperature significantly affected reef CpUE with more crabs observed in late August and early September. In 1997, average annual CpUE at the natural oyster bar was higher (9 crabs pot−1) than on the reef or the sand bar (both 6–7 crabs pot−1). Observed differences in habitat use may relate to site-specific differences in depth and tidal current as well as the presence of living oyster (biogenic) substrate. A transition in the sex ratio of crabs was observed as daylength declined seasonally. In May, males were 3–5 times more abundant than females at all sites but by early September, as daylength and water temperatures declined, female crabs were 3–4 times more abundant than males at all sites. The median size of males and females increased from spring into summer and female crabs were typically larger than males from the same habitats across all habitat types. The largest female crabs were observed in habitats with oysters. Biogenic oyster habitats are important estuarine habitats for blue crabs as well as oysters.
Blue crabs, Callinectes sapidus (Rathbun, 1896), are mobile opportunistic preda-tors and scavengers that occupy estuarine and marine habitats in the western Atlan-tic ranging from Cape Cod, USA to Brazil (hines et al., 1995). habitat use by blue crabs within an estuary changes ontogenetically (e.g., hines et al., 1987, 1995). In Chesapeake Bay, USA, blue crabs < 100 mm carapace width (CW, maximum dimen-sion from point to point across the carapace) remain in their natal estuaries until the end of their first year and then move to adjacent deeper water to overwinter (hines et al., 1995). In their second year, Chesapeake blue crabs 120–200 mm CW are sexu-ally mature and seasonally move into and out of smaller estuaries to forage and mate (van Engel, 1958). Males typically remain in the Chesapeake Bay and its tributaries year round but may move upriver in spring and fall with females following in mid-summer (Churchill, 1919; van Engel, 1958; Milliken and Williams, 1984; hines et al., 1987). Mating occurs during the summer months in the bay and its tributar-ies (Churchill, 1919; van Engel, 1958). Then, as water temperatures decrease during the fall, most females migrate to overwintering grounds in the mud of the southern Chesapeake Bay (Churchill, 1919; van Engel, 1958).
historically, Chesapeake Bay estuaries offered a gradient of nursery and foraging habitats for blue crabs. Shallow salt marshes (e.g., Orth and von Montfrans, 1990; Thomas et al., 1990; Fitz and Wiegert, 1991; Minello, 1999) and seagrass beds (e.g., Orth, 1977; Orth and von Montfrans, 1987; Wilson et al., 1987; Sogard and Able,

BULLETIN OF MARINE SCIENCE, vOL. 86, NO. 1, 201076
1994; Minello, 1999) are important nursery and forage habitat for post-settlement and juvenile crabs (< 100 CW mm) as well as adults (> 100 mm CW). Biogenic struc-tures created and maintained by Eastern oysters [Crassostrea virginica (Gmelin, 1791)]; three dimensional structures are termed “reefs”, two-dimensional structures are termed “bars”) are also used as habitat by blue crabs (e.g., Wells, 1961; Coen et al., 1999; harding and Mann, 1999; posey et al., 1999; Meyer and Townsend, 2000; Lenhert and Allen, 2002). Infaunal soft sediment habitats between marshes, seagrass beds, and oyster reefs provide additional crab foraging habitat (virnstein, 1977; Seitz et al., 2005). prior to the 20th century, seagrass beds and oyster reefs spatially domi-nated mesohaline shallow (< 3 m) Chesapeake Bay habitats forming a mosaic of suit-able habitats for crabs. The late 20th century decline of Chesapeake Bay seagrass beds (Orth and Moore, 1983) and oyster reefs (haven et al., 1981; Rothschild et al., 1994; hargis and haven, 1999) in terms of absolute abundance and spatial coverage has drastically reduced the availability and heterogeneity of these traditional crab habitats within Chesapeake Bay estuaries.
Recent management efforts focused on enhancement of natural oyster populations and construction of oyster reefs to encourage oyster recruitment, may indirectly pro-vide habitat enhancement for blue crabs (e.g., peterson et al., 2003). The piankatank River is a small, relatively pristine Chesapeake Bay tributary. during the 1990s, it was the location of focused oyster restoration efforts (e.g., Mann et al., 1996; Bartol and Mann, 1997, 1999) due to its history as a small, trap-type estuary (Andrews, 1979) with regular oyster recruitment, the absence of commercial oyster harvesting activ-ity, and a relatively undeveloped watershed. A limited number of commercial water-men fish for blue crabs in the river. during 1996–1997, a multi-species monitoring program for fishes (harding and Mann, 1999, 2000, 2001a,b, 2003) and decapod crustaceans (Mann and harding, 1997, 1998) provided the opportunity to examine blue crab habitat use patterns around a constructed oyster reef in relation to a natu-ral oyster bar and a sand bar. Our objectives were to quantitatively describe blue crab CpUE, sex, and size (1) around a constructed oyster reef between years (1996 vs 1997) and (2) across habitat types (sites) within 1 yr (1997) and (3) relate observed habitat use patterns to ambient environmental (water temperature, salinity, daylength) con-ditions.
Materials and Methods
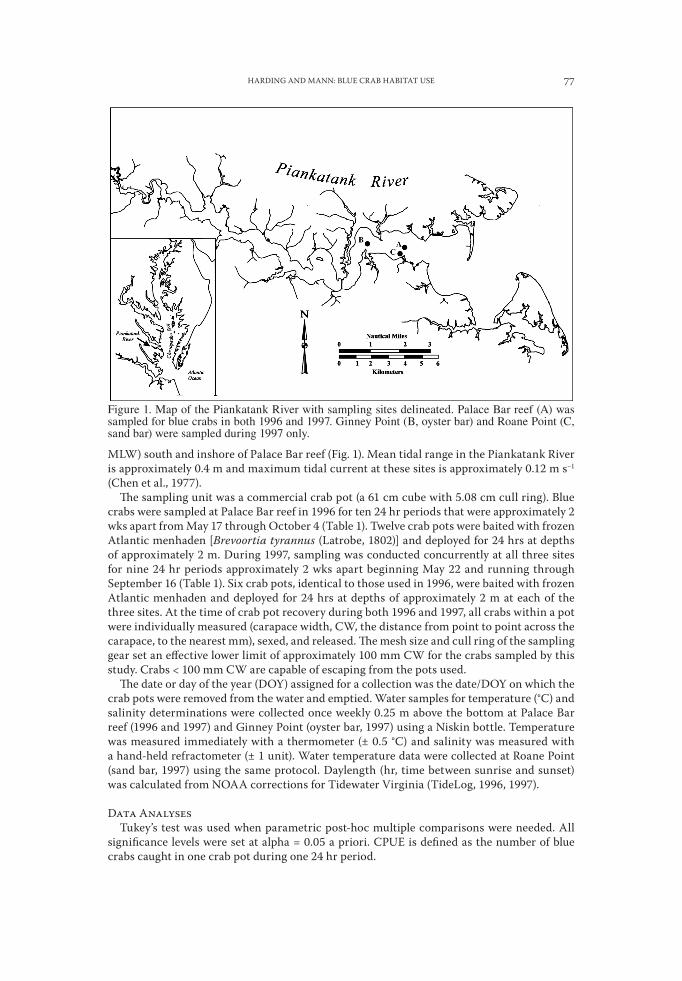
Field SamplingBlue crabs were sampled in the piankatank River, virginia at three sites (Fig. 1): palace Bar
oyster reef (37°31́ 41.69˝N, 76°22´25.98˝W), a natural oyster bar (Ginney point, 37°31́ 37.48˝N, 76°24´08.40˝W), and a sand bar (Roane point, 37°31́ 37.48˝N, 76°22´39.63˝W). palace Bar reef is an intertidal oyster reef (210 m × 30 m, reef depth range of 0.5 m above mean low wa-ter (MLW) to 3 m below MLW) adjacent to the historic palace Bar oyster ground that was built in 1993 by the virginia Marine Resources Commission (vMRC) Shellfish Replenish-ment program as a series of 18 shell mounds centered on and around an east-west centerline 300 m long (Mann et al., 1996). Approximately 70% of the reef (0.63 ha) is composed of oys-ter shell, while the remaining area (0.27 ha) is crushed clam shell. during the study period (1996–1997), palace Bar reef supported oyster densities similar to those observed on natural (i.e., not constructed) oyster bars in the piankatank River (~50–80 oysters m–2), harding and Mann, 1999). Ginney point (Fig. 1) is a flat (2 dimensional) natural oyster bar with a depth range of 2.5–3 m below MLW. Roane point is a natural sand bar (depth range 1.5–2 m below
hARdING ANd MANN: BLUE CRAB hABITAT USE 77
MLW) south and inshore of palace Bar reef (Fig. 1). Mean tidal range in the piankatank River is approximately 0.4 m and maximum tidal current at these sites is approximately 0.12 m s−1 (Chen et al., 1977).
The sampling unit was a commercial crab pot (a 61 cm cube with 5.08 cm cull ring). Blue crabs were sampled at palace Bar reef in 1996 for ten 24 hr periods that were approximately 2 wks apart from May 17 through October 4 (Table 1). Twelve crab pots were baited with frozen Atlantic menhaden [Brevoortia tyrannus (Latrobe, 1802)] and deployed for 24 hrs at depths of approximately 2 m. during 1997, sampling was conducted concurrently at all three sites for nine 24 hr periods approximately 2 wks apart beginning May 22 and running through September 16 (Table 1). Six crab pots, identical to those used in 1996, were baited with frozen Atlantic menhaden and deployed for 24 hrs at depths of approximately 2 m at each of the three sites. At the time of crab pot recovery during both 1996 and 1997, all crabs within a pot were individually measured (carapace width, CW, the distance from point to point across the carapace, to the nearest mm), sexed, and released. The mesh size and cull ring of the sampling gear set an effective lower limit of approximately 100 mm CW for the crabs sampled by this study. Crabs < 100 mm CW are capable of escaping from the pots used.
The date or day of the year (dOy) assigned for a collection was the date/dOy on which the crab pots were removed from the water and emptied. Water samples for temperature (°C) and salinity determinations were collected once weekly 0.25 m above the bottom at palace Bar reef (1996 and 1997) and Ginney point (oyster bar, 1997) using a Niskin bottle. Temperature was measured immediately with a thermometer (± 0.5 °C) and salinity was measured with a hand-held refractometer (± 1 unit). Water temperature data were collected at Roane point (sand bar, 1997) using the same protocol. daylength (hr, time between sunrise and sunset) was calculated from NOAA corrections for Tidewater virginia (TideLog, 1996, 1997).
data AnalysesTukey’s test was used when parametric post-hoc multiple comparisons were needed. All
significance levels were set at alpha = 0.05 a priori. CpUE is defined as the number of blue crabs caught in one crab pot during one 24 hr period.
Figure 1. Map of the Piankatank River with sampling sites delineated. Palace Bar reef (A) was sampled for blue crabs in both 1996 and 1997. Ginney Point (B, oyster bar) and Roane Point (C, sand bar) were sampled during 1997 only.

BULLETIN OF MARINE SCIENCE, vOL. 86, NO. 1, 201078
environmental data.—The median water temperature across all sites was calculated and used for all subsequent statistics as the descriptor of water temperature for that day. Salinities measured at palace Bar reef and Ginney point sites on each day were the same. Given Roane point’s proximity to the other sites (Fig. 1), salinities at Roane point were assumed to be the same as observed at the other two sites. daylength (hr) was the same for all three sites on any given day.
total Blue Crab Cpue.—Total (males and females) blue crab CpUE data from palace Bar reef in 1996 and 1997 were compared using an ANCOvA with year as a factor and day length, water temperature, and salinity as covariates. The data satisfied the assumption of normality after transformation (square root + 1) but did not satisfy the assumption of homogeneity of variance regardless of the transformation (square root, logarithm, natural logarithm, recipro-cal, arcsine). ANCOvAs are typically robust to the violation of a single assumption provided the other is satisfied (zar, 1996).
Total blue crab CpUE data from the three piankatank River sites sampled during 1997 were analyzed using an ANCOvA with site as a factor and water temperature and daylength as covariates. The data satisfied the assumptions of normality and homogeneity of variance after transformation (square root + 1).
Crab Cpue by Sex.—The proportion of the total crab CpUE that was male on a sampling date was used to describe CpUE in relation to sex. data from palace Bar reef in 1996 and 1997 were compared using an ANCOvA with year as a factor and daylength, water temperature, and salinity as covariates. The data satisfied the assumption of homogeneity of variance with-out transformation but did not satisfy the assumption of normality regardless of the transfor-mation (square root, logarithm, natural logarithm, reciprocal, arcsine). Untransformed data were used for the analyses.
Table 1. Summary of Piankatank River blue crab sampling in relation to Palace Bar oyster reef (A, 1996 and 1997), Ginney Point oyster bar (B, 1997), and Roane Point sand bar (C, 1997). Ab-breviations are as follows: DOY = day of the year, WT = bottom water temperature (°C), bottom salinity, DL = daylength (hr), Avg = average, CPUE = catch-per-unit-effort, crabs pot–1 day–1, SE = standard error of the mean, # = number, F = female, M = male.
A B C
Date DOYWT (°C) Sal
DL (hr)
Avg CPUE (SE) #F:#M
Avg CPUE (SE) #F:#M
Avg CPUE(SE) #F:#M
5/17/96 137 17 14 14.25 1.5 (0.48) 1:175/31/96 151 19 12 14.56 4.5 (0.71) 8:466/15/96 167 25 14 14.75 6.5 (0.82) 31:476/28/96 180 27 12 14.72 5.0 (0.59) 27:337/11/96 194 26 14 14.53 8.8 (1.21) 48:577/26/96 208 28 13 14.2 6.8 (0.83) 20:628/9/96 222 28 11 13.77 9.3 (1.46) 49:628/23/96 236 27.9 12 13.47 11.1 (1.63) 117:169/20/96 264 22 12 12.23 15.8 (2.76) 170:2010/4/96 279 18 13 11.6 11.1 (2.15) 120:135/23/97 143 18.5 18 14.40 0.2 (0.17) 0:2 1 (0.36) 0:4 1 (0.29) 0:56/6/97 157 18.5 17 14.67 2.8 (0.70) 2:15 9.67 (1.09) 6:52 6 (1.24) 2:346/20/97 171 22.5 14 14.75 6.0 (3.01) 14:22 9.16 (2.02) 20:35 4.83 (1.87) 11:187/3/97 184 24.5 14 14.68 6.5 (1.54) 8:31 5.83 (1.14) 9:26 5.33 (0.92) 6:267/18/97 199 26.3 14 14.43 7.3 (1.28) 15:29 13.67 (1.15) 36:52 8.83 (0.65) 14:398/5/97 217 27.0 15 13.93 2.67 (1.28) 0:19 7.83 (1.47) 3:44 3.33 (0.49) 1:198/19/97 231 27.0 16 13.47 6.83 (1.66) 13:28 8.0 (0.68) 23:25 7.17 (1.92) 24:199/3/97 246 27.0 16 12.90 12.5 (3.10) 62:13 12.17 (1.49) 42:24 4.83 (0.65) 16:129/16/97 259 25.0 18 12.38 15.83 (3.38) 83:12 13.5 (2.17) 72:21 13.5 (2.96) 69:12
hARdING ANd MANN: BLUE CRAB hABITAT USE 79
The proportion of male crabs observed in the CpUE at each of the three sites sampled in 1997 was analyzed using an ANCOvA with site as a factor and daylength and water tempera-ture as covariates. data satisfied assumptions of both homogeneity of variance and normality without transformation.
Crab Carapace Width in Relation to Habitat and Sex.—Carapace width measurements (CW, mm) for individual crabs caught on palace Bar reef in 1996 and 1997 did not satisfy the assumptions of homogeneity of variance or normality regardless of the transformation (loga-rithm, natural logarithm, square root, arcsin). CW measurements at the reef from 1996 and 1997 were compared using a kruskal Wallis test with year as a factor and a second kruskal Wallis test with sex as a factor.
CW measurements made during 1997 at the reef, oyster bar, and sand bar did not satisfy the assumptions of homogeneity of variance or normality regardless of the transformation (logarithm, natural logarithm, square root, arcsin). Individual kruskal Wallis tests were used to compare crab CW across sites and in relation to crab sex.
Results
Environmental data.—Bottom water temperatures measured on the same day at all three sites were within a degree of each other with the exception of May 23, 1997, when oyster bar water temperatures were 1.5 °C less than water tempera-tures at the other two sites. piankatank bottom water temperatures followed similar trends in 1996 and 1997 (Fig. 2A) with temperatures increasing through May (dOy < 152), remaining in the 24–28 °C range throughout June, July, and August, and then decreasing during September (dOy 244-273).
In the tidewater region of virginia, May is typically the end of the spring rainy season and concurrently low salinities (Fig. 2B). The regional dry season is usually from June through November with increasing salinities observed during the warmer months of July, August, and September (Fig. 2B). piankatank bottom salinities ranged from 11 to 14 during 2006 and 14–18 during 2007 (Fig. 2B). In general, regional pre-cipitation levels were higher from May through September 1996 (total precipitation = 82.45 cm) than 1997 (28.73 cm, NOAA Climatological data summaries for West point, virginia (37°34´N, 76°48´W, 1996 and 1997) causing the observed intra-annual differences in piankatank River salinities.
The passage of hurricane Fran over the piankatank watershed on September 6–7, 1996 with locally heavy rainfall caused the reduced salinities observed on dOy 250 (Fig. 2B). Although crab pots were set on September 6, 1996, weather and tide condi-tions prevented their retrieval until September 10 and 11, 1996. data from this crab pot deployment are not included herein because of the difference in soak time (96 hrs vs the regular 24 hrs) and storm related differences in habitat conditions (tides, waves, wind, salinity) that may have affected crab habitat use patterns. daylength reached a maximum (14.85 hrs) at the summer solstice (June 21) and then gradually declined for the rest of the sampling period.
Total Blue Crab CpUE.—Blue crabs were first observed in the piankatank estu-ary at water temperatures > 17 °C in 1996 and 1997 (Table 1). The total number of blue crabs caught on palace Bar oyster reef was 964 and 364 during 1996 and 1997, respectively. Sampling effort on the reef in 1996 (120 pots) was greater than in 1997 (54 pots) with an average reef CpUE of 8.03 crabs pot−1 ± 0.56 standard error of the mean (SE) and 6.74 ± 0.90 SE respectively, for 1996 and 1997. There was no significant difference in total blue crab CpUE at palace Bar reef between 1996 and 1997 (AN-COvA, Table 2, Fig. 3A,B). Water temperature and daylength significantly affected

BULLETIN OF MARINE SCIENCE, vOL. 86, NO. 1, 201080
Figure 2. Summary of water temperature (°C), salinity, and daylength (hr) conditions in the Pi-ankatank River, Virginia during (A) 1996 and (B) 1997. Water temperature and salinity were measured once weekly 0.3 m above the bottom. Daylength for the river was calculated from sun-rise and sunset times (TideLog 1996, 1997). The shaded box indicates the time period when male blue crab abundance declined and female blue crab abundance increased in both years.

hARdING ANd MANN: BLUE CRAB hABITAT USE 81
Tabl
e 2.
Sum
mar
y of
stat
istic
al te
sts u
sed
to d
escr
ibe
blue
cra
b pa
ttern
s of h
abita
t use
. F v
alue
s res
ult f
rom
AN
CO
VAs.
H v
alue
s res
ult f
rom
Kru
skal
Wal
lis te
sts.
Tuke
y’s t
est w
as u
sed
for p
ost-h
oc m
ultip
le c
ompa
rison
s. A
bbre
viat
ions
are
as f
ollo
ws:
PB
R =
Pal
ace
Bar
reef
, GP
= oy
ster
bar
, RP
= sa
nd b
ar. A
ster
isks
indi
cate
st
atis
tical
sign
ifica
nce
at α
= 0
.05.
Test
Res
pons
eFa
ctor
Cov
aria
teF/
H v
alue
P va
lue
Post
-hoc
Mul
tiple
com
paris
on re
sult
AN
CO
VATo
tal c
rab
CPU
E at
oys
ter r
eef (
1996
–199
7)Ye
ar0.
010.
92D
ayle
ngth
26.6
4<
0.01
*11
.7–1
4.2
h >
14.2
5,14
.4–1
4.75
hW
ater
tem
pera
ture
56.8
4<
0.01
*25
> 2
2, 1
8.5
> 18
°CSa
linity
3.06
0.08
AN
CO
VATo
tal c
rab
CPU
E ac
ross
all
site
s (19
97)
Site
6.84
< 0.
01*
GP
> PB
R, R
PD
ayle
ngth
8.41
< 0.
01*
12.3
8 >
13.4
–14.
4 >
14.6
–14.
75W
ater
tem
pera
ture
0.33
0.56
Salin
ity3.
200.
08A
NC
OVA
Prop
ortio
n of
male
s in
CPU
E at
oyste
r ree
f (19
96–1
997)
Year
0.01
0.94
Day
leng
th62
.87
< 0.
01*
13.5
–14.
68 h
> 1
3.4
Wat
er te
mpe
ratu
re0.
150.
70Sa
linity
0.02
0.90
AN
CO
VAPr
opor
tion
of m
ales
in C
PUE
acro
ss a
ll si
tes (
1997
)Si
te1.
820.
17D
ayle
ngth
47.5
9<
0.01
*13
.93
= 14
.6 >
14.
75, 1
4.4
> 12
.38–
13.4
Wat
er te
mpe
ratu
re25
.59
< 0.
01*
25 <
all
othe
rsSa
linity
29.6
4<
0.01
*15
> a
ll ot
hers
, 14
, 17
> 16
, 18
Kru
skal
Wal
lisC
arap
ace
wid
th a
t oys
ter r
eef (
1996
–199
7)Ye
ar43
.23
< 0.
01*
1996
> 1
997
Sex
210.
5<
0.01
*Fe
mal
e >
mal
eK
rusk
al W
allis
Car
apac
e w
idth
acr
oss a
ll si
tes (
1997
)Si
te10
.6<
0.01
*PB
R, R
P >
GP
Sex
128.
17<
0.01
*Fe
mal
e >
mal
e

BULLETIN OF MARINE SCIENCE, vOL. 86, NO. 1, 201082
Figure 3. Average (± standard error of the mean) blue crab catch-per-unit-effort (CPUE) at (A) Palace Bar reef (1996 and 1997) and (B) at all three sites in 1997.

hARdING ANd MANN: BLUE CRAB hABITAT USE 83
reef CpUE (ANCOvA, Table 2). Total reef CpUE increased with increasing water temperatures up to 25 °C and declined at temperatures above 26 °C observed from mid-July through August in both years (Tukey’s test: Table 2). In general, total crab CpUE on the reef was lowest during late July and August when declining daylength coincided with the highest water temperatures (Tukey’s test: Table 2).
The total number of crabs caught on the oyster reef, sand bar, and oyster bar during 1997 was 364, 328, and 495, respectively. Effort was the same across sites sampled in 1997 (a total of 54 pots site−1) with average total daily CpUEs of 6.74 ± 0.90 SE, 6.07 ± 0.65 SE, and 9.17 ± 0.09 SE observed for oyster reef, sand bar, and oyster bar, respec-tively. Total crab CpUE was significantly higher on the oyster bar than on either the oyster reef or the sand bar (ANCOvA, Table 2). In general, more crabs were caught at water temperatures of 25 °C than either at higher (27 °C) or lower temperatures with the lowest non-zero crab catch in 1997 observed at water temperatures of 18.5 °C (Tukey’s test, Table 2). Crab CpUE was highest during September 1997 when lower light levels (12.4–12.5 hrs, Tukey’s test, Table 2) coincided with water temperatures of 25 °C (Fig. 2).
Crab CpUE by Sex.—A late summer reversal in the numerical abundance of sexes was observed in both years and across sites within 1997 (Table 1, Fig. 4). Male crabs composed > 50% of the total catch until dOy 221 (August 8, 1996, reef only) and dOy 246 (September 3, 1997; all three sites) and < 50% afterward (Fig. 4). The dOy 221-246 time frame corresponds to decreasing daylengths from 13.6 hrs to 12.9 hrs, a brief decline in salinities (from 13 to 11), and relatively high water temperatures (1996 = 28 °C, 1997 = 27 °C, Fig. 2).
The proportion of the total CpUE at palace Bar reef composed of male crabs dur-ing 1996 and 1997 was not significantly affected by year, salinity, or water tempera-ture (ANCOvA, Table 2). daylength significantly affected the proportion of male crabs with fewer males collected at daylengths < 13.4 hrs (dOy > 236).
The proportion that male crabs contributed to the total CpUE at the reef, oyster bar and sand bar sampled during 1997 was not significantly affected by site (ANCO-vA, Table 2). Significantly more male crabs were captured at daylengths > 13.5 hrs with the most male crabs observed at daylengths of 13.9 (dOy 217, August 5, 1997) and 14.6 hrs (dOy 157, June 6, 1997; Fig. 4). Significantly more male crabs were ob-served at a salinity of 15 than at all other salinities (ANCOvA, Table 2) and at water temperatures above or below 25 °C (ANCOvA, Table 2).
Crab Carapace Width in Relation to habitat and Sex.—In general, female crabs had significantly larger carapace widths (CW) than male crabs at both reef and non-reef sites and in both years (kruskal Wallis: Tables 2, 3, Figs. 5, 6). In 1997, the largest females were observed at dOy 200 (CW range 126–180 mm) across all sites (Fig. 5). Males with CW of approximately 160 mm were observed in both years at all sites irrespective of dOy (Fig. 6).
Female crabs at palace Bar reef had significantly larger carapace widths in 1997 than in 1996 (kruskal Wallis: Table 2, Figs. 5, 6). In 1997, carapace widths from crabs caught at Ginney point (mean CW = 138.9 ± 0.6 mm SE) were smaller than CW from crabs caught at palace Bar (141.6 ± 0.7 mm SE) and Roane point (141.6 ± 0.8 mm SE; kruskal Walllis: Tables 2, 3). Although this difference in CW between sites is statisti-cally significant at alpha = 0.05, the difference in the upper CW confidence interval at Ginney point and the lower CW confidence interval from palace Bar and Roane point is < 2 mm and may not be biologically significant.

BULLETIN OF MARINE SCIENCE, vOL. 86, NO. 1, 201084
Figure 4. Average proportion (± standard error of the mean) of the total number of blue crab catch as males over time at (A) Palace Bar Reef (1996 and 1997) and (B) at all three sites in 1997.

hARdING ANd MANN: BLUE CRAB hABITAT USE 85
discussion
Blue crabs used all three habitat types examined in the piankatank River, virginia. Crabs were first observed in the estuary at water temperatures above 17 °C in 1996 and 1997. While the lower size limit in this study was set by the sampling gear at approximately 100 mm CW, crabs of both sexes > 150 mm CW were observed at all sites in both years. Seasonal estuarine migration patterns by sexes are related to ambient light levels (daylength) and are similar to previously described migrations in Chesapeake tributaries (Churchill, 1919; van Engel, 1958; hines et al., 1987).
The annual average CpUE on palace Bar reef was 6–8 crabs pot−1 with maximum CpUEs of 15 crabs pot−1 in both 1996 and 1997. The annual average CpUEs observed at these sites in the piankatank River are similar to the annual average CpUEs of 4–6 crabs pot−1 observed near Calvert Cliffs, Maryland in 1996 and 1997 (Abbe, 2002). Similar seasonal trends in reef CpUE were observed in both years with the highest CpUEs observed in early September (approximately dOy 250) as both water temper-atures and daylength were declining during the summer to fall transition. In 1997, the average annual CpUE at the natural oyster bar was higher (9 crabs pot−1) than the either reef or the sand bar (both 6–7 crabs pot−1). Observed differences in habitat use between these three sites may be related to site-specific differences in depth and tidal current as well as the presence of living oyster (biogenic) substrate and associ-ated food resources (see below). The natural oyster bar, Ginney point, had a relatively uniform depth of approximately 3 m and is located at a bend in the piankatank River where tidal currents sweep across the oyster bar, which is perpendicular to the chan-nel and tidal currents. It is deeper than either the reef (1–2 m) or the sand bar (2 m) and may offer more protection from visual predators during daylight hours (Sogard and Able, 1994; posey et al., 1999). A wider size range of both sexes was consistently observed at the natural oyster bar than at either of the oyster sites. The abundance of bluefish and striped bass was greater around the three dimensional oyster reef than at the other two habitat types observed in this time frame (harding and Mann, 2001b). Blue crabs were consumed by both bluefish (harding and Mann, 2001a) and striped bass (harding and Mann, 2003).
diurnal patterns in crab habitat use within a site or across sites are unknown be-cause sampling was at 24 hr intervals and integrated any diurnal variation. The oys-ter bar may also have offered a relative thermal refuge and more available foraging habitat during the warmest days of summer, particularly if low tide was in the middle of the day. As reef mounds were exposed by the outgoing waters, the availability of forage habitat declined with a concurrent reduction of water circulation around
Table 3. Summary of crab carapace width measurements (CW, mm) for female and male crabs by year and site. Only Palace Bar oyster reef was sampled in 1996 (12 pots wk–1). In 1997, 6 pots wk–1 were used at all three sites.
Site Yearn
femalesfemale
CW rangemedian
female CW n malesmale
CW rangemedian
male CWPalace Bar oyster reef 1996 589 84–170 140 375 104–165 130Palace Bar oyster reef 1997 197 100–182 145 167 108–155 137Ginney Point oyster bar 1997 212 110–180 145 285 98–170 135Roane Point sand bar 1997 144 100–178 147 180 100–180 135

BULLETIN OF MARINE SCIENCE, vOL. 86, NO. 1, 201086
Figure 5. Box whisker plots of carapace width (mm) over time for female blue crabs collected from Palace Bar reef (A: 1996, B: 1997), (C) Ginney Point (1997), and (D) Roane Point (1997). The solid horizontal line in each plot is the median CW of all female crabs captured within that year (1996 = 140 mm, n = 589; 1997 = 145.5 mm, ns = 554). N values for each collection date are given above the x axis. ns = not sampled.

hARdING ANd MANN: BLUE CRAB hABITAT USE 87
Figure 6. Box whisker plots of carapace width (mm) over time for male blue crabs collected from Palace Bar reef (A: 1996, B: 1997), (C) Ginney Point (1997), and (D) Roane Point (1997). The solid horizontal line in each plot is the median CW of all male crabs captured within that year (1996 = 130, n = 375, 1997 = 135 mm, n = 632). N values for each collection date are given above the x axis. ns = not sampled.

BULLETIN OF MARINE SCIENCE, vOL. 86, NO. 1, 201088
mounds and the potential for localized water temperature increases at very shallow sites on the reef.
A transition in the sex ratio of crabs was observed as daylength declined season-ally in the August-early September time frame. In May, males were 3–5 times more abundant than females at all sites. Male crabs were more abundant than females at all sites when daylengths were above 13.4 hrs. By early September, as both daylengths and water temperatures declined, female crabs were 3–4 times more abundant than males at all sites. Late summer migrations of male crabs to up-river habitats are typi-cal in Chesapeake estuaries (Churchill, 1919; van Engel, 1958; hines et al., 1987). Aguilar et al. (2005) showed that post-copulatory females in the upper Bay do not migrate from mating areas within the tributaries until the fall (September–Novem-ber). The large numbers of female crabs observed in the piankatank River in early September may reflect the onset of the seasonal migration toward down-Bay spawn-ing habitats. We may have captured both female crabs that mated in the piankatank as well as those migrating from upper Bay sites that diverted into the piankatank to take advantage of shallow foraging grounds while water temperatures were relatively warm.
Seasonal changes in crab size were also observed. Spring collections included smaller individuals and sexes were similarly sized; typically < 140 mm CW). The me-dian size of both males and females increased in the summer months. Abbe (2002) also observed a gradual increase in CW with season from 1998 through 2000 for male crabs collected in Maryland in the patuxent River and near Calvert Cliffs. Fe-male crabs were typically larger than males from the same piankatank habitats across all habitats with the largest female crabs observed in habitats with oysters. This sex-based shift in demographics is likely the result of seasonal growth and migration of females that were forced to overwinter in the tributary or up-Bay to higher salinity spawning sites down-Bay (Churchill, 1919; van Engel, 1958). Similar demographics were observed by hines et al. (1987) in the Rhode River, another small western shore Chesapeake tributary. data sets such as this one describing the seasonal dynamics of blue crab habitat use by sex and size provide information that could be applied by fishery managers toward rotational area closures designed to protect spawning stock and the habitats that they seasonally occupy.
Crabs are mobile benthic predators that undergo ontogenetic shifts in habitat use (e.g., Orth and von Montfrans, 1987) with mature crabs using a range of estuarine habitat types when they are available. The sand bar, oyster bar, and oyster reef sites examined represent a gradient of increasing structural complexity for crab foraging sites. The increased structural complexity offered by biogenic oyster habitats attracts species from all tropic levels (e.g., Wells, 1961; Coen et al., 1999; harding and Mann, 1999; Glancy et al., 2003; peterson et al., 2003) while providing protected settlement habitat for oysters (Bartol and Mann, 1999; Grabowski, 2004), which in turn, main-tains the biogenic structure. Seitz et al. (2003) describe food availability as the main factor controlling blue crab densities at spatial scales < 10 km. Estimates of oyster reef restoration effects by peterson et al. (2003) suggest that oyster reef restoration enhances crab production locally by increasing structural habitat and food resourc-es. Efforts to rebuild natural oyster populations and the biogenic structure offered by either natural bars or three dimensional reefs will provide inherent habitat benefits to crab populations given the dual enhancement of the forage base and habitat het-erogeneity provided by biogenic oyster habitats.

hARdING ANd MANN: BLUE CRAB hABITAT USE 89
Acknowledgments
Support for this project was provided by the U.S. Environmental protection Agency Chesa-peake Bay program (CB993267-02-1, CB993267-03-1, and CB993777-01) and the department of Fisheries Science, virginia Institute of Marine Science. The following individuals gracious-ly donated their time to assist with field sampling: F. Arazyus, k. Arazyus, I. Bartol, R. Boger, S. Brooke, J. Brust, N. Clark, v. Clark, C. Conrath, S. drake, J. duggan, k. Farnsworth, C. Fen-nessy, J. Goins, S. Goodbred, A. hayes, E. hinchey, k. hovel, d. kerstetter, T. Lewis, J. Nes-tlerode, M. Neubauer, S. Neubauer, J. Newton, J. Oliver, C. Robertson, v. Roggero, W. Rose, h. Simpkins, M. Southworth, C. Squyars, B. Trainum, M. Wagner, k. Walker, J. Walter, G. White, and h. yarnall. This paper is Contribution Number 3043 from the virginia Institute of Marine Science, College of William and Mary, Gloucester point, virginia.
Literature Cited
Abbe, G. 2002. decline in size of male blue crabs (Callinectes sapidus) from 1968 to 2000 near Calvert Cliffs, Maryland. Estuaries 25: 105–114.
Andrews, J. 1979. pelecypoda: Ostreaidae. pages 293–341 in A. C. Giese and J. S. pearse, eds. Reproduction of marine invertebrates. volume v. Molluscs: pelecypods and lesser classes. Academic press, New york.
Anguilar, R., A. hines, T. Wolcott, d. Wolcott, M. kramer, and R. Lipcius. 2005. The timing and route of movement and migration of post-copulatory female blue crabs, Callinectes sapidus Rathbun, from the upper Chesapeake Bay. J. Exp. Mar. Biol. Ecol. 319: 117–128.
Bartol, I. k. and R. Mann. 1997. Small-scale settlement patterns of the oyster Crassostrea virgi-nica on a constructed intertidal reef. Bull. Mar. Sci. 61: 881–897.
__________ and ______. 1999. Growth and mortality of oysters (Crassostrea virginica) on con-structed intertidal reefs: effects of tidal height and substrate level. J. Exp. Mar. Biol. Ecol. 237: 157–187.
Chen, h., p. hyer, A. kuo, and C. Fang. 1977. hydrography and hydrodynamics of virginia estuaries. xI. Mathematical model studies of water quality of the piankatank estuary. Spe-cial Report No 124 in Applied Science and Ocean Engineering, virginia Institute of Marine Science, Gloucester point. 80 p.
Churchill, E. 1919. Life history of the blue crab. Bull. U.S. Bureau of Fisheries. vol. xxxvI. 1917-1918. 136 p.
Climatological data for virginia. National Oceanic and Atmospheric Adminstration, dept of Commerce. vol 107(4 through 9) and vol 108(4 through 9).
Coen, L., M. Luckenbach, and d. Breitburg. 1999. The role of oyster reefs as essential fish habi-tat: a review of current knowledge and some new perspectives. pages 438–454 in L. R. Benaka, ed. Fish habitat: essential fish habitat and rehabilitation. American Fisheries Soci-ety. Bethesda.
Fitz, h. and R. Wiegert. 1991. Utilization of the intertidal zone of a salt marsh by the blue crab Callinectes sapidus: density, return frequency, and feeding habits. Mar. Ecol. prog. Ser. 76: 249–260.
Glancy, T., T. Frazer, C. Cichra, and W. Lindberg. 2003. Comparative patterns of occupancy by decapod crustaceans in seagrass, oyster, and marsh-edge habitats in a northeast Gulf of Mexico estuary. Estuaries 26: 1291–1301.
Grabowski, J. 2004. habitat complexity disrupts predator-prey interactions but not the trophic cascade on oyster reefs. Ecology 85: 995–1004.
harding, J. M. and R. Mann. 1999. Fish species richness in relation to restored oyster reefs, piankatank River, virginia. Bull. Mar. Sci. 65: 289–300.
____________ and _______. 2000. Estimates of naked goby (Gobiosoma bosc), striped blen-ny (Chasmodes bosquianus) and eastern oyster (Crassostrea virginica) larval production around a restored Chesapeake Bay oyster reef. Bull. Mar. Sci. 66: 29–45.

BULLETIN OF MARINE SCIENCE, vOL. 86, NO. 1, 201090
____________ and _______. 2001a. diet and habitat use by bluefish, pomatomus saltatrix, in a Chesapeake Bay estuary. Environ. Biol. Fishes. 60: 401–409.
____________ and _______. 2001b. Oyster reefs as fish habitat: opportunistic use of restored reefs by transient fishes. J. Shellfish Res. 20: 951–959.
____________ and _______. 2003. Influence of habitat on diet and distribution of striped bass (Morone saxatilis) in a temperate estuary. Bul. Mar. Sci. 72: 841–851.
hargis, W. J., Jr. and d. S. haven. 1999. Chesapeake oyster reefs, their importance, destruction and guidelines for restoring them. pages 328–359 in M. W. Luckenbach, R. Mann, and J. A. Wesson, eds. Oyster reef habitat restoration: a synopsis and synthesis of approaches. virginia Institute of Marine Science press, Gloucester point.
haven, d. S., J. Whitcomb, and p. kendall. 1981. The present and potential productivity of the Baylor Grounds in virginia. virginia Institute of Marine Science, Special Report Applied Marine Science and Ocean Engineering No 243, 154 p.
hines, A., R. Lipcius, and A. haddon. 1987. population dynamics and habitat partioning by size, sex, and molt stage of blue crabs Callinectes sapidus in a subestuary of central Chesa-peake Bay. Mar. Ecol. prog. Ser. 36: 55–64.
________, T. G. Wolcott, E. Gonzalez-Gurriaran, J. L. Gonzalez-Gurriaran, and J. Friere. 1995. Movement patterns and migrations in crabs: telemetry studies of juvenile and adult behav-ior in Callinectes sapidus and Maja squinado. J. Mar. Biol. Assoc. U. k. 75: 27–42.
Lenhert, R. and d. Allen. 2002. Nekton use of subtidal oyster shell habitat in a Southeastern US estuary. Estuaries 25: 1015–1024.
Mann, R., F. perkins, J. Wesson, and I. Bartol. 1996. Intertidal oyster reefs as a tool for estuarine rehabilitation and rejuvenation of the virginia oyster fishery. Final report submitted to the department of Environmental Quality, virginia Coastal Resource Management program, Richmond. 129 p.
Mann, R. and J. M. harding. 1997. Trophic studies on constructed “restored” oyster reefs. Final report (CB993267-02-1) submitted to the U.S. Environmental protection Agency, Chesa-peake Bay program Office, Annapolis.
_______ and ___________. 1998. Continuing trophic studies on constructed “restored” oyster reefs. Final report (CB993267-03) submitted to the U.S. Environmental protection Agency, Chesapeake Bay program Office, Annapolis.
Meyer, d. and E. Townsend. 2000. Faunal utilization of created intertidal eastern oyster (Crassostrea virginica) reefs in the southeastern United States. Estuaries 23: 34–45.
Millikin, M. and A. Williams. 1984. Synopsis of biological data on the blue crab Callinectes sapidus, Rathbun. NOAA Tech. Rep. NMFS 1, FAO Fisheries Synopsis No. 138. US depart-ment of Commerce. 39 p.
Minello, T. 1999. Nekton densities in shallow estuarine habitats of Texas and Louisiana and the identification of essential fish habitat. pages 43–75 in L. Benaka, ed. Fish habitat: essential fish habitat and rehabilitation. American Fisheries Society, Bethesda.
Orth, R. 1977. The importance of sediment stability in seagrass communities. pages 281–300 in B. C. Coull, ed. Ecology of marine benthos. Univ. of South Carolina press, Columbia.
Orth, R. J. and J. von Montfrans. 1987. Utilization of a seagrass meadow and a marsh tidal creek by blue crabs Callinectes sapidus. 1. Seasonal and annual variations in abundance with em-phasis on post-settlement juveniles. Mar. Ecol. prog. Ser. 41: 283–294.
________ and k. Moore. 1983. Chesapeake Bay: an unprecedented decline in submerged aquatic vegetation. Science 222: 51–53.
peterson, C., J. Grabowski, and S. powers. 2003. Estimated enhancement of fish production resulting from restoring oyster reef habitat: quantitative valuation. Mar. Ecol. prog. Ser. 264: 249–254.
posey, M., T. Alpin, C. powell, and E. Townsend. 1999. Oyster reefs as habitat for fish and decapods. pages 229–237 in M. W. Luckenbach, R. Mann, and J. A. Wesson, eds. Oyster reef habitat restoration: a synopsis and synthesis of approaches. virginia Institute of Marine Science press, Gloucester point.

hARdING ANd MANN: BLUE CRAB hABITAT USE 91
Rothschild, B. J., J. Ault, p. Goulletquer, and M. heral. 1994. decline of the Chesapeake Bay oyster population: a century of habitat destruction and overfi shing. Mar. Ecol. prog. Ser. 111: 29–39.
Seitz, R., R. Lipcius, and M. Seebo. 2005. Food availability and growth of the blue crab in sea-grass and unvegetated nurseries of Chesapeake Bay. J. Exp. Mar. Biol. Ecol. 319: 57–68.
_______, R. Lipcius, W. Stockhausen, k. delano, M. Seebo, and p. Gerdes. 2003. potential bottom-up control of blue crab distribution at various spatial scales. Bull. Mar. Sci. 72: 471–490.
Sogard, S. and k. Able. 1994. diel variation in immigration of fi shes and decapod crustaceans to artifi cial seagrass habitat. Estuaries 17: 622–630.
Th omas, J., R. zimmerman, and T. Minello. 1990. Abundance patterns of juvenile blue crabs (Callinectes sapidus ) in nursery habitats of two Texas bays. Bull. Mar. Sci. 46: 115–125.
van Engel, W. 1958. Th e blue crab and its fi shery in Chesapeake Bay. part 1: reproduction, early development, growth, and migration. Comm. Fish. Rev. 20: 6–17.
virnstein, R. 1977. Th e importance of predation by crabs and fi shes on benthic infauna in Chesapeake Bay. Ecology 58: 1199–1217.
Wells, h. 1961. Th e fauna of oyster beds, with special reference to the salinity factor. Ecol. Monogr. 31: 239–266.
Wilson, k., k. heck, Jr., and k. Able. 1987. Juvenile blue crab, Callinectes sapidus, survival: an evaluation of eelgrass, Zostera marina, as refuge. Fish. Bull. 85: 53–58.
zar, J. h. 1996. Biostatistical analysis. 3rd ed. prentice hall, Upper Saddle River. 662 p.
date Submitted: 13 March, 2009.date Accepted: 29 September, 2009.Available Online: 19 October, 2009.
Address: department of Fisheries Science, Virginia institute of Marine Science, p.O. Box 1346, Gloucester point, Virginia 23062. Corresponding Author: (J.M.h.) e-mail: <[email protected]>.