Observations of Atmospheric Phenomena from … of Atmospheric Phenomena from USArray and ANZA...
85
Observations of Atmospheric Phenomena from USArray and ANZA Observing Systems Text Frank Vernon Antelope User Group Meeting Muscat, Oman 2-4 March 2013 Wednesday, May 29, 13
Transcript of Observations of Atmospheric Phenomena from … of Atmospheric Phenomena from USArray and ANZA...
Observations of Atmospheric Phenomena from
USArray and ANZA ObservingSystems
Text
Frank Vernon
Antelope User Group MeetingMuscat, Oman
2-4 March 2013
Wednesday, May 29, 13
Array Network Facility
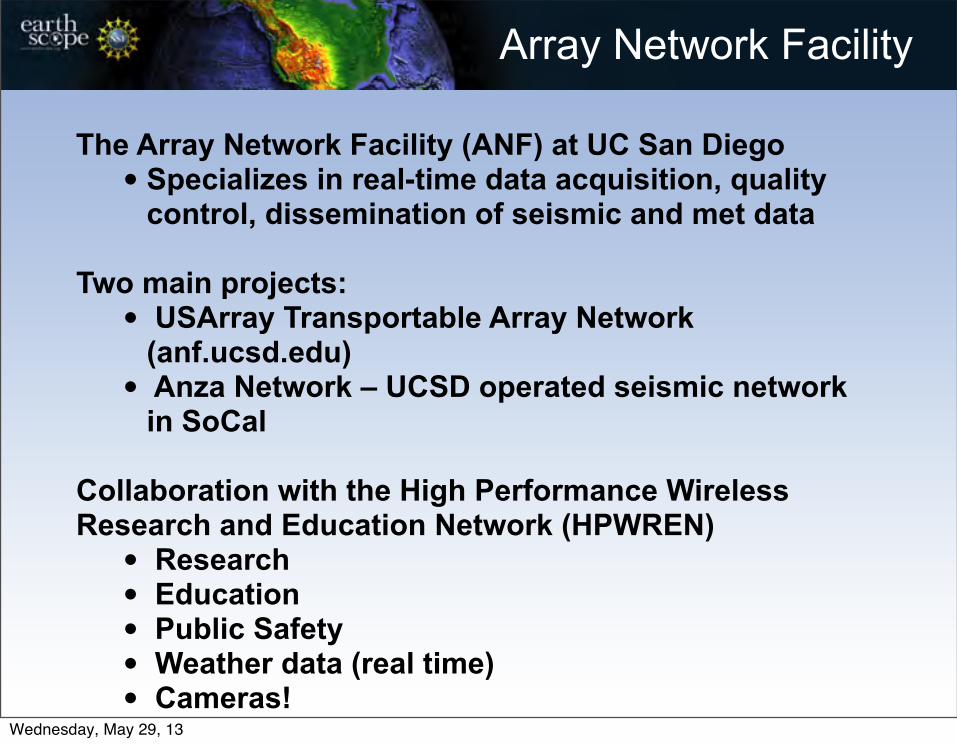
The Array Network Facility (ANF) at UC San Diego• Specializes in real-time data acquisition, quality
control, dissemination of seismic and met data
Two main projects:• USArray Transportable Array Network
(anf.ucsd.edu)• Anza Network – UCSD operated seismic network
in SoCal
Collaboration with the High Performance Wireless Research and Education Network (HPWREN)
• Research• Education• Public Safety• Weather data (real time)• Cameras!
Wednesday, May 29, 13

Acknowledgements
EarthScope is funded by the National Science Foundation.
EarthScope is being constructed, operated, and maintained as a collaborative effort with UNAVCO, IRIS, and Stanford University, with contributions from the US Geological
Survey, NASA and several other national and international organizations.
Wednesday, May 29, 13
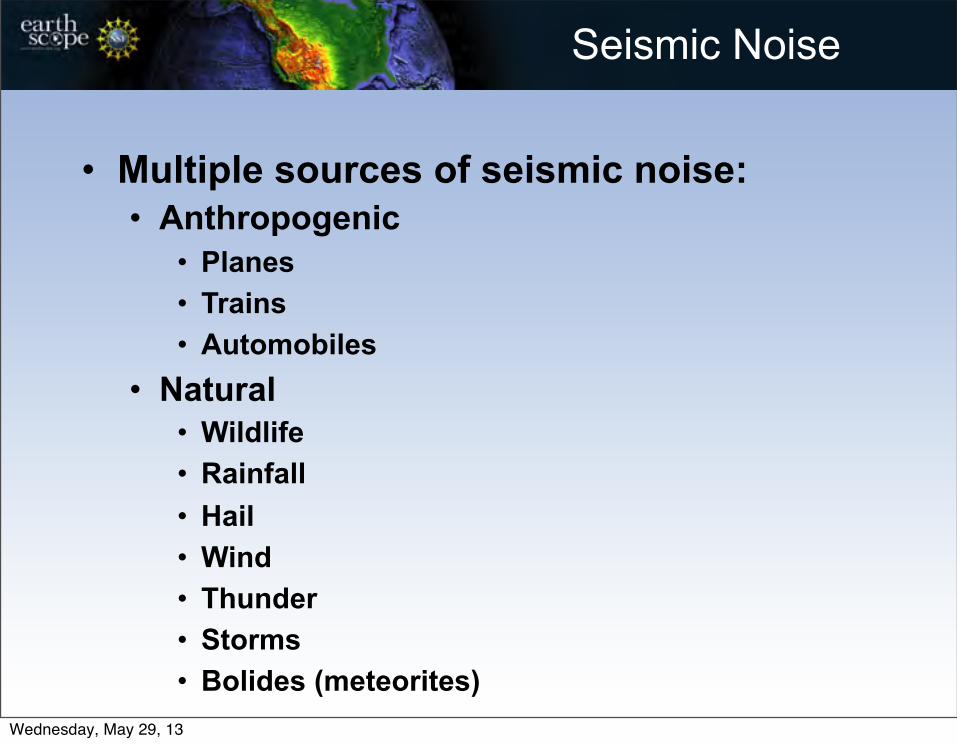
Seismic Noise
• Multiple sources of seismic noise:• Anthropogenic
• Planes• Trains• Automobiles
• Natural• Wildlife• Rainfall • Hail • Wind• Thunder• Storms• Bolides (meteorites)
Wednesday, May 29, 13
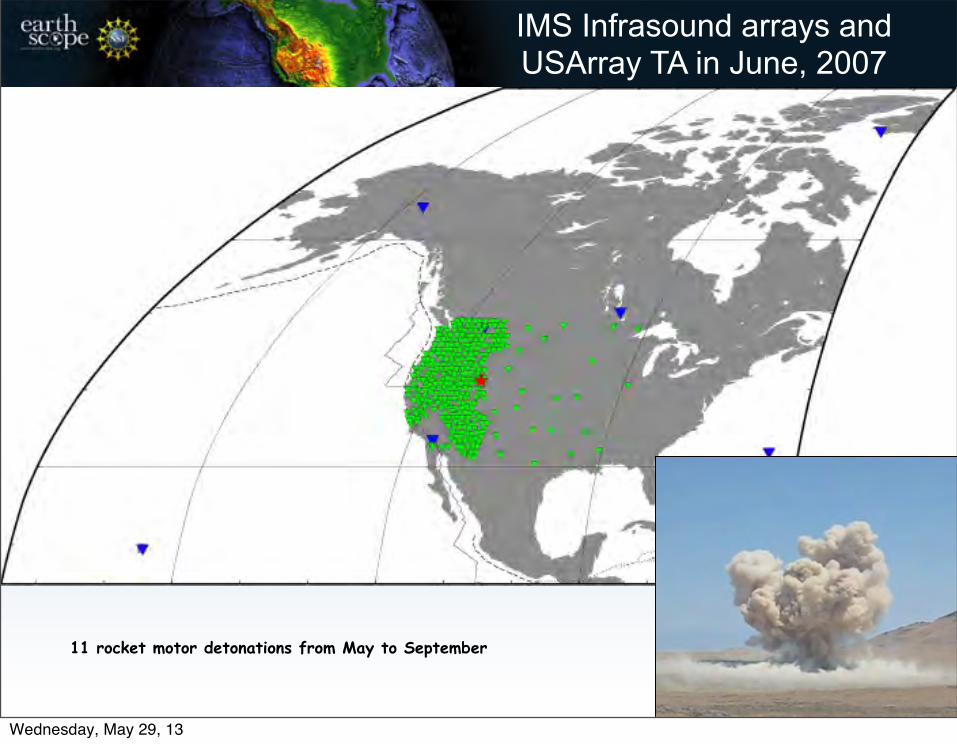
IMS Infrasound arrays and USArray TA in June, 2007
11 rocket motor detonations from May to September
Wednesday, May 29, 13

IMS Infrasound arrays and USArray TA in June, 2007
Wednesday, May 29, 13
Wednesday, May 29, 13
• A bolide burst above NE Oregon at 05:30 AM local time on Feb 19, 2008
• The event was recorded by 4 infrasound arrays and several hundred seismic stations in the USArray and regional networks
• The seismic stations reveal how infrasound signals vary with range and azimuth
• Celerity (horizontal distance traveled/travel time) vs range plots may shed light on propagation paths and provide useful information about atmospheric structure
Oregon Bolide 2008-02-19
Wednesday, May 29, 13

I57US
Seismic stns in redrecording from I56US
297 km
1700 km
1350 km
800 km
Wednesday, May 29, 13
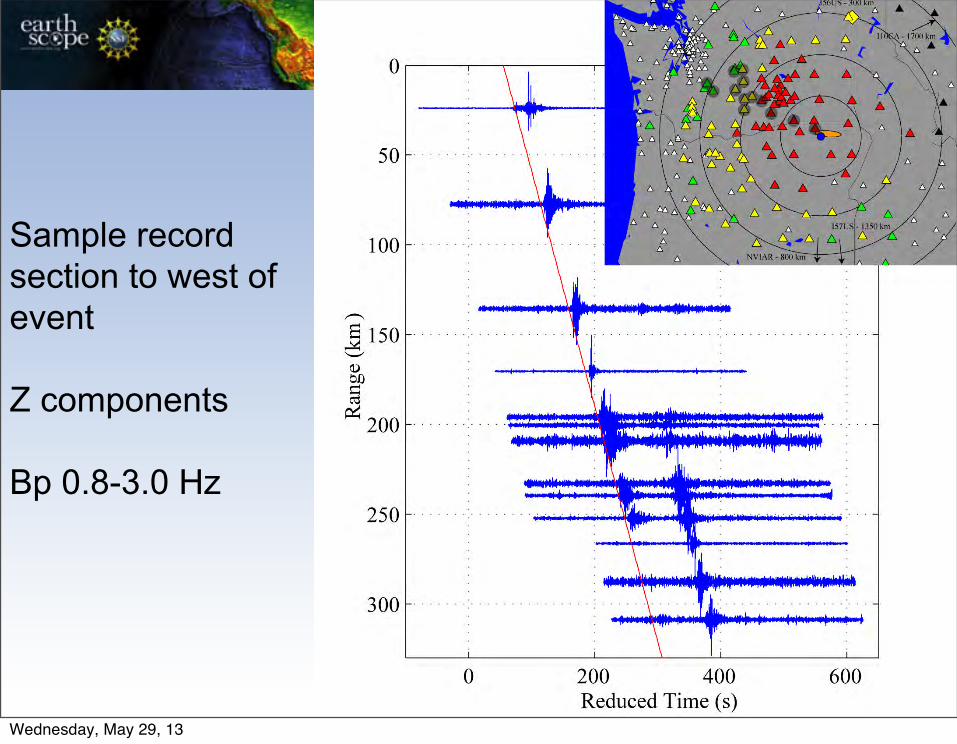
Sample record section to west of event
Z components
Bp 0.8-3.0 Hz
Wednesday, May 29, 13
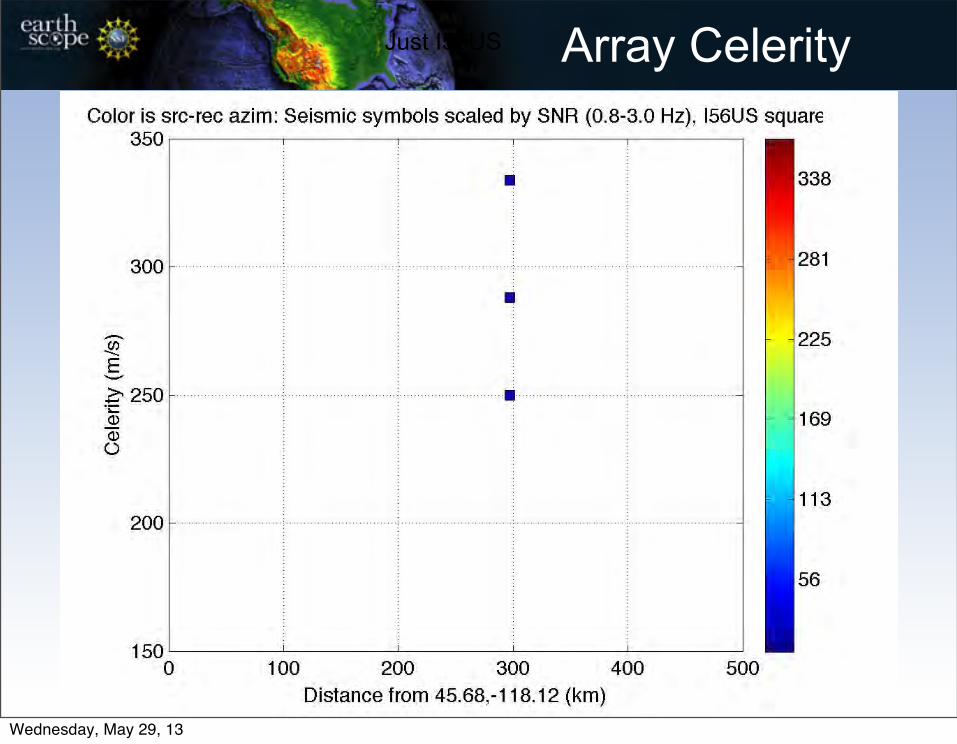
Array CelerityJust I56US
Wednesday, May 29, 13
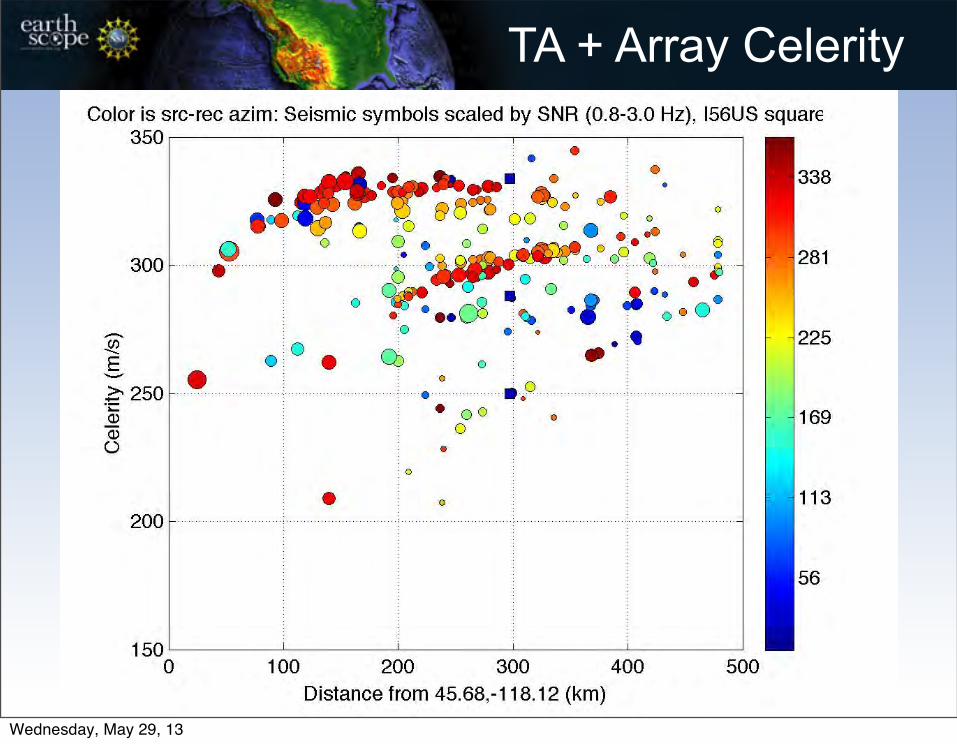
TA + Array Celerity
Wednesday, May 29, 13

Acoustic branchesHedlin et al 2010
Wednesday, May 29, 13

Pressure Sensor ResponseEvents reviewed by ANF, 4/2004 - 9/2011
8
• Overlapping pass-bands provides continuous coverage from DC to 20 Hz
8
MEMS BarometerEP - LDM
Setra BarometerEP - LDO, EP - BDO
NCPA Infrasound MicrophoneEP - LDF, EP - BDF
Wednesday, May 29, 13
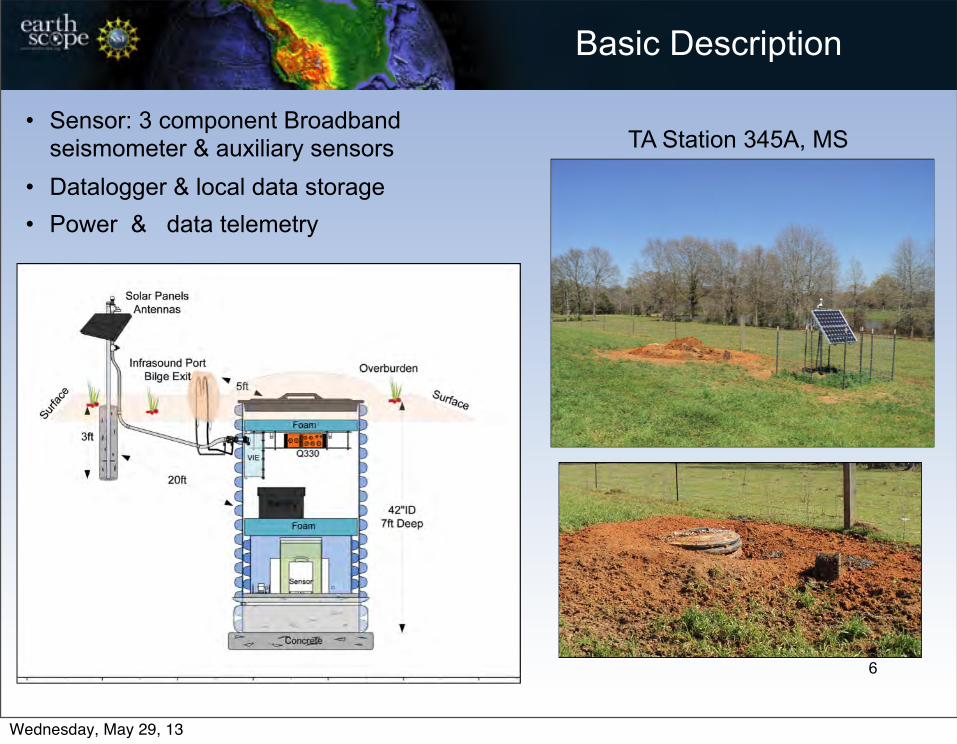
Basic Description
• Sensor: 3 component Broadband seismometer & auxiliary sensors
• Datalogger & local data storage• Power & data telemetry
6
TA Station 345A, MS
Wednesday, May 29, 13

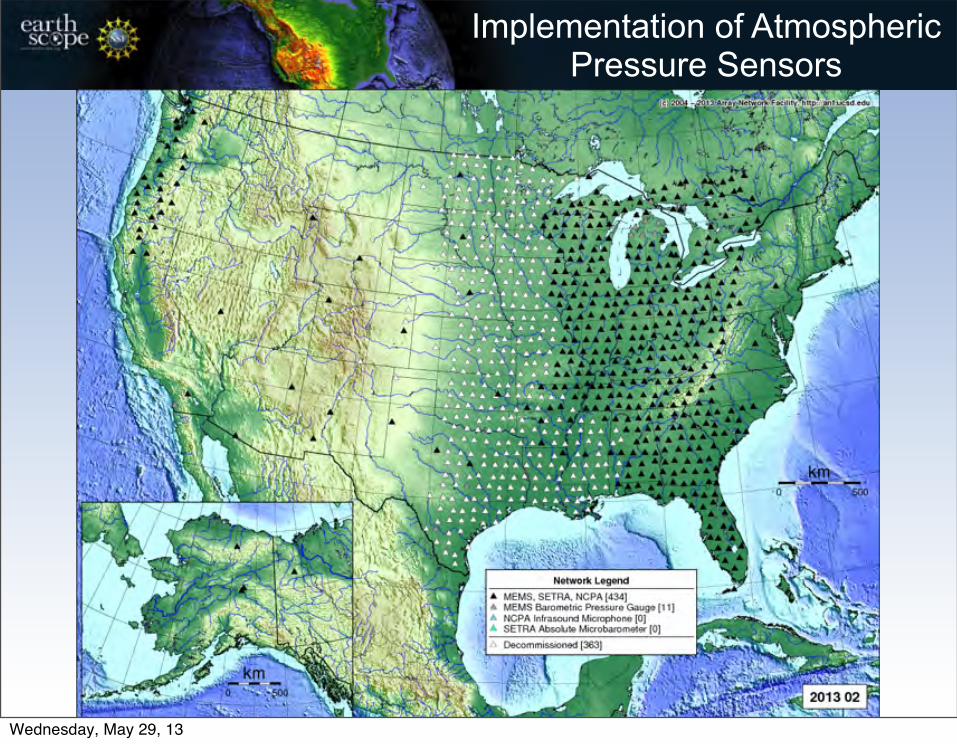
Implementation of Atmospheric Pressure Sensors
Wednesday, May 29, 13

Pressure Observations• Pressure and infrasound at
every TA station• Sampled at 40 samples per
second• Pressure fluctuations from DC
to 20 Hz• Multiple applications
• Noise induced on vertical and horizontal seismic channels
• Meso-scale atmosphere variation• Acoustic energy propagating in the
atmosphere• Acoustic – seismic coupling
MesoWest is accessing data via web services
Wednesday, May 29, 13
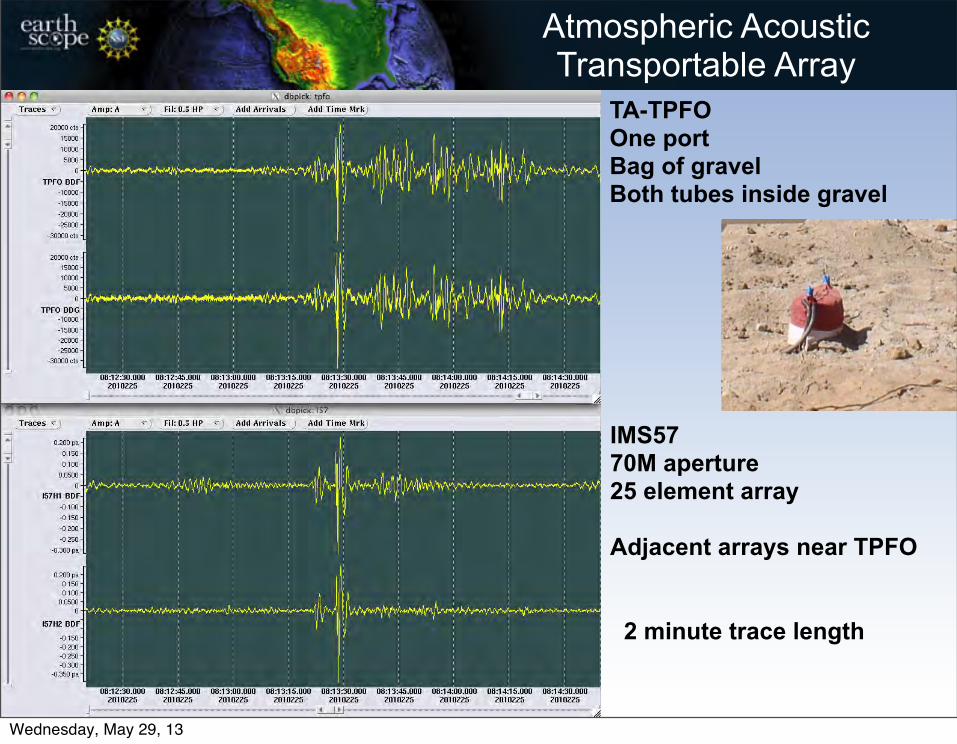
Atmospheric Acoustic Transportable Array
IMS57 70M aperture 25 element array
Adjacent arrays near TPFO
TA-TPFO One portBag of gravelBoth tubes inside gravel
2 minute trace length
Wednesday, May 29, 13
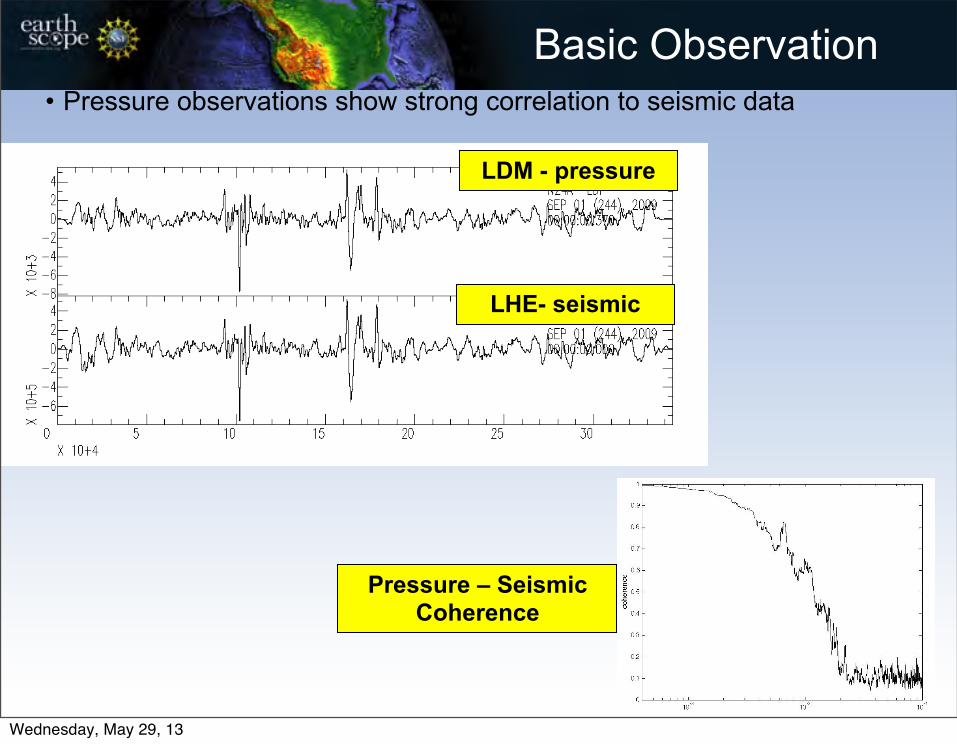
Basic Observation• Pressure observations show strong correlation to seismic data
LDM - pressure
LHE- seismic
Pressure – Seismic Coherence
Wednesday, May 29, 13

Pressure-Ground motion
• Pressure-seismic coherence is well observed for both vertical and horizontal components• Multiple studies have used the pressure signal as a means of de-
noising the seismic data
• Vertical component• At long periods (e.g., 2-4 mHz) verticals have a gravity contribution
from the mass of air and deformation effect (Zürn & Widmer, 1995)
• Horizontal components• Pressure fluctuations introduce multiple tilt effects (Sorrells, 1971)• Traveling Wave Model
• Depends on pressure variation in time and space• Local Deformation Model
• Depends on time variation of pressure, not spatial variation• Assumed to be specific to local site - collective response of sensor, vault,
local site conditions , . . .• Like pushing on a three-legged stool with one weak leg – the result of
pressure fluctuations from above will produce tilt in the same directionWednesday, May 29, 13

Method• Use 30 day time series, bandpass filtered 2,000 s – 100 s• Sliding ~3 hour window, 50% overlap• Compute coherence in band around 1,000 s
• Rotate horizontals to maximize coherence• Process several months of data
• ~450 coherence estimates per station per month• Plow through noise, earthquakes, etc.
• Focus on spatial characteristics of pressure-seismic coherence, not amplitude relationship (e.g., admittance)
“poor” fit @320° best fit @ 200°C28AAug 2010
Wednesday, May 29, 13
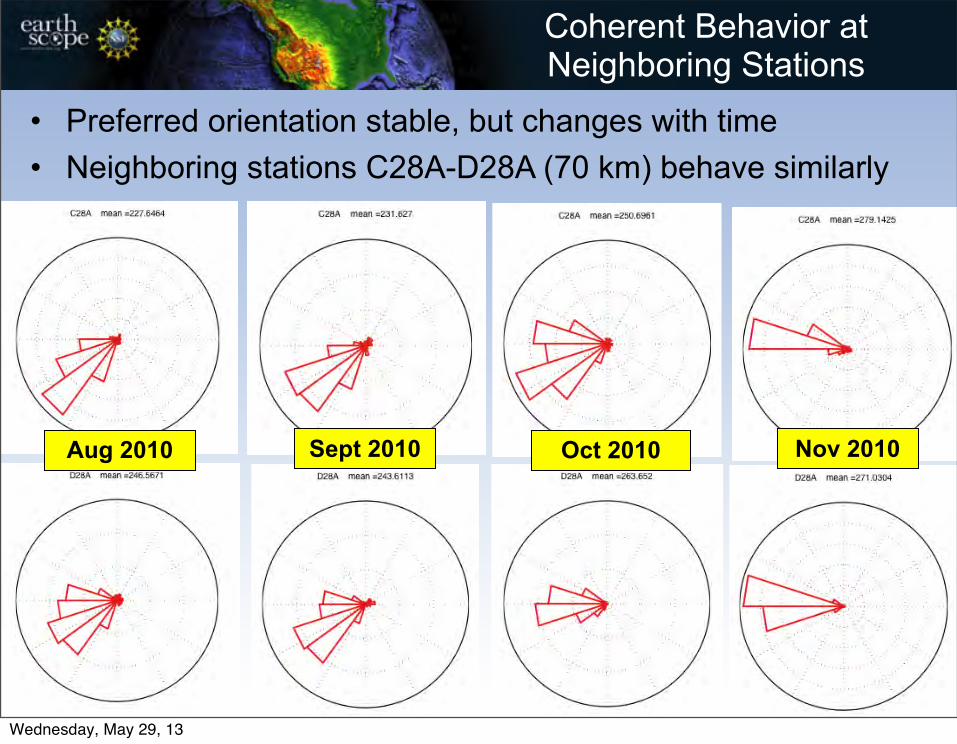
Coherent Behavior at Neighboring Stations
Oct 2010 Nov 2010Aug 2010 Sept 2010
• Preferred orientation stable, but changes with time• Neighboring stations C28A-D28A (70 km) behave similarly
Wednesday, May 29, 13
Implementation of Atmospheric Pressure Sensors
Wednesday, May 29, 13

• Strange signals
• Correlated across stations
• Slow move out
• Too slow for seismic
• Too slow for infrasound
8 Hours
Wednesday, May 29, 13

• Strange signals
• Correlated across stations
• Slow move out
• Too slow for seismic
• Too slow for infrasound
8 Hours
Wednesday, May 29, 13
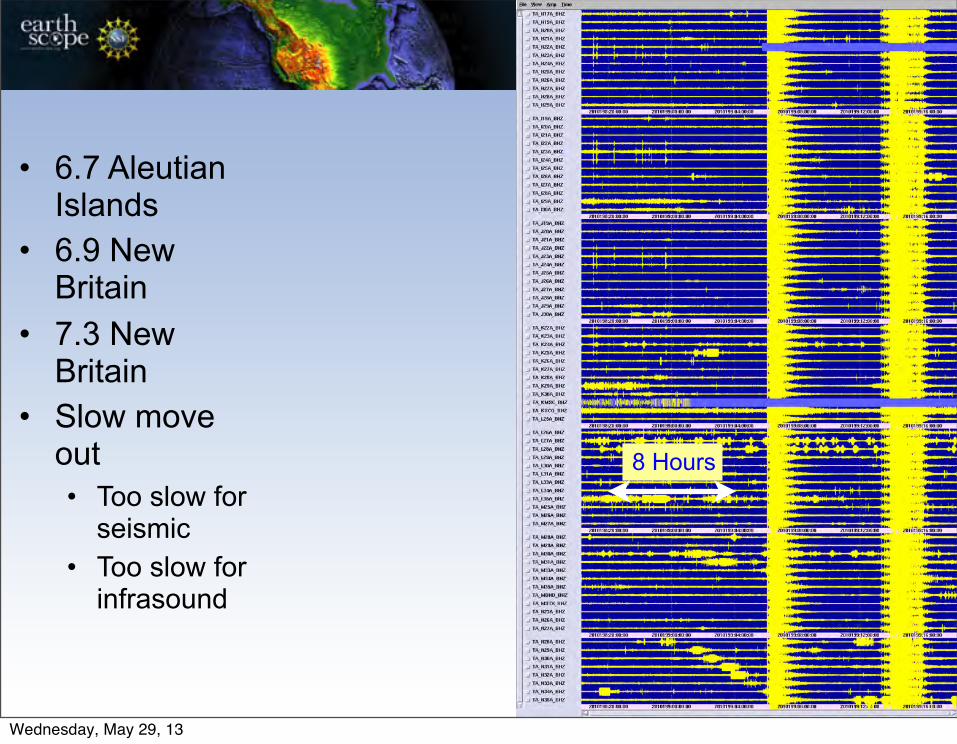
• 6.7 Aleutian Islands
• 6.9 New Britain
• 7.3 New Britain
• Slow move out• Too slow for
seismic• Too slow for
infrasound
8 Hours
Wednesday, May 29, 13

• 6.7 Aleutian Islands
• 6.9 New Britain
• 7.3 New Britain
• Slow move out• Too slow for
seismic• Too slow for
infrasound
8 Hours
Wednesday, May 29, 13

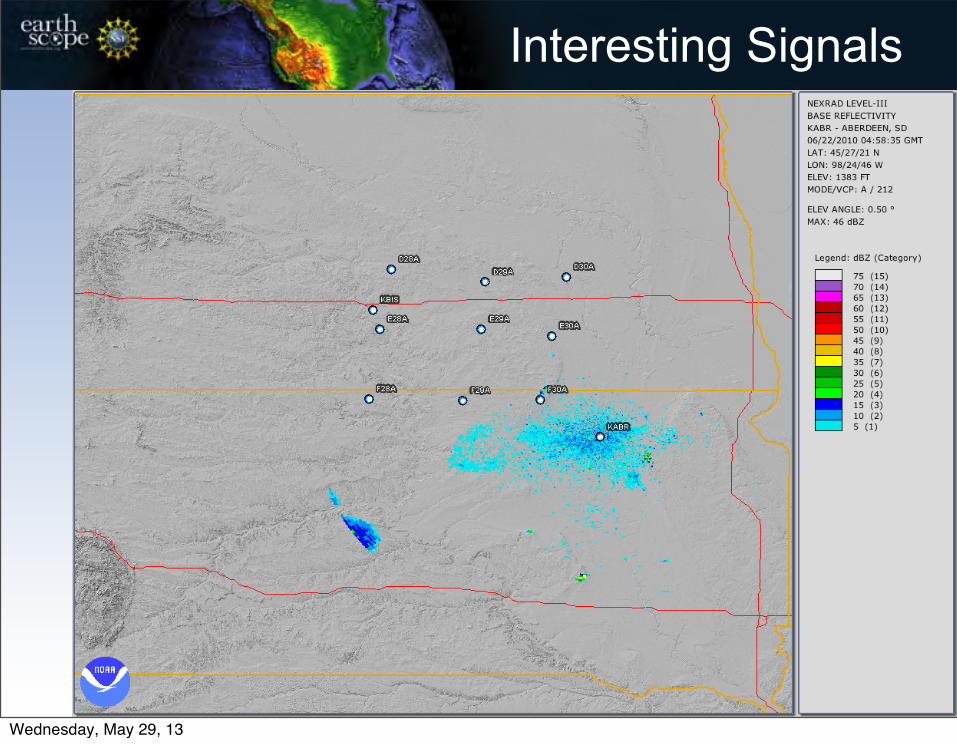
Interesting Signals
40 sps
Unfiltered
Wednesday, May 29, 13

Interesting Signals
40 sps
DC - 0.01 Lowpass Filter
Wednesday, May 29, 13
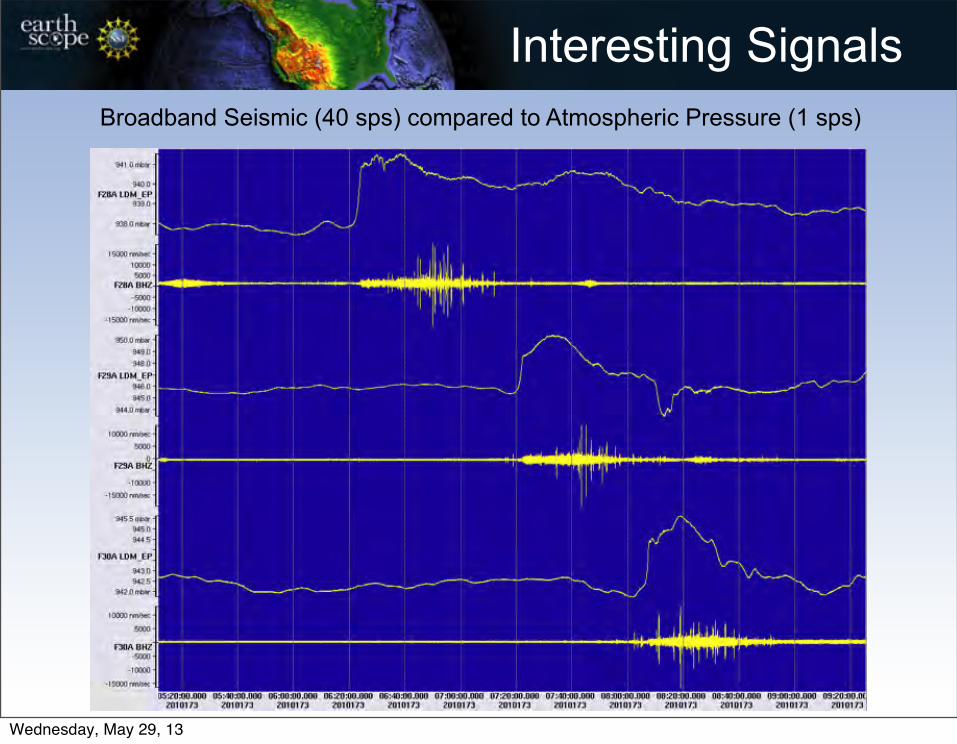
Interesting SignalsBroadband Seismic (40 sps) compared to Atmospheric Pressure (1 sps)
Wednesday, May 29, 13
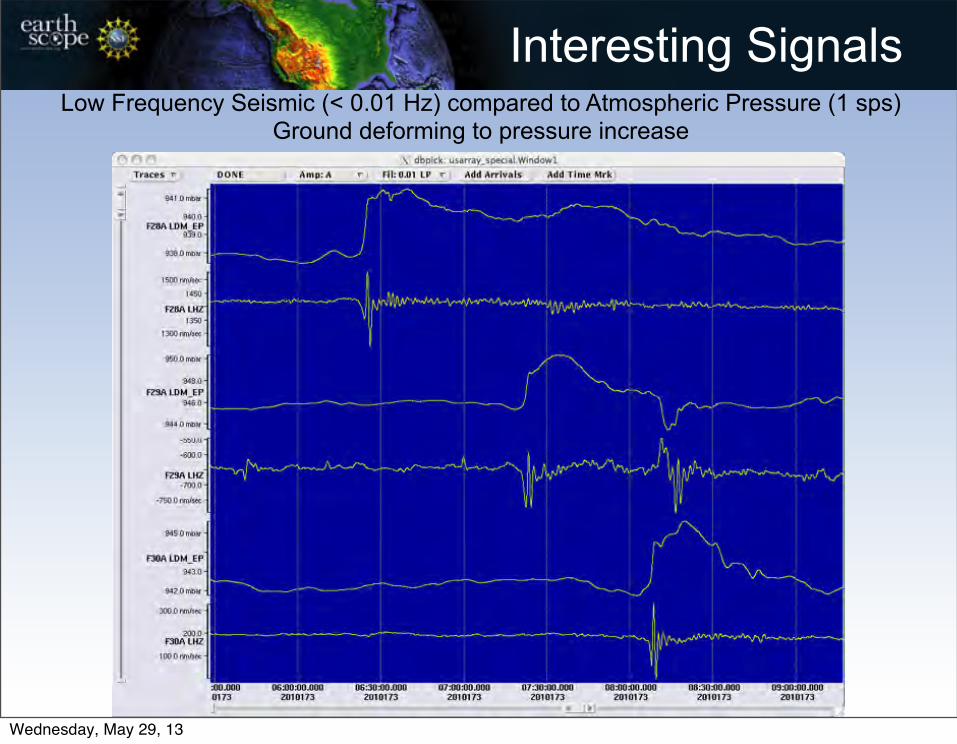
Interesting SignalsLow Frequency Seismic (< 0.01 Hz) compared to Atmospheric Pressure (1 sps)
Ground deforming to pressure increase
Wednesday, May 29, 13
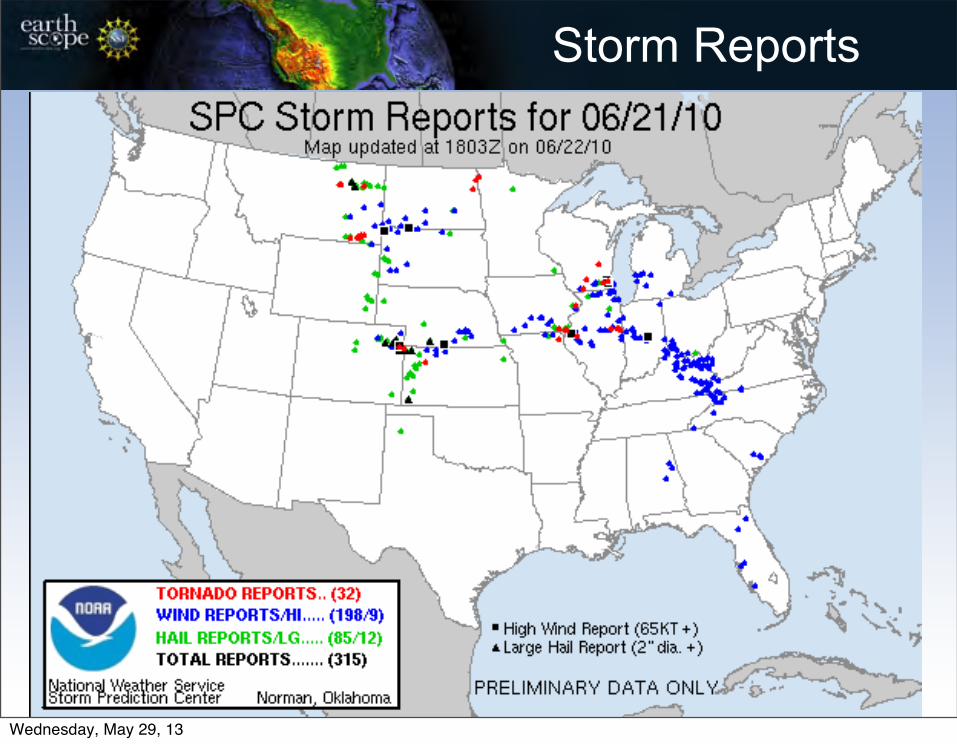
Storm Reports
Wednesday, May 29, 13
Interesting Signals
Wednesday, May 29, 13
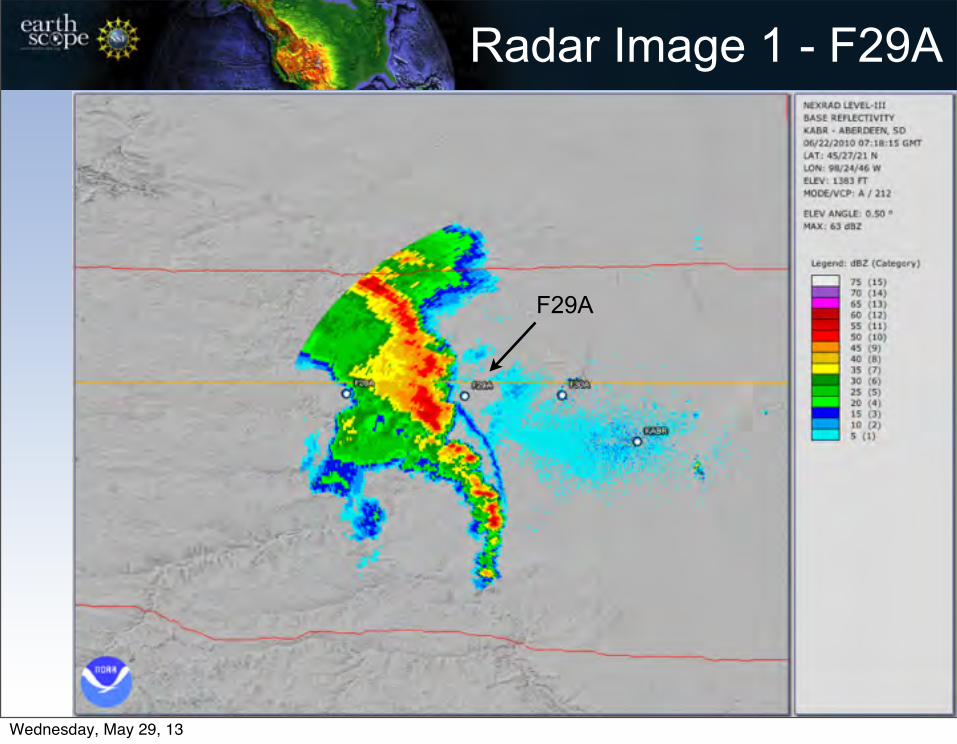
Radar Image 1 - F29A
F29A
Wednesday, May 29, 13
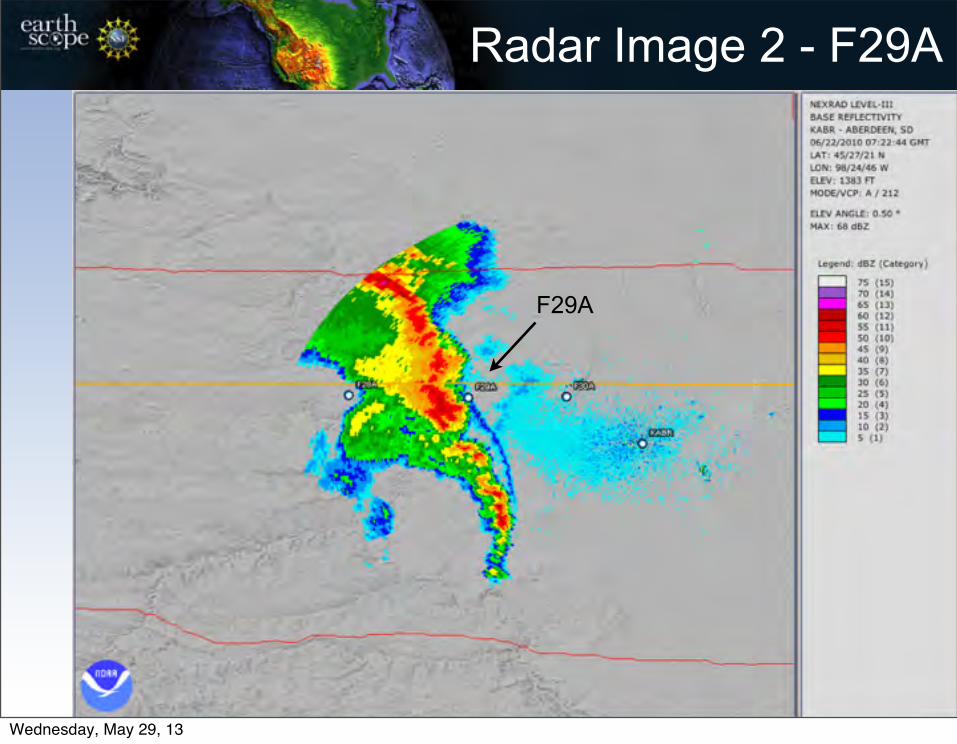
Radar Image 2 - F29A
F29A
Wednesday, May 29, 13
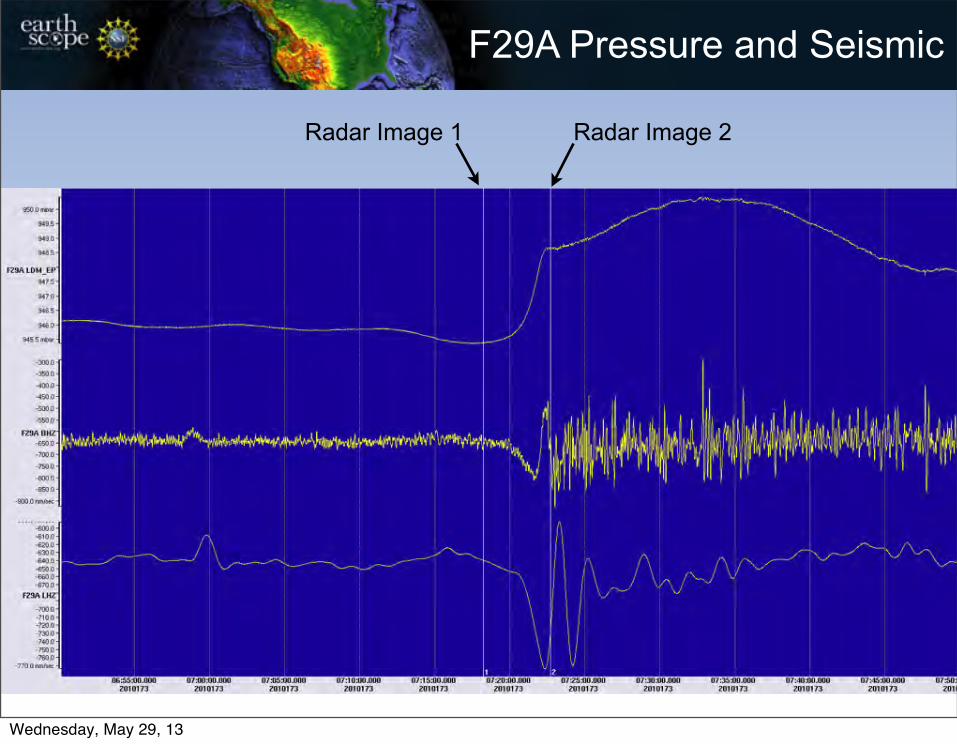
F29A Pressure and Seismic
Radar Image 1 Radar Image 2
Wednesday, May 29, 13
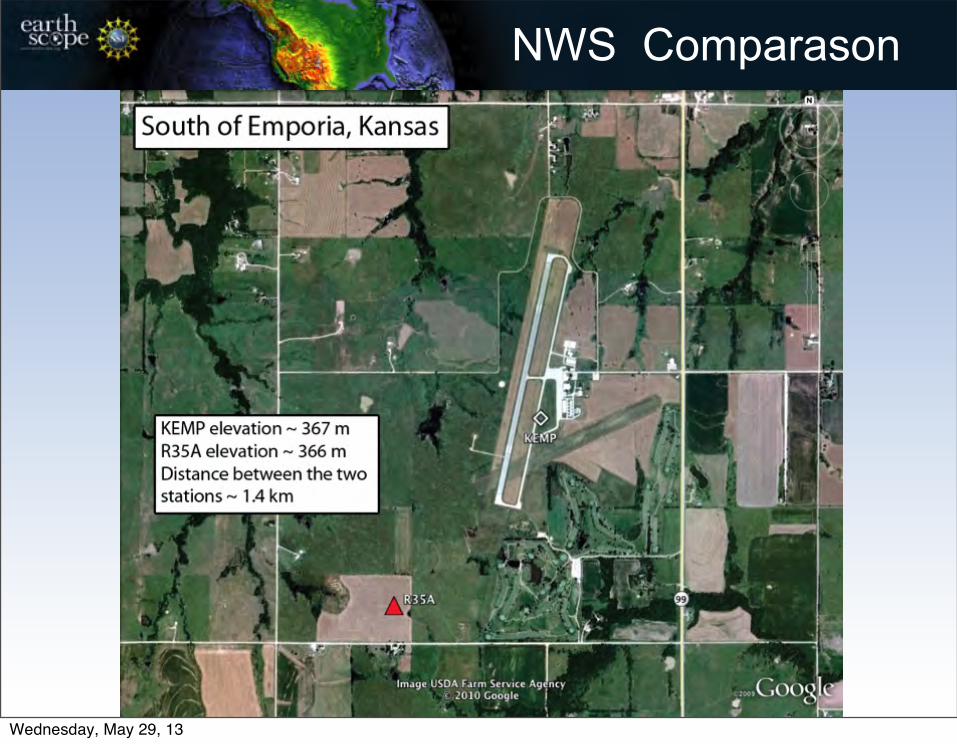
NWS Comparason
Wednesday, May 29, 13

NWS Comparason
8/13/201011:53:00
8/13/201014:53:00
8/13/201017:53:00
8/13/201020:53:00
8/13/201023:53:00
8/14/201002:53:00
8/14/201005:53:00
8/14/201008:53:00
8/14/201011:53:00
958
959
960
961
962
963
964
965
966
967
Time (UTC)
Pres
sure
(mb)
Data Sampling ComparisonASOS Station KEMP vs. TA Station R35A
KEMPR35A
Gust Front
Wednesday, May 29, 13
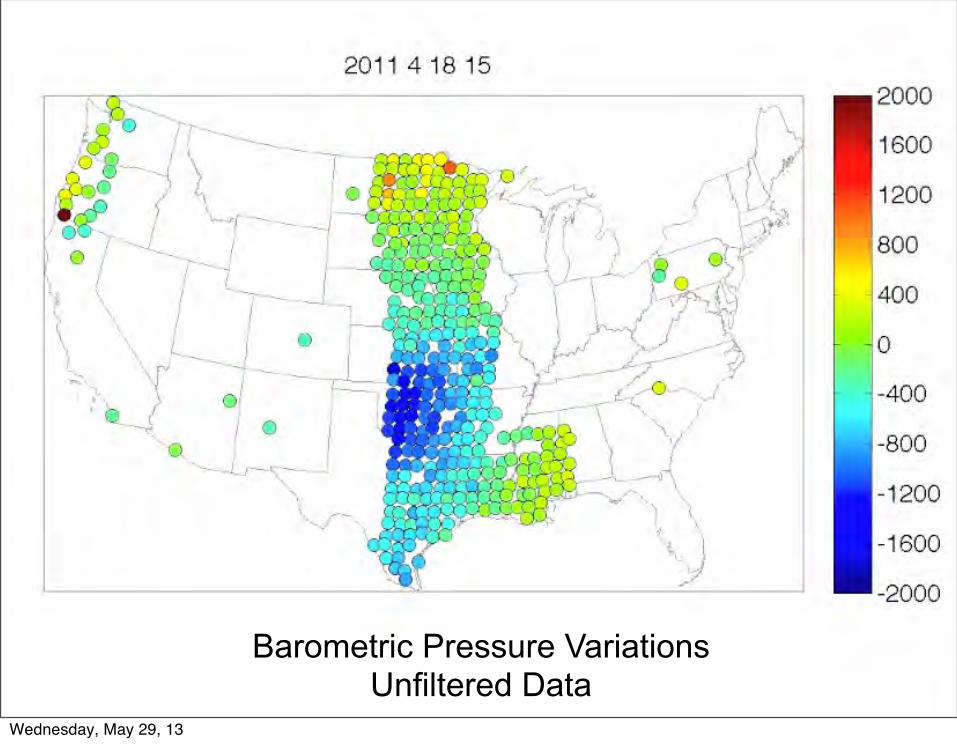
Barometric Pressure VariationsUnfiltered Data
Wednesday, May 29, 13

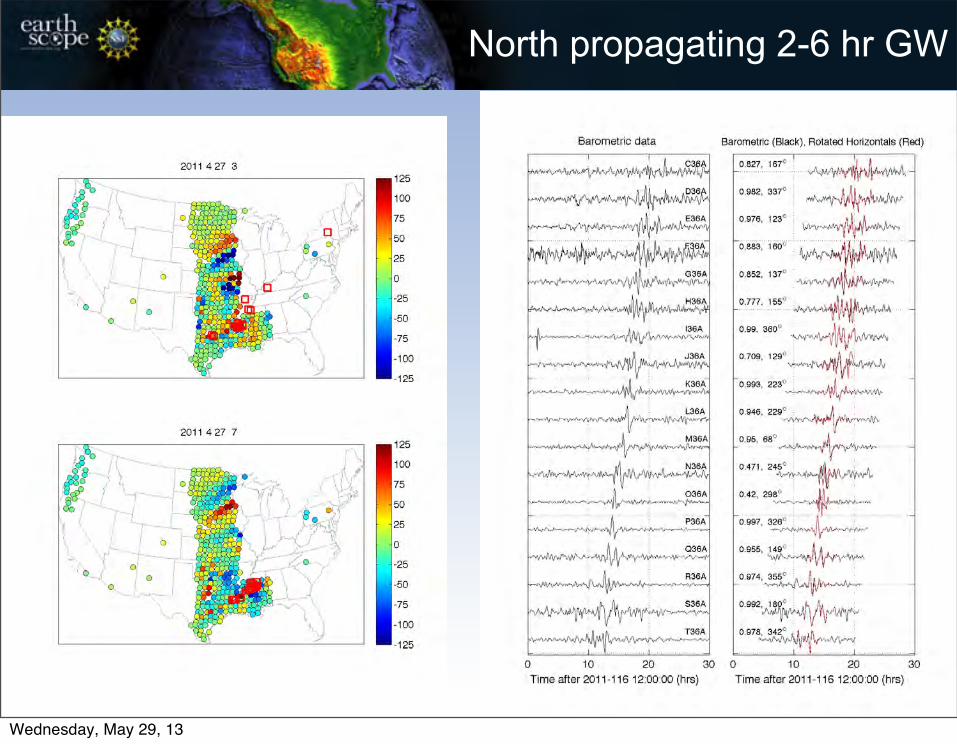
Atmospheric Gravity Wave Band Periods - 2 to 6 Hours
Wednesday, May 29, 13
12
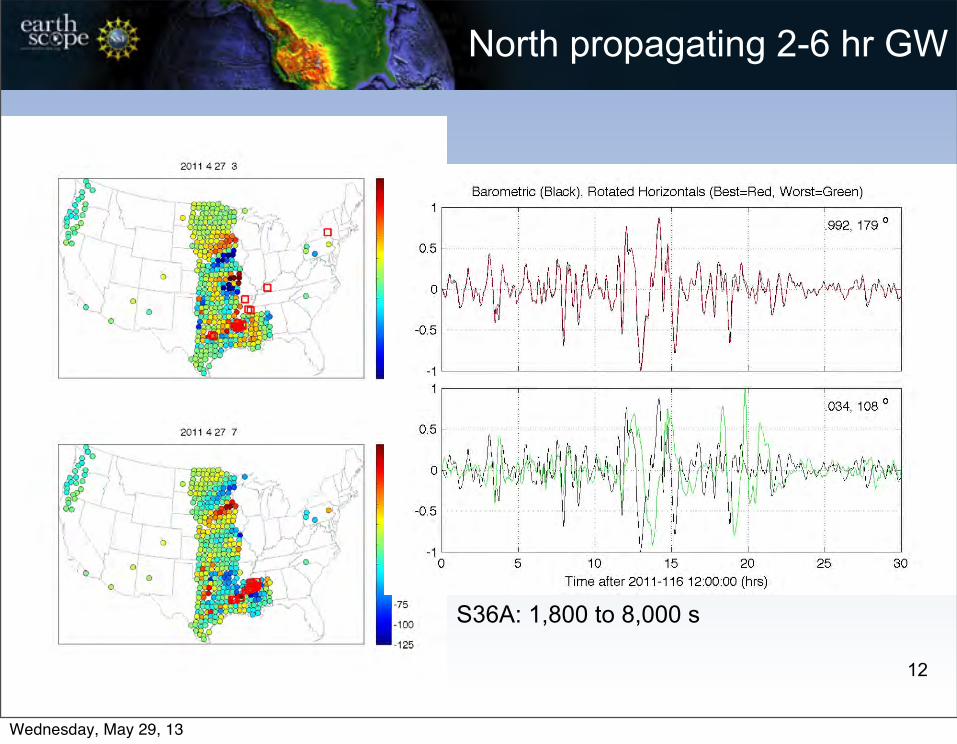
North propagating 2-6 hr GW
S36A: 1,800 to 8,000 s
Wednesday, May 29, 13
13
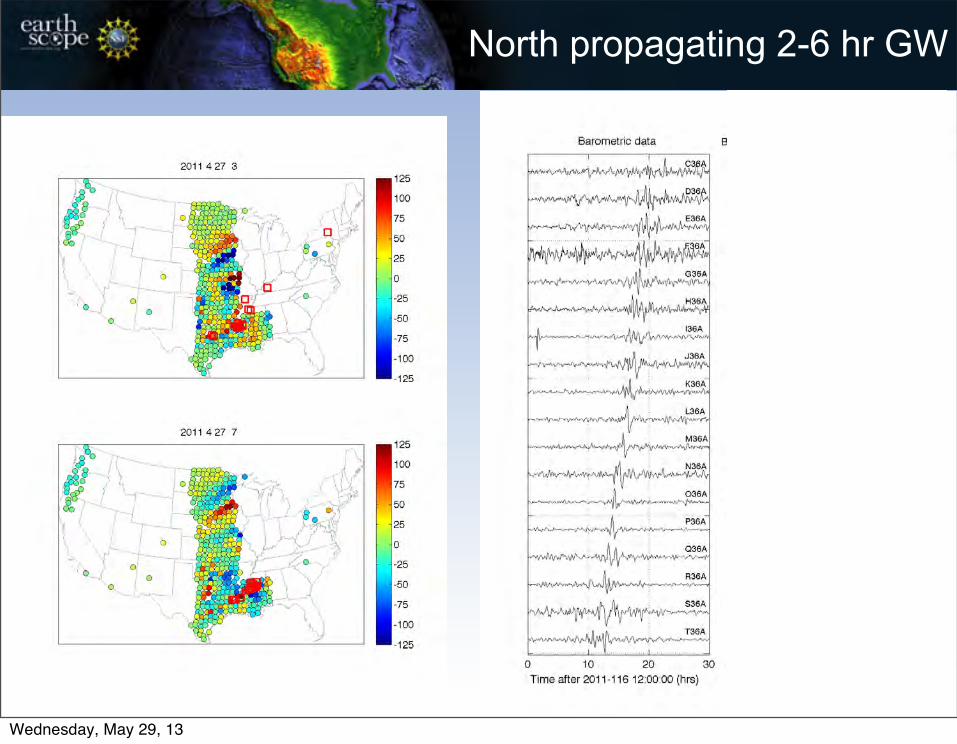
North propagating 2-6 hr GW
Wednesday, May 29, 13
13
North propagating 2-6 hr GW
Wednesday, May 29, 13

Tornado Prevalence
Wednesday, May 29, 13

Jackson Tornado on 4/15/2011 – 245A
Wednesday, May 29, 13

6 hours
10 minutes
Jackson, MS22:35:59 UTC
Jackson Tornado on 4/15/2011 – 245A
Wednesday, May 29, 13
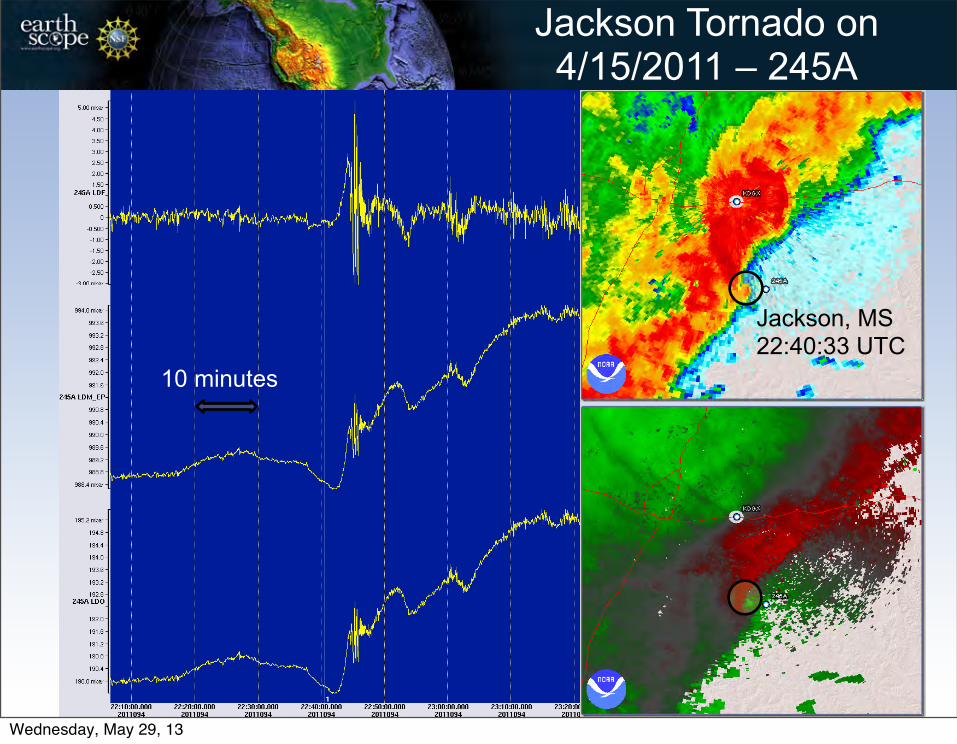
6 hours
Jackson, MS22:40:33 UTC
10 minutes
Jackson Tornado on 4/15/2011 – 245A
Wednesday, May 29, 13
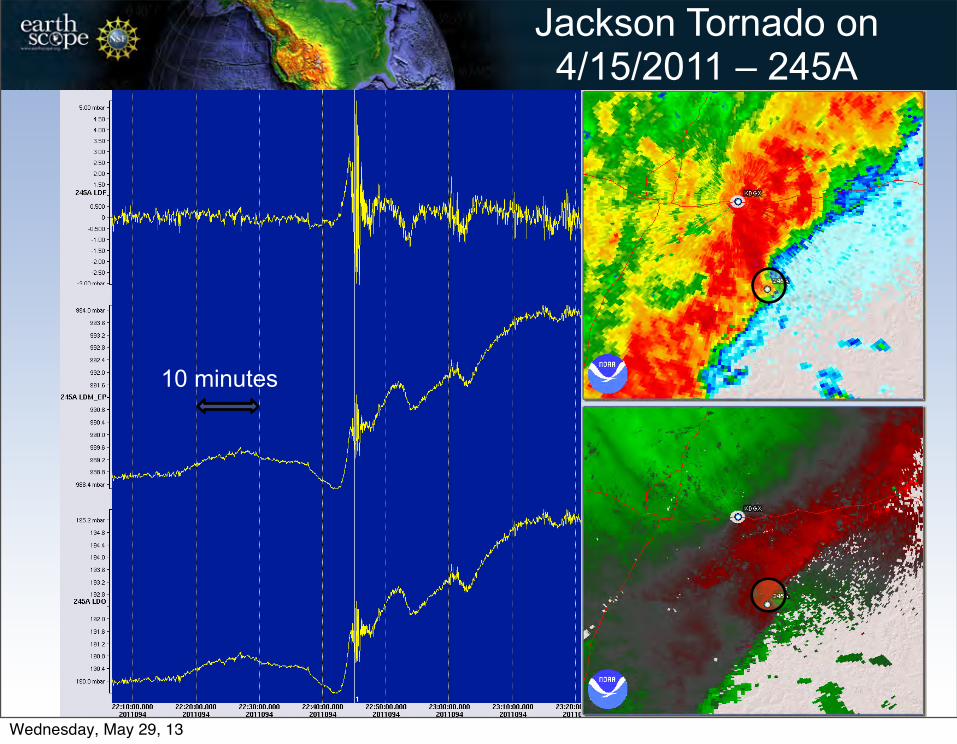
10 minutes
Jackson Tornado on 4/15/2011 – 245A
Wednesday, May 29, 13

Jackson Tornado on 4/15/2011 – 245A
Wednesday, May 29, 13

1 minute
Jackson Tornado on 4/15/2011 – 245A
Wednesday, May 29, 13

1 minute
Jackson Tornado on 4/15/2011 – 245A
Impulsive Rise and Drop
Wednesday, May 29, 13
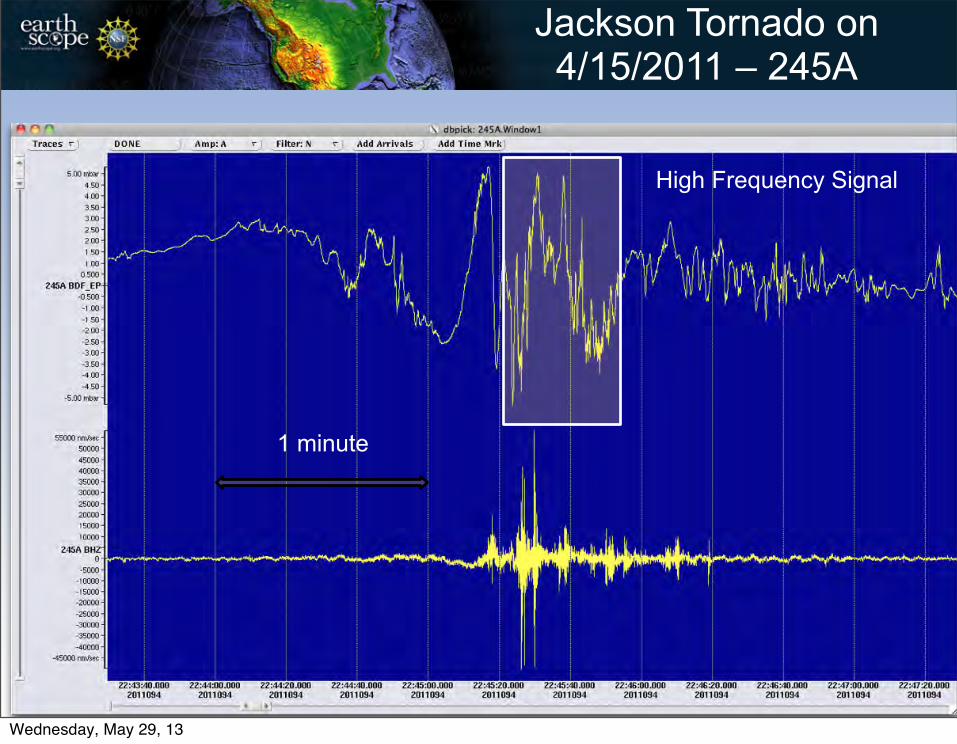
1 minute
Jackson Tornado on 4/15/2011 – 245A
High Frequency Signal
Wednesday, May 29, 13

Joplin Tornado 5/22/2011 – T38A
Wednesday, May 29, 13

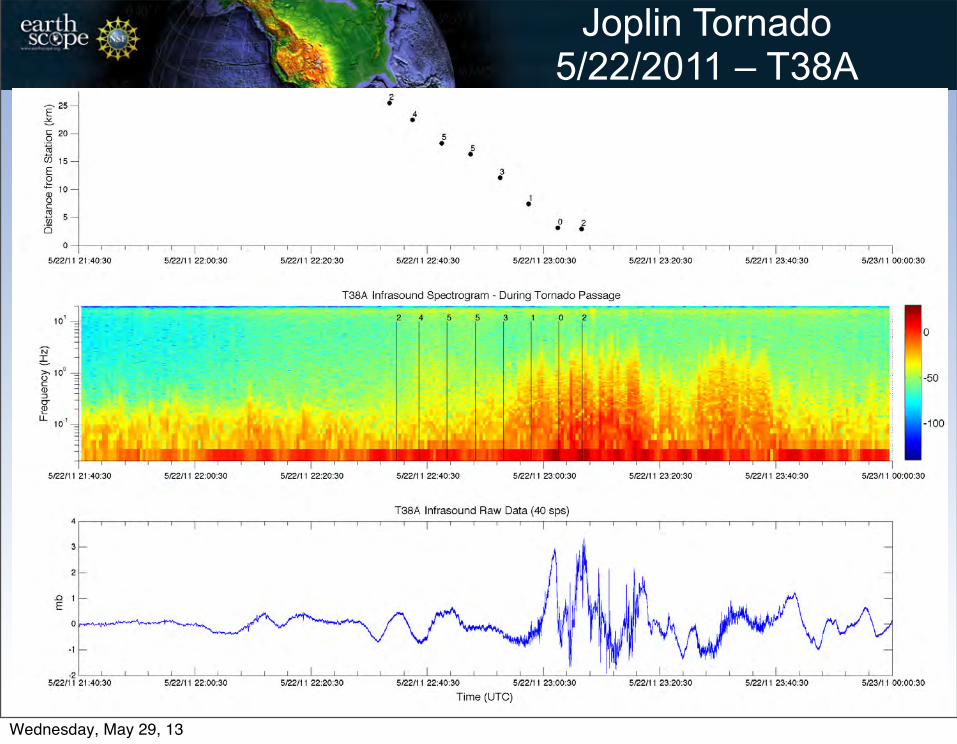
Joplin Tornado 5/22/2011 – T38A
Wednesday, May 29, 13
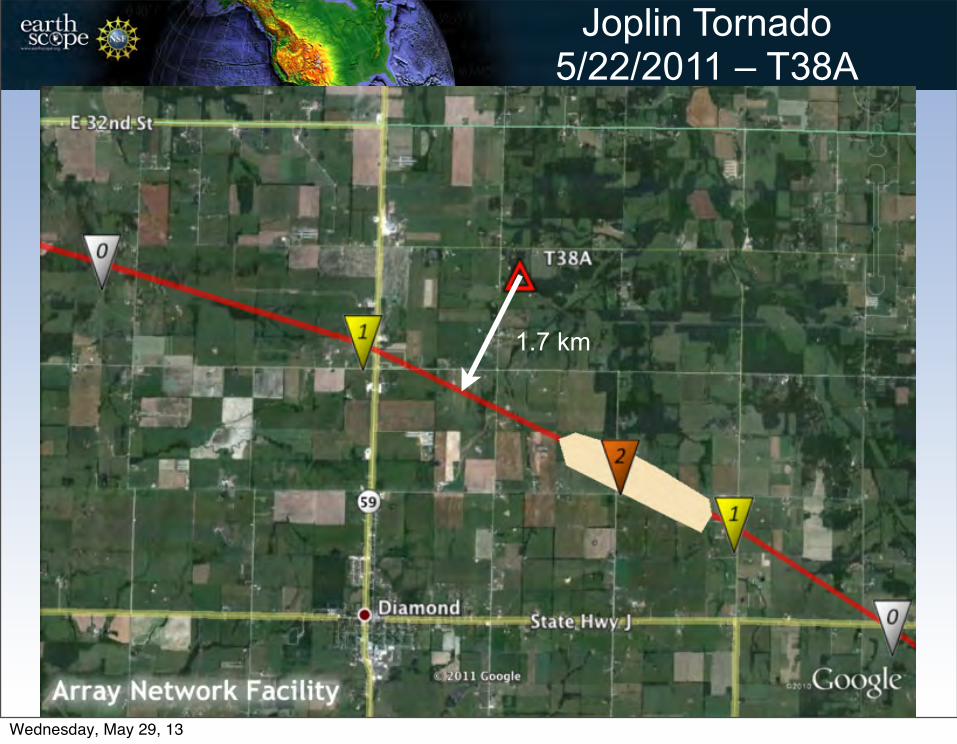
Joplin Tornado 5/22/2011 – T38A
1.7 km
Wednesday, May 29, 13
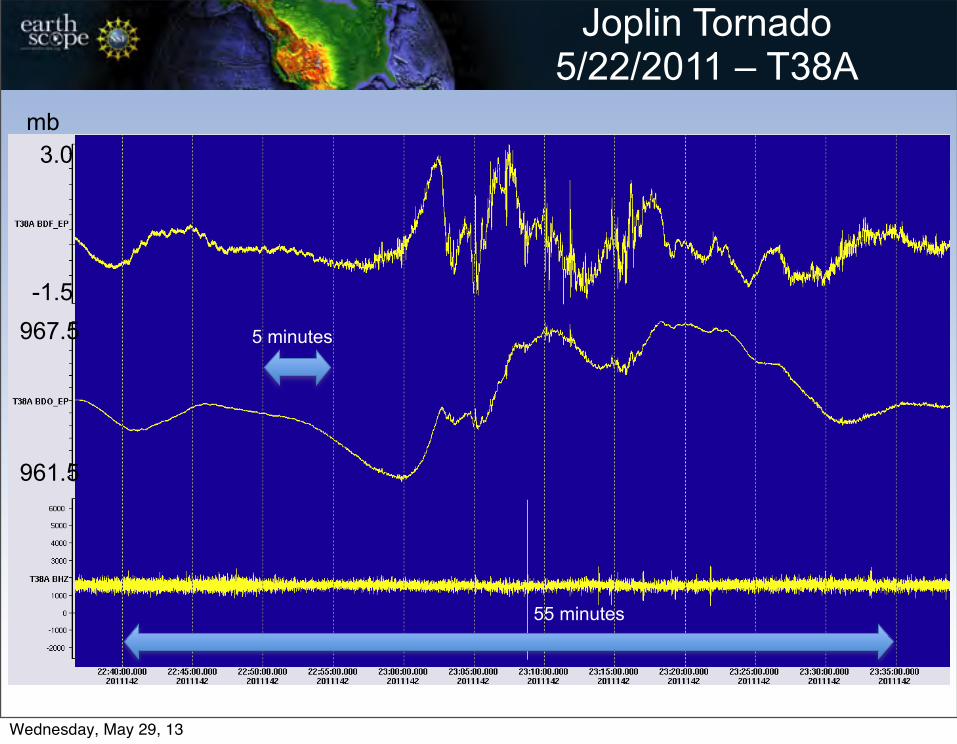
5 minutes
3.0
-1.5967.5
961.5
55 minutes
mb
Joplin Tornado 5/22/2011 – T38A
Wednesday, May 29, 13
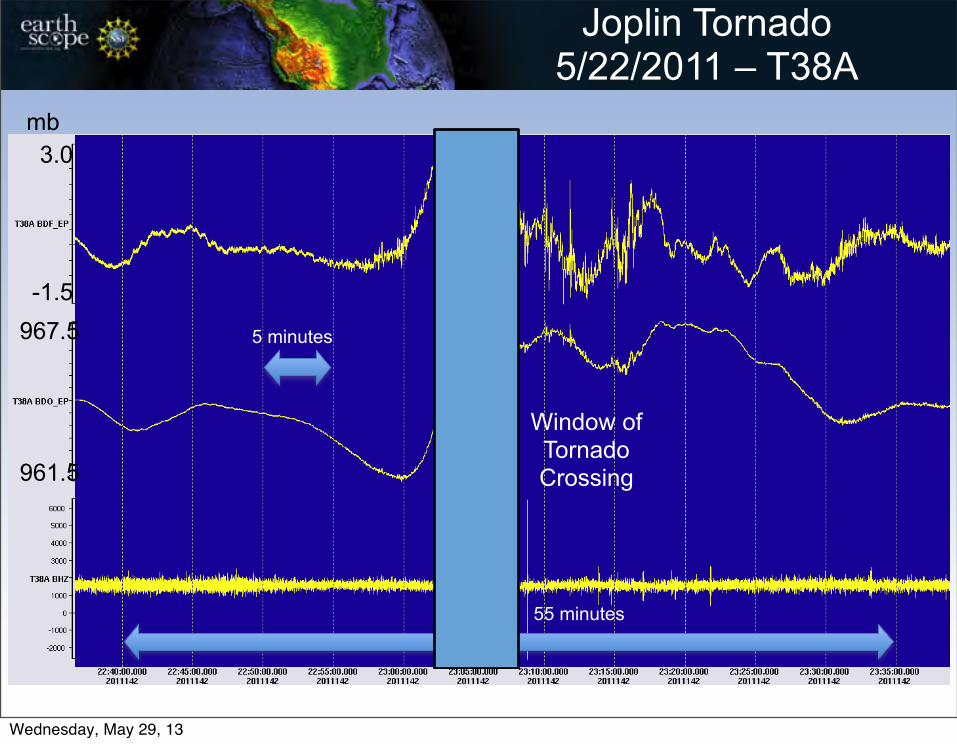
5 minutes
3.0
-1.5967.5
961.5
55 minutes
mb
Window of Tornado Crossing
Joplin Tornado 5/22/2011 – T38A
Wednesday, May 29, 13
Joplin Tornado5/22/2011 – T38A
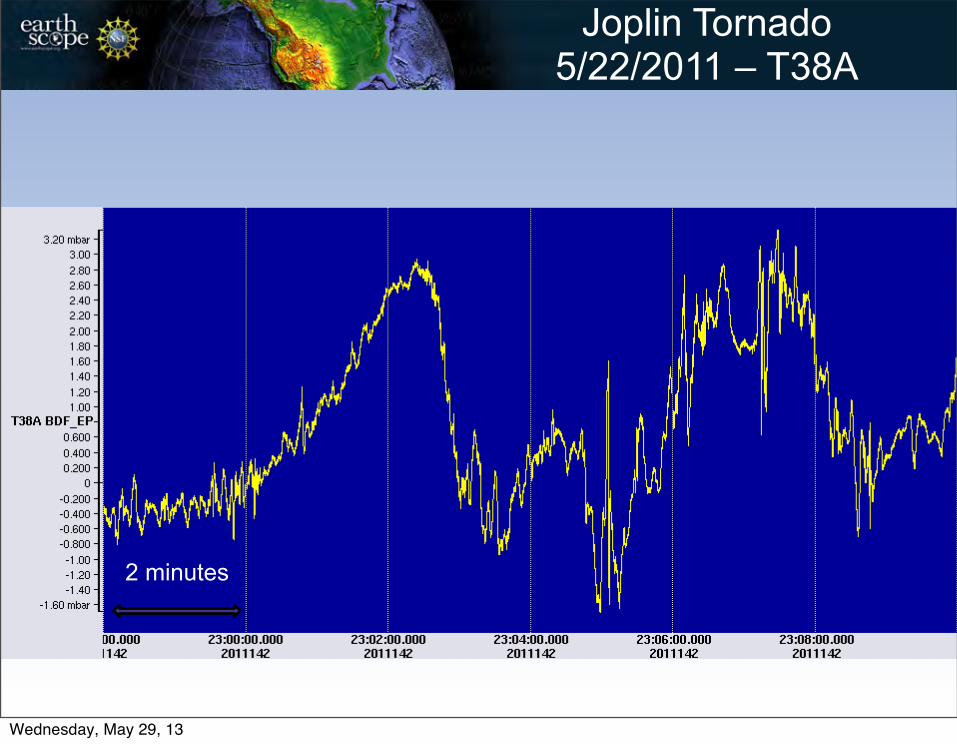
2 minutes
Wednesday, May 29, 13

Joplin Tornado5/22/2011 – T38A
2 minutes
Impulsive Rise and Drop
Wednesday, May 29, 13
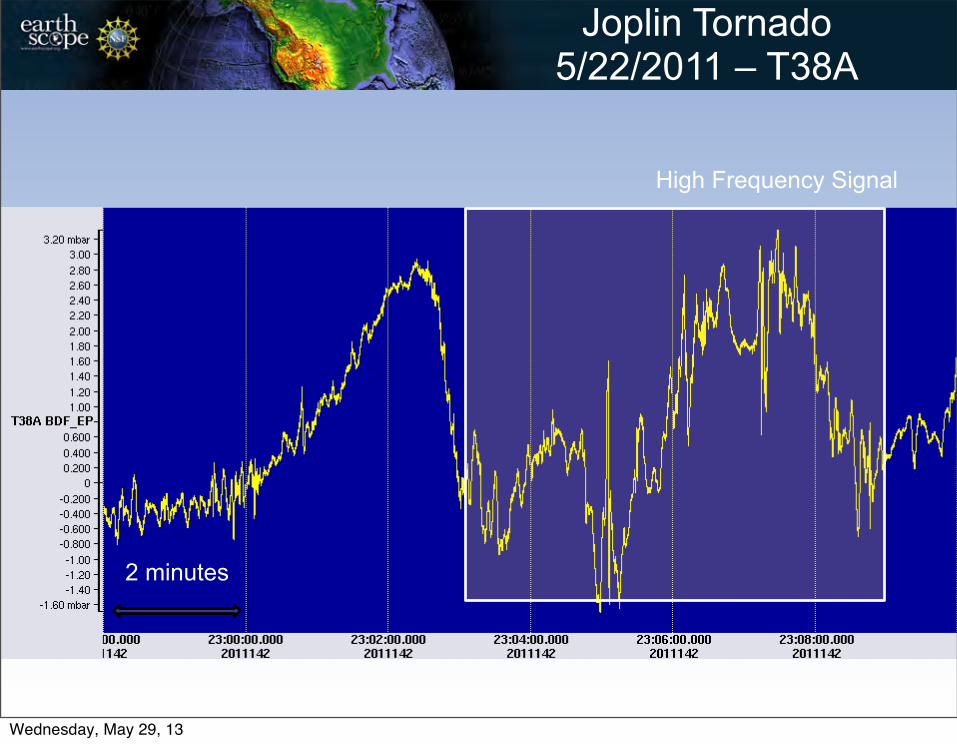
Joplin Tornado5/22/2011 – T38A
2 minutes
High Frequency Signal
Wednesday, May 29, 13
Joplin Tornado5/22/2011 – T38A
Wednesday, May 29, 13

Oklahoma Tornado on 4/27/2011 – Y46A
Wednesday, May 29, 13

Mesa Grande View
Wednesday, May 29, 13
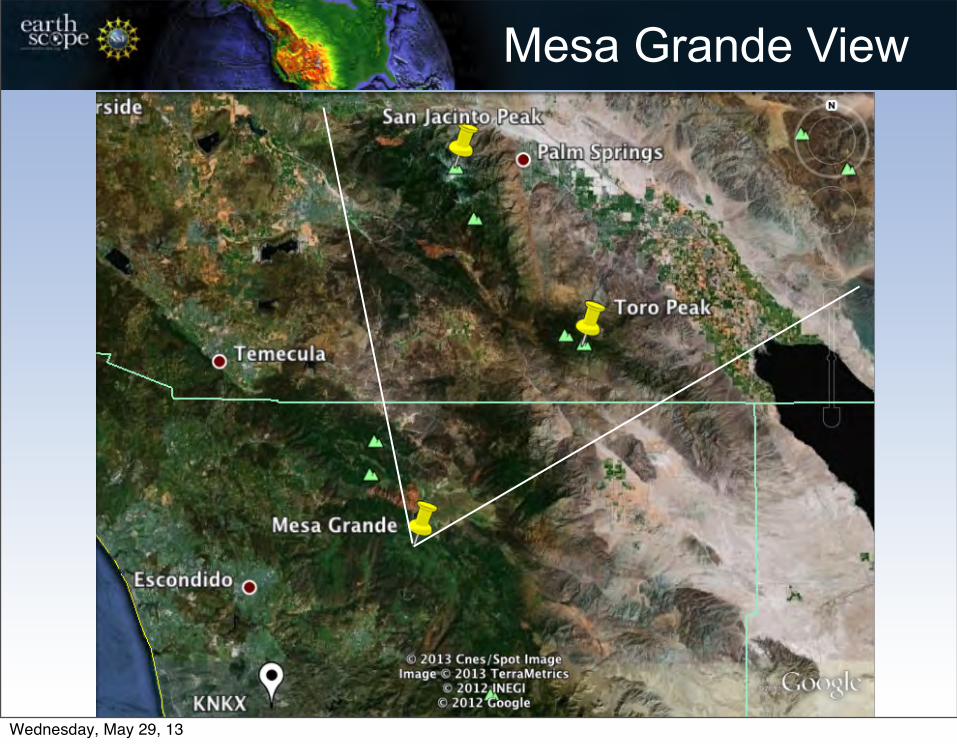
Mesa Grande View
Wednesday, May 29, 13

HPWREN Photo
Main challenge: A single lightning event can contain multiple branches covering a large area.
Wednesday, May 29, 13

Data Integration
• The ANF is collaborating with Earth Networks and their Total Lightning Network (ENTLN) in order to identify thunder noise in our seismic data.
All lightning locations shown are from the ENTLN
Wednesday, May 29, 13

Mesa Grande Lightning
~ 7.5 km between CG1 and CG3
Wednesday, May 29, 13

Seismic Data
Wednesday, May 29, 13
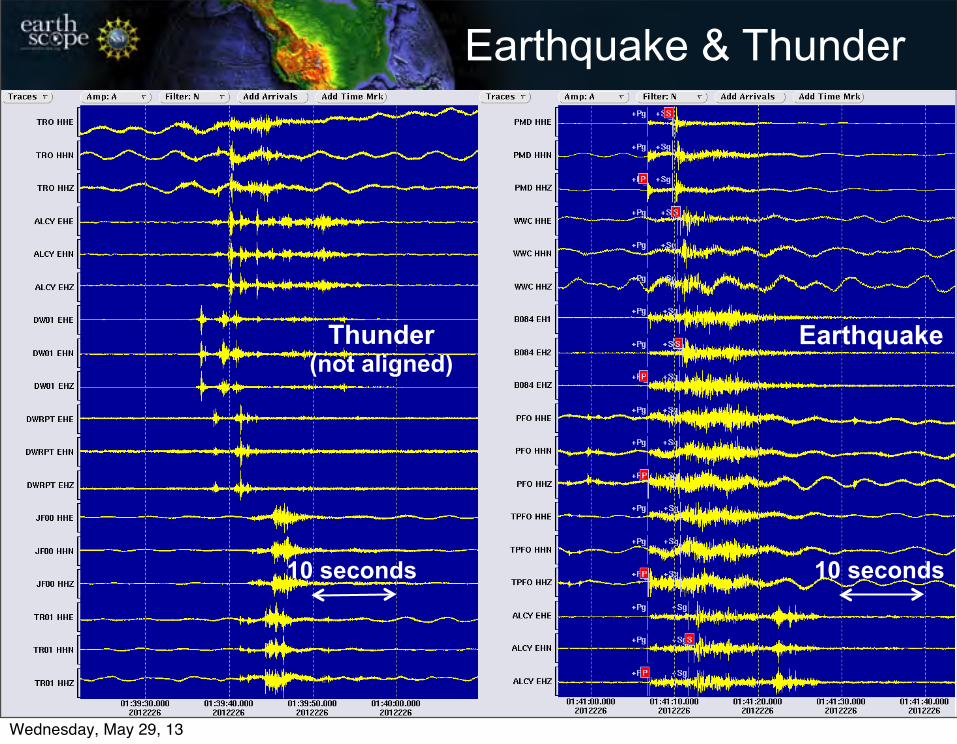
Earthquake & Thunder
Earthquake
10 seconds
Thunder (not aligned)
10 seconds
Wednesday, May 29, 13
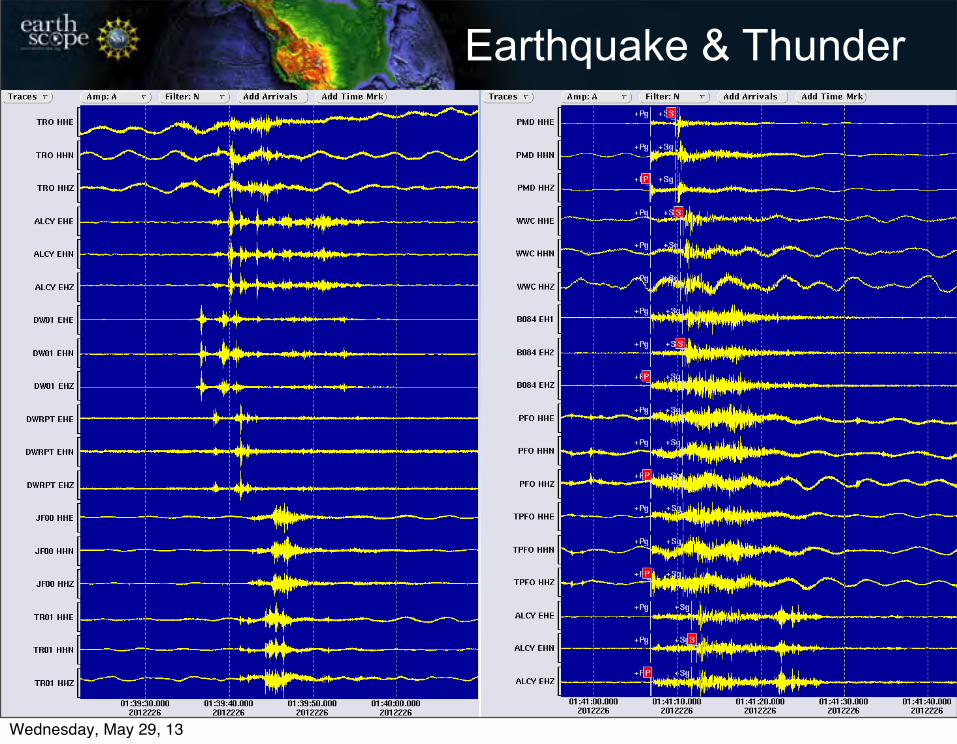
Earthquake & Thunder
Wednesday, May 29, 13

Earthquake & Thunder
Often similar patterns…
Wednesday, May 29, 13

Earthquake & Thunder
10 seconds
Thunder noise lined-up
Seismic event
stands out
ENTLN Event time
Wednesday, May 29, 13
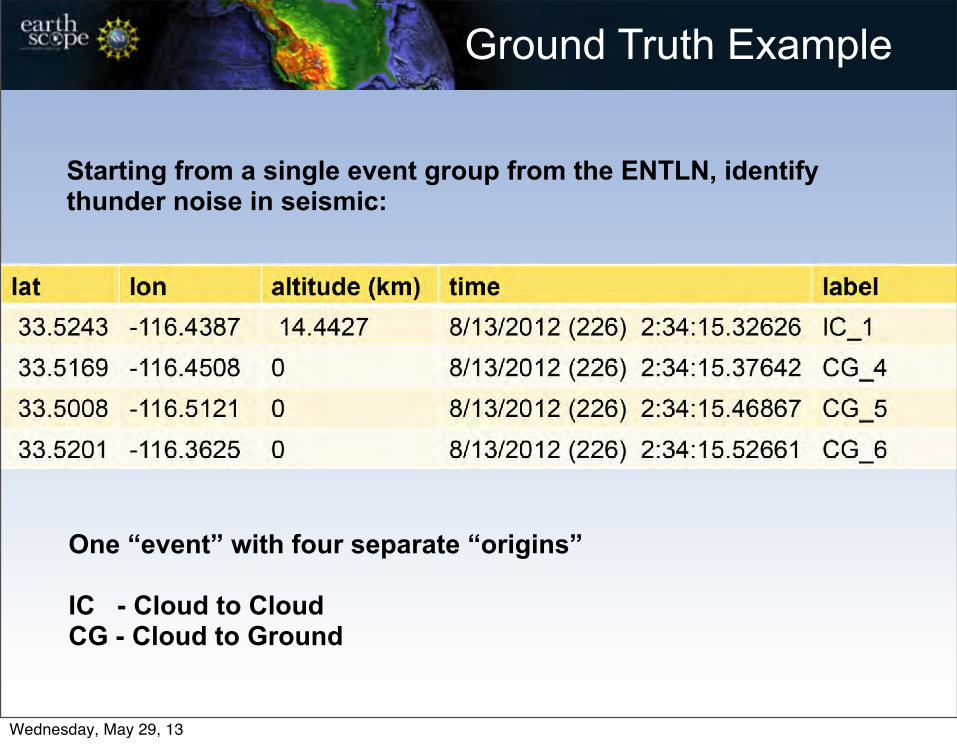
Ground Truth Example
Starting from a single event group from the ENTLN, identify thunder noise in seismic:
One “event” with four separate “origins”
IC - Cloud to CloudCG - Cloud to Ground
Wednesday, May 29, 13

Ground Truth Example
Wednesday, May 29, 13
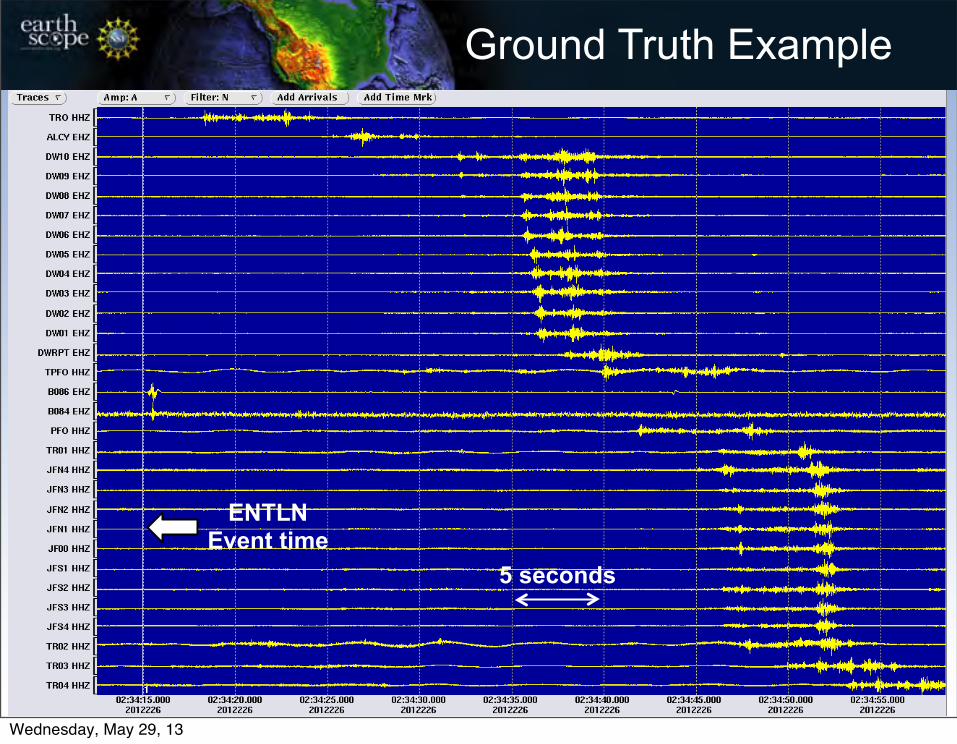
Ground Truth Example
ENTLN Event time
5 seconds
Wednesday, May 29, 13

Thunder review
• Thunder noise from lightning events readily poses challenges for seismic analysts
• Lightning can cover large areas vs. isolated seismic sources
• Large area acoustic signatures difficult to determine arrival times in data (though “ballpark” estimates possible)
• Signals from thunder can overlap, cross-over, and distort seismic waveforms
Wednesday, May 29, 13
Data Fusion
• Earth Networks’ comprehensive Total Lightning Network (ENTLN) helps isolate specific thunder obs.
• Seismic analysts can regroup waveforms using lightning events as point source “regions” – this helps isolate earthquake signatures
• Possibility of developing a real-time detector, though this would be difficult without supplemental data such as ENTLN
Wednesday, May 29, 13
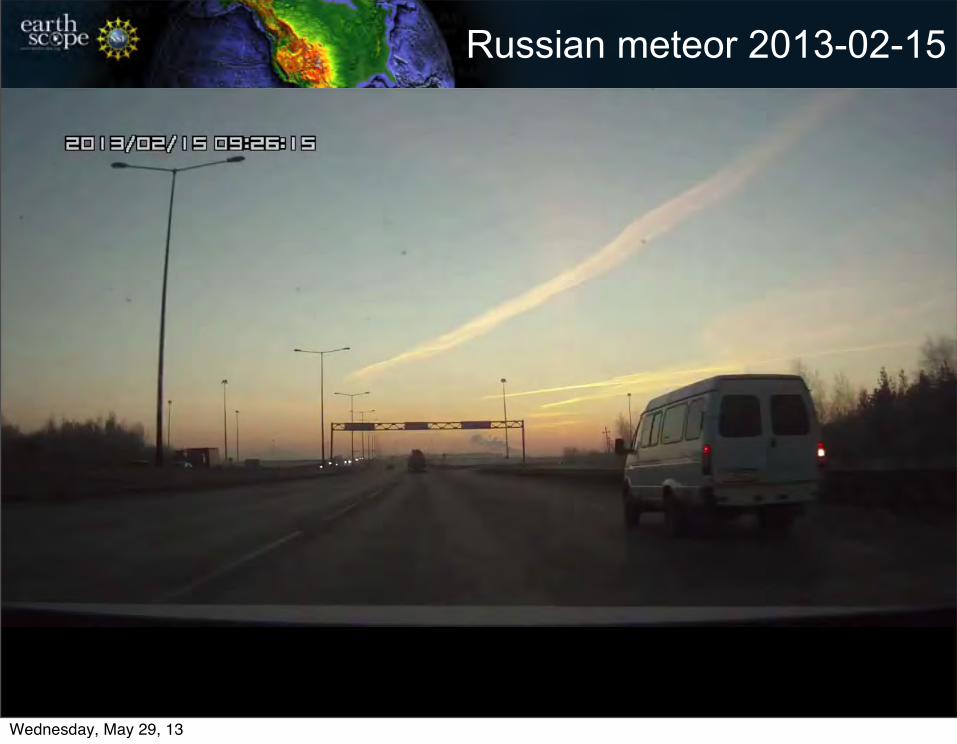
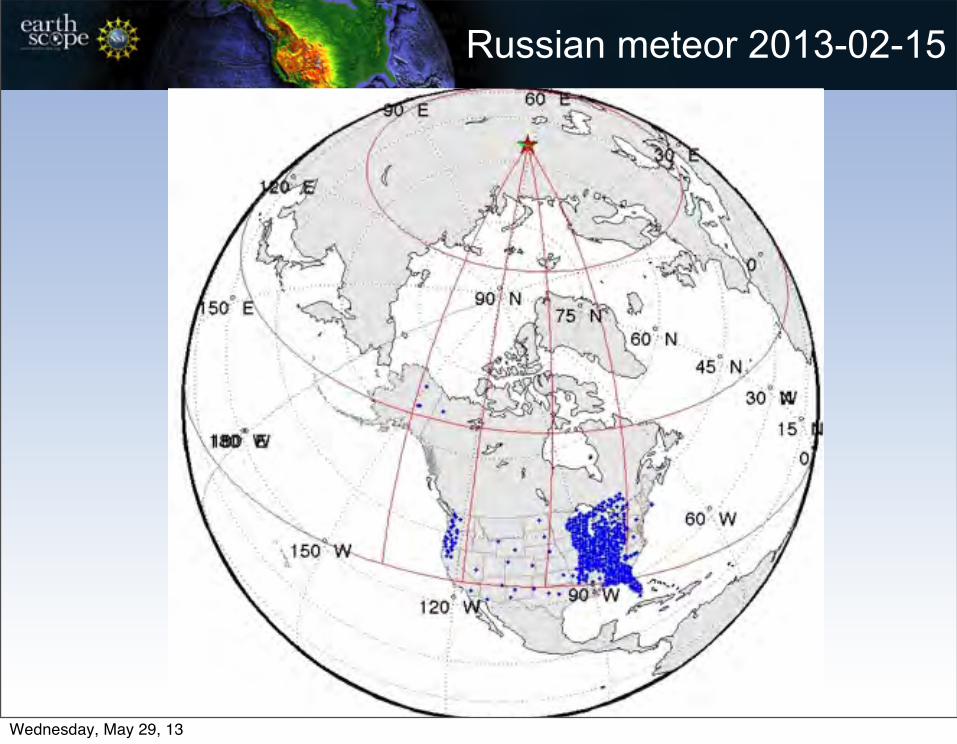
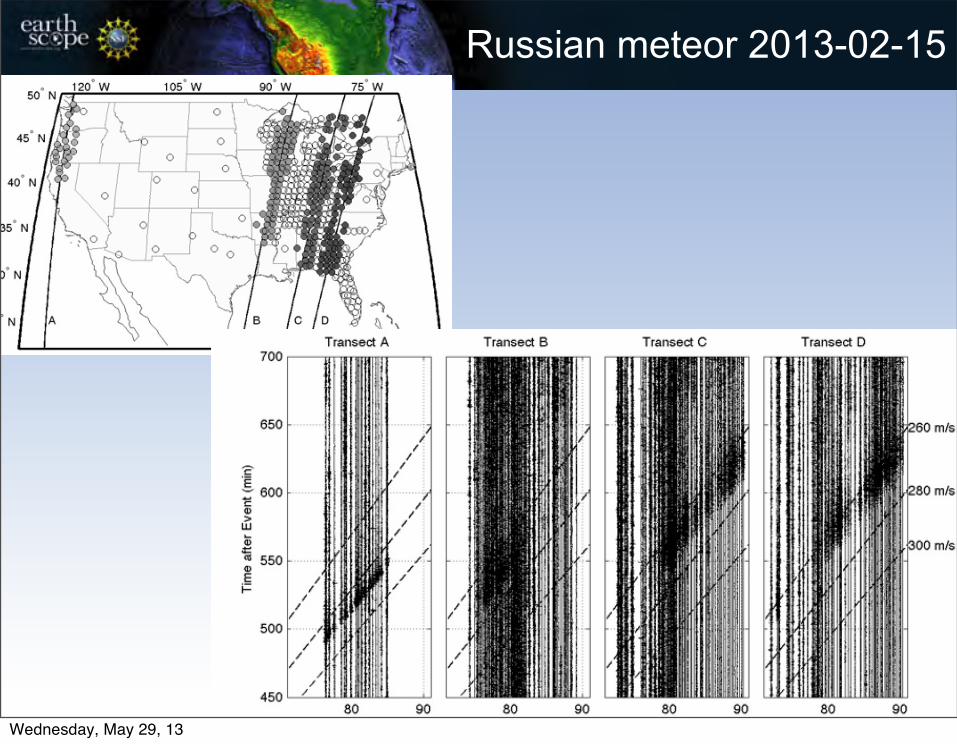
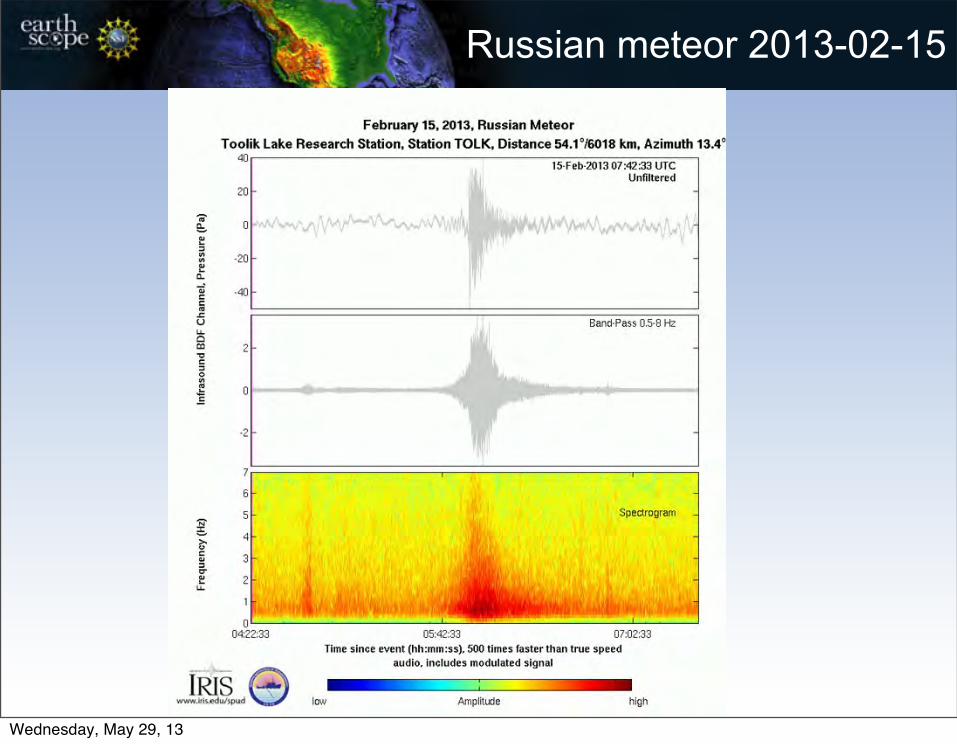
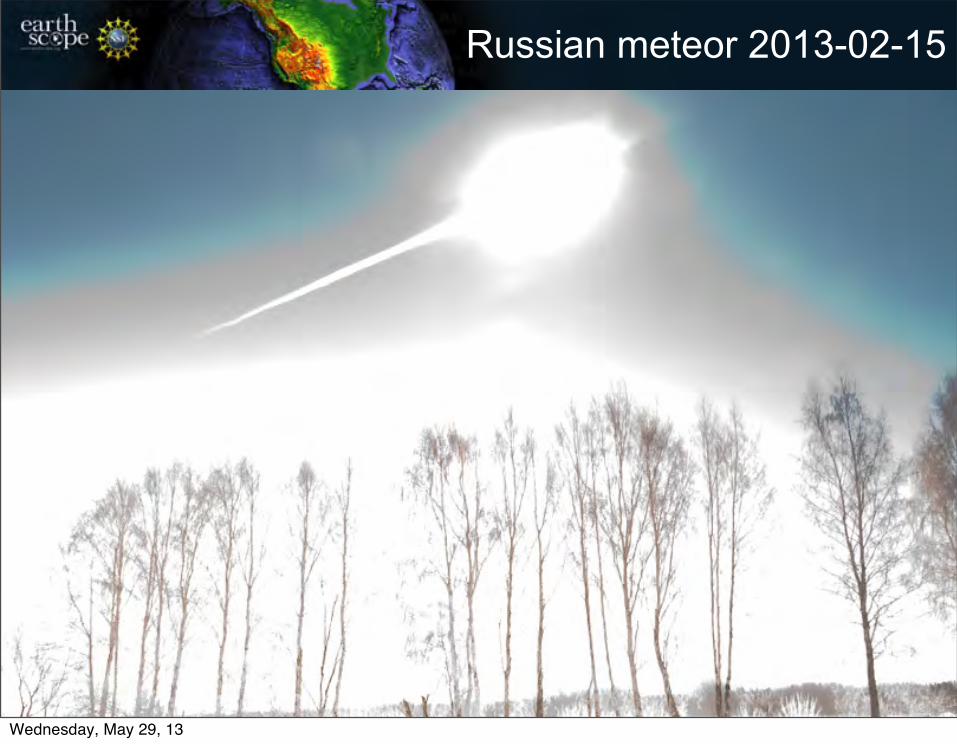
Russian meteor 2013-02-15
Wednesday, May 29, 13
Russian meteor 2013-02-15
Wednesday, May 29, 13

Russian meteor 2013-02-15
Wednesday, May 29, 13
Russian meteor 2013-02-15
Wednesday, May 29, 13

Russian meteor 2013-02-15
Wednesday, May 29, 13
Russian meteor 2013-02-15
Wednesday, May 29, 13
Russian meteor 2013-02-15
• Chelyabinsk, Russia, 2013 02 15
• Equivalent ~100s
• Meteorite video
•
Wednesday, May 29, 13

Conclusions
• Meteorological sensors can enhance understanding of seismic data
• Meteorological sensors can create opportunities for collaboration between different scientific communities• real time monitoring• hazards• civil defense
• Seismic networks provide sites, permitting, real time telemetry
• Networks in Middle East using USArray technology are easily adaptable to extended environmental monitoring capabilities
Wednesday, May 29, 13