OBSERVATIONS OF A SUPERCELL AND WEAK · PDF fileLyakhov, et al. p. 1 OBSERVATIONS OF A...
28
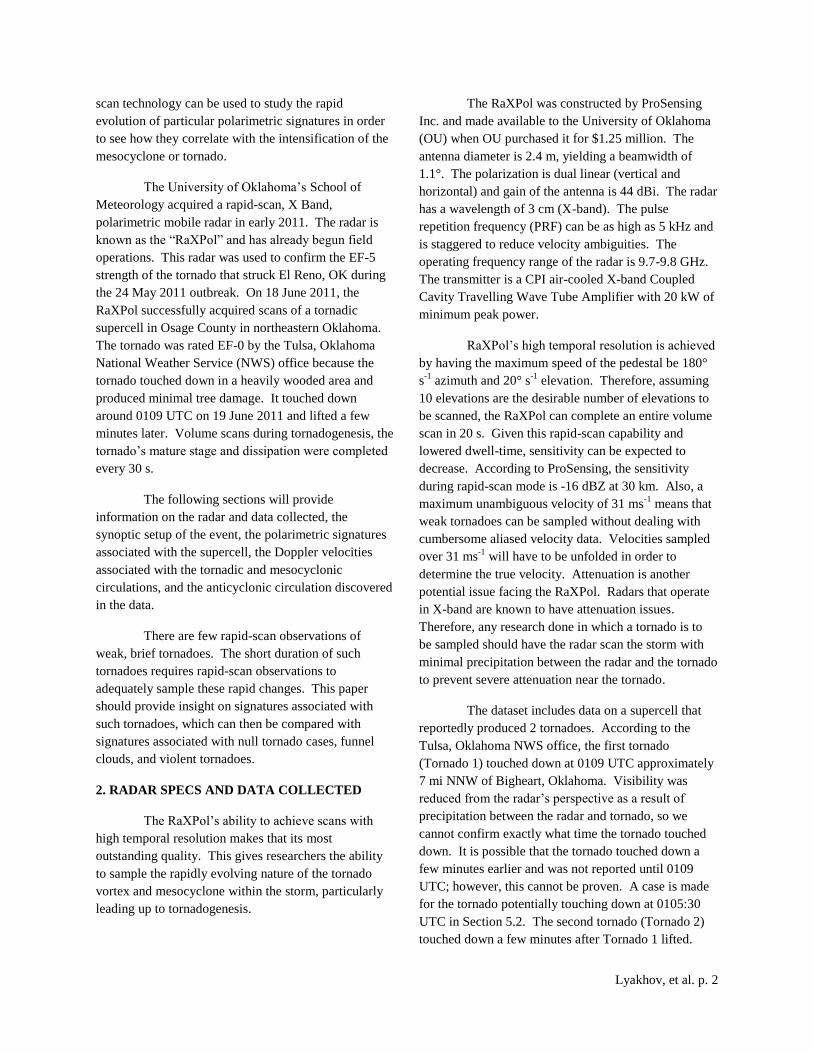
Lyakhov, et al. p. 1 OBSERVATIONS OF A SUPERCELL AND WEAK TORNADO MADE WITH A RAPID-SCAN, POLARIMETRIC, MOBILE RADAR Alex Lyakhov 1,2 , David Bodine 3,4 , and Robert Palmer 3,4 1 2011 National Weather Center Research Experience for Undergraduates, Norman, Oklahoma and 2 State University of New York College at Oneonta, Oneonta, New York 3 Atmospheric Radar Research Center, Norman, Oklahoma 4 School of Meteorology, University of Oklahoma, Norman, Oklahoma ABSTRACT A rapid-scan, X-band, polarimetric, mobile Doppler radar is used to collect horizontal reflectivity, differential reflectivity, cross correlation coefficient and radial velocity data of a supercell that produced two EF-0 tornadoes in Osage County, OK on 18 June 2011. Volume scans of the first tornado, which lasted a few minutes, were acquired every 30 s. Analysis of data reveals several common polarimetric radar signatures associated with supercells including the low-level inflow, low-level hail and differential reflectivity arc signatures. The low-level inflow and differential reflectivity arc signatures both decreased in prominence around the time of tornado dissipation. No tornadic debris signature was noted, likely owing to the fact that the tornado was too weak to loft heavy debris, suggesting it is difficult for polarimetric radars to detect weak tornadoes. A Three Body Scatter Spike was also evident in the data, suggesting the presence of large hail aloft. Doppler velocity data reveal that mid-level mesocyclone intensification is not a pre-requisite for tornadogenesis. A trend of increasing azimuthal shear with time up to tornado dissipation is observed in the lowest two elevation scans, as well as within the low and midlevel mesocyclones. Azimuthal shear decreased after tornado dissipation in the lowest two scans and the low-level mesocyclone, but not with the midlevel mesocyclone. Furthermore, an anticyclonic circulation accompanied the cyclonic mesocyclone. A hook signature in the reflectivity field was observed with the mesoanticyclone, which later morphed into a linear feature. __________________________________ 1. INTRODUCTION 1 Supercell thunderstorms have been extensively studied by mobile radars due to the mobile radar’s ability to navigate close to the storm and acquire high- resolution imagery. Polarimetric mobile radars are capable of distinguishing between hydrometeor types as well as between hydrometeors and tornadic debris (Ryzhkov et al. 2005). Numerous observational studies of supercells using polarimetric radars have been conducted (e.g., Loney et al. 2002; Ryzhkov et al. 2005; Heinselman and Ryzhkov, 2006; Bluestein et al. 2007; Van den Broeke et al. 2008; Kumjian and Ryzhkov, 2008; Kumjian and Ryzhkov, 2009; Kumjian et al. 2010; Palmer et al. 2010). Kumjian and Ryzhkov 1 Corresponding author address: Alex Lyakhov, 1632 East 18 Str., Apt. D11, Brooklyn, NY 11229. E-mail: [email protected] (2008) identified seven common polarimetric signatures associated with supercells such as the tornadic debris signature (TDS), hail signature in the forward-flank downdraft (FFD), low-level inflow/updraft signature, differential reflectivity (Z DR ) arc signature, Z DR columns, specific differential phase (K DP ) columns, and midlevel Z DR and cross correlation coefficient (ρ hv ) rings. Not every supercell will have every signature to the same extent. With rapid-scan polarimetric mobile radars, the ability to distinguish hydrometeors from non-meteorological targets is coupled with the ability to achieve volume scans in as low as 30 s at close proximity to supercells and tornadoes. This particular attribute is essential when trying to analyze the rapidly evolving, small-scale structures within supercells. It has been observed that only tens of seconds are needed for microscale structures such as tornadoes to alter their structure significantly (Bluestein et al. 2003). Rapid-
-
Upload
nguyenphuc -
Category
Documents
-
view
222 -
download
0
Transcript of OBSERVATIONS OF A SUPERCELL AND WEAK · PDF fileLyakhov, et al. p. 1 OBSERVATIONS OF A...
Lyakhov, et al. p. 1
OBSERVATIONS OF A SUPERCELL AND WEAK TORNADO
MADE WITH A RAPID-SCAN, POLARIMETRIC, MOBILE RADAR
Alex Lyakhov 1,2
, David Bodine3,4
, and Robert Palmer3,4
12011 National Weather Center Research Experience for Undergraduates, Norman, Oklahoma
and 2State University of New York College at Oneonta, Oneonta, New York
3Atmospheric Radar Research Center, Norman, Oklahoma
4School of Meteorology, University of Oklahoma, Norman, Oklahoma
ABSTRACT
A rapid-scan, X-band, polarimetric, mobile Doppler radar is used to collect horizontal reflectivity,
differential reflectivity, cross correlation coefficient and radial velocity data of a supercell that produced two
EF-0 tornadoes in Osage County, OK on 18 June 2011. Volume scans of the first tornado, which lasted a few
minutes, were acquired every 30 s. Analysis of data reveals several common polarimetric radar signatures
associated with supercells including the low-level inflow, low-level hail and differential reflectivity arc
signatures. The low-level inflow and differential reflectivity arc signatures both decreased in prominence
around the time of tornado dissipation. No tornadic debris signature was noted, likely owing to the fact that
the tornado was too weak to loft heavy debris, suggesting it is difficult for polarimetric radars to detect weak
tornadoes. A Three Body Scatter Spike was also evident in the data, suggesting the presence of large hail
aloft. Doppler velocity data reveal that mid-level mesocyclone intensification is not a pre-requisite for
tornadogenesis. A trend of increasing azimuthal shear with time up to tornado dissipation is observed in the
lowest two elevation scans, as well as within the low and midlevel mesocyclones. Azimuthal shear decreased
after tornado dissipation in the lowest two scans and the low-level mesocyclone, but not with the midlevel
mesocyclone. Furthermore, an anticyclonic circulation accompanied the cyclonic mesocyclone. A hook
signature in the reflectivity field was observed with the mesoanticyclone, which later morphed into a linear
feature.
__________________________________
1. INTRODUCTION1
Supercell thunderstorms have been extensively
studied by mobile radars due to the mobile radar’s
ability to navigate close to the storm and acquire high-
resolution imagery. Polarimetric mobile radars are
capable of distinguishing between hydrometeor types as
well as between hydrometeors and tornadic debris
(Ryzhkov et al. 2005). Numerous observational studies
of supercells using polarimetric radars have been
conducted (e.g., Loney et al. 2002; Ryzhkov et al. 2005;
Heinselman and Ryzhkov, 2006; Bluestein et al. 2007;
Van den Broeke et al. 2008; Kumjian and Ryzhkov,
2008; Kumjian and Ryzhkov, 2009; Kumjian et al.
2010; Palmer et al. 2010). Kumjian and Ryzhkov
1 Corresponding author address: Alex Lyakhov, 1632 East
18 Str., Apt. D11, Brooklyn, NY 11229.
E-mail: [email protected]
(2008) identified seven common polarimetric signatures
associated with supercells such as the tornadic debris
signature (TDS), hail signature in the forward-flank
downdraft (FFD), low-level inflow/updraft signature,
differential reflectivity (ZDR) arc signature, ZDR
columns, specific differential phase (KDP) columns, and
midlevel ZDR and cross correlation coefficient (ρhv)
rings. Not every supercell will have every signature to
the same extent. With rapid-scan polarimetric mobile
radars, the ability to distinguish hydrometeors from
non-meteorological targets is coupled with the ability to
achieve volume scans in as low as 30 s at close
proximity to supercells and tornadoes. This particular
attribute is essential when trying to analyze the rapidly
evolving, small-scale structures within supercells. It
has been observed that only tens of seconds are needed
for microscale structures such as tornadoes to alter their
structure significantly (Bluestein et al. 2003). Rapid-
Lyakhov, et al. p. 2
scan technology can be used to study the rapid
evolution of particular polarimetric signatures in order
to see how they correlate with the intensification of the
mesocyclone or tornado.
The University of Oklahoma’s School of
Meteorology acquired a rapid-scan, X Band,
polarimetric mobile radar in early 2011. The radar is
known as the “RaXPol” and has already begun field
operations. This radar was used to confirm the EF-5
strength of the tornado that struck El Reno, OK during
the 24 May 2011 outbreak. On 18 June 2011, the
RaXPol successfully acquired scans of a tornadic
supercell in Osage County in northeastern Oklahoma.
The tornado was rated EF-0 by the Tulsa, Oklahoma
National Weather Service (NWS) office because the
tornado touched down in a heavily wooded area and
produced minimal tree damage. It touched down
around 0109 UTC on 19 June 2011 and lifted a few
minutes later. Volume scans during tornadogenesis, the
tornado’s mature stage and dissipation were completed
every 30 s.
The following sections will provide
information on the radar and data collected, the
synoptic setup of the event, the polarimetric signatures
associated with the supercell, the Doppler velocities
associated with the tornadic and mesocyclonic
circulations, and the anticyclonic circulation discovered
in the data.
There are few rapid-scan observations of
weak, brief tornadoes. The short duration of such
tornadoes requires rapid-scan observations to
adequately sample these rapid changes. This paper
should provide insight on signatures associated with
such tornadoes, which can then be compared with
signatures associated with null tornado cases, funnel
clouds, and violent tornadoes.
2. RADAR SPECS AND DATA COLLECTED
The RaXPol’s ability to achieve scans with
high temporal resolution makes that its most
outstanding quality. This gives researchers the ability
to sample the rapidly evolving nature of the tornado
vortex and mesocyclone within the storm, particularly
leading up to tornadogenesis.
The RaXPol was constructed by ProSensing
Inc. and made available to the University of Oklahoma
(OU) when OU purchased it for $1.25 million. The
antenna diameter is 2.4 m, yielding a beamwidth of
1.1°. The polarization is dual linear (vertical and
horizontal) and gain of the antenna is 44 dBi. The radar
has a wavelength of 3 cm (X-band). The pulse
repetition frequency (PRF) can be as high as 5 kHz and
is staggered to reduce velocity ambiguities. The
operating frequency range of the radar is 9.7-9.8 GHz.
The transmitter is a CPI air-cooled X-band Coupled
Cavity Travelling Wave Tube Amplifier with 20 kW of
minimum peak power.
RaXPol’s high temporal resolution is achieved
by having the maximum speed of the pedestal be 180°
s-1
azimuth and 20° s-1
elevation. Therefore, assuming
10 elevations are the desirable number of elevations to
be scanned, the RaXPol can complete an entire volume
scan in 20 s. Given this rapid-scan capability and
lowered dwell-time, sensitivity can be expected to
decrease. According to ProSensing, the sensitivity
during rapid-scan mode is -16 dBZ at 30 km. Also, a
maximum unambiguous velocity of 31 ms-1
means that
weak tornadoes can be sampled without dealing with
cumbersome aliased velocity data. Velocities sampled
over 31 ms-1
will have to be unfolded in order to
determine the true velocity. Attenuation is another
potential issue facing the RaXPol. Radars that operate
in X-band are known to have attenuation issues.
Therefore, any research done in which a tornado is to
be sampled should have the radar scan the storm with
minimal precipitation between the radar and the tornado
to prevent severe attenuation near the tornado.
The dataset includes data on a supercell that
reportedly produced 2 tornadoes. According to the
Tulsa, Oklahoma NWS office, the first tornado
(Tornado 1) touched down at 0109 UTC approximately
7 mi NNW of Bigheart, Oklahoma. Visibility was
reduced from the radar’s perspective as a result of
precipitation between the radar and tornado, so we
cannot confirm exactly what time the tornado touched
down. It is possible that the tornado touched down a
few minutes earlier and was not reported until 0109
UTC; however, this cannot be proven. A case is made
for the tornado potentially touching down at 0105:30
UTC in Section 5.2. The second tornado (Tornado 2)
touched down a few minutes after Tornado 1 lifted.
Lyakhov, et al. p. 3
This particular report came to the SPC at 0125 UTC
with the wording “several storms chasers ... storm
spotters and at least one off duty National Weather
Service meteorologist witnessed this tornado. It lasted
10 to 15 minutes and produced no known damage.”
The exact time of Tornado 1 dissipation and Tornado 2
formation is not known to the authors, once again, due
to low visibility and the author’s distance from the
tornado.
In the case presented herein, the RaXPol was
located approximately 20 km east of Tornado 1 during
data collection. The tornado was observed reasonably
well, however, significant attenuation is apparent on the
opposite (western) side of the hail/precipitation core
(Figure 9). The radar performed volume scans with 13
elevations with the 0.8° elevation scan being the lowest
and 13° the highest.
3. STORM ENVIRONMENT
The supercell formed within an environment
with convective available potential energy (CAPE)
values around 3500 J kg-1
and storm relative
environmental helicity (SREH) values around 155 m2 s
-
2, according to the proximity sounding taken at 0000
UTC 19 June 2011 in Springfield, Missouri (Figure 1).
The surface plot in Figure 2 indicates that conditions
were favorable for severe storm development in
northeastern Oklahoma and southeastern Kansas due to
sufficiently warm temperatures (around 90°F) and high
dewpoints (70-75°F). A stationary front was present
from east central Kansas to south central Kansas with a
cold front extending into west central Oklahoma (not
shown). The boundary associated with the stationary
front provided adequate surface forcing for severe
storms to develop.
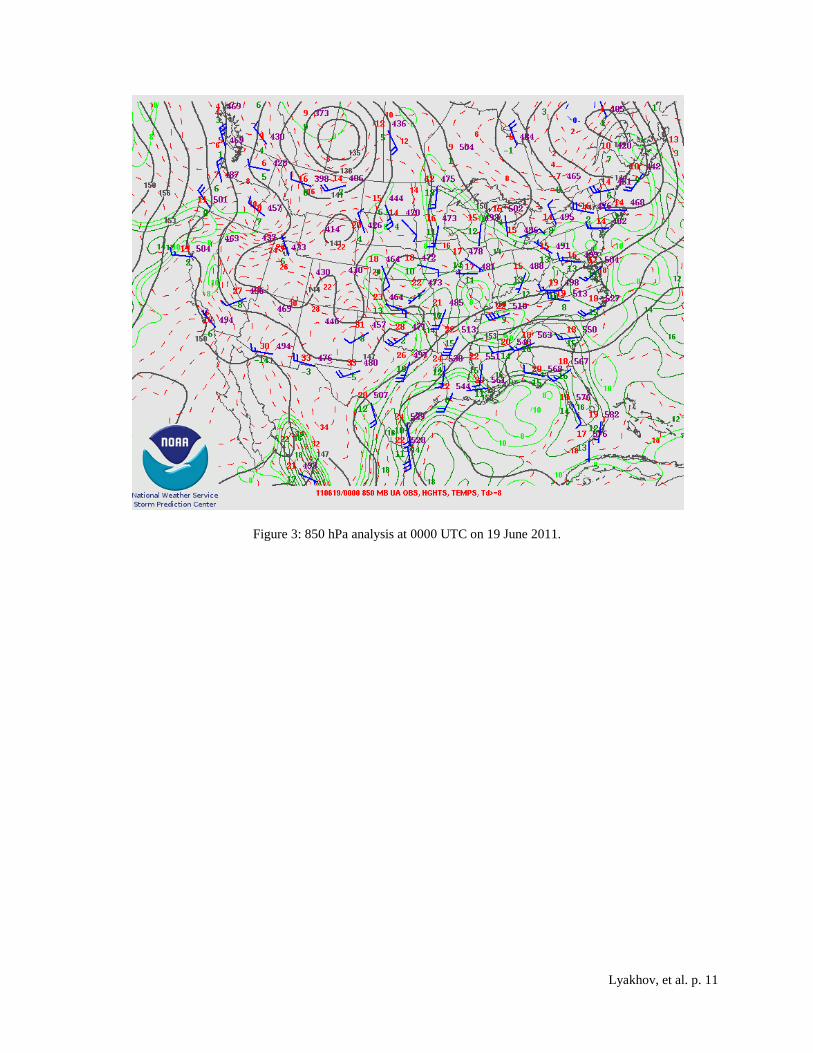
The 0000 UTC 850 hPa analysis (Figure 3)
shows that temperatures are between 20 and 30°C with
dewpoints between 10 and 20°C in the region where
the supercell developed. Warm air advection is evident
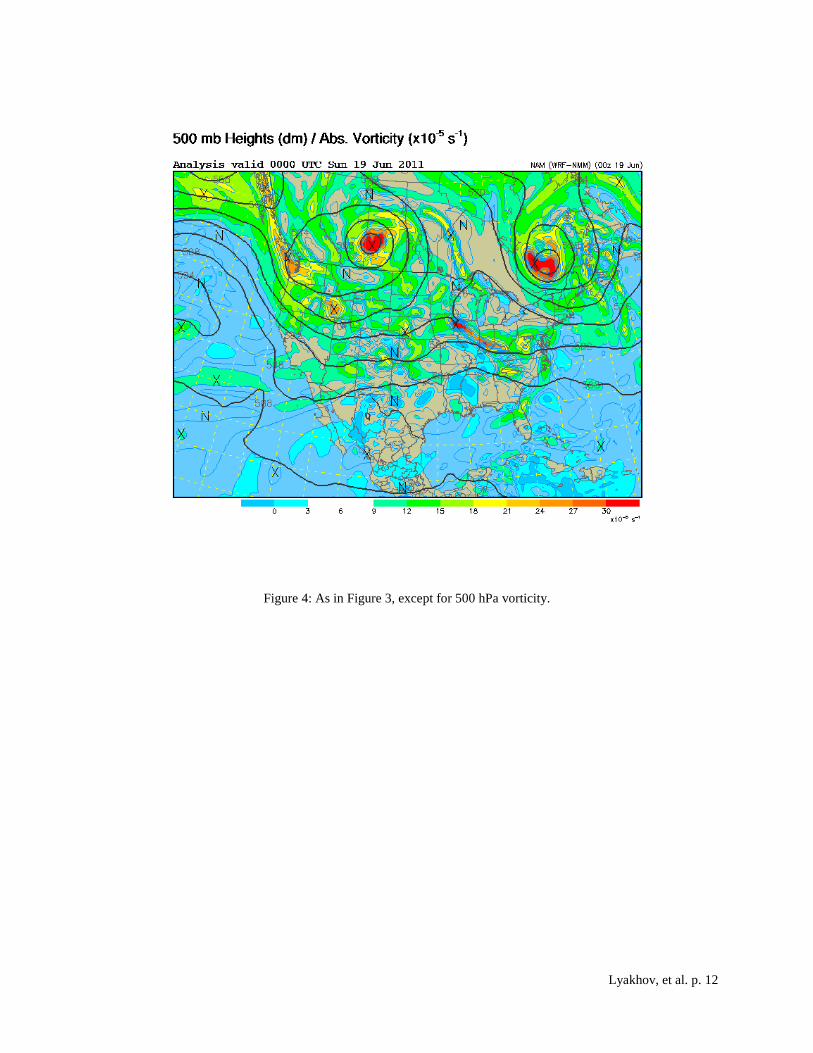
across Oklahoma into southwestern Missouri. A
shortwave trough is visible in the 500 hPa vorticity and
wind analysis (Figures 4 and 5 respectively) stretching
from north to south from western South Dakota to north
central Texas. The 300 hPa analysis reveals a lack of
any substantial jet streams overhead (not shown),
although winds at this level were still 50-60 kts as
shown by the sounding. The presence of a 500 hPa
shortwave trough and 850 hPa warm air advection acted
to enhance synoptic scale lift, potentially providing
additional support for severe storm development.
Storms formed around 2300 UTC along the
Kansas and Oklahoma border and progressed eastward.
The supercell discussed in this paper formed near
Arkansas City, Kansas and proceeded to traverse east
southeastward, nearly parallel to the Kansas and
Oklahoma border.
4. POLARIMETRIC RADAR SIGNATURES
Common polarimetric radar signatures of
supercells were documented by Kumjian and Ryzhkov
(2008). These signatures are found by analyzing the
values of variables such as horizontal reflectivity (Z),
ZDR, ρhv and KDP. A few of the common polarimetric
radar signatures were documented with this supercell
including the low-level inflow signature, the low-level
hail signature, and the ZDR arc. No clear tornadic debris
signature (TDS) was documented; potential reasons for
this will be discussed in this section.
4.1 Low-level inflow signature
Strong low-level inflow was evident during the
mature stage of the supercell. A “tongue” of lower ρhv
values are seen wrapping around the mesocyclone from
east of the circulation to the northwestern flank of the
circulation. These lowered ρhv values are collocated
with lowered Z values. The low Z values wrapping
around the mesocyclone are a feature of a Bounded
Weak Echo Region (BWER). Given Z values in the
12-22 dBZ range collocated with ρhv values in the 0.65-
0.75 range, such as in Figure 6, it can be reasonably
assumed that inflow winds were picking up irregularly
shaped nonmeteorological scatterers such as dirt,
leaves, bugs and grass and lifting them high enough to
be detected by radar. Precipitation particles may have
been mixed in as well (Kumjian and Ryzhkov, 2008).
This image was taken at approximately the time of
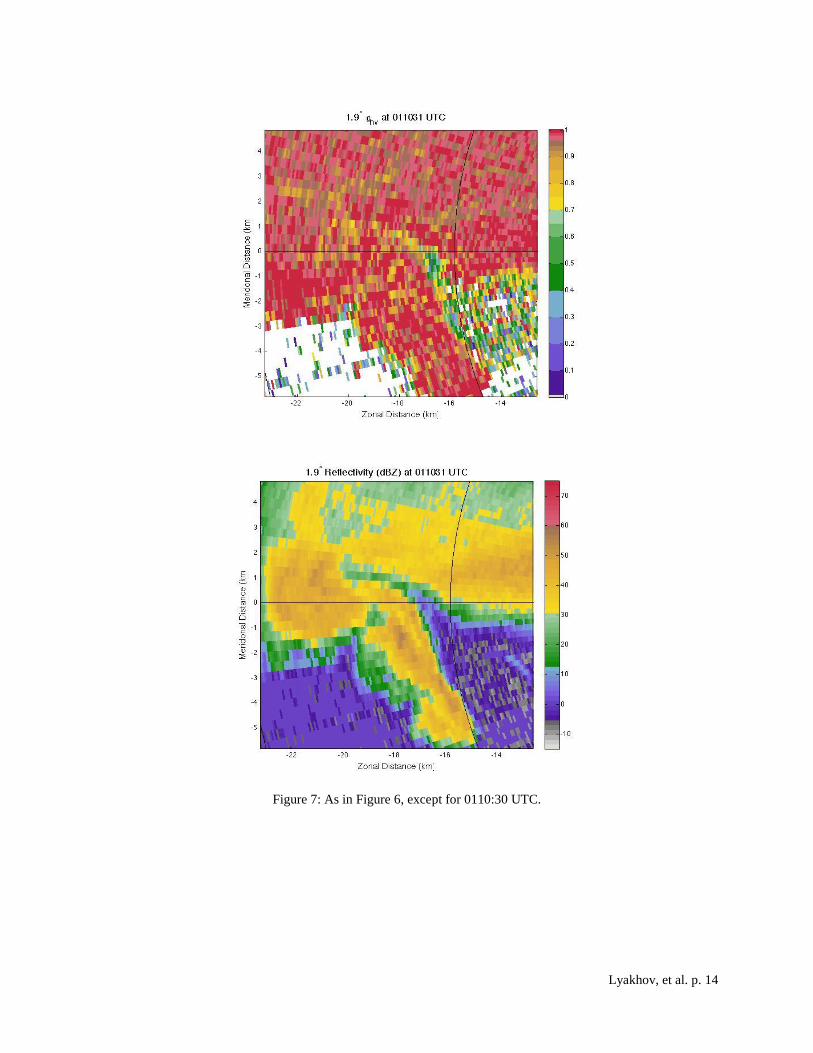
tornadogenesis. By 0110:30 UTC, the low-level inflow
signature is not as prominent given ρhv values not
wrapping as far around the mesocyclone (Figure 7).
This may be a result of weaker winds picking up fewer
nonmeteorological scatterers or more precipitation
falling as a result of a weaker updraft.

Lyakhov, et al. p. 4
4.2 Low-level hail signature
Severe hail (larger than or equal to 1 inch in
diameter) was reported with this storm (see SPC storm
reports website). The largest hail diameter reported
was 2.5 in, 3.2 km ENE of Maple City, KS at 2342
UTC. Unfortunately, the radar was in transit during
this time.
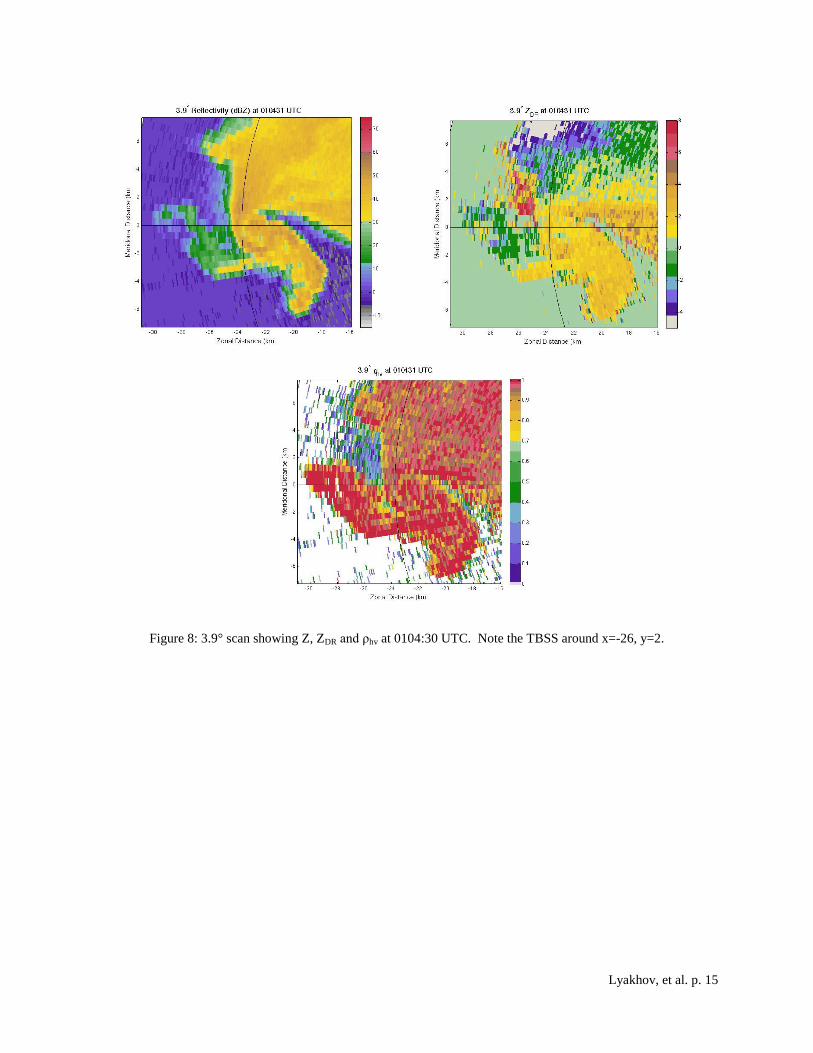
A polarimetric Three-Body Scatter Spike
(TBSS) is observed, characterized by the presence of an
area of low Z (0-10 dBZ), high ZDR (6-8 dB) and very
low ρhv (0.1-0.3) values a few km to the northwest of
the mesocyclone. Figure 8 shows the Z, ZDR and ρhv
values at 3.9° tilt at 0104:30 UTC. With the area most
likely to contain hail being located between the radar
and the TBSS in the 0104:30 UTC scans, it can be
assumed that hailstones present within the radar beam
caused such a signature. Previous research on the
TBSS concluded that it is caused by Mie-scattering
from an area containing a large concentration of large
hydrometeors (Lemon, 1998) and by multiple scattering
between hydrometeors and the ground (Zrnić, 1987).
Lemon (1998) also came to the conclusion that the
presence of a TBSS preceded surface hail fall, and can
therefore be used by forecasters to assess the likelihood
of hail falling with a particular storm.
The 0107 UTC scan (Figure 9) at the same
elevation reveals an area of anomalously depressed Z
and ZDR values oriented east-west stretching for
approximately 10 km to the north of the mesocyclone.
This is likely due to attenuation as a result of the
presence of a hail core. Hail, large raindrops, or a
combination of both to the north and northeast of the
mesocyclone is implied given the presence of high Z
and relatively lower ρhv values (45-60 dBZ and 0.75-
0.90 respectively) where there is no attenuation.
Attenuation makes determining the true ZDR value
where hail likely exists difficult. However, high ZDR is
seen to the east of the area of attenuation. Therefore, it
is reasonable to assume ZDR is in fact high despite the
attenuation making it seem as though it were lower.
The size of these hailstones is theorized to be smaller
than 1.5-2.0 cm. Hail of this size often obtains a water
shell (Rasmussen et al. 1984). The presence of water
on the surface of the hailstone tends to reduce the
chaotic nature of its orientation, thus increasing ZDR.
When scanned by radar, small, wet hailstones appear as
large raindrops with high ZDR values (Kumjian and
Ryzhkov, 2008). However, Kumjian and Ryzhkov
(2008) mention that the effects of intense attenuation
and resonance scattering at shorter wavelengths means
that radar measurements at C-band require special
considerations. Such considerations should be applied
to radar measurements at X-band, such as in this case.
There may well be large hail present downstream of the
mesocyclone despite high ZDR readings. The
combination of very large raindrops, large, dry hail and
melting hailstones can produce high ZDR. Therefore, it
is impossible to know with a high degree of certainty
whether or not very large hail existed with this
supercell at this time by only looking at the radar data.
Nevertheless, SPC storm reports indicate that pea to
quarter sized hail was falling during the time these
scans were taken.
4.3 ZDR arc
The ZDR arc is typically found along the
southern edge of the forward-flank downdraft (FFD)
where locally higher ZDR values form an “arc” shape.
Size sorting of particles by the updraft plays a key role
in forming the arc. These high ZDR values are primarily
associated with very large, oblate raindrops. ZDR drops
off with increasing distance from the updraft.
Intuitively, the largest particles will exist close to the
updraft and will fall to the ground close to the updraft
while smaller particles will be able to stay suspended
for a longer period of time and can therefore be carried
further downstream of the updraft. Moreover, Kumjian
and Ryzhkov (2009) show that the ZDR arc can serve as
a proxy for low-level storm-relative environmental
helicity (SREH; Davies-Jones et al. 1990). A stronger
ZDR arc implies that horizontal vorticity is being
ingested by the updraft, which may precede the
development of a tornado (Kumjian and Ryzhkov,
2008).
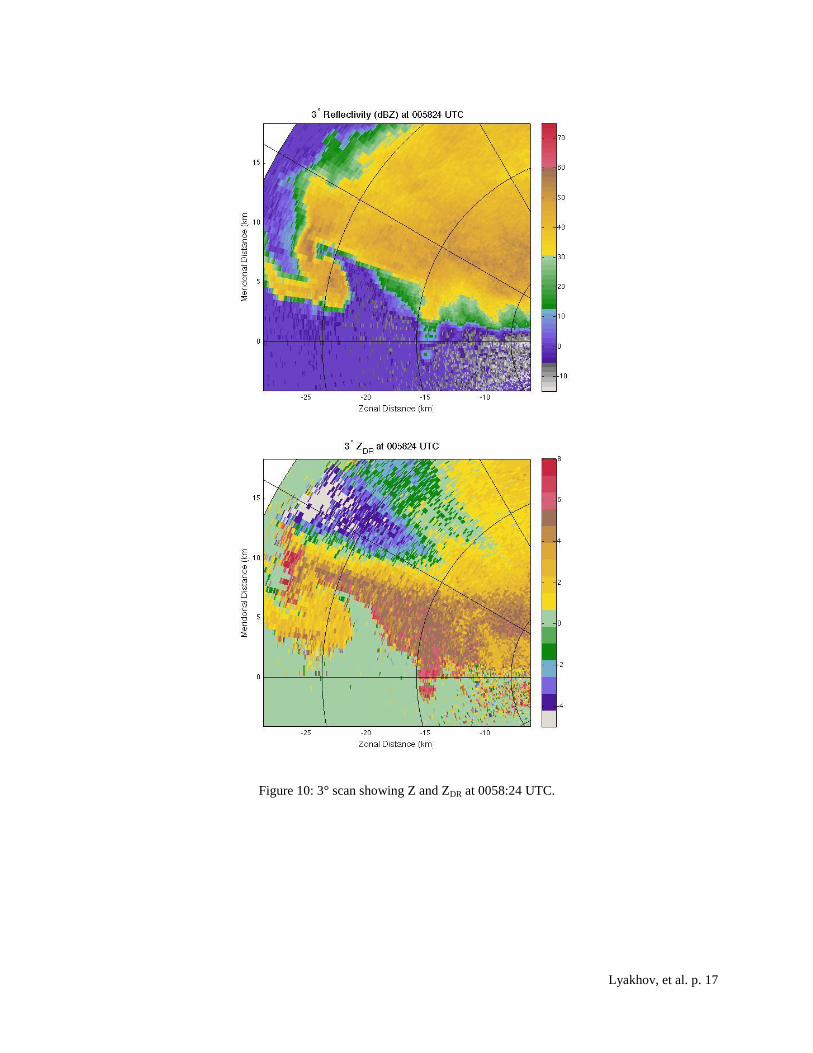
The 0058:24 UTC 3° elevation scan (Figure
10) reveals a striking ZDR arc characterized by ZDR
values in the 5-7 dB range. ZDR was this high for a few
more scans before being primarily in the 4-5 dB range
through the majority of the supercell’s mature stage.
However, from 0108-0111 UTC, the ZDR arc can be
seen decreasing in prominence and a region of lower
ZDR values develops within the arc (Figure 11). This
suggests a reduction in the amount of horizontal
Lyakhov, et al. p. 5
vorticity being ingested by the updraft, which can lead
to a weakening tornadic circulation. Doppler velocity
data did indeed depict a weakening tornadic circulation
at the same time, which will be discussed in Section
5.2.
4.4 Tornadic debris signature
Tornadic debris signatures (TDS) are
characterized by anomalously low ρhv values along with
low ZDR and high Z values within the hook of the
storm. The random orientation and irregular shape of
most debris lofted by tornadoes causes ρhv to be
lowered. The chaotically tumbling nature of large
debris would cause ZDR to decrease while the presence
of many small or a few large pieces of debris would
cause high Z values. Previous research on the detection
of tornadoes using polarimetric radar has postulated
that the tornado has to be at least F3 strength in order
for a TDS to persist for multiple scans. It was also
found that most weak tornadoes did not produce a TDS
likely owing to the fact that their winds are too weak to
cause or lift debris or that they are too short lived,
which would cause radars with poor temporal
resolution to miss the debris all together (Ryzhkov et al.
2005b). However, Kumjian and Ryzhkov (2008)
mention that KOUN detected a TDS with an EF-1
tornado on 9 May 2007.
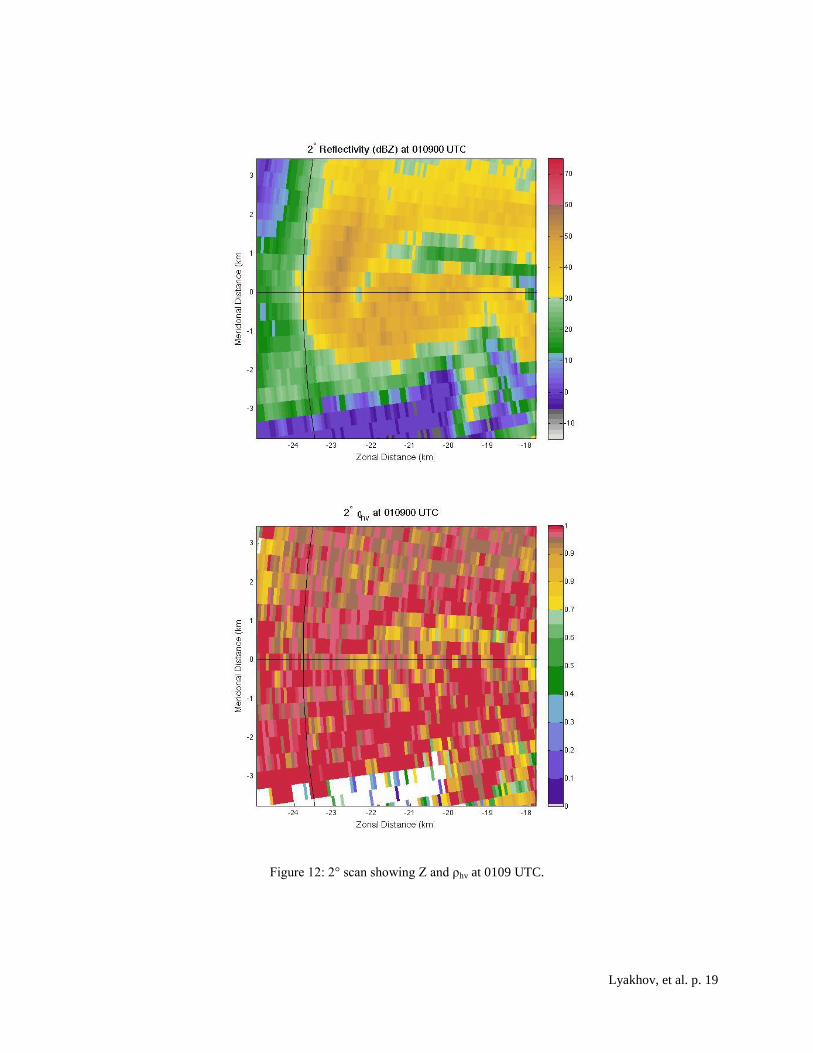
In the case presented here, no clear TDS was
documented most likely due to the tornado’s weak (EF-
0) winds. Interestingly, the 2° scan at 0109 UTC
(approximately the time of tornado touchdown) shows
reduced ρhv (0.75-0.85) near the circulation (Figure 12),
which may indicate some light debris being lofted. It is
unlikely that there was any large debris lofted by the
tornado. Its touchdown location was likely not a major
reason for the lack of a TDS because heavily wooded
areas should still have the ability to provide sufficient
debris to produce a TDS. However, if the winds are too
weak to break off enough branches and suspend them in
the air, no TDS can be expected to form. Other
possible reasons for a lack of a TDS include the radar
being too far away, so radar beams may have been
scanning above the level where the debris was located.
In addition, the signal from precipitation may have been
stronger than the signal from the small amount of debris
lofted, which would obscure the debris signal.
5. DOPPLER VELOCITIES and AZIMUTHAL
SHEAR
This section will analyze the Doppler
velocities and azimuthal shear associated with the low
and midlevel mesocyclones prior to, during, and after
tornadogenesis. Specifically, the time leading up to
tornadogenesis and the time following tornado
dissipation will be examined. Velocities of the tornadic
circulation will be analyzed as well. As a reminder,
only the first tornado spawned by the supercell
(Tornado 1) will be analyzed. Given that the radar was
approximately 20 km away from the tornado at its
closest, high enough resolution data are not available to
adequately sample the tornado itself. However, the
tornadic circulation was observable by radar with the
caveat of velocities measured within the gates being
highly averaged. Topics to be addressed include how
the strength of the shear within the low-level and
midlevel mesocyclones changed (if at all) prior to,
during, and after tornadogenesis. In addition, the
strength of the gate-to-gate shear associated with the
EF-0 tornado will be examined.
5.1 Mid and low-level mesocyclone
Figure 13 illustrates the change in azimuthal
shear with time of the midlevel and low-level
mesocyclones. The elevation angles that were
determined to have sampled the mid and low-level
mesocyclones are the 9.9° and 3.9° elevation angles
(respectively). The distance above ground of the
midlevel mesocyclone sampled by the 9.9° scan is
approximately 3.4 km. Meanwhile, the distance above
ground of the low-level mesocyclone sampled by the
3.9° scan is approximately 1.45 km. Shear with the
midlevel mesocyclone generally remained between
.0012 and .0019 s-1
.
Meanwhile, azimuthal shear with the low-level
mesocyclone varied between .0009 and .0016 s-1
.
Values appear to show an increasing trend leading up to
tornadogenesis (prior to 0109 UTC) and a decreasing
trend after tornado dissipation (around 0109 UTC).
Unlike in the low-level mesocyclone, azimuthal shear
after tornado dissipation increases with the midlevel
mesocyclone. Therefore, we cannot conclude that
midlevel mesocyclone weakening is required for
tornado dissipation.
Lyakhov, et al. p. 6
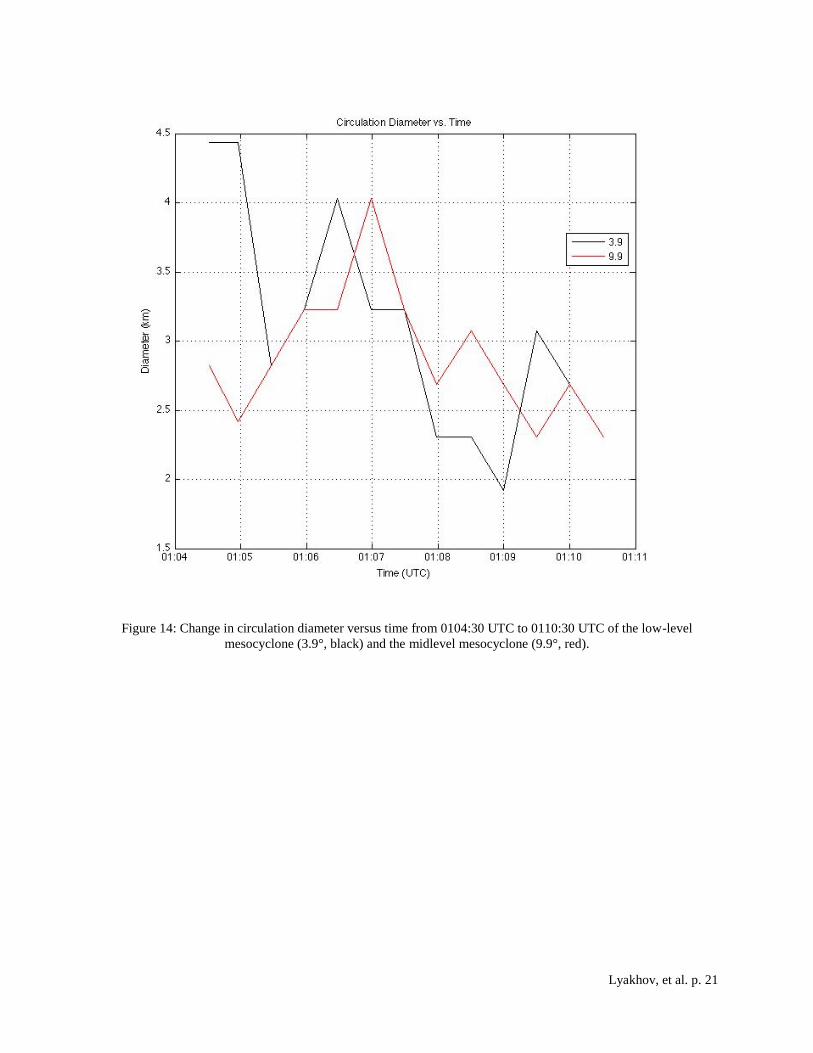
Additionally, Figure 14 shows the change of
the circulation diameter with time. Both the mid and
low-level mesocyclones appear to contract their
circulations after 0107 and 0106:30 UTC, respectively.
Notably, the low-level mesocyclonic circulation
contracts from about 4 km at 0106:30 UTC to about 2
km at 0109 UTC, followed by an expansion to about 3
km thirty seconds later. Angular momentum
considerations associated with tornadogenesis at the
surface are likely relevant in this case.
It is worth noting that the 8.9° scan shows a
distinct increase in azimuthal shear between 0107 and
0109 UTC (not shown). Maximum azimuthal shear
was recorded at .0058 s-1
at 0109 UTC before dropping
to .0025 s-1
in the following scan thirty seconds later.
Potential reasoning for this is that a tornado vortex
signature (TVS) was noted in the 8.9° scan at 0109
UTC (Figure 15). A TVS was also present at the 0.8°
scan at the same time (Figure 16), and was observed in
radial velocity from 0.358 km to 3.175 km above
ground (0.8° to 8.9°, respectively) (not shown), which
is the maximum height of the circulation. This would
account for the seemingly anomalous spike in
azimuthal shear.
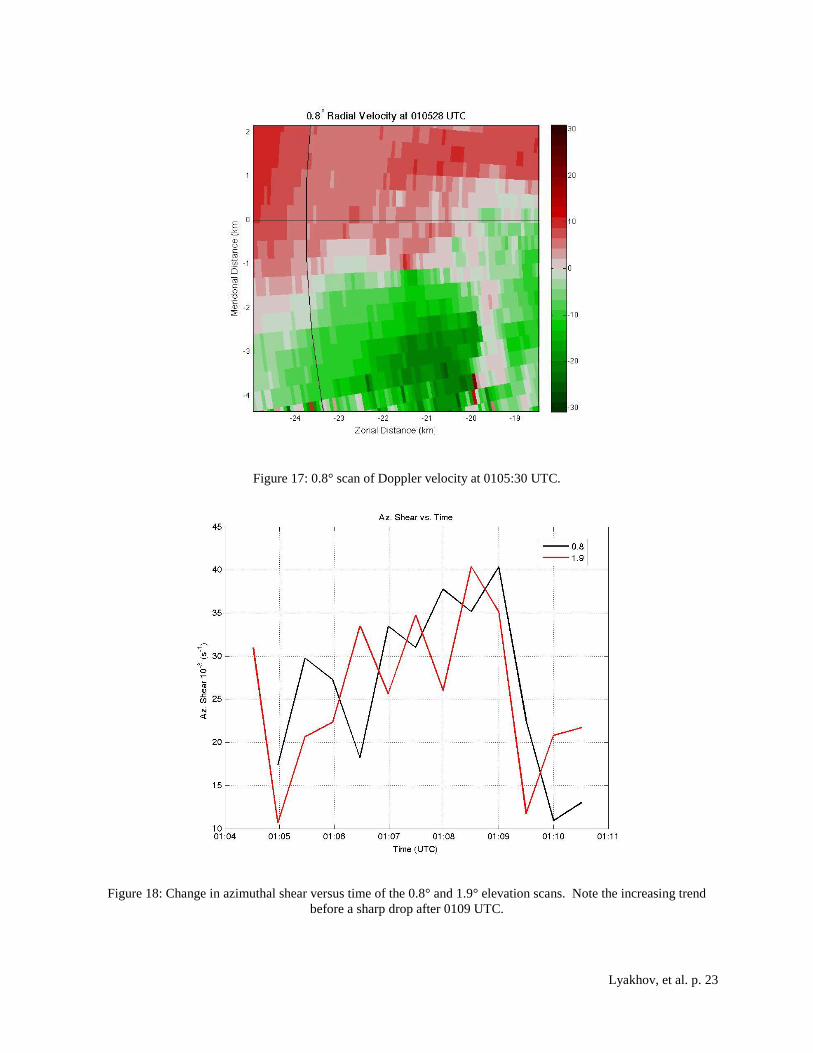
5.2 Tornado
Although ground confirmation of touchdown
time is unavailable, the tornado may have been on the
ground as early as 0105:30 UTC given the maximized
gate-to-gate velocities in Figure 17. Nonetheless, it
may just have been the funnel cloud that was being
sampled.
The 0.8° and 1.9° elevation angles were
utilized to determine the azimuthal shear associated
with the tornadic circulation near the surface. Height
above ground of the radar beams sampling the tornado
is approximately 350 m with the 0.8° elevation scan
and 750 m with the 1.9° scan. Figure 18 shows a
general trend of increasing shear values with time.
Maximum shear values were recorded at 0108:30 UTC
and 0109 UTC with the 1.9° and 0.8° scans
(respectively). This peak value that was recorded is
approximately .0041 s-1
for both elevation angles.
Figure 16 shows the velocity field in the 0.8° scan at
0109 UTC. This is when the strongest gate-to-gate
velocities were measured at this elevation: 31 ms-1
. A
notable decline in shear is evident in both elevation
scans at 0109:30 UTC. Thus, it is reasonable to assume
that the tornado dissipated between 0109 and 0109:30
UTC, which was corroborated by visible observations
of the funnel becoming more poorly defined. Such a
rapid weakening indicates that rapid-scan observations
are needed to understand tornado dissipation.
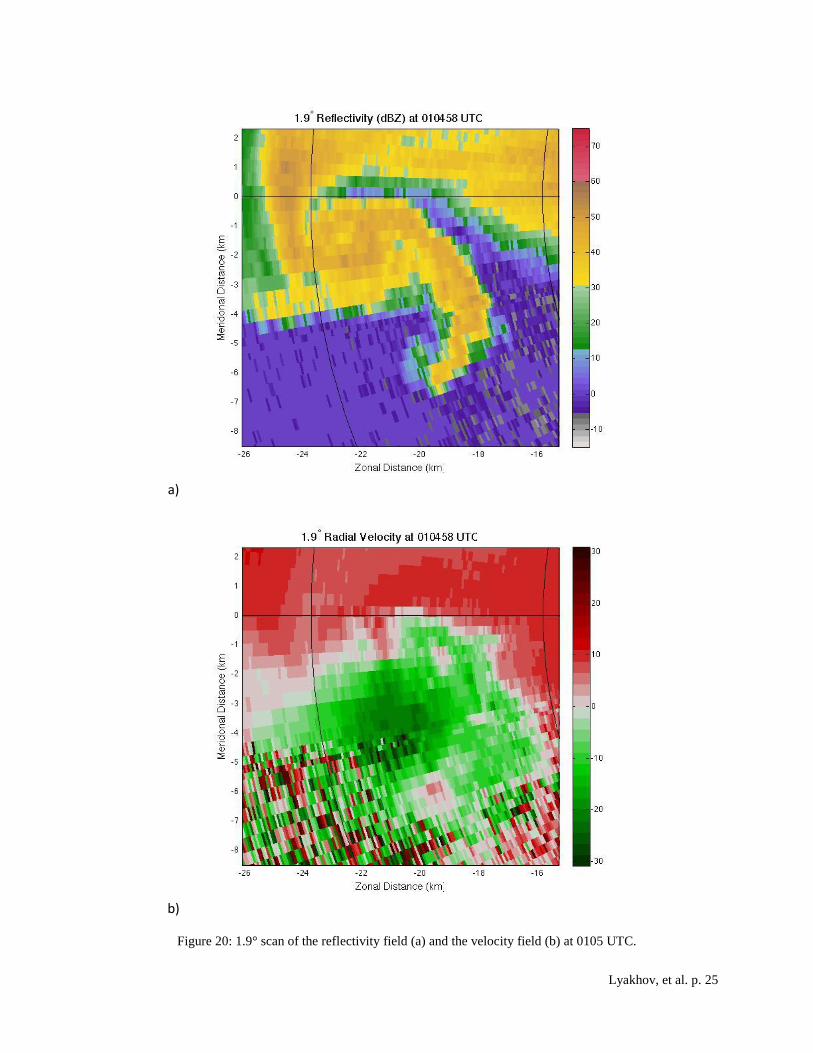
6. MESOANTICYCLONE
The 1.9° elevation scan at 0101:30 UTC
reveals an appendage structure in the reflectivity
extending southward from the hook echo (Figure 19a).
Velocity data reveal the presence of relatively strong
(~25 ms-1
) inbound winds likely associated the rear-
flank gust front surge a few km west of this appendage
(Figure 19b). By 0105 UTC, an anticyclonic
circulation is visible in the velocity data collocated with
the beginnings of what will later become the
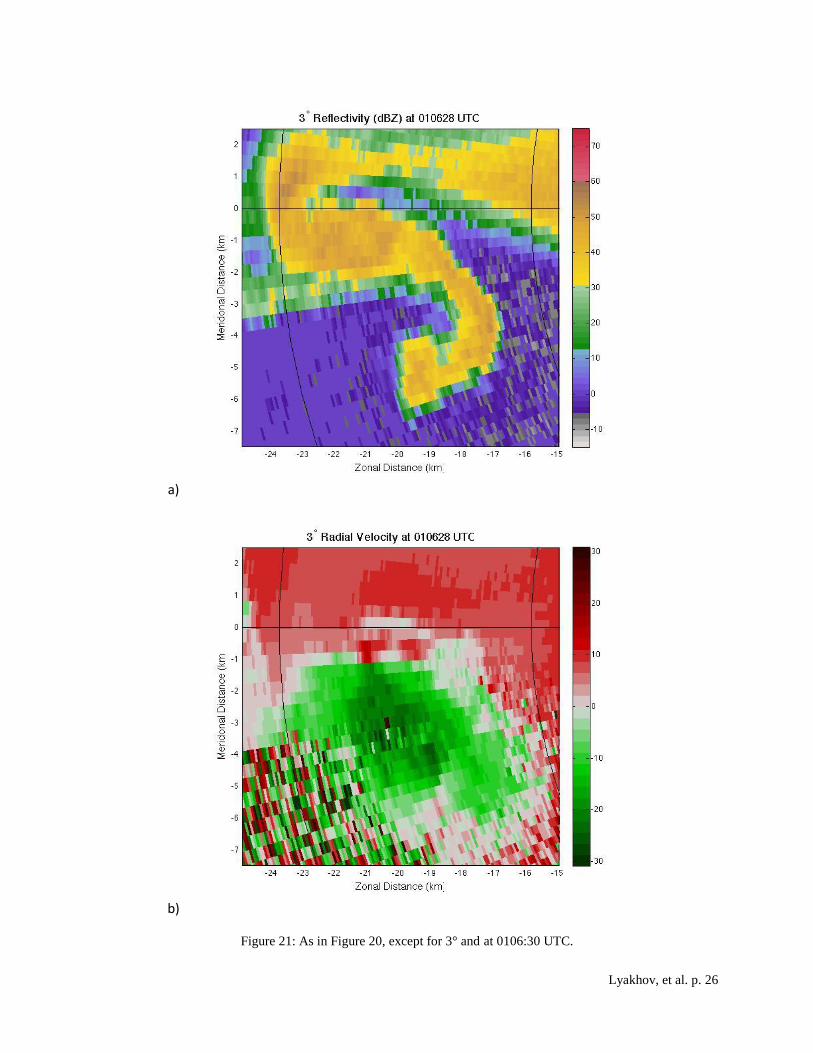
anticyclonic hook (Figure 20). This anticyclonic hook
is more prominent in the 3° scan at 0106:30 UTC
(Figure 21). The circulation associated with the
mesoanticyclone is noticeably weaker than that of the
tornadic circulation approximately 5 km to the NNW.
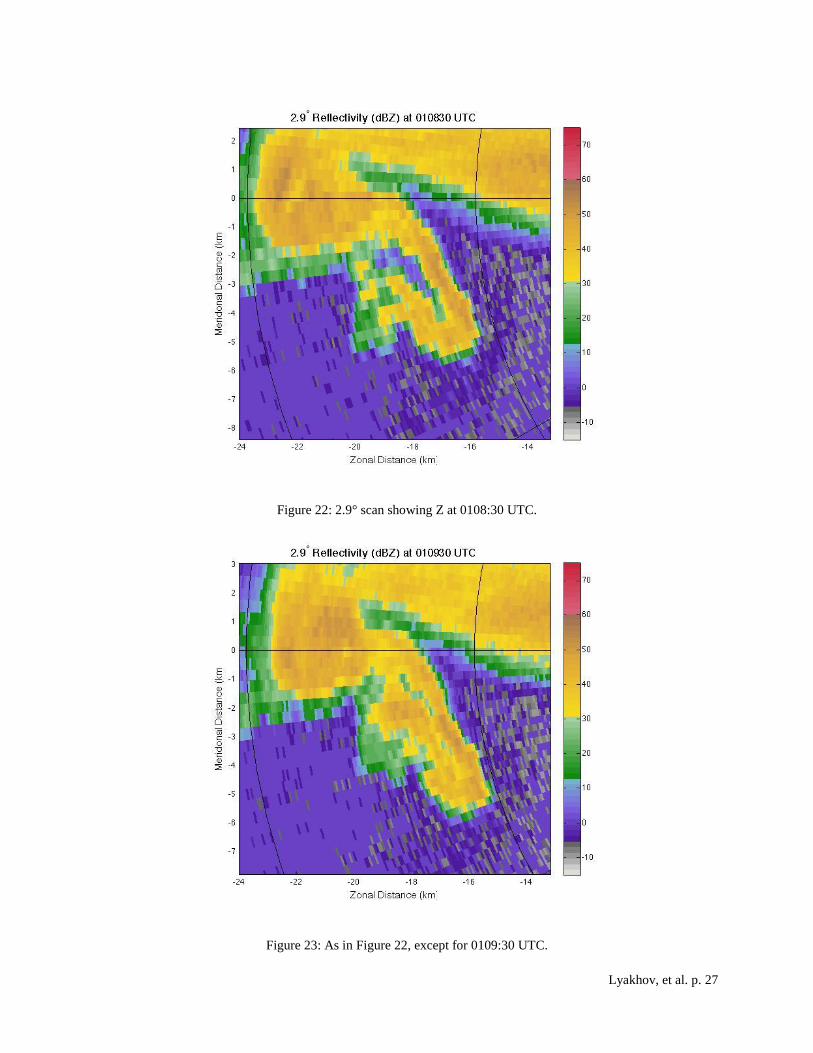
At 0108:30 UTC, the reflectivity field shows the 1-km
wide band of higher reflectivities (30-40 dBZ)
wrapping around the western side of the
mesoanticyclone (Figure 22), and by 0109:30 UTC, the
hook signature is no longer well-defined (Figure 23).
The mesoanticyclone later weakens probably due to
influences of occlusion of the updraft. A linear feature
associated with the mesoanticyclone is noted in
reflectivity. This linear feature is more prominent at
0111 UTC (Figure 24).
7. SUMMARY
Successful scans of a supercell and associated
weak (EF-0) tornado were made on 18 June 2011 with a
rapid-scan, polarimetric, X-band mobile radar known as
the RaXPol. Common polarimetric signatures
associated with supercells were noted with the storm
including the low-level inflow signature, low-level hail
signature and the ZDR arc.
The low-level inflow signature is characterized
by a narrow band of low ρhv and Z values wrapping
around the mesocyclone. This occurs when
nonmeteorological scatterers such as leaves, dirt and
bugs are picked up and carried by the inflow winds.
This signature became less prominent at approximately
Lyakhov, et al. p. 7
the time of tornado dissipation, suggesting weakened
inflow winds or more precipitation in the inflow region
due to a weaker updraft. The low-level hail signature
was characterized by attenuation as well as high Z and
ZDR and low ρhv values to the north and northeast of the
mesocyclone. Pea to quarter size hail was indeed
reported falling with the storm. In addition, a
polarimetric TBSS was noted, caused by multiple
scattering of the radar beams between hail and the
ground. A ZDR arc, in which a band of high ZDR exists
on the southern edge of the FFD, was seen. This can
serve as a proxy for storm-relative environmental
helicity. The ZDR arc became less prominent at around
the time of tornado dissipation. This may imply a
decrease in the amount of horizontal vorticity ingested
by the updraft, which can precede tornado dissipation.
No clear TDS was identified, although slightly lowered
ρhv values at 0109 UTC may indicate some light debris
being lofted.
Trends of strengthening azimuthal shear
before 0109 UTC (tornado dissipation) were
documented at the levels where the tornado, low-level
mesocyclone and midlevel mesocyclone existed. Shear
at the two lowest tilts decreased dramatically after 0109
UTC, within only 30 – 60 s. Azimuthal shear within
the low-level mesocyclone decreased by almost a factor
of two after 0109 UTC. However, shear within the
midlevel mesocyclone maintained its increasing trend.
For that reason, it cannot be concluded that the
weakening of the midlevel mesocyclone is a
prerequisite for tornado dissipation. Furthermore, in
addition to the cyclonic circulation associated with the
tornado and mesocyclone, an anticyclonic circulation
developed on the southern end of the supercell’s hook,
likely a result of the rear-flank gust front surge. It
developed a few minutes prior to tornadogenesis (with
the cyclonic circulation) and dissipated at about the
same time as the dissipation of the tornado (0109 UTC).
The rapid-scan and dual-polarization
capability of the RaXPol allowed the researchers to
examine the rapidly evolving structures and get a sense
of hydrometeor types and locations within the supercell.
Additional research should be conducted on supercells
that do not produce tornadoes, ones that only produce
funnel clouds, and ones that produce violent tornadoes
to compare their polarimetric signatures in the hopes
that once the WSR-88D radar network acquires
polarization capability; forecasters will be better able to
distinguish among the different types of tornado events
caused by supercells.
8. ACKNOWLEDGEMENTS
This paper was made possible thanks to
Daphne LaDue and the Research Experience for
Undergraduates (REU) Program. Additional thanks to
Tim Bonin for helping with the radar during
deployment. This work was prepared by the authors
with funding provided by National Science Foundation
Grant No. AGS-1062932. The funding for the RaXPol
was provided by National Science Foundation Grant
No. AGS-0821231. The statements, findings,
conclusions, and recommendations are those of the
authors and do not necessarily reflect the views of the
National Science Foundation.
9. REFERENCES
Bluestein, H.B., M.M. French, R.L. Tanamachi, S.
Frasier, K. Hardwick, F. Juyent, and A.L.
Pazmany, 2007b: Close-range observations of
tornadoes in supercells made with a
dual-polarization, X-band, mobile, Doppler
radar. Mon. Wea. Rev., 135, 1522-1543.
Davies-Jones, R., D.W. Burgess, and M. Foster, 1990:
Test of helicity as a forecast parameter.
Preprints, 16th Conf. on Severe Local Storms,
Kananaskis Park, Alberta, Amer. Meteor. Soc.,
588-592.
Heinselman, P.L., and A.V. Ryzhkov, 2006: Validation
of polarimetric hail detection. Wea.
Forecasting, 21, 839–850.
Kumjian, M.R. and A.V. Ryzhkov, 2008: Polarimetric
signatures in supercell thunderstorms. J. Appl.
Meteor. and Climatology,48,1940-1961.
Kumjian, M.R. and A.V. Ryzhkov, 2009: Storm-
relative helicity revealed from polarimetric
radar measurements. J. Atmos. Sci., 66, 667-
685.
Lemon, L.R., 1998: The radar “Three-Body Scatter
Spike”: An operational large-hail signature.
Wea. Forecasting, 13, 327-340.
Loney, M.L., D.S. Zrnić, J.M. Straka, and A.V.
Ryzhkov, 2002: Enhanced polarimetric radar
signatures above the melting level in a

Lyakhov, et al. p. 8
supercell storm. J. Appl. Meteor.,41, 1179-
1194.
Palmer, R.D., D. Bodine, M. Kumjian, B. Cheong, G.
Zhang, Q. Cao, H. Bluestein, A. Ryzhkov, T.-
Y. Yu, Y. Wang, The 10 May 2010 Tornado
Outbreak in Central Oklahoma: Potential for
New Science with High-Resolution
Polarimetric Radar, Bull. Amer. Meteor. Soc.,
in press.
Rasmussen, R.M., V. Levizzani and H.R. Pruppacher,
1984: A wind tunnel and theoretical study on
the melting behavior of atmospheric ice
particles, III: Experiment and theory for
spherical ice particles of radius ≥ 500 µm. J.
Atmos. Sci., 41, 381-388.
Ryzhkov, A.V., T.J. Schuur, D.W. Burgess, and D.S.
Zrnić, 2005b: Polarimetric tornado detection.
J. Appl. Meteor., 44, 557–570.
Van Den Broeke, M. S., J. M. Straka, and E. N.
Rasmussen, 2008: Polarimetric radar
observations at low levels during tornado life
cycles in a small sample of classic Southern
Plains supercells. J. Appl. Meteor. Climatol.,
47, 1232–1247.
Zrnić, D.S., 1987: Three-body scattering produces
precipitation signature of special diagnostic
value. Radio Sci., 22, 76-86.

Lyakhov, et al. p. 9
Figure 1: Springfield, Missouri (KSGF) sounding taken 0000 UTC on 19 June 2011.

Lyakhov, et al. p. 10
Figure 2: Station plots of the Central Plains taken at 0007 UTC on 19 June 2011.
Lyakhov, et al. p. 11
Figure 3: 850 hPa analysis at 0000 UTC on 19 June 2011.
Lyakhov, et al. p. 12
Figure 4: As in Figure 3, except for 500 hPa vorticity.

Lyakhov, et al. p. 13
Figure 5: As in Figure 3, except for 500 hPa.
Figure 6: 1.9° elevation scan showing ρhv and Z at 0108:30 UTC.
Lyakhov, et al. p. 14
Figure 7: As in Figure 6, except for 0110:30 UTC.
Lyakhov, et al. p. 15
Figure 8: 3.9° scan showing Z, ZDR and ρhv at 0104:30 UTC. Note the TBSS around x=-26, y=2.

Lyakhov, et al. p. 16
Figure 9: As in Figure 8, except for 0107 UTC. Note the attenuation in the Z and ZDR fields. Also note the slightly
lowered ρhv values where Z values remain high around x=-12, y=1.
Lyakhov, et al. p. 17
Figure 10: 3° scan showing Z and ZDR at 0058:24 UTC.

Lyakhov, et al. p. 18
Figure 11: Time series of the 3° scan showing ZDR at 0108, 0109, 0110 and 0111 UTC. The dissipation of the ZDR
arc is observed during this period.
Lyakhov, et al. p. 19
Figure 12: 2° scan showing Z and ρhv at 0109 UTC.

Lyakhov, et al. p. 20
Figure 13: Azimuthal shear versus time from 0104:30 UTC to 0110:30 UTC for the 3.9° (black) and 9.9° (red)
elevation scans.
Lyakhov, et al. p. 21
Figure 14: Change in circulation diameter versus time from 0104:30 UTC to 0110:30 UTC of the low-level
mesocyclone (3.9°, black) and the midlevel mesocyclone (9.9°, red).

Lyakhov, et al. p. 22
Figure 15: 8.9° scan of the Doppler velocity field at 0109 UTC.
Figure 16: As in Figure 15, except for the 0.8° scan.
Lyakhov, et al. p. 23
Figure 17: 0.8° scan of Doppler velocity at 0105:30 UTC.
Figure 18: Change in azimuthal shear versus time of the 0.8° and 1.9° elevation scans. Note the increasing trend
before a sharp drop after 0109 UTC.

Lyakhov, et al. p. 24
a)
b)
Figure 19: 1.9° scan of the reflectivity field (a) and the velocity field (b) at 0101:30 UTC. Note the appendage in (a)
at x =-21, y=2.
Lyakhov, et al. p. 25
a)
b)
Figure 20: 1.9° scan of the reflectivity field (a) and the velocity field (b) at 0105 UTC.
Lyakhov, et al. p. 26
a)
b)
Figure 21: As in Figure 20, except for 3° and at 0106:30 UTC.
Lyakhov, et al. p. 27
Figure 22: 2.9° scan showing Z at 0108:30 UTC.
Figure 23: As in Figure 22, except for 0109:30 UTC.

Lyakhov, et al. p. 28
Figure 24: As in Figure 22, except for 0111 UTC.