Observation Well Network
28
February 10, 2010 Mr. Jeff Smith, Chairman Imperial Valley Water Authority 25865 E County Road 1000 N Easton, IL 62633 Dear Chairman Smith: The Illinois State Water Survey (ISWS), under contract to the Imperial Valley Water Authority (IVWA), has operated a network of rain gauges in Mason and Tazewell Counties since August 1992 and a network of groundwater observation wells since 1994. The purpose of the rain gauge and groundwater observation well networks is to collect long-term data to determine the impact of groundwater withdrawals during dry periods and during the growing season, and the rate at which the aquifer recharges. This letter serves as the year end report for Year 17 which covers the time period from September 1, 2008 through August 31, 2009. Study Approach Observation Well Network The groundwater observation well network consists of thirteen wells, MTOW-01 through MTOW-13 (figure 1). MTOW-01, located near Snicarte, Illinois, is an inactive, large diameter, hand-dug domestic well that has been monitored by the ISWS since 1958. This well is equipped with a Stevens, Type F water-level recorder that produces a continuous record of the groundwater level on a 32-day paper chart. The remaining observation wells are drilled wells between 2 and 6 inches in diameter. With the exception of MTOW-05 and MTOW-09, these wells are equipped with pressure transducers that electronically log the groundwater level data. In Year 15, a new well was drilled to replace MTOW-1. This new well, named Snicarte #2, will eventually take the place of the original well (MTOW-01 or Snicarte #1) within the monitoring well network. The two wells are still being observed jointly so that their water level data can be correlated. The new well was originally equipped with the same type of Stevens recorder as the original well, but has since been converted to digital data collection. This digital data collection system is outfitted with telemetry which allows access to the data at the ISWS office via a cell phone modem. The final correlation between data from the two Snicarte wells will occur during Year 18. In accordance with our agreement, each well, with the exception of MTOW-05 and MTOW-09, is visited by ISWS personnel during the first few days of the month during irrigation season and approximately bi-monthly during the non-irrigated portion of the year. MTOW-01 is visited monthly because of its inclusion in the Shallow Groundwater Well Network of the ISWS Water and Atmospheric Resources Monitoring (WARM) Program. When the final correlation between Snicarte #1 and Snicarte #2 has taken place, Snicarte #1 will no longer be visited. Snicarte # 2 will take its place within the monitoring well network and will be visited only a few times per year.
Transcript of Observation Well Network

February 10, 2010 Mr. Jeff Smith, Chairman Imperial Valley Water Authority 25865 E County Road 1000 N Easton, IL 62633 Dear Chairman Smith:
The Illinois State Water Survey (ISWS), under contract to the Imperial Valley Water Authority (IVWA), has operated a network of rain gauges in Mason and Tazewell Counties since August 1992 and a network of groundwater observation wells since 1994. The purpose of the rain gauge and groundwater observation well networks is to collect long-term data to determine the impact of groundwater withdrawals during dry periods and during the growing season, and the rate at which the aquifer recharges. This letter serves as the year end report for Year 17 which covers the time period from September 1, 2008 through August 31, 2009. Study Approach Observation Well Network The groundwater observation well network consists of thirteen wells, MTOW-01 through MTOW-13 (figure 1). MTOW-01, located near Snicarte, Illinois, is an inactive, large diameter, hand-dug domestic well that has been monitored by the ISWS since 1958. This well is equipped with a Stevens, Type F water-level recorder that produces a continuous record of the groundwater level on a 32-day paper chart. The remaining observation wells are drilled wells between 2 and 6 inches in diameter. With the exception of MTOW-05 and MTOW-09, these wells are equipped with pressure transducers that electronically log the groundwater level data. In Year 15, a new well was drilled to replace MTOW-1. This new well, named Snicarte #2, will eventually take the place of the original well (MTOW-01 or Snicarte #1) within the monitoring well network. The two wells are still being observed jointly so that their water level data can be correlated. The new well was originally equipped with the same type of Stevens recorder as the original well, but has since been converted to digital data collection. This digital data collection system is outfitted with telemetry which allows access to the data at the ISWS office via a cell phone modem. The final correlation between data from the two Snicarte wells will occur during Year 18.
In accordance with our agreement, each well, with the exception of MTOW-05 and MTOW-09, is visited by ISWS personnel during the first few days of the month during irrigation season and approximately bi-monthly during the non-irrigated portion of the year. MTOW-01 is visited monthly because of its inclusion in the Shallow Groundwater Well Network of the ISWS Water and Atmospheric Resources Monitoring (WARM) Program. When the final correlation between Snicarte #1 and Snicarte #2 has taken place, Snicarte #1 will no longer be visited. Snicarte # 2 will take its place within the monitoring well network and will be visited only a few times per year.

2
Figure 1. Configuration of the 13-site observation well and 25-site rain gauge networks, and location of the irrigation field site, Imperial Valley, 2008-2009.
Groundwater levels for each well for the period of record (September 1, 2008-August 31,
2009) are presented in Appendix A. For MTOW-01, -05, and -09 their entire period of record is shown because they do not have digital recorders. In future reports, MTOW-01 will follow the yearly format as the well is now equipped with a digital recorder which allows for daily data collection. Each hydrograph also contains the daily precipitation for the nearest rain gauge. For observation wells located between several rain gauges, an average of the surrounding rain gauge data is presented. Groundwater level data are presented as groundwater elevation above mean sea level. Rain Gauge Network
A 25-site rain gauge network (Figure 1) with approximately 5 miles between gauges was established in late August 1992. The network was reduced to 20 sites in September 1996. The rain gauge network is maintained by a Mason County resident hired to visit each site monthly. During

3
these visits the charts are changed, data downloaded and other routine services performed. ISWS personnel visit the rain gauge network to perform major maintenance and repairs as needed.
Data reduction activities during Year Seventeen of network operation are similar to those performed during the previous sixteen years. Each month rainfall amounts are totaled from 10-minute digital data and are placed into an array of values for the 20 gauges. This data array is used to check for spatial and temporal consistency between gauges, and to divide the data into storm periods. If the digital data are missing, hourly rainfall amounts from the analog (paper) charts are used. In the rare event that data from both a data logger and the corresponding chart are missing, the hourly amounts are estimated based on an interpolation of values from the nearest surrounding gauges.
Irrigation
Since 1995, the IVWA has estimated irrigation pumpage from wells in the Imperial Valley based on electric power consumption. Menard Electric Cooperative provides the IVWA with electric power consumption data for the irrigation services they provide during the growing season (June-September). The pumpage estimate assumes that application rates for the irrigation wells with electric pumps in Menard Electric Cooperative also are representative of other utilities and other energy sources. Past estimates were based on the assumption that 33 percent of the irrigation wells were served by Menard Electric Cooperative in 1995-1997, 40 percent in 1998-2001.
In 2002, the U.S. Geological Survey (USGS) updated the formula used to calculate pumpage by closely measuring the pumping rate at 77 irrigation systems serviced by Menard Electric. The updated formula provides estimates that are appreciably lower than the previous formula, by approximately 20 percent. Therefore, irrigation withdrawals for the years 1997 to the present were recalculated using the new formula, replacing earlier published estimates (reports through Year 11, September 1, 2002 – August 31, 2003, use the original formula). Data Analysis The Year Seventeen dataset was used to produce summaries for all storm data for each station and the network; monthly, seasonal, and annual rainfall totals; analysis of the rainfall and river stages and groundwater level fluctuations; the data obtained from the long-term monitoring well network; the database showing the individual storms in the Imperial Valley region; and an updated version of the irrigation pumpage data. Rain Gauge Network The Year Seventeen network precipitation of 49.34 inches was above average, 15.55 inches above the previous 16-year’s average of 33.79 inches. It was the second wettest year in the 17 years of network operation. The spring, summer and autumn seasons in Year Seventeen were above average in seasonal total precipitation. Table 1 gives the monthly precipitation totals for each rain gauge within the network during Year 17.

4
Table 1. Monthly Precipitation Amounts (inches), September 2008- August 2009
Month
Station Sep Oct Nov Dec Jan Feb Mar Apr May Jun Jul Aug Total
2
8.62
1.94
1.10
3.04
0.17
2.07
5.25
7.77
5.08
8.31
3.87
7.07
54.293 9.70 2.26 1.07 2.75 0.26 1.94 5.33 6.54 4.18 5.17 3.42 5.99 48.614 8.92 2.10 1.06 2.84 0.12 1.88 5.15 7.05 5.30 4.47 6.40 6.38 51.676 10.61 2.31 0.95 2.84 0.16 1.81 4.18 6.96 4.45 3.51 4.20 7.11 49.097 9.92 2.19 1.26 2.85 0.26 2.00 4.96 6.79 4.92 4.57 2.64 7.08 49.448 9.30 2.24 0.95 2.58 0.20 1.61 4.43 6.01 4.92 5.72 5.18 5.70 48.849 9.31 2.23 0.98 2.64 0.31 2.31 4.48 5.45 3.75 5.13 5.54 7.13 49.26
10 10.98 2.30 0.89 2.76 0.06 2.02 4.54 6.07 3.86 3.60 5.91 8.47 51.4611 10.75 2.34 0.76 2.91 0.20 1.93 4.83 6.81 2.94 3.15 4.67 6.82 48.1112 11.28 2.37 1.11 3.05 0.25 2.23 4.44 6.07 2.84 3.47 4.49 5.85 47.4513 9.60 2.53 0.96 2.58 0.18 2.20 4.36 5.34 4.43 5.53 5.71 7.10 50.5215 12.39 1.86 1.12 3.16 0.38 2.08 4.76 5.52 4.17 3.78 6.37 6.66 52.2516 10.08 1.78 0.64 2.62 0.11 1.80 3.74 5.23 4.40 2.28 5.90 6.03 44.6118 12.18 2.55 1.09 3.21 0.37 2.64 4.95 6.07 4.96 5.99 2.57 4.96 51.5419 11.15 2.48 1.02 2.98 0.15 2.60 4.24 5.92 4.87 5.43 3.97 5.42 50.2320 11.86 1.82 1.03 2.92 0.25 2.38 4.08 5.34 3.45 3.74 6.75 5.99 49.6121 10.15 1.90 0.88 2.95 0.14 2.63 4.20 5.28 2.49 3.72 9.80 5.93 50.0722 10.14 2.04 0.94 2.88 0.14 2.80 3.59 4.98 2.61 4.15 6.77 5.43 46.4723 9.92 2.83 0.92 3.01 0.27 2.30 3.74 4.61 2.80 3.79 5.31 4.58 44.0824 9.64 2.04 0.99 3.05 0.22 2.32 4.76 6.45 4.03 6.87 3.83 4.94 49.14
Avg 10.32 2.21 0.99 2.88 0.21 2.18 4.50 6.01 4.02 4.62 5.16 6.23 49.34
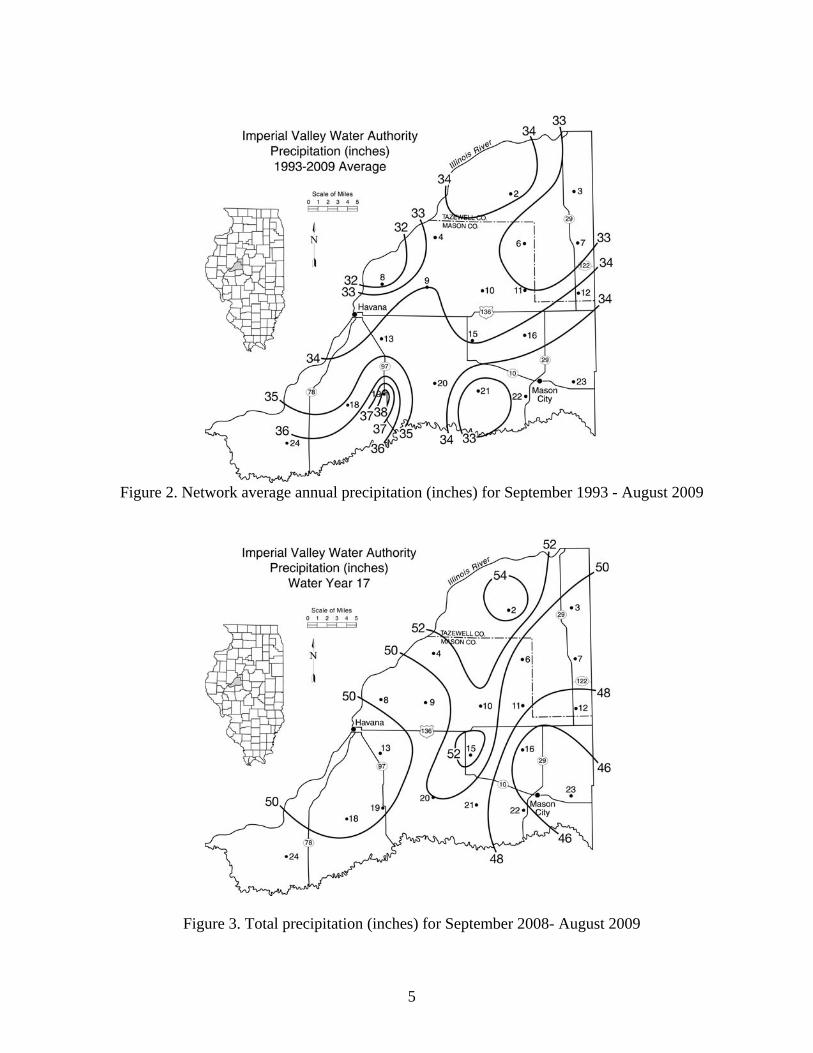
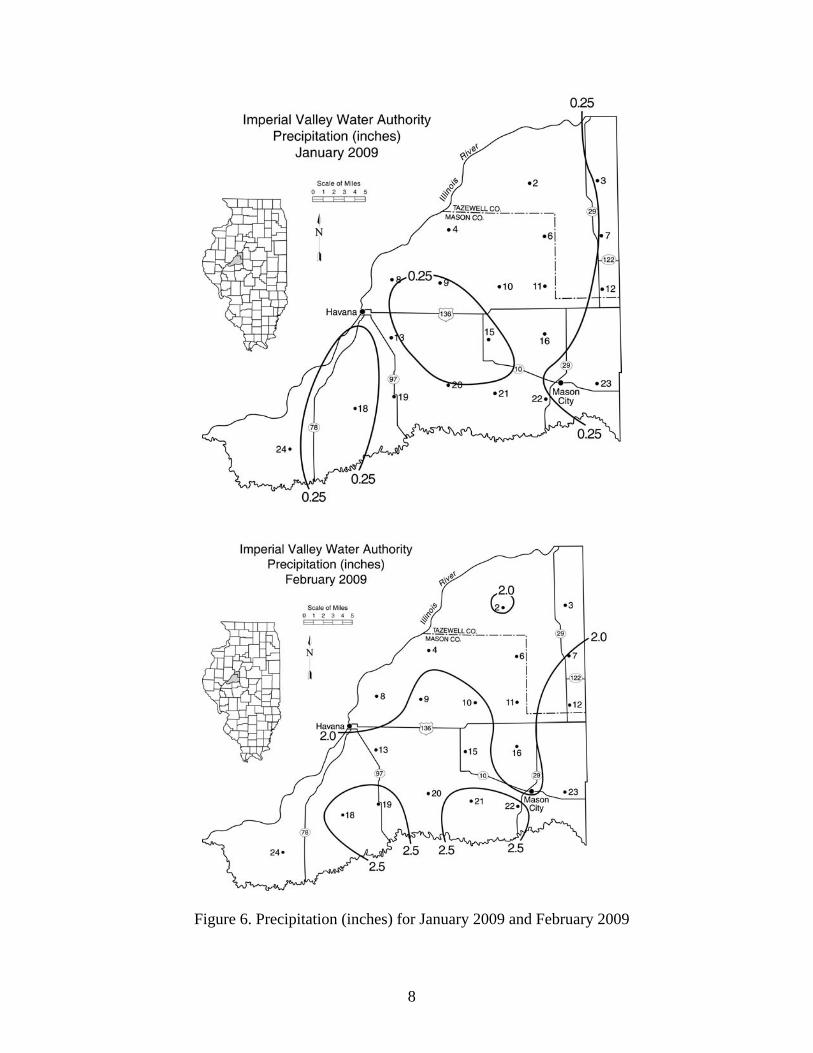
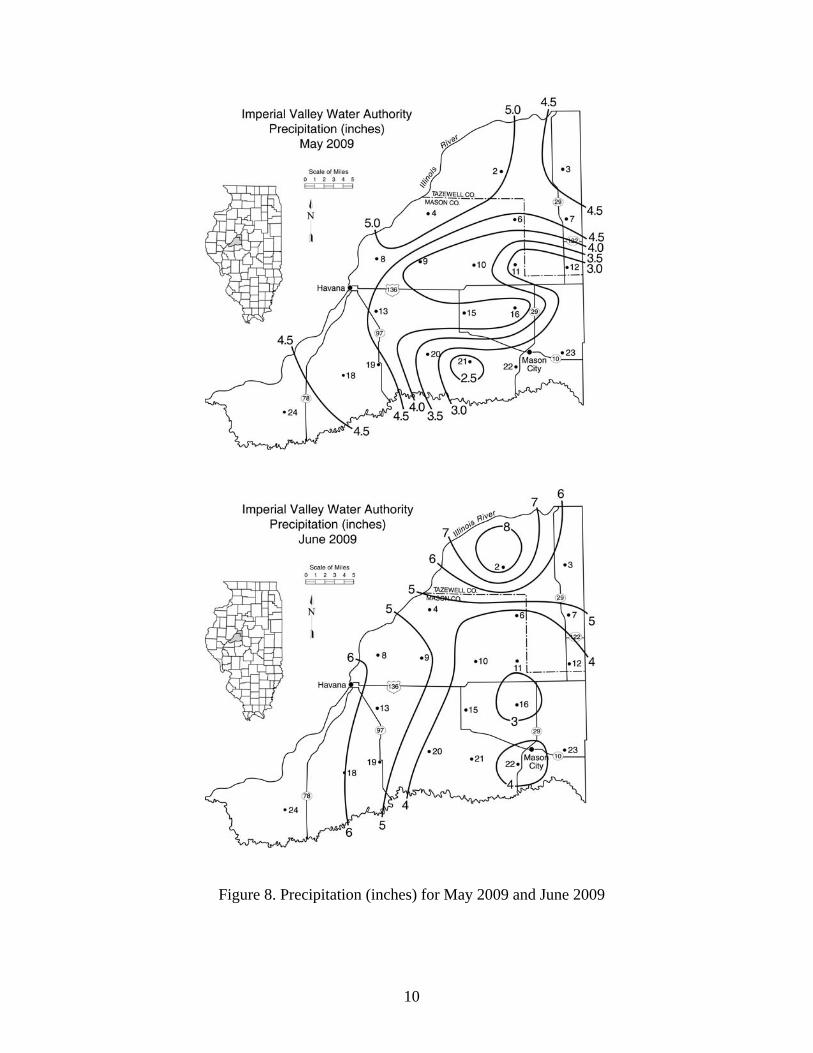
Figure 2 presents the 17-year network average, excluding sites 16, 19, and 21 during the period 1997-2002, and Figure 3 presents the annual precipitation pattern for Year Seventeen. During Year Seventeen, annual gauge totals varied from 44.08 inches at site 23 to 54.29 inches at site number 2 (Figure 3). Eight-inch gradients between gauges in annual precipitation are not unusual during any given year, as long as they are not replicated at the same gauges year after year, and are somewhat supported by surrounding gauges. September and December of 2008 and February, March, April, June, July and August of 2009 all received above average precipitation with September 2008 being the wettest month of the year. All other months of the year received below average precipitation (Figures 4-9). September 2008 accounted for 10.32 inches of precipitation or 31 percent of the 16-year average annual precipitation, and 21 percent of Year Seventeen total network precipitation. The network received 6.21 inches less precipitation than in the wettest year (1992-1993) and 23.64 inches more than in the driest year (1995-1996). Storm Events The number of network precipitation periods was determined for the 17-year period. Mean monthly, seasonal, and annual number of these precipitation events are presented for 2008-2009 (Table 2). The monthly, seasonal, and annual number of precipitation events averaged over the 1993-2008 period also is presented (Table 2). A network storm period is defined as a precipitation event separated from proceeding and succeeding events at all network stations by at least three hours.
5
Figure 2. Network average annual precipitation (inches) for September 1993 - August 2009
Figure 3. Total precipitation (inches) for September 2008- August 2009

6
Figure 4. Precipitation (inches) for September 2008 and October 2008

7
Figure 5. Precipitation (inches) for November 2008 and December 2008
8
Figure 6. Precipitation (inches) for January 2009 and February 2009

9
Figure 7. Precipitation (inches) for March 2009 and April 2009
10
Figure 8. Precipitation (inches) for May 2009 and June 2009

11
Figure 9. Precipitation (inches) for July 2009 and August 2009

12
Table 2. Comparison of Total Precipitation (inches), Number of Precipitation Events, and Average Precipitation per Event for Each Month and Season, 1992-2008 and 2008-2009
1992-2008 16-yr average 2008-2009 average
Period Precipitation Events
Inches/event Precipitation Events Inches/event
Sep 2.49 7.3 0.34 10.32 8 1.29 Oct 2.41 8.8 0.28 2.21 7 0.32 Nov 2.75 9.4 0.29 0.99 11 0.09 Dec 1.62 9.0 0.18 2.88 10 0.29 Jan 2.24 9.6 0.23 0.21 7 0.03 Feb 1.68 7.7 0.22 2.18 7 0.31 Mar 2.18 8.7 0.25 4.50 9 0.50 Apr 3.35 10.9 0.31 6.01 14 0.43 May 4.10 13.9 0.30 4.02 15 0.27 Jun 3.83 11.9 0.32 4.62 14 0.33 Jul 3.82 10.9 0.35 5.16 10 0.52 Aug 3.33 12.6 0.26 6.23 12 0.52 Fall 7.64 25.4 0.30 13.52 26 0.52 Winter 5.54 26.3 0.21 5.27 24 0.22 Spring 9.92 33.4 0.29 14.53 38 0.38 Summer 10.98 35.4 0.31 16.01 36 0.44 Annual 33.79 120.5 0.28 49.33 124 0.40
A total of 2052 storm periods occurred during the 17-year observation period, with 124 in 2008-09, resulting in an average of 121 storm events per year. Fewer events than average occurred in October 2008 and January 2009. A greater number of events than average occurred in November 2008 and April, May, and June of 2009. The spring had a larger number of events than average. Fall 2008, Spring 2009 and Summer 2009 received more precipitation than average and the events during these seasons were more intense than average. The plot of the network average monthly precipitation time series (Figure 10) shows the monthly variation of precipitation. From February 2005 through August 2008, a very dry period of record, only six months had precipitation of greater than 3.0 inches. During 2008-09, seven months received 4 inches of precipitation or greater. The storm recurrence frequency is the statistical probability of the recurrence of a storm with the reported precipitation (i.e., a 10-year storm would be expected to occur on average only once every 10 years at a given station, or have a 10 percent chance of occurring in any given year). The recurrence frequencies computed here are for each gauge and are based upon the total storm duration for the gauges with precipitation. In the first 16-years of network operation, 71 of the 1928 storm events produced maximum precipitation at one or more gauges with a recurrence frequency greater than one year: 50-yr (1 storm), 10-year (4 storms), 5 year (9 storms), 2 year (34 storms), and greater than 1-year but less

13
1993 1994 1995 1996 1997 1998 1999 2000 2001 2002 2003 2004 2005 2006 2007 2008 20090
1
2
3
4
5
6
7
8
9
10
11
12To
tal M
onth
ly P
reci
pita
tion
(inch
es)
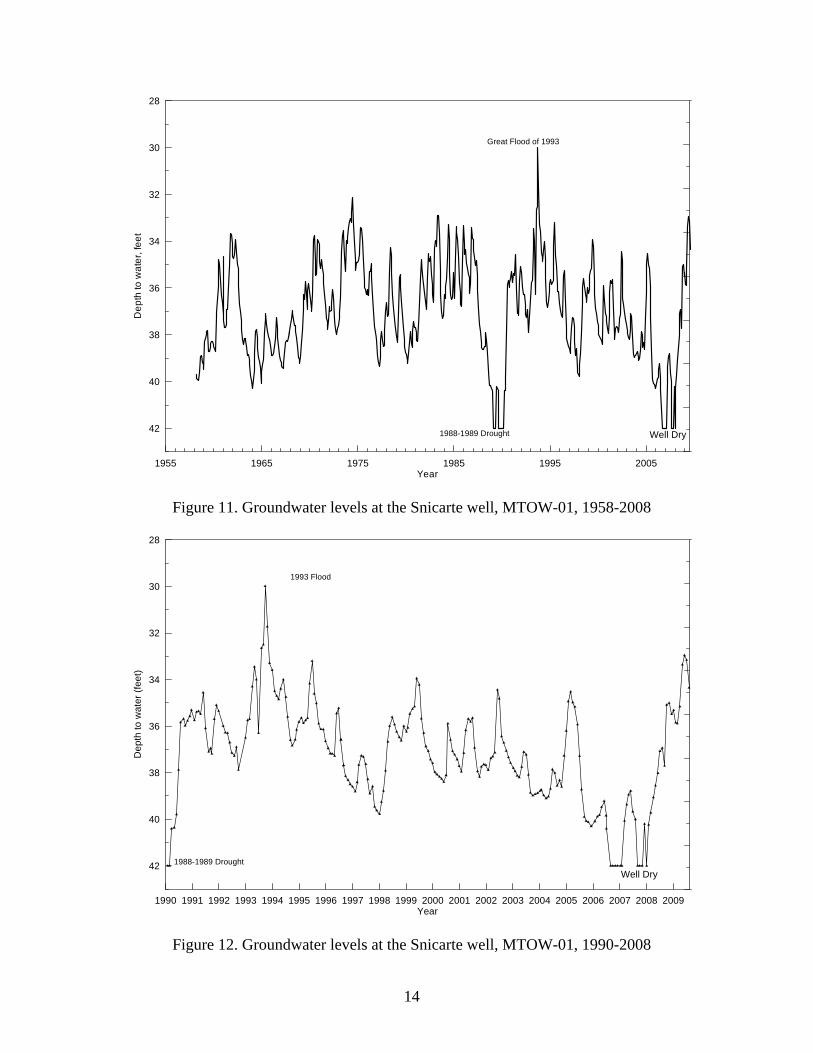
Figure 10. Network average monthly precipitation (inches), September 1992 - August 2009 than 2-year (23 storms). The 50-year storm occurred on 13 September 1995, and the 10-year storms on 16 May 1995, 8 May 1996, 19 July 1997, and 30 March 2007. In Year 17, nine of the 124 network storm periods exceeded the one-year or greater recurrence frequency. One event exceeded the 10-year recurrence frequency and occurred from 11-14 September 2008. The network-averaged precipitation totaled 5.12 inches for this event. One event exceeded the 5-year recurrence frequency and occurred from 28-29 July 2009. Groundwater Levels The long-term hydrograph at MTOW-01 (Snicarte) in Figure 11 provides a reference for comparison with the shorter records of the other network wells. The ISWS has recorded water levels in this well since 1958. Annual fluctuations from less than a foot to more than 6 feet have been observed. Based on the data we have available, these annual fluctuations often appear to be superimposed on longer term trends, perhaps 10 years or more. For the 51-year record, both the record low and high have been observed within the last 20 years. A detailed look at water levels since 1990 is shown in Figure 12. During and shortly after the drought years of 1988 and 1989, the water level fell to 40.5 feet below land surface from September 1989 until April 1990, the only time in its 45-year history that the well went dry, until it did so again in 2006 and 2007. During the 1993 flood, groundwater levels rose almost 10 feet and peaked at approximately 30 feet in September 1993.
14
1955 1965 1975 1985 1995 2005Year
42
40
38
36
34
32
30
28
Dep
th to
wat
er, f
eet
Great Flood of 1993
1988-1989 Drought
aa
Well Dry
Figure 11. Groundwater levels at the Snicarte well, MTOW-01, 1958-2008
1990 1991 1992 1993 1994 1995 1996 1997 1998 1999 2000 2001 2002 2003 2004 2005 2006 2007 2008 2009Year
42
40
38
36
34
32
30
28
Dep
th to
wat
er (f
eet)
1993 Flood
1988-1989 DroughtWell Dry
Figure 12. Groundwater levels at the Snicarte well, MTOW-01, 1990-2008

15
The dramatic drop in 1988-89 shows how significantly a major drought can impact the aquifer. Though we don’t have irrigation data for 1988, based on data from the other parts of the state (Cravens, 1989) it is likely that irrigation in 1988 was one of the highest amounts of any year. This is because summer precipitation was so low and summer temperatures were so high in 1988. Similarly, the irrigation amounts in 2005 (72 billion gallons) were 164 percent of average since 1995 and we see similar dramatic declines in water levels. Again in 2005, temperatures were high and summer precipitation was low. Conversely, 2008-2009 was a relative wet year with low irrigation withdrawals and ascension in water levels was observed. It is likely that local summer precipitation in future years will cause similar fluctuations in aquifer levels. Over the course of the last few years, the study area has received below average rainfall. These below average precipitation totals in combination with irrigation withdrawals have affected the groundwater elevations in the study area. This began in 2002-2003, when rainfall amounts fell below average and continued to fall overall until this year. Year Seventeen precipitation has elevated groundwater levels to the point of near record highs since the observation well network was established in 1995. Previous reports have shown hydrographs indicating recharge events in the aquifer occurring within a few days after a rainfall event. In other words, recharge occurs on a scale of days after a precipitation event, and so historical monthly measurements missed many such events. Based on these results, the IVWA purchased ten In-Situ data loggers that were installed in wells between December 30, 2004 and August 2005. The hydrographs for these ten loggers can be seen in Appendix A. In Year Seventeen, a rainfall event during September at the Easton Well (MTOW-02) is very evident as recharge as shown in Figure 13. The four separate rainfall events during early September produced nearly five feet of recharge within approximately seven days. Other regions of the aquifer show a similar but less pronounced response. Figures 14 and 15 show the same precipitation event at the Hahn Farm (MTOW-12) and San Jose wells (MTOW-10) producing over 1 foot of recharge within seven days. And while the hydrographs showing the recharge following precipitation for the Hahn Farm and San Jose wells are not as dramatic as at Easton, in general, the information they provide are just as vital. The recent addition of continuous water level measurements has already led to an increased understanding of the relationship between rainfall, irrigation, water levels, and recharge. Along with Easton, Hahn Farm and San Jose, the hydrographs showing continuous water levels and daily rain gauge data for Year 17 are available for the remaining monitoring wells in Appendix A. Groundwater levels in the Pekin (MTOW-05) and Havana-IDOT (MTOW-09) wells, because of their proximity to the Illinois River, have been found to fluctuate largely in response to river stage. Since these two monitoring wells are so strongly influenced by the Illinois River, the wells are not outfitted with pressure transducers and are measured infrequently. The hydrographs for these two wells (MTOW-05 and MTOW-09) are located in Appendix A.

16
9/1/08 9/7/08 9/13/08 9/19/08497
499
501
503
505
507G
roun
dwat
er E
leva
tion
(feet
abo
ve M
SL)
0
1
2
3
4
5
6
Pre
cipi
tatio
n (in
ches
)
MTOW-02 and Average of Rain Gauges 15, 20 and 21September 1, 2008 - September 21, 2008Land Surface Elevation 509.58
Digital MeasurementObserved MeasurementAveraged Daily Precipitation at Rain Gauges 15, 20 and 21
Figure 13. Groundwater elevations at the Easton well, MTOW-02, September 1, 2008-September 21, 2008
9/1/08 9/7/08 9/13/08 9/19/08486
488
490
492
494
496
Gro
undw
ater
Ele
vatio
n (fe
et a
bove
MS
L)
0
1
2
3
4
5
6
Pre
cipi
tatio
n (in
ches
)
MTOW-12 and Average of Rain Gauges 13 and 20September 1, 2008 - September 21, 2008Land Surface Elevation 503.74 feet above MSL
Digital MeasurementObserved MeasurementAveraged Daily Precipitation at Rain Gauges 13 and 20
Figure 14. Groundwater elevations at the Hahn Farm, MTOW-12, September 1, 2008-September 21, 2008

17
9/1/08 9/7/08 9/13/08 9/19/08528
530
532
534
536
538G
roun
dwat
er E
leva
tion
(feet
abo
ve M
SL)
0
1
2
3
4
5
6
Pre
cipi
tatio
n (in
ches
)
MTOW-10 and Rain Gauge 12September 1, 2008 - September 21, 2008Land Surface Elevation 560.74 feet above MSL
Digital MeasurementObserved MeasurementDaily Precipitation at Rain Gauge 12
Figure 15. Groundwater elevations at the San Jose wells, MTOW-10, September 1, 2008-September 21, 2008
Irrigation Water Use For Year Seventeen, the higher than normal precipitation in the spring and summer of 2009 affected irrigation practices significantly. Irrigation in June was the second lowest June for the length of the study, July the third lowest, August the fourth lowest and September the lowest on record. The total irrigation pumpage in 2009 was approximately 26 billion gallons (bg), which is the lowest irrigation amount for the observation period, below the approximately 30 bg pumped in 1998 and 2000, when there were several hundred fewer irrigation systems in use. The monthly and seasonal estimates of irrigation withdrawals are shown in Table 3. These data were calculated for the Imperial Valley by previously described methods. Total annual irrigation withdrawals, from highest to lowest, are as follows: 2005, 2007, 1996, 2006; 2001 and 2002 (equal); 2003; 2004; 1999; 1997 and 1995 (equal); 2008; 1998 and 2000 (equal); and 2009. Typically, irrigation withdrawals are greatest in July and August, with September and June withdrawals being much less. Though more irrigation systems are added each year, suggesting that irrigation pumpage should keep increasing, it is clearly apparent that the timing and amount of rainfall received during the irrigation season (rather than throughout the whole year) are primary factors affecting the amount of irrigation.

18
Table 3. Estimated Monthly Irrigation Withdrawals (billion gallons), Number of Irrigation Systems, Withdrawal per System and Withdrawal Rank
Year June July August September Total # Systems BG/system Rank 1995 2.6 14 10 11 38 10 1996 2.0 20 18 12 52 3 1997 2.6 19 14 2.0 38 10 1998 2.1 7.8 13 6.9 30 1622 .018 13 1999 2.8 18 12 6.0 39 1771 .022 9 2000 6.4 6.0 12 5.6 30 1799 .017 13 2001 4.4 21 17 5.0 47 1818 .026 5 2002 3.4 24 16 3.7 47 1839 .026 5 2003 4.1 16 15 10 46 1867 .025 7 2004 5.3 12 19 5.7 42 1889 .022 8 2005 15 29 23 4.8 72 1909 .038 1 2006 7.2 22 16 5.2 50 1940 .026 4 2007 16 17 19 4.9 57 1971 .029 2 2008 1.2 10 14.5 7.1 33 2014 .016 12 2009 1.6 9.3 12.1 2.9 26 2054 .012 15 Average 5.1 16.3 15.4 6.2 43 __________ Note:
Total annual withdrawal may differ from sum of monthly withdrawals due to rounding error. Also, data regarding the number of systems in 1995-1997 are unavailable.
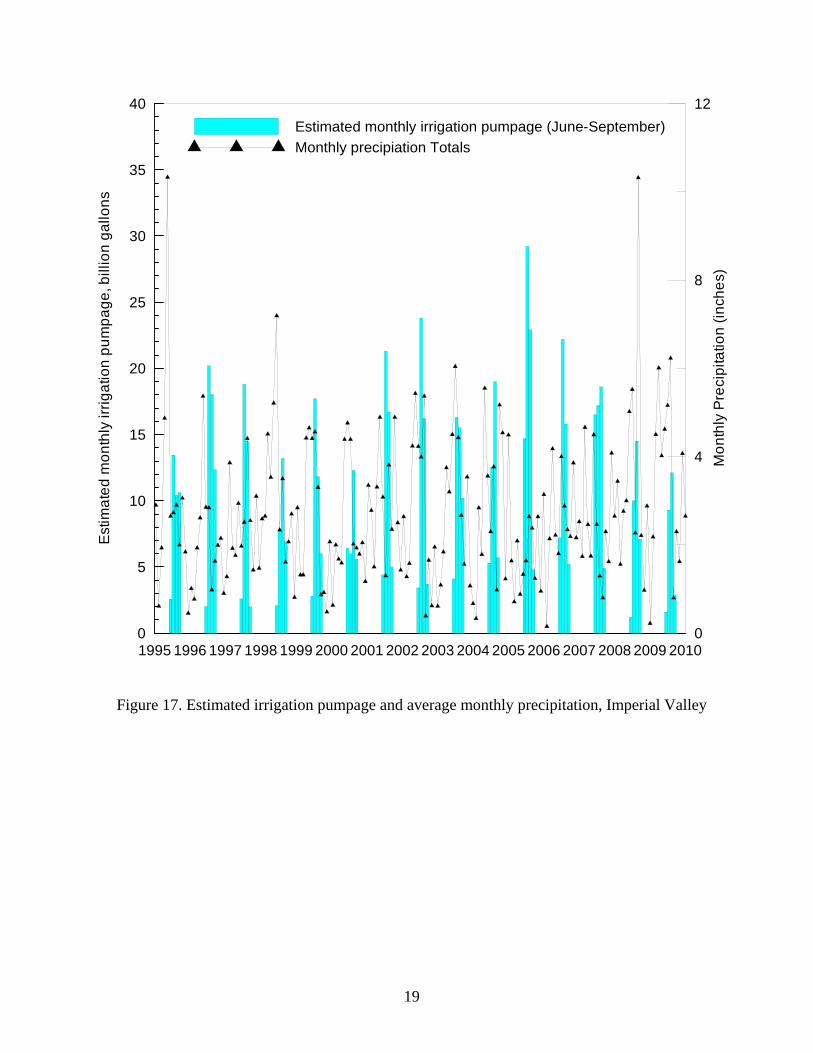
The estimated monthly irrigation pumpage is displayed graphically in Figure 17 along with
average monthly network precipitation. These pumpage values show a tendency for lower irrigation amounts during times of increasing precipitation and vice versa, but also show that irrigation is dependent on the timing of precipitation. For example, only 30 bg were pumped in 2000 (Year Eight), even though Year Eight showed a deficit of 9.5 inches (Table 4). This was because significant precipitation fell during the summer of 2000, reducing the need for irrigation. Similarily, Year Fifteen (summer 2007) was the ninth driest of network operation, but ranked number 2 for irrigation pumpage. The influence of the abundant rainfall during Year 17, 12.58 inches of precipitation above average, is evident in both the decreased amount of water withdrawn for irrigation and in higher groundwater levels throughout the study area. Table 4 also shows that for the 6 of the last 7 years and for 11 of the last 14 years, rainfall has been below the 30-year (1971-2000) historical average of 36.76 inches (average of Havana and Mason City).
19
1995 1996 1997 1998 1999 2000 2001 2002 2003 2004 2005 2006 2007 2008 2009 20100
5
10
15
20
25
30
35
40E
stim
ated
mon
thly
irrig
atio
n pu
mpa
ge, b
illio
n ga
llons
0
4
8
12
Mon
thly
Pre
cipi
tatio
n (in
ches
)
Estimated monthly irrigation pumpage (June-September)Monthly precipiation Totals
Figure 17. Estimated irrigation pumpage and average monthly precipitation, Imperial Valley

20
Table 4. Average Annual Precipitation, Annual Precipitation Surplus, Running Surplus, and Ranked Annual Precipitation and Irrigation, Imperial Valley Network
September-August Network average Annual Running Rank period precipitation (in.) surplus (in.) surplus (in.) Precip. Irrigation 1992 - 1993 55.55 +18.79 +18.79 1 - 1993 - 1994 40.21 +3.45 +22.24 3 - 1994 - 1995 39.42 +2.66 +24.90 6 10 1995 - 1996 25.70 -11.06 +13.84 17 3 1996 - 1997 27.31 -9.45 +4.39 15 10 1997 - 1998 40.06 +3.30 +7.69 4 13 1998 - 1999 34.02 -2.74 +4.95 8 9 1999 - 2000 25.81 -10.95 -6.00 16 13 2000 - 2001 30.97 -5.79 -11.79 10 5 2001 - 2002 39.91 +3.15 -8.64 5 5 2002 - 2003 30.06 -6.70 -15.34 11 7 2003 - 2004 29.64 -7.12 -22.46 12 8 2004 - 2005 27.34 -9.42 -31.88 14 1 2005 - 2006 27.74 -9.02 -40.90 13 4 2006 - 2007 31.94 -4.82 -45.72 9 2 2007 - 2008 35.02 -1.74 -47.46 7 12 2008 - 2009 49.34 +12.58 -34.88 2 15 1971 - 2000 30-yr average 37.82 (Havana) 1971 - 2000 30-yr average 35.70 (Mason City) 1971 - 2000 30-yr average 36.76 (average of Mason City and Havana used to determine surplus) Note: Site 16 was excluded from network average computations from 1996-1997 through 2001-2002.
Findings
In summary, for Year Seventeen of the rain gauge network operation (September 2008-August 2009), the network received an average of 49.34 inches of precipitation, 15.55 inches more than the network previous 16-year average precipitation of 33.79 inches and 12.58 inches more than the 30-year average for the study area. The timing and amount of rainfall was such that the need for irrigation in the summer of 2009 was greatly reduced. This reduced pumping of the aquifer for irrigation, along with above average precipitation, provided an opportunity to recharge the aquifer system significantly. In fact, groundwater levels within the aquifer are dramatically higher at the end of Year 17 than at the beginning. The ten pressure transducers installed in the observation wells give us a much better picture of how rainfall, depth to water, and distance to a nearby stream influence recharge and water level changes in the aquifer. This past year, with several significant storm events, we were able to record and see measurable response in the aquifer that had not been seen the past several years at some locations. We look forward to gathering additional supporting data that will allow us to better predict water level changes in the future.

21
If you have any questions or comments, please contact Kevin Rennels, Steve Wilson or Nancy Westcott. Sincerely, Kevin L. Rennels Steven D. Wilson Nancy Westcott Associate Supportive Scientist Groundwater Hydrologist Research Meteorologist Illinois State Water Survey Illinois State Water Survey Illinois State Water Survey [email protected] [email protected] [email protected] Phone: (217) 333-8466 Phone: (217) 333-0956 Phone: (217) 244-0884 c: Dorland Smith Wayne Deppert Don Osborn, Jr. Morris Bell
22
Appendix A. Hydrographs, Imperial Valley Observation Well Network
Observed depth to water in MTOW-1Total monthly precipitation at Gauge 24
0
2
4
6
8
10
12
14
16
Tota
l mon
thly
pre
cipi
tatio
n at
Gau
ge 2
4, in
ches
1995 1996 1997 1998 1999 2000 2001 2002 2003 2004 2005 2006 2007 2008
55
50
45
40
35
30
Dep
th to
wat
er a
t MTO
W-1
, fee
t bel
ow la
nd s
urfa
ce
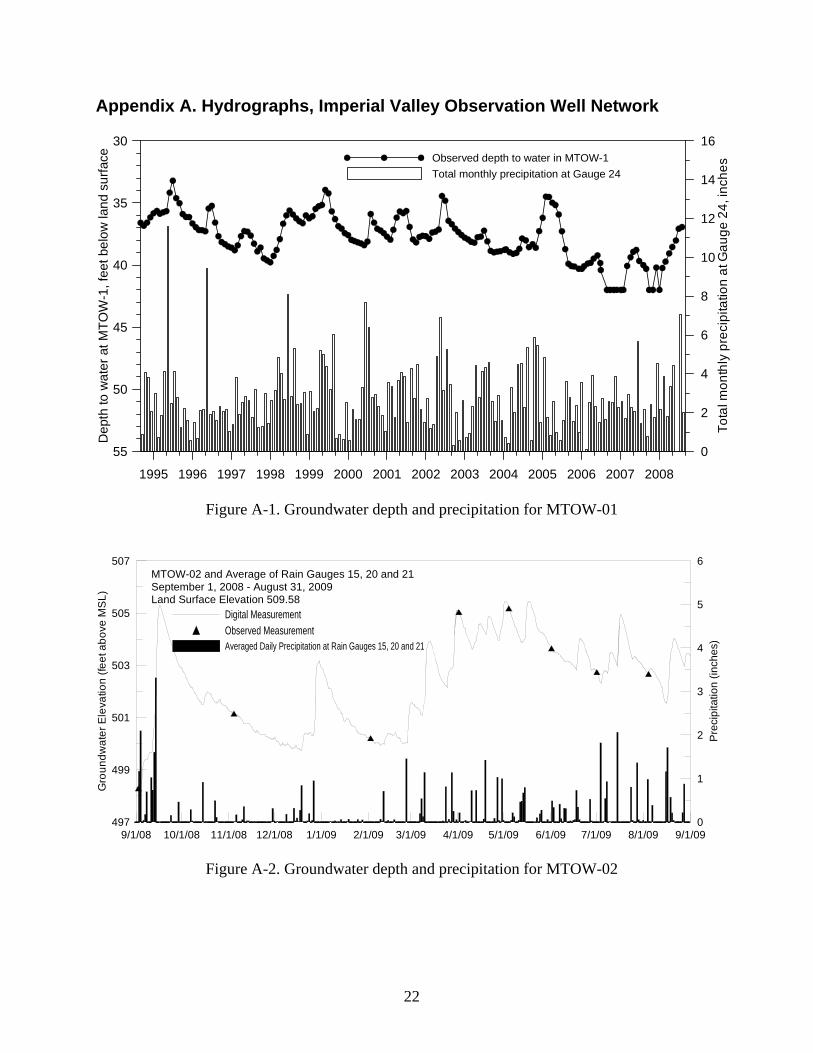
Figure A-1. Groundwater depth and precipitation for MTOW-01
9/1/08 10/1/08 11/1/08 12/1/08 1/1/09 2/1/09 3/1/09 4/1/09 5/1/09 6/1/09 7/1/09 8/1/09 9/1/09497
499
501
503
505
507
Gro
undw
ater
Ele
vatio
n (fe
et a
bove
MS
L)
0
1
2
3
4
5
6
Pre
cipi
tatio
n (in
ches
)
MTOW-02 and Average of Rain Gauges 15, 20 and 21September 1, 2008 - August 31, 2009Land Surface Elevation 509.58
Digital MeasurementObserved MeasurementAveraged Daily Precipitation at Rain Gauges 15, 20 and 21
Figure A-2. Groundwater depth and precipitation for MTOW-02

23
9/1/08 10/1/08 11/1/08 12/1/08 1/1/09 2/1/09 3/1/09 4/1/09 5/1/09 6/1/09 7/1/09 8/1/09 9/1/09472
474
476
478
480
482
Gro
undw
ater
Ele
vatio
n (fe
et a
bove
MS
L)
0
1
2
3
4
5
6
Pre
cipi
tatio
n (in
ches
)
Digital MeasurementObserved MeasurementDaily Precipitation at Rain Gauge 18
MTOW-03 and Rain Gauge 18September 1, 2008 - August 31, 2009Land Surface Elevation 492.54 feet above MSL
Figure A-3. Groundwater depth and precipitation for MTOW-03
9/1/08 10/1/08 11/1/08 12/1/08 1/1/09 2/1/09 3/1/09 4/1/09 5/1/09 6/1/09 7/1/09 8/1/09 9/1/09469
471
473
475
477
479
Gro
undw
ater
Ele
vatio
n (fe
et a
bove
MS
L)
0
1
2
3
4
5
6
Pre
cipi
tatio
n (in
ches
)
MTOW-04 and Rain Gauge 4September 1, 2008 - August 31, 2009Land Surface Elevation 487.10 feet above MSL
Digital Measurement Observed MeasurementDaily Precipitation at Rain Gauge 4
Figure A-4. Groundwater elevation and precipitation for MTOW-04
24
0
2
4
6
8
10
12
14
16
Ave
rage
of t
otal
mon
thly
pre
cipi
tatio
n at
Gau
ges
2 an
d 3
45
40
35
30
25
20D
epth
to w
ater
in M
TOW
-5, f
eet b
elow
land
sur
face
1995 1996 1997 1998 1999 2000 2001 2002 2003 2004 2005 2006 2007 2008
Observed depth to water in MTOW-5Ave. of total monthly precipitation at Gauges 2 and 3
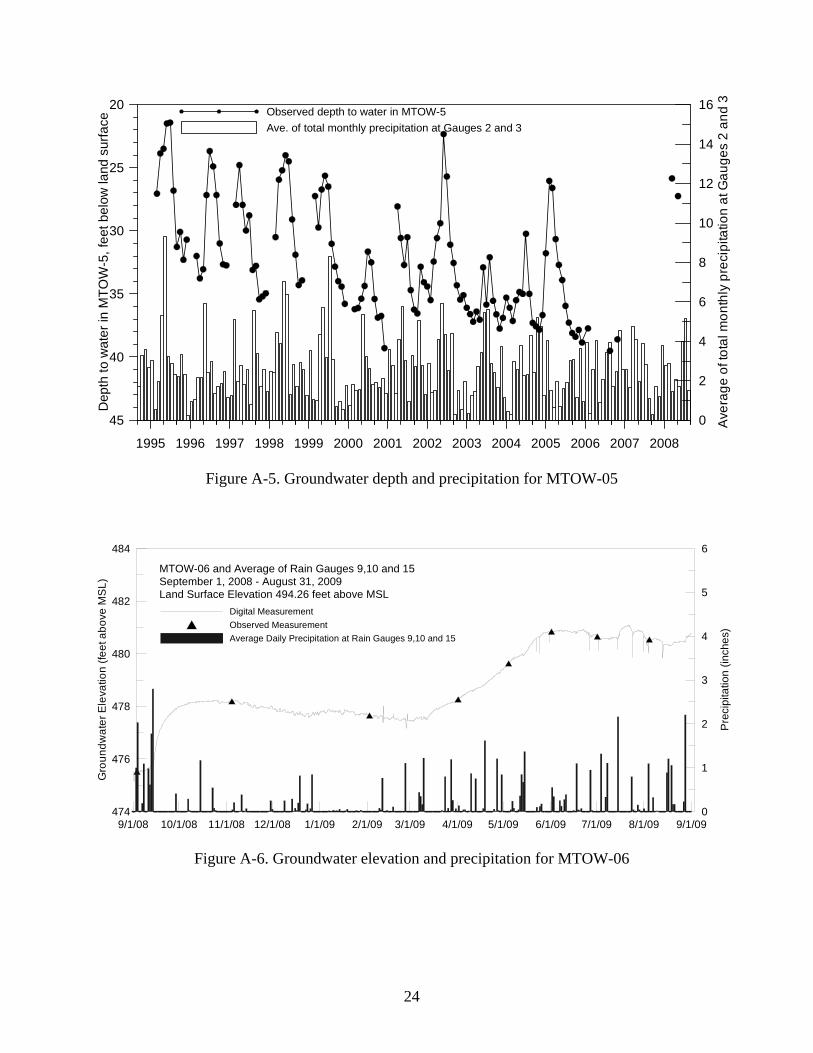
Figure A-5. Groundwater depth and precipitation for MTOW-05
9/1/08 10/1/08 11/1/08 12/1/08 1/1/09 2/1/09 3/1/09 4/1/09 5/1/09 6/1/09 7/1/09 8/1/09 9/1/09474
476
478
480
482
484
Gro
undw
ater
Ele
vatio
n (fe
et a
bove
MS
L)
0
1
2
3
4
5
6
Pre
cipi
tatio
n (in
ches
)
MTOW-06 and Average of Rain Gauges 9,10 and 15September 1, 2008 - August 31, 2009Land Surface Elevation 494.26 feet above MSL
Digital Measurement Observed MeasurementAverage Daily Precipitation at Rain Gauges 9,10 and 15
Figure A-6. Groundwater elevation and precipitation for MTOW-06

25
9/1/08 10/1/08 11/1/08 12/1/08 1/1/09 2/1/09 3/1/09 4/1/09 5/1/09 6/1/09 7/1/09 8/1/09 9/1/09472
474
476
478
480
482G
roun
dwat
er E
leva
tion
(feet
abo
ve M
SL)
0
1
2
3
4
5
6
Pre
cipi
tatio
n (in
ches
)
MTOW-07 and Average of Rain Gauges 15, 20 and21September 1, 2008 - August 31, 2009Land Surface Elevation 493.07 feet above MSL
Digital MeasurementObserved MeasurementAverage of Daily Precipitation at Rain Gages 15, 20 and 21
Figure A-7. Groundwater elevation and precipitation for MTOW-07
9/1/08 10/1/08 11/1/08 12/1/08 1/1/09 2/1/09 3/1/09 4/1/09 5/1/09 6/1/09 7/1/09 8/1/09 9/1/09506
508
510
512
514
516
Gro
undw
ater
Ele
vatio
n (fe
et a
bove
MS
L)
0
1
2
3
4
5
6
Pre
cipi
tatio
n (in
ches
)
MTOW-08 and Rain Gauge 7September 1, 2008 - August 31, 2009Land Surface Elevation 531.99 feet above MSL
Digital Measurement Observed MeasurementDaily Precipitation at Rain Gauge 7
Figure A-8. Groundwater elevation and precipitation for MTOW-08
26
0
2
4
6
8
10
12
14
16
Ave
rage
of t
otal
mon
thly
pre
cipi
tatio
n at
Gau
ges
8 &
13
1995 1996 1997 1998 1999 2000 2001 2002 2003 2004 2005 2006 2007 2008
30
25
20
15
10
5D
epth
to w
ater
in M
TOW
-9, f
eet b
elow
land
sur
face
Observed depth to water in MTOW-9Ave. of total monthly precipitation at Gauges 8 & 13
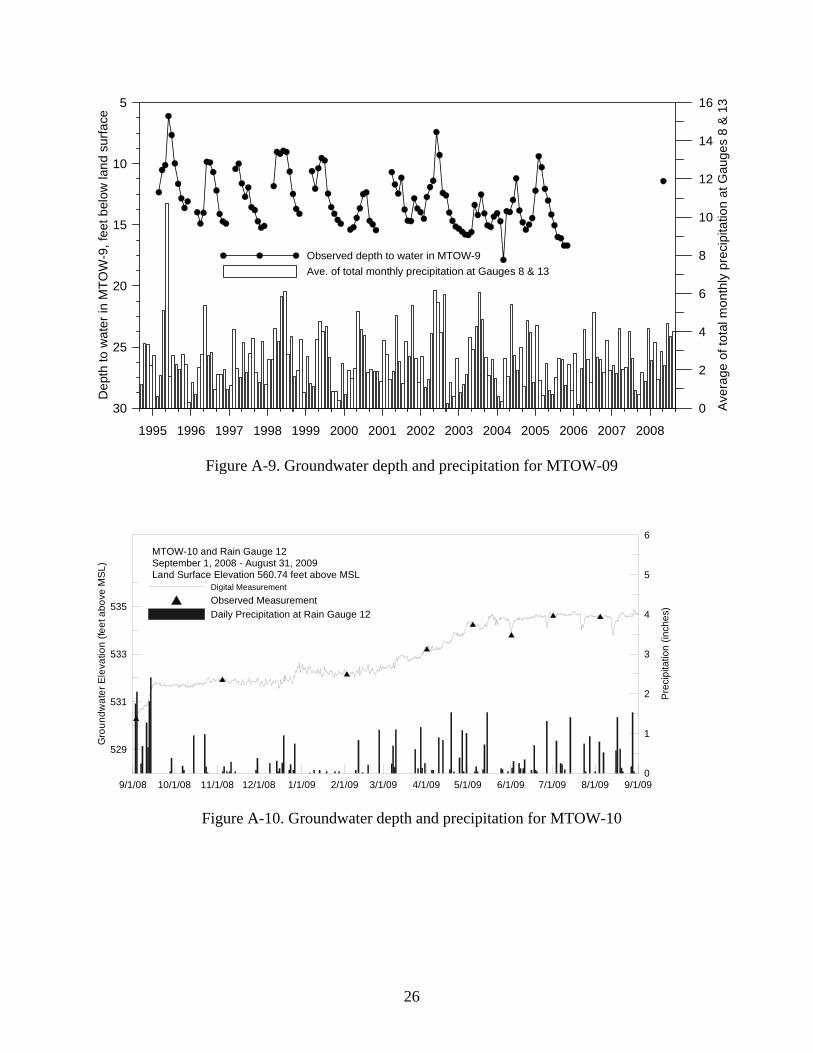
Figure A-9. Groundwater depth and precipitation for MTOW-09
9/1/08 10/1/08 11/1/08 12/1/08 1/1/09 2/1/09 3/1/09 4/1/09 5/1/09 6/1/09 7/1/09 8/1/09 9/1/09
529
531
533
535
Gro
undw
ater
Ele
vatio
n (fe
et a
bove
MS
L)
0
1
2
3
4
5
6
Pre
cipi
tatio
n (in
ches
)
MTOW-10 and Rain Gauge 12September 1, 2008 - August 31, 2009Land Surface Elevation 560.74 feet above MSL
Digital MeasurementObserved MeasurementDaily Precipitation at Rain Gauge 12
Figure A-10. Groundwater depth and precipitation for MTOW-10

27
9/1/08 10/1/08 11/1/08 12/1/08 1/1/09 2/1/09 3/1/09 4/1/09 5/1/09 6/1/09 7/1/09 8/1/09 9/1/09
526
528
530
532
534
Gro
undw
ater
Ele
vatio
n (fe
et a
bove
MS
L)
0
1
2
3
4
5
6
Pre
cipi
tatio
n (in
ches
)
MTOW-11 and Average of Rain Gauges 22 and 23September 1, 2008 - August 31, 2009Land Surface Elevation 561.35 feet above MSL
Digital Measurement Observed MeasurementAverage Daily Precipitation at Rain Gauges 22 and 23
Figure A-11. Groundwater elevation and precipitation for MTOW-11
9/1/08 10/1/08 11/1/08 12/1/08 1/1/09 2/1/09 3/1/09 4/1/09 5/1/09 6/1/09 7/1/09 8/1/09 9/1/09486
488
490
492
494
496
Gro
undw
ater
Ele
vatio
n (fe
et a
bove
MS
L)
0
1
2
3
4
5
6
Pre
cipi
tatio
n (in
ches
)
MTOW-12 and Average of Rain Gauges 13 and 20September 1, 2008 - August 31, 2009Land Surface Elevation 503.74 feet above MSL
Digital MeasurementObserved MeasurementAveraged Daily Precipitation at Rain Gauges 13 and 20
Figure A-12. Groundwater elevation and precipitation for MTOW-12

28
9/1/08 10/1/08 11/1/08 12/1/08 1/1/09 2/1/09 3/1/09 4/1/09 5/1/09 6/1/09 7/1/09 8/1/09 9/1/09460
462
464
466
468
470G
roun
dwat
er E
leva
tion
(feet
abo
ve M
SL)
0
1
2
3
4
5
6
Pre
cipi
tatio
n (in
ches
)
MTOW-13 and Rain Gauges 2September 1, 2008 - August 31, 2009Land Surface Elevation 501.69 feet above MSL
Digital MeasurementObserved MeasurementDaily Precipitation at Rain Gauges 2
Figure A-13. Groundwater depth and precipitation for MTOW-13