Observation of cardiogenic flow oscillations in healthy...
23
This is a repository copy of Observation of cardiogenic flow oscillations in healthy subjects with hyperpolarized He-3 MRI. White Rose Research Online URL for this paper: http://eprints.whiterose.ac.uk/116815/ Version: Accepted Version Article: Collier, G.J., Marshall, H., Rao, M. et al. (3 more authors) (2015) Observation of cardiogenic flow oscillations in healthy subjects with hyperpolarized He-3 MRI. Journal of Applied Physiology, 119 (9). pp. 1007-1014. ISSN 8750-7587 https://doi.org/10.1152/japplphysiol.01068.2014 [email protected] https://eprints.whiterose.ac.uk/ Reuse Items deposited in White Rose Research Online are protected by copyright, with all rights reserved unless indicated otherwise. They may be downloaded and/or printed for private study, or other acts as permitted by national copyright laws. The publisher or other rights holders may allow further reproduction and re-use of the full text version. This is indicated by the licence information on the White Rose Research Online record for the item. Takedown If you consider content in White Rose Research Online to be in breach of UK law, please notify us by emailing [email protected] including the URL of the record and the reason for the withdrawal request.
-
Upload
duongxuyen -
Category
Documents
-
view
213 -
download
0
Transcript of Observation of cardiogenic flow oscillations in healthy...

This is a repository copy of Observation of cardiogenic flow oscillations in healthy subjectswith hyperpolarized He-3 MRI.
White Rose Research Online URL for this paper:http://eprints.whiterose.ac.uk/116815/
Version: Accepted Version
Article:
Collier, G.J., Marshall, H., Rao, M. et al. (3 more authors) (2015) Observation of cardiogenic flow oscillations in healthy subjects with hyperpolarized He-3 MRI. Journal of Applied Physiology, 119 (9). pp. 1007-1014. ISSN 8750-7587
https://doi.org/10.1152/japplphysiol.01068.2014
[email protected]://eprints.whiterose.ac.uk/
Reuse
Items deposited in White Rose Research Online are protected by copyright, with all rights reserved unless indicated otherwise. They may be downloaded and/or printed for private study, or other acts as permitted by national copyright laws. The publisher or other rights holders may allow further reproduction and re-use of the full text version. This is indicated by the licence information on the White Rose Research Online record for the item.
Takedown
If you consider content in White Rose Research Online to be in breach of UK law, please notify us by emailing [email protected] including the URL of the record and the reason for the withdrawal request.

1
Observation of cardiogenic flow oscillations in healthy subjects with 1
hyperpolarized 3He MRI 2
Guilhem J. Collier, Helen Marshall, Madhwesha Rao, Neil J. Stewart, David 3
Capener, Jim M. Wild* 4
Academic Unit of Radiology, University of Sheffield, Royal Hallamshire Hospital, 5
Sheffield, UK 6
7
Running Head: Observation of cardiogenic flow oscillations with HP 3He MRI 8
9
*Correspondence to: Jim M. Wild, Ph.D., Academic Radiology, “C” floor, Royal Hallamshire 10
Hospital, University of Sheffield, Glossop Road, S10 2JF, Sheffield, UK. Telephone: +44 114 11
226 5389. E-mail: [email protected] 12
13

2
Abstract: 14
Recently, dynamic MR imaging of hyperpolarized 3He during inhalation revealed an alternation 15
of the image intensity between left and right lungs with a cardiac origin (Respiratory Physiology 16
& Neurobiology: 185, 468-471,2013). This effect is investigated further using dynamic and 17
phase contrast flow MR imaging with inhaled 3He during slow inhalations (flow rate ~ 100 mL s-18
1) to elucidate air-flow dynamics in the main lobes in six healthy subjects. The ventilation MR 19
signal and gas inflow in the left lower part of the lungs was found to oscillate clearly at the 20
cardiac frequency in all subjects, whereas the MR signals in the other parts of the lungs had a 21
similar oscillatory behavior but were smaller in magnitude and in anti-phase to the signal in the 22
left lower lung. The airflow in the main bronchi showed periodic oscillations at the frequency of 23
the cardiac cycle. In four of the subjects, backflows were observed for a short period of time of 24
the cardiac cycle, demonstrating a pendelluft effect at the carina bifurcation between the left and 25
right lungs. Additional 1H structural MR images of the lung volume and synchronized ECG 26
recording revealed that maximum inspiratory flow rates in the left lower part of the lungs 27
occurred during systole when the corresponding left lung volume increased whereas the opposite 28
effect was observed during diastole with gas flow being redirected to the other parts of the lung. 29
In conclusion, cardiogenic flow oscillations have a significant effect on regional gas flow and 30
distribution within the lungs. 31
Keywords: Cardiogenic oscillations, MRI, hyperpolarized gases, flow, lungs 32
Introduction 33
In the literature, the term cardiogenic oscillation has been used to refer to the modulation of the 34
pulmonary gas pressure, flow or concentration produced by the cardiac cycle. Cardiogenic 35

3
oscillations have been intensively observed and recorded in the past in the context of pulmonary 36
physiology measurements made at the mouth with pressure transducers, pneumotachographs (1, 37
20, 29) or gas analyzers (6, 15) but also directly inside the intra-thoracic airways during 38
bronchoscopy (30). The cardiac cycle is thought to be an important component of gas mixing 39
within the lung (12, 13, 15) and leads to oscillations in the concentration of oxygen and carbon 40
dioxide in expired gas (5, 6). The cardiac action has therefore an uncontested influence on lung 41
function but it is unclear how the different observations of cardiogenic oscillations are related to 42
each other. In the present study, only cardiogenic flow oscillations (COf) present in the 43
conducting airways are considered. COf can be detected in most subjects during the whole 44
breathing cycle and in all regions of the lung (11). However, very little data has been published 45
on the influence of COf on airflow pattern and gas distribution within the lung. 46
On the other hand, the field of study of pulmonary airflow has recently benefited from 47
advancements in imaging and computation methodology. Computational fluid dynamics (CFD) 48
simulations using realistic image-based airway models have vastly improved general 49
understanding of the local characteristics of gas flow in the airways (25). These findings are of 50
particular interest for inhaled therapy research (4) or the study of regional deposition of particles 51
(17) but have yet to take into account realistic physiological features such as COf and have 52
traditionally relied only on validation with in vitro airway tree models (21). In vivo, rates of gas 53
ventilation in the main airways and the periphery can be assessed with dynamic hyperpolarized 54
(HP) 3He ventilation imaging (16, 31). In addition, phase contrast velocimetry (PCV) sequences 55
can be used to directly map flow velocity profiles in the major airways (3, 10, 19). Sun et al. (24) 56
recently performed dynamic 3He ventilation imaging on seven healthy subjects and revealed an 57
alternation of the MR image intensity between the left and right lung (“ventilatory alternans”) 58

4
with a periodicity approximating the heart rate (unmeasured), which was presumably the effect 59
of cardiogenic flow oscillations. The aim of the present study is to further explore this 60
phenomenon by performing dynamic HP 3He ventilation imaging during inspiration in healthy 61
subjects to assess the extent to which cardiogenic flow oscillations can influence the gas 62
distribution inside the lobes and, additionally, by measuring gas velocities inside the main 63
bronchi with PCV sequences to investigate the airflow pattern within the lungs. 64
Materials and Methods 65
Subject Characteristics, 3He Production and Administration 66
Six healthy volunteers were recruited for this study (demographics and pulmonary function test 67
results shown in Table 1). Approval from the national research ethics committee was obtained 68
for all experiments. 3He (Linde Gases, Huntingdon, UK) was polarized on site with a regulatory 69
approved spin exchange polarizer to ~ 25 % (GE Healthcare, Amersham, UK). A 1 L gas 70
mixture of N2 and HP 3He was delivered for the subjects to inhale inside the MRI scanner. The 71
subjects performed a slow and constant-rate inspiration (inhalation time varied from 8 s to 15 s 72
between subjects) from a Tedlar bag (Jensen Inert Products, Coral Springs, FL) containing 20 % 73
of HP 3He for dynamic ventilation and 30 % for phase contrast velocimetry imaging. Data were 74
acquired during inhalation. 75
Image Acquisition 76
Imaging experiments were performed on a GE HDx 1.5T MR scanner with a maximum gradient 77
strength of 33 mT m-1 and slew rate of 120 mT m-1 ms-1. A quadrature flexible transmit-receive 78
(T-R) 3He radiofrequency coil (CMRS, Brookfield, WI) was used for dynamic ventilation and 79

5
1D velocity profile measurements. For 2D flow imaging across the left main bronchus, a home-80
built dedicated loop-butterfly quadrature T-R coil with high quality factor (Qloaded/Qunloaded ~ 81
230/25) was used (see Fig. 1). The heartbeat of the subjects was monitored during all 82
experiments with a finger probe or an ECG. When ECG was available (see Table 1), the R-wave 83
occurrences were recorded during the imaging sequences. Sequence details were as follows: 84
- Dynamic ventilation imaging: Dynamic coronal images of the 6 healthy subjects were 85
obtained with a spoiled gradient echo sequence (40×32 cm2 field of view, 64 readout × 52 86
phase encode matrix, Cartesian sequential phase encoding, single slice, 25 cm thickness, 87
echo/repetition time TE/TR of 0.8/2.7 ms, ± 31.25 kHz bandwidth, 3° flip angle and 150 88
frames with a time resolution per frame of 140 ms). 89
- 1D velocity profile imaging: Axial 1D projections, across the anterior to posterior 90
direction, below the carina (see slice location 1, dashed line in the inset of Fig. 1) were 91
acquired in the 6 subjects with a PCV sequence, providing dynamic 1D velocity profiles 92
across the left and right main bronchi. A field of speed (FOS) of [-120, +120] cm s-1 was 93
chosen along the superior to inferior direction which is the principal direction of gas flow 94
(20 cm field of view, 128 points, 1 cm slice thickness, 20° flip angle and 768 frames with 95
a 20 ms time resolution). 96
- 2D flow imaging: A 2D oblique slice through the left main bronchus (see slice location 2, 97
solid line in the inset of Fig. 1) was imaged in subjects 1, 5 and 6 with a PCV sequence. 98
The field of speed was set to [-160, +160] cm s-1 in the direction of the axis of the left 99
main bronchus (5×3.75 cm2 FOV, 32×18 matrix with a partial Fourier factor of 0.75 in 100
the phase direction and sequential Cartesian phase encoding, 1.5 cm slice thickness, 101

6
TE/TR of 3.3/6.4 ms, ± 15.63 kHz bandwidth, 18° flip angle and 232.4 ms time resolution 102
per image frame). 103
- Cardiac gated proton lung imaging: In order to observe the deformation of the lungs 104
around the heart during the cardiac cycle, a standard cine cardiac gated balanced steady 105
state free precession 1H pulse sequence was used to obtain an axial stack of images of the 106
lungs in the 6 subjects during breath hold (30 cm field of view, 256×256 matrix, 1 cm 107
slice thickness, 60° flip angle, TE/TR of 1.8/4.3 ms and 20 heart phases). 108
Image Analysis 109
For the dynamic ventilation images, four regions of interest (ROIs) in the Right/Left 110
Upper/Lower parts of the Lungs (RUL/LUL/RLL/LLL, see inset of Fig. 2A) were chosen and the 111
time evolution of the 3He MR signal was computed in each. The mean signals in each ROI were 112
divided by the noise estimated from the first image of the experiment (acquired before inhaling 113
3He) to compute signal to noise ratio (SNR) values. A Fourier analysis was performed for each 114
SNR-time curve to detect the frequency of signal oscillations. The phase difference between 115
signals at the fundamental frequency was also computed (the phase of the LLL signal was taken 116
as a reference). Cardiac gated proton images were analyzed with ScanIP (Simpleware, Exeter, 117
UK) to segment the volume of the lung cavity for each of the twenty cardiac frames. Pulmonary 118
veins and arteries were not excluded. The relative volume changes (V(t)/Vmean) of the left and 119
right lungs around the heart during the cardiac cycle were derived from the segmentation. 120
For the PCV data, velocity maps and profiles were generated offline from the raw data using in-121
house software developed in Matlab (MathWorks, Natick, MA). The phase difference 122
reconstruction was performed using the two interleaves of each frame to extract the 3He gas 123

7
velocity component in the encoded direction for each pixel. ROIs corresponding to the left and 124
right main bronchi were selected manually and the time evolution of the average gas velocity 125
was calculated for each 1D profile. For the 2D flow imaging experiments, the flow was derived 126
by integrating the velocities over the area of the left main bronchus. An error analysis of the 1D 127
average gas velocity and 2D flow values was performed. The following formula gives the 128
statistical uncertainty of the velocity value derived from the phase difference reconstruction: 129
時士 噺 擦鮫傘匝慈 紐岫時 傘層エ 岻匝 髪 岫時 傘匝エ 岻匝 ( 1 ) 130
where S1 and S2 are the magnitude values of the two interleaves and is the standard deviation 131
of the noise (the same in both interleaves). In practice S1 ~ S2 and the uncertainty in each velocity 132
value is therefore inversely proportional to the signal of each corresponding pixel. Since the 133
signal intensity is velocity dependent, the standard deviation of the velocity between pixels can 134
be fairly different. Indeed, the volume of gas in a pixel experiencing high flow rate is renewed 135
with “fresh” polarized gas (that has not undergone radio frequency destruction) more rapidly, 136
whereas pixels with low flow rate have lower signal and therefore higher variance v2. The 137
variance of the 2D flow measurement was calculated from the sum of each pixel variance 138
multiplied by the pixel area, whereas the variance of the 1D average velocity measurement was 139
derived according to the following formula: 140
時珊士匝 噺 盤デ 時士餐斬匝仔餐斬 匪 仔エ ( 2 ) 141
where vij is the standard deviation of the pixel ij and n is the number of pixels in the selected 142
ROI. 143
144
Results 145

8
Dynamic Ventilation: The signal to noise ratio (SNR) and hence, gas inflow in the left lower part 146
of the lung was clearly found to oscillate at the cardiac frequency in all subjects (see Fig. 2, Fig. 147
4, Table 2 and supplementary material for videos of dynamic ventilation images of each subject). 148
The signals in the other parts of the lungs (RLL, RUL and LUL) were also found to oscillate at 149
the same frequency in 5 of the 6 subjects, but with a markedly different phase when compared to 150
the LLL signal (139° was the average phase difference for the LUL signal, 167° for RLL and 151
145° for RUL). For subject 5 (Fig. 2F), no obvious pulsation was observed in the time evolution 152
of RLL, RUL and LUL SNRs. The simultaneous ECG recording in subjects 2, 3, 5 and 6 showed 153
that the R-wave occurrences corresponded to a minimum of SNR in the LLL (maximum SNR in 154
the other regions for subjects 2, 3 and 6) and were followed by a rapid rise of the LLL signal. 155
1D Velocity Profile: Although the experiments were performed during constant inhalation, the 156
average velocities in the left and right main bronchi fluctuated dramatically with a periodic 157
pattern whose frequency matched the heartbeat (see Fig. 3 and Fig. 4). The recorded velocities 158
ranged from -50 to 150 cm s-1 and varied antagonistically. More surprisingly, negative values 159
(backflows) were measured during a small part of the cardiac cycle in subjects 1, 3, 4 and 6, 160
demonstrating a pendelluft effect at the carina bifurcation between the left and right lungs. 161
Although the periodic patterns were quite different between subjects, recordings of R-waves 162
(start of systole) always preceded a strong gas inflow period in the left lung (low inflow or 163
backflow in the right lung) whereas the opposite phenomenon happened at the beginning of 164
diastole. The mean uncertainty in the measured average velocity value was found to be ± 6 cm s-165
1. 166
2D Flow: Measured velocity maps from the LMB confirmed the periodicity and dramatic change 167
of gas flow pattern during the cardiac cycle (see Fig. 5) and the existence of backflow in subjects 168

9
1 and 6. Flow values ranged from -40 to 220 mL s-1. For subject 6, the ECG was recorded 169
simultaneously and the maximum flow rate into the left lung was observed after the R-wave 170
occurrence. v was ~ 5 cm s-1 and the uncertainty on the flow values was below ± 2 mL s-1. 171
Proton Imaging: Manual segmentation of left and right lung cavities surrounding the heart 172
exhibited a similar relative volume time evolution for all subjects (see Fig. 6 and online 173
supplementary material for a video of the lung segmentation of subject 1 through the cardiac 174
cycle). During systole, the segmented lung volume increased on average by about 53 mL, which 175
agrees well with the volume displaced per heartbeat of 60 mL quoted by Cotes et al. (5). 176
Interestingly, 83 % of this increase was found in the left lung. The volume contraction of the 177
heart ventricles corresponded to a left lower lung expansion confirmed by the displacement of 178
the pulmonary vasculature in the left lung around the heart (see online supplementary video). 179
During the first half of diastole, the opposite effect occurred with a similar rate of volume change 180
as during systole (see inset of Fig. 6). The second part of diastole did not show major lung 181
volume changes. 182
Discussion 183
In this study, a dramatic effect of cardiogenic flow oscillations on pulmonary airflow pattern was 184
observed in the lungs of normal subjects with functional 3He MR imaging. Whereas Sun et al. 185
(24) noticed a ‘ventilatory alternans’ between the left and right lungs during inspiration in 186
healthy subjects, our data suggest that this observation is the consequence of stronger flow 187
oscillation in the left lower part of the lung due to the proximity of the heart, with accompanying 188
weaker oscillations of opposite phase in the rest of the lungs. We believe that Sun et al. did not 189
observe this localized origin most probably because of their choice of region of interest in the left 190
10
lung. The figure 1A of that study clearly shows that the left upper part of the lung was omitted in 191
the signal intensity calculation. However, the dynamic images from the subjects in that study 192
(available as videos in the online supplementary material) showed an alternans between the 193
upper and lower parts of the left lung. The increase in time resolution in the dynamic ventilation 194
imaging protocol between Sun et al. and the present studies (from 2.5 to 7.1 frames per sec) also 195
better facilitates the visualization of the alternans. Our data are also in agreement with previous 196
reports suggesting that the phase of COf is different in different parts of the lungs and that they 197
are more marked on the left side (30). Interestingly, the phase of the LUL signal seems to change 198
slightly in one subject (see Fig. 2A), which suggests that the phase difference between the lower 199
and upper parts of the left lung could depend on the lung inflation level in some cases. The signal 200
oscillations could be observed in all subjects in the LUL but only in 5 of 6 subjects in the rest of 201
the lungs. Similarly, the ventilatory alternans and the COf were observed in 5 of 7 subjects in the 202
imaging study of Sun et al. (24) and in 75 % of patients in a study by West et al. (30) with a gas 203
flow meter, which confirms that the existence and/or severity of COf are subject dependent. 204
However, it is worth noting that certain experimental and physiological conditions such as low 205
flow rates, hyperinflated lungs (13), higher cardiac output per beat and lower heartbeat 206
frequencies are more favorable for the observation of cardiogenic oscillations. Subject 5 207
performed a more rapid inhalation and had a faster heartbeat rate than the other subjects, which 208
could partly explain why no clear signal oscillations could be detected in the rest of that subject’s 209
lungs. 210
In addition to dynamic ventilation imaging, the PCV MRI technique was developed to observe 211
the effect of cardiogenic oscillations on the gas flow in the left and right main bronchi, which 212
revealed the existence of a pendelluft effect. The 3He gas velocity and flow values in the left and 213

11
right main bronchi were found to oscillate antagonistically and reversed backflows were 214
recorded in 4 of 6 subjects. The shape of the flow patterns, although having common features, 215
were different for all subjects. Among all subjects, the average velocity in both left and right 216
main bronchi during the cardiac cycle was about 38.7 cm s-1. Assuming a Weibel cross section of 217
the airway with an area of 1.17 cm2 for each main bronchus, and neglecting the fact that the slice 218
is not fully perpendicular to the bronchi directions (see slice location 1 in the inset of Fig. 1), an 219
average flow of 91 mL s-1 can be derived. This is roughly consistent with the expected average 220
flow of 85 mL s-1 deduced from the average time of 11.8 s that was required by the subjects to 221
inhale the 1 L bag of gas. PCV measurements have some limitations and possible scope for 222
improvements. It would be desirable to perform flow measurement at the entrance of the main 223
lobes and not only through the main bronchi, however, the localization of smaller airways is 224
highly challenging given the quality and resolution of MRI. In addition, in order to deduce the 225
exact flow pattern produced by COf, the measurement should also be repeated during breath 226
hold. However, because the 3He signal is nonrenewable, fresh gas needs to flow constantly 227
through the ROI, which led us to a dynamic experiment during the inspiratory phase. 228
Nevertheless, estimates of maximum COf values in the left main bronchus can be obtained from 229
the 2D PCV measurements by inspection of the amplitude of the flow oscillations: 230
approximately 45 mL s-1 for subjects 1 and 5 and 70 mL s-1 for subject 6. These results are 231
reasonably consistent with previously reported volume flow rates of 42 mL s-1 (30). The addition 232
of simultaneous ECG recording with MR measurements showed that some features in the COf 233
pattern were common to all subjects. Maximum flow rates in the left lower part of the lung 234
occurred during systole whereas the opposite effect happened during diastole, with gas being 235
redirected to the other parts of the lungs. 236

12
The origin of COf has been a matter of debate for some time, stimulated by contradictory results 237
from different groups (11). Whereas early studies suggested an aspirating effect of the heart 238
during systole, simply explained by a pressure change induced by a volume change of the lung, 239
more recent works claim that COf are caused by pulmonary artery pulsatility (23, 29). It is 240
doubtful that pulmonary artery pulsatility could explain our observations of regional phase 241
difference between the left lower part and the rest of the lungs. Moreover the fact that these latter 242
studies are based on pressure and flow measurements at the mouth only, and were performed 243
during open chest conditions, raises the question as to whether the same, related or indeed 244
potentially different phenomena are being observed and compared. An alternative and more 245
satisfactory mechanism is given by Engel (11): the oscillatory motion of the heart, in addition to 246
volume changes, produces deflation and inflation in the surrounding parts of the lung, resulting 247
in a dynamic redistribution of the gas. It is clear from the segmentation of the cardiac gated 248
proton images that the mechanical action of the heart produces a volume change mainly affecting 249
the left lower part of the lungs (see Fig. 6 and online supplementary video); we believe that this 250
results in pressure changes causing the observed redistribution of gas within the lung. During 251
systole, the blood redistribution from the ventricles to the systemic and pulmonary circulation 252
results in a stretch of the left lower part of the lung. Simultaneously, more gas is observed to 253
flow into this part of the lung. During diastole, the heart volume increases at the expense of the 254
surrounding left lobe where expiratory flows are measured. 255
It is interesting to compare the proposed mechanism with recent models of pendelluft in the 256
bronchial tree (14). The pendelluft effect has been reported at different airway levels mainly in 257
pulmonary diseases or under abnormal conditions and is expected to occur when regions of the 258
lung have different dynamics of regional inflation and deflation (for example, regions with 259

13
different compliance and/or flow resistance due to lung disease). In this sense, the asymmetric 260
volume change created by the cardiac cycle could lead to regional pressure differences and 261
explain the pendelluft observed at the carina bifurcation, therefore reflecting the modelling 262
predictions by Greenblatt et. al. (14). However, the main difference in the observed pendelluft in 263
the present study is that it results from the natural cardiac motion in subjects with healthy lungs. 264
The resulting oscillatory gas flows constitute an additional mechanism for gas mixing in the lung 265
(12, 13, 15) but quantitative measurements are required to conclude on their significance. A 266
recent study supports that the heart-lung interactions are a vital source of gas mixing (26). In 267
addition, aerosol transport, mixing and deposition could be strongly affected by COf, which is 268
particularly relevant for inhaled therapeutics. Ma et al. (18) and Darquenne et al. (8) proposed 269
the existence of cardiogenic mixing to explain differences between measurement and simulations 270
of aerosol dispersion, and for the heterogeneity of particle deposition in microgravity, 271
respectively. In a following study, Darquenne et al. (7) addressed the effect of COf on the 272
deposition and dispersion of 1-m particles during breath holds. Although gravitational 273
sedimentation is inferred to be the main mechanism, data have suggested that COf has a larger 274
effect in the central airways than in the periphery of the lung. We believe that the effect of COf 275
has been largely underestimated in the literature, especially in the field of CFD simulations of 276
airflow in the main airways (9, 17, 25), where the influence of the heart has not, to our 277
knowledge, been taken into consideration. Finally, it would be interesting to study how the 278
observed mechanism could contribute to the chaotic mixing of fine particles proposed by Tsuda 279
et al. (27). The classical theory assumes that acinar flow is kinematically reversible due to low 280
Reynolds number gas flow deep in the lung. However, Tsuda et al. (28) and Butler et al. (2) 281
observed kinematic irreversibility and complex convective stretch and fold patterns in excised rat 282

14
lungs supporting the theory that chaotic alveolar flow arising from flow trajectory asynchrony 283
governs aerosol transport and mixing in the lung periphery. 284
Further work to simulate the influence of COf on airflow patterns is required to supplement our 285
findings, but we hope this study will increase awareness of the effect of cardiac motion on gas 286
flow and distribution within the lungs among the pulmonary community. 287
Grants 288
This work was funded by EU FP7 AirPROM, EPSRC # EP/D070252/1 and by the National 289
Institute of Health Research (NIHR). This article presents independent research funded by the 290
NIHR. The views expressed are those of the authors and not necessarily those of the NHS, the 291
NIHR or the Department of Health. 292
Disclosures 293
No conflicts of interest, financial or otherwise, are declared by the authors. 294
References 295
1. Bijaoui E, Baconnier PF, and Bates JH. Mechanical output impedance of the lung determined 296
from cardiogenic oscillations. J Appl Physiol (1985) 91: 859-865, 2001. 297
2. Butler JP, and Tsuda A. Logistic trajectory maps and aerosol mixing due to asynchronous flow 298
at airway bifurcations. Respir Physiol Neurobiol 148: 195-206, 2005. 299
3. Collier GJ, and Wild JM . In vivo measurement of gas flow in human airways with 300
hyperpolarized gas MRI and compressed sensing. Magn Reson Med (July 1, 2014). doi: 301
10.1002/mrm.25348 302
4. Corley RA, Kabilan S, Kuprat AP, Carson JP, Minard KR, Jacob RE, Timchalk C, Glenny 303
R, Pipavath S, Cox T, Wallis CD, Larson RF, Fanucchi MV, Postlethwait EM, and Einstein DR. 304
Comparative Computational Modeling of Airflows and Vapor Dosimetry in the Respiratory Tracts of Rat, 305
Monkey, and Human. Toxicol Sci 128: 500-516, 2012. 306
5. Cotes JE, Chinn DJ, Miller MR, and Wiley InterScience (Online service). Lung function 307
physiology, measurement and application in medicine. Malden, Mass. ; Oxford: Blackwell Pub., 2006. 308
6. Dahlstrom H, Murphy JP, and Roos A. Cardiogenic Oscillations in Composition of Expired 309
Gas - the Pneumocardiogram. J Appl Physiol (1985) 7: 335-339, 1954. 310

15
7. Darquenne C, Paiva M, and Prisk GK. Effect of gravity on aerosol dispersion and deposition in 311
the human lung after periods of breath holding. J Appl Physiol (1985) 89: 1787-1792, 2000. 312
8. Darquenne C, West JB, and Prisk GK. Deposition and dispersion of 1-micrometer aerosol 313
boluses in the human lung: effect of micro- and hypergravity. J Appl Physiol (1985) 85: 1252-1259, 1998. 314
9. De Backer JW, Vos WG, Vinchurkar SC, Claes R, Drollmann A, Wulfrank D, Parizel PM, 315
Germonpre P, and De Backer W. Validation of computational fluid dynamics in CT-based airway 316
models with SPECT/CT. Radiology 257: 854-862, 2010. 317
10. de Rochefort L, Maitre X, Fodil R, Vial L, Louis B, Isabey D, Croce C, Darrasse L, Apiou 318
G, Caillibotte G, Bittoun J, and Durand E. Phase-contrast velocimetry with hyperpolarized 3He for in 319
vitro and in vivo characterization of airflow. Magn Reson Med 55: 1318-1325, 2006. 320
11. Engel A. Dynamic distribution of gas flow. In: Compr Physiol 2011, Supplement 12: Handbook 321
of Physiology, The Respiratory System, Mechanics of Breathing: 575-593. First published in print 1986. 322
doi: 10.1002/cphy.cp030332 323
12. Engel LA, Menkes H, Wood LD, Utz G, Joubert J, and Macklem PT. Gas mixing during 324
breath holding studied by intrapulmonary gas sampling. J Appl Physiol (1985) 35: 9-17, 1973. 325
13. Engel LA, Wood LD, Utz G, and Macklem PT. Gas mixing during inspiration. J Appl Physiol 326
(1985) 35: 18-24, 1973. 327
14. Greenblatt EE, Butler JP, Venegas JG, and Winkler T. Pendelluft in the bronchial tree. J Appl 328
Physiol (1985) 2014. 329
15. Kelly SM, Brancatisano AP, and Engel LA. Effect of cardiogenic gas mixing on arterial O2 330
and CO2 tensions during breath holding. J Appl Physiol (1985) 62: 1453-1459, 1987. 331
16. Koumellis P, van Beek EJR, Woodhouse N, Fichele S, Swift AJ, Paley MNJ, Hill C, Taylor 332
CJ, and Wild JM . Quantitative analysis of regional airways obstruction using dynamic hyperpolarized 333
He-3 MRI - Preliminary results in children with cystic fibrosis. Journal of Magnetic Resonance Imaging 334
22: 420-426, 2005. 335
17. Lambert AR, O'Shaughnessy P, Tawhai MH, Hoffman EA, and Lin CL. Regional deposition 336
of particles in an image-based airway model: large-eddy simulation and left-right lung ventilation 337
asymmetry. Aerosol Sci Technol 45: 11-25, 2011. 338
18. Ma BS, and Darquenne C. Aerosol bolus dispersion in acinar airways-influence of gravity and 339
airway asymmetry. J Appl Physiol (1985) 113: 442-450, 2012. 340
19. Minard KR, Kuprat AP, Kabilan S, Jacob RE, Einstein DR, Carson JP, and Corley RA. 341
Phase-contrast MRI and CFD modeling of apparent (3)He gas flow in rat pulmonary airways. J Magn 342
Reson 221: 129-138, 2012. 343
20. Montmerle S, and Linnarsson D. Effects of gravity and blood volume shifts on cardiogenic 344
oscillations in respired gas. J Appl Physiol (1985) 99: 931-936, 2005. 345
21. Mylavarapu G, Murugappan S, Mihaescu M, Kalra M, Khosla S, and Gutmark E. 346
Validation of computational fluid dynamics methodology used for human upper airway flow simulations. 347
J Biomech 42: 1553-1559, 2009. 348
22. Quanjer PH, Stanojevic S, Cole TJ, Baur X, Hall GL, Culver BH, Enright PL, Hankinson 349
JL, Ip MS, Zheng J, and Stocks J. Multi-ethnic reference values for spirometry for the 3-95-yr age 350
range: the global lung function 2012 equations. The European respiratory journal 40: 1324-1343, 2012. 351
23. Suarez-Sipmann F, Santos A, Peces-Barba G, Bohm SH, Gracia JL, Calderon P, and 352
Tusman G. Pulmonary artery pulsatility is the main cause of cardiogenic oscillations. J Clin Monit 353
Comput 27: 47-53, 2013. 354
24. Sun Y, Butler JP, Ferrigno M, Albert MS, and Loring SH. "Ventilatory alternans": a left-right 355
alternation of inspiratory airflow in humans. Respir Physiol Neurobiol 185: 468-471, 2013. 356
25. Tawhai MH, and Lin CL . Airway gas flow. Compr Physiol 1: 1135-1157, 2011. 357
26. Thurgood J, Dubsky S, Henon Y, Jesudason E, and Fouras A. Heart-lung interactions: A vital 358
source of gas mixing within the lungs. Am J Respir Crit Care Med 189: A6275, 2014. 359
27. Tsuda A, Laine-Pearson FE, and Hydon PE. Why chaotic mixing of particles is inevitable in 360
the deep lung. J Theor Biol 286: 57-66, 2011. 361

16
28. Tsuda A, Rogers RA, Hydon PE, and Butler JP. Chaotic mixing deep in the lung. P Natl Acad 362
Sci USA 99: 10173-10178, 2002. 363
29. Tusman G, Suarez-Sipmann F, Peces-Barba G, Climente C, Areta M, Arenas PG, and 364
Bohm SH. Pulmonary blood flow generates cardiogenic oscillations. Respir Physiol Neurobiol 167: 247-365
254, 2009. 366
30. West JB, and Hugh-Jones P. Pulsatile gas flow in bronchi caused by the heart beat. J Appl 367
Physiol (1985) 16: 697-702, 1961. 368
31. Wild JM, Paley MN, Kasuboski L, Swift A, Fichele S, Woodhouse N, Griffiths PD, and van 369
Beek EJ. Dynamic radial projection MRI of inhaled hyperpolarized 3He gas. Magn Reson Med 49: 991-370
997, 2003. 371
372
Figure Captions 373
374
Figure 1: 375
Picture of the quadrature transmit/receive radiofrequency coil used for 2D flow measurement in 376
the left main bronchus (see slice location 2, solid line in the inset). Inset: example of a HP 3He 377
ventilation image with indication of slice locations used for 1D (1) and 2D (2) phase contrast 378
velocimetry sequences. 379

17
380
Figure 2: 381
A: Time evolution of the SNR in the 4 ROIs (RUL, LUL, RLL and LLL) of the Cartesian 382
dynamic images of subject 1 (example image and ROI positions shown in the inset). B: 383
Frequency spectrum of the signal corresponding to the left lower part of the lung (curve LLL in 384
A) after a Fourier transform (FT). The peaks at 1.08 and 2.2 Hz correspond to the fundamental 385

18
and the second harmonic of the heart rate of the subject (65 BPM). C to G: Time evolution of the 386
signal in the 4 ROIs for subjects 2 to 6. For subjects 2, 3, 5 and 6 the ECG was recorded and the 387
dashed vertical lines correspond to the occurrence of R-waves. Note: an R-wave occurrence is 388
missing (not recorded) in G (subject 6) at ~ 7 s. 389
390
Figure 3: 391

19
1D PCV. Time evolution of the average velocity of 3He gas in the left/right main bronchi 392
(LMB/RMB) in subjects 1 to 6 (A to F respectively) during a constant inhalation (see slice 393
location 1 in the inset of Fig. 1). The vertical dashed lines correspond to the occurrences of the 394
R-waves that were recorded with ECG (not recorded for subject 1). For subject 3 (C) a case of 395
arrhythmia can be observed between 6 to 7 s. Mean estimated errors for each average velocity 396
curve were: A LMB: ± 5 cm s-1; RMB: ± 5 cm s-1. B LMB: ± 8 cm s-1; RMB: ± 7 cm s-1. C LMB: 397
± 6 cm s-1; RMB: ± 5 cm s-1. D LMB: ± 8 cm s-1; RMB: ± 6 cm s-1. E LMB: ± 7 cm s-1; RMB: ± 398
6 cm s-1. F LMB: ± 5 cm s-1; RMB: ± 5 cm s-1. 399
400
Figure 4: 401
Correlation and linear regression line of the fundamental frequency of the signal oscillations and 402
the heart rate measured with ECG. Crosses: from the SNR oscillations of LLL during the 403
dynamic ventilation experiments. Stars: from the 1D velocity measurement (in left main 404
bronchus). Solid line: linear regression line (f(SNR) = 6.24 + 0.92 × HR, correlation coefficient: 405
20
0.99). §: Heart beat measured by finger probe shortly before the experiments and not by 406
synchronized ECG recording. The three values marked with “§” are shown on the graph but were 407
not included into the regression line, nor were they used in the calculation of the correlation 408
coefficient. 409
410
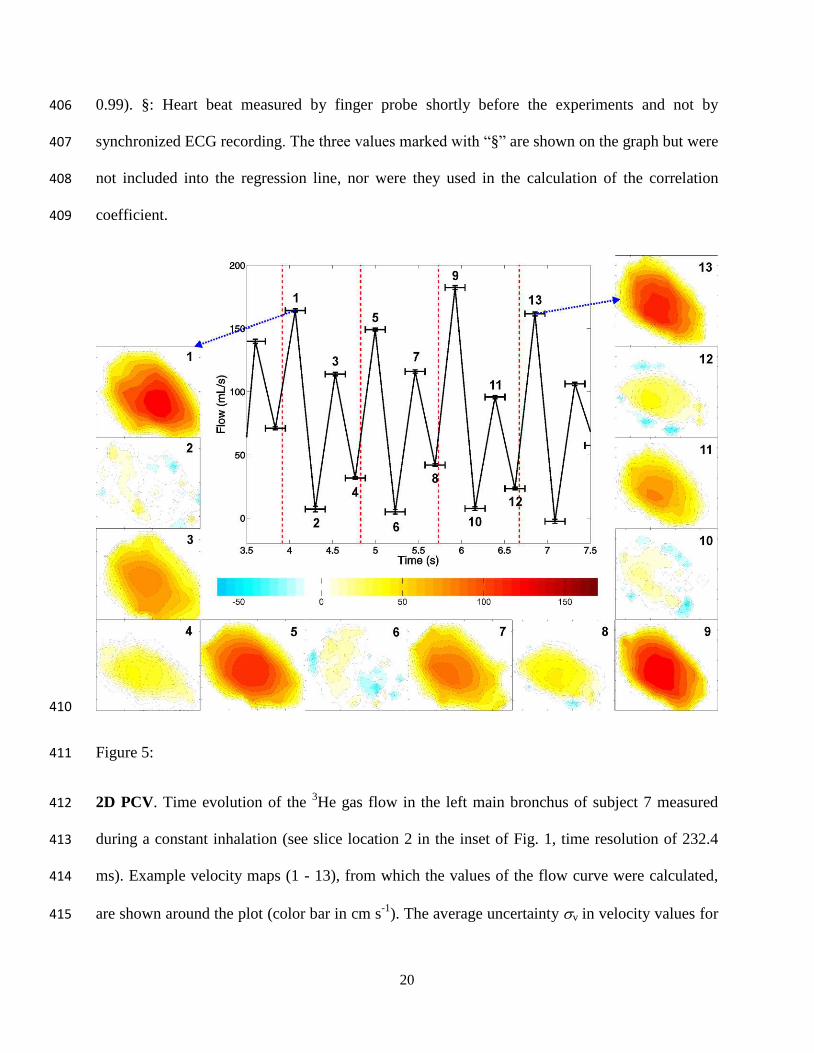
Figure 5: 411
2D PCV. Time evolution of the 3He gas flow in the left main bronchus of subject 7 measured 412
during a constant inhalation (see slice location 2 in the inset of Fig. 1, time resolution of 232.4 413
ms). Example velocity maps (1 - 13), from which the values of the flow curve were calculated, 414
are shown around the plot (color bar in cm s-1). The average uncertainty v in velocity values for 415

21
the given velocity maps was ~ 5 cm s-1. The flow error bars (on the vertical axis) were calculated 416
according to the method described in the image analysis section and range between ± 1 and ± 2 417
mL s-1. The “x-error bars” on the flow curve represent the acquisition window for each velocity 418
map. 419
420
Figure 6: 421
Relative left and right lung volume changes and the corresponding time-derivatives (inset) after 422
segmentation of a cardiac gated series of proton images of the lungs of subject 1 acquired during 423
breath hold (20 cardiac phases). 424
Tables 425
Table 1: 426
Subject characteristics and sequences performed 427

22
M, male; F, female; FEV1, forced expiratory volume in 1 s; FVC, forced vital capacity. * See ref. (22) . † 428
Synchronised ECG recording available. 429
Table 2: 430
Fourier transform analysis of the data from the dynamic ventilation experiments 431
* in beats per minute, † from finger probe shortly before the experiment, § from synchronized ECG 432
recording. ‡ No clear oscillations were observed for subject 5 in the LUL, RLL and RUL explaining why 433
no values are quoted. 434
435