Observation and Modeling Evidence of Ozone Transport to and from Asia Hajime Akimoto (Oliver Wild...
27
Observation and Modeling Evidence of Ozone Transport to and from Asia Hajime Akimoto (Oliver Wild and Pakpong Pochanar t) Frontier Research Center for Globa l Change (FRCGC) Japan Agency for Marine-Earth Science a LRTAP/EMEP Task Force on Hemispheric Transport of Air Pollutants, Brussels, June 1-3, 2005
-
Upload
johnathan-stewart -
Category
Documents
-
view
214 -
download
0
Transcript of Observation and Modeling Evidence of Ozone Transport to and from Asia Hajime Akimoto (Oliver Wild...
Observation and Modeling Evidence of Ozone Transport to and from Asia
Hajime Akimoto(Oliver Wild and Pakpong Pochanart)
Frontier Research Center for Global Change (FRCGC)
Japan Agency for Marine-Earth Science and Technology (JAMSTEC)
LRTAP/EMEP Task Force on Hemispheric Transport of Air Pollutants, Brussels, June 1-3, 2005

Free Troposphere
Boundary Layer
N. America AsiaEurope
Intercontinental Transport at Northern Mid-latitudes
HH
H
LL L

Trans-Eurasian Transport
Motivations
• Trans-Pacific and Trans-Atlantic transport well studied
– PEM-West, TRACE-P, ACE-Asia, NARE, ITCT
• Trans-Eurasian transport less well understood
• Unique features
– meteorological mechanisms for export
– chemical influences due to latitude and meteorology
– emissions and deposition over continent
Questions
• How does pollutant export differ from that from N. America or East Asia? What are the impacts on oxidation and climate?
• To what extent does European pollution affect central and eastern Asia? How does this compare with N. American influence?
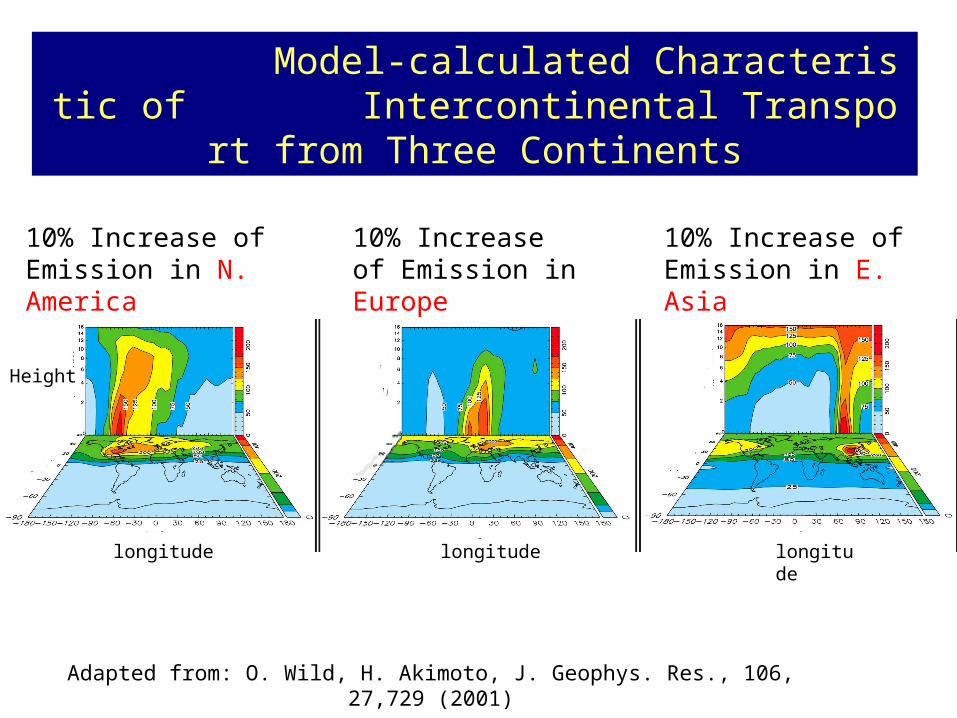
10% Increase of Emission in N. America
10% Increase of Emission in Europe
10% Increase of Emission in E. Asia
Model-calculated Characteristic of Intercontinental Transport from Three Continents
Adapted from: O. Wild, H. Akimoto, J. Geophys. Res., 106, 27,729 (2001)
longitude
Height
longitude longitude
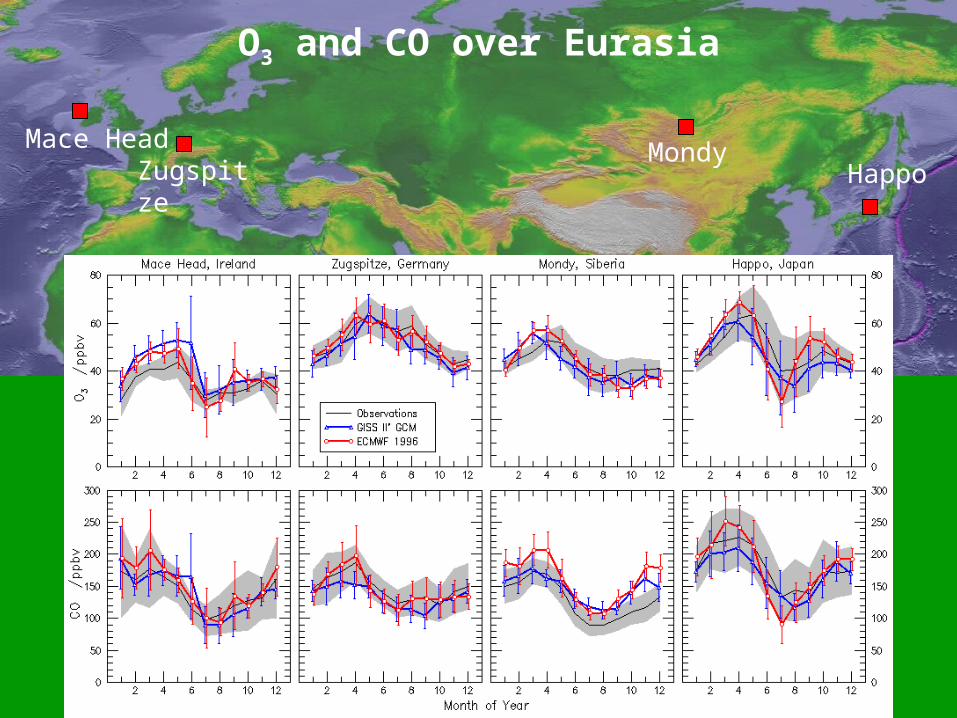
O3 and CO over Eurasia
Mace HeadZugspitze
MondyHappo

Export of Oxidants from Europe
• Horizontal transport in PBL dominates export
• Seasonal variation in export dependent on species

Can European Pollution Affect East Asia?
Source: Newell and Evans [2000]

Trajectories Arriving at 100°E
Newell and Evans [2000]

European Impacts at 100°E
CO: greatest in high-latitude PBL in wintertime
O3: greatest in low/mid-trop in spring
close to zero in winter PBL

Remote Stations for Surface O3 from Europe to East Asia Mountain (1600-2000 m): Arosa, Mondy and Happo
Sea Level: Mace Head, Oki, and Okinawa

Arosa, Switzerland
Mondy, Russia
Happo, Japan

Seasonal Variation of Background Ozone in East Asia and Europe -Observation-
Jan Feb Mar Apr May Jun Jul Aug Sep Oct Nov Dec0
10
20
30
40
50
60
70
East Asia-EuropeSummer Minimum
Spring Maximum Mondy Background 1996-1999 Happo Background 1996-1997 Arosa Background 1996-1997 Mace Head Background
Ozone (ppb)
Month

Seasonal Variation of Regionally Polluted Ozone in East Asia and Europe -Observation-
Jan Feb Mar Apr May Jun Jul Aug Sep Oct Nov Dec0
10
20
30
40
50
60
70
Arosa Regionally Polluted 1996-1997 Happo Regionally Polluted 1996-1997
Happo - Arosa
Ozone (ppb)
Month

Differences in Surface Ozone between
Europe and East Asia Derive regional background
– remove local emissions
Compare:Mace Head (Ireland)Arosa (Switzerland)Mondy (Siberia)Happo (Japan)
East Asian Ozone lower in summer due to Asian monsoon
Ozone 5-10 ppbv higher at Asian sites from autumn to spring
– Why ?

Differences in Surface Ozone between Europe and East Asia
Consider mean difference– Asian sites – European
sites– local emissions removed
Stratospheric influence greater over Asia – driven by subsidence over
Central Asia
Residual largely due to:– emissions over Europe– emissions over Eurasia
Background O3 higher over Asia– implications for air quality

Impacts of European Sources at 100º East
CO– Winter/spring maximum, summer
minimum– Boundary layer impacts greatest
O3
– Spring maximum, summer minimum
– Additional minimum in winter– Greater impacts in mid-
troposphere
Mondy, 52N
Can we detect European influence from the measurements?

Raw obserbational data of O3 and CO at Mondy during 1996-99
Pochanart, Akimoto et. al Atmos. Environ., 2001
O3
CO
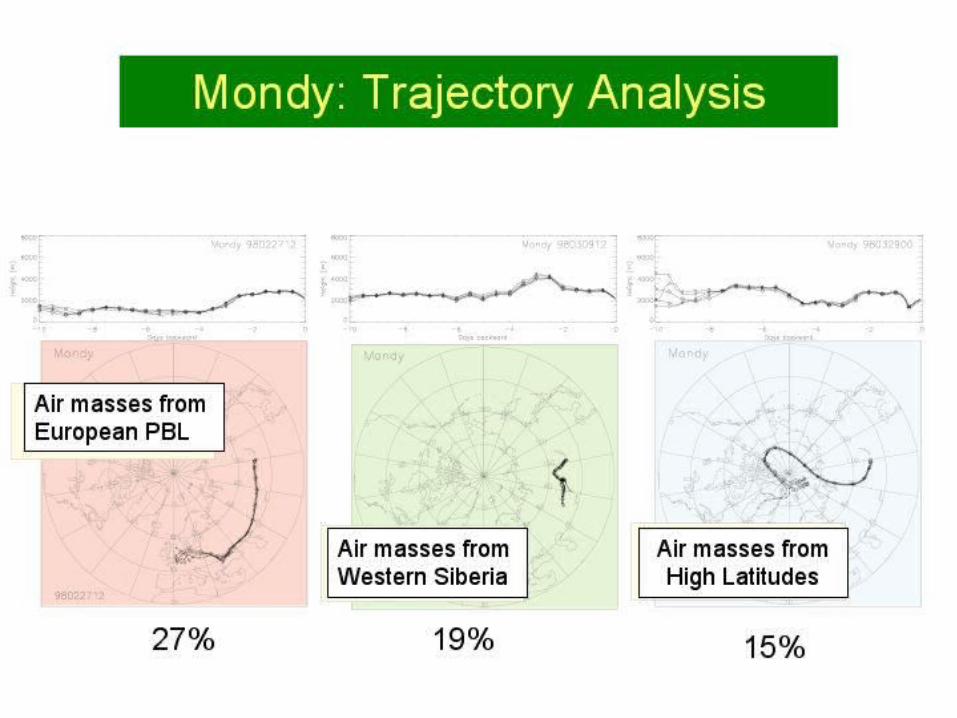

Classification based on trajectories
Jan Feb Mar Apr May Jun Jul Aug Sep Oct Nov Dec20
25
30
35
40
45
50
55
60
a)
Hi Lat
Ozone mixing ratio (ppb)
Month
Europe
Siberia
20 30 40 50 60 70 800
100
200
300
400
500
a) Ozone Europe Siberia High Latitude
Amount of Data (hr)
Ozone mixing ratio (ppb) EU
EU
SI
SI
HL
HL
O3 O3
CO CO
Monthly Mean Data Frequency Distributions (Annual Data)

Comparison of Ozone in European Air mass with Others by Season
Spring Summer Winter

Impact of O3 and CO over Happo, Japan from Europe and N. America

Impacts on O3 and CO over Happo, Japan from Europe and N. America in April 1996
O3 CO

Contribution to Surface O3 at Happo by Difference Sources in April 1996
60 ppbv 1hr av.
European/N.American impacts persist during local pollution episodes (Apr 23-27): affect attainment of air quality standards
Japan EQS for Ox

Seasonal Variation of Trajectory Categorized ozone in Japan
Jan Feb Mar Apr May Jun Jul Aug Sep Oct Nov Dec0
10
20
30
40
50
60
70
80
Rishiri 9801-9812
Ozone concentration (ppb)
Month
Jan Feb Mar Apr May Jun Jul Aug Sep Oct Nov Dec0
10
20
30
40
50
60
70
80
Okinawa 9501-9612
Ozone concentration (ppb)
Month
Jan Feb Mar Apr May Jun Jul Aug Sep Oct Nov Dec0
10
20
30
40
50
60
70
80
Oki 9404-9603
Ozone concentration (ppb)
Month
Jan Feb Mar Apr May Jun Jul Aug Sep Oct Nov Dec0
10
20
30
40
50
60
70
80
Ogasawara 9706-9808
Ozone concentration (ppb)
Month
Rishiri
Oki
Okinawa
Ogasawara

Trend of Annual Average Concentration of Ox and Precursors in Tokyo (Average of 23 Stations)
Oxidant Measure Committee Report, Tokyo Metropolitan Government (2005)

Mondy
WaliguanVostochnaya (?)
Long-term measurements needed over Eurasia
• Regional coverage over Asia relatively poor
• Transport from Europe occurs at high latitudes
• More sites needed over Central and Northern Asia
EMEP Sites EANET/ GAW Sites & China

ConclusionsFrom CTM Studie
• Significant European impacts over Central Asia– Average 10-30 ppbv CO, 1-4 ppbv O3
• Only slightly smaller impacts over Japan– Average 2-25 ppbv CO, 0.2-2.5 ppbv O3
– Present during anticyclonic conditions (affect AQ Stds)– N. American influence larger than European in mid-trop
From Observations• Signature of European influence present in O3 and CO
– Still difficult to quantify directly (new methods needed?)