Observation and Inference - Mr. Rohm's Science...
14
Observation and Inference An observation is a description of an object or event. For example, "this rock is shiny," "this animal has fur," and "the snowstorm lasted for six hours" are observations. Observations are made by using the five senses. Instruments assist our senses. A telescope allows us to see objects at very long distances. Instruments are also used to make measurements. For example, "this rock has a mass of 23.4 grams" is a measurement made by using a balance. An inference is a conclusion, opinion, or explanation of the observations. An inference can be a prediction about the future. The weather forecast for tomorrow is an inference. Review Questions 1. An observation is a ____________ of an object or event. 2. We observe by using our ____________. 3. Our senses are helped by the use of ____________. 4. An _________________is a conclusion based on observations. 5. An inference can be a ____________ about a future occurrence. 6. Is the statement an observation (O) or an inference (I)? a. The road is 5.6 kilometers long. ___ d. It will rain tonight. ___ b. Friction slowed the car. ___ e. This surface feels slippery. ___ c. This footprint was made by a dinosaur. ___ f. Ice melts at 0°C. ___ Metric Measurement Measurement is an observation and description using numbers. All measurements are usually rounded to the nearest tenth and have a unit. For example, a measured mass of 35.68 should be written as 35.7 grams. Any number that is equal to or greater than 5 will round up. Any number that is 4 or less will round down. Example: (1.44 1.4), (1.45 1.5), (1.461.5) If there is no number in the tenth position next to the whole number you still must round to the nearest tenth. Example: (11.0) Round all numbers to the nearest tenth 1) 2.36g= 2) 130.24 N = 3) 1.98 V = 4) 12.55ml = 5) 4mm = 6) 3.678g = 7) 3.16kg = 8) 10.45g = 9) 136.25ml= 10) 10.5932kg = 11) 8.43L = 12) 1.26m = 13) 20.125cm = 14) 112.456m = 15) 2g = 16) 1.446cm = 14. State the safety precautions a student should take in this laboratory situation. 1_____________________________________________________________________ 1
Transcript of Observation and Inference - Mr. Rohm's Science...
Observation and Inference
An observation is a description of an object or event. For example, "this rock is shiny," "this animal has fur," and "the snowstorm lasted for six hours" are observations.
Observations are made by using the five senses. Instruments assist our senses. A telescope allows us to see objects at very long distances. Instruments are also used to make measurements. For example, "this rock has a mass of 23.4 grams" is a measurement made by using a balance.
An inference is a conclusion, opinion, or explanation of the observations. An inference can be a prediction about the future. The weather forecast for tomorrow is an inference.
Review Questions
1. An observation is a ____________ of an object or event.
2. We observe by using our ____________.
3. Our senses are helped by the use of ____________.
4. An _________________is a conclusion based on observations.
5. An inference can be a ____________ about a future occurrence.
6. Is the statement an observation (O) or an inference (I)?
a. The road is 5.6 kilometers long. ___ d. It will rain tonight. ___
b. Friction slowed the car. ___ e. This surface feels slippery. ___
c. This footprint was made by a dinosaur. ___ f. Ice melts at 0°C. ___
Metric MeasurementMeasurement is an observation and description using numbers. All measurements are usually rounded to the
nearest tenth and have a unit. For example, a measured mass of 35.68 should be written as 35.7 grams. Any number that is equal to or greater than 5 will round up. Any number that is 4 or less will round down. Example: (1.44 1.4), (1.45 1.5), (1.461.5) If there is no number in the tenth position next to the whole number you still must round to the nearest tenth. Example: (11.0)
Round all numbers to the nearest tenth
1) 2.36g= 2) 130.24 N = 3) 1.98 V = 4) 12.55ml =
5) 4mm = 6) 3.678g = 7) 3.16kg = 8) 10.45g =
9) 136.25ml= 10) 10.5932kg = 11) 8.43L = 12) 1.26m =
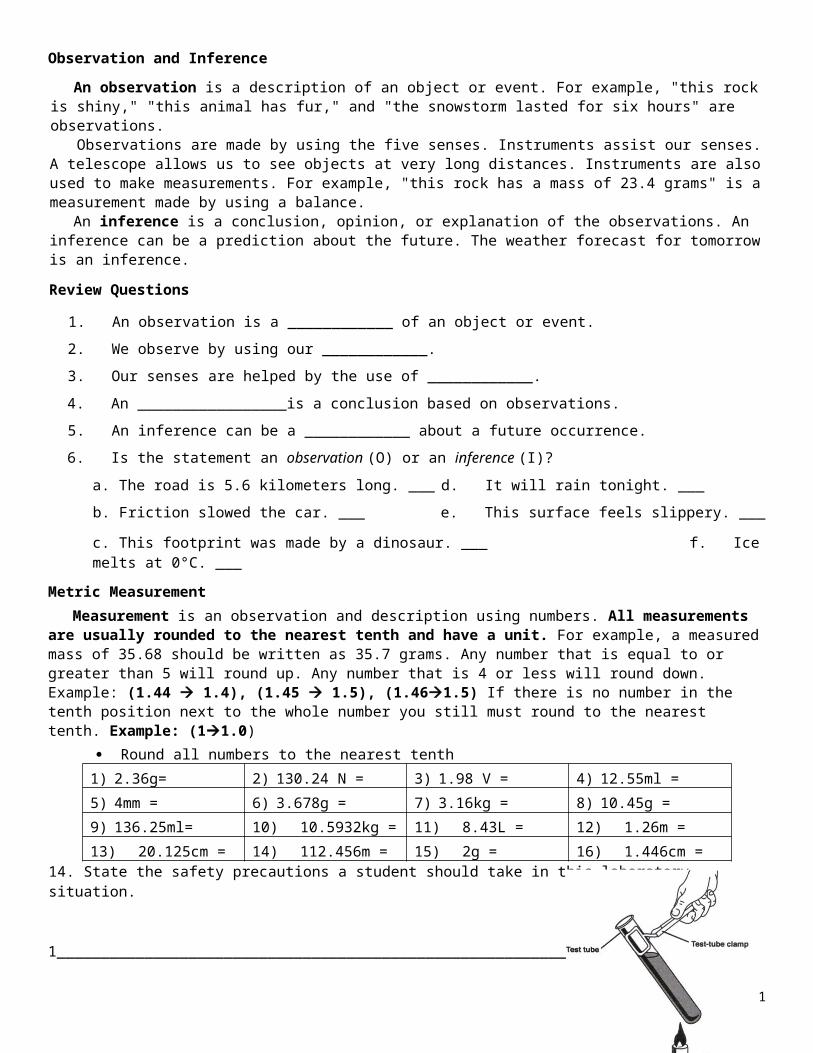
13) 20.125cm = 14) 112.456m = 15) 2g = 16) 1.446cm =14. State the safety precautions a student should take in this laboratory situation.
1_____________________________________________________________________
2_____________________________________________________________________
3_____________________________________________________________________
1

The scientific method is a series of steps used to investigate and answer questions. It is an organized plan used to solve problems. Scientists are not the only ones who use this method of investigation. We all use the scientific method to find the solutions to our questions.
Steps in the Scientific Method of Problem Solving
1 Ask a Question State the problem which needs to be solved.
2 Develop a Hypothesis
Educated guess
If … (what will happen)
Then … (expected outcome)
Because…(Why will this happen)
3 Design an Experiment
Write a step-by-step procedure that anyone can follow
Materials that are required
Safety precautions
State if it is a controlled experiment (an experiment that tests one factor)
Identify the independent “manipulated” variable (the variable that you change)
Identify the dependent “responding variable” (the result of the independent variable)
Identify all constants (factors that do not change in the experiment, which will allow only the independent variable to be tested and prevents mixed results)
4 Perform the Experiment
Make observations and collect data, Enter Data into data table
5 Interpret Data Explain observations, Identify sources of error
Include graphs, diagrams and calculations to support illustrate data collected.
6 Form a Conclusion
The conclusion is based on the observations and data collected.
The conclusion should answer questions and compare results to hypothesis.
7 Communicate Results
Write a lab report that will communicate your findings.
Review Questions
7. The first step in scientific method is to ask a ______________________________.
8. A possible (educated guess) answer to the problem is a _____________.
9. A controlled experiment tests only ____________________________ factor.
10. The variable which you change is the ________________________________ variable.
11. The data you collect is the _______________________________________________ variable.
12. A conclusion is based on _____________ and _____________ collected.
2

13. A student wonders if the color of the light will affect how a plant grows.
a. Write a Question: _________________________________________________________________________
b. Develop a Hypothesis:
If__________________________________________________________________________________________
Then________________________________________________________________________________________
Because_____________________________________________________________________________________
c. State the factor that should be changed in the experiment:____________________________________________
d. State the factor that will be observed during the experiment: _________________________________________
e. List THREE factors (constants) that should remain the same during the experiment:
(1) ______________________________(2) _____________________________ (3) ____________________________
Lab Equipment and Making Measurements
3

GraphingGraphs show the relationship between the variables. Graphs show how the responding variable has changed. They may show a pattern. STEPS IN CONSTRUCTING A LINE GRAPH
1 Label the X- axis The first factor listed in the data chart is the manipulated (independent) variable. This is labeled on the horizontal axis.
2 Label the Y-axis The second factor on the data chart is the responding (dependent) variable. This is labeled on the vertical axis.
3 Label the unit of measurement
On each axis write the unit of measurement that was used. This is often placed in parenthesis "( )".
4 Number each axis The data collected must fit along each axis of the graph. The axis must be numbered with the same interval such as by 2s (2, 4, 6,. . .) or 5s (5, 10, 15,...). The same interval does not have to be used on both axes.
5 Plot the data Accurately place a point for each set of data.6 Draw a line Draw the best fit line for the data plotted or connect the data points.7 Title the Graph Write a title for the graph based on the type of data collected.
A data chart and its corresponding graph is shown to the right.
19. Name the two parts of the graph that are missing. _____________ and _______________ Complete the graph.
20. The horizontal axis is the____________________variable.
21. The ____________ axis is the dependent variable.
22. Axes are numbered using the ___________ interval.
23. Each axis is labeled with the___________ and __________________.
24. Refer to the graph to the right:
a. The independent variable is_________________________________.
b. The dependent variable is _________________________________.
c. A good title would be ________________________________________
d. As the depth of water increased, the temperature_______________________.
4
Water Temperature (°C) Gill Movement (openings/minute)
10 1215 2320 3525 49

Multiple Choice Question: Name _______________________________________________________________1. A student visits a stream. The student writes down four statements in his notebook. Which statement is an
inference?(1) The maximum water depth is 8.7 meters.(2) The water is so clear that I can see the bottom.(3) The stream was formed during the last Ice Age.(4) The water temperature is 16.0° C.
2. A student is rolling a ball down a ramp. Which statement is an observation?(1) If the ramp is steeper, then the ball will roll faster.(2) Friction slowed the ball.(3) Gravity caused the ball's motion down the ramp.(4) The ball rolled 86.3cm. in 3.0 seconds.
3. Which set of items could be used to make observations during an experiment?(1) sight, ruler, stopwatch (3) sight, touch, textbook(2) sight, graph paper, calculator (4) touch, ruler, notebook
4. An orderly process used to solve problems and investigate the world is(1) technology (2) scientific method (3) prediction (4) theory
5. A student decides to enter a science contest that requires an original research project. What is the first step she must take in doing the research?(1) design an experiment(2) write a conclusion(3) state the problem to which she wants to find an answer(4) collect data in an organized chart
6. The information that has been collected through observation and measurement is called the(1)data (2) conclusion (3) variables (4) theory
7. In an experiment, the factor that is being tested and changed is the(1) data (2) control (3) variable (4) inference
8. Diagrams, tables, and graphs are used by scientists mainly to(1) design a procedure (3) organize data(2) test a hypothesis (4) predict the independent variable
9. All of the following are safe procedures to follow when heating a beaker of water except:(1) use heat-resistant gloves(2) watch the beaker as it is heated(3) remove your goggles when you put the beaker on the hot plate(4) keep the counter clear of papers
10. The length of a sneaker is best measured in: (1) millimeters (2) centimeters (3) meters 4) kilometers
11. The mass of a very large boulder is best expressed in:(1) milligrams (2) centigrams (3) grams 4) kilograms
5

SCIENTIFIC METHOD: ANALYSIS - INQUIRY - DESIGNBase your answers to questions 12-14 on the following paragraph:
In a science experiment, 10 bean seedlings were placed in the dark and another 10 bean seedlings were placed in sunlight. All other growth conditions were kept the same for both sets of seedlings. After one week it was observed that the seedlings in the dark were white with long slender stems. The seedlings in the sunlight were green and healthy.
12.The manipulated (independent) variable in this experiment was the: (1) number of bean seedlings (2) temperature (3) amount of light (4) growth of seedlings
13. The responding (dependent) variable in this experiment was the: (1) number of bean seedlings (2) temperature (3) amount of light (4) growth of seedlings
The "growth conditions" that were kept the same are called:(1) constants (2) predictions (3) observations (4) inferences
14. Which conclusion can be made from this experiment?(1) Plants grown in the dark can not carry on respiration.(2) Light is necessary for proper water absorption by roots.(3) Light is necessary for the germination of bean seeds.(4) Light is needed for the normal growth of seedlings.
15. An ecologist determined the population size of several species during May, June, and July. The results are in the data table below. Which graph best represents each specie's population for May?
16.
A student collects pond water in a jar. Write the steps she must follow to determine the mass of the pond in the jar.
__________________________________________________________________________________________________
__________________________________________________________________________________________________
17. A student goes skateboarding a few times a week. The student notices that she can go faster while skating on some level surfaces than on others. She hypothesizes that speed has something to do with the surface she is skating on. The student wants to design an experiment to test this hypothesis
a Identify the independent (manipulated) variable in the experiment. ________________________________
b Identify the dependent (responding) variable in the experiment. ___________________________________
c Identify two factors that will need to be held constant in the experiment.
_________________________________________ ____________________________________________
17. A student performed a laboratory experiment to determine the effect of temperature on the heart rate of a water flea. 6
Field Species Number of OrganismsMayMay
July Augustgrasshoppers
1,000 5,000 1,500birds 250 100 100grasses 7,000 20,000 6,000spiders 75 200 500

The following temperatures and heart rates were recorded:
20°C - 260 beats/min, 10°C- 154beats/min, 15°C- 200 beats/min, 25°C - 300 beats/min, 5°C- 102 beats/min
a. Organize the data into a data table (include title for each variable)
b. State the manipulated (independent) variable in this experiment.__________________________________c. Write a statement based on the data that describes the relationship between temperature and heart beat in the water flea.
__________________________________________________________________________________________________
18. Design a graph based on the data table that you made in question 17. Include the following, Title, name of axes and units, correct intervals that are the same for each box, the
A student set up the experiment below to learn about plant growth. The student added a different amount of
7
water to four identical containers, each containing four seeds in 100 cubic centimeters of soil. All of the containers were placed in the same sunny location.
65 State a hypothesis being tested in this experiment. [1] ______________________________________________________________________________________
______________________________________________________________________________________66 a Identify one variable that is being held constant in this experiment. [1]
______________________________________________________________________________________ b Explain why this variable needs to be held constant. [1]
______________________________________________________________________________________ ______________________________________________________________________________________
The diagram below shows a ball held in place by two blocks. The diameter (width) of the ball is shown between the two blocks.
What is the diameter of the ball?
(1) 6.0 cm (3) 14.0 cm (2) 8.0 cm (4) 17.0 cm
8
A student determined that shaking a container of sand caused the temperature of the sand to rise.
The student then performed a new experiment to see if shaking a container of pebbles would cause the temperature of the pebbles to rise.
61 Explain why the shaking caused the temperature of the sand to rise. [1] ______________________________________________________________________________________ ______________________________________________________________________________________62 Write a hypothesis for the new experiment. [1] ______________________________________________________________________________________ ______________________________________________________________________________________ ______________________________________________________________________________________63 Identify the dependent (responding) variable in the new experiment. [1] _________________________________________
The diagram below shows milk being poured into a measuring cup.
Which property of the milk can be directly measured using the cup?
9

(1) mass (2) density (3) solubility (4) volume
Saltwater plants of the same species were grown in soil in separate containers with 1 liter of water. All of the plants were the same height at the beginning of the experiment. Different amounts of salt were dissolved in each container as shown in the diagrams. All other conditions were held constant. Measurements for the final height of each plant are provided.
Use the information from the student’s experiment to construct a line graph on the grid below. a Use an X to plot the final height of each plant at the end of the experiment. [2]
b Connect the Xs with a solid line. [1]
50 Basedonyourgraphortheinformationprovided,determinetheexpectedheightofthissame
10

typeofplant if it were grown in 1 liter of water with 2.5 grams of salt added. [1] __________ cm
51 State one conclusion, based on the information provided, about the growth of this type of saltwater plant in water containing 0 to 20 grams of salt per liter. [1] ______________________________________________________________________________________ ______________________________________________________________________________________
52 In this experiment, the student used plants of the same height and species in equal amounts of water. Identify one other condition that the student needed to keep constant. [1] ______________________________________________________________________________________ ______________________________________________________________________________________.
11