OBJECTIVES (i) An update of the national analysis a) to assess the confounding and modifying effect...
15
-
Upload
junior-floyd -
Category
Documents
-
view
213 -
download
0
Transcript of OBJECTIVES (i) An update of the national analysis a) to assess the confounding and modifying effect...


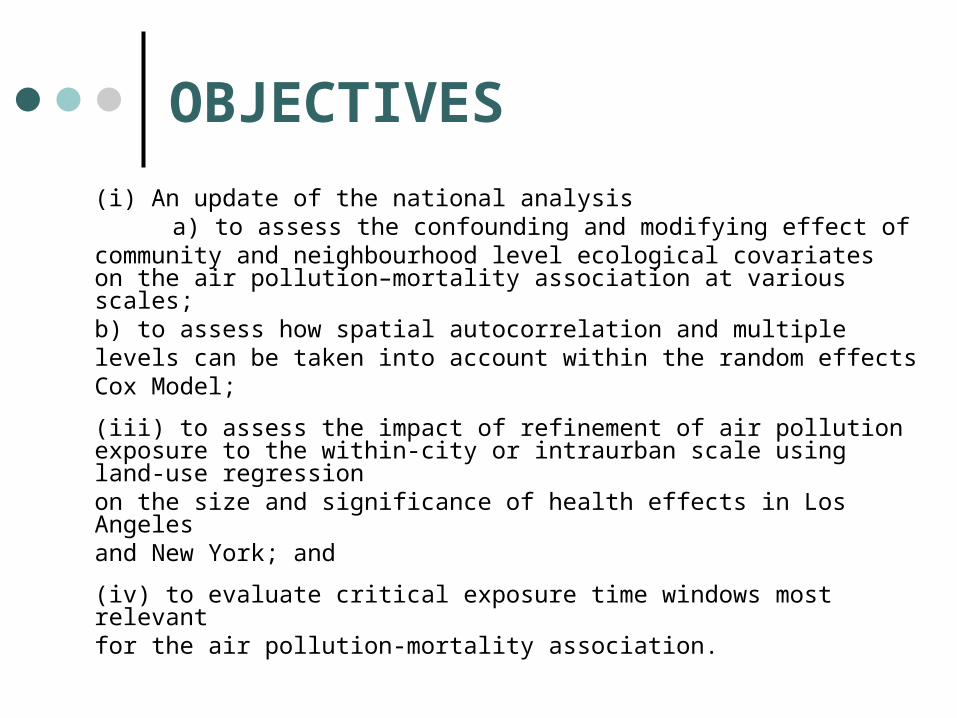
OBJECTIVES
(i) An update of the national analysis a) to assess the confounding and modifying effect of
community and neighbourhood level ecological covariates on the air pollution–mortality association at various scales;
b) to assess how spatial autocorrelation and multiple levels can be taken into account within the random effects Cox Model;
(iii) to assess the impact of refinement of air pollution exposure to the within-city or intraurban scale using land-use regression on the size and significance of health effects in Los Angeles and New York; and
(iv) to evaluate critical exposure time windows most relevant for the air pollution-mortality association.

Spatial distribution (kriged) of fine particles in the year 1999-2000 (mean)

HRs of pollution risk factors for selected causes of death with follow-up from 1982 to 2000, adjusting for 44 individual level covariates and stratifying the baseline hazard function by age, gender, and race using the standard Cox survival model (95% CIs).

HRs of pollution risk factors for selected causes of death with follow-up from 1982 to 2000, adjusting for 44 individual level covariates and stratifying the baseline hazard function by age, gender, and race using the standard Cox survival model (95% CIs).
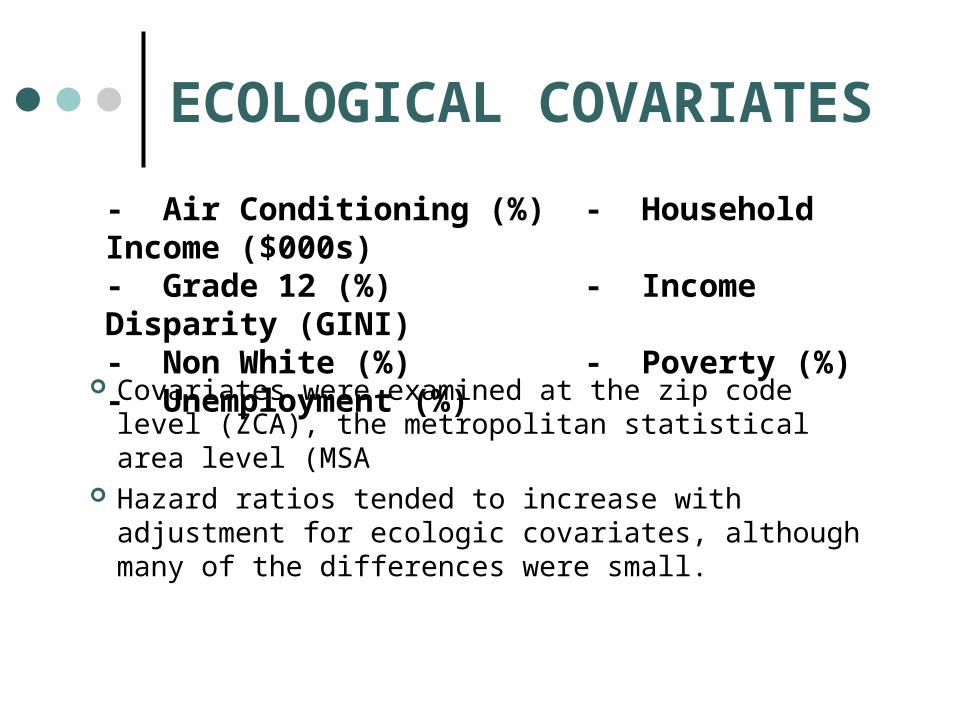
ECOLOGICAL COVARIATES
Covariates were examined at the zip code level (ZCA), the metropolitan statistical area level (MSA
Hazard ratios tended to increase with adjustment for ecologic covariates, although many of the differences were small.
- Air Conditioning (%) - Household Income ($000s)- Grade 12 (%) - Income Disparity (GINI)- Non White (%) - Poverty (%)- Unemployment (%)

SPATIAL AUTOCORRELATION
The inclusion of spatial autocorrelation at both the MSA and ZCA levels increased the variance of the random effects, and widened the CIs for the PM2.5 HR, providing some evidence of spatial clustering of residual mortality coinciding with the spatial pattern of PM2.5
EXPOSURE-TIME WINDOWS
Is there a critical exposure-time window that is primarily responsible for the increased mortality associated with ambient air pollution?
Limited inter-individual temporal variation in exposures makes it difficult to identify the most critical period of exposure

INTRAURBAN ANALYSES
LOS ANGELESResults of the LA spatial analysis found
health effects nearly three times greater than earlier analyses using between-community exposure contrasts.
NEW YORKUnlike the LA results, mortality for all-
cause, cardiopulmonary, and lung cancer deaths was not elevated in the NYC spatial analysis; however, significant effects were seen for IHD.

INTRAURBAN ANALYSES
Upon comparing subject characteristics in LA and NYC, it appeared unlikely that the differences observed among the national study and the two intraurban analyses were attributable differences in the underlying characteristics in each cohort group.
The differences between NYC and LA may be attributable to fundamental differences in the topographical, geographical, and urban attributes of these two megalopolisis.


ELEMENTAL CARBON
Elemental carbon was associated with the greatest all-cause and cardiopulmonary mortality effect; however results were sensitive to the inclusion of the other air pollutants in the model.
When using the actual distribution of air pollutant exposures in the U.S. as the risk scale in the survival models, sulphate was associated with the greatest mortality effect, with results robust to multi-pollutant adjustment.