
objectives...
21
21-22 March 2005 LMD, Palaiseau, France CHIMERE workshop Air quality assessment for Portugal A. Monteiro, C. Borrego, A.I. Miranda, R. Vautard Universidade de Aveiro, Portugal
description
objectives. ...to contribute to the air quality evaluation , according to the AQ Framework Directive. ...to verify the fulfilment of the Daughter Directives for NO 2 , SO 2 , CO and specially O 3. methodology... model system. meteorology. ECMWF - PowerPoint PPT Presentation
Transcript of objectives...

21-22 March 2005 LMD, Palaiseau, France
CHIMERE workshop
Air quality assessment for Portugal
A. Monteiro, C. Borrego, A.I. Miranda, R. Vautard
Universidade de Aveiro, Portugal

objectives...
...to contribute to the air
quality evaluation,
according to the AQ
Framework Directive
...to verify the fulfilment of
the Daughter Directives
for
NO2, SO2, CO and specially O3

ECMWF (European Centre for Medium-range
Weather Prediction)
meteorology
3D fields WindTemperatureSpecific humidity
2D fields Superficial pressureCloud coverPrecipitation
CHIMERE gas-phasephotochemistry
3D fieldsPollutants concentrationO3, NO2, NO, CO, COV,
SO2
2D fields Pollutants deposition
methodology...model system

methodology...study domain
1a simulation at continental scale
10.5W 22.5E
35N
57.5N
Initial and background conditionsMOZART climatological model
emissionsEMEP inventory
vertical structure6 levels (50, 250, 600, 1200, 2000 e 3000 m)
simulation period2001
50x50 km

methodology...study domain
“simple one-way technique”
2a simulation nested to PORTUGAL
domain
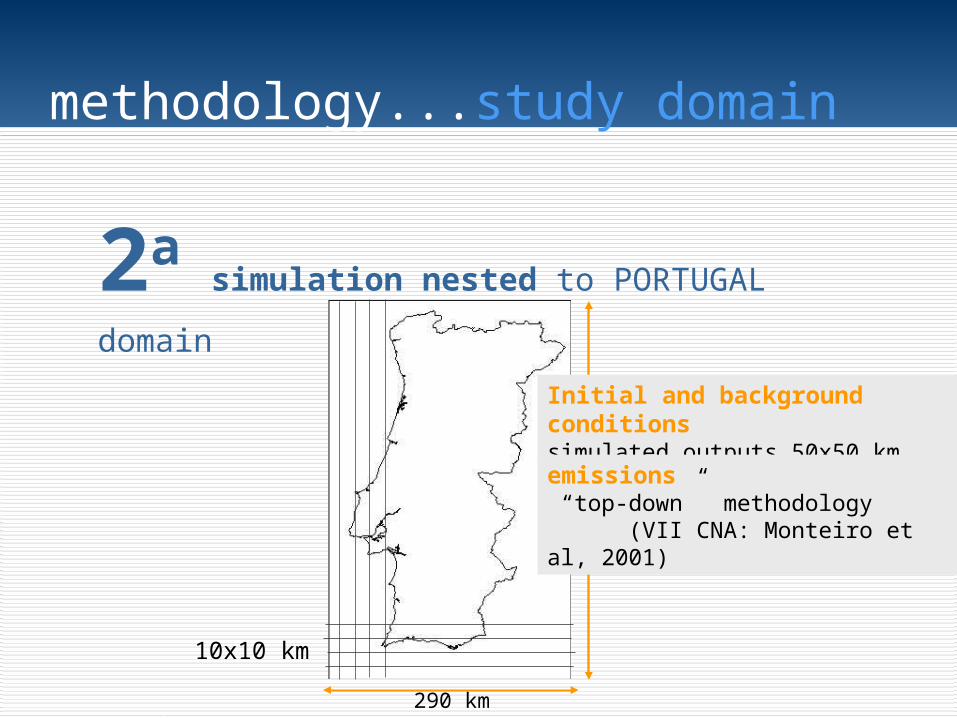
methodology...study domain
290 km
580 km
10x10 km
Initial and background conditionssimulated outputs 50x50 kmemissions “top-down” methodology (VII CNA: Monteiro et al, 2001)
2a simulation nested to PORTUGAL
domain

AQ standart (µg.m-3)
Nº of allowed excedeences
Target date
SO2 (1999/30/EC)
350 24 times/year 1 Jan 2005
125 3 times/year 1 Jan 2005
20 - -
20 - -
NO2 (1999/30/EC)
200 18 times/year 1 Jan 2010
40 - 1 Jan 2010
CO (2000/69/EC)
10 mg.m-3 - 1 Jan 2005
O3 (2002/3/EC)
120 25 times/year 1 Jan 2010
18000 µg.m-
3.h- 1 Jan 2010
180 - -
Parameters
Human health protection
Human health protection
Vegetation protection
Vegetation protection
Human health protection
Human health protection
Human health protection
Human health protection (target value)
Vegetation protection (AOT40) (target value)Information threshold
Alert threshold
Period
Hourly average
Daily average
Anual average
Winter average
Hourly average
Anual average
8h running average
8h running average
Hourly average (May-July)
hourly average
Hourly average 240 3 consecutive h -
air quality assessment
SO2 25ª m axim um hour o f the year
0
25
50
75
100
125
150
175
200
225
250
275
300
325
350
SO 2(µg.m -3)
4ª m axim um daily average of the year
SO 2(µg.m -3)
0
15
30
45
60
75
90
105
120
135
150
165
180
195
210
225
240
125
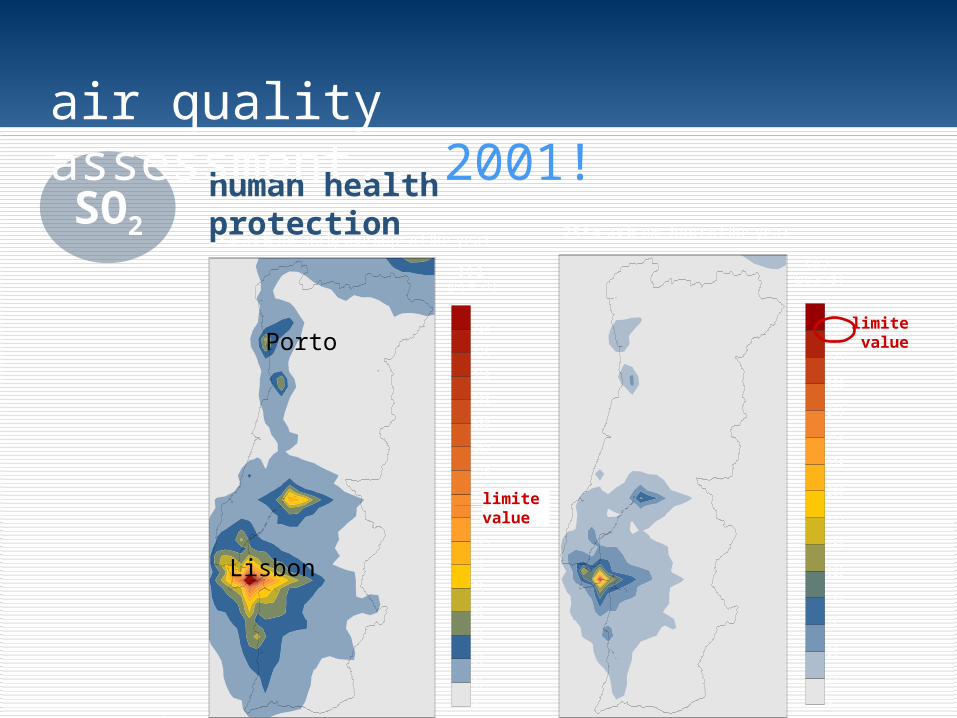
human health protection
air quality assessment...2001!
limite value
limite valuePorto
Lisbon

0102030405060708090100110120130140150160170180190200
19ª m axim um hour o f the year
NO 2(µg.m -3)
0246810121416182022242628303234363840
A nnual averageNO 2
(µg.m -3)
human health protection
air quality assessment...2001!
NO2
limite valuelimite
value

human health protection
100
200
300
400
500
1000
5000
10000
C O( µ g . m - 3 )
M axim um 8h running average
0
200
400
500
600
700
800
900
1000
1500
2000
2500
3000
3500
4000
4500
5000
C O( µ g . m - 3 )
A nnual average
air quality assessment...2001!
CO

human health protection
0
10
20
30
40
50
60
70
80
90
100
110
120
26ª m axim um 8h running average
O 3(µg.m -3)
air quality assessment...2001!
O3
limite value
VALOR-ALVO PROTECÇÃO VEGETAÇÃO
OBJECTIVO LONGO-PRAZO PROTECÇÃO VEGETAÇÃO
5 10 15 20 25
5
10
15
20
25
30
35
40
45
50
55 AO T40(µg.m -3.h)
0
2000
4000
6000
8000
10000
12000
14000
16000
18000
20000
22000
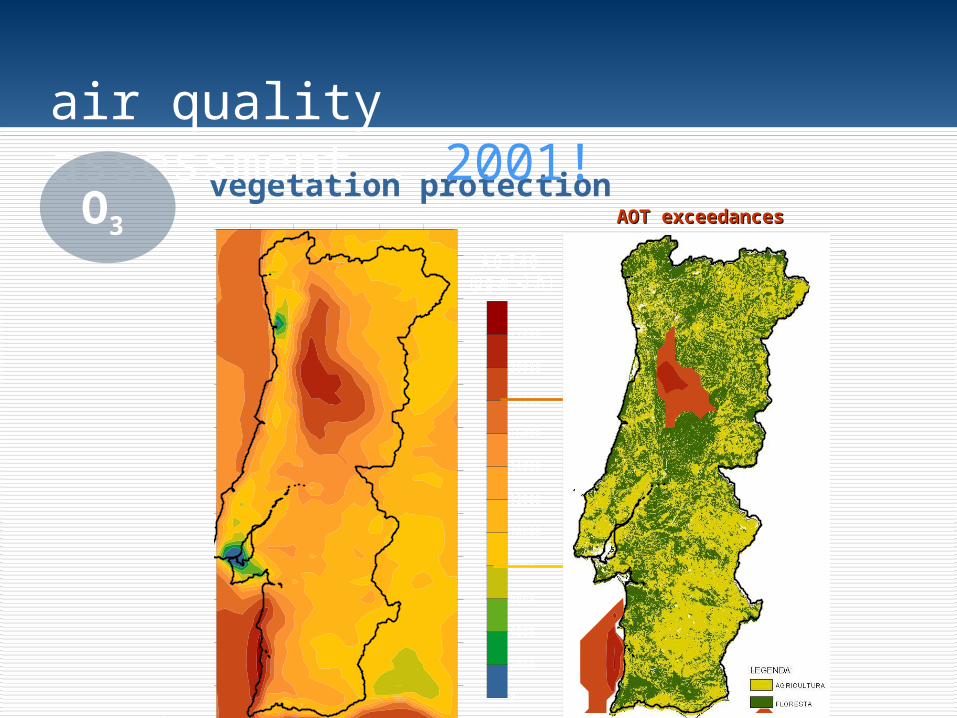
vegetation protectionExcedências AO T40
AOT exceedancesAOT exceedances
air quality assessment...2001!
O3

Air Quality National network
##
#
#
#
#
#
##
#
#
#
#
#
#
##
#
###
#
background stations•industrial stations•traffic stations•
23
5
17
45
validation exercise
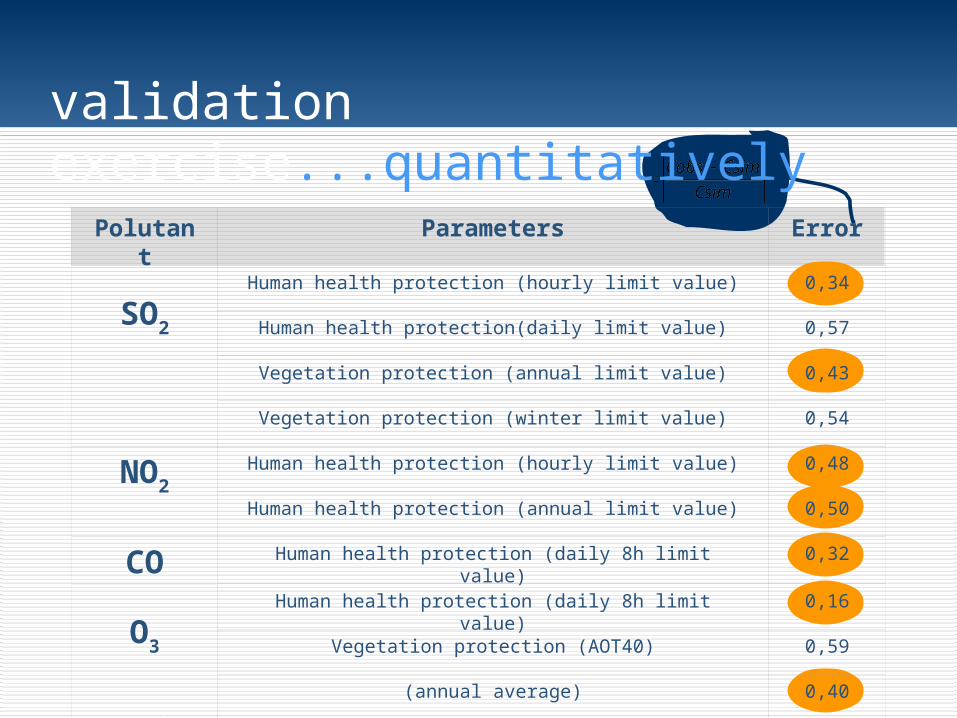
Polutant
Error
SO2
0,34
0,57
0,43
0,54
NO20,48
0,50
CO 0,32
O3
0,16
0,59
Parameters
Human health protection (hourly limit value)
Human health protection(daily limit value)
Vegetation protection (annual limit value)
Vegetation protection (winter limit value)
Human health protection (hourly limit value)
Human health protection (annual limit value)
Human health protection (daily 8h limit value)
Human health protection (daily 8h limit value)
Vegetation protection (AOT40)
(annual average) 0,40
validation exercise...quantitatively

validation exercise...quantitatively
STATION TYPE
RMSE(µg.m-3)
r bias RMSE(µg.m-3)
r RMSE(µg.m-3)
r
AVA Background 18.46 0,78 -5,04 21,71 0,59 24,55 0,48
MVE Background 19.00 0,66 -3,56 9,36 0,53 33,12 0,49
LOU Background 19.93 0,85 -6,99 29,20 0,68 30,43 0,59
PP Background 20.10 0,80 -2,86 35,26 0,59 37,65 0,40
BEA Background 21.95 0,73 -9,22 33,85 0,49 32,65 0,53
REB Background 22.16 0,71 -4,23 33,50 0,63 25,51 0,66
ALF Background 22.41 0,65 10,38 30,39 0,53 33,50 0,47
LEC Background 22.55 0,73 -13,25 32,16 0,62 29,98 0,56
ERM Background 22.83 0,78 -10,41 32,85 0,58 26,24 0,61
LAR Background 22.85 0,77 -10,10 35,88 0,64 32,62 0,54
VNT Background 25.50 0,64 -11,66 34,34 0,63 32,25 0,53average 22 0.7 -7.8 33 0.4 34 0.4
NO2 SO2O3

validation exercise...quantitatively
AVANCA(fundo rural)
0 30 60 90 120 150 180 210 240 270 300 330 360
O3 (µg
.m
-3 )
0
50
100
150
200
250
simuladoobservado
dias
MONTE CHÃOS
(industrial)
0 30 60 90 120 150 180 210 240 270 300 330 360
O3 ( µg
.m
-3 )
0
50
100
150
200
250
simuladoobservado
diasHOSPITAL VELHO
(tráfego)
0 30 60 90 120 150 180 210 240 270 300 330 360
O3 ( µg
.m
-3 )
0
50
100
150
200
250
simuladoobservado
dias
background
industrial
traffic
observedsimulated
O3
(µg
.m-3)
good agreement
overestimation
overestimation

modelled measured modelled measured NO2
O3
Experimental campaigns with difusion tubes
validation exercise...quanlitatively

2001 05 27 15H
ERM ESINDE200
TEIXUG UEIRA240
2001 05 28 14
5 10 15 20 25
5
10
15
20
25
30
35
40
45
50
55
TE IXU G U EIR A300
AVAN C A200
M O N TE VELH O180
2001 05 29 14h
TE IXU G U EIR A200
5 10 15 20 25
5
10
15
20
25
30
35
40
45
50
55
140
160
180
200
220
240
260
O 3 (µg.m -3)
episode days...

sensitivity tests...RMS error
0
5
10
15
20
25
30
35
40
45
LOU BEA LAR REB PP LEC ALF ERM AVA VNT MVE CUS
background stations
µg
.m-3
V200410 MM5
V200410 ECMWF
V200303 ECMWF
correlation factor
0.4
0.5
0.6
0.7
0.8
0.9
1
LOU BEA LAR REB PP LEC ALF ERM AVA VNT MVE CUS
background stations
V200410 MM5
V200410 ECMWF
V200303 ECMWF
V 200410
V 200303
MM5
ECMWF
MM5
ECMWF

future work...
• operational air quality forecast for Portugal
10x10 km with zoom to Lisbon and Porto area
•aerosols version simulation
•forest fire emissions estimation and its
integration in the forecast air quality system
•...

Thank you!


![Learning Objectives Epidemiology - … Objectives ... • Barium enemaBarium enema ... Microsoft PowerPoint - Siddiqui handout w objectives,disclosure.ppt [Compatibility Mode]](https://static.fdocuments.in/doc/165x107/5ad44f597f8b9a6d708b6dd4/learning-objectives-epidemiology-objectives-barium-enemabarium-enema.jpg)


