Objective measures, sensors and computational techniques ...
15
c o m p u t e r m e t h o d s a n d p r o g r a m s i n b i o m e d i c i n e 1 0 8 ( 2 0 1 2 ) 1287–1301 jo ur n al hom ep age : www.intl.elsevierhealth.com/journals/cmpb Objective measures, sensors and computational techniques for stress recognition and classification: A survey Nandita Sharma ∗ , Tom Gedeon Information and Human Centred Computing Research Group, Research School of Computer Science, Australian National University, Canberra, ACT 0200, Australia a r t i c l e i n f o Article history: Received 2 April 2012 Received in revised form 2 July 2012 Accepted 25 July 2012 Keywords: Computational stress model Pattern recognition Stress classification Stress prediction Stress sensors Stress computational techniques a b s t r a c t Stress is a major growing concern in our day and age adversely impacting both individ- uals and society. Stress research has a wide range of benefits from improving personal operations, learning, and increasing work productivity to benefiting society – making it an interesting and socially beneficial area of research. This survey reviews sensors that have been used to measure stress and investigates techniques for modelling stress. It discusses non-invasive and unobtrusive sensors for measuring computed stress, a term we coin in the paper. Sensors that do not impede everyday activities that could be used by those who would like to monitor stress levels on a regular basis (e.g. vehicle drivers, patients with illnesses linked to stress) is the focus of the discussion. Computational techniques have the capac- ity to determine optimal sensor fusion and automate data analysis for stress recognition and classification. Several computational techniques have been developed to model stress based on techniques such as Bayesian networks, artificial neural networks, and support vec- tor machines, which this survey investigates. The survey concludes with a summary and provides possible directions for further computational stress research. © 2012 Elsevier Ireland Ltd. All rights reserved. 1. Introduction There are escalating changes in technology and society, which bring growing demands for better techniques in dealing with wellbeing by containing everyday unavoidable life pressures and challenges. Stress is the leading threat to people because these daily demands cannot be satisfactorily handled, and is a risk to health and social aspects of life. The term, stress, introduced by Selye, defined stress as “the non-specific response of the body to any demand for change”. In general, stress is a “complex reaction pattern that often has psycholog- ical, cognitive and behavioural components” [1]. It can essen- tially be used to describe the wear and tear of the body experi- ∗ Corresponding author at: Center of Information and Human Centred Computing, Research School of Computer Science, Building 108, Australian National University, Canberra, ACT 0200, Australia. Tel.: +61 2 6125 7060. E-mail addresses: [email protected] (N. Sharma), [email protected] (T. Gedeon). encing changing environments, thus giving three main facets – input stimulus, processing and evaluation, and response [2]. It has been widely accepted that stress, when sufficiently powerful so that it overcomes defence mechanisms, has a range of severe impacts on immune and cardiovascular sys- tems on individuals. As stress becomes chronic, it makes individuals more vulnerable to infections and incurable dis- eases, and slows down the body’s recovery processes [3]. In addition, stress causes financial burdens on society [4]. There are organisations (e.g. International Stress Management Asso- ciation UK [5], SupportLine [6] and Lifeline Australia [7]) in place to help individuals deal with stress and in creating awareness of the issues associated with stress, a major prob- lem faced by the world today. 0169-2607/$ – see front matter © 2012 Elsevier Ireland Ltd. All rights reserved. http://dx.doi.org/10.1016/j.cmpb.2012.07.003
Transcript of Objective measures, sensors and computational techniques ...
Of
NIC
a
A
R
R
A
K
C
P
S
S
S
S
1
Tbwatairsit
A
0h
c o m p u t e r m e t h o d s a n d p r o g r a m s i n b i o m e d i c i n e 1 0 8 ( 2 0 1 2 ) 1287–1301
jo ur n al hom ep age : www.int l .e lsev ierhea l th .com/ journa ls /cmpb
bjective measures, sensors and computational techniquesor stress recognition and classification: A survey
andita Sharma ∗, Tom Gedeonnformation and Human Centred Computing Research Group, Research School of Computer Science, Australian National University,anberra, ACT 0200, Australia
r t i c l e i n f o
rticle history:
eceived 2 April 2012
eceived in revised form 2 July 2012
ccepted 25 July 2012
eywords:
omputational stress model
attern recognition
tress classification
tress prediction
a b s t r a c t
Stress is a major growing concern in our day and age adversely impacting both individ-
uals and society. Stress research has a wide range of benefits from improving personal
operations, learning, and increasing work productivity to benefiting society – making it an
interesting and socially beneficial area of research. This survey reviews sensors that have
been used to measure stress and investigates techniques for modelling stress. It discusses
non-invasive and unobtrusive sensors for measuring computed stress, a term we coin in the
paper. Sensors that do not impede everyday activities that could be used by those who would
like to monitor stress levels on a regular basis (e.g. vehicle drivers, patients with illnesses
linked to stress) is the focus of the discussion. Computational techniques have the capac-
ity to determine optimal sensor fusion and automate data analysis for stress recognition
tress sensors
tress computational techniques
and classification. Several computational techniques have been developed to model stress
based on techniques such as Bayesian networks, artificial neural networks, and support vec-
tor machines, which this survey investigates. The survey concludes with a summary and
provides possible directions for further computational stress research.
ciation UK [5], SupportLine [6] and Lifeline Australia [7]) in
. Introduction
here are escalating changes in technology and society, whichring growing demands for better techniques in dealing withellbeing by containing everyday unavoidable life pressuresnd challenges. Stress is the leading threat to people becausehese daily demands cannot be satisfactorily handled, and is
risk to health and social aspects of life. The term, stress,ntroduced by Selye, defined stress as “the non-specificesponse of the body to any demand for change”. In general,
tress is a “complex reaction pattern that often has psycholog-cal, cognitive and behavioural components” [1]. It can essen-ially be used to describe the wear and tear of the body experi-∗ Corresponding author at: Center of Information and Human Centredustralian National University, Canberra, ACT 0200, Australia. Tel.: +61
E-mail addresses: [email protected] (N. Sharma), tom.ge169-2607/$ – see front matter © 2012 Elsevier Ireland Ltd. All rights resttp://dx.doi.org/10.1016/j.cmpb.2012.07.003
© 2012 Elsevier Ireland Ltd. All rights reserved.
encing changing environments, thus giving three main facets– input stimulus, processing and evaluation, and response [2].
It has been widely accepted that stress, when sufficientlypowerful so that it overcomes defence mechanisms, has arange of severe impacts on immune and cardiovascular sys-tems on individuals. As stress becomes chronic, it makesindividuals more vulnerable to infections and incurable dis-eases, and slows down the body’s recovery processes [3]. Inaddition, stress causes financial burdens on society [4]. Thereare organisations (e.g. International Stress Management Asso-
Computing, Research School of Computer Science, Building 108, 2 6125 [email protected] (T. Gedeon).
place to help individuals deal with stress and in creatingawareness of the issues associated with stress, a major prob-lem faced by the world today.
erved.

i n
physiological and physical measures. A physical feature or
1288 c o m p u t e r m e t h o d s a n d p r o g r a m s
Various response (or symptom) measures have been usedto interpret stress levels and fluctuations. The response meas-ures reflect reactions of individuals and their body to stressfulsituations. Some individuals may react differently to stressfulevents from others due to their body conditions, age, gender,experience and so on. There are computational techniques,such as artificial neural networks, that can deal with thesevariables [8]. Additionally, uncertainties and complexities alsoexist that need to be dealt with when defining stress. Tech-niques such as, fuzzy logic, can narrow the gap.
Hormonal imbalances and physiological and physicalchanges are some characteristics associated with stress,i.e. they are symptoms of stress. When a person is understress, increased amounts of stress hormones (e.g. corti-sol or catecholamine levels) are released and measures forthese hormones are obtained via invasive methods (e.g. tak-ing blood, saliva or urine samples), possibly performed byqualified practitioners, and require lengthy analysis proce-dures conducted by qualified scientists ([9–12]). Also understress, changes in heart rate (HR) [13], blood pressure (BP) [14],pupil diameter (PD) [15], breathing pattern [16], galvanic skinresponse (GSR) [17], emotion [18], voice intonation [19] andbody pose [20] are observed, which, unlike measuring stresshormones, can be acquired through non-invasive means. Thispaper concentrates on non-invasive and automated methodsrequiring shorter time periods for detecting and analysingstress. Physiological (e.g. heart rate, skin conductivity) andphysical (e.g. facial expressions, voice intonation, body poses,and gestures) features enable such methods and can be usedto model stress objectively.
In this paper, a measure of stress refers to a primary (orsymptom) measure (or signal) for stress, monitoring stressmeans examining fluctuations in primary measures for stress,and indication or detection of stress refers to certain fluctua-tions in primary measures for stress that show an increase instress towards distress. These terms will be used in the surveyto describe work done in literature.
We coin the term computed stress and define it as thestress computationally derived from instantaneous measuresof stress symptoms obtained by non-invasive methods. Acomputational model of stress will take some combinationof stress symptom measures as inputs to produce a computedstress measure as an instantaneous measure of stress at thatpoint in time.
The literature suggests stress is defined as a self-reportedmeasure (e.g. self-assessment [21,22]) or observer-reportedmeasure (e.g. human behaviour coder [23]). These reportedmeasures are used to support stress measures drawn fromdirectly measuring stress symptoms, but do not give aninstantaneous stress measure.
The key differences in our approach is that we assumethere is an underlying property called stress for which boththe symptom measurements and the reported measures areapproximations, and that we can use both these sourcesof information in AI models to learn the underlying modelof true stress. Henceforth we use our term, computed stress,and distinguish it from the traditional overall stress mea-
sure. With our computed stress, stress cannot only be comparedacross time but also across multiple individuals. A conse-quence of our model is that the computed stress will beb i o m e d i c i n e 1 0 8 ( 2 0 1 2 ) 1287–1301
statistically more reliable than individual reporting or symp-tom measures.
Stress research has a wide range of potential applicationsincluding the capacity to improve personal, government andindustry operations, including increasing the robustness ofmilitary operations, law enforcements, athlete performance[24], games and education software, life support systems andcommercial products. It also has the potential to improvelearning and increase work productivity [25]. Computer sys-tems using non-invasive techniques that dynamically provideindications of stress have been exploited to determine stressin fighter pilots [26], but were obtrusive and do not suit usualflight operations and behaviour. However, less intrusive sys-tems have been developed to detect stress in a range of peopleincluding car drivers [23,27,28], computer users [29], army offi-cers [30,31], pilots in flight [31,32], surgeons [33], and surgicalpatients [34].
The current focus of stress research is in determiningways to measure and monitor stress and is in the earlystages of computational modelling. A range of sensors andtechniques from various fields, including computer science(e.g. bio-inspired, machine learning, data mining), engineer-ing and statistics, have been applied to stress problems. Thissurvey will investigate sensors for primary measures (physi-ological and physical measures) of stress and computationaltechniques used for signal analysis, feature extraction, stressdetection and recognition, and computational models used inliterature over the recent years, and provides a direction forfuture research.
2. Measuring stress
Traditionally, stress has been measured using assessmentbased on humans rating stress levels on some scale (e.g.Relative Stress Scale [35], Fear Survey Schedule [36], Cook-Medley Hostility Scale [37], and Brief Symptom Inventory[38,39]), which are subjective. All these assessments requiremajor human intervention, including manually recognisingand interpreting visual patterns (possibly with some supporttools) of behaviour in observational studies. Stress experi-ments that use various sensors to obtain objective measuresof stress also use subjective assessment to verify measure-ments obtained from sensors [23]. Lack of data and insufficientcapability of existing modelling techniques forces the activityof measuring stress to include these subjective conventionalmethods. It is regarded that self-assessment is a good mea-sure of stress [35,37], and this alerts us that more work needsto be done to bring objective methods for measuring stressup to par (if not, even better). So far, work proposing objec-tive measures of stress and using these measures to developa model has not been coherently reviewed and a purpose ofthis survey is to bring together the major contributions in thefield and provide a foundation for future computational stressresearch.
Primary measures for stress investigated in this survey are
characteristic is defined as a property that humans can seechanges in without the need for equipment and tools, unlikephysiological features, which require the use of tools that

c o m p u t e r m e t h o d s a n d p r o g r a m s i n b i o m e d i c i n e 1 0 8 ( 2 0 1 2 ) 1287–1301 1289
Fig. 1 – Common physical and physiological measures used to detect stress. The figure shows the usual sources for them is su
ntvim
pvstpst
3
TiPgtiaigwooasts
easures. The measures in this figure are investigated in th
eed to be attached to individuals to detect general fluctua-ions. However, sophisticated equipment and sensors usingision and audio technologies are still needed to obtain phys-cal signals at sampling rates sufficient for data analysis and
odelling.Common techniques for detecting stress include analysing
hysiological signals, electroencephalography (EEG), bloodolume pulse (BVP), heart rate variability (HRV), galvanickin response (GSR), and electromyography (EMG). In addi-ion, physical signals for measuring stress include eye gaze,upil diameter, voice characteristic, and face movement. Fig. 1hows the physical and physiological signals that will be inves-igated in this survey.
. Physiological measures
he Autonomic Nervous System (ANS), responsible fornvoluntary activities, is made up of Sympathetic andarasympathetic nervous systems. Stressful events or emer-ency situations cause dynamic changes in ANS, wherehe activity rate in the Sympathetic Nervous System (SNS)ncreases and the Parasympathetic Nervous System (PNS)ctivity decreases. Alternatively, activities in the PNS dom-nate during resting activities. SNS and PNS regulate thealvanic skin response, heart rate variability, and brain waves,hich are the main measures for stress used in literature, andther physiological systems including blood pressure. Detailsf how stress affects the ANS at molecular and cellular levels
re provided in [41]. Note that stress towards distress is not aole contributor to changes in the ANS and the features it con-rols, for instance, eustress (which characterises as a positivetate, e.g. joy) can elevate skin conductance like distress [42].rvey. The person figure is adapted from [40].
Symptoms of stress appear as time progresses and thismakes continuous recordings of physiological signals sig-nificant to monitor variations and trends to detect stressreliably. In order to deal with voluminous data associatedwith such recordings, measurements from physiological sen-sors are usually divided up into segments before features areobtained. In a driving experiment [23], segments were madeup of 5 min data out of 30 min, which included rest, city andhighway driving representing low, medium and high stressrespectively. Main features obtained from physiological datahave included normalised mean, root mean square, meanamplitude, variance, and normalised signals. Using featurevalues over time segments does not only provide data fromdifferent perspectives but also helps reduce the effect of noisyor missing data during analysis as opposed to analysing rawsignal values.
3.1. Skin conductivity
Galvanic skin response (GSR), also known as skin conductanceor electrodermal activity response, is reliable indicator of stress[17,23,43,44]. It is a measurement of flow of electricity throughthe skin of an individual. When the individual is under stress,skin conductance is increased [45] due to increase in mois-ture on the surface of the skin, which increases the flow ofelectricity. Conversely, the skin conductance is reduced whenthe individual becomes less stressed. Physiological detailsof the way the SNS affects skin conductance can be foundin [46].
The fluctuations in skin conductance are recorded aschanges in GSR. Variations in GSR have reflected stress lev-els in individuals while they played a competitive racing game[47]. In addition, cognitive load [48] and work performance [49],

1290 c o m p u t e r m e t h o d s a n d p r o g r a m s i n b i o m e d i c i n e 1 0 8 ( 2 0 1 2 ) 1287–1301
Table 1 – Analysis of GSR measurement systems.
GSR measurement system Advantages Disadvantages
Biopac GSR100C (connected to acomputer with AcqKnowledgesoftware suite)
Data transferred to a computer in real-timeAllows real-time viewing and analysis of dataand trendsRaw data is availableSampling rate of 1 kHz
Equipment not portableSensitive to equipment movementElectrodes are attached to fingers using conductivegelExpensive
Thought Technology FlexComp(connected to a computer withBiograph software suite)
Data transferred to a computer in real-timeAllows real-time viewing and analysis of dataWaveforms accurate to 500 Hz 2000 samples/s
Equipment not portableExpensive
Thought Technology GSR2 Frequency range from 0 to 40,000 Hz Does not allow viewing of data in real-timeFingers have to be stably placed on electrode platesfor data acquisitionRequires RelaxTrace software to upload and viewdata on the computer
Affectiva Q Sensor Sampling rate of 2–32 readings/minPortable armbandEnables long term data collectionEnables real-time data viewing and collectionTheoretical characteristics have been reviewedby researchers
Relatively new and lacks usage reviewsExpensive
BodyMedia Sensewear Portable armbandEnables long term data collection
Does not allow viewing of real-time dataData is recorded after every minute – this restrictspattern recognition capability for stress detectionMain purpose is to assess physical activity with theaim to determine calorie expenditure
BodyBugg Portable armbandEnables long term data collection
Does not allow viewing of real-time dataData recorded after every minute – this restrictspattern recognition capability for stress detectionMain purpose is to assess physical activity with the
which can be seen as stressors [50,51], have strong correlationswith GSR.
GSR measurement can be taken by measuring electricalpotentials between electrodes placed on surfaces of the skin.Electrodes are typically placed on the hand, first and mid-dle fingers. Some popular equipment used in stress relatedresearch experiments to monitor GSR include the BiopacGSR100C [47], Thought Technology Limited GSR2 [52], Affec-tiva Q Sensor [53], BodyMedia Sensewear [54], and BodyBugg[55]. An analysis of the characteristics of these equipments isgiven in Table 1.
GSR features that require minimal calculations (e.g. meanand sum) have been used for comparing stress in differ-ent tasks [48]. More complex features, such as, number oforienting responses in a time segment, sum of the star-tle magnitudes, sum of the response durations, and sumof the estimated areas under the responses have also beenused [56]. However, it is not known whether these com-plex measures gave better indications of stress than minimalcalculations.
3.2. Heart activity
Heart rate variability (HRV) is a popular non-invasive measureto detect cardiovascular conditions [57], ANS activities [8], andis another reliable primary measure for stress [13,44,57–59].Many stress monitoring systems use HRV to detect stress
aim to determine calorie expenditure
[60,61]. It is believed that HRV also reflects how well individualsare able to adapt to changes [57].
Electrocardiogram (ECG), also known as elektrokardio-gramm (EKG), is highly sensitive to heartbeats and a superiormeasurement for HRV [62]. ECG is a graphical recording of elec-trical activity produced by an impulse of ions flowing throughcardiac muscles, which dissipates into the region around theheart with diminished amounts spreading around the surfaceof the body. The main electrical signals are produced by cardiaccells depolarising and repolarising. Depolarising occurs due tothe flow of ions accompanying atrial heart muscle constrictionwhich results in a P wave. The impulse then travels throughthe ventricles of the heart causing septal depolarisation, earlyventricular depolarisation followed by late ventricular depo-larisation. This series forms a QRS wave, the dominant wave.After the completion of depolarisation, ventricular cells repo-larise by restoring it to resting polarity, resulting in a T wave.A change in potential can be measured between electrodesattached to a person’s body on each side of the heart duringthe electrical stimulation cycle of the heart. ECG signals areperiodic and have persistent features such as R–R intervals, aparameter to determine HRV. The Einthoven’s Triangle, theoret-ical triangle area around the heart representing lead vectors,
can be used for lead configuration based on desired informa-tion. There are three main lead configurations, but Lead I issufficient to obtain a HRV signal because it gives the completeQRS waveform [63].
c o m p u t e r m e t h o d s a n d p r o g r a m s i n b i o m e d i c i n e 1 0 8 ( 2 0 1 2 ) 1287–1301 1291
Table 2 – Analysis of heart activity measurement systems.
Heart rate measurementsystem
Advantages Disadvantages
Thought Technology FlexComp(connected to a computer withBiograph software suite)
Data transferred to a computer in real-timeAllows real-time viewing and analysis of dataand trendsWaveforms accurate to 500-2000 Hz
Equipment not portableExpensive
Biopac ECG100C (connected to acomputer with AcqKnowledge
Data transferred to a computer in real-timeAllows real-time viewing and analysis of data
Equipment not portableSensitive to equipment movement
iGT
aoratDu
seotnum
iadqHLo[ttbaarTks
Ew
E
AH
software suite) and trendsSampling rate of 1 kHz
Popular systems used to obtain continuous heart ratenclude the Thought Technology FlexComp and BiopacSR100C [47]. An analysis of these systems is presented inable 2.
Acute stress causes the heart to contract with high forcend increased frequency. With more chronic stress, the massf the heart is increased to provide the body with greateresponse to stressors [64]. A decrease in ECG amplitude isn indicator of stress in healthy individuals [65]. This is dueo vasoconstriction, where peripheral blood vessels constrict.etails of how the SNS affects heart activity when an individ-al is exposed to stressors are presented in [66].
Heart activity has been found to be more correlated withtress as opposed to EMG and respiration recordings [23]. How-ver, the baseline heart rate depends on cardiovascular fitnessf an individual and the activity the individual is doing athe time. This means that heart activity measurements can-ot be directly compared across multiple people for stressnless measurements are standardised using some baselineeasurements.HRV is an indicator of dynamic and cumulative load mak-
ng it a good measure for stress. Short term lower HRV reflectscute stress, which means that HRV can be negatively affecteduring stress [67]. Generally, low frequency (LF) and high fre-uency (HF) bands of HRV are used to analyse stress. LF andF are known to reflect SNS and PNS activities respectively.F has been categorised as 0–0.08 Hz [23], 0.04–0.15 Hz [8,68]r 0.05–0.15 Hz [13,52] and HF has is either in the 0.15–0.5 Hz
13,23] or 0.16–0.40 Hz [52] range. It has been suggested thathese definitions for frequency bands could be inappropriate ifhe respiratory frequencies are not in the range of 0.15–0.40 Hzecause it could affect ANS activity estimates [68]. Examples ofctivities where the respiratory frequencies could be extremere during intense exercise or during extreme relaxation withespiratory frequencies of 0.7 Hz and 0.1 Hz respectively [68].he frequency of ECG between 0 Hz and 0.04 Hz, sometimesnown as very low frequency (VLF), has been found to distorttress detection [69].
Stress levels are expected to increase with increase innergy RatioECG in Eq. (1) (used as a stress feature in [23,52,70]),hich is defined in terms of total energy values in LF and HF:
nergy ratioECG = total energy in LF(1)
total energy in HF
clustering based fuzzy model has been established whereRV features are mapped to a 0–100 (mental) stress scale [8].
Electrodes are attached to skin usingconductive gelExpensive
Three HRV features, each corresponding to VLF (0.01–0.04 Hz),LF (0.04–0.15 Hz) and HF (0.15–0.5 Hz) bands, were used asparameters to the fuzzy model. The features were definedusing continuous wavelet transformations, where detaileddefinitions are given in [8].
3.3. Brain activity
Research shows that relationships exist between brain activ-ity and stress [71,72] and further research is required for moreinsight to develop models based on brain activity to deter-mine stress. Some methods by which data can be obtainedfor analysing brain activity are functional magnetic reso-nance imaging (fMRI), positron emission tomography (PET)and electroencephalography (EEG). Of the lot, EEG is the mostcommonly used due to high temporal resolution, low intru-sive equipment and low cost. EEG has been used to determinestress levels in computer game players [71] and biofeedbackgames [72].
Neural activity in the brain produces electrical signals,including well known signals that are captured in EEG. EEGrecords complex electrical waveforms at the scalp formed byaction electrical potentials during synaptic excitations andinhibitions of dendrites. Potentials at the scalp range from 20to 100 �V [73], which can be recorded by pairs of electrodesattached to the scalp (on both sides of the brain hemisphere).The waveforms are characterised by frequency, amplitude,shape and sites of the scalp. Also, age and state of alertness isalso relevant to analyse the waveforms [73]. Activities in theright hemisphere of the brain dominate the activities in theleft hemisphere of the brain during negative emotions [74],which suggests an area for stress detection. Literature thatprovides details of the way stress affects the brain include [75].
The potentials can also be measured using less intrusiveequipments, such as the Emotiv EPOC headset. An analysisof common brain activity measurement systems is given inTable 3.
EEG signals are categorised by frequency and each cate-gory represents some state for a person. The indices, waves orbands in the EEG are categorised in Table 4. Beta and alphawaves represent conscious states whereas theta and deltawaves signify unconscious states [76]. Rapid beta wave fre-quencies (from decrease in alpha wave frequencies) are the
main characteristics indicating stress [73,76,77]. Alpha wavesappear on both sides of the brain, but slightly higher in ampli-tude on the non-dominant side, generally observed in peoplewho are right-handed [73]. Band pass filtering can be used to
1292 c o m p u t e r m e t h o d s a n d p r o g r a m s i n b i o m e d i c i n e 1 0 8 ( 2 0 1 2 ) 1287–1301
Table 3 – Analysis of brain activity measurement systems.
Brain activity measurementsystem
Advantages Disadvantages
Thought Technology FlexCompInfiniti (connected to a computerwith Biograph Infiniti softwaresuite)
Data transferred to a computer in real-timeAllows real-time viewing and analysis of dataand trendsWaveforms accurate to 500 Hz 2000 samples/s
Equipment not portableExpensive
Emotiv Research Edition SDK Portable headbandLess intrusive than conventional EEG capsAllows real-time viewing of data and trends
Minimal data analysis methods and tools providedwith the systemData analysis has to be done offline
Sampling rate of 128 Hz
remove noise and obtain certain parts and features of an EEGsignal before analysis. EEG signals can be filtered using a bandpass filter with appropriate values for low and high pass filters,e.g. 30 Hz and 4 Hz respectively.
Brain activity has been examined for those who have expe-rienced chronic stress. It has been found that females withpost-traumatic stress have an increased activation in the ante-rior and middle insula when presented with stimuli thatreminded them of the previous stressful events [78]. This char-acteristic was obtained through fMRI recordings and analysis.In a different study, positive, neutral and negative emotionswere classified using EEG [74]. EEG frequency band power,cross-correlation between band powers, peak frequency inalpha band and Hjorth parameters [79] were some featuresused. Hjorth parameters are time-based characteristics of anEEG signal and details can be found in [79].
Signal processing methods (e.g. FT) have been applied toEEG and analysed in time, frequency and spatial domains. Forphysical stress [80], ratio of power spectral densities of thealpha and beta bands has been calculated and analysed forstress [81]. Results suggested that the ratios for alpha (r˛) andbeta (rˇ) powers defined as given in Eqs. (2) and (3) respectivelywere negatively correlated with self-reports.
r˛ = ˛R − ˛L
˛R + ˛L(2)
rˇ = ˇR − ˇL
ˇR + ˇL(3)
where ˛R and ˛L in the equations represent alpha bands onthe right and left hemispheres of the brain. Beta bands, ˇ, aresimilarly represented.
Neurofeedback training has been developed to inducestress management by training the brain to reduce symptomsof stress, e.g. Interactive Productline Mindball, a competitive
Table 4 – EEG wave band categories.
Wave band Frequencyrange (Hz)
Individual characteristic(s)
Beta 13–30 Alertness or anxietyAlpha 8–13 RelaxationTheta 4–8 Dream sleep or phase between
consciousness and drowsinessDelta 0.5–4 Coma or deep sleep
game system. Mindball uses EEG information to assess stressand provide feedback over a period of time, and the player withlower stress levels win the game [77].
EEG signals may have more information about stress levelsthan blood pressure and heart rate. EEG has been claimed toshow differences in relaxation (opposite of stress) levels thatblood pressure and heart rate information cannot illustrate[77]. Sum of alpha and theta, and the sum of alpha, beta andtheta are good measures [77] for relaxation. It is not yet knownwhether EEG gives more details of stress than GSR.
Stress states have been classified using EEG data and adecision tree model [71]. Other work has used EEG to classifystates that are not directly related to stress but could be usedas a basis for further EEG-based stress models. SVMs, ANNsand Bayesian classifiers have not showed much variation inperformance for classifying emotions ranging from positiveto negative emotions [74]. In addition, EEG data has been usedto classify different tasks with ANNs and SVMs and their vari-ance in performance was not significant [82].
3.4. Other primary physiological measures
Primary measures of stress presented in this section are notreliable if used solely. They are usually used in conjunctionwith other primary measures investigated above. Apart fromstress, there are other body triggers that affect signals of theprimary measures investigated in this section by distorting thesignals, so it makes stress detection difficult if used as a singlemeasure to detect stress.
3.4.1. Blood pressureBlood pressure (BP) is the pressure exerted on the walls ofblood vessels due to blood circulation and varies between asystolic (maximum) and a diastolic (minimum) pressure. Anincrease BP has been related with increase in stress [83].
Continuous BP waveforms can be measured using systemssuch as the Ambulatory Blood Pressure Monitor (ABPM-50) orFinapres (FINger Arterial PRESsure) monitor system. Just liketraditional BP monitoring systems, ABPM-50 requires a cuff tobe wrapped around the upper arm. However, Finapres requiresits cuff to be wrapped around a finger and is less intrusive andless disruptive.
3.4.2. Blood volume pulseBlood volume is the amount of blood in a blood tissue dur-ing a certain time interval. BVP measures the amount of light

b i o
tbrvritiatbBs
3Eat[so
3Smtisp
3TlirtpcGp
4
Iafrsma
4
Bglncv
c o m p u t e r m e t h o d s a n d p r o g r a m s i n
hat is reflected by the skin’s surface. Blood flow through thelood vessels after each heart beat causes changes in lighteflections, thus, provides measures for constriction of bloodessels and heart rate. Decreases in BVP have shown to be cor-elated with increases in stress and lower stress levels havellustrated increases in BVP [84]. Measurements of BVP can beaken using a Photoplethysmography (PPG) from the skin cap-llary bed of a finger. A PPG bounces infra-red light on the skinnd the amount of light reflected provides a measurement ofhe amount of blood present in the region. It has been usedy commercial (HRV-based) stress monitoring systems [85,86].VP has been used with other physiological measures to detecttress more reliably [52].
.4.3. Electromyogramlectromyography (EMG) shows electrical activity produced byctive muscles, i.e. muscle action potentials. For stress detec-ion, EMG electrodes have been placed on the trapezius muscle23], which is located in the shoulder. Other measurements,uch as, GSR and ECG, have been found to be better indicatorsf stress [23].
.4.4. Skin temperaturekin temperature (ST) in conjunction with other primaryeasures [29] has been used to measure stress. Investiga-
ions show that ST is negatively correlated with stress, i.e. STncreases when stress levels decrease and ST decreases whentress increases [84]. ST has been measured using LM34 IC bylacing the sensor on the distal phalanx of the left thumb [52].
.4.5. Respirationhe rate and volume of respiration has been used to measure
evels of stress but generally in conjunction with other phys-ological measures [17]. Most respiration monitoring systemsequire individuals to wear a belt around their chest [23]. Thisype of a system is intrusive and may restrict individuals fromerforming their regular activities. In addition, it has beenlaimed that other physiological measures, such as HRV andSR, reflect stress levels to a greater extent than respiration,articularly in driver stress [23].
. Physical measures
n this survey, a physical feature or characteristic is defined as property that humans can see changes in without the needor equipment and tools, unlike physiological features, whichequire the use of tools to detect general fluctuations. Physicalignals that are sensitive to stress are behaviour, gesture, bodyovement, facial expression, eye gaze, blinks, pupil dilation,
nd voice.
.1. Behaviour, gesture and interaction
ody language can express stress states and humans areenerally good assessors at finding these relationships. Body
anguage is defined by body pose and/or body motion. Recog-ition of body language requires complex techniques thatonsider degrees of freedom for body configurations andast variations in motion. Behaviour can be determined bym e d i c i n e 1 0 8 ( 2 0 1 2 ) 1287–1301 1293
examining body language. Behavioural recognition and anal-ysis requires computer vision techniques with the purposeof understanding a visual environment. However, the com-mon method for determining stress through behaviour is byhuman experts. Stress levels in car drivers have been assessedby humans who used their judgement to examine driverbehaviour on recorded videos [23]. Future research couldinclude developing techniques for automated stress detec-tion from behaviour data. Due to the time-varying nature ofstress, HMM, Markov chains, Bayesian classifiers [87], HiddenSemi-Markov Models, ANN, Temporal Scenario Recognitionand Petri Nets are some types of techniques that can be inves-tigated for interpreting and analysing behaviour associatedwith stress.
Stress models based on gesture and interaction featureshave been quite simplistic. Driving scenarios are rich in stressstimuli that induce drivers to react by gestures, which is anarea where stress has been modelled. Gesture recognition hasbeen used to determine stress in car drivers [23]. Approachesfor predicting driver behaviour have also been developedthrough vision based techniques and dynamic Markov mod-els [88,89]. Haptic cues have been used in stress experimentswhich induces interaction with environments. Investigationswith mouse movement show that individuals click mouse but-tons harder as their stress decreases [45].
4.2. Facial features
Facial features can provide insight to feelings and mentalstates for individuals including stress. When conversing withan individual, a person can get feedback from facial featureswhich they can act accordingly, e.g. the person might cut a longstory short when they observe and realise that the individualis showing signs of frustration, agitation or preoccupation byless nodding, reduced facial muscle movements or frequenteye movements to other objects in the surroundings.
There are systems established (e.g. FaceLAB, NEVEN Vision[90]) that automatically determines facial features (e.g. pointson face, head movements, levels of mouth openness) fromcameras or videos. Face LAB, a product by Seeing Machines,is a system for head and face tracking and allows obtainingmeasurements at a sampling rate of 60 Hz for facial featuresincluding eye gaze, pupil dilation and blinking signals non-invasively and non-intrusively. The equipment consists of apair of cameras, with infrared lighting. It does not require anyform of contact during signal acquisition.
4.2.1. Facial expressionsStress classification models have been developed from facialfeature data and results show that facial expressions can beused to show stress [91]. When responding to stressors, facialexpressions indicate biological responses reliably [10], whichare commonly used to assess stress. Online analysis of facialexpressions can be used to predict behaviour and events, e.g.car accidents, in real-time [92]. Facial muscle movements havebeen used to determine stress. Increase in head and mouth
movements indicate increase in stress [45].Human observers are good at assessing individuals’ stress.The human brain of a healthy individual has facial expres-sion recognition detectors to determine emotions that show
i n
1294 c o m p u t e r m e t h o d s a n d p r o g r a m ssymptoms of stress of a person but unfortunately the pro-cess by which the brain deduces such conclusions is yet to beunderstood. Machine learning techniques [93], including SVM,principal component analysis [94], and decision tree-basedclassifiers [94] have been used for facial expression recogni-tion.
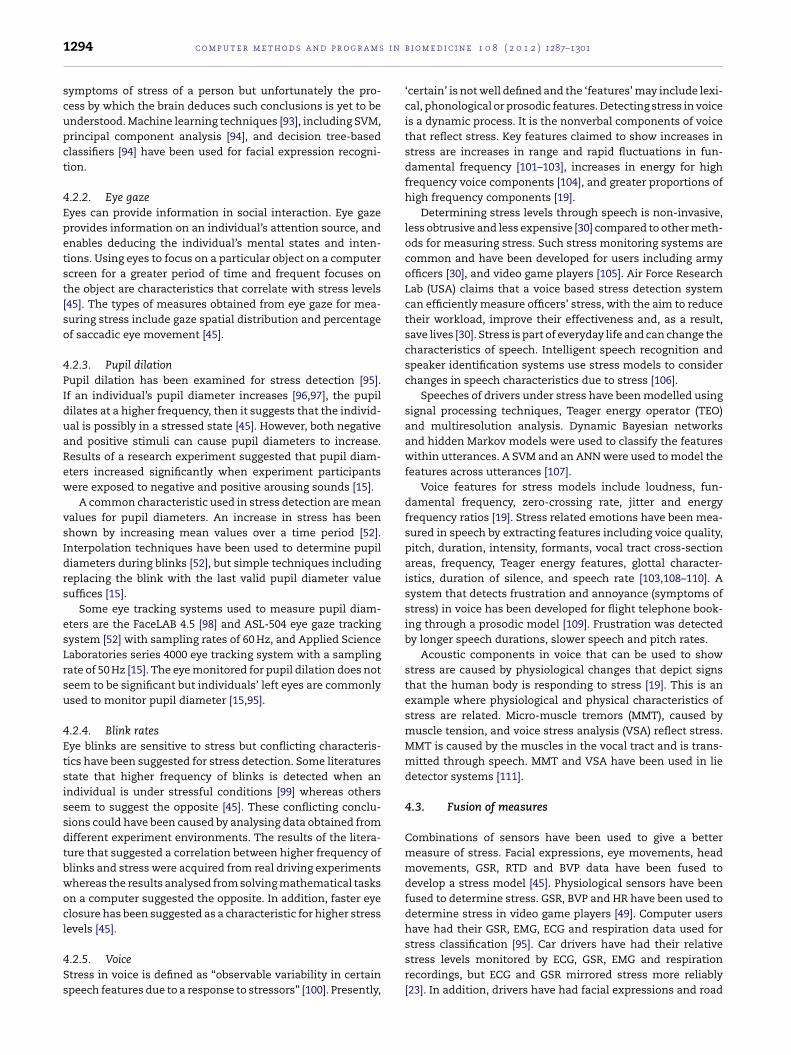
4.2.2. Eye gazeEyes can provide information in social interaction. Eye gazeprovides information on an individual’s attention source, andenables deducing the individual’s mental states and inten-tions. Using eyes to focus on a particular object on a computerscreen for a greater period of time and frequent focuses onthe object are characteristics that correlate with stress levels[45]. The types of measures obtained from eye gaze for mea-suring stress include gaze spatial distribution and percentageof saccadic eye movement [45].
4.2.3. Pupil dilationPupil dilation has been examined for stress detection [95].If an individual’s pupil diameter increases [96,97], the pupildilates at a higher frequency, then it suggests that the individ-ual is possibly in a stressed state [45]. However, both negativeand positive stimuli can cause pupil diameters to increase.Results of a research experiment suggested that pupil diam-eters increased significantly when experiment participantswere exposed to negative and positive arousing sounds [15].
A common characteristic used in stress detection are meanvalues for pupil diameters. An increase in stress has beenshown by increasing mean values over a time period [52].Interpolation techniques have been used to determine pupildiameters during blinks [52], but simple techniques includingreplacing the blink with the last valid pupil diameter valuesuffices [15].
Some eye tracking systems used to measure pupil diam-eters are the FaceLAB 4.5 [98] and ASL-504 eye gaze trackingsystem [52] with sampling rates of 60 Hz, and Applied ScienceLaboratories series 4000 eye tracking system with a samplingrate of 50 Hz [15]. The eye monitored for pupil dilation does notseem to be significant but individuals’ left eyes are commonlyused to monitor pupil diameter [15,95].
4.2.4. Blink ratesEye blinks are sensitive to stress but conflicting characteris-tics have been suggested for stress detection. Some literaturesstate that higher frequency of blinks is detected when anindividual is under stressful conditions [99] whereas othersseem to suggest the opposite [45]. These conflicting conclu-sions could have been caused by analysing data obtained fromdifferent experiment environments. The results of the litera-ture that suggested a correlation between higher frequency ofblinks and stress were acquired from real driving experimentswhereas the results analysed from solving mathematical taskson a computer suggested the opposite. In addition, faster eyeclosure has been suggested as a characteristic for higher stresslevels [45].
4.2.5. VoiceStress in voice is defined as “observable variability in certainspeech features due to a response to stressors” [100]. Presently,
b i o m e d i c i n e 1 0 8 ( 2 0 1 2 ) 1287–1301
‘certain’ is not well defined and the ‘features’ may include lexi-cal, phonological or prosodic features. Detecting stress in voiceis a dynamic process. It is the nonverbal components of voicethat reflect stress. Key features claimed to show increases instress are increases in range and rapid fluctuations in fun-damental frequency [101–103], increases in energy for highfrequency voice components [104], and greater proportions ofhigh frequency components [19].
Determining stress levels through speech is non-invasive,less obtrusive and less expensive [30] compared to other meth-ods for measuring stress. Such stress monitoring systems arecommon and have been developed for users including armyofficers [30], and video game players [105]. Air Force ResearchLab (USA) claims that a voice based stress detection systemcan efficiently measure officers’ stress, with the aim to reducetheir workload, improve their effectiveness and, as a result,save lives [30]. Stress is part of everyday life and can change thecharacteristics of speech. Intelligent speech recognition andspeaker identification systems use stress models to considerchanges in speech characteristics due to stress [106].
Speeches of drivers under stress have been modelled usingsignal processing techniques, Teager energy operator (TEO)and multiresolution analysis. Dynamic Bayesian networksand hidden Markov models were used to classify the featureswithin utterances. A SVM and an ANN were used to model thefeatures across utterances [107].
Voice features for stress models include loudness, fun-damental frequency, zero-crossing rate, jitter and energyfrequency ratios [19]. Stress related emotions have been mea-sured in speech by extracting features including voice quality,pitch, duration, intensity, formants, vocal tract cross-sectionareas, frequency, Teager energy features, glottal character-istics, duration of silence, and speech rate [103,108–110]. Asystem that detects frustration and annoyance (symptoms ofstress) in voice has been developed for flight telephone book-ing through a prosodic model [109]. Frustration was detectedby longer speech durations, slower speech and pitch rates.
Acoustic components in voice that can be used to showstress are caused by physiological changes that depict signsthat the human body is responding to stress [19]. This is anexample where physiological and physical characteristics ofstress are related. Micro-muscle tremors (MMT), caused bymuscle tension, and voice stress analysis (VSA) reflect stress.MMT is caused by the muscles in the vocal tract and is trans-mitted through speech. MMT and VSA have been used in liedetector systems [111].
4.3. Fusion of measures
Combinations of sensors have been used to give a bettermeasure of stress. Facial expressions, eye movements, headmovements, GSR, RTD and BVP data have been fused todevelop a stress model [45]. Physiological sensors have beenfused to determine stress. GSR, BVP and HR have been used todetermine stress in video game players [49]. Computer usershave had their GSR, EMG, ECG and respiration data used for
stress classification [95]. Car drivers have had their relativestress levels monitored by ECG, GSR, EMG and respirationrecordings, but ECG and GSR mirrored stress more reliably[23]. In addition, drivers have had facial expressions and road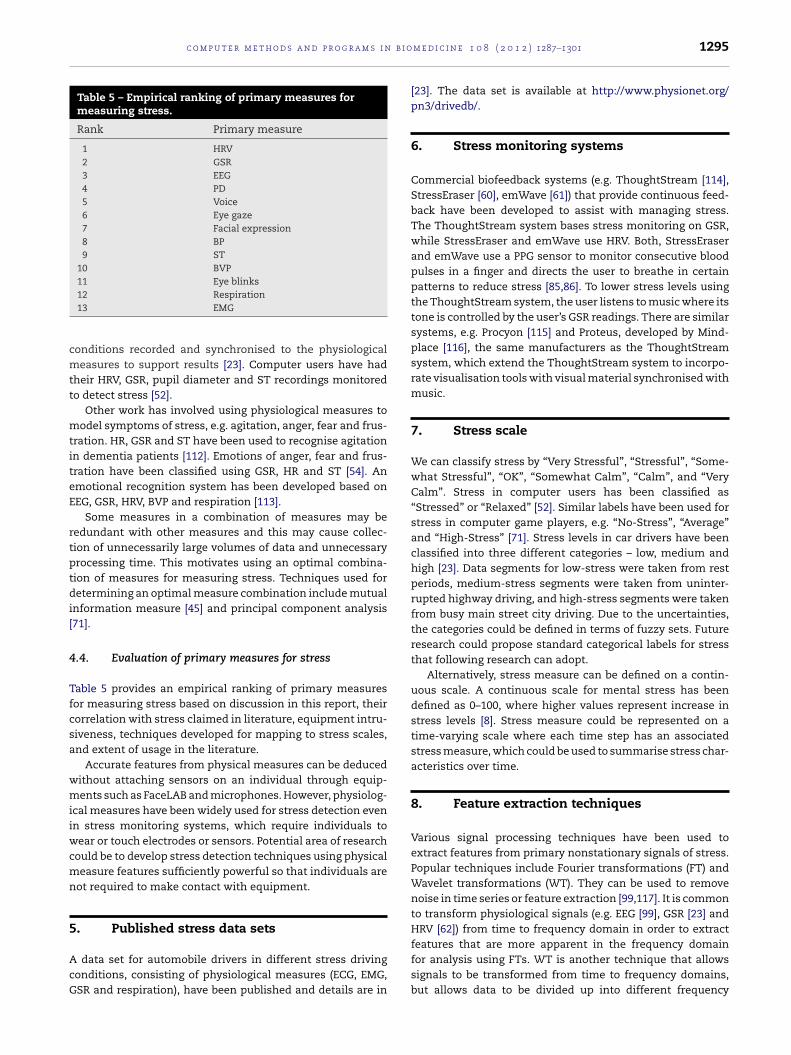
c o m p u t e r m e t h o d s a n d p r o g r a m s i n b i o
Table 5 – Empirical ranking of primary measures formeasuring stress.
Rank Primary measure
1 HRV2 GSR3 EEG4 PD5 Voice6 Eye gaze7 Facial expression8 BP9 ST
10 BVP11 Eye blinks
cmtt
mtiteE
rtptdi[
4
Tfcsa
wmiiwcmn
5
AcG
features that are more apparent in the frequency domain
12 Respiration13 EMG
onditions recorded and synchronised to the physiologicaleasures to support results [23]. Computer users have had
heir HRV, GSR, pupil diameter and ST recordings monitoredo detect stress [52].
Other work has involved using physiological measures toodel symptoms of stress, e.g. agitation, anger, fear and frus-
ration. HR, GSR and ST have been used to recognise agitationn dementia patients [112]. Emotions of anger, fear and frus-ration have been classified using GSR, HR and ST [54]. Anmotional recognition system has been developed based onEG, GSR, HRV, BVP and respiration [113].
Some measures in a combination of measures may beedundant with other measures and this may cause collec-ion of unnecessarily large volumes of data and unnecessaryrocessing time. This motivates using an optimal combina-ion of measures for measuring stress. Techniques used foretermining an optimal measure combination include mutual
nformation measure [45] and principal component analysis71].
.4. Evaluation of primary measures for stress
able 5 provides an empirical ranking of primary measuresor measuring stress based on discussion in this report, theirorrelation with stress claimed in literature, equipment intru-iveness, techniques developed for mapping to stress scales,nd extent of usage in the literature.
Accurate features from physical measures can be deducedithout attaching sensors on an individual through equip-ents such as FaceLAB and microphones. However, physiolog-
cal measures have been widely used for stress detection evenn stress monitoring systems, which require individuals toear or touch electrodes or sensors. Potential area of research
ould be to develop stress detection techniques using physicaleasure features sufficiently powerful so that individuals are
ot required to make contact with equipment.
. Published stress data sets
data set for automobile drivers in different stress drivingonditions, consisting of physiological measures (ECG, EMG,SR and respiration), have been published and details are in
m e d i c i n e 1 0 8 ( 2 0 1 2 ) 1287–1301 1295
[23]. The data set is available at http://www.physionet.org/pn3/drivedb/.
6. Stress monitoring systems
Commercial biofeedback systems (e.g. ThoughtStream [114],StressEraser [60], emWave [61]) that provide continuous feed-back have been developed to assist with managing stress.The ThoughtStream system bases stress monitoring on GSR,while StressEraser and emWave use HRV. Both, StressEraserand emWave use a PPG sensor to monitor consecutive bloodpulses in a finger and directs the user to breathe in certainpatterns to reduce stress [85,86]. To lower stress levels usingthe ThoughtStream system, the user listens to music where itstone is controlled by the user’s GSR readings. There are similarsystems, e.g. Procyon [115] and Proteus, developed by Mind-place [116], the same manufacturers as the ThoughtStreamsystem, which extend the ThoughtStream system to incorpo-rate visualisation tools with visual material synchronised withmusic.
7. Stress scale
We can classify stress by “Very Stressful”, “Stressful”, “Some-what Stressful”, “OK”, “Somewhat Calm”, “Calm”, and “VeryCalm”. Stress in computer users has been classified as“Stressed” or “Relaxed” [52]. Similar labels have been used forstress in computer game players, e.g. “No-Stress”, “Average”and “High-Stress” [71]. Stress levels in car drivers have beenclassified into three different categories – low, medium andhigh [23]. Data segments for low-stress were taken from restperiods, medium-stress segments were taken from uninter-rupted highway driving, and high-stress segments were takenfrom busy main street city driving. Due to the uncertainties,the categories could be defined in terms of fuzzy sets. Futureresearch could propose standard categorical labels for stressthat following research can adopt.
Alternatively, stress measure can be defined on a contin-uous scale. A continuous scale for mental stress has beendefined as 0–100, where higher values represent increase instress levels [8]. Stress measure could be represented on atime-varying scale where each time step has an associatedstress measure, which could be used to summarise stress char-acteristics over time.
8. Feature extraction techniques
Various signal processing techniques have been used toextract features from primary nonstationary signals of stress.Popular techniques include Fourier transformations (FT) andWavelet transformations (WT). They can be used to removenoise in time series or feature extraction [99,117]. It is commonto transform physiological signals (e.g. EEG [99], GSR [23] andHRV [62]) from time to frequency domain in order to extract
for analysis using FTs. WT is another technique that allowssignals to be transformed from time to frequency domains,but allows data to be divided up into different frequency

i n
1296 c o m p u t e r m e t h o d s a n d p r o g r a m scomponents. Unlike FT, WT performs well when approxi-mating data that has sharp spikes and discontinuities.
Principal Component Analysis (PCA) and IndependentComponent Analysis (ICA) have mainly been used to extractfeatures from EEG data but can be used for reducing the featureset or removing unwanted features from the set of primarymeasures for stress models. PCA was used to reduce featuresin EEG signals to model stress [71]. ICA has been used toremove eye movement and other muscular movement infor-mation, which is generally considered to be noise, from EEGsignals [82].
9. Computational techniques
Various software programs, tools and packages (e.g. Matlab[118], AcqKnowledge [119] and Biosignal Analysis Software[58]) are available for analysing physiological and physicalsignals. Most of the tools and applications are not specifi-cally designed for primary measures of stress but they sufficefor general data exploration. Exploring signal data is benefi-cial because it enables selection of appropriate computationaltechniques to model stress. It also allows detection of noisy,corrupted or missing signal data, which is useful in the pro-cess of preparing data before computational stress models aredeveloped. This section focuses on computational modellingtechniques used for stress.
9.1. Bayesian classification
Bayesian classifiers can predict class membership probabil-ities for given samples. Such classifiers are based on Bayes’theorem and have been used to calculate posterior probabili-ties stress states. Naive Bayesian classifiers have been used toclassify stress [52,95], which assumes classes are independent.A maximum posterior (MAP) decision rule was used to clas-sify features from physical measures to stress classes: “Stress”and “Normal” [52]. Alternatively, Bayesian belief networksor Bayesian Networks (BN) can be used when classes havedependencies. A BN can be represented by a directed acyclicgraph or conditional probability tables to show joint condi-tional probabilities for attributes or variables. Nodes in thegraph depict variables and arcs portray causality. A DynamicBayesian Network (DBN) has been used to model stress [45].Unlike a traditional BN, a DBN can show how properties ofstress vary over time.
9.2. Decision trees
Decision tree classifiers, based on a divide-and-conquerapproach, have been used in stress classification. The struc-ture of a decision tree is like a flowchart. Each internal noderepresents some criteria or test to divide the input space intoregions, each branch denotes an outcome of the test, andeach terminal node or leaf represents a target class. Algo-
rithms have been established to generate decision trees [120].Unknown samples are classified by starting at the root of thetree and moving the sample towards the leaf after testing thesample against the criteria at the internal nodes in the path.b i o m e d i c i n e 1 0 8 ( 2 0 1 2 ) 1287–1301
Decision trees have been used to classify stress based oncharacteristics in physiological measures (e.g. EEG [71]) andcombinations of primary measures (e.g. combination of BVP,GSR, PD and ST [52]). A potential problem with using decisiontrees to model stress is the crisp splits for prediction. Futureresearch could investigate softening the decision process withthe use of fuzzy techniques or some probabilistic framework.
9.3. Artificial neural networks
Artificial neural networks (ANNs) are inspired by biologicalneural networks with characteristics for learning and reacting,making them a common technique in classification prob-lems in health systems and an upcoming approach for stressresearch. Stress models based on ANN are at the early stagesof research and have produced promising results. It has beenclaimed that an ANN is better at recognising stress thanhumans from voice recordings [105] and this result contributesto motivation for further research with ANN for stress.
Multi-layered perceptrons, a type of ANN with multiplehidden layers, have been used for stress classification [121].Features from physiological measures were used in the classi-fication. Recurrent ANNs (RANN) have been used to measurestress. A RANN is an ANN that contains feedback connections.It has been claimed to be useful for retaining information ofhow the previous sample was processed to process the cur-rent sample effectively. A RANN based on labelled voice datafor experiment participants playing a video game has beendeveloped [105]. Utterances were recorded when participantsanswered questions while playing the video game.
Choosing the number of hidden neurons and layers is a crit-ical aspect in defining the structure of an ANN. With a smallnumber of hidden neurons, an ANN will not be able to dif-ferentiate between complex patterns, which will result in anunderestimation of the actual trend. On the other hand, a largenumber of hidden neurons could lead to a poor generalisationbecause of over-parameterisation. The number of hidden neu-rons is usually obtained empirically. In some situations theaccuracy may be similar for different topologies, for instance,the accuracy for the one and two hidden layers were similarwhen classifying fatigue [122].
9.4. Support vector machines
Stress models have been developed using support vectormachines (SVMs). It can be used for classifying linear and non-linear primary measures. A SVM transforms training data toa higher dimension, in which a linear separating hyper-planeis determined. An appropriate non-linear mapping can sepa-rate two classes of data with a hyper-plane provided that thedata has been transformed to a satisfactorily high dimension.Training samples, or support vectors, and margins, which aredefined by support vectors, are used to determine a hyper-plane. SVMs have been used to predict stress states using BVP,GSR, PD and ST data [29,52].
Other research has modelled properties more related with
the symptoms of stress. SVM has been used to recognise agi-tation in dementia patients based on physiological signals:HR, GSR and ST [112], which is somewhat related to stressresearch. It was claimed that their SVM algorithm was not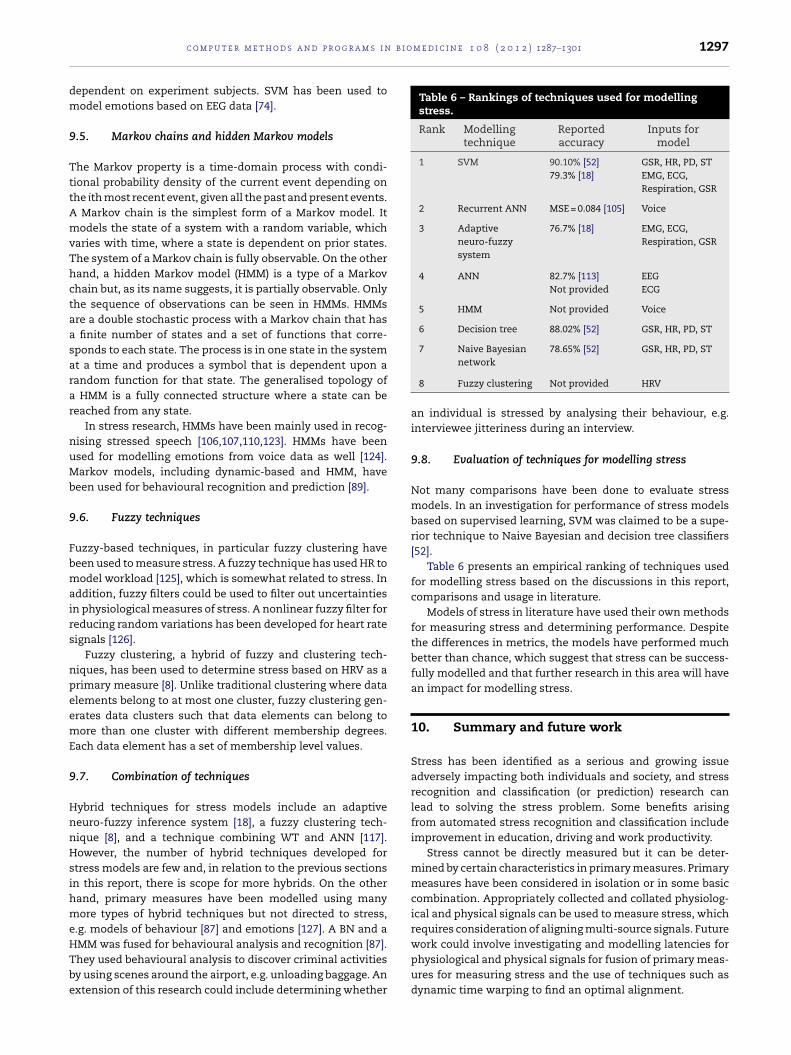
b i o m e d i c i n e 1 0 8 ( 2 0 1 2 ) 1287–1301 1297
dm
9
TttAmvThctaasarar
nuMb
9
Fbmairs
npeemE
9
HnnHsihmeHTbe
Table 6 – Rankings of techniques used for modellingstress.
Rank Modellingtechnique
Reportedaccuracy
Inputs formodel
1 SVM 90.10% [52]79.3% [18]
GSR, HR, PD, STEMG, ECG,Respiration, GSR
2 Recurrent ANN MSE = 0.084 [105] Voice
3 Adaptiveneuro-fuzzysystem
76.7% [18] EMG, ECG,Respiration, GSR
4 ANN 82.7% [113]Not provided
EEGECG
5 HMM Not provided Voice
6 Decision tree 88.02% [52] GSR, HR, PD, ST
7 Naive Bayesian 78.65% [52] GSR, HR, PD, ST
c o m p u t e r m e t h o d s a n d p r o g r a m s i n
ependent on experiment subjects. SVM has been used toodel emotions based on EEG data [74].
.5. Markov chains and hidden Markov models
he Markov property is a time-domain process with condi-ional probability density of the current event depending onhe ith most recent event, given all the past and present events.
Markov chain is the simplest form of a Markov model. Itodels the state of a system with a random variable, which
aries with time, where a state is dependent on prior states.he system of a Markov chain is fully observable. On the otherand, a hidden Markov model (HMM) is a type of a Markovhain but, as its name suggests, it is partially observable. Onlyhe sequence of observations can be seen in HMMs. HMMsre a double stochastic process with a Markov chain that has
finite number of states and a set of functions that corre-ponds to each state. The process is in one state in the systemt a time and produces a symbol that is dependent upon aandom function for that state. The generalised topology of
HMM is a fully connected structure where a state can beeached from any state.
In stress research, HMMs have been mainly used in recog-ising stressed speech [106,107,110,123]. HMMs have beensed for modelling emotions from voice data as well [124].arkov models, including dynamic-based and HMM, have
een used for behavioural recognition and prediction [89].
.6. Fuzzy techniques
uzzy-based techniques, in particular fuzzy clustering haveeen used to measure stress. A fuzzy technique has used HR toodel workload [125], which is somewhat related to stress. In
ddition, fuzzy filters could be used to filter out uncertaintiesn physiological measures of stress. A nonlinear fuzzy filter foreducing random variations has been developed for heart rateignals [126].
Fuzzy clustering, a hybrid of fuzzy and clustering tech-iques, has been used to determine stress based on HRV as arimary measure [8]. Unlike traditional clustering where datalements belong to at most one cluster, fuzzy clustering gen-rates data clusters such that data elements can belong toore than one cluster with different membership degrees.
ach data element has a set of membership level values.
.7. Combination of techniques
ybrid techniques for stress models include an adaptiveeuro-fuzzy inference system [18], a fuzzy clustering tech-ique [8], and a technique combining WT and ANN [117].owever, the number of hybrid techniques developed for
tress models are few and, in relation to the previous sectionsn this report, there is scope for more hybrids. On the otherand, primary measures have been modelled using manyore types of hybrid techniques but not directed to stress,
.g. models of behaviour [87] and emotions [127]. A BN and a
MM was fused for behavioural analysis and recognition [87].hey used behavioural analysis to discover criminal activitiesy using scenes around the airport, e.g. unloading baggage. Anxtension of this research could include determining whethernetwork
8 Fuzzy clustering Not provided HRV
an individual is stressed by analysing their behaviour, e.g.interviewee jitteriness during an interview.
9.8. Evaluation of techniques for modelling stress
Not many comparisons have been done to evaluate stressmodels. In an investigation for performance of stress modelsbased on supervised learning, SVM was claimed to be a supe-rior technique to Naive Bayesian and decision tree classifiers[52].
Table 6 presents an empirical ranking of techniques usedfor modelling stress based on the discussions in this report,comparisons and usage in literature.
Models of stress in literature have used their own methodsfor measuring stress and determining performance. Despitethe differences in metrics, the models have performed muchbetter than chance, which suggest that stress can be success-fully modelled and that further research in this area will havean impact for modelling stress.
10. Summary and future work
Stress has been identified as a serious and growing issueadversely impacting both individuals and society, and stressrecognition and classification (or prediction) research canlead to solving the stress problem. Some benefits arisingfrom automated stress recognition and classification includeimprovement in education, driving and work productivity.
Stress cannot be directly measured but it can be deter-mined by certain characteristics in primary measures. Primarymeasures have been considered in isolation or in some basiccombination. Appropriately collected and collated physiolog-ical and physical signals can be used to measure stress, whichrequires consideration of aligning multi-source signals. Futurework could involve investigating and modelling latencies for
physiological and physical signals for fusion of primary meas-ures for measuring stress and the use of techniques such asdynamic time warping to find an optimal alignment.
i n
r
1298 c o m p u t e r m e t h o d s a n d p r o g r a m s
Based on literature investigated in this survey, there hasnot been an extensive use of combinations of physical andphysiological sensors in research yet where stress can bemonitored through social and emotional interactions. Phys-iological sensors can detect stress to some extent and usuallyfulfils its purpose but they can be somewhat cumbersome.There are occasions and cultures where it may be inappro-priate to attach sensors to people, which is a drawback. Onthe other hand, some physical sensors require less or nocontact at all and have the capability of detecting stress,but more research is required before it can be comfortablysaid that physical sensors are as good as, if not better, thanphysiological sensors in measuring stress. Combining the twodifferent types of sensors and analysing their impact couldbe a starting point to determine the relationship and dis-similarities in the functionalities. It will also provide a richmethod of analysing communication, both social and emo-tional, between any combination of people and intelligentsystems.
Clustering approaches can be used for objectively group-ing of unlabeled data (including data in time or frequencydomains) for primary measures to determine stress cat-egories. It can also be used to determine data outliers.Clustering algorithms that have been established to determineclusters have been generally categorised as partitioning methods(e.g. k-means), hierarchical methods (e.g. BIRCH), density-basedmethods (e.g. OPTICS), grid-based methods (e.g. WaveCluster),and model-based methods (e.g. Self Organising Maps) [120]. Fordetermining stress levels, clustering of data for primary meas-ures would be more suitable if a categorical (including aninterval-based) scale for stress is used. Clustering techniquescan be included in the process for determining an optimalcombination of primary measures.
Models developed to date that describe stress are quitesimplistic. Generally, established techniques such as ANNand SVM have been used to model stress. Novel or morecomplex computational techniques are needed for stressmodels.
Future stress models could be developed based on mod-els developed for similar research problems e.g. models foremotion [128] and mental workload [129] (which have beenbased on physiological signals, e.g. EEG, HRV and GSR, andthese signals are based to detect stress). In addition, fear andanger are some emotions that are symptoms for stress somodels for stress and emotions may overlap. Genetic pro-gramming (GP) techniques have been used for determiningemotions. A GP has been used to generate regression equa-tions from facial expressions to measure emotions [130].In addition, genetic algorithms have been used for fea-ture selection in EEG for developing emotion models toreduce computational resources required for an Elman net-work [113], a type of recurrent ANN. These techniques areexamples of some techniques that can be used in stressresearch.
Conflict of interest
None.
b i o m e d i c i n e 1 0 8 ( 2 0 1 2 ) 1287–1301
e f e r e n c e s
[1] M. Feuerstein, et al., Health Psychology: A PsychobiologicalPerspective, Springer, 1986.
[2] T. Steckler, et al., Handbook of Stress and the Brain, ElsevierScience, Amsterdam, 2005.
[3] S.C. Segerstrom, G.E. Miller, Psychological stress and thehuman immune system: a meta-analytic study of 30 yearsof inquiry, Psychological Bulletin 130 (2004) 601.
[4] Lifeline Australia, Stress Costs Taxpayer $300K Every Day,2009, Available: www.lifeline.org.au.
[5] International Stress Management Association UK, 2010.Available: http://www.isma.org.uk/.
[6] SupportLine UK, Stress, 2010, Available:http://www.supportline.org.uk/problems/stress.php.
[7] Lifeline Australia, Stress Down Day, 2010, Available:http://www.lifeline.org.au/About-Lifeline/Lifeline-Locations/Central-Australia-NT/News-Articles/Stress-Down-Day/blog.aspx.
[8] M. Kumar, et al., Fuzzy evaluation of heart rate signals formental stress assessment, IEEE Transactions on FuzzySystems 15 (2007) 791–808.
[9] P. Jin, Efficacy of tai chi, brisk walking, meditation, andreading in reducing mental and emotional stress, Journalof Psychosomatic Research 36 (1992) 361–370.
[10] J.S. Lerner, et al., Facial expressions of emotion revealneuroendocrine and cardiovascular stress responses,Biological Psychiatry 61 (2007) 253–260.
[11] F.E. Ritter, et al., Measuring the effect of dental work as astressor on cognition (Tech. Report No. 2005-1). AppliedCognitive Science Lab, School of Information Sciences andTechnology, Penn State.acs.ist.psu.edu/acslab/reports/ritterCRK05.pdf, 2005.
[12] U. Lundberg, et al., Psychophysiological stress and EMGactivity of the trapezius muscle, International Journal ofBehavioral Medicine 1 (1994) 354–370.
[13] R.K. Dishman, et al., Heart rate variability, trait anxiety, andperceived stress among physically fit men and women,International Journal of Psychophysiology 37 (2000)121–133.
[14] A. Steptoe, M. Marmot, Impaired cardiovascular recoveryfollowing stress predicts 3-year increases in blood pressure,Journal of Hypertension 23 (2005) 529.
[15] T. Partala, V. Surakka, Pupil size variation as an indicationof affective processing, International Journal ofHuman-Computer Studies 59 (2003) 185–198.
[16] U. Lundberg, Stress, subjective and objective health,International Journal of Social Welfare 15 (2006)S41–S48.
[17] E. Labbé, et al., Coping with stress: the effectiveness ofdifferent types of music, Applied Psychophysiology andBiofeedback 32 (2007) 163–168.
[18] C.D. Katsis, et al., Toward emotion recognition in car-racingdrivers: a biosignal processing approach, IEEE Transactionson Systems, Man and Cybernetics, Part A: Systems andHumans 38 (2008) 502–512.
[19] L.J.M. Rothkrantz, et al., Voice stress analysis, Lecture Notesin Computer Science 3206 (2004) 449–456.
[20] K. Schindler, et al., Recognizing emotions expressed bybody pose: a biologically inspired neural model, NeuralNetworks 21 (2008) 1238–1246.
[21] A. Niculescu, et al., Manipulating stress and cognitive loadin conversational interactions with a multimodal system
for crisis management support, Development ofMultimodal Interfaces: Active Listening and Synchrony(2010) 134–147.
b i o
c o m p u t e r m e t h o d s a n d p r o g r a m s i n[22] L.M. Vizer, et al., Automated stress detection usingkeystroke and linguistic features: an exploratory study,International Journal of Human-Computer Studies 67(2009) 870–886.
[23] J.A. Healey, R.W. Picard, Detecting stress during real-worlddriving tasks using physiological sensors, IEEE Transactionson Intelligent Transportation Systems 6 (2005) 156–166.
[24] E.H. Chi, et al., Guest editors’ introduction: pervasivecomputing in sports technologies, IEEE PervasiveComputing 4 (2005) 22–25.
[25] M. Kompier, C.L. Cooper, Preventing Stress ImprovingProductivity: European Case Studies in the Workplace,Routledge, 1999.
[26] C.W. Sem-Jacobsen, Electroencephalographic Study of PilotStresses in Flight, Gaustad Hospital-EEG Research Lab,Oslo, Norway, 1961.
[27] D.A. Hennessy, D.L. Wiesenthal, Traffic congestion, driverstress, and driver aggression, Aggressive Behavior 25 (1999)409–423.
[28] J. Healey, R. Picard, Smartcar: Detecting Driver Stress, 2000,p. 4218.
[29] J. Zhai, A. Barreto, Stress detection in computer users basedon digital signal processing of noninvasive physiologicalvariables, in: Proceedings of the 28th IEEE EMBS AnnualInternational Conference, 2006, pp. 1355–1358.
[30] C.S. Hopkins, et al., Evaluation of voice stress analysistechnology, in: Proceedings of the 38th Annual HawaiiInternational Conference on System Sciences (HICSS ’05),2005, p. 20b.
[31] D. Haddad, et al., Investigation and Evaluation of VoiceStress Analysis Technology, Air Force Research Lab RomeNY Information Directorate, 2001.
[32] A. Roscoe, Assessing pilot workload. Why measure heartrate, HRV and respiration? Biological Psychology 34 (1992)259–287.
[33] J.B. Sexton, et al., Error, stress, and teamwork in medicineand aviation: cross sectional surveys, British MedicalJournal 320 (2000) 745.
[34] K.J. Kemper, S.C. Danhauer, Music as therapy, SouthernMedical Journal 98 (2005) 282.
[35] I. Ulstein, et al., High score on the Relative Stress Scale, amarker of possible psychiatric disorder in family carers ofpatients with dementia, International Journal of GeriatricPsychiatry 22 (2007) 195–202.
[36] J.J. Miller, et al., Three-year follow-up and clinicalimplications of a mindfulness meditation-based stressreduction intervention in the treatment of anxietydisorders, General Hospital Psychiatry 17 (1995)192–200.
[37] G. Weidner, et al., Hostility and cardiovascular reactivity tostress in women and men, Psychosomatic Medicine 51(1989) 36.
[38] L. Lemyre, R. Tessier, Measuring psychological stress.Concept, model, and measurement instrument in primarycare research, Canadian Family Physician 49 (2003) 1159.
[39] J.E. Wartella, et al., Emotional distress, coping andadjustment in family members of neuroscience intensivecare unit patients, Journal of Psychosomatic Research 66(2009) 503–509.
[40] I. BIOPAC Systems. MP System Hardware Guide, 2010.Available: www.biopac.com.
[41] W. Jänig, E.M. McLachlan, Characteristics offunction-specific pathways in the sympathetic nervoussystem, Trends in Neurosciences 15 (1992) 475–481.
[42] P.J. Lang, et al., Looking at pictures: affective, facial,
visceral, and behavioral reactions, Psychophysiology 30(1993) 261–273.[43] H. Seyle, The Stress of Life, McGraw-Hill, New York, 1956.
m e d i c i n e 1 0 8 ( 2 0 1 2 ) 1287–1301 1299
[44] P. Ferreira, et al., License to chill!: how to empower users tocope with stress, in: Proceedings of the 5th NordicConference on Human–Computer Interaction: BuildingBridges, 2008, pp. 123–132.
[45] W. Liao, et al., A real-time human stress monitoring systemusing dynamic Bayesian network, in: Computer Vision andPattern Recognition—Workshops, CVPR Workshops, 2005.
[46] S.C. Jacobs, et al., Use of skin conductance changes duringmental stress testing as an index of autonomic arousal incardiovascular research, American Heart Journal 128 (1994)1170–1177.
[47] D. Bersak, et al., Intelligent biofeedback using animmersive competitive environment, presented at theDesigning Ubiquitous Computing Games Workshop atUbiComp 2001, Atlanta, GA, USA, 2001.
[48] Y. Shi, et al., Galvanic skin response (GSR) as an index ofcognitive load, in: CHI ’07 extended abstracts on HumanFactors in Computing Systems, San Jose, CA, USA, 2007, pp.2651–2656.
[49] T. Lin, et al., Do physiological data relate to traditionalusability indexes? in: Proceedings of the 17th AustraliaConference on Computer–Human Interaction: CitizensOnline: Considerations for Today and the Future, 2005, pp.1–10.
[50] L.H. Miller, B.M. Shmavonian, Replicability of two GSRindices as a function of stress and cognitive activity Journalof Personality and Social Psychology (1965) 753–756.
[51] B.S. McEwen, R.M. Sapolsky, Stress and cognitive function,Journal of Current Opinion in Neurobiology 5 (1995)205–216.
[52] J. Zhai, A. Barreto, Stress recognition using non-invasivetechnology, in: Proceedings of the 19th InternationalFlorida Artificial Intelligence Research Society ConferenceFLAIRS, 2006, pp. 395–400.
[53] Affectiva, Q Sensor, 2012, Available:http://www.affectiva.com/q-sensor/.
[54] C.L. Lisetti, F. Nasoz, Using noninvasive wearablecomputers to recognize human emotions fromphysiological signals, EURASIP Journal on Applied SignalProcessing 2004 (2004) 1672–1687.
[55] Apex-Fitness, BodyBugg, 2012, Available:http://www.bodybugg.com/.
[56] J.A. Healey, Wearable and automotive systems for affectrecognition from physiology, Doctor of Philosophy, MediaArts and Sciences, Massachusetts Institute of Technology,Cambridge, 2000.
[57] U. Rajendra Acharya, et al., Heart rate variability: a review,Medical and Biological Engineering and Computing 44(2006) 1031–1051.
[58] J.P. Niskanen, et al., Software for advanced HRV analysis,Computer Methods and Programs in Biomedicine 76 (2004)73–82.
[59] D.W. Rowe, et al., Heart rate variability: indicator of userstate as an aid to human–computer interaction, in:Proceedings of the SIGCHI Conference on Human Factors inComputing Systems, Los Angeles, CA, United States, 1998,pp. 480–487.
[60] Western Cape Direct, StressEraser, 2010, Available:http://stresseraser.com/.
[61] HeartMath Australasia, emWave, 2010, Available:http://www.emwave.com.au/.
[62] G.D. Clifford, Signal processing methods for heart ratevariability, Doctor of Philosophy, Engineering Science,University of Oxford, 2002.
[63] D. Bansal, et al., A review of measurement and analysis of
heart rate variability, in: International Conference onComputer and Automation Engineering (ICCAE ’09),Bangkok, Thailand, 2009, pp. 243–246.
i n
1300 c o m p u t e r m e t h o d s a n d p r o g r a m s[64] R.B. Devereux, et al., Left ventricular wall stresses and wallstress-mass-heart rate products in hypertensive patientswith electrocardiographic left ventricular hypertrophy: theLIFE study, Journal of Hypertension 18 (2000)1129–1138.
[65] P.E. Bonoris, et al., Significance of changes in R waveamplitude during treadmill stress testing: angiographiccorrelation, The American Journal of Cardiology 41 (1978)846–851.
[66] B.F. Robinson, et al., Control of heart rate by the autonomicnervous system: studies in man on the interrelationbetween baroreceptor mechanisms and exercise,Circulation Research 19 (August) (1966) 400–411.
[67] L. Salahuddin, D. Kim, Detection of acute stress by heartrate variability using a prototype mobile ECG sensor, ICHITHybrid Information Technology 6 (2006)453–459.
[68] R. Bailón, et al., Analysis of heart rate variability usingtime-varying frequency bands based on respiratoryfrequency, in: 29th Annual International Conference of theIEEE Engineering in Medicine and Biology Society (EMBS2007), Lyon, 2007, pp. 6674–6677.
[69] T. Force, Heart rate variability: standards of measurement,physiological interpretation and clinical use. Task Force ofthe European Society of Cardiology and the NorthAmerican Society of Pacing and Electrophysiology,Circulation 93 (1996) 1043–1065.
[70] N. Hjortskov, et al., The effect of mental stress on heart ratevariability and blood pressure during computer work,European Journal of Applied Physiology 92 (2004) 84–89.
[71] Z. Dharmawan, Analysis of computer games player stresslevel using EEG data, Master of Science Thesis Report,Faculty of Electrical Engineering, Mathematics andComputer Science, Delft University of Technology,Netherlands, 2007.
[72] Interactive Productline IP AB-Mindball, 2010. Available:http://www.mindball.se/index.html.
[73] D. Novák, et al., EEG and VEP signal processing, TechnicalReport. Czech Technical University in Prague, Departmentof Cybernetics, 2004.
[74] R. Horlings, et al., Emotion recognition using brain activity,in: Proceedings of the 9th International Conference onComputer Systems and Technologies and Workshop forPhD Students in Computing, Gabrovo, Bulgaria, 2008, pp.II.1-1.
[75] D.A. Morilak, et al., Role of brain norepinephrine in thebehavioral response to stress, Progress inNeuro-Psychopharmacology and Biological Psychiatry 29(2005) 1214–1224.
[76] E. Hoffmann, Brain training against stress: theory methodsand results from an outcome study, Stress Report 4 (2005).
[77] T. Lin, L. John, Quantifying mental relaxation with EEG foruse in computer games, in: International Conference onInternet Computing, Las Vegas, Nevada, USA, 2006, pp.409–415.
[78] A.N. Simmons, et al., Functional activation and neuralnetworks in women with posttraumatic stress disorderrelated to intimate partner violence, Biological Psychiatry64 (2008) 681–690.
[79] B. Hjorth, EEG analysis based on time domain properties,Electroencephalography and Clinical Neurophysiology 29(1970) 306–310.
[80] N. Sulaiman, et al., Initial investigation of human physicalstress level using brainwaves, in: IEEE Student Conferenceon Research and Development (SCOReD), UPM, Serdang,
2009, pp. 230–233.[81] N.H.A. Hamid, et al., Evaluation of human stress using EEGpower spectrum, in: 6th International Colloquium on
b i o m e d i c i n e 1 0 8 ( 2 0 1 2 ) 1287–1301
Signal Processing and Its Applications (CSPA), Mallaca City,2010, pp. 1–4.
[82] M. Honal, T. Schultz, Identifying user state usingelectroencephalographic data, presented at the Workshopon Multimodal Multipary Meeting, Trento, Italy, 2005.
[83] T. Pickering, et al., Environmental influences on bloodpressure and the role of job strain, Journal of Hypertension.Supplement: Official Journal of the International Society ofHypertension 14 (1996) 179–185.
[84] S. Reisman, Measurement of physiological stress, in:Bioengineering Conference, 1997, pp. 21–23.
[85] K.J. Heilman, et al., Accuracy of the StressEraser® in thedetection of cardiac rhythms, Applied Psychophysiologyand Biofeedback 33 (2008) 83–89.
[86] HeartMath, The Science Behind the emWave® Desktop &emWave2 Products, 2010, Available:http://www.heartmathstore.com/cgi-bin/category.cgi?category=sciencebehind.
[87] N. Carter, et al., A combined Bayesian Markovian approachfor behaviour recognition, Pattern Recognition 1 (2006)761–764.
[88] A. Liu, D. Salvucci, Modeling and prediction of humandriver behavior, in: 9th International Conference onHuman Computer Interaction, New Orleans, USA, 2001, pp.235–244.
[89] A. Pentland, A. Liu, Modeling and prediction of humanbehavior, Neural Computation 11 (1999) 229–242.
[90] Google, NEVEN Vision, 2010, Available:http://www.nevenvision.com/.
[91] D.F. Dinges, et al., Optical computer recognition of facialexpressions associated with stress induced by performancedemands, Aviation, Space, and Environmental Medicine 76(2005) B172–B182.
[92] M. Jabon, et al., Facial expression analysis for predictingunsafe driving behavior, IEEE Pervasive Computing 10(2010) 84–95.
[93] J. Susskind, et al., Human and computer recognition offacial expressions of emotion, Neuropsychologia 45 (2007)152–162.
[94] S. Dubuisson, et al., A solution for facial expressionrepresentation and recognition, Signal Processing: ImageCommunication 17 (2002) 657–673.
[95] A. Barreto, et al., Non-intrusive physiological monitoringfor automated stress detection in human–computerinteraction, Human–Computer Interaction (2007) 29–38.
[96] W.S. Peavler, Pupil size, information overload, andperformance differences, Psychophysiology 11 (1974)559–566.
[97] A. Barreto, et al., Pupil diameter measurements: untappedpotential to enhance computer interaction for eye trackerusers? in: Proceedings of the 10th international ACMSIGACCESS conference on Computers and Accessibility,Halifax, Nova Scotia, Canada, 2008, pp. 269–270.
[98] S. Machines, FaceLAB, 2010, Available:http://www.seeingmachines.com/product/facelab/.
[99] M. Haak, et al., Detecting stress using eye blinks and brainactivity from EEG signals, in: Proceeding of the 1st DriverCar Interaction and Interface (DCII 2008), Chez TechnicalUniversity, Prague, 2008.
[100] I.R. Murray, et al., Towards a definition and working modelof stress and its effects on speech Speech Communication20 (1996) 3–12.
[101] P. Wittels, et al., Voice monitoring to measure emotionalload during short-term stress, European Journal of AppliedPhysiology 87 (2002) 278–282.
[102] C.E. Williams, K.N. Stevens, On determining the emotionalstate of pilots during flight: an exploratory study,Aerospace Medicine 40 (1969) 1369–1372.
b i o
c o m p u t e r m e t h o d s a n d p r o g r a m s i n[103] T.L. Nwe, et al., Speech emotion recognition using hiddenMarkov models, Speech Communication 41 (2003)603–623.
[104] K. Gopalan, On the effect of stress on certain modulationparameters of speech, in: IEEE International Conference onAcoustics, Speech, and Signal Processing (ICASSP ’01), SaltLake City, 2001, pp. 101–104.
[105] S. Scherer, et al., Emotion recognition from speech: stressexperiment, in: Proceedings of the 6th InternationalLanguage Resources and Evaluation (LREC 2008),Marrakech, Morocco, 2008.
[106] J. Hansen, S. Patil, Speech under stress: analysis,modeling and recognition, Speaker Classification I (2007)108–137.
[107] R. Fernandez, R.W. Picard, Modeling drivers’ speech understress, Speech Communication 40 (2003) 145–159.
[108] D. Ververidis, C. Kotropoulos, Emotional speechrecognition: resources, features, and methods, SpeechCommunication 48 (2006) 1162–1181.
[109] J. Ang, et al., Prosody-based automatic detection ofannoyance and frustration in human–computer dialog, in:7th International Conference on Spoken LanguageProcessing, Denver, Colorado, USA, 2002, pp. 2037–2040.
[110] M. Rahurkar, et al., Frequency band analysis for stressdetection using a Teager energy operator based feature, in:7th International Conference on Spoken LanguageProcessing, Denver, Colorado, USA, 2002, pp. 2021–2024.
[111] X. Liu, Voice stress analysis: detection of deception,Master’s Thesis at the University of Sheffield, Departmentof Computer Science, 2005.
[112] G.E. Sakr, et al., Multi level SVM for subject independentagitation detection, in: IEEE/ASME InternationalConference on Advanced Intelligent Mechatronics,Singapore, 2009, pp. 538–543.
[113] S.A. Hosseini, M.A. Khalilzadeh, Emotional stressrecognition system using EEG and psychophysiologicalsignals: using new labelling process of EEG signals inemotional stress state, in: International Conference ofBiomedical Engineering and Computer Science (ICBECS),2010, pp. 1–6.
[114] Mindplace, ThoughtStream, 2012, Available:http://www.mindplace.com/Mindplace-Thoughtstream-USB-Personal-Biofeedback/dp/B005NDGPLC.
[115] Mindplace, Procyon, 2012, Available:http://www.mindplace.com/Mindplace-Procyon-System-
Meditation-Machine/dp/B005NDHWWI.[116] Mindplace, Proteus, 2012, Available:http://www.mindplace.com/MindPlace-Proteus-Light-Meditation-Machine/dp/B005NDED02.
m e d i c i n e 1 0 8 ( 2 0 1 2 ) 1287–1301 1301
[117] O. Fukuda, et al., Evaluation of heart rate variability byusing wavelet transform and a recurrent neural network,in: Proceedings of the 23rd Annual InternationalConference of the IEEE Engineering in Medicine andBiology Society, vol. 2, 2001, pp. 1769–1772.
[118] Mathworks. Matlab., 2010. Available:http://www.mathworks.com.au/products/matlab/.
[119] I. BIOPAC Systems. AcqKnowledge Software, 2010.Available: http://www.biopac.com/acqknowledge-data-acquisition-analysis-software-win.
[120] J. Han, M. Kamber, Data Mining: Concepts and Techniques,2nd ed., Morgan Kaufmann, San Francisco, 2006.
[121] Y. Fukuoka, A. Ishida, Chronic stress evaluation usingneural networks, IEEE Engineering in Medicine and BiologyMagazine 19 (2000) 34–38.
[122] M.M. Bundele, R. Banerjee, Detection of fatigue of vehiculardriver using skin conductance and oximetry pulse: a neuralnetwork approach, in: Proceedings of the 11thInternational Conference on Information Integration andWeb-based Applications and Services, Kuala Lumpur,Malaysia, 2009, pp. 739–744.
[123] G. Zhou, et al., Nonlinear feature based classification ofspeech under stress, IEEE Transactions on Speech andAudio Processing 9 (2002) 201–216.
[124] B. Schuller, et al., Hidden Markov model-based speechemotion recognition, in: IEEE International Conference onAcoustics Speech, and Signal Processing (ICASSP ’03), 2003,pp. II-1-4.
[125] M. Kumar, et al., Fuzzy techniques for subjectiveworkload-score modeling under uncertainties, IEEETransactions on Systems, Man, and Cybernetics: Part B:Cybernetics 38 (2008) 1449–1464.
[126] M. Kumar, et al., Fuzzy filtering for physiological signalanalysis, IEEE Transactions on Fuzzy Systems 18 (2010)208–216.
[127] H. Kurose, et al., A method for selecting facial expressionbased on emotions and its application for text reading, in:IEEE International Conference on Systems, Man andCybernetics (SMC ’06), Taipei, 2006, pp. 4028–4033.
[128] S.K. Yoo, et al., Neural network based emotion estimationusing heart rate variability and skin resistance, Advancesin Natural Computation (2005) 818–824.
[129] G.F. Wilson, C.A. Russell, Real-time assessment of mentalworkload using psychophysiological measures andartificial neural networks, Human Factors: The Journal of
the Human Factors and Ergonomics Society 45 (2003) 635.[130] A. Loizides, et al., Measuring facial emotional expressionsusing genetic programming, Soft Computing and IndustryRecent Applications (2001) 545–554.