Object Oriented-Failure Modes and Effects Analysis
72
Serial number: 19850208-T535 Object Oriented Failure Modes and Effects Analysis (Climate System) Objektorienterad FMEA (klimatsystem) Owais Arshad Sohail Faculty of Health, Science and Technology Master’s Program in Electrical Engineering Degree Project of 30 credit points External Supervisor : Chowa Choo, Volvo Car Corporation, Göteborg Internal Supervisor : Jorge Solis, Karlstad University, Karlstad Examiner : Magnus Mosberg, Karlstad University, Karlstad Date : 31 March 2015
Transcript of Object Oriented-Failure Modes and Effects Analysis

Serial number: 19850208-T535
Object Oriented Failure Modes and Effects Analysis (Climate System)
Objektorienterad FMEA (klimatsystem)
Owais Arshad Sohail
Faculty of Health, Science and Technology
Master’s Program in Electrical Engineering
Degree Project of 30 credit points
External Supervisor : Chowa Choo, Volvo Car Corporation, Göteborg Internal Supervisor : Jorge Solis, Karlstad University, Karlstad
Examiner : Magnus Mosberg, Karlstad University, Karlstad
Date : 31 March 2015
ii
Abstract
In order to make the product more reliable and efficient, the failures and their occurrence
related to the products should be reduced if not eliminated. To achieve that, the approach of
Failure Modes Effects Analysis (FMEA) is used in the process development phase where all the
aspects of the product failure are generated and studied. With the passage of time the systems
began to become more complex and alone FMEA not good enough approach for the complex
systems. To handle a complex system is a hard and tedious job which requires more expertise. In
complex systems the individual system might have overlaps, their boundaries are often unclear.
The computation of information and its transmission between the components is extensive.
Object Oriented FMEA resolves these issues by identifying the structure and screening a proper
boundary of the system. It looks deeply in to the operational environment and external shared
resources. It then decomposes its functions and behaviors in to separable physical, logical and
attributes objects. The OO-FMEA approach obeys to the objectives of modern product
development process and its principles. This approach makes it comparatively much easier to
analyze the complex auto-motive systems that are built in extensive electrical architecture. The
systems components perform their task while being interacted, linked or even independent. In
this thesis the OO-FMEA approach is implemented on the Climate System of the SPA Hybrid.

iii
Acknowledgement
I would like to express my deepest appreciation to my external supervisors Mr. Chowa Choo
without his support and cooperation; I would not be able to deal with this challenging project.
I am also very grateful to Mr. Khosro Zabihi for his time and guidance throughout this project.
I would like to thank my internal supervisor Jorge Solis, Associate Professor at Karlstad
University for his excellent support and guidance.
iv
Contents
Definitions ................................................................................................................................................................. vi
Terms ...................................................................................................................................................................... vi
Abbreviations .................................................................................................................................................... viii
List of Figures ........................................................................................................................................................... x
1 Introduction ......................................................................................................................................................... 1
1.1 History........................................................................................................................................................... 1
1.2 Motivation ................................................................................................................................................... 1
1.3 Problem Definition ................................................................................................................................... 2
1.4 Aims and objectives ................................................................................................................................. 2
1.5 Thesis Organization ................................................................................................................................. 3
2 Traditional FMEA ............................................................................................................................................... 4
2.1 FMEA .............................................................................................................................................................. 4
2.1.1 FMEA Standards .............................................................................................................................. 4
2.1.2 Types of FMEA ................................................................................................................................. 5
2.1.3 Guide to the Selection of Scope ................................................................................................. 5
2.1.4 Testing ................................................................................................................................................. 7
2.1.5 FMEA in modern project development line the “V-Diagram” ...................................... 8
2.2 Literature Review ..................................................................................................................................... 9
3 Thermal Management ................................................................................................................................... 12
3.1 Introduction ............................................................................................................................................. 12
3.2 Thermal Management Powertrain ................................................................................................. 13
3.2.1 Air Flow ............................................................................................................................................ 13
3.2.2 Coolant Flow .................................................................................................................................. 13
3.3 Thermal Management Climate ......................................................................................................... 16
3.3.1 Preconditioning ............................................................................................................................ 16
3.3.2 Defroster .......................................................................................................................................... 17
3.3.3 Head Level estimation ............................................................................................................... 17
3.3.4 Steering wheel and Seat Heating ........................................................................................... 17
3.3.5 Air Conditioning A/C .................................................................................................................. 17
3.4 Cooling System ....................................................................................................................................... 17
v
3.4.1 Compressor Module .................................................................................................................... 18
3.4.2 Electric A/C Compressor .......................................................................................................... 18
3.5 Battery Cooling System ....................................................................................................................... 19
3.6 Heating System ....................................................................................................................................... 19
3.6.1 Fuel operated heater (FOH) .................................................................................................... 19
3.6.2 Restricted cooling coil FOH - passenger compartment element .............................. 19
3.6.3 Electric heater for passenger compartment PTC ............................................................ 19
3.6.4 Electric Engine Heater (optional) ......................................................................................... 20
3.7 Climate Comfort in Hybrid Electric Vehicles .............................................................................. 20
3.7.1 Cooling/Heating system ............................................................................................................ 20
3.8 Electrical Architecture ......................................................................................................................... 20
4 OO-FMEA for Climate System..................................................................................................................... 22
4.1 Introduction ............................................................................................................................................. 22
4.2 Simple and Complex Systems ........................................................................................................... 22
4.3 Sub-system Boundaries ...................................................................................................................... 24
4.4 Comparison between tradition and object oriented FMEAs ............................................... 27
4.5 Implementation of OO-FMEA on Climate System .................................................................... 30
4.5.1 OO-FMEA 1st step (Conceptual System Structure) ......................................................... 30
4.5.2 OO-FMEA 2nd step (Identification of Behavior) ............................................................... 33
4.5.3 OO-FMEA 3rd Step (Prioritization) ........................................................................................ 37
4.5.4 OO-FMEA 4Th Step (Generating the Failure Modes) ...................................................... 39
4.5.5 OO-FMEA 5Th Step (Complete the FMEA) ........................................................................... 47
4.6 1st Recommendation ............................................................................................................................ 48
4.6.1 Explanation..................................................................................................................................... 49
4.6.2 Suggestion regarding 1st Recommendation ...................................................................... 49
4.7 2nd Recommendation maintaining the humidity level ........................................................... 50
4.8 Survey: Comparison between traditional FMEA & OO-FMEA............................................. 51
5 Results ................................................................................................................................................................. 54
6 Conclusion and Future work ...................................................................................................................... 58
Bibliography ........................................................................................................................................................... 60
vi
Definitions
Terms
Failure
Failure is defined as the completely loss of
envisioned function in any system is called
failure.
Failure Mode
Failure mode is defined as the way failure
occurs or the way things fail.
Failure Effects
The penalties as a result of the Failure are
termed as Failure Effects
FMEA
FMEA is a tool, systematic process for
assessment of potential failures modes of
any system. It is a systematic process
which is used to identify potential failure
modes and their potential causes, for the
improvement of product reliability
Thermal Management System
Thermal management as the name shows
is the management of heat energy. It is a
complicated system in cars which manages
the thermal energy in cars.
Simple System
A system is said to be a simple system
when it has limited number of system
elements, its boundaries are clear and it
has well defined inputs and outputs.
Complex System
Any system which is composed of various
dependent and/or independent, densely
interconnected components having
multiple level details, with no clear
boundaries is said to be a complex system.
Interface
Interface is when data is transmitted from
one entity to another without any
feedback between the connected entities.
The transfer of data can be one or two
ways, but is independent of each other.
Interaction
Interaction is a type of interface with
interdependent two-way effect.
External Shared Resources
External shared resources are the
elements outside the system boundary
which do not interact with the
system/sub-system but do provide vital
information for the system in the form of
input.
System Overlaps
When two or more sub systems share the
common object or group of objects (most
of the time in complex systems) this is
known as System Overlap. It is important
that the overlap must me indicated where
ever it is identified because if the overlap
is not indicated then this could be the
cause of the potential failures.
vii
Object
An object is an information package
containing a name and brief, but accurate
description of the design intent of a
separable part of the system. In OO-FMEA
there are three types of objects, which are
physical, attribute and logical objects.
Logical objects
The Logical Objects are represented with
red squares and are software based which
are responsible to perform different tasks
such as taking different decisions to have
the operations performed according to the
requirements set by the user and
instruction from the Climate System for
the required/set climate comfort in the
passenger compartment.
Physical Objects
The Physical objects are represented with
blue squares which represent the
hardware or tangible devices which take
part in the completion of any process, e.g.
electric control unit, relay, switch or
sensor etc.
Attribute objects
The attributes objects are represented
with a green square, which define the
attributes of the design intents of the
logical and physical objects. Basically the
attributes objects holds the desired
conditions and quality level of system,
subsystem or to which it refers to. The
examples of attribute objects are crash
handling, legal requirements, passenger’s
protection, system performance,
prevention against noise factors etc.
Design Intent
The design intent of an object basically
shows the perception about the working of
the object in the system, it explains what
does this object do and what is its purpose.
Topology
Topology is the geometrical arrangement
of modules and units in the network.
LIN
LIN is single wired low cost, low speed
having a data rate of up to 20 Kbps
asynchronous bus used in the products for
non-critical applications.
CAN
CAN uses unshielded two wire line,
medium speed a synchronous bus having a
data speed of 1 Mbps a medium speed
asynchronous bus offering a data rate up
to 1 Mbps.
Flex Ray
It is a serial communication and uses two
channels, both of these channels have
pairs of wires, and it has the data transfer
rate up to 20 Mbps and it has a payload
consist of 0 to 254 bytes for the transfer of
data
Severity
It represents what is important to
industry, or to customers such as the
safety standards, loss of functions etc. It
shows how severe the failure is so 10
means the very high severity ranking
when a potential failure mode affects the
viii
safe vehicle operations and 1 being the
lowest and to be less worried about.
Occurrence
It is the probability of the occurrence of
failure during the expected life time of the
product. In other words, how often this
failure may occur or occurs and is based
on the previous failures. 10 is consider
having a high persistent failure and it can
be defined as 100 products out of 1000
products if the problem occurs and 1 being
the lowest such as 1 product out of 1000.
Detection
It is the detection of the failure in the
product and is based on the internally
defined criteria. On a ranking scale 10
being very hard to detect and 1 being
easily detectable.
Risk Priority Number (RPN)
RPN is a decision factor based on the
product of three ratings which are
severity, Occurrence and Detection based
on the standardized criteria. These ratings
are scaled with numbers from 1 to 10.
According to the criteria there are
different levels of acceptance of the Risk
Priority Number.
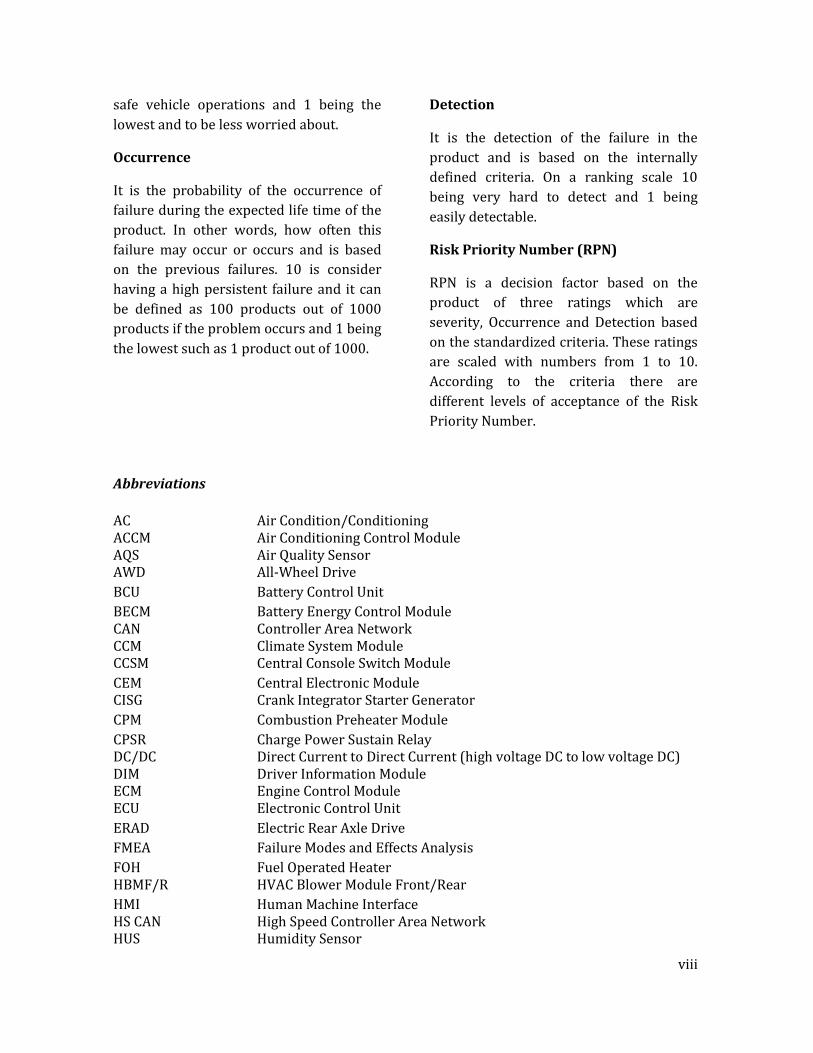
Abbreviations
AC Air Condition/Conditioning ACCM Air Conditioning Control Module AQS Air Quality Sensor AWD All-Wheel Drive
BCU Battery Control Unit
BECM Battery Energy Control Module CAN Controller Area Network CCM Climate System Module CCSM Central Console Switch Module
CEM Central Electronic Module CISG Crank Integrator Starter Generator
CPM Combustion Preheater Module
CPSR Charge Power Sustain Relay DC/DC Direct Current to Direct Current (high voltage DC to low voltage DC) DIM Driver Information Module ECM Engine Control Module ECU Electronic Control Unit
ERAD Electric Rear Axle Drive
FMEA Failure Modes and Effects Analysis
FOH Fuel Operated Heater HBMF/R HVAC Blower Module Front/Rear
HMI Human Machine Interface HS CAN High Speed Controller Area Network HUS Humidity Sensor
ix
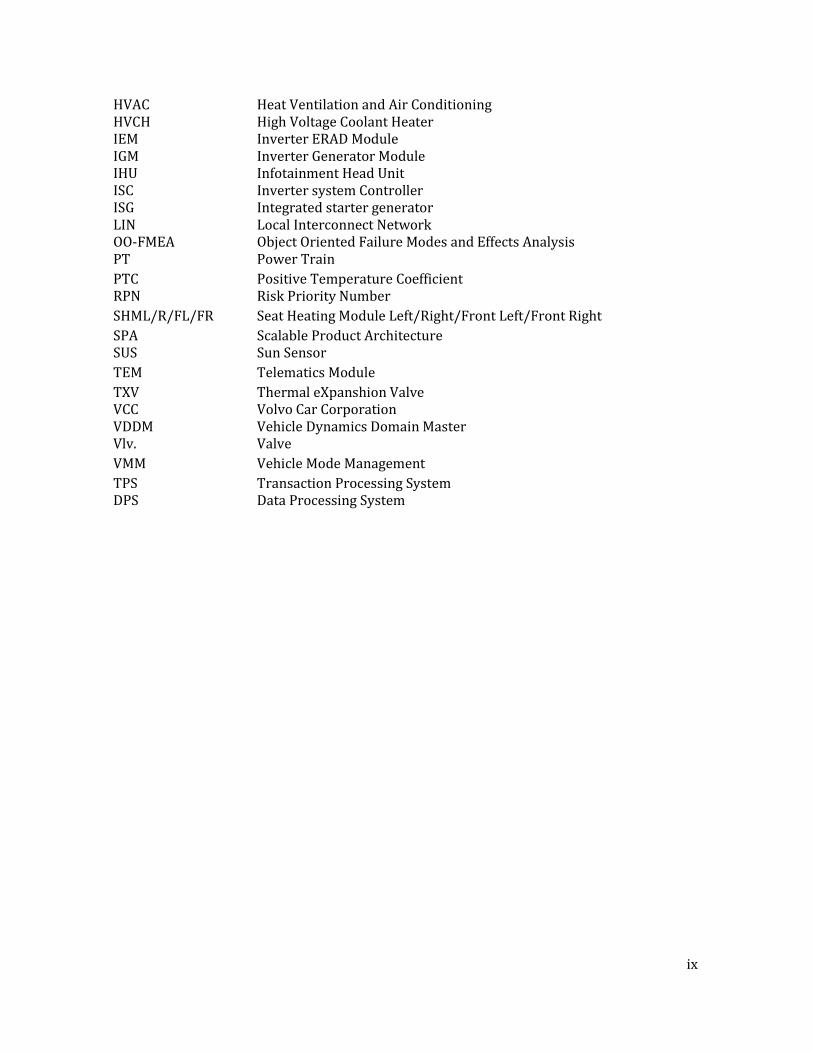
HVAC Heat Ventilation and Air Conditioning HVCH High Voltage Coolant Heater IEM Inverter ERAD Module IGM Inverter Generator Module IHU Infotainment Head Unit ISC Inverter system Controller ISG Integrated starter generator LIN Local Interconnect Network OO-FMEA Object Oriented Failure Modes and Effects Analysis PT Power Train
PTC Positive Temperature Coefficient RPN Risk Priority Number
SHML/R/FL/FR Seat Heating Module Left/Right/Front Left/Front Right
SPA Scalable Product Architecture SUS Sun Sensor
TEM Telematics Module
TXV Thermal eXpanshion Valve VCC Volvo Car Corporation VDDM Vehicle Dynamics Domain Master Vlv. Valve
VMM Vehicle Mode Management
TPS Transaction Processing System DPS Data Processing System
x
List of Figures Figure 2-1 Types of FMEA .............................................................................................................................................................. 5
Figure 2-2 Guide line for choosing the FMEA scope........................................................................................................... 6
Figure 2-3 Difference between the Physical testing and Theoretical testing (FMEA) ........................................ 7
Figure 2-4 FMEA in a modern product development process (The V Diagram) ................................................... 8
Figure 3-1 Hierarchy of Thermal Management at VCC .................................................................................................. 12
Figure 3-2 Battery Cooling Loop .............................................................................................................................................. 14
Figure 3-3 Electric Rear Axle Drive Loop (ERAD) ............................................................................................................ 15
Figure 3-4 Engine Cooling System .......................................................................................................................................... 16
Figure 3-5 Air Conditioning Loop ............................................................................................................................................ 18
Figure 3-6 Heating system Loop (passenger compartment) ...................................................................................... 19
Figure 3-7 High Voltage Components [16] .......................................................................................................................... 21
Figure 4-1 Example of simple system .................................................................................................................................... 23
Figure 4-2 Example of complex system ................................................................................................................................ 23
Figure 4-3 The Interface between two processes ............................................................................................................ 24
Figure 4-4 Interaction between multiple processes ....................................................................................................... 25
Figure 4-5 System Overlap and External Shared Resources ....................................................................................... 26
Figure 4-6 Difference between Object and Design Intent and elements of Design Intents ........................... 27
Figure 4-7 OO-FMEA Flow Chart ............................................................................................................................................. 28
Figure 4-8 Working procedure of OO-FMEA ...................................................................................................................... 30
Figure 4-9 Block diagram of Climate System...................................................................................................................... 31
Figure 4-10 Network Topology of the allocation of the modules.............................................................................. 32
Figure 4-11 Examples of the logical, Attributes and Physical objects ..................................................................... 35
Figure 4-12 Defroster the Logical Object ............................................................................................................................. 36
Figure 4-13 List of logical objects ............................................................................................................................................ 38
Figure 4-14 List of Physical Objects ....................................................................................................................................... 39
Figure 4-15 Attributes Objects ................................................................................................................................................. 39
Figure 4-16 Types of Failure Modes ....................................................................................................................................... 41
Figure 4-17 Illustration the potential cause mechanism in complex structures ................................................ 42
Figure 4-18 Design prevention and design detection .................................................................................................... 43
Figure 4-19 Criteria for the selection of level of severity [9] ...................................................................................... 44
Figure 4-20 Criteria for the selection of level of likelihood of Occurrence [9] .................................................... 44
Figure 4-21 Selection level due to chances of detection of Failure Mode [9] ...................................................... 45
Figure 4-22 Generation of Failure Modes and RPN ......................................................................................................... 46
Figure 4-23 Pivot Table ................................................................................................................................................................ 46
Figure 4-24 RPN distribution .................................................................................................................................................... 47
Figure 4-25 Completion of FMEA ............................................................................................................................................ 48
Figure 4-26 Flow of the commands according to the design intents ....................................................................... 49
Figure 4-27 Recommended flow of commands for automatic Defroster .............................................................. 50
Figure 5-1 Boundary of Climate System ............................................................................................................................... 54
Figure 5-2 List of Sensors, Controllers and Actuators .................................................................................................... 55
Figure 5-3 Modified structure after implementation of OO-FMEA .......................................................................... 56
Figure 5-4 Flow of commands according to design intents ......................................................................................... 56
Figure 5-5 Physical, Attributes and Logical objects after implementation of OO-FMEA ................................ 57
1
1 Introduction
1.1 History The technique of Failure modes and Effect Analysis (FMEA) was first used in 1920’s but was
not considerably documented. Afterwards in 1949 it was used for military procedure MIL-P-
1629, in which the FMEA was performed it was used as a reliability technique to determine
the effects of the system and equipment failures. In 1960’s FMEA was used to improve and
verify reliability of space program hardware [1]. After that in 70’s it was introduced and used
in the automotive industry but its use was geared up in 90’s to cope with the major quality
and reliability challenges [2]. The wide use of FMEA methodology is being made possible by
the recent changes in the law on corporate responsibilities.
1.2 Motivation Automotive industries are introducing intelligent vehicles for the sake of customers’ comfort.
To be stable, to propagate in the market and to compete with the contenders, there are
certain requirements to be fulfilled [3], quality is the basic one of those requirements. To
produce reliable and high quality products companies have product testing workshops in
which the preexisting models and/or the prototypes of products are tested and decisions
regarding any changes or up gradation are made based on the tested data [4]. Getting a
physically tested data to mitigate the failures and errors is considered late if production
process of any product is started, because after that the customer will be directly affected [5].
This is where FMEA come in handy, because FMEA is started in the design phase and by the
time the prototype is completed almost all the failures and errors are already been reduced
or eliminated. In simple words FMEA is a process to eliminate/reduce to errors before even
they occur [6].
FMEA is the process which can be described as a systemized group of activities intended to
recognize and evaluate the potential failure of a product/process and its effects, to identify
actions which could eliminate or reduce the chance of potential failure occurring, and
documenting the whole process. Though being famous and widely recognized still some
improvements are required the FMEA process alone is not very much capable of delivering
the results which can be resulted by the implementation of several operations performed
with FMEA to have better results. For this approach to work better there are several different
processes which should be performed along with FMEA to get better results which could not
be provided by FMEA alone [7] . It is complementary to the process of defining what a design
process must do to satisfy the customer. Failure Modes and Effect Analysis (FMEA) is a logical
and systematical analysis of a system, sub system, module or object to analyze and identify
the failure modes their roots and the reasons which cause them, and the effects related to
those failures [8].
2
1.3 Problem Definition In order to make the products more reliable, robust, efficient and long lasting, the products
must be developed while keeping in mind all the possible failures modes. Less the failures
are, less are the chances of the product go fail. According to Murphy’s Law “Everything which
can fail, will fail” [8]. So it is almost impossible to make something which never fails, but the
life of the product can be increased and for that FMEA has been in use. The technique of
FMEA is around since the beginning of 20th century. It has been very useful for the betterment
of product quality. As there is always room for some improvement in the products, so is true
for the tools which are in use to make these products better and improved. FMEA is a good
and efficient approach but only when it is implemented on simple systems. This approach is
not very good to find the missing or incomplete designs. It does not focus on the interactions
and interfaces between the objects, sub-system and even systems [9]. So performing FMEA
on such complex system can be a tedious task. In complex system the sub-system often has
the overlaps and their boundaries are unclear. Though FMEA is around for a long time but
still only FMEA is not a very good approach when it comes to the complex systems. For the
complex systems we use OO-FMEA. Climate System is a complex system and OO-FMEA is the
approach to be implemented on it. The main objective of this thesis is to implement the OO-
FMEA and generate the failure modes to have better results. OO-FMEA being a five steps
method, the steps which differentiate the traditional FMEA from OO-FMEA are steps number
1, 2 and 3, whereas step 4 and 5 are same as of traditional FMEA [9]. It is more efficient and is
more feasible, relevant and effective towards the complex systems, efficient in the detection
of missing or incomplete designs, unclear or unnecessary requirements and specifications
which cannot be identified when applying the traditional FMEA approach are identified. The
best thing which makes OO-FMEA dominant on the traditional FMEA approach is that the
objects are convenient for reuse and update [2]. This makes it possible to understand the
boundary of the system to be considered and understating the complex failure modes and the
failure modes in different subsystems.
1.4 Aims and objectives The main focus of this thesis work is to apply the OO-FMEA approach on Thermal
Management Climate in order to study the effectiveness of the new approach in analyzing
complex system. As Thermal Management Climate is a big and complex system and
traditional FMEA is not very efficient for this kind of system that is why OO-FMEA is being
applied on this system. Within this system one of the functions, defroster is chosen as an
object for detailed analysis in this report according to the principles of the new approach. The
main objectives which will be achieved by the end of this thesis work are as follows,
Advantages and disadvantages of using the OO-FMEA instead of traditional FMEA
approach.
The capability of this approach to identify
o Incomplete designs
o Ambiguous and unnecessary requirements (Suggestion related to them)
o Unmotivated complexity in design solutions
3
Undesired external sub-systems interactions and interfaces
Easy usability
Easy update
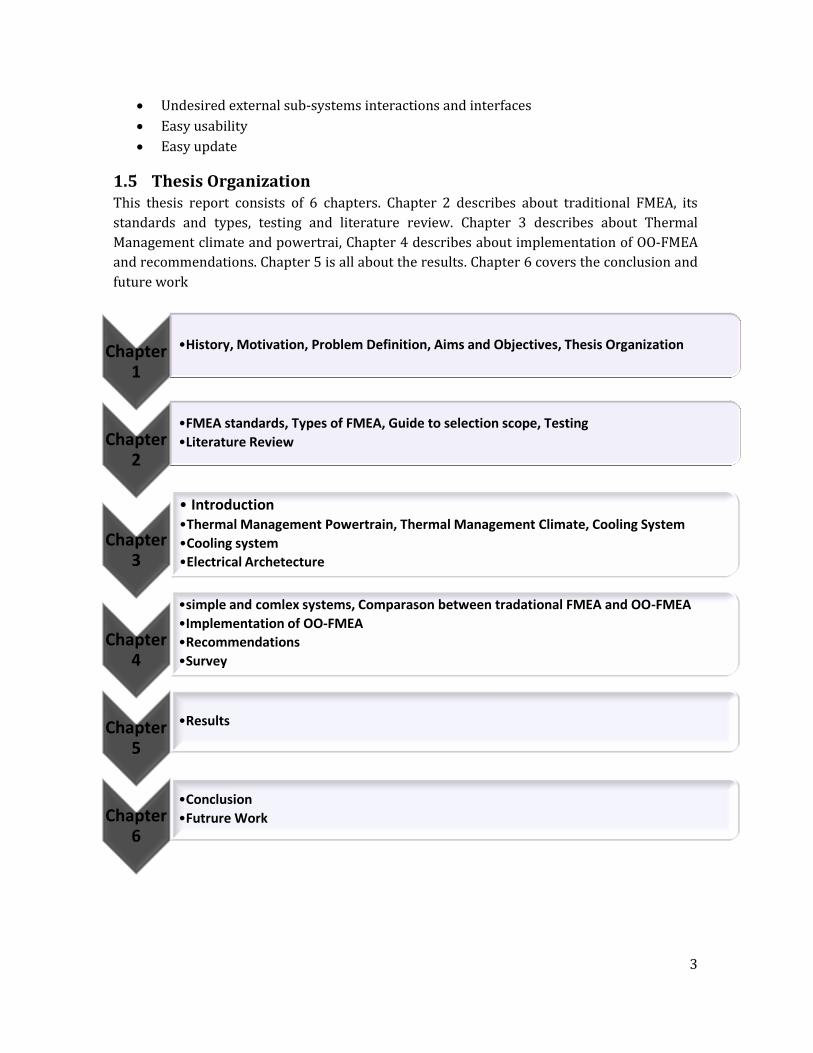
1.5 Thesis Organization This thesis report consists of 6 chapters. Chapter 2 describes about traditional FMEA, its
standards and types, testing and literature review. Chapter 3 describes about Thermal
Management climate and powertrai, Chapter 4 describes about implementation of OO-FMEA
and recommendations. Chapter 5 is all about the results. Chapter 6 covers the conclusion and
future work
Chapter 1
•History, Motivation, Problem Definition, Aims and Objectives, Thesis Organization
Chapter 2
•FMEA standards, Types of FMEA, Guide to selection scope, Testing
•Literature Review
Chapter 3
• Introduction •Thermal Management Powertrain, Thermal Management Climate, Cooling System
•Cooling system
•Electrical Archetecture
Chapter 4
•simple and comlex systems, Comparason between tradational FMEA and OO-FMEA
•Implementation of OO-FMEA
•Recommendations
•Survey
Chapter 5
•Results
Chapter 6
•Conclusion
•Futrure Work
4
2 Traditional FMEA
2.1 FMEA It is a tool for risk assessment, a function or a systematic process which is used to identify
potential failure modes and their causes, and for the improvement of product reliability [10].
It also evaluates the effects of the failure or errors in the system and provides the information
of the system about the capabilities and limitations of the system. It helps to mitigate or
minimize the risks related to the failure modes. Under given conditions “Failure” is defined as
the loss of envisioned function and the way it occurs is termed as “Failure Mode”. The
penalties as a result of the Failure are termed as “Failure Effects” [11] .
One advantage of FMEA to start early is that, it makes it possible to understand any
requirements for the project and these requirements are added in the product before it is
finalized (Earlier it is, the better it is). The basic objective and purpose of FMEA is to help in
developing a system which is without or very much reduced potential failures or errors and
the system which can tolerate the failures and faults in any given circumstances and
conditions. Aside from those the focus is not only to develop a fault tolerant system but also
to allow the faults or errors to be corrected to some extents when they occur and it must not
affect the system or its performance. In any automotive system, all the basic and general
systems and sub systems are involved and are taken under study for the development of a
more robust system which can cope with any problems and failures the system may face.
Each and every minor detail is taken under consideration during the FMEA process, only then
can a system be more efficient [8]. The actions against the failures and errors are taken
according the standards set by the organization and for the required quality of the product.
Any system which has to perform in an environment where it has more chances of facing the
errors and failures, for those areas the system made is more robust and efficient enough that
it could face any challenge and any problem. Even if the problem occurs, the system should
have the ability and capability to cope with it. Such system to be made the FMEA is a tool to
be used in the design phase so that the errors and problems, which the end product may face
in future, should be eliminated in the design phase which is more time, money and energy
efficient [12].
2.1.1 FMEA Standards
There are some standards on which FMEA is carried out and those are important to mention.
These standards provide the basic structure and manner in which FMEA is to be carried out
in matter of severity, detection and occurrence. Various industries have established their own
standards, such as Aerospace and Defense companies follow MIL-STD-1629A. Automotive
industries usually follow SAEJ_1739 or AIAG (Automotive Industry Action Group) which is
basically the combination of different standards which includes SAE J2886. International
Electro-technical Commission adopts IEC 60812 [8].
5
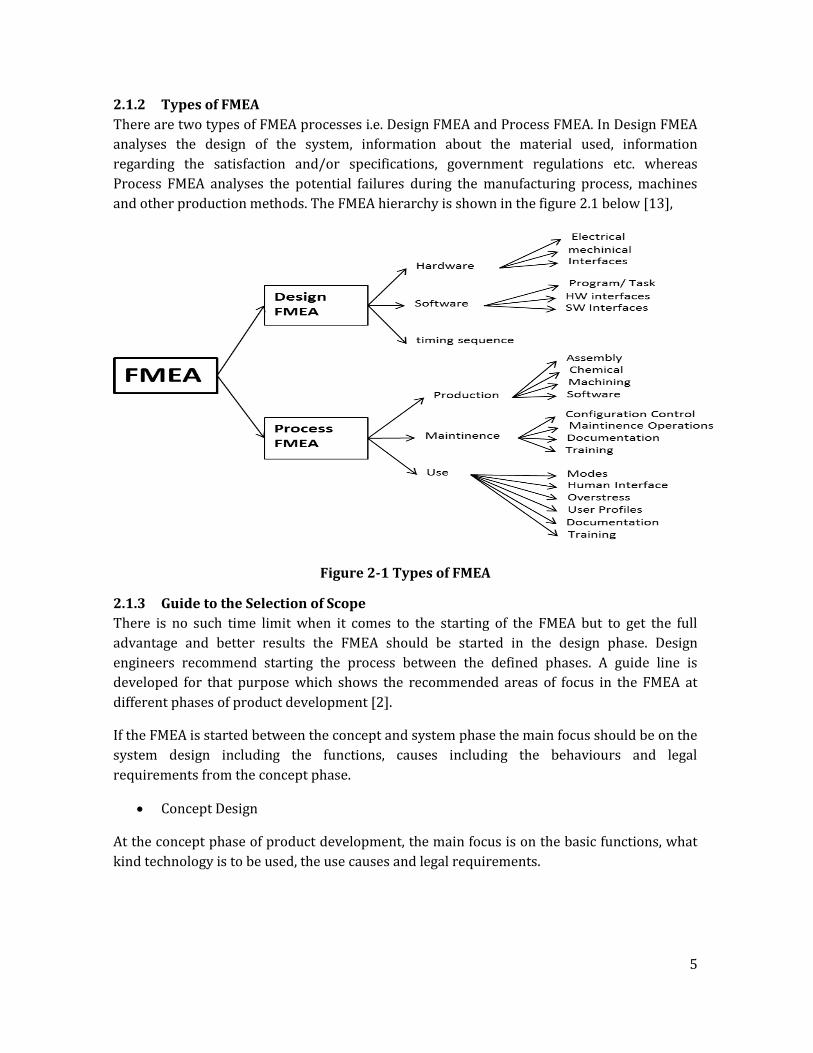
2.1.2 Types of FMEA
There are two types of FMEA processes i.e. Design FMEA and Process FMEA. In Design FMEA
analyses the design of the system, information about the material used, information
regarding the satisfaction and/or specifications, government regulations etc. whereas
Process FMEA analyses the potential failures during the manufacturing process, machines
and other production methods. The FMEA hierarchy is shown in the figure 2.1 below [13],
Figure 2-1 Types of FMEA
2.1.3 Guide to the Selection of Scope
There is no such time limit when it comes to the starting of the FMEA but to get the full
advantage and better results the FMEA should be started in the design phase. Design
engineers recommend starting the process between the defined phases. A guide line is
developed for that purpose which shows the recommended areas of focus in the FMEA at
different phases of product development [2].
If the FMEA is started between the concept and system phase the main focus should be on the
system design including the functions, causes including the behaviours and legal
requirements from the concept phase.
Concept Design
At the concept phase of product development, the main focus is on the basic functions, what
kind technology is to be used, the use causes and legal requirements.
6
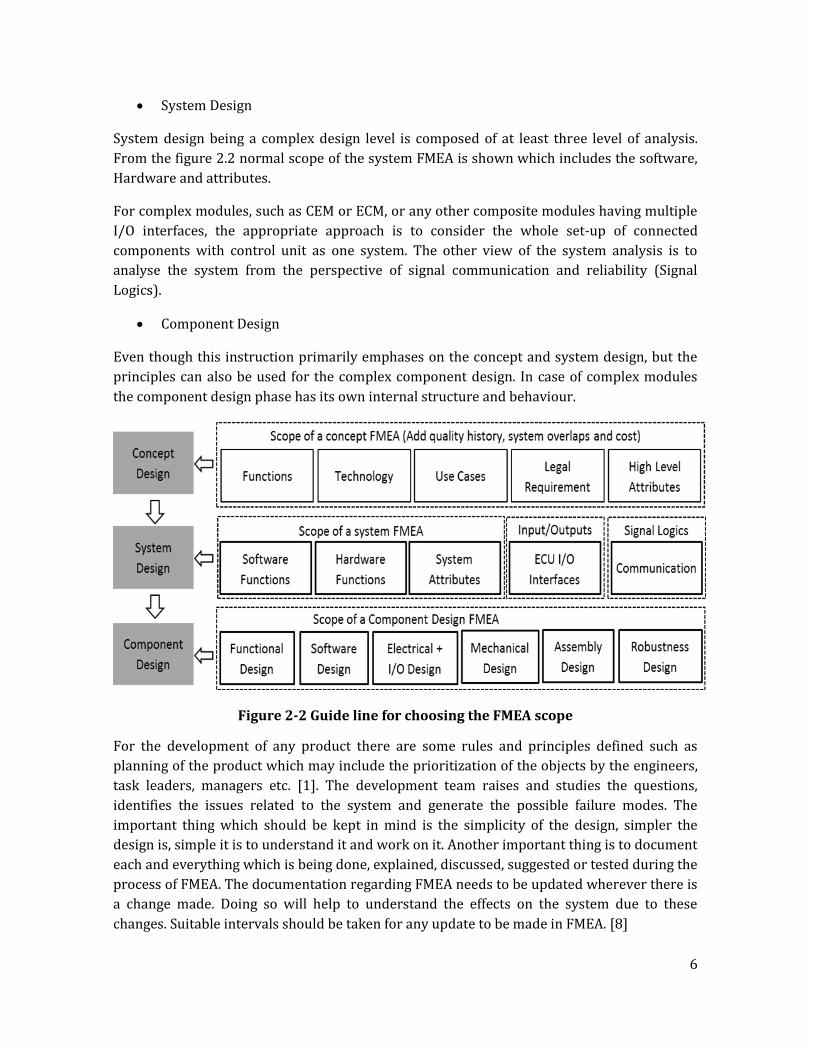
System Design
System design being a complex design level is composed of at least three level of analysis.
From the figure 2.2 normal scope of the system FMEA is shown which includes the software,
Hardware and attributes.
For complex modules, such as CEM or ECM, or any other composite modules having multiple
I/O interfaces, the appropriate approach is to consider the whole set-up of connected
components with control unit as one system. The other view of the system analysis is to
analyse the system from the perspective of signal communication and reliability (Signal
Logics).
Component Design
Even though this instruction primarily emphases on the concept and system design, but the
principles can also be used for the complex component design. In case of complex modules
the component design phase has its own internal structure and behaviour.
Figure 2-2 Guide line for choosing the FMEA scope
For the development of any product there are some rules and principles defined such as
planning of the product which may include the prioritization of the objects by the engineers,
task leaders, managers etc. [1]. The development team raises and studies the questions,
identifies the issues related to the system and generate the possible failure modes. The
important thing which should be kept in mind is the simplicity of the design, simpler the
design is, simple it is to understand it and work on it. Another important thing is to document
each and everything which is being done, explained, discussed, suggested or tested during the
process of FMEA. The documentation regarding FMEA needs to be updated wherever there is
a change made. Doing so will help to understand the effects on the system due to these
changes. Suitable intervals should be taken for any update to be made in FMEA. [8]
7
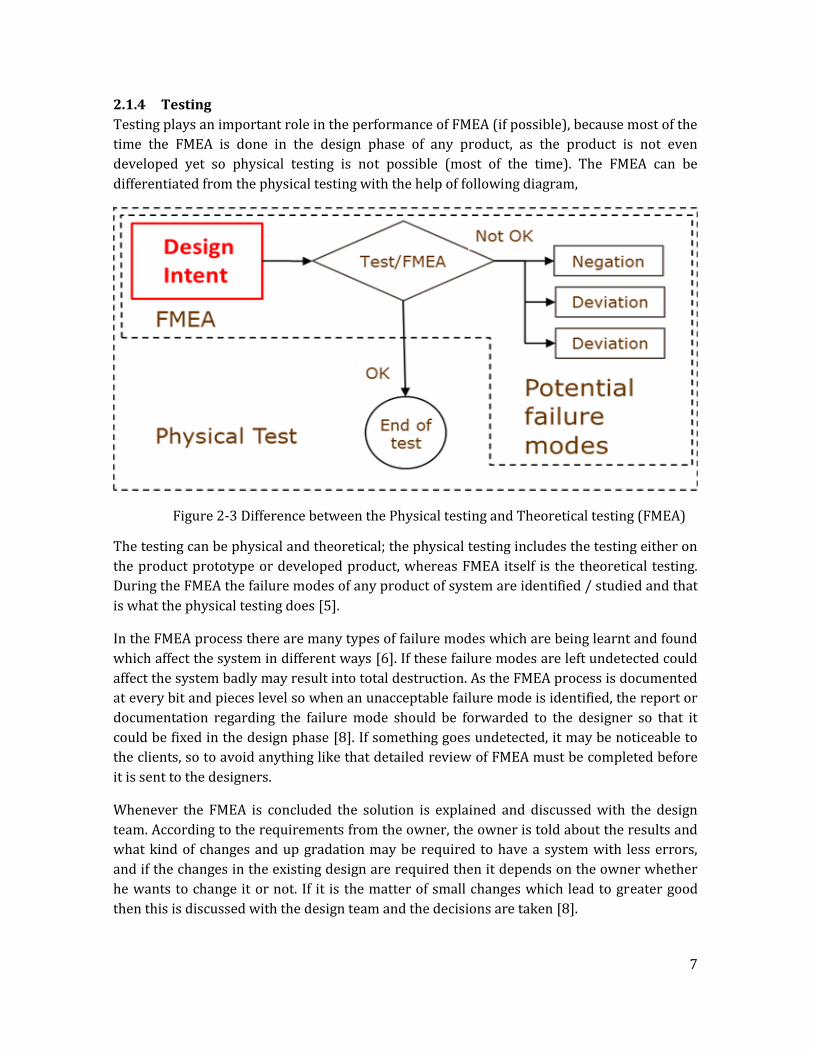
2.1.4 Testing
Testing plays an important role in the performance of FMEA (if possible), because most of the
time the FMEA is done in the design phase of any product, as the product is not even
developed yet so physical testing is not possible (most of the time). The FMEA can be
differentiated from the physical testing with the help of following diagram,
Figure 2-3 Difference between the Physical testing and Theoretical testing (FMEA)
The testing can be physical and theoretical; the physical testing includes the testing either on
the product prototype or developed product, whereas FMEA itself is the theoretical testing.
During the FMEA the failure modes of any product of system are identified / studied and that
is what the physical testing does [5].
In the FMEA process there are many types of failure modes which are being learnt and found
which affect the system in different ways [6]. If these failure modes are left undetected could
affect the system badly may result into total destruction. As the FMEA process is documented
at every bit and pieces level so when an unacceptable failure mode is identified, the report or
documentation regarding the failure mode should be forwarded to the designer so that it
could be fixed in the design phase [8]. If something goes undetected, it may be noticeable to
the clients, so to avoid anything like that detailed review of FMEA must be completed before
it is sent to the designers.
Whenever the FMEA is concluded the solution is explained and discussed with the design
team. According to the requirements from the owner, the owner is told about the results and
what kind of changes and up gradation may be required to have a system with less errors,
and if the changes in the existing design are required then it depends on the owner whether
he wants to change it or not. If it is the matter of small changes which lead to greater good
then this is discussed with the design team and the decisions are taken [8].
8
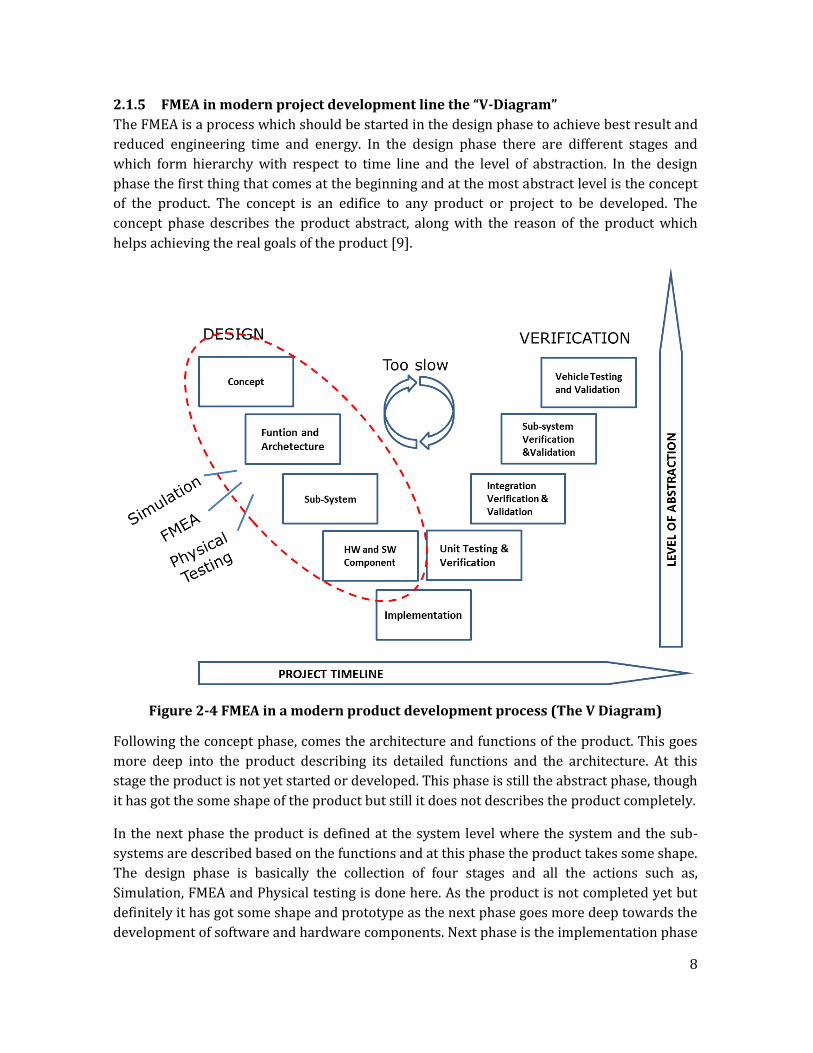
2.1.5 FMEA in modern project development line the “V-Diagram”
The FMEA is a process which should be started in the design phase to achieve best result and
reduced engineering time and energy. In the design phase there are different stages and
which form hierarchy with respect to time line and the level of abstraction. In the design
phase the first thing that comes at the beginning and at the most abstract level is the concept
of the product. The concept is an edifice to any product or project to be developed. The
concept phase describes the product abstract, along with the reason of the product which
helps achieving the real goals of the product [9].
Figure 2-4 FMEA in a modern product development process (The V Diagram)
Following the concept phase, comes the architecture and functions of the product. This goes
more deep into the product describing its detailed functions and the architecture. At this
stage the product is not yet started or developed. This phase is still the abstract phase, though
it has got the some shape of the product but still it does not describes the product completely.
In the next phase the product is defined at the system level where the system and the sub-
systems are described based on the functions and at this phase the product takes some shape.
The design phase is basically the collection of four stages and all the actions such as,
Simulation, FMEA and Physical testing is done here. As the product is not completed yet but
definitely it has got some shape and prototype as the next phase goes more deep towards the
development of software and hardware components. Next phase is the implementation phase
9
in which the implementation of the products is done. In this phase all the previous knowledge
data is used to shape the product. From the implementation phase the level of abstraction
rises as the project timeline proceeds towards completion.
2.2 Literature Review Since the start of FMEA there has been a lot of research on the making the FMEA process
more efficient and for that much research is carried out. Though traditional FMEA has its
history and have been useful but still there are always some flaws and room for up gradation.
OO-FMEA is a 5 step method which insists on the system structure or boundary, the
interactions and interface between the design intents and the prioritization of the objects.
These are the steps which make OO-FMEA more robust and efficient. Methodologies of FMEA
are discussed which shows some of the drawbacks
1. As a survey method FMEA most of the times is very useful to identify the major failure
modes of any system. FMEA is a useful tool but this very tool is not able to cope with
the complex system and to determine complex failure modes which involve the
multiple failure modes and failure in the subsystems due to the absence of interaction
and interface. It is also not very good with the estimation of the reliability of the
product [12].
2. Nematollah Bidokhti (2009) highlights the incompleteness of FMEA and represents
the steps and methodology that is required to be followed before and/after FMEA to
take its full advantage. According to him there are some requirements which
important for a system to robust. These requirements include reliability, availability,
detectability, isolation and fault coverage. Fault management architecture of any
product is of great importance so when it comes to next generation of pre-existing
product the fault management architecture is addressed but it will be very
challenging if the product initially did not have built in fault management because
then it will require an overly architecture. For new products fault management
architecture must be built to avoid problems later on.
First step includes the utilization of the information provided by the customer and
marketing team to develop the requirements. In second step it is made important to
work with engineering, architecture and design teams to make sure that the key
elements are identified also incorporate these in hardware and software architecture.
Third step: Creation of failure modes classification and execution of FMEA. Having a
comprehensive list of hardware and software failure modes is critical to the success
of a reliable design. Depending on the types and levels of the FMEA, there is already
taxonomy that addresses the hardware failure modes. Fourth step: the
implementation of Fault Insertion Test (FIT) and use FMEA as FIT test plan. [7]
3. According to Milena Krasich (2007) criticize FMEA, that this approach cannot be
considered a standalone approach in a reliability program.
Traditional FMEA treats each and every failure mode independently. So when the
analyzing reliability of a failure mode is concerned, FMEA is not efficient. Either FMEA
has to address all the components else the quantification of probability of failures of
10
entire product is not likely to be. Due to the lack of knowledge about the interactions
and interface between the objects as a result this method of analysis is good for some
improvements but not to discover the expected failure mode in product for a
particular failure mode.
The inputs for FMEA include the electrical and/or mechanical engineering analysis
along with the failure rates and failure probability of the under study system which
helps understand the severity level of the failure modes. Study of reliability test
design, testing and data analysis of the system. These studies lead to the outputs in
the form of archives of the failure modes found suggestion regarding the required and
taken actions and what are the measures taken to reduce the failure modes.
FEMA treats each failure mode as independent which does not show its relations or
dependencies over the others, and because of this FMEA cannot produce trustworthy
information regarding the product reliability. (this problem is taken care in OO-FMEA
due to the identification of interfaces and interactions)
If FMEA only addresses some of the components and their failure modes, the behavior
of the entire system cannot be understood and the analysis can never be considered
complete for the entire system. This is due to FMEA procedure as it treats every
failure mode independently which does not show its relation or affect over the others.
(again this is taken care of OO-FMEA which the prioritization is done based on the
interactions and interfaces). [10]
4. Software development using Unified Modelling Language (UML) mostly provides
products that deliver more transparent overview of the system. Eradication of
failures of single output is not agreeable as it may miss many conditions in which a
single programming error affects multiple variables. These are some of the basic
reasons which require the generation of software FMEA. It helps much as the FMEA
generated in response to this helps in validation and verification. UML can be of great
assistance as it helps to look deep into all forms of dependability analysis of methods
(Behaviors) in the system which are completely characterized. Verification and
Validation is no doubt a costly process and software based FMEA can help by
highlighting the objects having high level of severity, so that those objects should only
be focused with a confidence that it would eradicate the failure modes. As far as the
question of missing links or data is concerned detection level can help defining the
attention level.
Implementation of FMEA in concept phase is much better as the highlighted
weaknesses can still be corrected without the documentation which is required if the
implementation is done in later phases. Computer generated FMEA can benefit much
even if it is incomplete. In this approach a use case diagram is used with a role
assignment. Role assignment is a software construct. Wherever components are
automatically switched from active to standby status role assignment is confronted.
The use case diagram is usually the first item created in UML-based development
whereas the stick figures are called “actors” and are not necessarily persons, could be
a control system.

11
UML development tools such as Rational Rose™ and Rhapsody™ could be of great help
in conducting the analysis with reduced efforts. The Use Case Diagram could be
generated by these tools which also store the structural information and properties as
part of their database with the help of which the program for computer aided FMEA
can be recovered. During the implementation phase higher degree of integration
between FMEA generation and UML tools are achieved.
In this phase FMEA is done on the system and decisions are made on the basis of the
findings (Failure modes). In this phase the Identification Number (ID) is assigned in a
manner of aa.bb.cc.dd and these are configuration items. Based on the nomenclature
failure modes are identified by the letter such as “s” for stop or “I” for incorrect result
or by numeric suffixes.
There are listed over 20 different types of failure modes based on their types e.g.
hang, stop, missing data, incorrect data or wrong data etc. these are necessary for
software FMEA as there can by a verity of failure modes.
Milena Krasich (2007) criticize FMEA that traditional FMEA treats every failure mode
independently due to which its relation and dependencies over the others is not clear in other
words the combination of failures are captured as a single failure. So its affects cannot be
studied and thus traditional FMEA cannot produce reliable information regarding the product
reliability. If FMEA addresses some of the components and their failure modes, the behavior
of entire system cannot be understood and analysis can never be considered complete.
Nematollah Bidokhti (2009) highlights the imperfection of FMEA and suggests that alone
FMEA is not good enough to handle complex system, and some steps and methodologies are
required to be followed before and/or after to take full its advantage. Katarína RIPLOVÁ
(2007) highlights that FMEA is a useful approach but it is not very useful when it comes to
complex systems. FMEA is not able to notice complex failure modes at multiple levels of
details and expected failure intervals of failure modes and for these different other methods
such as Fault Tree Analysis (FTA) are used.
12
3 Thermal Management
3.1 Introduction As the name shows Thermal Management is the high level management system of the thermal
energy in the vehicle. In electrical, mechanical, both or any other systems when some work is
done it give rises to the output and also heat is produced as a byproduct due to friction or
other reasons, which effects the efficiency of the system or damage the system/components
[14]. To overcome this problem or make use of the excessive heat, thermal management
system is used which maintains the temperature where required and also it gives heat where
required in an extraordinary fashion [15]. Also it helps to use the waste heat for any functions
in the vehicle, such as the heat in the winter season is basically the usage of the waste engine
heat which is processed to make it useful though sometimes heaters in the air vents are also
used but it is not a very good idea comparatively. In the Vehicle structure it is used to control
the heating and cooling the actuators, consumers like engine, climate and the hybrid
components like ERAD (Electric Rear Axle Drive), high voltage battery system etc. Due to
organizational dependencies the thermal management is described in the hierarchy shown in
the figure below.
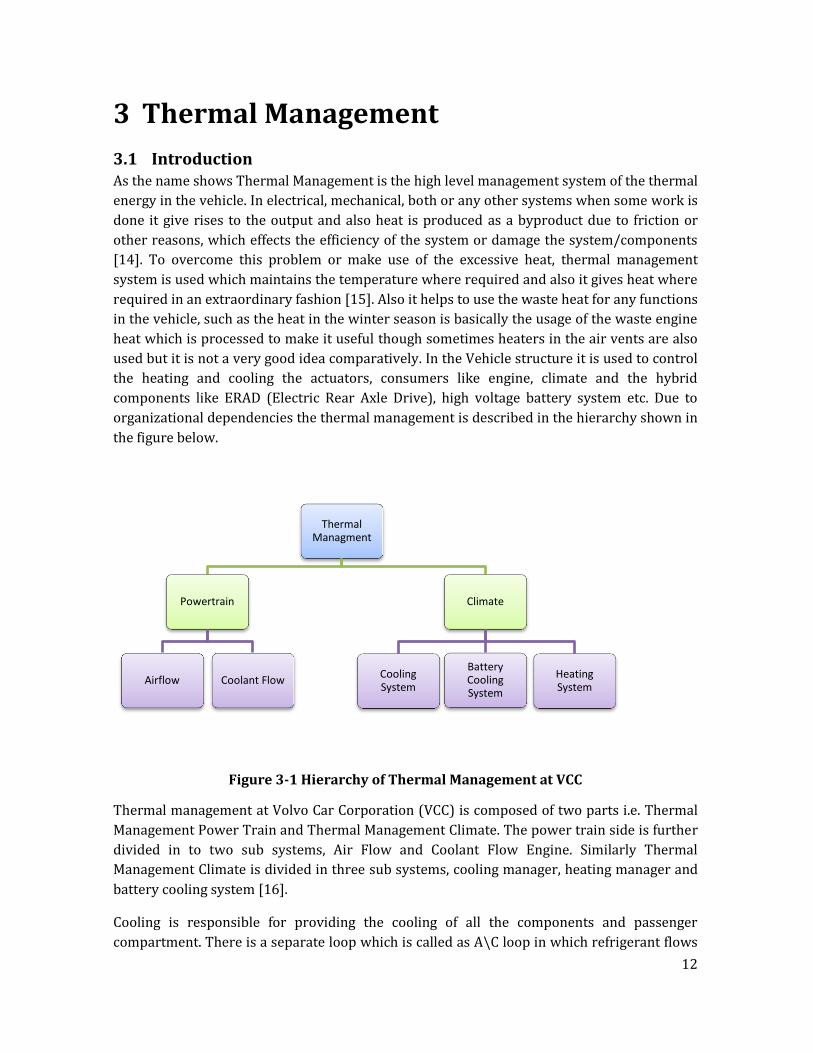
Figure 3-1 Hierarchy of Thermal Management at VCC
Thermal management at Volvo Car Corporation (VCC) is composed of two parts i.e. Thermal
Management Power Train and Thermal Management Climate. The power train side is further
divided in to two sub systems, Air Flow and Coolant Flow Engine. Similarly Thermal
Management Climate is divided in three sub systems, cooling manager, heating manager and
battery cooling system [16].
Cooling is responsible for providing the cooling of all the components and passenger
compartment. There is a separate loop which is called as A\C loop in which refrigerant flows
Thermal Managment
Powertrain
Airflow Coolant Flow
Climate
Cooling System
Battery Cooling System
Heating System
13
and provides cooling (mentioned in cooling module). Battery cooling system though has its
separate coolant loop but when alone coolant flowing in that loop cannot fulfill the
requirements then there is present a chiller in the A\C loop which helps fulfilling the
requirements which is activated with the Chiller Shutoff Valve being activated by the Climate
System Module.
Where in case of heating there are two options, i.e. the management of excessive heat from
engine and in case when the engine is not started yet (preconditioning) the heating is done
with the help of the HVAC heaters.
3.2 Thermal Management Powertrain It is the sub-system of thermal management and is further divided in to Air Flow and Coolant
Flow System.
3.2.1 Air Flow
The air flow system helps the cooling or heating to reach the user. There are different levels
of the flow of air according to request from the user as well as to maintain the climate
comfort. The air flow on the whole is a system which provides the required airflow to the
systems and subsystems. During the high loads on A/C system when more cooling is
required, the condenser might require the airflow to help fulfilling the request. Engine also
require the airflow to help lower down its temperature but it has high current consumption
and noise level, due to which it is only used when it is required to the most or is used in
balance with cooling from coolant flow. There are shutters present to get the outside air
when required and should remain closed to avoid aerodynamic drag. In winter these are
most of the time closed but in summer are open most of the time until vehicle high speed. To
lower down the temperature in electric drive train, the fans are used.
3.2.2 Coolant Flow
The cooling system of the powertrain components in a hybrid vehicle is divided into three
different levels based the temperature limits at which the cooling is required [16].
Low Temperature Cooling Circuit, includes the cooling of the High-Voltage battery
Medium Temperature Cooling Circuit, includes the cooling of ERAD
High Temperature Cooling Circuit, includes cooling of Engine
High Voltage Battery Cooling High voltage battery cooling system comes under the area of low temperature cooling
components, where the maximum specified temperature limit is 32 °C [17].
Components involved in the high voltage cooling system
1. Water pump, Located behind the high-voltage battery
2. Air cooler, located under the floor on the right hand side
3. Expansion tank, located above the right hand wheel housing
4. 3-way valve, which opens for cooling at 32°C
14
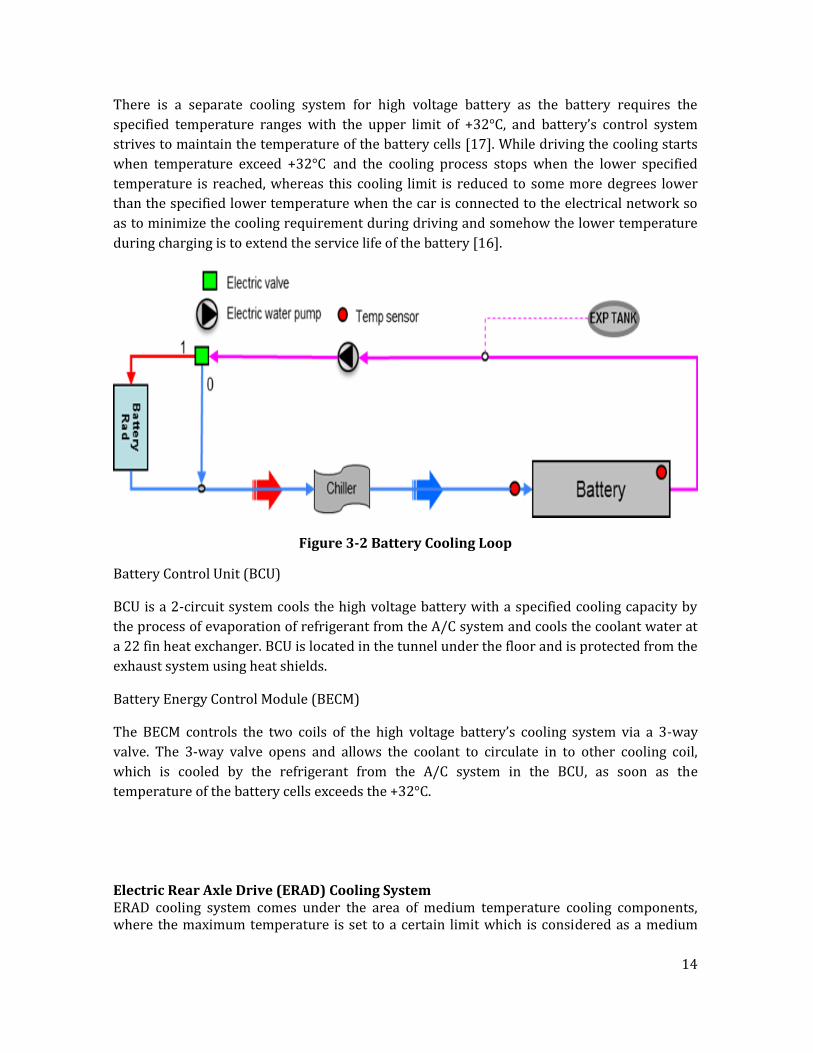
There is a separate cooling system for high voltage battery as the battery requires the
specified temperature ranges with the upper limit of +32°C, and battery’s control system
strives to maintain the temperature of the battery cells [17]. While driving the cooling starts
when temperature exceed +32°C and the cooling process stops when the lower specified
temperature is reached, whereas this cooling limit is reduced to some more degrees lower
than the specified lower temperature when the car is connected to the electrical network so
as to minimize the cooling requirement during driving and somehow the lower temperature
during charging is to extend the service life of the battery [16].
Figure 3-2 Battery Cooling Loop
Battery Control Unit (BCU)
BCU is a 2-circuit system cools the high voltage battery with a specified cooling capacity by
the process of evaporation of refrigerant from the A/C system and cools the coolant water at
a 22 fin heat exchanger. BCU is located in the tunnel under the floor and is protected from the
exhaust system using heat shields.
Battery Energy Control Module (BECM)
The BECM controls the two coils of the high voltage battery’s cooling system via a 3-way
valve. The 3-way valve opens and allows the coolant to circulate in to other cooling coil,
which is cooled by the refrigerant from the A/C system in the BCU, as soon as the
temperature of the battery cells exceeds the +32°C.
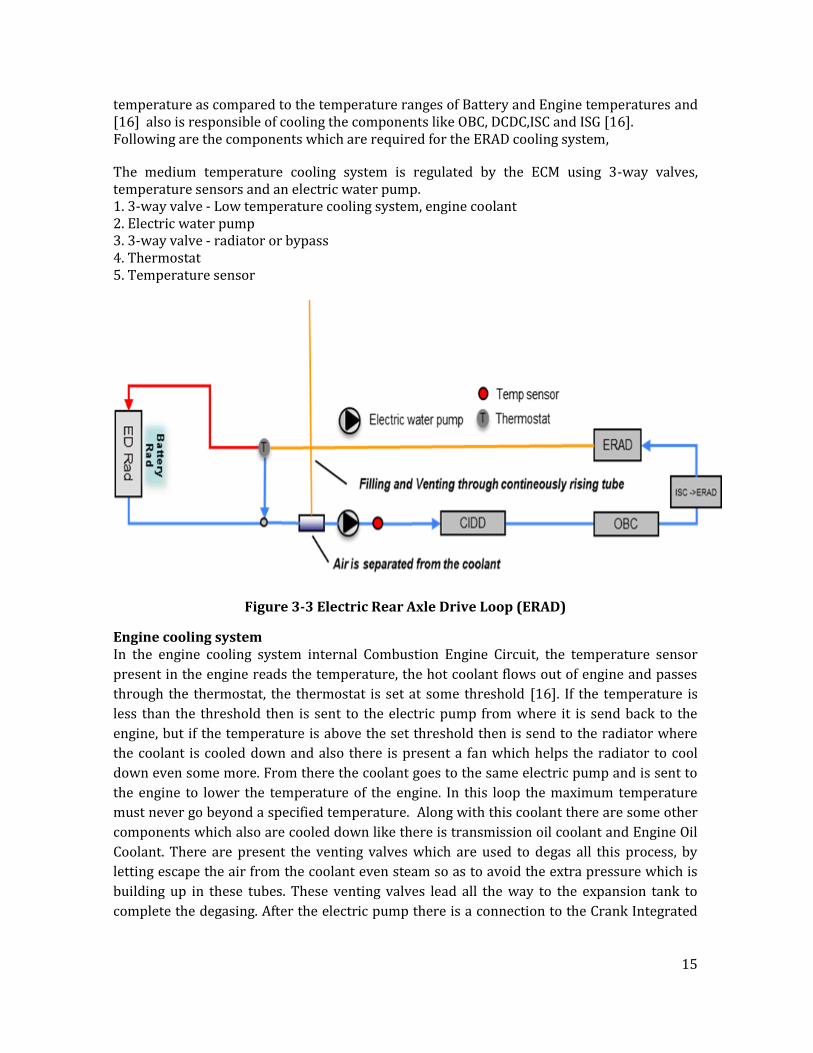
Electric Rear Axle Drive (ERAD) Cooling System ERAD cooling system comes under the area of medium temperature cooling components, where the maximum temperature is set to a certain limit which is considered as a medium
15
temperature as compared to the temperature ranges of Battery and Engine temperatures and [16] also is responsible of cooling the components like OBC, DCDC,ISC and ISG [16]. Following are the components which are required for the ERAD cooling system,
The medium temperature cooling system is regulated by the ECM using 3-way valves, temperature sensors and an electric water pump. 1. 3-way valve - Low temperature cooling system, engine coolant 2. Electric water pump 3. 3-way valve - radiator or bypass 4. Thermostat 5. Temperature sensor
Figure 3-3 Electric Rear Axle Drive Loop (ERAD)
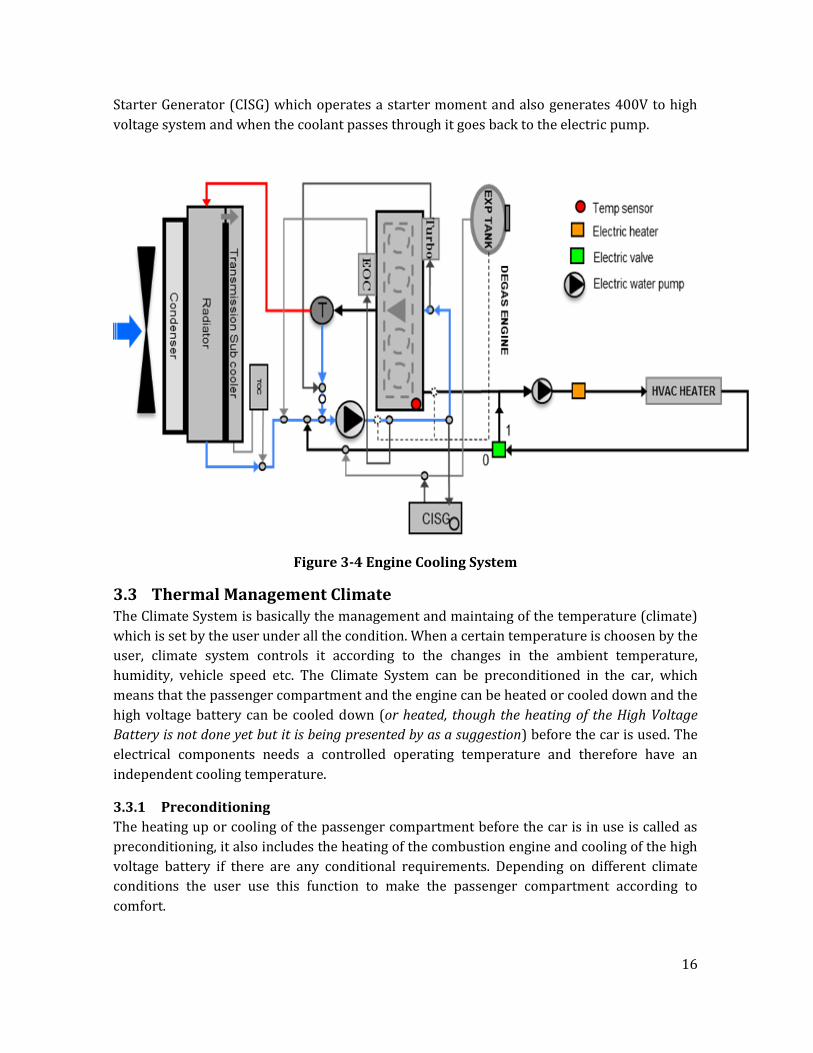
Engine cooling system In the engine cooling system internal Combustion Engine Circuit, the temperature sensor
present in the engine reads the temperature, the hot coolant flows out of engine and passes
through the thermostat, the thermostat is set at some threshold [16]. If the temperature is
less than the threshold then is sent to the electric pump from where it is send back to the
engine, but if the temperature is above the set threshold then is send to the radiator where
the coolant is cooled down and also there is present a fan which helps the radiator to cool
down even some more. From there the coolant goes to the same electric pump and is sent to
the engine to lower the temperature of the engine. In this loop the maximum temperature
must never go beyond a specified temperature. Along with this coolant there are some other
components which also are cooled down like there is transmission oil coolant and Engine Oil
Coolant. There are present the venting valves which are used to degas all this process, by
letting escape the air from the coolant even steam so as to avoid the extra pressure which is
building up in these tubes. These venting valves lead all the way to the expansion tank to
complete the degasing. After the electric pump there is a connection to the Crank Integrated
16
Starter Generator (CISG) which operates a starter moment and also generates 400V to high
voltage system and when the coolant passes through it goes back to the electric pump.
Figure 3-4 Engine Cooling System
3.3 Thermal Management Climate The Climate System is basically the management and maintaing of the temperature (climate)
which is set by the user under all the condition. When a certain temperature is choosen by the
user, climate system controls it according to the changes in the ambient temperature,
humidity, vehicle speed etc. The Climate System can be preconditioned in the car, which
means that the passenger compartment and the engine can be heated or cooled down and the
high voltage battery can be cooled down (or heated, though the heating of the High Voltage
Battery is not done yet but it is being presented by as a suggestion) before the car is used. The
electrical components needs a controlled operating temperature and therefore have an
independent cooling temperature.
3.3.1 Preconditioning
The heating up or cooling of the passenger compartment before the car is in use is called as
preconditioning, it also includes the heating of the combustion engine and cooling of the high
voltage battery if there are any conditional requirements. Depending on different climate
conditions the user use this function to make the passenger compartment according to
comfort.
17
3.3.2 Defroster
The use of Defroster in the vehicles is of great importance. The defroster is a manual function
which is activated by the user manually when the need of it is felt. When the humidity level
reached the dew point and forms the mist on the windscreen then it becomes hard to see
through the windscreen. The driver turns ON the Defroster so that the mist on the
windscreen as well as on the side windows is reduced [2].
3.3.3 Head Level estimation
Head level temperature is the closest temperature to climate comfort (desired temperature)
and its estimation is done in the Climate System. It is calculated based on the data values from
the ambient temperature, sun sensor, speed of vehicle, in Car sensor and evaporator
temperature sensor. Based on these calculations for the head level estimation the climate
comfort is estimated [16].
3.3.4 Steering wheel and Seat Heating
Climate System also includes the seat heating and steering wheel heating but to make the
system more simple it is been included in to component heating and is included in to another
system [16].
3.3.5 Air Conditioning A/C
The A/C system in the hybrid cars is somewhat different from the A/C systems before, as
along with the other requirements the cooing of the high voltage battery coolant via the heat
exchanger BCU. When in pure driving mode the A/C in the passenger compartment is
switched OFF and will be only used if the temperature exceeds the critical limit and battery
needs the cooling [17]. There are three different operating conditions for A/C,
Operating condition 1,Cooling the passenger compartment
Operating condition 2,Cooling the passenger compartment and High-Voltage battery
Operating condition 3, Cooling the High-Voltage Battery
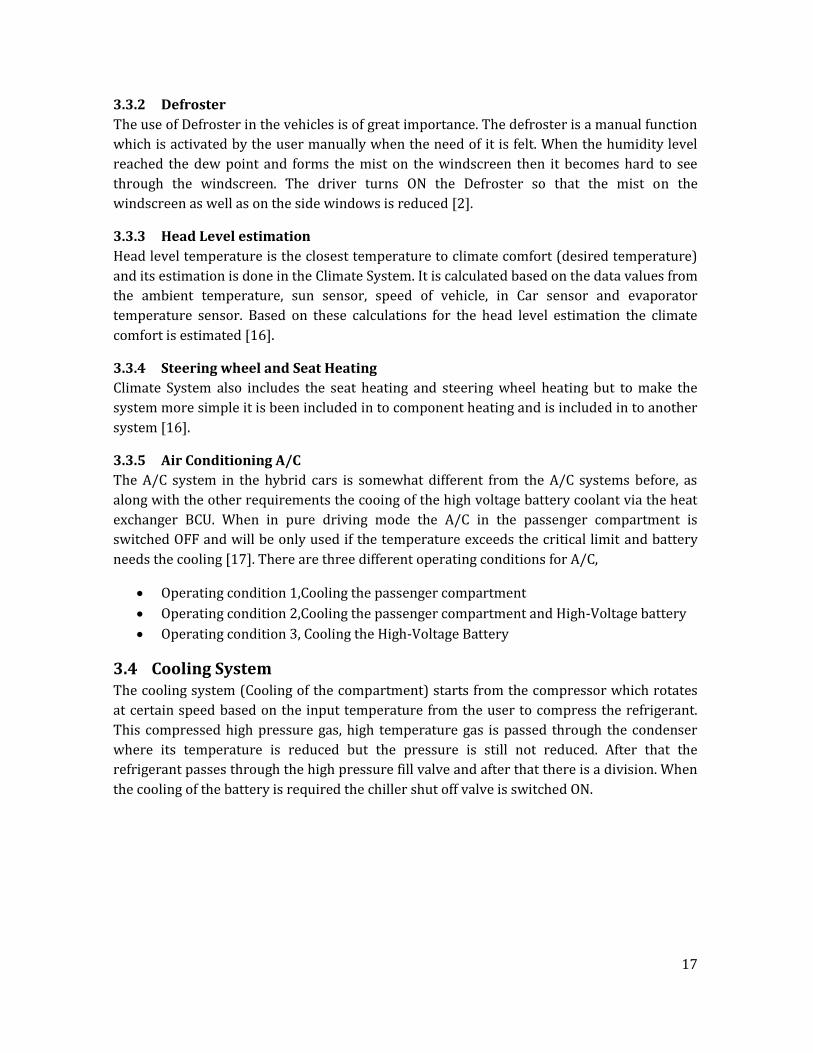
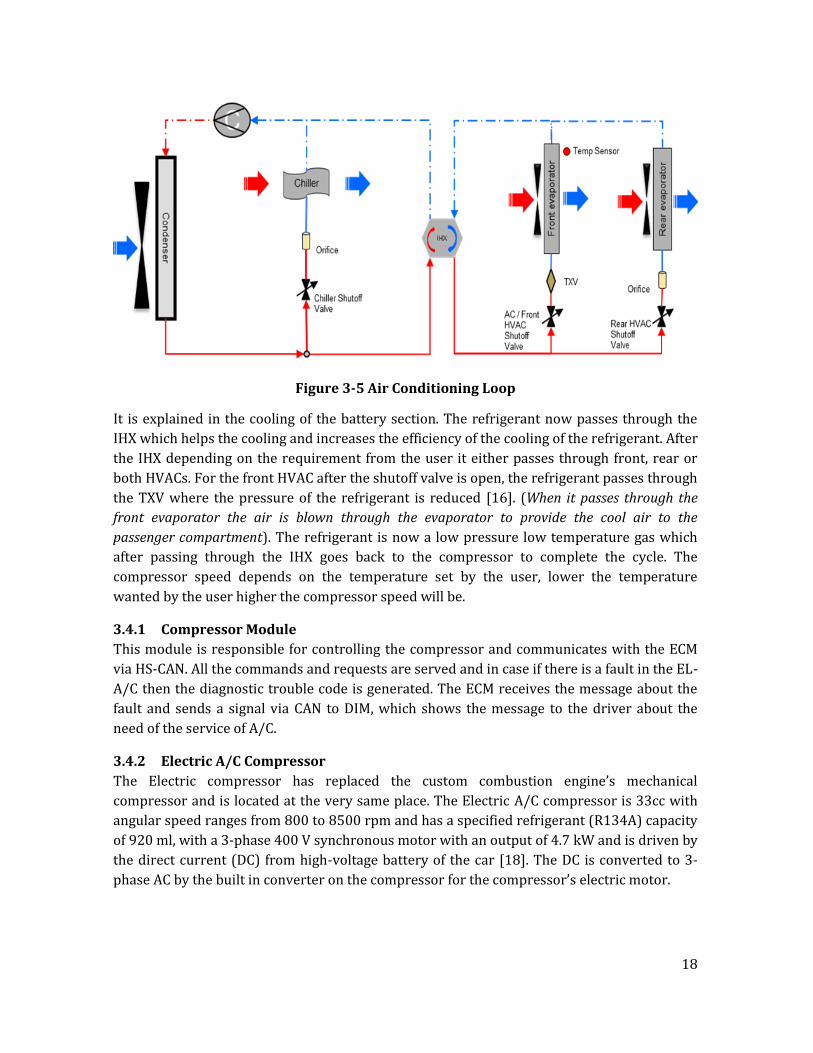
3.4 Cooling System The cooling system (Cooling of the compartment) starts from the compressor which rotates
at certain speed based on the input temperature from the user to compress the refrigerant.
This compressed high pressure gas, high temperature gas is passed through the condenser
where its temperature is reduced but the pressure is still not reduced. After that the
refrigerant passes through the high pressure fill valve and after that there is a division. When
the cooling of the battery is required the chiller shut off valve is switched ON.
18
Figure 3-5 Air Conditioning Loop
It is explained in the cooling of the battery section. The refrigerant now passes through the
IHX which helps the cooling and increases the efficiency of the cooling of the refrigerant. After
the IHX depending on the requirement from the user it either passes through front, rear or
both HVACs. For the front HVAC after the shutoff valve is open, the refrigerant passes through
the TXV where the pressure of the refrigerant is reduced [16]. (When it passes through the
front evaporator the air is blown through the evaporator to provide the cool air to the
passenger compartment). The refrigerant is now a low pressure low temperature gas which
after passing through the IHX goes back to the compressor to complete the cycle. The
compressor speed depends on the temperature set by the user, lower the temperature
wanted by the user higher the compressor speed will be.
3.4.1 Compressor Module
This module is responsible for controlling the compressor and communicates with the ECM
via HS-CAN. All the commands and requests are served and in case if there is a fault in the EL-
A/C then the diagnostic trouble code is generated. The ECM receives the message about the
fault and sends a signal via CAN to DIM, which shows the message to the driver about the
need of the service of A/C.
3.4.2 Electric A/C Compressor
The Electric compressor has replaced the custom combustion engine’s mechanical
compressor and is located at the very same place. The Electric A/C compressor is 33cc with
angular speed ranges from 800 to 8500 rpm and has a specified refrigerant (R134A) capacity
of 920 ml, with a 3-phase 400 V synchronous motor with an output of 4.7 kW and is driven by
the direct current (DC) from high-voltage battery of the car [18]. The DC is converted to 3-
phase AC by the built in converter on the compressor for the compressor’s electric motor.
19
3.5 Battery Cooling System Cooling of the battery is an important job as the certain rise in temperature ends up in
battery being inefficient and lessen of life time. So to get full use of battery the cooling of
battery is important. It is controlled by ECM on the command of which the chiller in the
cooling system loop activates and provides the cooling to the battery as shown in figure 3.2.
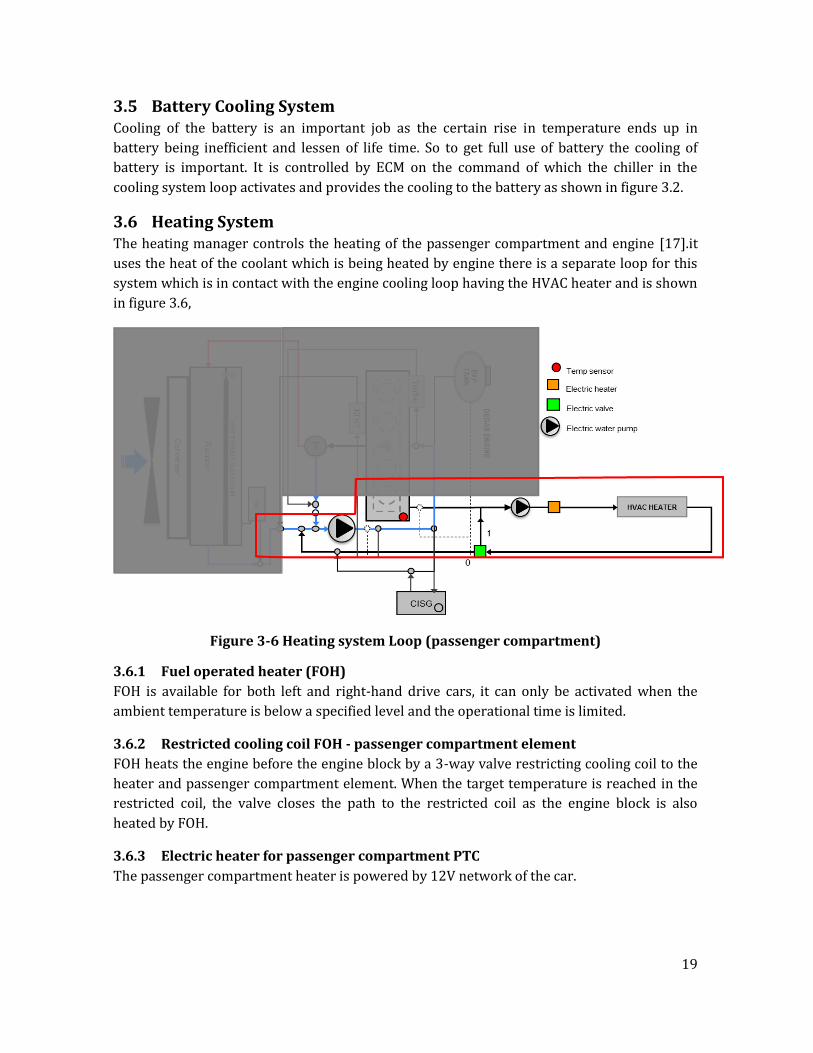
3.6 Heating System The heating manager controls the heating of the passenger compartment and engine [17].it
uses the heat of the coolant which is being heated by engine there is a separate loop for this
system which is in contact with the engine cooling loop having the HVAC heater and is shown
in figure 3.6,
Figure 3-6 Heating system Loop (passenger compartment)
3.6.1 Fuel operated heater (FOH)
FOH is available for both left and right-hand drive cars, it can only be activated when the
ambient temperature is below a specified level and the operational time is limited.
3.6.2 Restricted cooling coil FOH - passenger compartment element
FOH heats the engine before the engine block by a 3-way valve restricting cooling coil to the
heater and passenger compartment element. When the target temperature is reached in the
restricted coil, the valve closes the path to the restricted coil as the engine block is also
heated by FOH.
3.6.3 Electric heater for passenger compartment PTC
The passenger compartment heater is powered by 12V network of the car.
20
3.6.4 Electric Engine Heater (optional)
This heater is powered by the current from the electrical network and is supplied via OBC
which is controlled from the preconditioning settings.
3.7 Climate Comfort in Hybrid Electric Vehicles The very first hybrid vehicle was introduced in market was in 1997 and after effort of more
than 10 years, Hybrid vehicles have made in to 1% of the global market. Hybrid vehicles are
powered by petrol, diesel and electric motor which are regulated by power storage battery.
There is a wide range of different configurations for the hybrid electric vehicle depending
upon the role played and capability of battery and electric motor, which includes Micro
Hybrids, Mild Hybrid, Full Hybrid, Plugin Hybrid (PHEV), Series / Parallel Hybrids and Series-
Parallel Hybrid [19].
3.7.1 Cooling/Heating system
For air conditioning system the conventional belt driven compressor (with the fuel engine) is
used and when the somehow engine is idle then a device called storage evaporator is used for
cooling. In case of full hybrid vehicles, electric compressors are used to fulfil the cooling
needs of passenger compartment. This definitely helps in preconditioning (cooling of
passenger compartment before driving) of the compartment in harsh weather. As far as the
heating of passenger compartment in cold weather is concerned, the waste heat from the
engine is used. Also there are PTC heaters are used for preconditioning.
3.8 Electrical Architecture The electrical systems in Plug-in Hybrid are divided in to high voltage and 12 volts. The high-
voltage section consists of both AC and DC, as battery stores DC whereas motors or
generators work with 3 phase AC. The high voltage section has a voltage between 230 to 400
and is mainly used for hybrid operations and for driving the A/C compressor. For the purpose
of control and signal the high-voltage components are also connected to 12 V circuit.
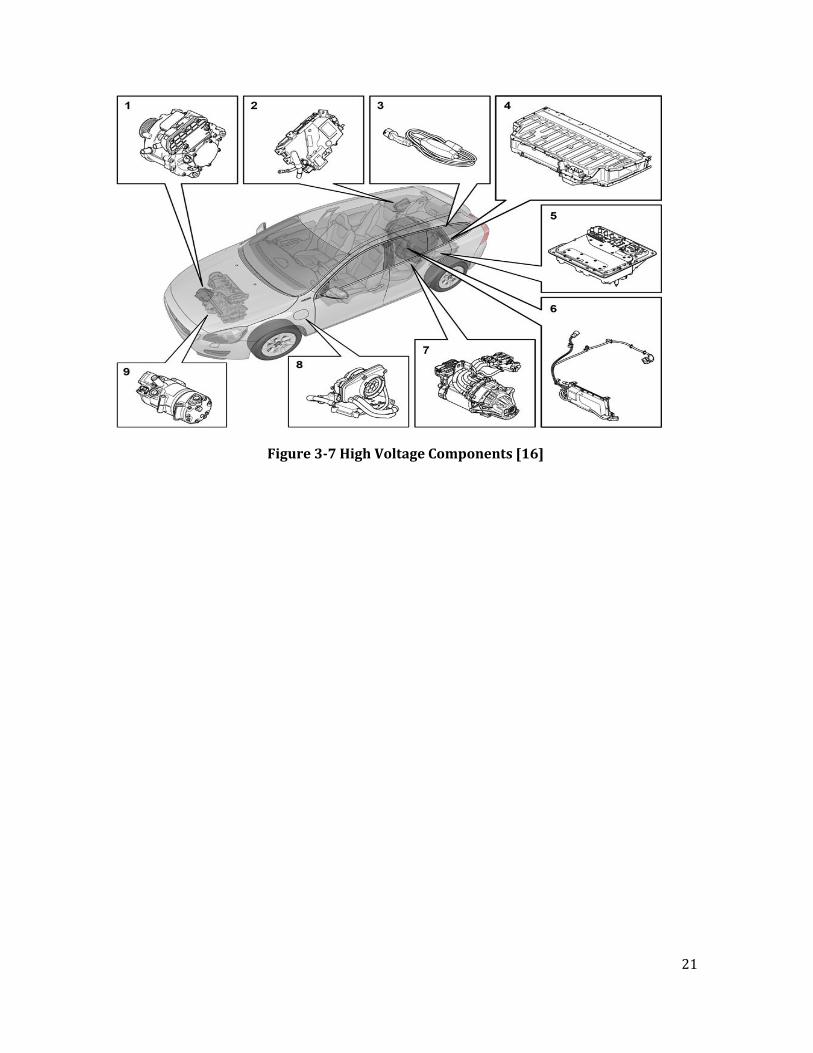
In the figure 3.7; 1 shows the ISG which is used for starting the internal engine and generating
current for high voltage section. Number 2 shows the DCDC, which is a control module for DC
to DC convertor as it converts the high voltage DC to 12V DC. 3 is the charging cable for
setting the charge current. 4 is the High Voltage Battery for driving ERAD during the electric
drive and other High Voltage components. 5 is the ISC which contains two separate voltage
convertors IGM and IEM that convert between the high voltage battery’s direct current and 3
Phase alternating current for the components. 6 shows the OBC is a charger which converts
230V AC mains power to 400V DC for charging the high voltage batter and operating the EL-
A/C and DCDC during mains power recharging. 7 shows the ERAD is a 3 phase AC motor for
electric and hybrid drive mounted directly on the real axel which also works as a generator
with energy recovery during breaking. 8 shows the sharing socket which is a connection for
230V main power and 9 shows the EL-A/C which is an electric A/C compressor.
21
Figure 3-7 High Voltage Components [16]
22
4 OO-FMEA for Climate System
4.1 Introduction OO-FMEA has been developed at Volvo Car Corporation specifically for analyzing complex
automotive systems which are often built within huge electrical architecture where multiple
ECU’s interact and share software and hardware resources. Information transmission
between components and information computation are extensive.
Performing FMEA on these systems is a great challenge because the individual sub-systems
have overlaps and their boundaries are often indistinguishable and FMEA alone is not a good
approach to cope with the complex systems.
The main problem with the complex systems is starting and the ending points, finding of
which is never less of a challenge. This problem is solved with the help of OO-FMEA which
also gives a full control over the targeted areas when prioritization of objects is done. The
prioritization is done based on the communication between the design intents and their
functions. In OO-FMEA logical objects are developed which are good to handle software as it
is a good approach towards the software analysis. All the interactions must be identified
which will help about the priorities of the analysis. OO-FMEA resolves these issues by
applying an approach based on knowledge of complex systems behaviors and application of
object-oriented analysis from the software development practices [2].
The OO-FMEA approach starts by finding simplicities in the complexness in order to master
the system or sub-system under study, by identifying its structure and behavior. The system
structure contains the system elements within an appropriately defined boundary, the
operational environment and the shared resources. The system behaviors, basically the
functional and not functional capabilities, are decomposed into separable physical, logical and
attribute objects. OO-FMEA has been in use at the electrical and electronics systems
engineering department at Volvo Car Corporation since 2006.
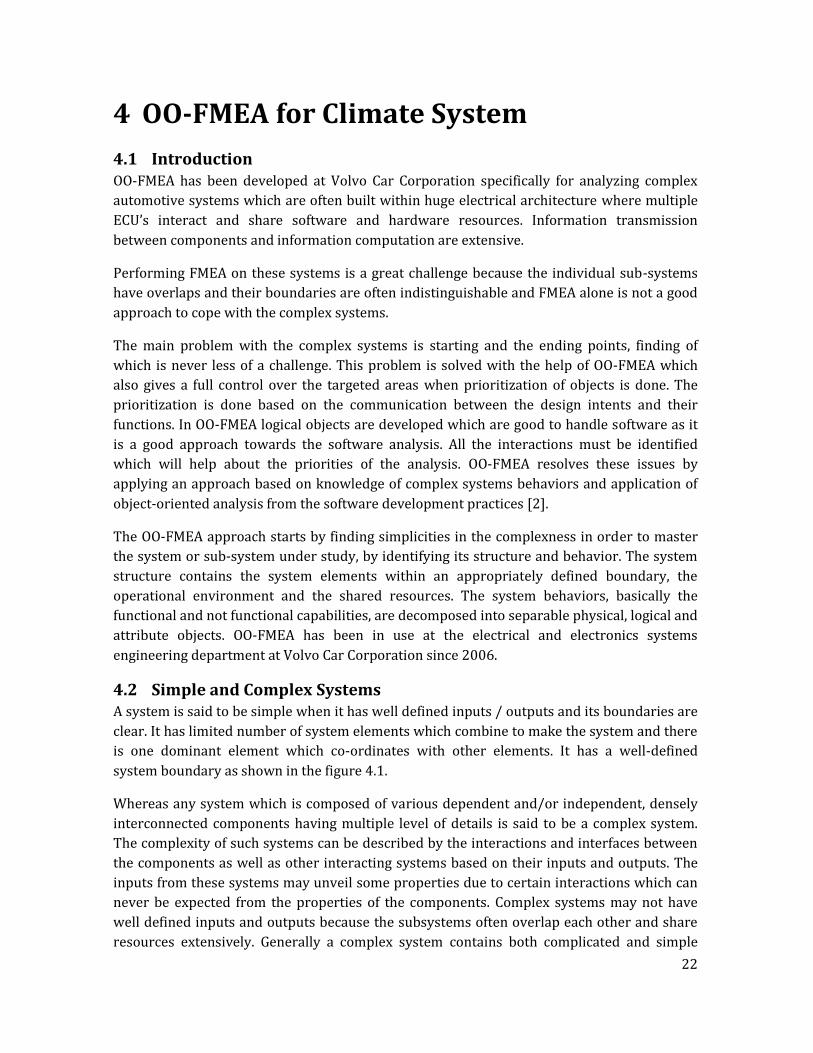
4.2 Simple and Complex Systems A system is said to be simple when it has well defined inputs / outputs and its boundaries are
clear. It has limited number of system elements which combine to make the system and there
is one dominant element which co-ordinates with other elements. It has a well-defined
system boundary as shown in the figure 4.1.
Whereas any system which is composed of various dependent and/or independent, densely
interconnected components having multiple level of details is said to be a complex system.
The complexity of such systems can be described by the interactions and interfaces between
the components as well as other interacting systems based on their inputs and outputs. The
inputs from these systems may unveil some properties due to certain interactions which can
never be expected from the properties of the components. Complex systems may not have
well defined inputs and outputs because the subsystems often overlap each other and share
resources extensively. Generally a complex system contains both complicated and simple
23
elements. The complicated elements perform the varying tasks, whereas simple elements
perform highly repetitive tasks. [20]
Figure 4-1 Example of simple system
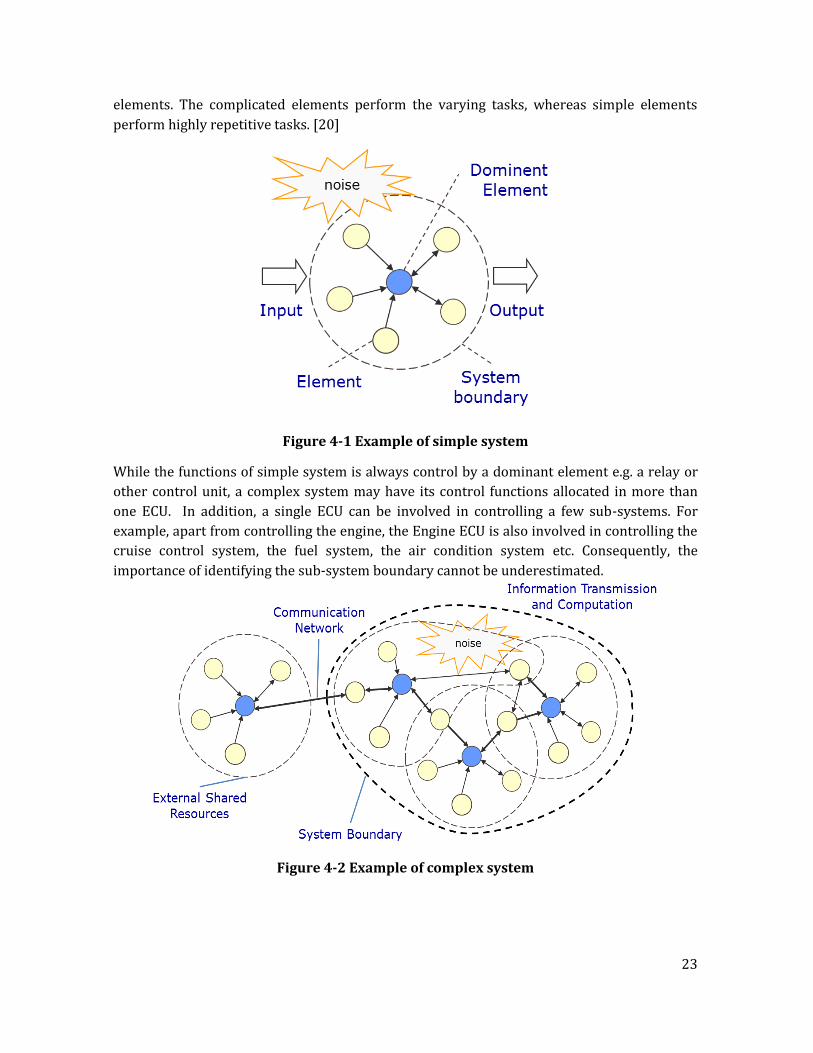
While the functions of simple system is always control by a dominant element e.g. a relay or
other control unit, a complex system may have its control functions allocated in more than
one ECU. In addition, a single ECU can be involved in controlling a few sub-systems. For
example, apart from controlling the engine, the Engine ECU is also involved in controlling the
cruise control system, the fuel system, the air condition system etc. Consequently, the
importance of identifying the sub-system boundary cannot be underestimated.
Figure 4-2 Example of complex system
24
4.3 Sub-system Boundaries Types of Interface
The most significant factor to consider when identifying the sub-system boundary is the
interface of the system element.
Interface is a point at which different elements connect or interact. When identifying a sub-
system boundary in a complex operational environment where multiple systems are
integrated, the nature of interface must be understood. At any interface point, the system
elements assert an effect on each other. The type of interface decides what kind of affect the
elements or the processes have on each other. When a two way effect occurs with a feedback,
the connecting elements in fact interact with each other. This distinction of an interaction to a
simple interface is an important aspect in identifying sub-system boundaries. Since data
transmission is a significant process in complex automotive system, the interfaces can be
categorized according to the method of communication [2].
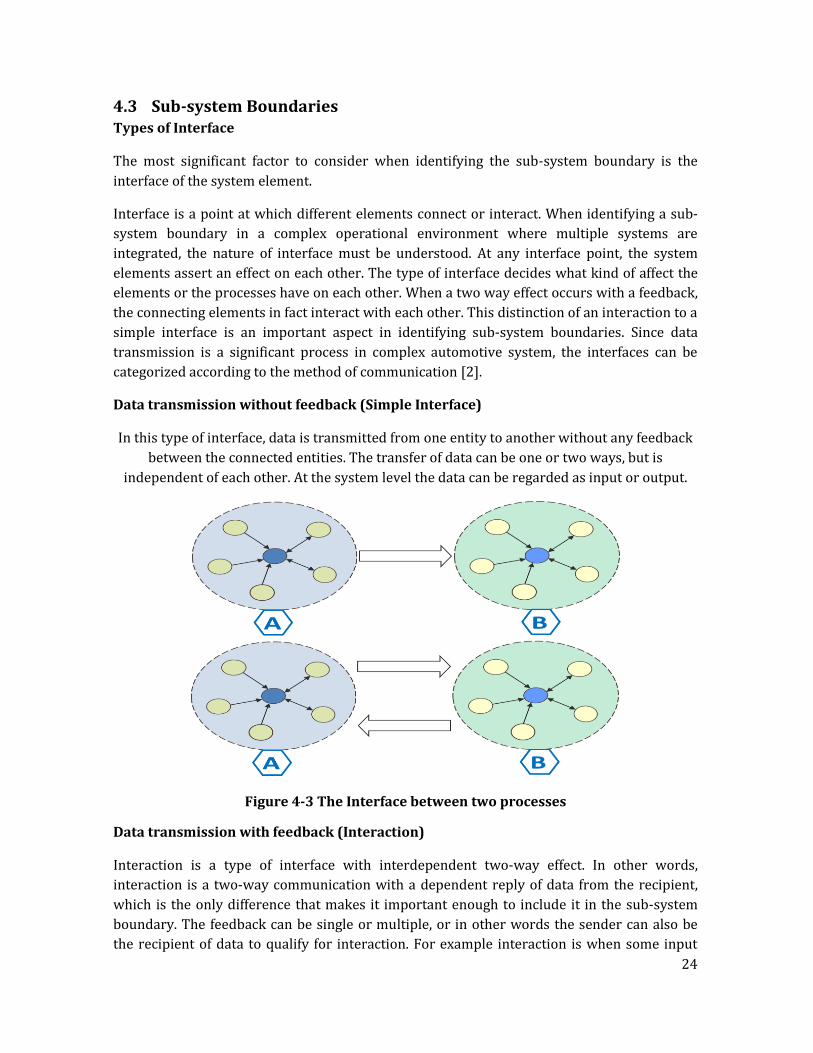
Data transmission without feedback (Simple Interface)
In this type of interface, data is transmitted from one entity to another without any feedback
between the connected entities. The transfer of data can be one or two ways, but is
independent of each other. At the system level the data can be regarded as input or output.
Figure 4-3 The Interface between two processes
Data transmission with feedback (Interaction)
Interaction is a type of interface with interdependent two-way effect. In other words,
interaction is a two-way communication with a dependent reply of data from the recipient,
which is the only difference that makes it important enough to include it in the sub-system
boundary. The feedback can be single or multiple, or in other words the sender can also be
the recipient of data to qualify for interaction. For example interaction is when some input
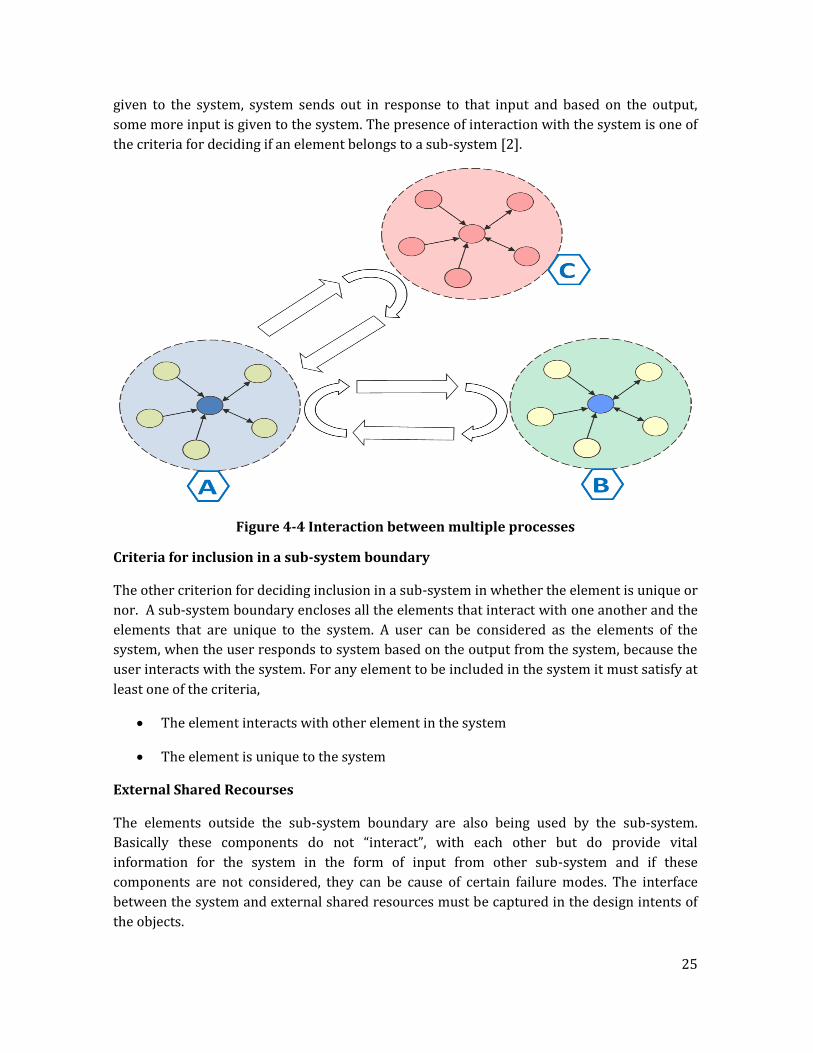
25
given to the system, system sends out in response to that input and based on the output,
some more input is given to the system. The presence of interaction with the system is one of
the criteria for deciding if an element belongs to a sub-system [2].
Figure 4-4 Interaction between multiple processes
Criteria for inclusion in a sub-system boundary
The other criterion for deciding inclusion in a sub-system in whether the element is unique or
nor. A sub-system boundary encloses all the elements that interact with one another and the
elements that are unique to the system. A user can be considered as the elements of the
system, when the user responds to system based on the output from the system, because the
user interacts with the system. For any element to be included in the system it must satisfy at
least one of the criteria,
The element interacts with other element in the system
The element is unique to the system
External Shared Recourses
The elements outside the sub-system boundary are also being used by the sub-system.
Basically these components do not “interact”, with each other but do provide vital
information for the system in the form of input from other sub-system and if these
components are not considered, they can be cause of certain failure modes. The interface
between the system and external shared resources must be captured in the design intents of
the objects.
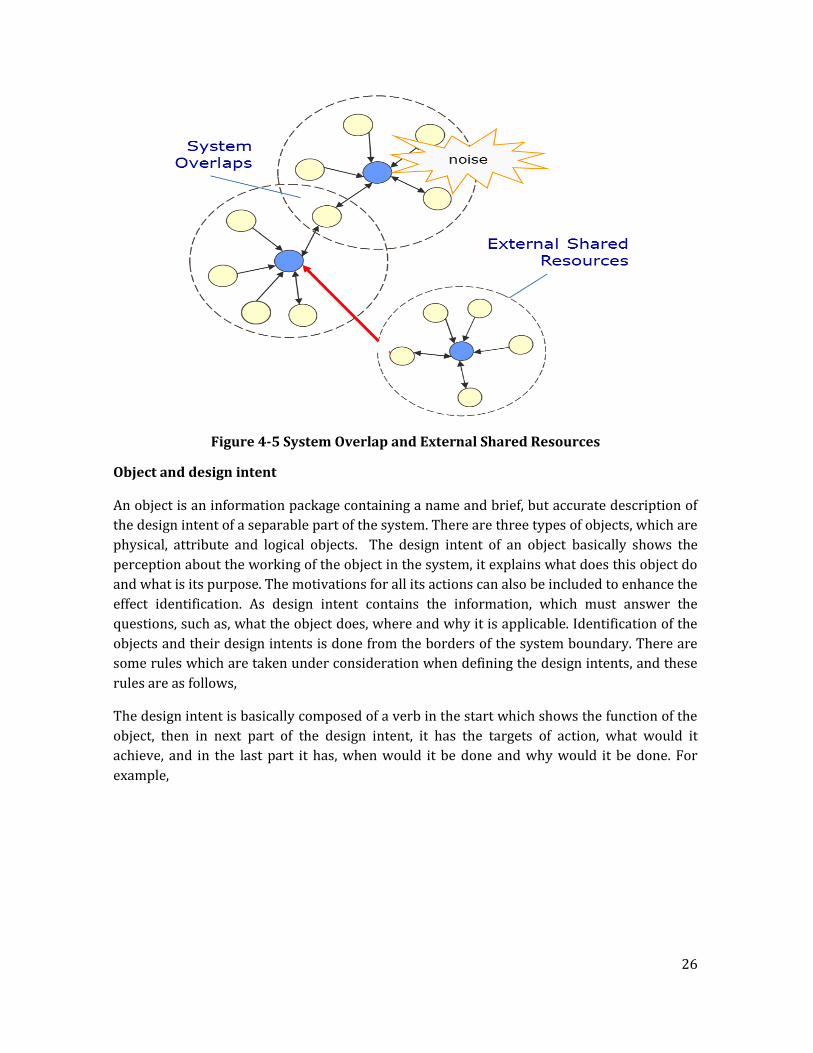
26
Figure 4-5 System Overlap and External Shared Resources
Object and design intent
An object is an information package containing a name and brief, but accurate description of
the design intent of a separable part of the system. There are three types of objects, which are
physical, attribute and logical objects. The design intent of an object basically shows the
perception about the working of the object in the system, it explains what does this object do
and what is its purpose. The motivations for all its actions can also be included to enhance the
effect identification. As design intent contains the information, which must answer the
questions, such as, what the object does, where and why it is applicable. Identification of the
objects and their design intents is done from the borders of the system boundary. There are
some rules which are taken under consideration when defining the design intents, and these
rules are as follows,
The design intent is basically composed of a verb in the start which shows the function of the
object, then in next part of the design intent, it has the targets of action, what would it
achieve, and in the last part it has, when would it be done and why would it be done. For
example,
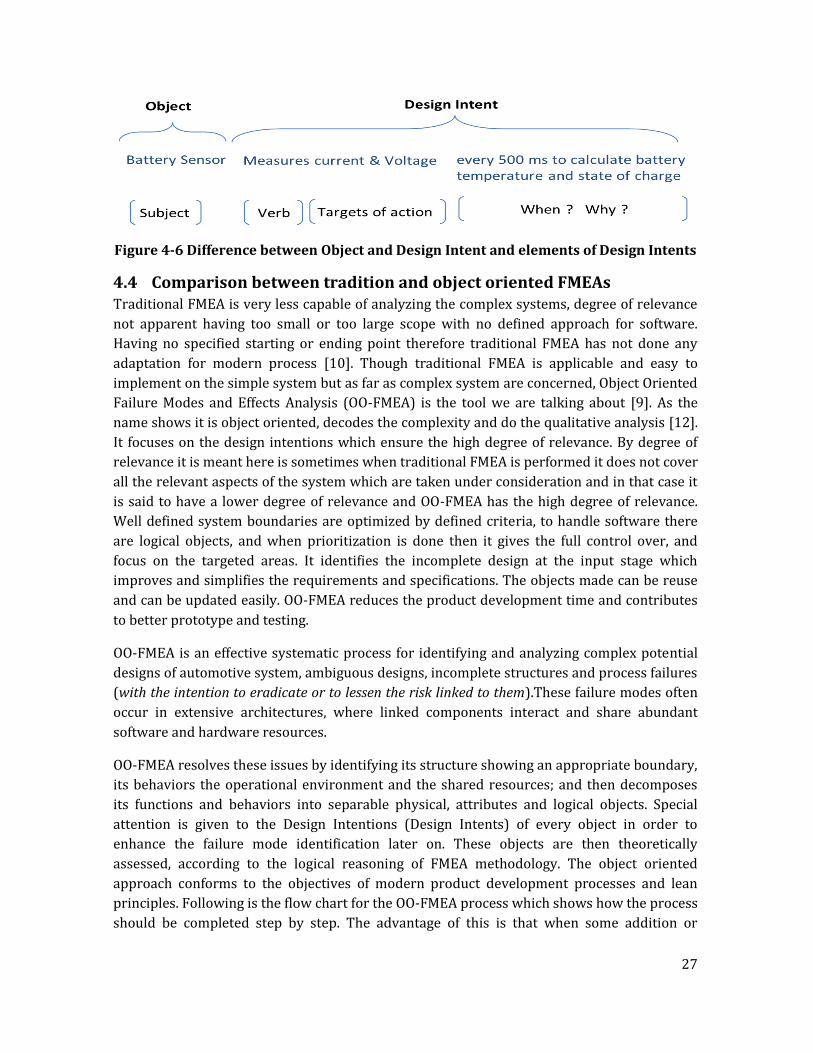
27
Figure 4-6 Difference between Object and Design Intent and elements of Design Intents
4.4 Comparison between tradition and object oriented FMEAs Traditional FMEA is very less capable of analyzing the complex systems, degree of relevance
not apparent having too small or too large scope with no defined approach for software.
Having no specified starting or ending point therefore traditional FMEA has not done any
adaptation for modern process [10]. Though traditional FMEA is applicable and easy to
implement on the simple system but as far as complex system are concerned, Object Oriented
Failure Modes and Effects Analysis (OO-FMEA) is the tool we are talking about [9]. As the
name shows it is object oriented, decodes the complexity and do the qualitative analysis [12].
It focuses on the design intentions which ensure the high degree of relevance. By degree of
relevance it is meant here is sometimes when traditional FMEA is performed it does not cover
all the relevant aspects of the system which are taken under consideration and in that case it
is said to have a lower degree of relevance and OO-FMEA has the high degree of relevance.
Well defined system boundaries are optimized by defined criteria, to handle software there
are logical objects, and when prioritization is done then it gives the full control over, and
focus on the targeted areas. It identifies the incomplete design at the input stage which
improves and simplifies the requirements and specifications. The objects made can be reuse
and can be updated easily. OO-FMEA reduces the product development time and contributes
to better prototype and testing.
OO-FMEA is an effective systematic process for identifying and analyzing complex potential
designs of automotive system, ambiguous designs, incomplete structures and process failures
(with the intention to eradicate or to lessen the risk linked to them).These failure modes often
occur in extensive architectures, where linked components interact and share abundant
software and hardware resources.
OO-FMEA resolves these issues by identifying its structure showing an appropriate boundary,
its behaviors the operational environment and the shared resources; and then decomposes
its functions and behaviors into separable physical, attributes and logical objects. Special
attention is given to the Design Intentions (Design Intents) of every object in order to
enhance the failure mode identification later on. These objects are then theoretically
assessed, according to the logical reasoning of FMEA methodology. The object oriented
approach conforms to the objectives of modern product development processes and lean
principles. Following is the flow chart for the OO-FMEA process which shows how the process
should be completed step by step. The advantage of this is that when some addition or
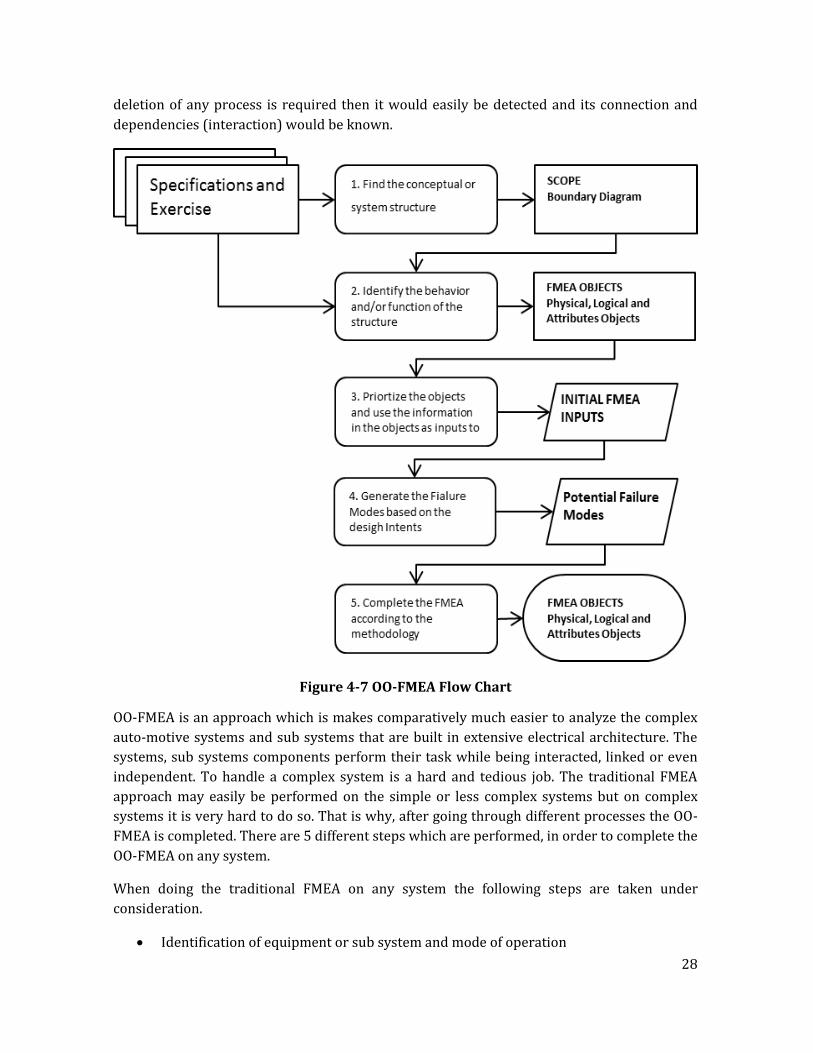
28
deletion of any process is required then it would easily be detected and its connection and
dependencies (interaction) would be known.
Figure 4-7 OO-FMEA Flow Chart
OO-FMEA is an approach which is makes comparatively much easier to analyze the complex
auto-motive systems and sub systems that are built in extensive electrical architecture. The
systems, sub systems components perform their task while being interacted, linked or even
independent. To handle a complex system is a hard and tedious job. The traditional FMEA
approach may easily be performed on the simple or less complex systems but on complex
systems it is very hard to do so. That is why, after going through different processes the OO-
FMEA is completed. There are 5 different steps which are performed, in order to complete the
OO-FMEA on any system.
When doing the traditional FMEA on any system the following steps are taken under
consideration.
Identification of equipment or sub system and mode of operation
29
Identification of potential failure modes and their causes
Evaluation of effects on the system with respect to each failure mode
Identification of the recommendation for reducing or elimination of any error or
Failure Mode
Testing (if possible)
When it comes to the procedure of performance of OO-FMEA on the system the following
procedure are done [9],
Identification or finding of the conceptual system structure and the boundary
Identification of the objects and their behavior
Prioritization of the objects which are to be selected for FMEA process and their
addition in the FMEA template
Generating the failure Modes based on the design Intents
Completion of FMEA according to the FMEA methodology
Though the OO-FMEA process is longer than the Traditional approach but it is very much
useful in certain ways i.e.
OO-FMEA is much more feasible to handle the complex system
It is very much useful in the detection of the incomplete designs
Requirements which are unclear are identified and corrected
Considering the design intents helps finding the interaction and interfaces which
helps in location the system boundary
In OO-FMEA the objects can be reused
It saves a lot of engineering time
It helps to have structure through objects for complex system analysis
The Object Oriented FMEA approach begins and concludes with the requirement description
and specifications in every iterative loop and it is best described in the figure 4.8,
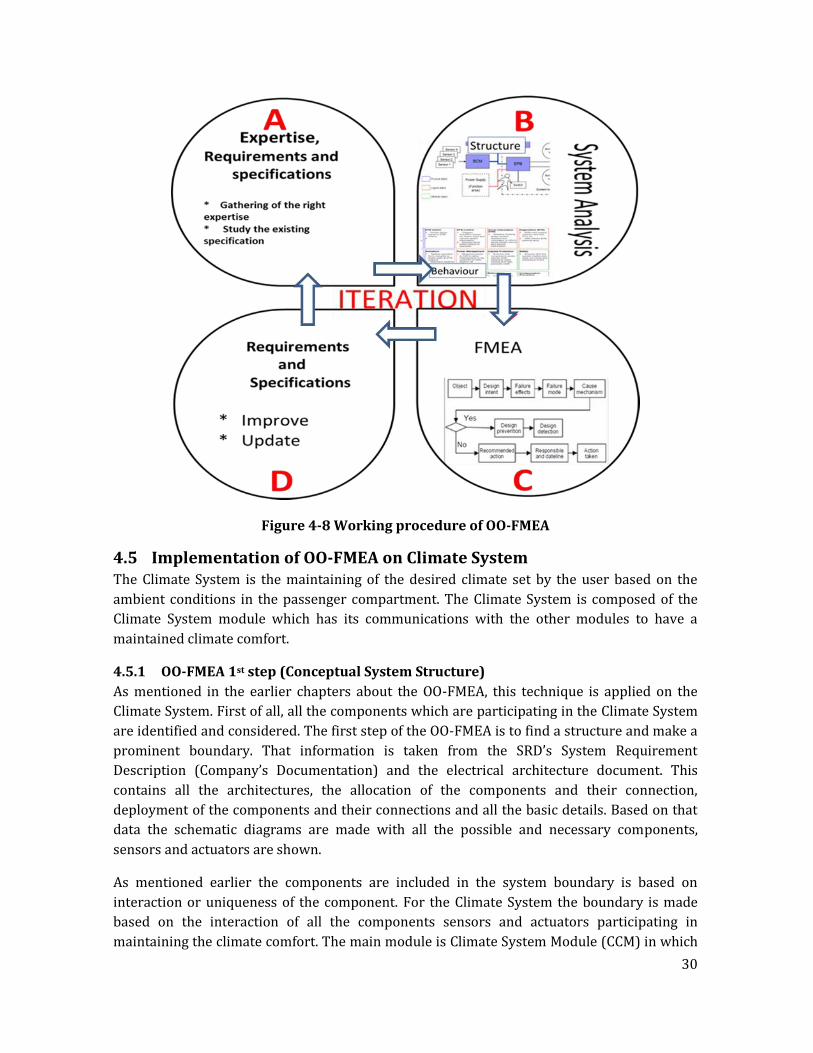
30
Figure 4-8 Working procedure of OO-FMEA
4.5 Implementation of OO-FMEA on Climate System The Climate System is the maintaining of the desired climate set by the user based on the
ambient conditions in the passenger compartment. The Climate System is composed of the
Climate System module which has its communications with the other modules to have a
maintained climate comfort.
4.5.1 OO-FMEA 1st step (Conceptual System Structure)
As mentioned in the earlier chapters about the OO-FMEA, this technique is applied on the
Climate System. First of all, all the components which are participating in the Climate System
are identified and considered. The first step of the OO-FMEA is to find a structure and make a
prominent boundary. That information is taken from the SRD’s System Requirement
Description (Company’s Documentation) and the electrical architecture document. This
contains all the architectures, the allocation of the components and their connection,
deployment of the components and their connections and all the basic details. Based on that
data the schematic diagrams are made with all the possible and necessary components,
sensors and actuators are shown.
As mentioned earlier the components are included in the system boundary is based on
interaction or uniqueness of the component. For the Climate System the boundary is made
based on the interaction of all the components sensors and actuators participating in
maintaining the climate comfort. The main module is Climate System Module (CCM) in which
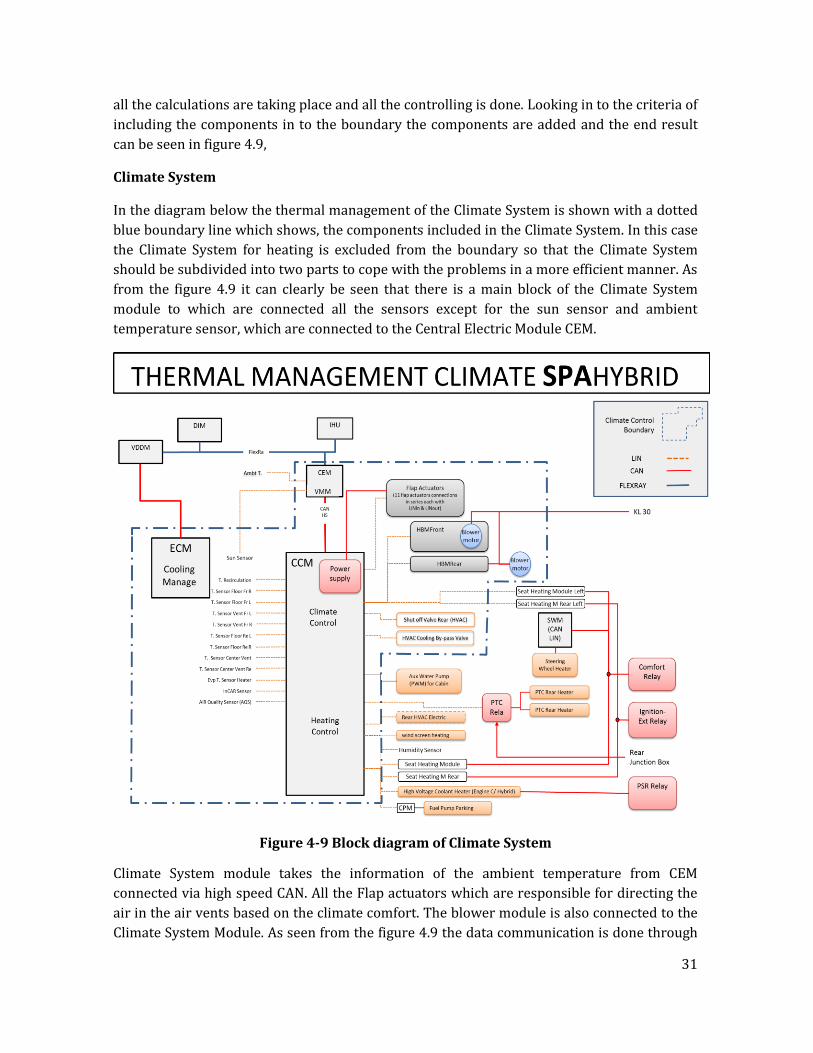
31
all the calculations are taking place and all the controlling is done. Looking in to the criteria of
including the components in to the boundary the components are added and the end result
can be seen in figure 4.9,
Climate System
In the diagram below the thermal management of the Climate System is shown with a dotted
blue boundary line which shows, the components included in the Climate System. In this case
the Climate System for heating is excluded from the boundary so that the Climate System
should be subdivided into two parts to cope with the problems in a more efficient manner. As
from the figure 4.9 it can clearly be seen that there is a main block of the Climate System
module to which are connected all the sensors except for the sun sensor and ambient
temperature sensor, which are connected to the Central Electric Module CEM.
Figure 4-9 Block diagram of Climate System
Climate System module takes the information of the ambient temperature from CEM
connected via high speed CAN. All the Flap actuators which are responsible for directing the
air in the air vents based on the climate comfort. The blower module is also connected to the
Climate System Module. As seen from the figure 4.9 the data communication is done through
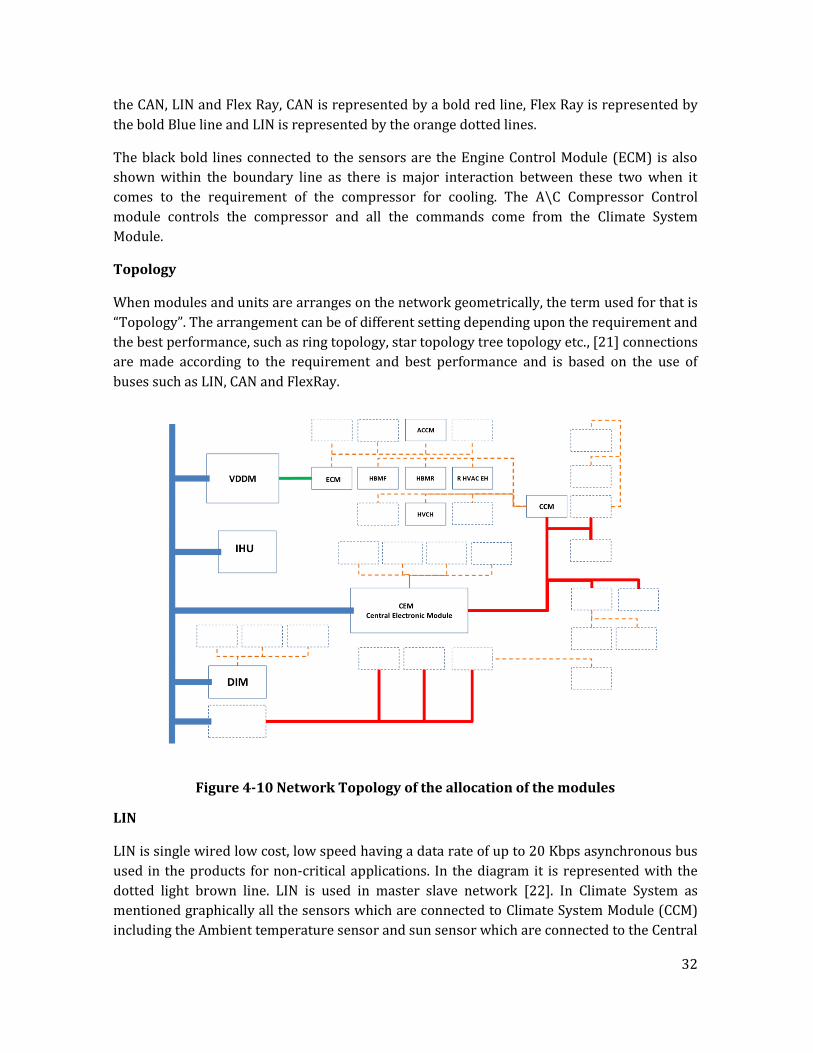
32
the CAN, LIN and Flex Ray, CAN is represented by a bold red line, Flex Ray is represented by
the bold Blue line and LIN is represented by the orange dotted lines.
The black bold lines connected to the sensors are the Engine Control Module (ECM) is also
shown within the boundary line as there is major interaction between these two when it
comes to the requirement of the compressor for cooling. The A\C Compressor Control
module controls the compressor and all the commands come from the Climate System
Module.
Topology
When modules and units are arranges on the network geometrically, the term used for that is
“Topology”. The arrangement can be of different setting depending upon the requirement and
the best performance, such as ring topology, star topology tree topology etc., [21] connections
are made according to the requirement and best performance and is based on the use of
buses such as LIN, CAN and FlexRay.
Figure 4-10 Network Topology of the allocation of the modules
LIN
LIN is single wired low cost, low speed having a data rate of up to 20 Kbps asynchronous bus
used in the products for non-critical applications. In the diagram it is represented with the
dotted light brown line. LIN is used in master slave network [22]. In Climate System as
mentioned graphically all the sensors which are connected to Climate System Module (CCM)
including the Ambient temperature sensor and sun sensor which are connected to the Central
33
Electronic Module are connected through LIN. as far as the question of Actuators is concerned
HVAC Blower Module (HBM) front and rear, Flap Actuators shut Off Valves are connected
through LIN [23]. In the Climate System Diagram it is denoted by thin light brown dotted line.
CAN
CAN uses unshielded two wire line, medium speed a synchronous bus having a data speed of
1 Mbps a medium speed asynchronous bus offering a data rate up to 1 Mbps [22] . In the
diagram it is represented with a bold Red line. It is used in the combination of multiple
master based architecture. CAN uses a data frame having a maximum payload of 8 bytes to
transmit data [23]. In Climate System when it comes to the communication between the
modules which contain many system and sub-system in them, CAN is used. As it is for
multiple master based architecture therefor many sets of instruction would be flowing
through it at a time.
Flex Ray
When it comes to the safety critical applications in vehicles FlexRay is used. In the diagram it
is represented with a bold Blue line. It is a serial communication and uses two channels, both
of these channels have pairs of wires, and it has the data transfer rate up to 20 Mbps and it
has a payload consist of 0 to 254 bytes for the transfer of data [23]. Each channel may be
operated at the same time i.e. sharing the 20 Mbps in to 10 Mbps each and is used in different
topologies, such as bus, star etc. In Climate System the main units are connected through
FlexRay such as, Internal Head Unit (IHU) and Driver Information Module (DIM).
4.5.2 OO-FMEA 2nd step (Identification of Behavior)
The second step when performing OO-FMEA is the identification of behavior of the system.
Structure without behavior is useless if talking about any electro-mechanical system or any
other system in which the user expects some kind of output. The first step of OO-FMEA is in
which the structure of system is identified. To have a deeper knowledge about the system, its
behavior has its own importance. If the behavior is defined in a simplest way it is, the how,
when, why, where and with the help of which component the system performs any task.
Obviously the completion of any task may require a set of instructions and actuators to have a
desired output. The identification of objects and their design intents, and the information
about these objects and design intents comes from the same source of course, the SRD’s in
which the description of the signals responsible to complete different jobs and perform
different function.
The behavior is basically composed of three types of objects, which are based on the
information from the SRD’s. These objects are
1. Logical Objects
2. Physical Objects
3. Attributes Objects
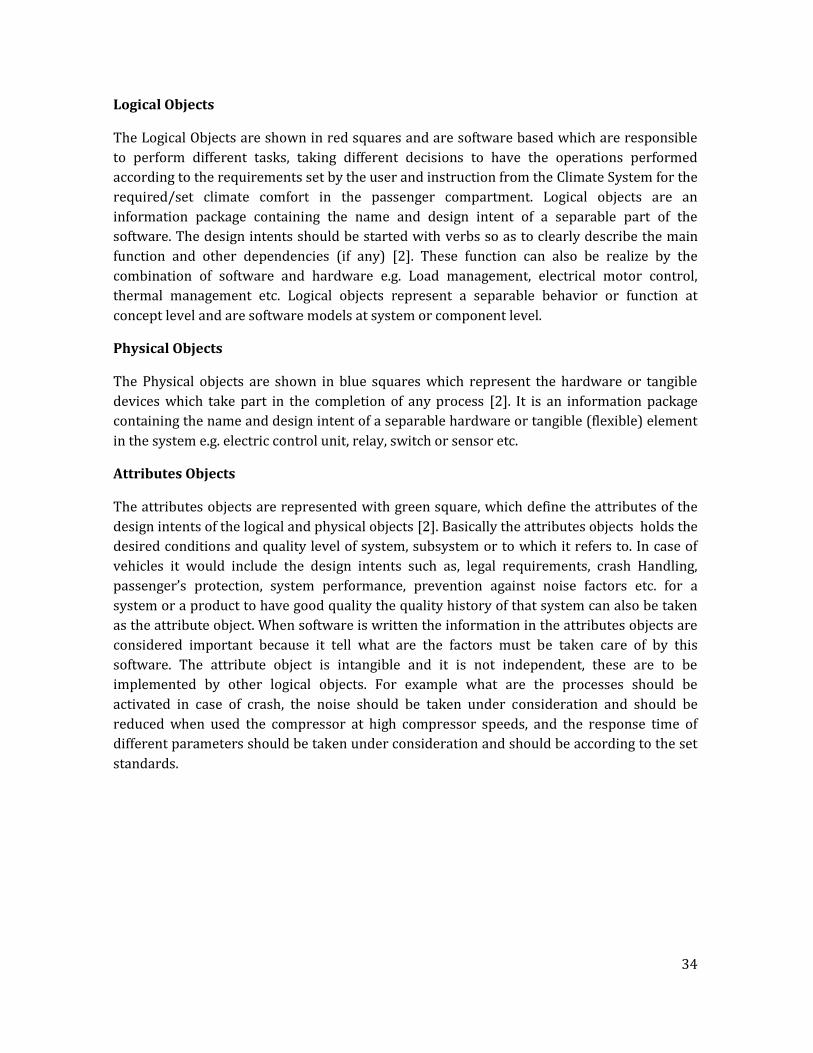
34
Logical Objects
The Logical Objects are shown in red squares and are software based which are responsible
to perform different tasks, taking different decisions to have the operations performed
according to the requirements set by the user and instruction from the Climate System for the
required/set climate comfort in the passenger compartment. Logical objects are an
information package containing the name and design intent of a separable part of the
software. The design intents should be started with verbs so as to clearly describe the main
function and other dependencies (if any) [2]. These function can also be realize by the
combination of software and hardware e.g. Load management, electrical motor control,
thermal management etc. Logical objects represent a separable behavior or function at
concept level and are software models at system or component level.
Physical Objects
The Physical objects are shown in blue squares which represent the hardware or tangible
devices which take part in the completion of any process [2]. It is an information package
containing the name and design intent of a separable hardware or tangible (flexible) element
in the system e.g. electric control unit, relay, switch or sensor etc.
Attributes Objects
The attributes objects are represented with green square, which define the attributes of the
design intents of the logical and physical objects [2]. Basically the attributes objects holds the
desired conditions and quality level of system, subsystem or to which it refers to. In case of
vehicles it would include the design intents such as, legal requirements, crash Handling,
passenger’s protection, system performance, prevention against noise factors etc. for a
system or a product to have good quality the quality history of that system can also be taken
as the attribute object. When software is written the information in the attributes objects are
considered important because it tell what are the factors must be taken care of by this
software. The attribute object is intangible and it is not independent, these are to be
implemented by other logical objects. For example what are the processes should be
activated in case of crash, the noise should be taken under consideration and should be
reduced when used the compressor at high compressor speeds, and the response time of
different parameters should be taken under consideration and should be according to the set
standards.
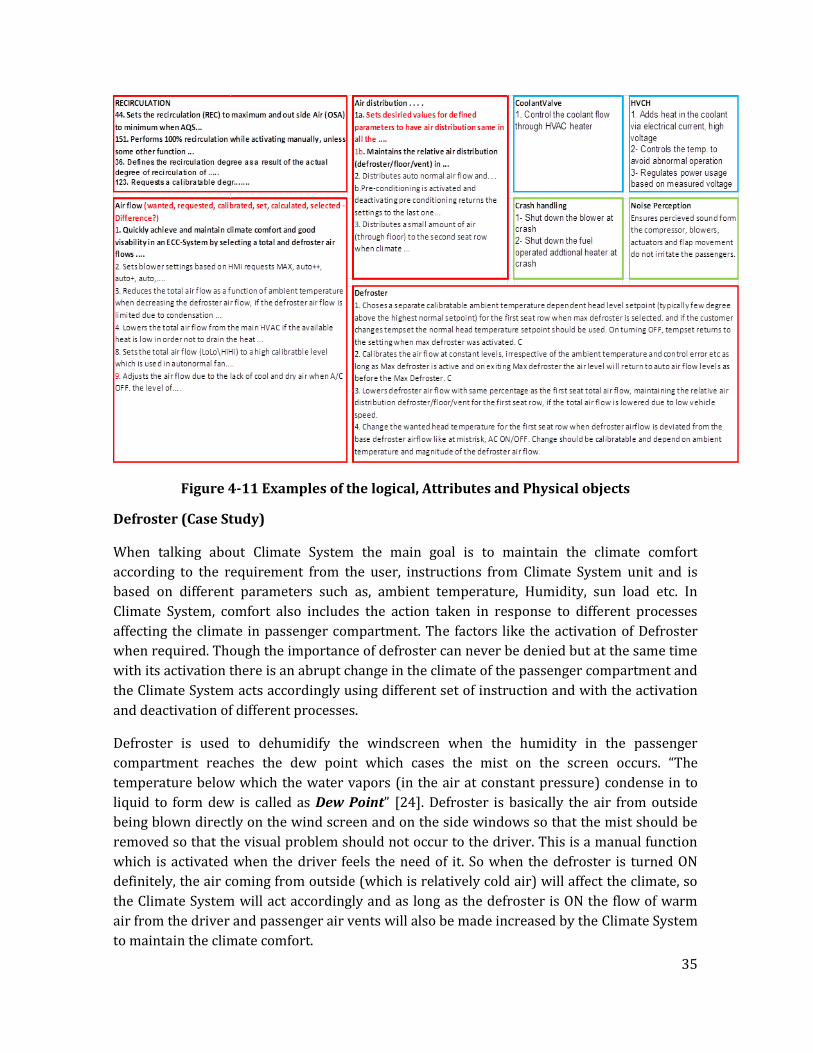
35
Figure 4-11 Examples of the logical, Attributes and Physical objects
Defroster (Case Study)
When talking about Climate System the main goal is to maintain the climate comfort
according to the requirement from the user, instructions from Climate System unit and is
based on different parameters such as, ambient temperature, Humidity, sun load etc. In
Climate System, comfort also includes the action taken in response to different processes
affecting the climate in passenger compartment. The factors like the activation of Defroster
when required. Though the importance of defroster can never be denied but at the same time
with its activation there is an abrupt change in the climate of the passenger compartment and
the Climate System acts accordingly using different set of instruction and with the activation
and deactivation of different processes.
Defroster is used to dehumidify the windscreen when the humidity in the passenger
compartment reaches the dew point which cases the mist on the screen occurs. “The
temperature below which the water vapors (in the air at constant pressure) condense in to
liquid to form dew is called as Dew Point” [24]. Defroster is basically the air from outside
being blown directly on the wind screen and on the side windows so that the mist should be
removed so that the visual problem should not occur to the driver. This is a manual function
which is activated when the driver feels the need of it. So when the defroster is turned ON
definitely, the air coming from outside (which is relatively cold air) will affect the climate, so
the Climate System will act accordingly and as long as the defroster is ON the flow of warm
air from the driver and passenger air vents will also be made increased by the Climate System
to maintain the climate comfort.
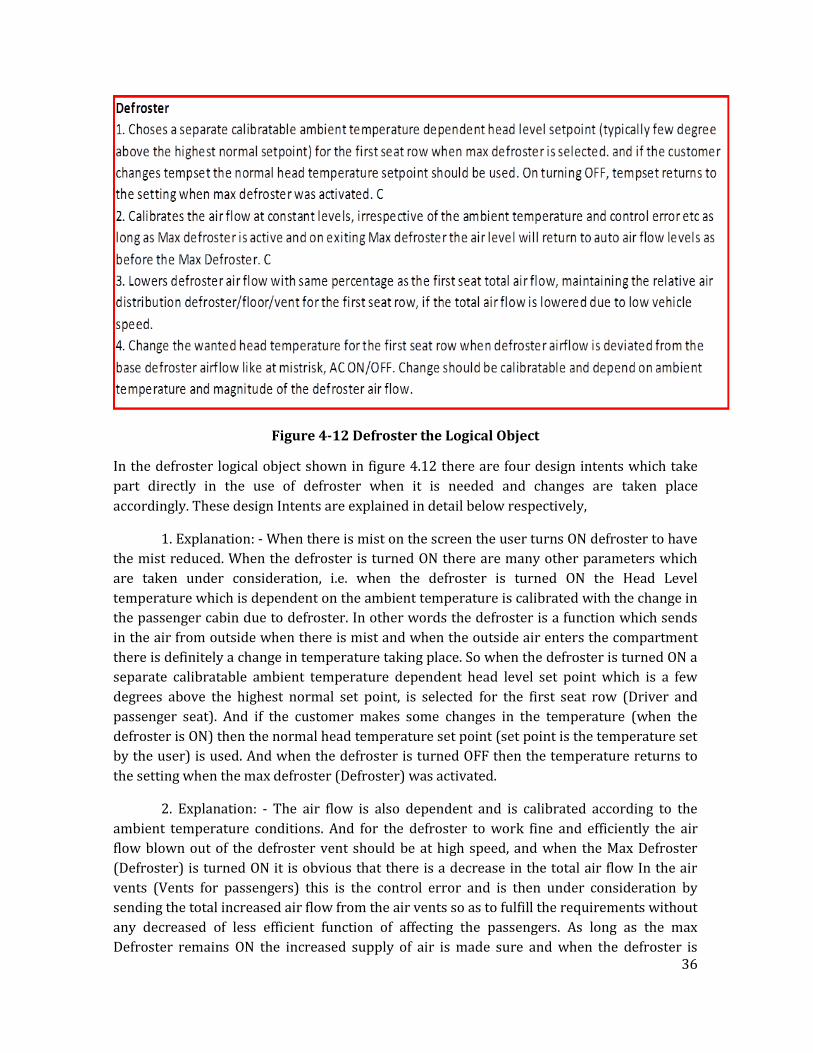
36
Figure 4-12 Defroster the Logical Object
In the defroster logical object shown in figure 4.12 there are four design intents which take
part directly in the use of defroster when it is needed and changes are taken place
accordingly. These design Intents are explained in detail below respectively,
1. Explanation: - When there is mist on the screen the user turns ON defroster to have
the mist reduced. When the defroster is turned ON there are many other parameters which
are taken under consideration, i.e. when the defroster is turned ON the Head Level
temperature which is dependent on the ambient temperature is calibrated with the change in
the passenger cabin due to defroster. In other words the defroster is a function which sends
in the air from outside when there is mist and when the outside air enters the compartment
there is definitely a change in temperature taking place. So when the defroster is turned ON a
separate calibratable ambient temperature dependent head level set point which is a few
degrees above the highest normal set point, is selected for the first seat row (Driver and
passenger seat). And if the customer makes some changes in the temperature (when the
defroster is ON) then the normal head temperature set point (set point is the temperature set
by the user) is used. And when the defroster is turned OFF then the temperature returns to
the setting when the max defroster (Defroster) was activated.
2. Explanation: - The air flow is also dependent and is calibrated according to the
ambient temperature conditions. And for the defroster to work fine and efficiently the air
flow blown out of the defroster vent should be at high speed, and when the Max Defroster
(Defroster) is turned ON it is obvious that there is a decrease in the total air flow In the air
vents (Vents for passengers) this is the control error and is then under consideration by
sending the total increased air flow from the air vents so as to fulfill the requirements without
any decreased of less efficient function of affecting the passengers. As long as the max
Defroster remains ON the increased supply of air is made sure and when the defroster is
37
turned OFF the air flow level is reduced and is set to the point where it was before (before the
defroster was turned ON).
3. Explanation: -The air flow is calibrated with the speed of the vehicle, when the
vehicle is moving at slow speed there will be a relative low speed as compared to the vehicle
at high speed. So when the Defroster is ON and there is a variation in the speed of the vehicle,
this variation would also effect with the same percentage on the air flow in the defroster, air
flow in the floors and in the vents of the first and second seat rows.
4. Explanation: -The Defroster is operated at different levels depending on the level of
mist in the wind screen and for that the mist is calculated based of the
calculations/measurements of the wind screen temperature and level of humidity. If the level
of humidity reaches the dew point (that point at which the dew) and the delta dew point is
also calculated with the help of humidity sensor. Perform demisting by increasing the
defroster airflow according to the demand of demisting based on the calculated mist risk
(Humidity sensor) and (ambient temperature). The following relation is of great importance.
Dew point = wind Screen Temperature – Delta Dew Point
These above are the design intents which show the defroster function and the changes which
are made accordingly when defroster is turned ON and OFF. The above is shown how the
design intents are used to describe the functionality of the objects. Explain and derive the
relations of dew points.
4.5.3 OO-FMEA 3rd Step (Prioritization)
The prioritization of the objects is one of the most important tasks which should be
performed in an efficient way to that the work load should be lessened this is the actual relief
in OO-FMEA. It deeds the principle of efficient compatibility rather than unmotivated
completeness. In other words the analysis targets on the significant issues. Due to the
interactions between the objects, the high priority will include the effect of the low priority
objects. After the prioritization simply transfer the information in to the objects to the FMEA-
template. The objects are prioritized and the information the objects is used as inputs to the
FMEA. The idea behind the prioritization is to select the most important and main objects
which have most interactions with other objects, no matter where the deployment of the
object is. The interaction between the objects shows the root importance of the objects. When
the objects are being prioritized, things which should be taken under consideration are the
number of interactions. Prioritization also applies the working principles of complex systems,
some objects have highly complex behaviors and they require high attention, while others
have highly repetitive behaviors and may be treated with lower priority. The analysis of the
objects can distribute to different groups so that parallel analysis teams can performed.
When the finding the behavior of the objects is concerned in the step two of OO-FMEA
process then there are many objects and all the objects are combined to represent a system.
Each object has its own function. But when the consideration of the object in the system
boundary is concerned then at that time interactions between the logical objects and the
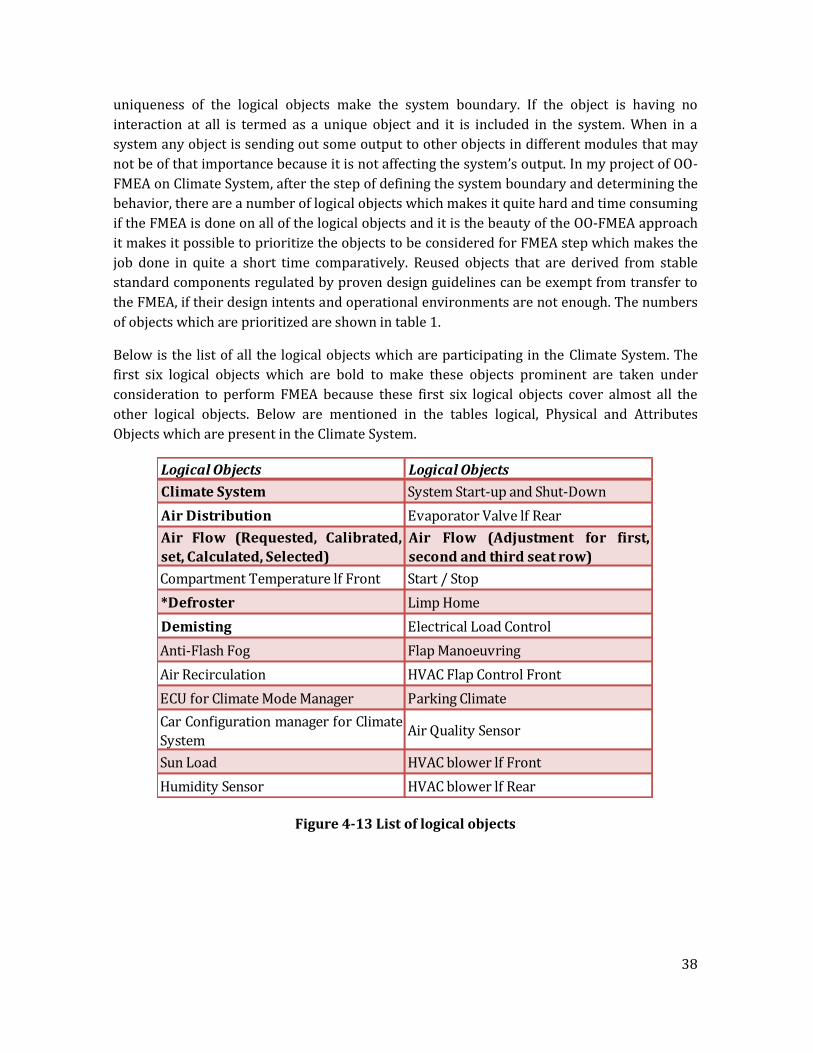
38
uniqueness of the logical objects make the system boundary. If the object is having no
interaction at all is termed as a unique object and it is included in the system. When in a
system any object is sending out some output to other objects in different modules that may
not be of that importance because it is not affecting the system’s output. In my project of OO-
FMEA on Climate System, after the step of defining the system boundary and determining the
behavior, there are a number of logical objects which makes it quite hard and time consuming
if the FMEA is done on all of the logical objects and it is the beauty of the OO-FMEA approach
it makes it possible to prioritize the objects to be considered for FMEA step which makes the
job done in quite a short time comparatively. Reused objects that are derived from stable
standard components regulated by proven design guidelines can be exempt from transfer to
the FMEA, if their design intents and operational environments are not enough. The numbers
of objects which are prioritized are shown in table 1.
Below is the list of all the logical objects which are participating in the Climate System. The
first six logical objects which are bold to make these objects prominent are taken under
consideration to perform FMEA because these first six logical objects cover almost all the
other logical objects. Below are mentioned in the tables logical, Physical and Attributes
Objects which are present in the Climate System.
Figure 4-13 List of logical objects
Logical Objects Logical Objects
Climate System System Start-up and Shut-Down
Air Distribution Evaporator Valve lf Rear
Air Flow (Requested, Calibrated,
set, Calculated, Selected)
Air Flow (Adjustment for first,
second and third seat row)
Compartment Temperature lf Front Start / Stop
*Defroster Limp Home
Demisting Electrical Load Control
Anti-Flash Fog Flap Manoeuvring
Air Recirculation HVAC Flap Control Front
ECU for Climate Mode Manager Parking Climate
Car Configuration manager for Climate
SystemAir Quality Sensor
Sun Load HVAC blower lf Front
Humidity Sensor HVAC blower lf Rear
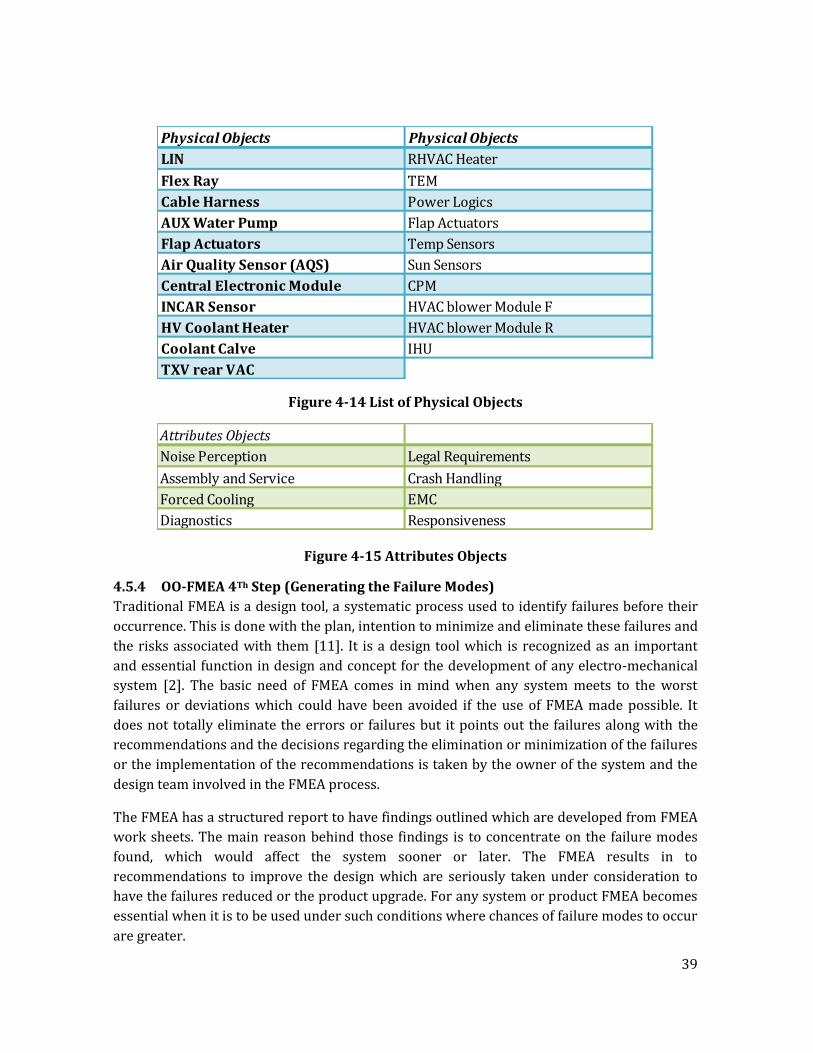
39
Figure 4-14 List of Physical Objects
Figure 4-15 Attributes Objects
4.5.4 OO-FMEA 4Th Step (Generating the Failure Modes)
Traditional FMEA is a design tool, a systematic process used to identify failures before their
occurrence. This is done with the plan, intention to minimize and eliminate these failures and
the risks associated with them [11]. It is a design tool which is recognized as an important
and essential function in design and concept for the development of any electro-mechanical
system [2]. The basic need of FMEA comes in mind when any system meets to the worst
failures or deviations which could have been avoided if the use of FMEA made possible. It
does not totally eliminate the errors or failures but it points out the failures along with the
recommendations and the decisions regarding the elimination or minimization of the failures
or the implementation of the recommendations is taken by the owner of the system and the
design team involved in the FMEA process.
The FMEA has a structured report to have findings outlined which are developed from FMEA
work sheets. The main reason behind those findings is to concentrate on the failure modes
found, which would affect the system sooner or later. The FMEA results in to
recommendations to improve the design which are seriously taken under consideration to
have the failures reduced or the product upgrade. For any system or product FMEA becomes
essential when it is to be used under such conditions where chances of failure modes to occur
are greater.
Physical Objects Physical Objects
LIN RHVAC Heater
Flex Ray TEM
Cable Harness Power Logics
AUX Water Pump Flap Actuators
Flap Actuators Temp Sensors
Air Quality Sensor (AQS) Sun Sensors
Central Electronic Module CPM
INCAR Sensor HVAC blower Module F
HV Coolant Heater HVAC blower Module R
Coolant Calve IHU
TXV rear VAC
Attributes Objects
Noise Perception Legal Requirements
Assembly and Service Crash Handling
Forced Cooling EMC
Diagnostics Responsiveness
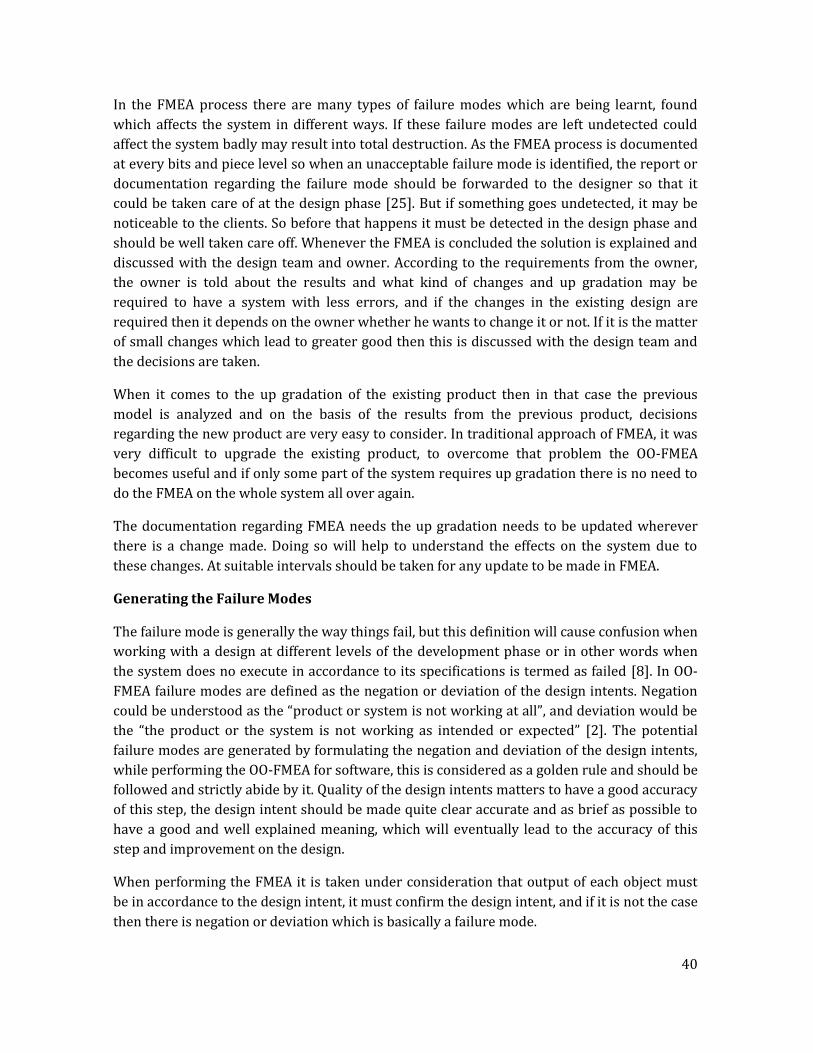
40
In the FMEA process there are many types of failure modes which are being learnt, found
which affects the system in different ways. If these failure modes are left undetected could
affect the system badly may result into total destruction. As the FMEA process is documented
at every bits and piece level so when an unacceptable failure mode is identified, the report or
documentation regarding the failure mode should be forwarded to the designer so that it
could be taken care of at the design phase [25]. But if something goes undetected, it may be
noticeable to the clients. So before that happens it must be detected in the design phase and
should be well taken care off. Whenever the FMEA is concluded the solution is explained and
discussed with the design team and owner. According to the requirements from the owner,
the owner is told about the results and what kind of changes and up gradation may be
required to have a system with less errors, and if the changes in the existing design are
required then it depends on the owner whether he wants to change it or not. If it is the matter
of small changes which lead to greater good then this is discussed with the design team and
the decisions are taken.
When it comes to the up gradation of the existing product then in that case the previous
model is analyzed and on the basis of the results from the previous product, decisions
regarding the new product are very easy to consider. In traditional approach of FMEA, it was
very difficult to upgrade the existing product, to overcome that problem the OO-FMEA
becomes useful and if only some part of the system requires up gradation there is no need to
do the FMEA on the whole system all over again.
The documentation regarding FMEA needs the up gradation needs to be updated wherever
there is a change made. Doing so will help to understand the effects on the system due to
these changes. At suitable intervals should be taken for any update to be made in FMEA.
Generating the Failure Modes
The failure mode is generally the way things fail, but this definition will cause confusion when
working with a design at different levels of the development phase or in other words when
the system does no execute in accordance to its specifications is termed as failed [8]. In OO-
FMEA failure modes are defined as the negation or deviation of the design intents. Negation
could be understood as the “product or system is not working at all”, and deviation would be
the “the product or the system is not working as intended or expected” [2]. The potential
failure modes are generated by formulating the negation and deviation of the design intents,
while performing the OO-FMEA for software, this is considered as a golden rule and should be
followed and strictly abide by it. Quality of the design intents matters to have a good accuracy
of this step, the design intent should be made quite clear accurate and as brief as possible to
have a good and well explained meaning, which will eventually lead to the accuracy of this
step and improvement on the design.
When performing the FMEA it is taken under consideration that output of each object must
be in accordance to the design intent, it must confirm the design intent, and if it is not the case
then there is negation or deviation which is basically a failure mode.
41
Figure 4-16 Types of Failure Modes
The FMEA Template
The clarification and explanation of the FMEA chart is important so as to have a better
understating. The FMEA template is shown in 3.19 and its headings are explained one by one
as follows,
1. Object
In the blocks under the column of “Object” the names of the objects is entered, the name of
the object which contain the design intents. In our case we will put the name “Defroster” in it.
2. Function
When the fourth step of FMEA starts, it starts with the addition of the design intents
sometimes called as intended functions, are put in to the 3rd column of the FMEA chart sheet
named “Function” [8]. The syntax in which it should be written is of great importance i.e. verb
of the design intent should come first showing its main function. For example the functions
for the Defroster as stated earlier are added one by one in each column. The example of the
function is shown in the figure 4.22.
3. Potential Failure Modes
It is defined as the number of possible ways in which a system, subsystem, product, or any
process fails [26]. The design intents are discussed, explained and the possible failure modes
are taken under consideration. Either negation or deviations are written in the next column
named under “Potential Failure Mode”. The deviation can further be explained as any over
function, unintended function or partial failure. It is of great importance that there should be
discussed the failure mode for each design intent, sometimes a design intent may not have
any failure mode in such case that design intent is not included in the FMEA process because
without any potential failure, why bother including FMEA in this process.
4. Potential Effects of Failure Modes
Potential Effects of the Failure Modes are written in the next column named under “Potential
Effects of Failure”. The Effects of the failures are the consequences of the failure modes to be
faced by the end user. The effect of the failure is important to discuss here as on the basis of
this, the Risk Priority Number (RPN) would be more accurate and the recommendations
could be more effective and accurate. It is very important to be very precise in describing the
failure effects.
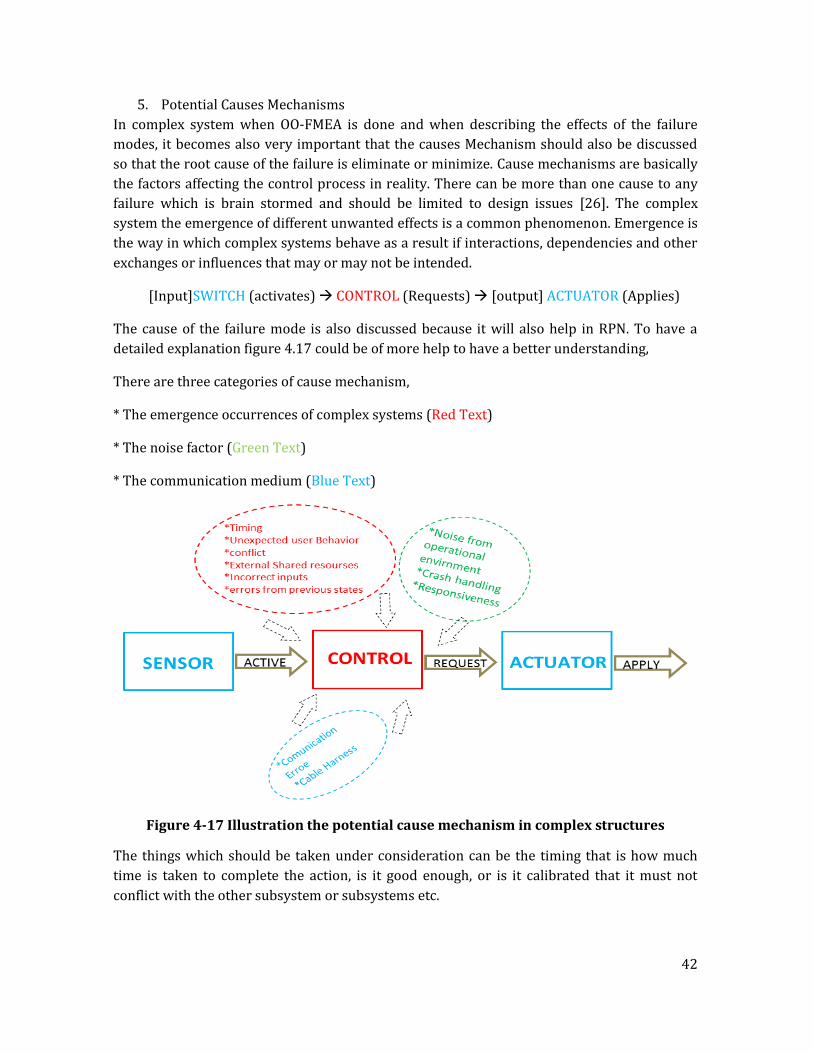
42
5. Potential Causes Mechanisms
In complex system when OO-FMEA is done and when describing the effects of the failure
modes, it becomes also very important that the causes Mechanism should also be discussed
so that the root cause of the failure is eliminate or minimize. Cause mechanisms are basically
the factors affecting the control process in reality. There can be more than one cause to any
failure which is brain stormed and should be limited to design issues [26]. The complex
system the emergence of different unwanted effects is a common phenomenon. Emergence is
the way in which complex systems behave as a result if interactions, dependencies and other
exchanges or influences that may or may not be intended.
[Input]SWITCH (activates) CONTROL (Requests) [output] ACTUATOR (Applies)
The cause of the failure mode is also discussed because it will also help in RPN. To have a
detailed explanation figure 4.17 could be of more help to have a better understanding,
There are three categories of cause mechanism,
* The emergence occurrences of complex systems (Red Text)
* The noise factor (Green Text)
* The communication medium (Blue Text)
Figure 4-17 Illustration the potential cause mechanism in complex structures
The things which should be taken under consideration can be the timing that is how much
time is taken to complete the action, is it good enough, or is it calibrated that it must not
conflict with the other subsystem or subsystems etc.
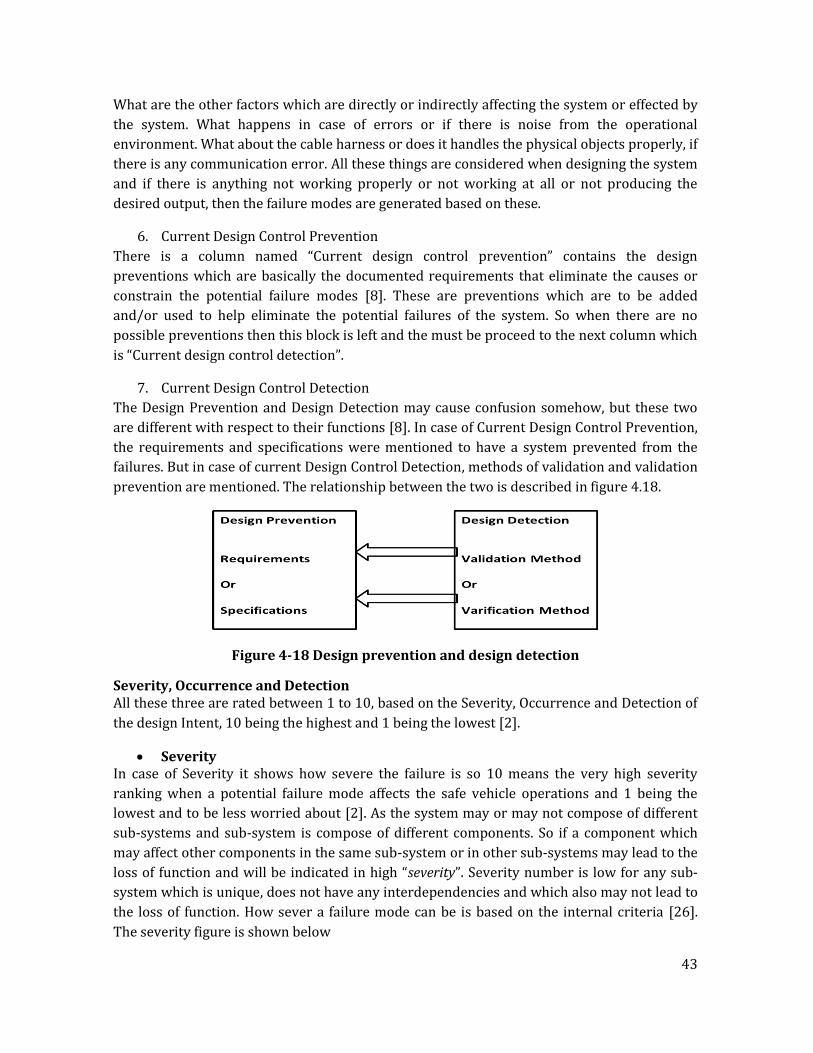
43
What are the other factors which are directly or indirectly affecting the system or effected by
the system. What happens in case of errors or if there is noise from the operational
environment. What about the cable harness or does it handles the physical objects properly, if
there is any communication error. All these things are considered when designing the system
and if there is anything not working properly or not working at all or not producing the
desired output, then the failure modes are generated based on these.
6. Current Design Control Prevention
There is a column named “Current design control prevention” contains the design
preventions which are basically the documented requirements that eliminate the causes or
constrain the potential failure modes [8]. These are preventions which are to be added
and/or used to help eliminate the potential failures of the system. So when there are no
possible preventions then this block is left and the must be proceed to the next column which
is “Current design control detection”.
7. Current Design Control Detection
The Design Prevention and Design Detection may cause confusion somehow, but these two
are different with respect to their functions [8]. In case of Current Design Control Prevention,
the requirements and specifications were mentioned to have a system prevented from the
failures. But in case of current Design Control Detection, methods of validation and validation
prevention are mentioned. The relationship between the two is described in figure 4.18.
Figure 4-18 Design prevention and design detection
Severity, Occurrence and Detection All these three are rated between 1 to 10, based on the Severity, Occurrence and Detection of
the design Intent, 10 being the highest and 1 being the lowest [2].
Severity In case of Severity it shows how severe the failure is so 10 means the very high severity
ranking when a potential failure mode affects the safe vehicle operations and 1 being the
lowest and to be less worried about [2]. As the system may or may not compose of different
sub-systems and sub-system is compose of different components. So if a component which
may affect other components in the same sub-system or in other sub-systems may lead to the
loss of function and will be indicated in high “severity”. Severity number is low for any sub-
system which is unique, does not have any interdependencies and which also may not lead to
the loss of function. How sever a failure mode can be is based on the internal criteria [26].
The severity figure is shown below
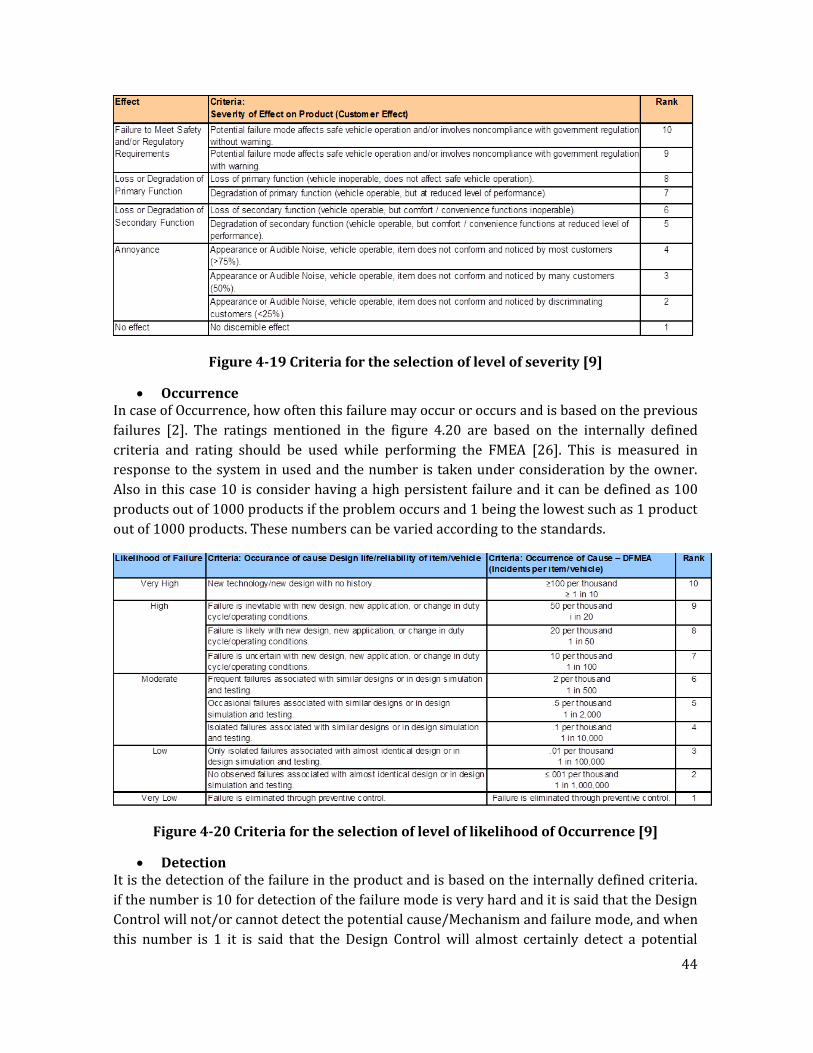
44
Figure 4-19 Criteria for the selection of level of severity [9]
Occurrence In case of Occurrence, how often this failure may occur or occurs and is based on the previous
failures [2]. The ratings mentioned in the figure 4.20 are based on the internally defined
criteria and rating should be used while performing the FMEA [26]. This is measured in
response to the system in used and the number is taken under consideration by the owner.
Also in this case 10 is consider having a high persistent failure and it can be defined as 100
products out of 1000 products if the problem occurs and 1 being the lowest such as 1 product
out of 1000 products. These numbers can be varied according to the standards.
Figure 4-20 Criteria for the selection of level of likelihood of Occurrence [9]
Detection It is the detection of the failure in the product and is based on the internally defined criteria.
if the number is 10 for detection of the failure mode is very hard and it is said that the Design
Control will not/or cannot detect the potential cause/Mechanism and failure mode, and when
this number is 1 it is said that the Design Control will almost certainly detect a potential
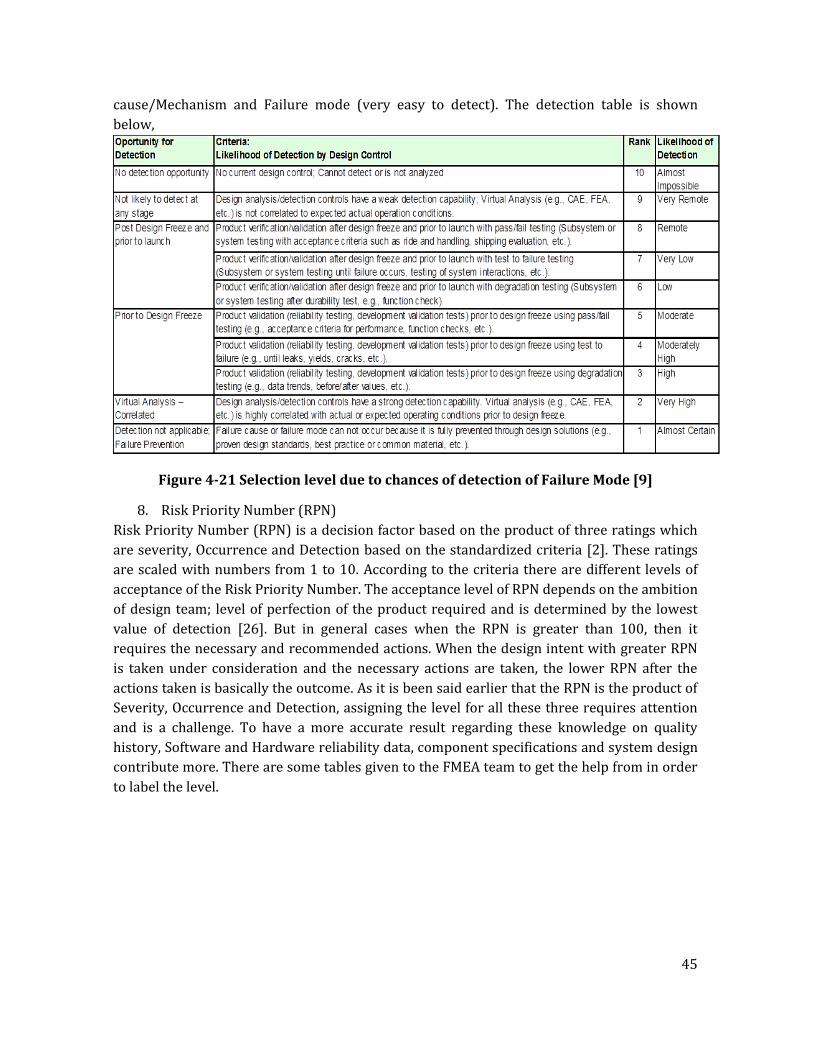
45
cause/Mechanism and Failure mode (very easy to detect). The detection table is shown
below,
Figure 4-21 Selection level due to chances of detection of Failure Mode [9]
8. Risk Priority Number (RPN)
Risk Priority Number (RPN) is a decision factor based on the product of three ratings which
are severity, Occurrence and Detection based on the standardized criteria [2]. These ratings
are scaled with numbers from 1 to 10. According to the criteria there are different levels of
acceptance of the Risk Priority Number. The acceptance level of RPN depends on the ambition
of design team; level of perfection of the product required and is determined by the lowest
value of detection [26]. But in general cases when the RPN is greater than 100, then it
requires the necessary and recommended actions. When the design intent with greater RPN
is taken under consideration and the necessary actions are taken, the lower RPN after the
actions taken is basically the outcome. As it is been said earlier that the RPN is the product of
Severity, Occurrence and Detection, assigning the level for all these three requires attention
and is a challenge. To have a more accurate result regarding these knowledge on quality
history, Software and Hardware reliability data, component specifications and system design
contribute more. There are some tables given to the FMEA team to get the help from in order
to label the level.
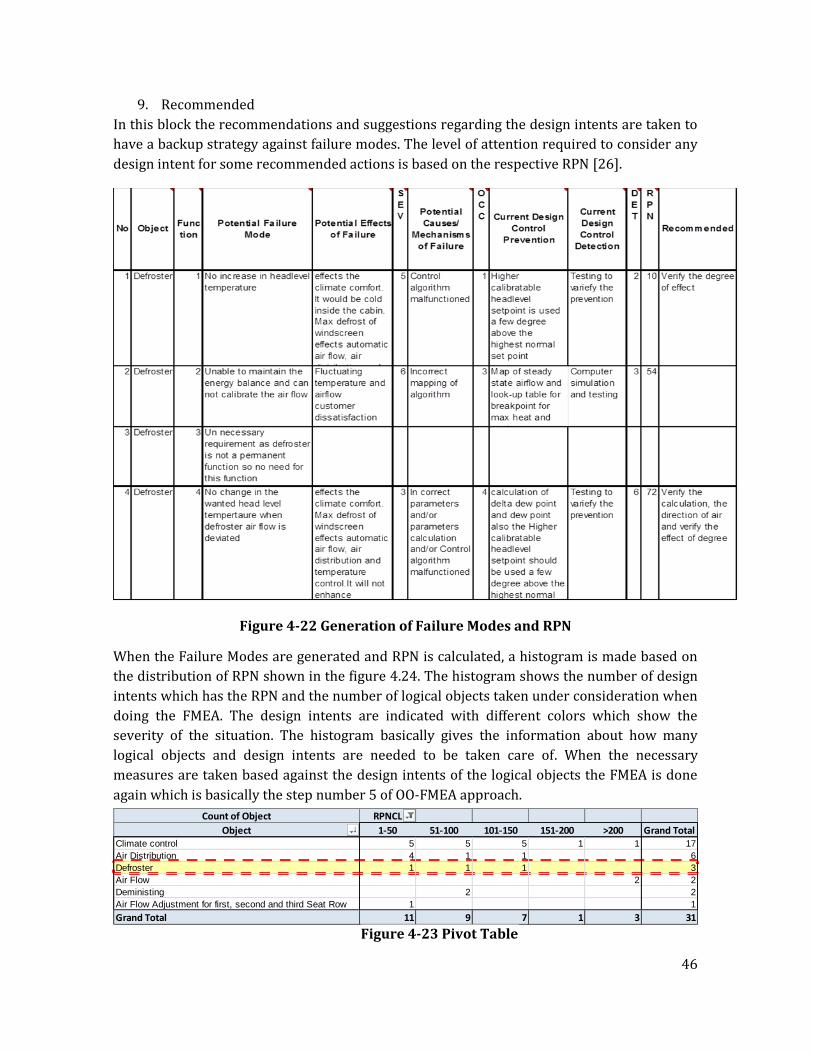
46
9. Recommended
In this block the recommendations and suggestions regarding the design intents are taken to
have a backup strategy against failure modes. The level of attention required to consider any
design intent for some recommended actions is based on the respective RPN [26].
Figure 4-22 Generation of Failure Modes and RPN
When the Failure Modes are generated and RPN is calculated, a histogram is made based on
the distribution of RPN shown in the figure 4.24. The histogram shows the number of design
intents which has the RPN and the number of logical objects taken under consideration when
doing the FMEA. The design intents are indicated with different colors which show the
severity of the situation. The histogram basically gives the information about how many
logical objects and design intents are needed to be taken care of. When the necessary
measures are taken based against the design intents of the logical objects the FMEA is done
again which is basically the step number 5 of OO-FMEA approach.
Count of Object RPNCL
Object 1-50 51-100 101-150 151-200 >200 Grand TotalClimate control 5 5 5 1 1 17
Air Distribution 4 1 1 6
Defroster 1 1 1 3
Air Flow 2 2
Deministing 2 2
Air Flow Adjustment for first, second and third Seat Row 1 1
Grand Total 11 9 7 1 3 31
Figure 4-23 Pivot Table
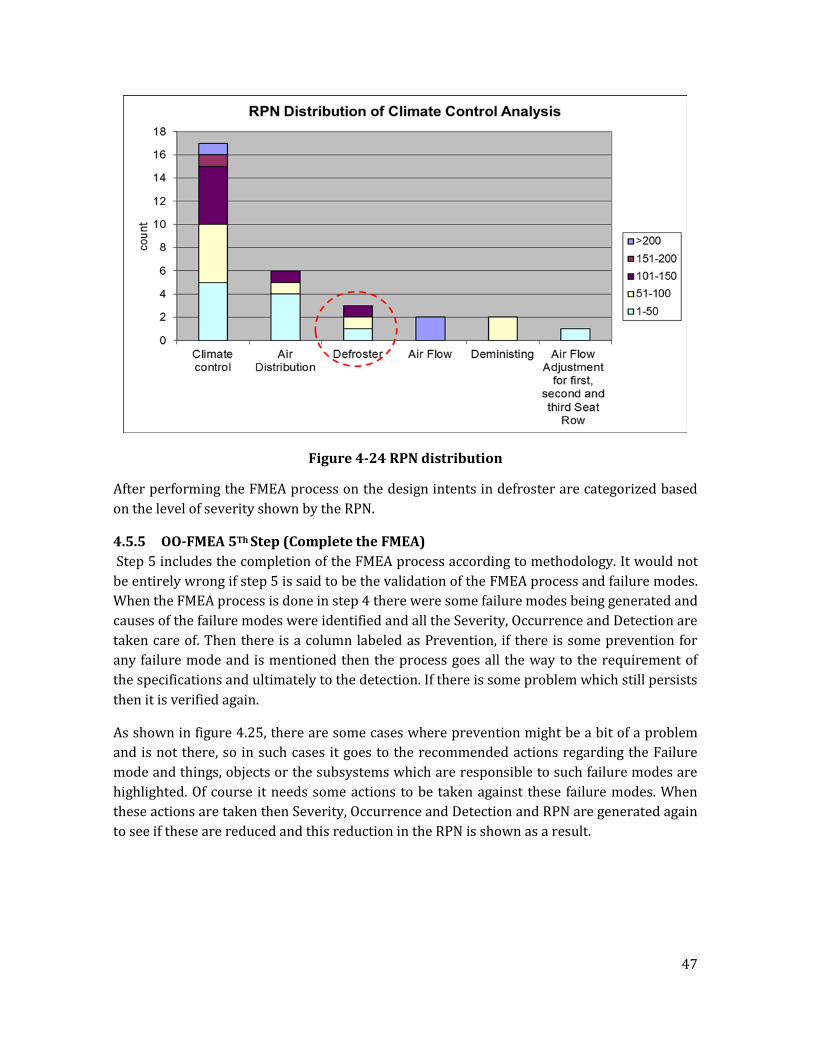
47
Figure 4-24 RPN distribution
After performing the FMEA process on the design intents in defroster are categorized based
on the level of severity shown by the RPN.
4.5.5 OO-FMEA 5Th Step (Complete the FMEA)
Step 5 includes the completion of the FMEA process according to methodology. It would not
be entirely wrong if step 5 is said to be the validation of the FMEA process and failure modes.
When the FMEA process is done in step 4 there were some failure modes being generated and
causes of the failure modes were identified and all the Severity, Occurrence and Detection are
taken care of. Then there is a column labeled as Prevention, if there is some prevention for
any failure mode and is mentioned then the process goes all the way to the requirement of
the specifications and ultimately to the detection. If there is some problem which still persists
then it is verified again.
As shown in figure 4.25, there are some cases where prevention might be a bit of a problem
and is not there, so in such cases it goes to the recommended actions regarding the Failure
mode and things, objects or the subsystems which are responsible to such failure modes are
highlighted. Of course it needs some actions to be taken against these failure modes. When
these actions are taken then Severity, Occurrence and Detection and RPN are generated again
to see if these are reduced and this reduction in the RPN is shown as a result.
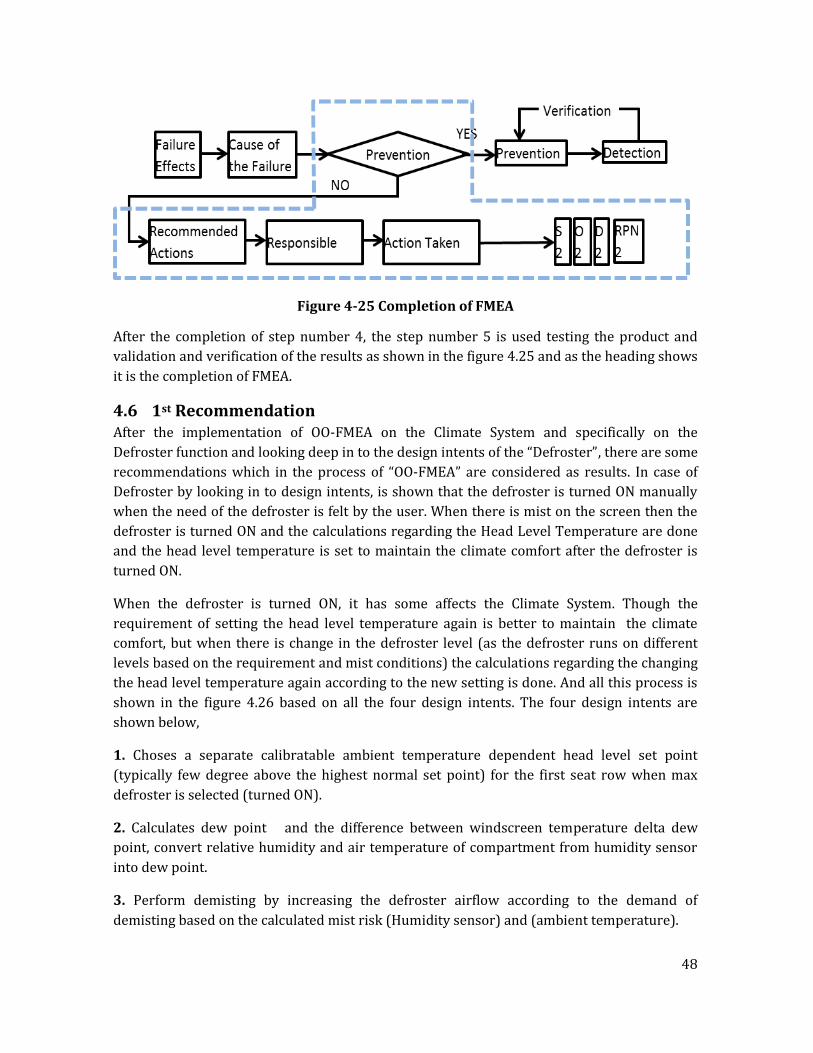
48
Figure 4-25 Completion of FMEA
After the completion of step number 4, the step number 5 is used testing the product and
validation and verification of the results as shown in the figure 4.25 and as the heading shows
it is the completion of FMEA.
4.6 1st Recommendation After the implementation of OO-FMEA on the Climate System and specifically on the
Defroster function and looking deep in to the design intents of the “Defroster”, there are some
recommendations which in the process of “OO-FMEA” are considered as results. In case of
Defroster by looking in to design intents, is shown that the defroster is turned ON manually
when the need of the defroster is felt by the user. When there is mist on the screen then the
defroster is turned ON and the calculations regarding the Head Level Temperature are done
and the head level temperature is set to maintain the climate comfort after the defroster is
turned ON.
When the defroster is turned ON, it has some affects the Climate System. Though the
requirement of setting the head level temperature again is better to maintain the climate
comfort, but when there is change in the defroster level (as the defroster runs on different
levels based on the requirement and mist conditions) the calculations regarding the changing
the head level temperature again according to the new setting is done. And all this process is
shown in the figure 4.26 based on all the four design intents. The four design intents are
shown below,
1. Choses a separate calibratable ambient temperature dependent head level set point
(typically few degree above the highest normal set point) for the first seat row when max
defroster is selected (turned ON).
2. Calculates dew point and the difference between windscreen temperature delta dew
point, convert relative humidity and air temperature of compartment from humidity sensor
into dew point.
3. Perform demisting by increasing the defroster airflow according to the demand of
demisting based on the calculated mist risk (Humidity sensor) and (ambient temperature).
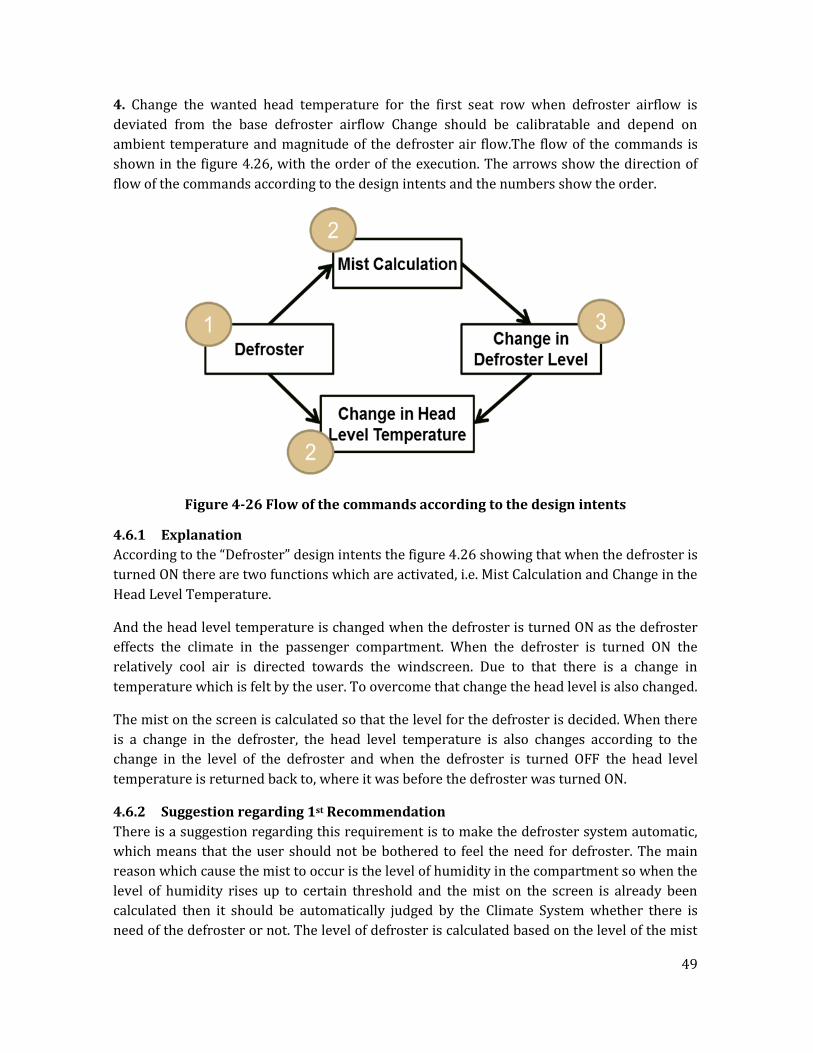
49
4. Change the wanted head temperature for the first seat row when defroster airflow is
deviated from the base defroster airflow Change should be calibratable and depend on
ambient temperature and magnitude of the defroster air flow.The flow of the commands is
shown in the figure 4.26, with the order of the execution. The arrows show the direction of
flow of the commands according to the design intents and the numbers show the order.
Figure 4-26 Flow of the commands according to the design intents
4.6.1 Explanation
According to the “Defroster” design intents the figure 4.26 showing that when the defroster is
turned ON there are two functions which are activated, i.e. Mist Calculation and Change in the
Head Level Temperature.
And the head level temperature is changed when the defroster is turned ON as the defroster
effects the climate in the passenger compartment. When the defroster is turned ON the
relatively cool air is directed towards the windscreen. Due to that there is a change in
temperature which is felt by the user. To overcome that change the head level is also changed.
The mist on the screen is calculated so that the level for the defroster is decided. When there
is a change in the defroster, the head level temperature is also changes according to the
change in the level of the defroster and when the defroster is turned OFF the head level
temperature is returned back to, where it was before the defroster was turned ON.
4.6.2 Suggestion regarding 1st Recommendation
There is a suggestion regarding this requirement is to make the defroster system automatic,
which means that the user should not be bothered to feel the need for defroster. The main
reason which cause the mist to occur is the level of humidity in the compartment so when the
level of humidity rises up to certain threshold and the mist on the screen is already been
calculated then it should be automatically judged by the Climate System whether there is
need of the defroster or not. The level of defroster is calculated based on the level of the mist
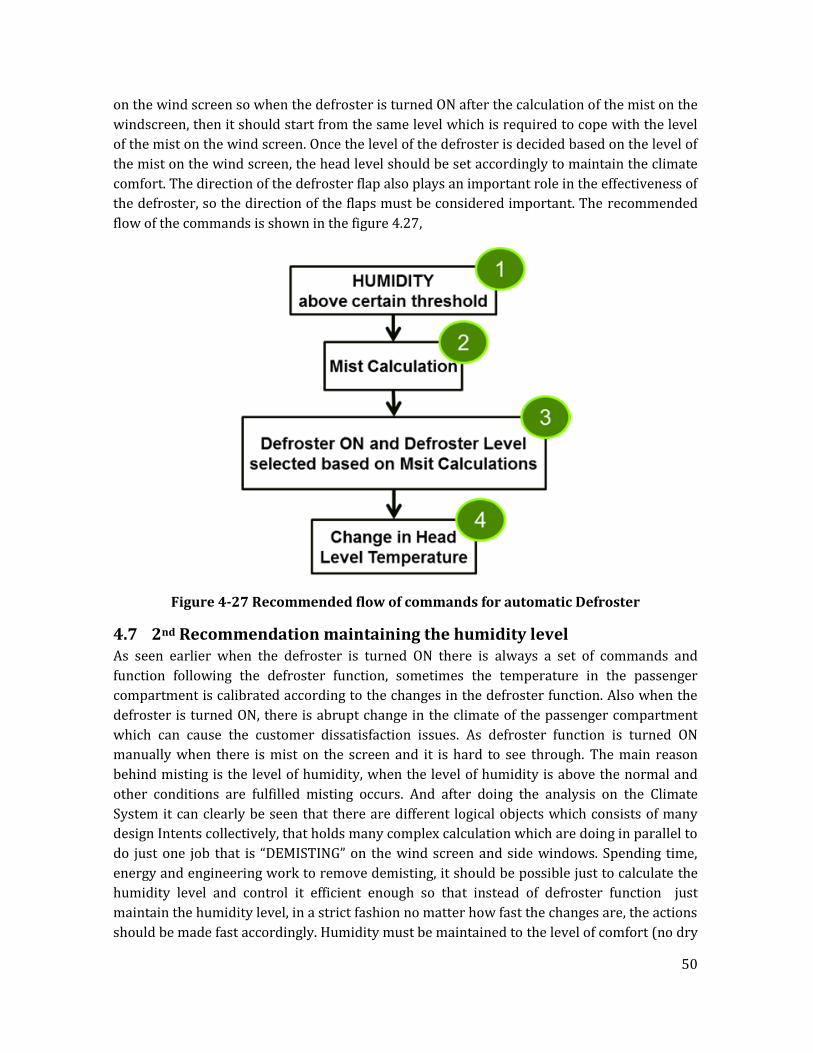
50
on the wind screen so when the defroster is turned ON after the calculation of the mist on the
windscreen, then it should start from the same level which is required to cope with the level
of the mist on the wind screen. Once the level of the defroster is decided based on the level of
the mist on the wind screen, the head level should be set accordingly to maintain the climate
comfort. The direction of the defroster flap also plays an important role in the effectiveness of
the defroster, so the direction of the flaps must be considered important. The recommended
flow of the commands is shown in the figure 4.27,
Figure 4-27 Recommended flow of commands for automatic Defroster
4.7 2nd Recommendation maintaining the humidity level As seen earlier when the defroster is turned ON there is always a set of commands and
function following the defroster function, sometimes the temperature in the passenger
compartment is calibrated according to the changes in the defroster function. Also when the
defroster is turned ON, there is abrupt change in the climate of the passenger compartment
which can cause the customer dissatisfaction issues. As defroster function is turned ON
manually when there is mist on the screen and it is hard to see through. The main reason
behind misting is the level of humidity, when the level of humidity is above the normal and
other conditions are fulfilled misting occurs. And after doing the analysis on the Climate
System it can clearly be seen that there are different logical objects which consists of many
design Intents collectively, that holds many complex calculation which are doing in parallel to
do just one job that is “DEMISTING” on the wind screen and side windows. Spending time,
energy and engineering work to remove demisting, it should be possible just to calculate the
humidity level and control it efficient enough so that instead of defroster function just
maintain the humidity level, in a strict fashion no matter how fast the changes are, the actions
should be made fast accordingly. Humidity must be maintained to the level of comfort (no dry
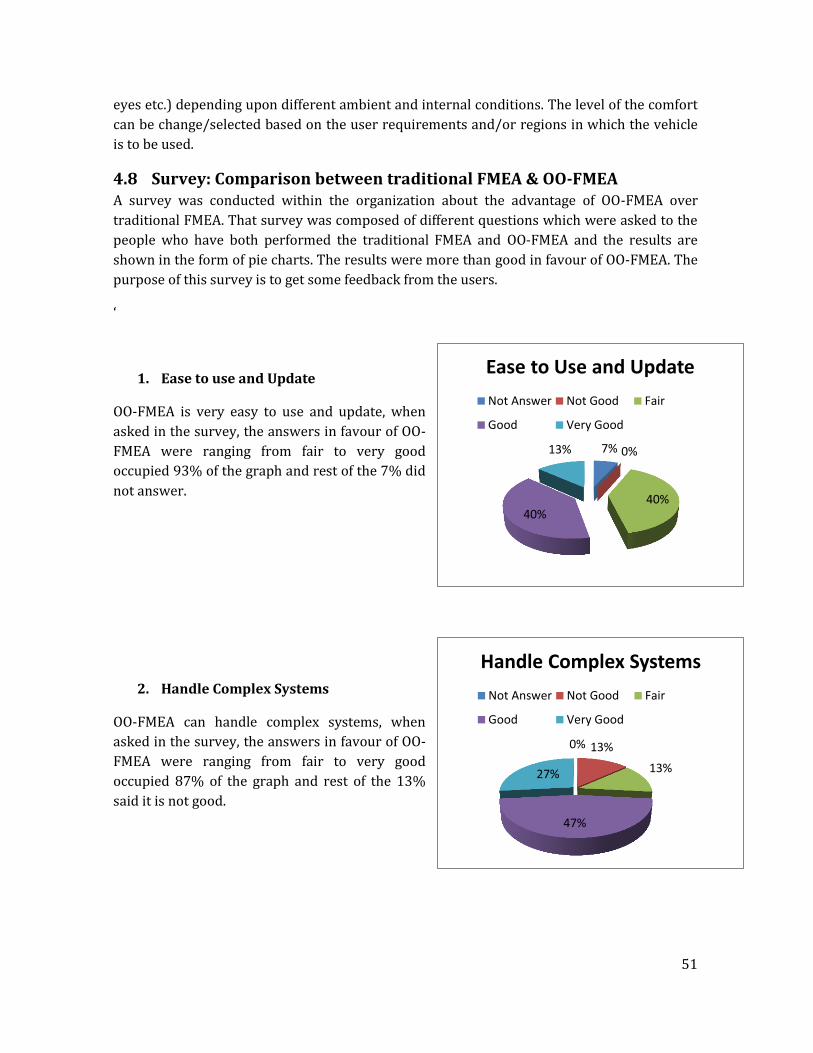
51
7% 0%
40% 40%
13%
Ease to Use and Update
Not Answer Not Good Fair
Good Very Good
eyes etc.) depending upon different ambient and internal conditions. The level of the comfort
can be change/selected based on the user requirements and/or regions in which the vehicle
is to be used.
4.8 Survey: Comparison between traditional FMEA & OO-FMEA A survey was conducted within the organization about the advantage of OO-FMEA over
traditional FMEA. That survey was composed of different questions which were asked to the
people who have both performed the traditional FMEA and OO-FMEA and the results are
shown in the form of pie charts. The results were more than good in favour of OO-FMEA. The
purpose of this survey is to get some feedback from the users.
‘
1. Ease to use and Update
OO-FMEA is very easy to use and update, when
asked in the survey, the answers in favour of OO-
FMEA were ranging from fair to very good
occupied 93% of the graph and rest of the 7% did
not answer.
2. Handle Complex Systems
OO-FMEA can handle complex systems, when
asked in the survey, the answers in favour of OO-
FMEA were ranging from fair to very good
occupied 87% of the graph and rest of the 13%
said it is not good.
0% 13%
13%
47%
27%
Handle Complex Systems
Not Answer Not Good Fair
Good Very Good
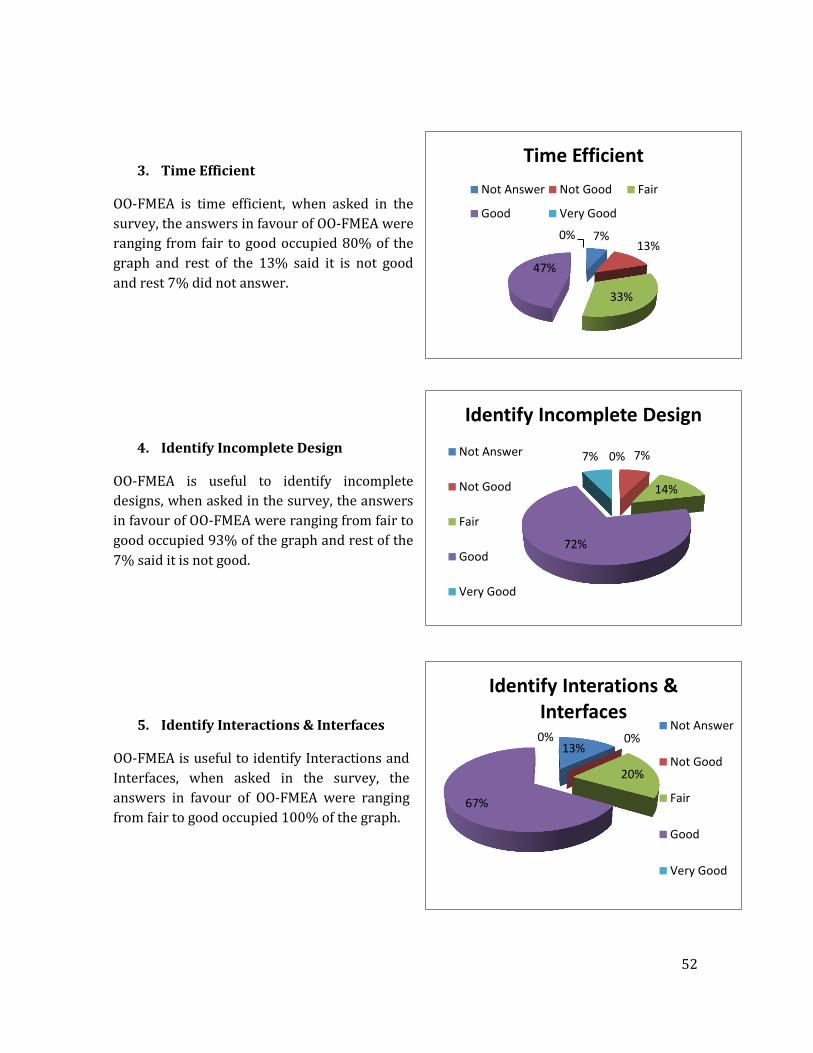
52
3. Time Efficient
OO-FMEA is time efficient, when asked in the
survey, the answers in favour of OO-FMEA were
ranging from fair to good occupied 80% of the
graph and rest of the 13% said it is not good
and rest 7% did not answer.
4. Identify Incomplete Design
OO-FMEA is useful to identify incomplete
designs, when asked in the survey, the answers
in favour of OO-FMEA were ranging from fair to
good occupied 93% of the graph and rest of the
7% said it is not good.
5. Identify Interactions & Interfaces
OO-FMEA is useful to identify Interactions and
Interfaces, when asked in the survey, the
answers in favour of OO-FMEA were ranging
from fair to good occupied 100% of the graph.
7% 13%
33%
47%
0%
Time Efficient
Not Answer Not Good Fair
Good Very Good
0% 7%
14%
72%
7%
Identify Incomplete Design
Not Answer
Not Good
Fair
Good
Very Good
13% 0%
20%
67%
0%
Identify Interations & Interfaces
Not Answer
Not Good
Fair
Good
Very Good
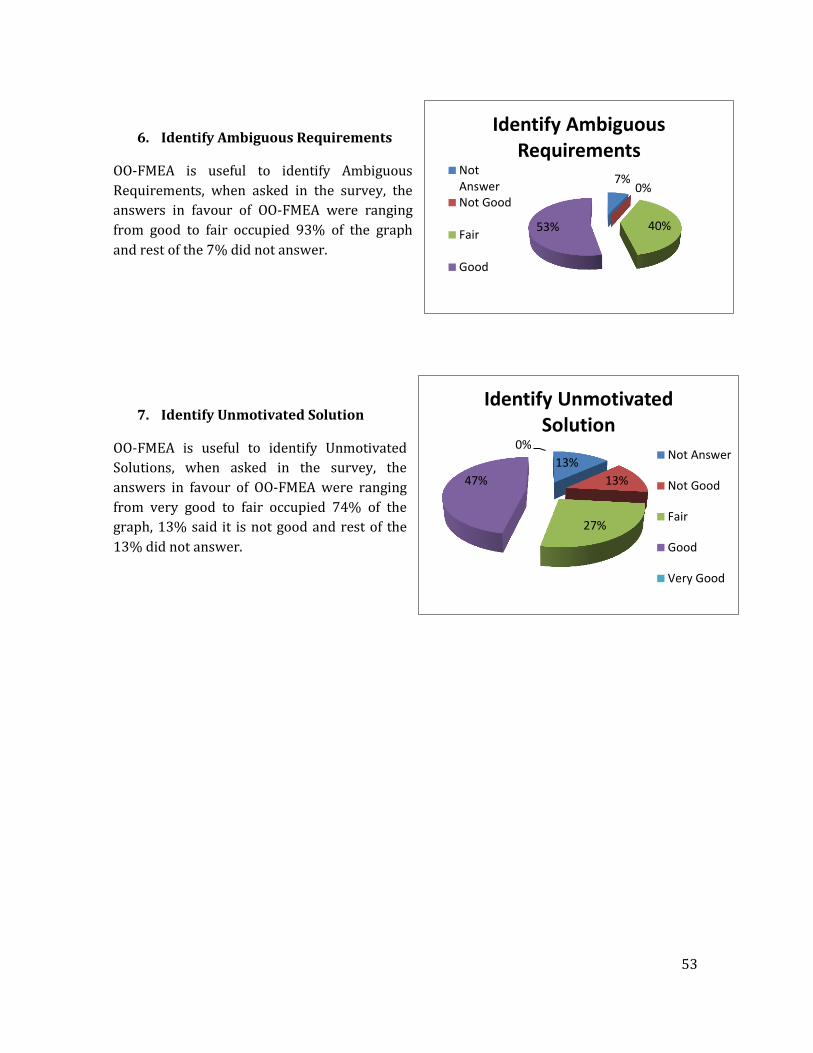
53
6. Identify Ambiguous Requirements
OO-FMEA is useful to identify Ambiguous
Requirements, when asked in the survey, the
answers in favour of OO-FMEA were ranging
from good to fair occupied 93% of the graph
and rest of the 7% did not answer.
7. Identify Unmotivated Solution
OO-FMEA is useful to identify Unmotivated
Solutions, when asked in the survey, the
answers in favour of OO-FMEA were ranging
from very good to fair occupied 74% of the
graph, 13% said it is not good and rest of the
13% did not answer.
7% 0%
40% 53%
Identify Ambiguous Requirements
NotAnswerNot Good
Fair
Good
13%
13%
27%
47%
0%
Identify Unmotivated Solution
Not Answer
Not Good
Fair
Good
Very Good
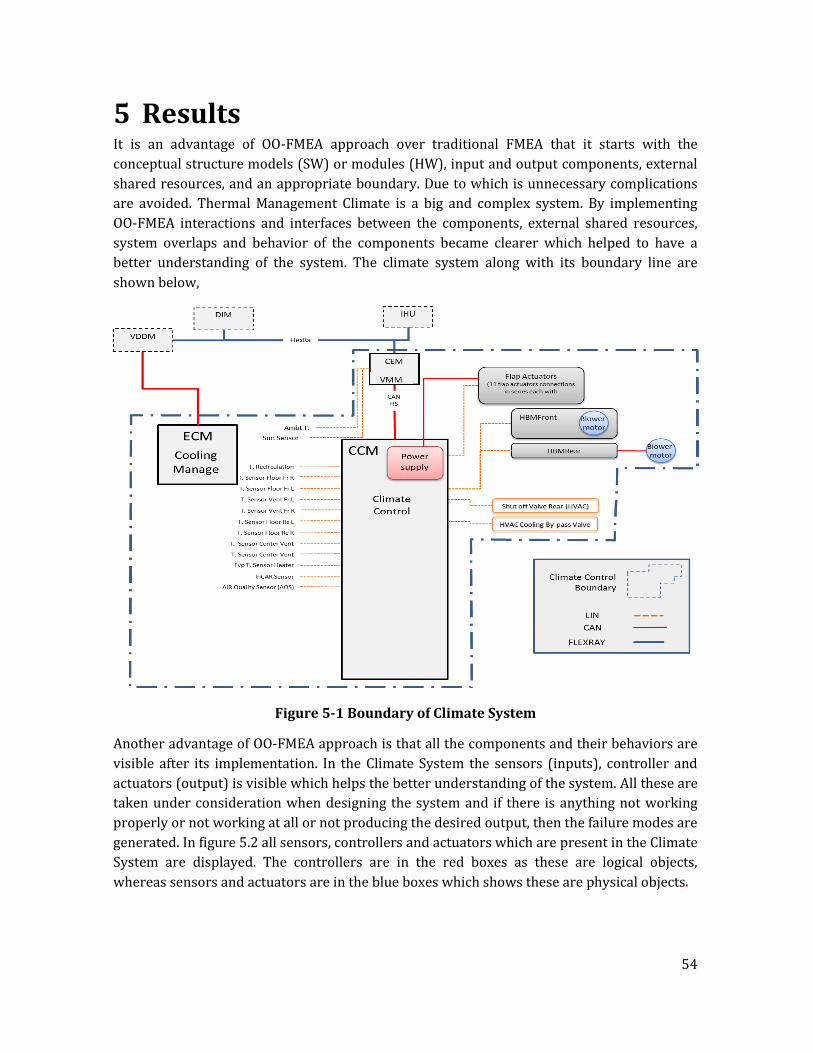
54
5 Results It is an advantage of OO-FMEA approach over traditional FMEA that it starts with the
conceptual structure models (SW) or modules (HW), input and output components, external
shared resources, and an appropriate boundary. Due to which is unnecessary complications
are avoided. Thermal Management Climate is a big and complex system. By implementing
OO-FMEA interactions and interfaces between the components, external shared resources,
system overlaps and behavior of the components became clearer which helped to have a
better understanding of the system. The climate system along with its boundary line are
shown below,
Figure 5-1 Boundary of Climate System
Another advantage of OO-FMEA approach is that all the components and their behaviors are
visible after its implementation. In the Climate System the sensors (inputs), controller and
actuators (output) is visible which helps the better understanding of the system. All these are
taken under consideration when designing the system and if there is anything not working
properly or not working at all or not producing the desired output, then the failure modes are
generated. In figure 5.2 all sensors, controllers and actuators which are present in the Climate
System are displayed. The controllers are in the red boxes as these are logical objects,
whereas sensors and actuators are in the blue boxes which shows these are physical objects.
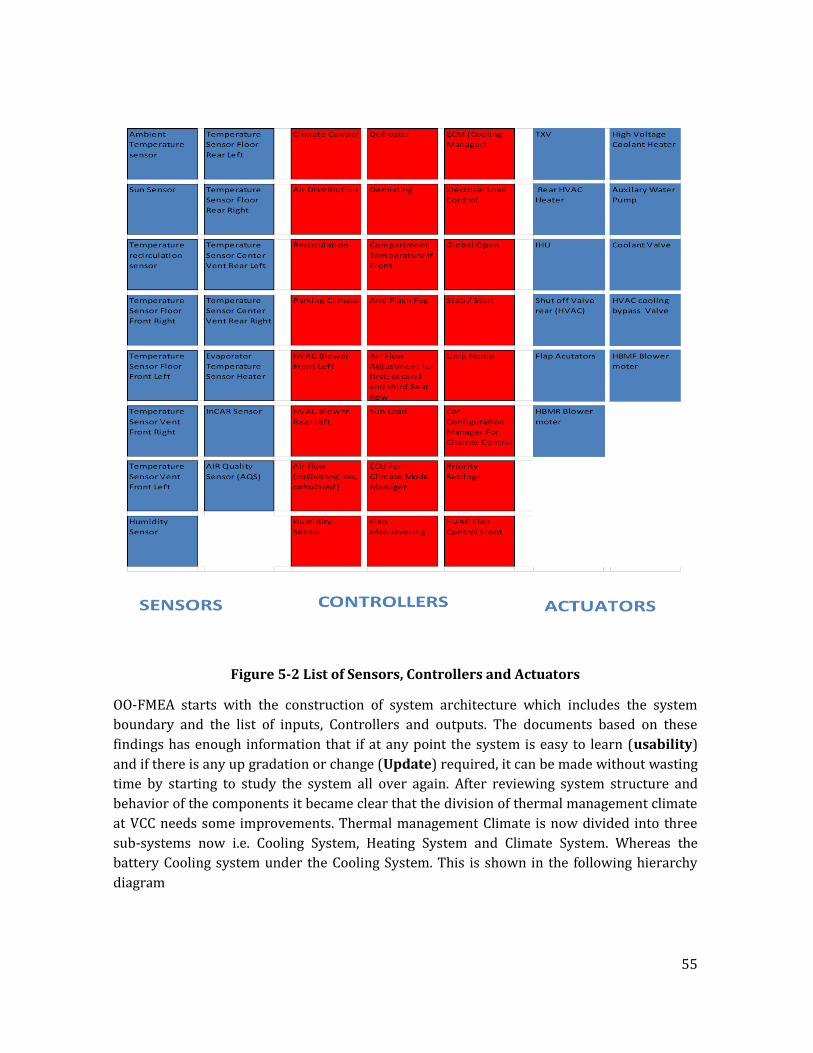
55
Figure 5-2 List of Sensors, Controllers and Actuators
OO-FMEA starts with the construction of system architecture which includes the system
boundary and the list of inputs, Controllers and outputs. The documents based on these
findings has enough information that if at any point the system is easy to learn (usability)
and if there is any up gradation or change (Update) required, it can be made without wasting
time by starting to study the system all over again. After reviewing system structure and
behavior of the components it became clear that the division of thermal management climate
at VCC needs some improvements. Thermal management Climate is now divided into three
sub-systems now i.e. Cooling System, Heating System and Climate System. Whereas the
battery Cooling system under the Cooling System. This is shown in the following hierarchy
diagram
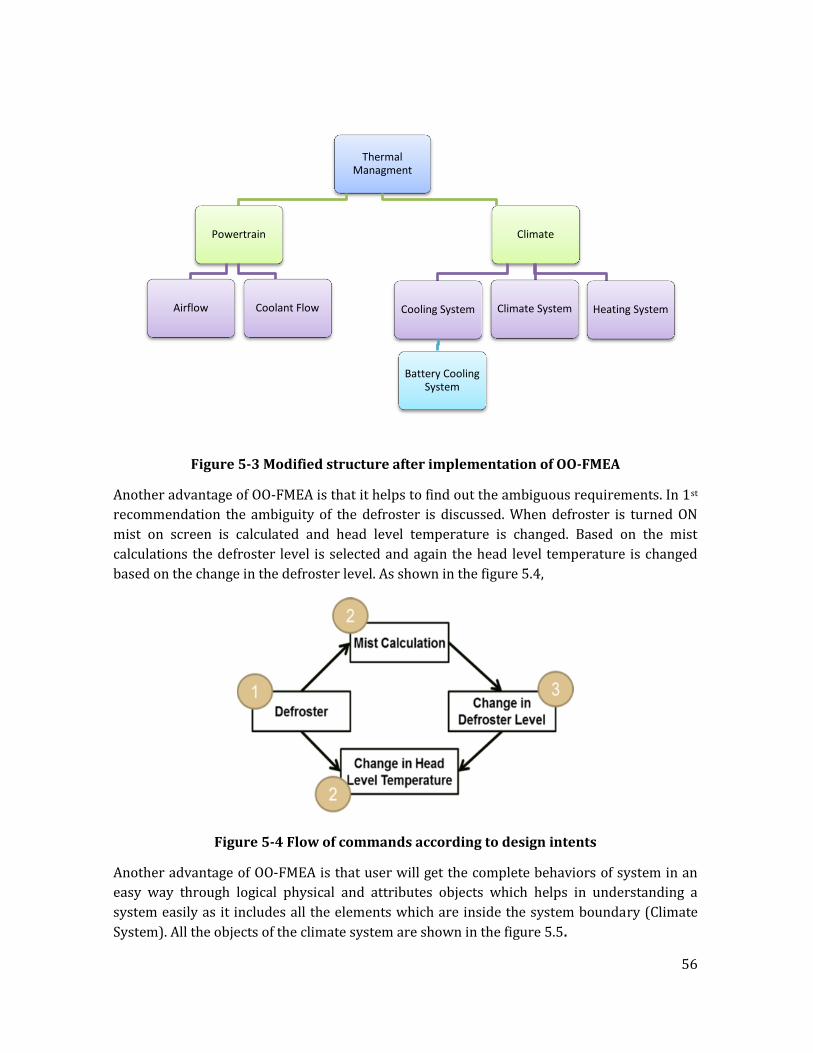
56
Figure 5-3 Modified structure after implementation of OO-FMEA
Another advantage of OO-FMEA is that it helps to find out the ambiguous requirements. In 1st
recommendation the ambiguity of the defroster is discussed. When defroster is turned ON
mist on screen is calculated and head level temperature is changed. Based on the mist
calculations the defroster level is selected and again the head level temperature is changed
based on the change in the defroster level. As shown in the figure 5.4,
Figure 5-4 Flow of commands according to design intents
Another advantage of OO-FMEA is that user will get the complete behaviors of system in an
easy way through logical physical and attributes objects which helps in understanding a
system easily as it includes all the elements which are inside the system boundary (Climate
System). All the objects of the climate system are shown in the figure 5.5.
Thermal Managment
Powertrain
Airflow Coolant Flow
Climate
Cooling System
Battery Cooling System
Climate System Heating System
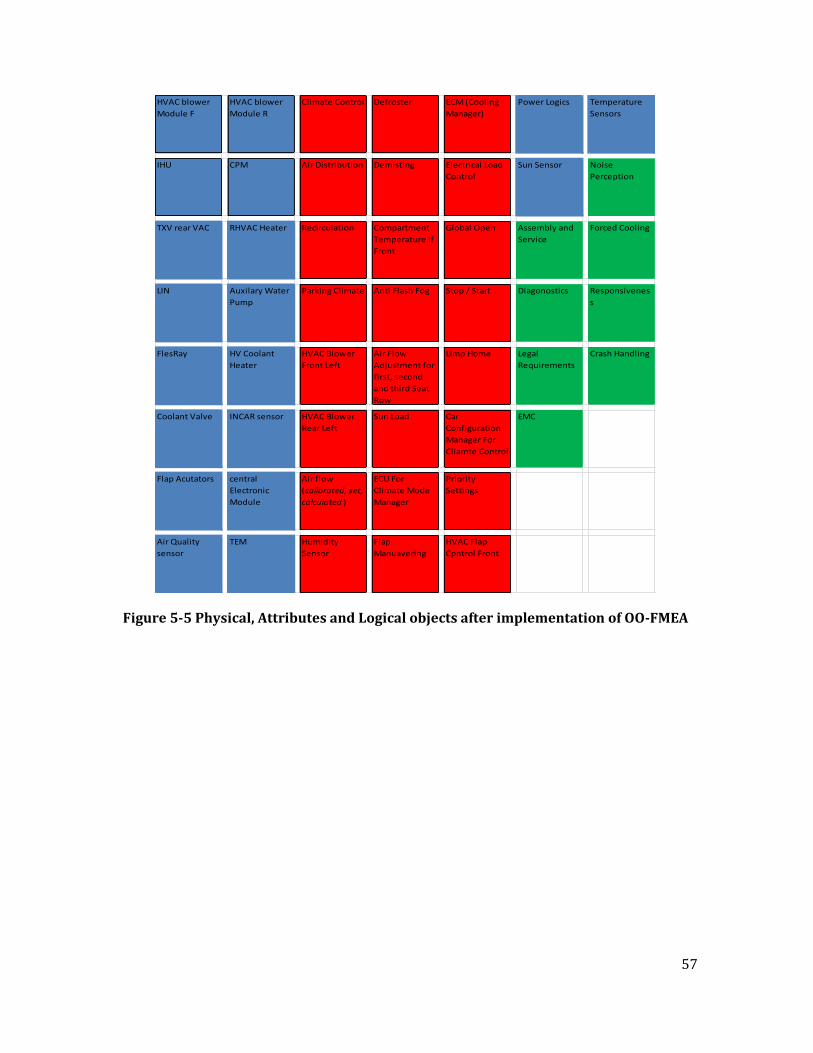
57
Figure 5-5 Physical, Attributes and Logical objects after implementation of OO-FMEA
HVAC blower
Module F
HVAC blower
Module R
Climate Control Defroster ECM (Cooling
Manager)
Power Logics Temperature
Sensors
IHU CPM Air Distribution Demisting Electrical Load
Control
Sun Sensor Noise
Perception
TXV rear VAC RHVAC Heater Recirculation Compartment
Temperature lf
Front
Global Open Assembly and
Service
Forced Cooling
LIN Auxilary Water
Pump
Parking Climate Anti Flash Fog Stop / Start Diagonostics Responsivenes
s
FlesRay HV Coolant
Heater
HVAC Blower
Front Left
Air Flow
Adjustment for
first, second
and third Seat
Row
Limp Home Legal
Requirements
Crash Handling
Coolant Valve INCAR sensor HVAC Blower
Rear Left
Sun Load Car
Configuration
Manager For
Cliamte Control
EMC
Flap Acutators central
Electronic
Module
Air flow
(calibrated, set,
calculated )
ECU For
Climate Mode
Manager
Priority
Settings
Air Quality
sensor
TEM Humidity
Sensor
Flap
Manuavering
HVAC Flap
Cpntrol Front
58
6 Conclusion and Future work
Conclusion
Current trend in the automobile industry is to introduce highly intelligent yet comfortable
and safe vehicles to achieve the higher level of customer satisfaction. To achieve such
reliability, the products must be reliable and the chances of problems or failures to occur in
them must be very low. The FMEA is a tool to eliminate or reduce any failure modes of
system. Lesser the failures are more reliable the product there is. Though being a widely used
approach it also requires some other design activities which are done before, along with and
after FMEA to take full advantage of the FMEA process. Quality of FMEA results are
dependent on the quality of inputs to FMEA which are provided by OO-FMEA. When it comes
to the complex systems like Climate System, traditional FMEA alone is not good to handle
these. In complex systems traditional FMEA treats each failure mode as independent which
does not show its dependencies or effects on the other components, this is solved by the use
of OO-FMEA where interactions and interface defines the dependencies and effects of
components over the others. In this thesis OO-FMEA is introduced and implemented on the
Climate System. This approach is quite capable of handling the complex systems. Unlike
traditional FMEA, this approach is very good when it comes to do any advancements or
applying the up gradations on any system. In OO-FMEA to find out the dependencies and
interactions between the objects, structure and boundaries of the system are of great help.
These boundaries also help to find out the dependencies of some objects over the other. It
helps engineers to decide; which of the objects need the Failure generation. It has a better
control over the starting of ending point because it stats with the making of system structure
and making of the system boundary.
Future Work
Climate system is basically a control oriented system which is composed of sensors,
controllers and actuators. Data from sensors is input to the system where certain actions are
performed based on the requirements and output data is given to the actuators to perform
the actions accordingly. Control system is basically a combination of certain processes and
interconnected components designed to achieve desired goals which take some inputs and
provide controlled output. OO-FMEA must also be applied to other types of systems such as
Transaction Processing Systems (TPS) and Data Processing Systems (DPS).
OO-FMEA should be implemented on TPS because this being a real time system has to be
faultless. To handle requests from multiple clients to updates to shared data resources is a
transaction Processing System [27]. TPS is a type of information system in which collection,
retrieval, modification and storage of data transactions is done. TPS is a real time system in
which an immediate response is given while the processing is completed. Transaction is
59
basically a series of decisions/operation taken on shared data all together and must be real
time and it must complete or fail its task as a unit. It must be independent of all other
processes which are running at the same time. In TPS if the process is completed it must
update both, from where the data is taken and to which data is transmitted. In TPS the data is
shared between numerous users, the requests are processed in real time. It may entertain
multiple requests at the same time and is called batch processing. In TPS there is a term
called time sharing which is basically the distribution of time between multiple users so as to
entertain their requests at the same time. Though this system gives the impression that the
user solely control over the system but it is shared. The Transaction processing cycle includes
data entry, generation of reports, analysis handling. The example of TPS is Automated Teller
Machine (ATM).
OO-FMEA should be implemented on Data Processing Systems (DPS). It is a type of
information system which includes accepting a set of data input, processing and storage of
data and in response providing a set of outputs [28]. It runs a check for any possible errors or
if data is not in accordance with required specifications, this process is called validation. It
provides information (alerts) about the errors and if data is correct then it records/save it.
Data processing system is a complex system which may include the encryption of data,
accumulation of multiple pieces of data, arrangement of data with specific measures
according to set standards, and analysis of data. In data processing activities, data has to be
stored for future use as it may not be needed instantly. Unlike control systems where the
efforts are made to increase the efficiency of control, in data processing system processing,
storing, collection and retrieval of data is done so that the difficult and frequently repeating
tedious operations are processed, For example the library management system.
After reviewing thermal management climate system, based on the behaviours and
interactions it was best suited to make three sub-systems out of it i.e. Climate System, Cooling
system and Heating system. In Climate System the heating of the components were
considered with the help Heating Manager. The heating system includes the heating of
passenger compartment and is important when discussing the passenger compartment
comfort. It was done in order to make the system less complex and the heating components
such as seat heating and steering heating were considered under the heating manager and
FMEA is yet to be completed on this system. OO-FMEA has been implemented on Cooling
System and Climate System but Heating System is not yet completed and it is recommend that
OO-FMEA should be completed for heating system.

60
Bibliography
[1] S. Narayanagounder and K. Gurusami, "A New Approach for Prioritization of Failure
Modes in Design FMEA using ANOVA," in World Academy of Science, Engineering and
Technology, 2009.
[2] Volvo Car Corporation, "Object Oriented Design Failure Modes and Effects Analysis,"
2013.
[3] H. Arabian Hoseynabadi, H. Oraee and P. Tavner, "Failure Modes and Effects Analysis
(FMEA) for Wind Turbines," Elsevier Editorial System(tm) for International Journal of
Electrical Power and Energy System, p. 14, 2010.
[4] D. Palumbo, "Automating Failure Modes And Effect Analysis," in Reliability and
Maintainability Symposium, 1994.
[5] T. T. Chen, Y.-S. Chen and Y.-K. Chung, "Implementation of an Enhanced FMEA System for
the PCBA Design Testing," in Proceedings of 2004 International Conference on the
Business of Electronic Product Reliability and Liability, Chung-Li, Taiwan, 2004.
[6] F. Shen, "Failure Modes and Effects Analysis of Dynamic Envirnment Test," in 8th
International Conference on Reliability, Maintainability and Safety, Beijing, 2009.
[7] N. Bidokhti, "FMEA Is Not Enough," in Reliability and Maintainability Symposium,RAMS
2009., 2009.
[8] The International Marine Contractors Association, "Guidance on Failure Modes & Effects
Analyses (FMEAs)," IMCA, 2002.
[9] Volvo Car Corporation, "Object Oriented Failure Modes and Effect Analysis Course,"
2012.
[10] M. Krasich, "Can Failure Modes and Effects Analysis Assure a Reliable Product?," in
Reliability and Maintainability Symposium, RAMS '07, 2007.
[11] P. K. Pareek, T. V. Nandikolmath and P. Gowda, "FMEA IMPLEMENTATION IN A
FOUNDRY IN BANGALORE TO IMPROVE QUALITY AND RELIABILITY," Mechanical
Engineering and Robotics Research, vol. 1, 2012.
[12] K. RIPLOVÁ, "TOOL OF RISK MANAGEMENT: FAILURE MODE AND EFFECTS ANALYSIS
AND FAILURE MODES, EFFECTS AND CRITICALITY ANALYSIS," Control and Management
Systems, vol. 5, pp. 111-119, 2007.
61
[13] H. Pentti and H. Atte, "Failure Modes and Effects Analysis of Software-based automation
system," 2002.
[14] W. Nessim and F. Zhang, "Powertrain Warm-up Improvement using Thermal
Management Systems," Scientific & Technology Research, vol. 1, no. 4, 2012.
[15] DELPHI, "Powertrain Thermal Management," DELPHI, 2007.
[16] Volvo Car Corporation, "Cooling and Climate Control System of SPA Hybrid," Volvo Cars
Corporation.
[17] BEHR, "Thermal Management For Hybrid Vehicles," BEHR, 2009.
[18] DELPHI, "Air Conditioning Compressors," DELPHI, 2007.
[19] M. O. Omoigui and O. D. Momoh, "An Overview of Hybrid Electric Vehicle technology," in
Vehicle Power and Propulsion Conference, 2009.
[20] Y. Bar-Yam, Dynamics Of Complex Systems, Addison-Wesley, 1997.
[21] V. S. Bagad and I. A. Dhotre, Computer Networks, Pune: Technical Publications Pune,
2009.
[22] R. V. D. and G. K., "Design of an In-Vehicle Network (Using LIN, CAN and FlexRay),
Gateway and its Diagnostics Using Vector CANoe," American Journal of Signal Processing,
vol. 1, pp. 40-45, 2011.
[23] S. C. Talbot and S. Ren, "Comparison of FieldBus Systems, CAN, TTCAN, FlexRay and LIN
in Passenger Vehicles," in Distributed Computing Systems Workshops, Chicago, 2009.
[24] M. Kunze, H. Glosch, B. Ehrbrecht, S. Billat, S. Messner, M. Ashauer and R. Zengerle,
"THERMAL DEWPOINT SENSING: A NEW APPROACH FOR DEWPOINT DETECTION AND
HUMIDITY SENSING," in Micro Electro Mechanical Systems, Freiburg, 2007.
[25] T. A. Montgomery and K. A. Marko, "Quantitative FMEA Automation," in Reliability and
Maintainability Symposium, 1997 Proceedings, Dearborn, 1997.
[26] The Unioversity of Wisconsin, "Failure Mode and Effect Analysis," Madison.
[27] P. S. S. Sundikar, Introduction to Database Management System.
[28] R. J. Reddy, Business Data Processing and Computer Applications, S.B. Nangia.
[29] The International Marine Contractors Association, "Guidence on Failure Modes & Effects

62
Analysis (FMEAs)," IMCA, 2002.
[30] S. Kahrobaee and S. Asgarpoor, "Risk-Based Failure Mode and Effect Analysis for Wind
Turbines (RB-FMEA)," in North American Power Symposium (NAPS), 2011.
[31] A. Nannikar, D. N. Raut, R. M. Chanmanwar and S. B. Kamble, "FMEA for Manufacturing
and Assembly Process," in Technology and Business Management, Mumbai, 2012.