Object Classification of Satellite Images Using Cluster Repulsion Based Kernel Fcm and Svm Classifi
11
IOSR Journal of Electronics and Communication Engineering (IOSR-JECE) e-ISSN: 2278-2834,p- ISSN: 2278-8735. Volume 7, Issue 3 (Sep. - Oct. 2013), PP 25-35 www.iosrjournals.org www.iosrjournals.org 25 | Page Object Classification of Satellite Images Using Cluster Repulsion Based Kernel Fcm and Svm Classifier Mr. S.V.S.Prasad 1 , Dr. T. Satya savithri 2 , Dr.Iyyanki V. Murali Krishna 3 1 Assoc. Professor Dept. of ECE, MLRIT, Hyderabad 2 Professor, Dept. of ECE, JNTU, Hyderabad 3 Retd. Professor, CSIT and Director (R&D), JNTU, Hyderabad Abstract: We investigated the Classification of satellite images and multispectral remote sensing data .we focused on uncertainty analysis in the produced land-cover maps .we proposed an efficient technique for classifying the multispectral satellite images using Support Vector Machine (SVM) into road area, building area and green area. We carried out classification in three modules namely (a) Preprocessing using Gaussian filtering and conversion from conversion of RGB to Lab color space image (b) object segmentation using proposed Cluster repulsion based kernel Fuzzy C- Means (FCM) and (c) classification using one-to-many SVM classifier. The goal of this research is to provide the efficiency in classification of satellite images using the object-based image analysis. The proposed work is evaluated using the satellite images and the accuracy of the proposed work is compared to FCM based classification. The results showed that the proposed technique has achieved better results reaching an accuracy of 79%, 84%, 81% and 97.9% for road, tree, building and vehicle classification respectively. Keywords:-Satellite image, FCM Clustering, Classification, SVM classifier. I. Introduction Multispectral image brings a huge basis of data for studying spatial and temporal alters aptitude of the ecological factors. It can be utilized in a figure of applications which comprises of reconnaissance, making of mapping manufactured goods for military and civil use, assessment of environmental injure, nursing of land use, radiation level check, urban planning, growth directive, soil test and crop result augmentation . One main area where we use multispectral image is in the process of classification and mapping of vegetation over large spatial scales, as the remote sensing data brings high-quality coverage, mapping and classification of land cover featureslike vegetation, soil, water and forests. These behave like a substitute for the standard classification techniques, which necessitate luxurious and time-intensive field surveys. Researches and studies on image classification have long been enthralled the concentration of the scientific community, from the time when many environmental and socioeconomic presentations are based on the classification penalty. Usually, a classification system makes a classification map of the particular meaningful features or classes of land cover section in a part. Regardless of all the compensation, classification of land-cover using multispectral imagery is a difficult subject since of the difficulty of landscapes and the spatial and spectral resolution of the images being occupied. Multispectral images comprise of info collected over a wide range of changes on frequencies and these frequencies change over different areas (irregular or frequency variant behaviour of the signal). The overall complex nature of multispectral image data can be credited to the spectral characteristics with correlated bands and spatial features related within the same band which is also known as the spatial association. A resourceful method capable of arranging the spectral and spatial (contextual) info existing in the multispectral data can boost the accuracy level of the classification in a good way when matched with the traditional non-contextual information based techniques. Researches and studies on multispectral image categorization have long acquired the attention of the scientific community, because mainly environmental and socio-economic applications are based on the classification grades. Multispectral image classification can be measured as a mutual project of both image processing and classification scheme. Usually, image classification, in the procedure of remote sensing is the process of referring pixels or the basic units of an image to the classes. It is chiefly probable to create groups of similar pixels found in image data into classes that match the informational category of user interest by matching the pixels to one another and to those of the said identity. Many technique of image classification have been introduced and numerous areas like image analysis and prototype recognition use the vital term, classification. In many circumstances, the classification itself may become the entity of the analysis and serve as the ultimate matter. In other scenarios, the categorization aims to be the middle step in more complicated computations, such as land-degradation studies, process studies, landscape modelling, coastal zone management, resource management and other environment monitoring applications. Due to this, image categorization has grown and established as a major tool for learning digital images. Furthermore, the choice of the ideal classification method
-
Upload
iosr-journals -
Category
Documents
-
view
229 -
download
1
description
http://www.iosrjournals.org/iosr-jece/papers/Vol7-Issue3/E0732535.pdf?id=6678
Transcript of Object Classification of Satellite Images Using Cluster Repulsion Based Kernel Fcm and Svm Classifi
IOSR Journal of Electronics and Communication Engineering (IOSR-JECE)
e-ISSN: 2278-2834,p- ISSN: 2278-8735. Volume 7, Issue 3 (Sep. - Oct. 2013), PP 25-35 www.iosrjournals.org
www.iosrjournals.org 25 | Page
Object Classification of Satellite Images Using Cluster Repulsion
Based Kernel Fcm and Svm Classifier
Mr. S.V.S.Prasad1, Dr. T. Satya savithri
2, Dr.Iyyanki V. Murali Krishna
3
1 Assoc. Professor Dept. of ECE, MLRIT, Hyderabad 2 Professor, Dept. of ECE, JNTU, Hyderabad
3 Retd. Professor, CSIT and Director (R&D), JNTU, Hyderabad
Abstract: We investigated the Classification of satellite images and multispectral remote sensing data .we
focused on uncertainty analysis in the produced land-cover maps .we proposed an efficient technique for
classifying the multispectral satellite images using Support Vector Machine (SVM) into road area, building area and green area. We carried out classification in three modules namely (a) Preprocessing using Gaussian
filtering and conversion from conversion of RGB to Lab color space image (b) object segmentation using
proposed Cluster repulsion based kernel Fuzzy C- Means (FCM) and (c) classification using one-to-many SVM
classifier. The goal of this research is to provide the efficiency in classification of satellite images using the
object-based image analysis. The proposed work is evaluated using the satellite images and the accuracy of the
proposed work is compared to FCM based classification. The results showed that the proposed technique has
achieved better results reaching an accuracy of 79%, 84%, 81% and 97.9% for road, tree, building and vehicle
classification respectively.
Keywords:-Satellite image, FCM Clustering, Classification, SVM classifier.
I. Introduction
Multispectral image brings a huge basis of data for studying spatial and temporal alters aptitude of the
ecological factors. It can be utilized in a figure of applications which comprises of reconnaissance, making of
mapping manufactured goods for military and civil use, assessment of environmental injure, nursing of land use, radiation level check, urban planning, growth directive, soil test and crop result augmentation . One main area
where we use multispectral image is in the process of classification and mapping of vegetation over large spatial
scales, as the remote sensing data brings high-quality coverage, mapping and classification of land cover
featureslike vegetation, soil, water and forests. These behave like a substitute for the standard classification
techniques, which necessitate luxurious and time-intensive field surveys. Researches and studies on image
classification have long been enthralled the concentration of the scientific community, from the time when many
environmental and socioeconomic presentations are based on the classification penalty. Usually, a classification
system makes a classification map of the particular meaningful features or classes of land cover section in a part.
Regardless of all the compensation, classification of land-cover using multispectral imagery is a difficult subject
since of the difficulty of landscapes and the spatial and spectral resolution of the images being occupied.
Multispectral images comprise of info collected over a wide range of changes on frequencies and these
frequencies change over different areas (irregular or frequency variant behaviour of the signal). The overall complex nature of multispectral image data can be credited to the spectral characteristics with correlated bands
and spatial features related within the same band which is also known as the spatial association. A resourceful
method capable of arranging the spectral and spatial (contextual) info existing in the multispectral data can
boost the accuracy level of the classification in a good way when matched with the traditional non-contextual
information based techniques. Researches and studies on multispectral image categorization have long acquired
the attention of the scientific community, because mainly environmental and socio-economic applications are
based on the classification grades.
Multispectral image classification can be measured as a mutual project of both image processing and
classification scheme. Usually, image classification, in the procedure of remote sensing is the process of
referring pixels or the basic units of an image to the classes. It is chiefly probable to create groups of similar
pixels found in image data into classes that match the informational category of user interest by matching the pixels to one another and to those of the said identity. Many technique of image classification have been
introduced and numerous areas like image analysis and prototype recognition use the vital term, classification.
In many circumstances, the classification itself may become the entity of the analysis and serve as the ultimate
matter. In other scenarios, the categorization aims to be the middle step in more complicated computations, such
as land-degradation studies, process studies, landscape modelling, coastal zone management, resource
management and other environment monitoring applications. Due to this, image categorization has grown and
established as a major tool for learning digital images. Furthermore, the choice of the ideal classification method

Object Classification Of Satellite Images Using Cluster Repulsion Based Kernel Fcm And Svm Classifier
www.iosrjournals.org 26 | Page
to be used can have a considerable effect on the outcomes of it. The classification is used as a major product or
as one of many computational processes used for deriving info from an image for further learning.
The obtainable literature has a good number of supervise procedure that has been created to conquer
the multispectral data classification difficult prospect. The statistical method used for the earlier studies of land-
cover categorization is the utmost likelihood classifier. In fresh times, various studies have applied artificial intelligence technique as seconds to the remotely-sensed image classification applications. Besides, different
ensemble classification technique has been presented to increase the classification precision. Scientists have
made great strides in creating well-organized classification organization and methods for increasing the
classification accuracy. Here, we have proposed an efficient technique for classifying the multispectral satellite
images using SVM into road area, building area and green area. The classification is carried out in three
modules namely (a) Pre-processing using Gaussian filtering and conversion from conversion of RGB to Lab
colour space image (b) object segmentation using proposed Cluster repulsion based kernel FCM and (c) Final
classification using one-to-many SVM classifier. The goal of this research is to provide the efficiency in
classification of satellite images using the object-based image analysis.
The rest of the paper is organized as follows: A brief review of researches related to the proposed
technique is presented in section 2. The proposed classification technique is presented in Section 3. The
experimental results and discussion are given in Section 4. The conclusions are summed up in Section 5.
II. Review Of Related Works A lot of research works have been carried out in the literature for remotely sensed multispectral image
classification and some of them have motivated us to take up this research. Brief reviews of some of those
recent significant researches are presented below: K Perumal and R Bhaskaran [1] proposed a proficient land
use image classification system with the help of image processing methods and Support Vector Machines. The
proposed method consisted of SVM Training and then, SVM Testing. In the training part, the multispectral
image data was done un-sharp filtering and nonlinear isotropic diffusion segmentation. The segmented image
pixels matching the land use regions were then given as training input to the SVM. And in order to have the testing in an automatic manner, the regions segmented by nonlinear isotropic diffusion segmentation were then
mined out with the use of the active contour model. Then, the trained SVM precisely classified the land cover
regions based on the pixel values of the mined out area. The experimental results showed the efficacy of the
proposed classification technique in classifying land cover regions.
JanKnorn et al. [2] presented a technique for the Landsat image classification. Their goal was to
remove the drawbacks of a normal system and to examine the chain classifications, which is to the classify
Landsat images based on the info in the overlapping regions of nearby sights. The SVMs classified 8 sight
scenes with a precision in the range of 92.1% and 98.9%. Xiaochen Zou and Daoliang Li [3] proposed an
outline of a number of different techniques to image texture analysis. All the outcomes of the classifications
were matched and computed. In their work, they used grey level co-occurrence matrix (GLCM) and the feature
label images, which assisted in the classification of remote sensing. Reda A. El-Khoribi [4] proposed a method to perform classification of multispectral images in which, a discriminative training procedure for discrete
hidden Markov tree (HMT) productive structures were given to the multi-resolution ranklet changes and it was
performed and evaluated on a set of Landsat 7-band images and used the acceptable statistics of the HMT
generative model. B Sowmya and B Sheelarani [5] clarified the mission of land cover classification making use
of the renewed fuzzy C means. In order to assess the image on all of its colours, the likely colours were grouped
together by the renewed fuzzy C means algorithm. The segmented images were matched using image quality
evaluation metrics which used peak signal to noise ratio (PSNR), error image and compression ratio. The time
needed for image segmentation was also used as an assessment factor.
V.K.Panchal et al. [6] presented a technique in which concentrated on the classification of the satellite
image of a specific land cover making use of the concept of Bio-geography based Optimization. Alterations
were applied to the original BBO algorithm to incorporate clustering and the modified changed algorithm was
employed to classify the satellite image of the given area. Highly precise land cover features were mined successfully when the proposed technique was made use of. Huang B et al. [7] presented a SVM modeling
framework to discuss and assess the land-use change in relation to different factors such as population, distance
to roads and facilities, and surrounding land use. An unbalanced SVM was implemented by improving the
standard normal SVMs in order to solve the issues faced by normal SVM, such as having an unstable land-use
data.
Object Classification Of Satellite Images Using Cluster Repulsion Based Kernel Fcm And Svm Classifier
www.iosrjournals.org 27 | Page
III. Proposed Object Classification Of Satellite Images Using Cluster Repulsion
Based Kernel Fcm Clustering And Svm Classifier
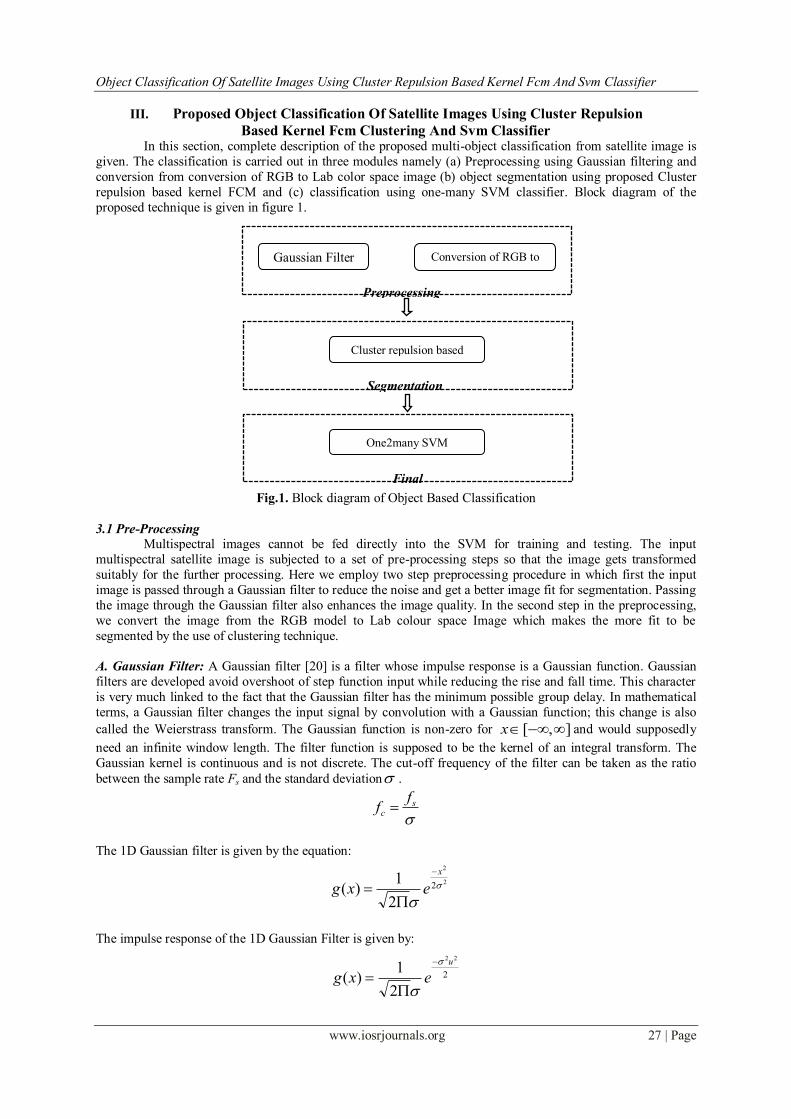
In this section, complete description of the proposed multi-object classification from satellite image is
given. The classification is carried out in three modules namely (a) Preprocessing using Gaussian filtering and
conversion from conversion of RGB to Lab color space image (b) object segmentation using proposed Cluster
repulsion based kernel FCM and (c) classification using one-many SVM classifier. Block diagram of the
proposed technique is given in figure 1.
Fig.1. Block diagram of Object Based Classification
3.1 Pre-Processing
Multispectral images cannot be fed directly into the SVM for training and testing. The input
multispectral satellite image is subjected to a set of pre-processing steps so that the image gets transformed
suitably for the further processing. Here we employ two step preprocessing procedure in which first the input
image is passed through a Gaussian filter to reduce the noise and get a better image fit for segmentation. Passing
the image through the Gaussian filter also enhances the image quality. In the second step in the preprocessing,
we convert the image from the RGB model to Lab colour space Image which makes the more fit to be
segmented by the use of clustering technique.
A. Gaussian Filter: A Gaussian filter [20] is a filter whose impulse response is a Gaussian function. Gaussian
filters are developed avoid overshoot of step function input while reducing the rise and fall time. This character
is very much linked to the fact that the Gaussian filter has the minimum possible group delay. In mathematical
terms, a Gaussian filter changes the input signal by convolution with a Gaussian function; this change is also
called the Weierstrass transform. The Gaussian function is non-zero for ],[ x and would supposedly
need an infinite window length. The filter function is supposed to be the kernel of an integral transform. The
Gaussian kernel is continuous and is not discrete. The cut-off frequency of the filter can be taken as the ratio
between the sample rate Fs and the standard deviation .
s
c
ff
The 1D Gaussian filter is given by the equation:
2
2
2
2
1)(
x
exg
The impulse response of the 1D Gaussian Filter is given by:
2
22
2
1)(
u
exg
Gaussian Filter Conversion of RGB to
Lab color space
Preprocessing
Module
Cluster repulsion based
kernel FCM
Segmentation
Module
One2many SVM
Final
Classification
Module

Object Classification Of Satellite Images Using Cluster Repulsion Based Kernel Fcm And Svm Classifier
www.iosrjournals.org 28 | Page
Here in the preprocessing step, the input image is passed through a Gaussian filter which results in reduction of
the noise in the input image and also results in obtaining an image fit for further processing. Passing the image
through the Gaussian filter also enhances the image quality.
B. Conversion of RGB to Lab colour space Image: A Lab color space [21] is a color-opponent space with dimension L for lightness and „a‟ and „b‟ for the color-opponent dimensions, based on nonlinearly compressed
CIE XYZ color space coordinates. Different from the RGB and CMYK color models, Lab color is developed to
approximate the human vision. It aims for perceptual uniformity, and its L component relatively corresponds to
human perception of lightness. It is therefore used to make accurate color balance corrections by changing the
output curves in the „a‟ and „b‟ components, or to regulate the lightness contrast using the L component. In RGB
or CMYK spaces, which model the output of physical devices instead of the human visual perception, these
changes are done with the aid of the corresponding blend modes in the editing application.
3.2 Segmentation Module
After applying the preprocessing steps to the input multispectral satellite image, we get an image fit to
be segmented. This image is made of thousands of pixels and to classify this image based on each of this
individual pixel is a hectic task and is time consuming. Processing this huge amount of data also results in increase of error rate and the degraded performance of the classifier system. Hence, we cluster the pre-processed
image into clusters and then select the centroid of each of these clusters formed for the classification process.
This is due to the fact, that each member in a cluster will have almost similar pixel values and differ from the
centroid value of the cluster by only a small amount. Hence, this centroid value will represent all the pixels in
the clusters. As a result, the classification of a centroid of a cluster will act virtually as classification of all the
pixels in the cluster. This result in reducing the number of the inputs to the classifier system which reduce the
classifier complexity and also the time incurred. It also results in making the system more efficient and accurate.
Cluster analysis is a technique for classifying data, i.e., to divide a given dataset into a set of classes or
clusters. The goal is to divide the dataset in such a way that two cases from the same cluster are as similar as
possible and two cases from different clusters are as dissimilar as possible. The idea behind cluster repulsion is
to combine an attraction of data to clusters with repulsion between different clusters. Here, the distance between clusters and the data points assigned to them should be minimized. The distance between clusters should to be
maximized and there should be no empty clusters, i.e., for each cluster there must be datum with non-vanishing
membership degree. Membership degrees should be close to one and, of course, the trivial solution of all
membership degrees being zero should be suppressed.
The degrees of membership to which a given data point belongs to the different clusters are computed
from the distances of the data point to the cluster centers with respect to the size and the shape of the cluster as
stated by the additional prototype information. The closer a data point lies to the center of a cluster, the higher is
its degree of membership to this cluster. Hence the problem to divide a dataset P
n RdddD },...,,{ 21
into
k clusters can be stated as the task to minimize the distances of the data points to the cluster centers and to
maximize the degrees of membership.
In probabilistic fuzzy clustering the task is to minimize the objective function:
),(),,( 2
1 1
ji
k
i
n
j
m
ij dsDJ
Subject to: 01
n
j
ij , for all },...,1{ ki and 11
k
j
ij , for all },...,1{ nj
Where ]1,0[ij is the membership degree of datum jd
to cluster
iik , is the prototype of clusterik , and
),( ji ds
is the distance between datum jd
and prototype i . is the set of all k clusters k
,...,, 21 .
][ ij is called the fuzzy partition matrix and the parameter m is called the fuzzifier.
In possibilistic fuzzy clustering, more intuitive assignment of degrees of membership is achieved by dropping
constraint which forces ij away from zero for all },...,2,1{ ki . That is, the objective function J is modified
to:

Object Classification Of Satellite Images Using Cluster Repulsion Based Kernel Fcm And Svm Classifier
www.iosrjournals.org 29 | Page
n
j
m
ij
k
i
iji
k
i
n
j
m
ij dsDJ11
2
1 1
)1(),(),,(
Where, 0i . The first term leads to a minimization of the weighted distances while the second term
suppresses the trivial solution by making allforij 0 },...,2,1{ ki . This approach is called possibilistic
clustering, because the membership degrees for one datum resemble the possibility. The formula for updating
the membership degrees that is derived from this objective function is:
1
12
)),(
(1
1
m
i
ij
ijds
is chosen for each cluster separately and can be determined by the equation:
n
j
ij
m
ij
i
j dsM
G
1
2 ),(
Applying KFCM using Gaussian Kernels, we get the centroid updation formula:
n
j
ij
m
ij
n
j
jij
m
ij
i
cdK
dcdK
c
1
1
),(
).,(
Where K is the Gaussian kernel and ),( ji ddK the kernel function is defined in DKFCM by:
)||||
exp(),(2
2
r
ddddK
ji
ji
)||],[],[||
exp(2
2
r
dddd jjii
)||||
exp(2
22
r
dddd jiji
)||
exp()||
exp(2
2
2
2
r
dd
r
dd jiji
),(),().,( 21 jiCOMjiji ddKddKddK
3.3 Feature Extraction
After pre-processing and segmentation, the color feature is extracted from every segment. The average
HSV value is the color feature of a region which is then converted to a semantic color name. Firstly, the HSV
values are normalized to the range [0,1]. The range from zero to one is uniformly quantized into 10 segments,
where each segment is denoted by a base colors. The ten base colors are red, orange, yellow, green, aqua,
aquamarine, blue, violet, purple and magenta. Table 1 shows the semantic colors with their corresponding quantized HSV values.
Value of HSV Base Color
0-0.1 Orange
0.1-0.2 Yellow
0.2-0.3 Green
0.3-0.4 Aqua

Object Classification Of Satellite Images Using Cluster Repulsion Based Kernel Fcm And Svm Classifier
www.iosrjournals.org 30 | Page
0.4-0.5 Aquamarine
0.5-0.6 Blue
0.6-0.7 Violet
0.7-0.8 Purple
0.8-0.9 Magenta
0.9-1 Red
Table 1: Color Semantic Table based on Average HSV value
3.4 Final Classification Module
After feature extraction, we employ Support Vector Machines (SVM) for multi-object classification.
Support Vector Machines (SVM) [16] is a statistical learning based classification system where the basic idea is
to find a hyper plane which separates the d-dimensional data perfectly into its two classes. Consider there are
k training examples denoted by { , }j ja b where 1,2,...,j k . Here each example has g inputs ( )g
ja R and
class label with one of the two values ( { 1,1})jb . The hyper planes in gR are hence parameterized by a
vector h and constant c , which can be expressed by the equation:
. 0h a c
Here h is the vector orthogonal to the hyperplane. Considering the hyper plane ( , )h c , function that separates
the data can be defined as:
( ) ( . )f a sign h a b
The hyper plane ( , )h c can be equally expressed by all pairs ( , )h c for R . Hence we define a
canonical hyperplane to be that which separates the data form hyperplane by a distance of atleast 1 which can be
expressed as:
. 1, 1j ja h c when b
. 1, 1j ja h c when b
This can be compactly defined as:
( . ) 1,j jb a h c when j
In order to obtain the geometric distance from hyperplane to the data point, we normalize by magnitude h to get:
( . ) 1(( , ), )
|| || || ||
j j
j
b a h cd h c a
h h
To maximize the geometric distance to the closest data points, we need to minimize || ||h .The problem can be
eventually transformed into:
1 1 1 1
1( ) ( . )
2
k k k
j j i j i j i
j j
H b b a a
Subject to:
1
0 ( )k
j j j
j
b where C j
Here, where is the vector of k non-negative Lagrange multipliers and C is a constant. From the derivation,
the hyperplane can also be defines as:

Object Classification Of Satellite Images Using Cluster Repulsion Based Kernel Fcm And Svm Classifier
www.iosrjournals.org 31 | Page
. .j j j
j
h b a
It can be also shown that:
( ( . ) 1) 0j j jb h a c
The input satellite image is classified into four classes using a one-to-many SVM. The classifications are green
area, road area, vehicle and building area. The operation of a one-to-many is explained in figure 2. Multiple
loops of binary SVM operation is carried out for one-to-many SVM operation. Here it can be seen that there are
four classes and initially matching is carried out between class 1 and rest of the classes (class 2, 3 and 4 in our
case). If class 1 matches, then it is assigned class 1 label else the matching out between class 2, class 3 and class
4 and class labeling is done accordingly.
Figure 2: Block diagram of One-To-Many SVM
The pre-processed satellite image is clustered using Cluster repulsion based kernel FCM to obtain clusters. Here
it can be seen that each member in a cluster will have almost similar pixel values and differ from the centroid
value of the cluster by only a small amount. Hence the centroid value can represent all the pixels in the clusters.
Hence, by performing single step of classifying the centroid of a cluster will act like as multiple steps of
classifying all the pixels in the cluster. This result in reducing the number of the inputs to the classifier system
which reduce the classifier complexity and also the time incurred.
Suppose we consider the thi cluster having n elements where each pixel having a value of kP . Then, the
centroid value of the thi cluster, iO can be calculated as
n
P
O
n
k
k
i
1 . Similarly, repeat the process for all
the clusters to obtain the centroid values for each of the clusters. Suppose there are N numbers of cluster, then
centroid set O ={ ,1O ,2O ,3O ……. }, NO , will be given as the input to the SVM classifier.
Classification is carried out in two phases in SVM, namely testing phase and training phase. In the training
phase the system is being taught using the features extracted and in testing phase, actual classification takes
place. The feature extracted for the purpose is the average HSV value as the color feature of a region which is
then converted to a semantic color name. In the testing phase, the input is classified by the trained SVM based on the features and the classifications are road area, green area, building area and vehicle.
Input
Matchin
g
between
class 1
and rest Matchin
g
between
class 2
class 3
and class
4
Class 1
label
Class 2
label
Class 3 or
class 4
label
If matching to
class 1
If matching
to class 2
If
matching
to rest of
class
If matching to
rest of the class

Object Classification Of Satellite Images Using Cluster Repulsion Based Kernel Fcm And Svm Classifier
www.iosrjournals.org 32 | Page
IV. Results And Experimentation The results obtained for the proposed satellite classification technique is discussed in this section. The
experimental set up and the evaluation metrics used are given in section 4.1. The experimental results obtained are plotted in section 4.2 and performance analysis is made in section 4.3.
4.1 Experimental set up and evaluation metrics
The proposed technique is implemented in MATLAB on a system having 6 GB RAM and 2.6 GHz
Intel i-7 processor. The evaluation metrics used to evaluate the proposed technique is the accuracy of the
classification. The accuracy of a measurement system is the degree of closeness of measurements of
a quantity to that quantity's actual true value.
4.2 Experimental results
The experimental results obtained for the proposed technique are given in this section. Figure 3 and
figure 4 gives the input and preprocessed input image. Figure 5 gives the plot obtained for building classification using proposed technique, figure 6 gives the plot obtained for road classification. Figure 7 gives
the plot obtained for vegetation classification and figure 8 provides the extracted vehicle from the satellite
image. In the building classification plot, we can see that the building areas are marked in red and others
unchanged, similarly in the road classification plot, we can see that the road areas are marked in blue and others
unchanged and in the vegetation classification plot, we can see that the tree areas are marked in green and others
unchanged. The figures show that the proposed technique has achieved good results.
Figure 3: Input Image
Figure 4:Preprocessed Input Image
Figure 5: Image obtained for building classification using proposed technique

Object Classification Of Satellite Images Using Cluster Repulsion Based Kernel Fcm And Svm Classifier
www.iosrjournals.org 33 | Page
Figure 6: Image obtained for road classification using proposed technique
Figure 7: Image obtained for tree classification using proposed technique
Figure 8: Image obtained for car classification using proposed technique
4.3 Performance Analysis
The performance is evaluated by the evaluation metric of accuracy. The accuracy obtained by the
various classifications by our technique is given in figure 9 to 12. Here, for comparison, existing clustering
technique, FCM method is taken and also, neural network classifier is also taken to do the comparison. For
SVM classifier, different kernels such as, 'linear', 'quadratic', 'polynomial', and 'RBF‟ are also used for
comparative analysis. From the results, it is clear that the proposed clustering technique with quadratic kernel
have achieved better results when compared to FCM based classification with neural network.
For building area classification, it can be observed that the classification accuracy of proposed
clustering technique with RBF kernel came about 81.07% for our proposed technique and FCM based technique with neural network had the classification accuracy of 81.04%. For road area classification, the classification
accuracy of proposed technique with RBF kernel came about 79.09% and FCM based technique with neural
network had the classification accuracy of 79.89%. For tree area classification, it can be shown that the
classification accuracy of proposed technique with RBF kernel came about 84.0% for our proposed technique
and FCM based technique with neural network had the classification accuracy of 79.7%. For vehicle area
classification, it can be proved that the classification accuracy of proposed technique with RBF kernel achieved
about 97.92% for our proposed technique and FCM based technique with neural network had the classification
accuracy of 97.75% . In table 1, I summarized the accuracy of different methods.

Object Classification Of Satellite Images Using Cluster Repulsion Based Kernel Fcm And Svm Classifier
www.iosrjournals.org 34 | Page
Figure 9. Classification accuracy of building area
Figure 10. Classification accuracy of road area
Figure 11. Classification accuracy of tree area
Object s name NN With FCM SVM WITH proposed
method
BUILDING 81.04 81.07
ROAD 79.89 79.07
TREE 79.7 84.02
VEHICLE 97.5 97.92
Table 1. Accuracy of the different methods in object classification
Figure 12. Classification accuracy of vehicle

Object Classification Of Satellite Images Using Cluster Repulsion Based Kernel Fcm And Svm Classifier
www.iosrjournals.org 35 | Page
V. Conclusion The proposed satellite image classification to road area, building area, vehicle area and vegetation area
is carried out using object segmentation using proposed Cluster repulsion based kernel FCM and one-many SVM classifier. Initially, preprocessing using Gaussian filtering and conversion from conversion of RGB to Lab
color space image is carried out and then object segmentation and final classification is done to have the
classified output. The proposed work is evaluated using the satellite images and the accuracy of the proposed
work is compared to FCM based classification with neural network. The results showed that the proposed
technique has achieved better results reaching an accuracy of 79%, 84%, 81% and 97.9% for road, tree, building
and vehicle classification respectively.
References [1] K Perumal and R Bhaskaran , “SVM-Based Effective Land Use Classification System For Multispectral Remote Sensing Images”,
(IJCSIS) International Journal of Computer Science and Information Security, Vol. 6, No. 2, pp.95-107, 2009.
[2] Jan Knorn, Andreas Rabe, Volker C. Radeloff, Tobias Kuemmerle, Jacek Kozak, Patrick Hostert, "Land cover mapping of large
areas using chain classification of neighboring Landsat satellite images", Remote Sensing of Environment, Vol. 118, pages 957-964
, 2009.
[3] Xiaochen Zou, Daoliang Li, "Application of Image Texture Analysis to Improve Land Cover Classification", WSEAS Transactions
on Computers, Vol. 8, No. 3, pp. 449-458, March 2009.
[4] Reda A. El-Khoribi, "Support Vector Machine Training of HMT Models for Multispectral Image Classification", IJCSNS
International Journal of Computer Science and Network Security, Vol.8, No.9, pp.224-228, September 2008.
[5] B Sowmya and B Sheelarani , “Land cover classification using reformed fuzzy C-means”, Sadhana, Vol. 36, No. 2, pp. 153–165,
2011.
[6] V.K.Panchal, Parminder Singh, Navdeep Kaur and Harish Kundra, “Biogeography based Satellite Image Classification”,
International Journal of Computer Science and Information Security IJCSIS, Vol. 6, No. 2, pp. 269-274, November 2009.
[7] Huang B, Xie C, Tay R, Wu B, 2009, "Land-use-change modeling using unbalanced support-vector machines" , Environment and
Planning B: Planning and Design , Vol.36, No.3, pp.398-416,2009.
[8] James A. Shine and Daniel B. Carr, "A Comparison of Classification Methods for Large Imagery Data Sets", JSM 2002 Statistics
in an ERA of Technological Change-Statistical computing section, New York City, pp.3205-3207, 11-15 August 2002.
[9] D. Lu, Q. Weng, "A survey of image classification methods and techniques for improving classification performance", International
Journal of Remote Sensing, Vol. 28, No. 5, pp. 823-870, January 2007.
[10] M. Govender, K. Chetty, V. Naiken and H. Bulcock, "A comparison of satellite hyperspectral and multispectral remote sensing
imagery for improved classification and mapping of vegetation", Water SA, Vol. 34, No. 2, April 2008.
[11] Jasinski, M. F., "Estimation of subpixel vegetation density of natural regions using satellite multispectral imagery", IEEE
Transactions on Geoscience and Remote Sensing, Vol. 34, pp. 804–813, 1996.
[12] C. Palaniswami, A. K. Upadhyay and H. P. Maheswarappa, "Spectral mixture analysis for subpixel classification of coconut",
Current Science, Vol. 91, No. 12, pp. 1706 -1711, 25 December 2006.
[13] Ming-Hseng Tseng, Sheng-Jhe Chen, Gwo- Haur Hwang, Ming-Yu Shen, "A genetic algorithm rule-based approach for land-cover
classification", Journal of Photogrammetry and Remote Sensing ,Vol.63, No.2, (3), pp. 202-212, 2008.
[14] Pall Oskar Gislason, Jon Atli Benediktsson, Johannes R. Sveinsson, "Random Forests for land cover classification", Pattern
Recognition Letters,Vol.27, No.4, (3), pp. 294-300, 2006.
[15] Hua-Mei Chen, Varshney, P.K. and Arora, M.K, “Performance of mutual information similarity measure for registration of
multitemporal remote sensing images “, IEEE Transactions on Geoscience and Remote Sensing, Vol.41 No.11, pp. 2445 – 2454,
2003.
[16] Cristianini, Nello and Shawe-Taylor, John, “An Introduction to Support Vector Machines and other kernel based learning methods",
Cambridge University Press, Cambridge, 2000.
[17] Li Zhuo, Jing Zheng, Fang Wang, Xia Li, Bin Ai, Junping Qian, "A Genetic Algorithm Based Wrapper Feature Selection Method
For Classification Of Hyperspectral Images Using Support Vector Machine", The International Archives of the Photogrammetry,
Remote Sensing and Spatial Information Science, Vol. XXXVII, No. B7, pp.397-402, 2008.
[18] S. C. Johnson, "Hierarchical Clustering Schemes", Psychometrika, Vol.2, pp.241-254, 1967.
[19] J. C. Dunn (1973): "A Fuzzy Relative of the ISODATA Process and Its Use in Detecting Compact Well-Separated
Clusters", Journal of Cybernetics, Vol. 3, pp.32-57, 1973.
[20] R.A. Haddad and A.N. Akansu, "A Class of Fast Gaussian Binomial Filters for Speech and Image Processing," IEEE Transactions
on Acoustics, Speech and Signal Processing, vol. 39, pp 723-727, March 1991.
[21] Hunter and Richard Sewall,"Accuracy, Precision, and Stability of New Photo-electric Color-Difference Meter", Proceedings of the
Thirty-Third Annual Meeting of the Optical Society of America, Vol. 38(12), 1948.