Obesity: The Epidemic Patrick McBride, MD, MPH Professor UW Medical School.
51
Obesity: The Epidemic Patrick McBride, MD, MPH Professor UW Medical School
-
Upload
violet-mitchell -
Category
Documents
-
view
217 -
download
1
Transcript of Obesity: The Epidemic Patrick McBride, MD, MPH Professor UW Medical School.

Obesity: The Epidemic
Patrick McBride, MD, MPH
Professor
UW Medical School

Overview
• Obesity: The Epidemic
• U.S. Trends: Disease of the decade
• Costs, Causes, Consequences – Obesity = 280,000 deaths annually– Costs: $77 billion year U.S.
Wisconsin = $1.4 billion / year
(5 – 7% of all health care costs)– Obesity is complex with genetic,
behavioral and environmental causes

Obesity - The Epidemic
• Will soon overtake smoking as the leading preventable cause of death!*
• *Obesity greater morbidity than:–Smoking–Problem drinking–Poverty
•* Public Health 2001;115:229-235

Obesity - The Epidemic
• Overweight or obese in U.S.
–1 in 4 adults in the 1960’s
• Overweight: 37% of U.S. adults WI = 37%
• Obese: 21% of U.S. adults
WI = 22%
(Doubled: 11% only 10 yrs ago!)

Obesity* Trends Among U.S. AdultsBRFSS, 1991
(*BMI 30, or ~ 30 lbs overweight for 5’4” person)
No Data <10% 10%-14% 15-19% 20%
Source: BRFSS, CDC.

Obesity* Trends Among U.S. AdultsBRFSS, 1992
(*BMI 30, or ~ 30 lbs overweight for 5’4” person)
Source: BRFSS, CDC.
No Data <10% 10%-14% 15-19% 20%

Obesity* Trends Among U.S. AdultsBRFSS, 1993
(*BMI 30, or ~ 30 lbs overweight for 5’4” person)
No Data <10% 10%-14% 15-19% 20%
Source: BRFSS, CDC.

Obesity* Trends Among U.S. AdultsBRFSS, 1994
(*BMI 30, or ~ 30 lbs overweight for 5’4” person)
Source: BRFSS, CDC.
No Data <10% 10%-14% 15-19% 20%
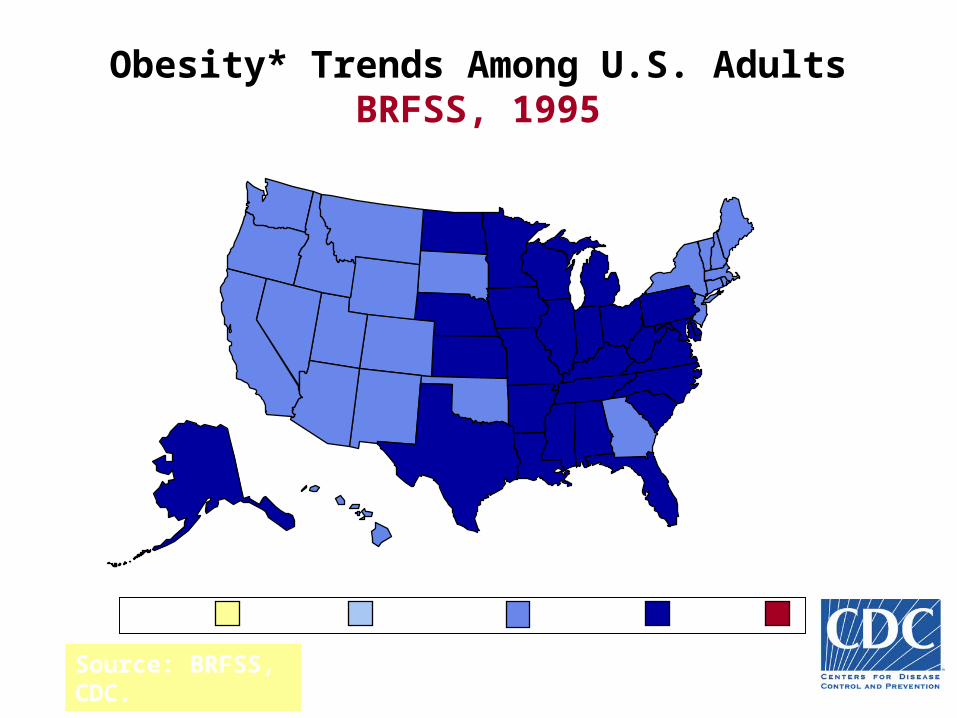
Obesity* Trends Among U.S. AdultsBRFSS, 1995
(*BMI 30, or ~ 30 lbs overweight for 5’4” person)
No Data <10% 10%-14% 15-19% 20%
Source: BRFSS, CDC.

Obesity* Trends Among U.S. AdultsBRFSS, 1996
(*BMI 30, or ~ 30 lbs overweight for 5’4” person)
Source: BRFSS, CDC.
No Data <10% 10%-14% 15-19% 20%

Obesity* Trends Among U.S. AdultsBRFSS, 1997
(*BMI 30, or ~ 30 lbs overweight for 5’4” person)
Source: BRFSS, CDC.
No Data <10% 10%-14% 15-19% 20%

Obesity* Trends Among U.S. AdultsBRFSS, 1998
(*BMI 30, or ~ 30 lbs overweight for 5’4” person)
No Data <10% 10%-14% 15-19% 20%
Source: BRFSS, CDC.

Obesity* Trends Among U.S. AdultsBRFSS, 1999
(*BMI 30, or ~ 30 lbs overweight for 5’4” person)
Source: BRFSS, CDC.
No Data <10% 10%-14% 15-19% 20%

Obesity* Trends Among U.S. AdultsBRFSS, 2000
(*BMI 30, or ~ 30 lbs overweight for 5’4” person)
Source: BRFSS, CDC.
No Data <10% 10%-14% 15-19% 20%

Obesity - The Epidemic: Kids
• 15% of children are overweight
• 5% in 1970 – 1980 and 11% in 1990
• 22% African-American & Hispanic children are now overweight
• 27% of AA and Hispanic male children overweight
• Diabetes in kids: up 10 X in 10 years
• < 25% children active regularly


C hildhood obesity predicts adult obesity*C hildhood obesity predicts adult obesity*
1519
12
36
11
55
10
75
9
67
0
20
40
60
80
Percent obese as young
adult (at age 21 to 29 yrs)
1-2 yr 3-5 yr 6-9 yr 10-14 yr 15-17 yr
Age
Not obese
Obese

Obesity: Causes and Consequences

Physical Activity in U.S.
• < 20% Adults and Children get regular physical activity
• Trend unchanged in past 2 decades; exception is high school females getting less activity in past decade
• Physical activity classes decreasing in U.S. high schools


0
1
2
3
4
5
1967 1983
Hoursperday
• is sedentary• takes away time from other activities• associated with eating
68% increaseVideo Games and Children. ERIC Digest
Children’s Television Resource & Education Center


0
1
2
3
4
5
1981 2000
Mealsoutperweek
3.7 to 4.2
14% increase
USDA statistics show that the average daily caloric intake of Americans has risen from 1,854 calories to 2,002 calories during the last 20 years. That increase - 148 calories per day - theoretically works out to an extra 15 pounds per year.
32% are fast food27% sit down restaurants24% convenience stores(USDA 1995)

SmallSmall MediumMedium LargeLarge Super-SizeSuper-Size
1950-601950-60 200200caloriescalories
1970’s1970’s 200200caloriescalories
320320caloriescalories
1980’s1980’s 320320caloriescalories
400400caloriescalories
1990’s1990’s 450450caloriescalories
540540caloriescalories
20002000 450450caloriescalories
540540caloriescalories
610610caloriescalories
The History of French Fries in AmericaThe History of French Fries in America

Obesity Health Consequences
• Heart Disease• Other Vascular Dz• Stroke• Dementia• Cancer (breast,
colon, other)• Type 2 DM• Sleep Apnea• Depression
• Osteoarthritis• Back pain• Gallstones• Surgery
complications• Congenital
malformations• Urinary stress
incontinence• Psychological

Diabetes Mellitus in the US:Increasing Prevalence of Diagnosed Cases
Pe
rso
ns
Wit
h D
iag
no
sed
D
iab
ete
s (
mill
ion
s)
8
7
6
5
4
3
2
1
0
1958 1963 1968 1979 1984 1989 1994
Diabetes Overview. October 1995 (updated 1996). NDDK publication NIH 96-1468.Kenny SJ et al. In: Diabetes in America 2nd ed. 1995:47-67.
Year


What to do?
• Individuals
• Families
• Industry
• Schools
• Policymakers
• Government

National Guidelines• American Obesity Association
www.aoa.org• National Institute of Health - Obesity
Research 1998;6:S51-S209
www.nhlbi.nih.gov/guidelines• American Heart Association
www.americanheart.org• BMI calculator:
www.nhlbisupport.com/bmi

The Metabolic Syndrome
High Risk Syndrome:
• Overweight / central obesity as the primary contributor to insulin resistance
with genetic predisposition
• Multiple metabolic abnormalities
• Target: insulin resistance & metabolism
• Emphasis on weight reduction & physical activity to reverse

How Common is the Metabolic Syndrome?
• US NHANES survey• Adults > 20 years of age• 24% all adults, 42% over age 60 yrs• Similar for men and women!• Mexican Americans 32%• African American women >> men • 47 million adults in the U.S.
JAMA 2002;287:356

Waist CircumferenceWaist circumference, independent of BMI /
weight, confers additional health risk with:– Glucose intolerance / Diabetes mellitus– Hypertension– Dyslipidemia
Important - WC in any weight category confers similar risk
Arch Intern Med 2002;162:2074


New Emphasis of ATP III:The Metabolic Syndrome
Risk FactorAbdominal Obesity
MenWomen
TriglyceridesHDL cholesterol
MenWomen
Blood pressureSerum glucose
Defining LevelWaist Circumference
> 40 inches > 35 inches
> 150 mg/dL
< 40 mg/dL< 50 mg/dL> 130/ 85 mmHg> 110-125 mg/dL

Accelerated atherosclerosis
Clinical diabetes
Hyperinsulinemia Impairedglucose
tolerance
HypertriglyceridemiaDecreased HDL-C
Essentialhypertension
Insulin resistance
Insulin Resistance and Atherosclerosis

Obesity Preventionand
Management

Can Lifestyle Change Work?
Prevention of Type 2 Diabetes Mellitus
• Changes in lifestyle:
NEJM 2001;344:1343-1350
• Changes in lifestyle or metformin NEJM 2002;346:393-403

Metabolic Syndrome Prevention
• 3234 patients with GINT / high FBG• Randomized for 3 years to:
– Placebo– Metformin– Lifestyle intervention
• Results in reducing diabetes:– Lifestyle 58% (NNT = 7)– Metformin 31% (NNT = 14)
N Engl J Med 2002;346:393

Diabetes Preventionin Metabolic Syndrome
• 522 men & women IGT - mean BMI 31• RCT Individualized counseling vs UC• RX 4.2 kg weight loss (vs 0.8 kg UC)*• Diabetes incidence 11% vs 23% UC*
(58% risk reduction, p< 0.001*) 3 yrs.• Achieving either 5% wt. loss or
fitness reduced risk of DM by 70%NEJM 2001;344:1343-50

Diabetes Therapy Trial*• 160 patients with Type 2 DM + PU• Trial of “Intensive Therapy”:
– Lowfat diet + exercise + tobacco cslg.– ACE or ARB + HTN treatment– Multivitamin– Statin or Fibrate depending on cholesterol
disorder– Diabetes treatment if needed: metformin,
gliclazide, insulinNEJM 2003;348:383-
93


Diabetes Therapy Trial*
• Intensive Therapy vs. Usual Care• Outcomes in 8 years (160 patients):
85 events in 35 patients Usual Care
33 events in 19 patients Intensive RX
– 53% decrease in CVD
– 61% decrease in nephropathy
– 58% decrease in retinopathy
– 63% decrease in autonomic neuropathy NEJM 2003;348:383-
93

Body Weight Management
• Patients BMI > 25 or WC increased: • nutrition and physical activity counseling
• Goal: IBW - BMI 19 - 25?• Goal: WC < 35” women, 40” male?
OR• Emphasize weight loss to achieve normal
BP, cholesterol levels, and glucose?

Achieve Ideal Body Weightor
Achieve a 5% loss?• 200# 5% = 10 loss
• Total cholesterol down 15%
• TG down 20%
• HDL up 15%
• Sys BP / Dias BP down 12/9 mmHg
• Improved hyperglycemia
• Improved life expectancy

Weight Loss• Obese adults can lose 1# per week
reducing kcalories 500-1000 below maintenance for current weight
• Exercise is most important to add for sustained weight loss
• Combining caloric restriction and exercise leads to 5 - 10% weight loss in a 4 - 6 month period
NEJM 2002;346:591

Activity - Vital
• Modest energy balance = Wt. Gain
• 10 calories / day excess = LB / year
• 100 calories / day excess = 10 LB / yr
• Additional activity daily changes calories consumed and the Basal Metabolic Rate (BMR)

Physical Activity
• Minimum goal - 30 minutes, 3 - 4x per week• Ideal goal: 30 - 45 minutes daily• Encourage moderate intensity aerobic activity
supplemented by daily lifestyle activities• Resistance training has positive effects on
metabolism and visceral obesity • Medically supervised programs for moderate to high-risk patients demonstrate benefits
JAMA 2002;288:1622-31

Websites for PatientsAtkins alert:
www.atkinsdietalert.org/physician
Evaluate diets:
www.pcrm.org/new/health010109.html
www.niddk.nih.gov/health/nutrit/pubs/myths/index.htm
Good sites
www.shapeup.org/index.htm
www.nhlbi.nih.gov/health/public/heart

Summary• Obesity and it’s consequences are an
epidemic in the U.S.
• Metabolic and medical outcomes are poor, with serious morbidity
• Population change is the only reasonable approach
• Medical management is very limited - emphasize health benefits and encourage patients with lifestyle

Body Mass Index (kg/m2)
Dose - Response Risk Relationship
Underweight < 18.5
Normal 18.5 - 25
Overweight 25 - 30
Obese > 30 – Class I 30 - 34.9– Class II 35 - 39.9– Class III >40

Exercise & Intra- Abdominal Body Fat
• RCT of 173 post-menopausal women• Moderate intensity exercise vs.
stretching program control group• 12 month data:
– Body weight difference 1.4 kg– Total body fat - 1%– Intra-abdominal fat - 8.6 g/cm– Subcutaneous abdominal fat - 29 g/cm
JAMA 2003;289:323-330