Missouri - State Nutrition, Physical Activity, and Obesity Profile

in Santa Clara County
Obesity, Physical Activity & Nutrition
1
Contents Obesity, Physical Activity, and Nutrition in Santa Clara County ............................................................................................. 3
Key Findings ............................................................................................................................................................................ 3
1. Obesity and Overweight ..................................................................................................................................................... 4
Obesity and Overweight Among Adults .............................................................................................................................. 4
Table 1.1: Percentage of Adults Who Were Overweight or Obese by Selected Characteristics, 2000-2009 ................. 5
Obesity and Overweight Among Youth .............................................................................................................................. 6
Table 1.2: Percentage of Youth Who Were Overweight or Obese by Selected Characteristics, 2008-2012.................. 6
Table 1.3: Overweight and Obesity Among Low-Income Children Participating in the Child Health and Disability Prevention (CHDP) Program by Race/Ethnicity .............................................................................................................. 7
Weight Management Among Youth ................................................................................................................................... 8
Figure 1.1: Weight Management Among Middle and High School Students ................................................................. 8
Maternal Prepregnancy BMI and Infant Birthweight ......................................................................................................... 8
Table 1.4: Infant Birthweight Status by Mother’s Prepregnancy BMI ............................................................................ 8
2. Physical Activity ................................................................................................................................................................... 9
Physical Activity Among Adults ........................................................................................................................................... 9
Figure 2.1: Percentage of Adults Who Met CDC Recommendations for Aerobic Physical Activity by Race/Ethnicity ... 9
Physical Activity and Sedentary Behaviors Among Youth .................................................................................................. 9
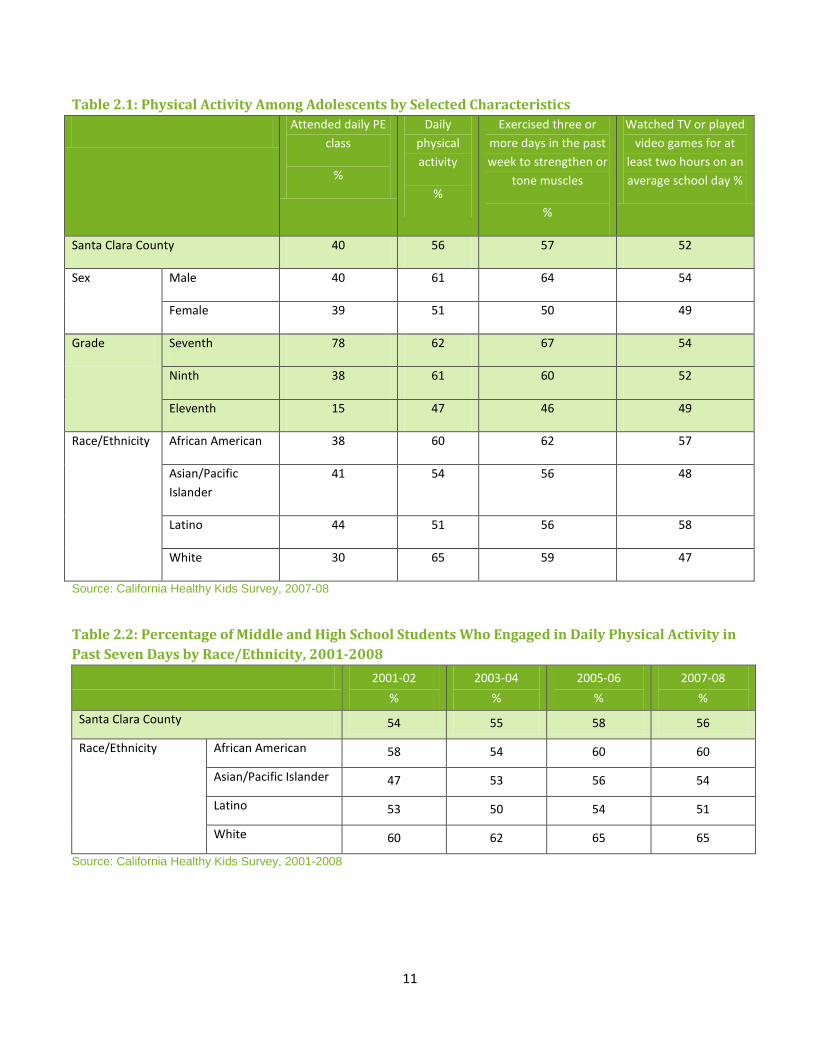
Table 2.1: Physical Activity Among Adolescents by Selected Characteristics ............................................................... 11
Table 2.2: Percentage of Middle and High School Students Who Engaged in Daily Physical Activity in Past Seven Days by Race/Ethnicity, 2001-2008 ....................................................................................................................................... 11
Physical Fitness Standards Among Youth ......................................................................................................................... 12
Table 2.3: Percentage of Youth Who Met Physical Fitness Standards by Grade and Race/Ethnicity, 2007-2012 ....... 12
Perceptions of Neighborhood Walkability ........................................................................................................................ 13
Table 2.4: Perceptions of Neighborhood Walkability and Access to Physical Activity Facilities Among Adults by Selected Characteristics ................................................................................................................................................ 14
Household Physical Activity Policies ................................................................................................................................. 15
Table 2.5: Household Physical Activity Policies Among Adults by Selected Characteristics ......................................... 15
Workplace Physical Activity Policies ................................................................................................................................. 16
Table 2.6: Workplace Physical Activity Policies Among Adults by Selected Characteristics ......................................... 16
3. Nutrition ............................................................................................................................................................................ 17
Healthy Nutrition Among Adults ....................................................................................................................................... 17
2
Table 3.1: Consumption of at Least Five Servings of Fruits and Vegetables the Previous Day Among Adults by Selected Characteristics, 2004-2010 ............................................................................................................................. 18
Table 3.2: Consumption of Fruits and Vegetables at Least Once Per Day in the Past Month Among Adults by Selected Characteristics ................................................................................................................................................ 19
Fast Food Consumption Among Adults............................................................................................................................. 20
Table 3.3: Consumption of Fast Food Among Adults by Selected Characteristics ....................................................... 20
Healthy Nutrition and Fast Food Consumption Among Children and Adolescents .......................................................... 21
Use of Menu Labeling Among Adults ................................................................................................................................ 22
Table 3.4: Use of Calorie Information in Fast Food and Chain Restaurants to Help Decide What to Order Among Adults by Selected Characteristics ................................................................................................................................ 22
Food Stamp (CalFresh) Participation and Food Assistance ............................................................................................... 23
Table 3.5: Percentage of Population Enrolled in CalFresh Only and CalWorks/CalFresh Mixed by Race/Ethnicity ..... 23
Food Insecurity Among Adults ...................................................................................................................................... 23
Beverage Consumption Among Adults ............................................................................................................................. 25
Table 3.7: Consumption of Beverages Among Adults by Selected Characteristics ...................................................... 26
Table 3.8: Beverage Consumption Patterns Among Adults by Selected Characteristics .............................................. 27
Preferences Regarding Water Consumption Among Adults ............................................................................................. 28
Table 3.9: Water Consumption Preferences Among Adults by Selected Characteristics ............................................. 29
Beverage Consumption Among Youth .............................................................................................................................. 30
Table 3.10: Soda Consumption Among Middle and High School Students by Selected Characteristics, 2001-2008 ... 30
Consumption of Foods Linked with Higher Intake of Sugar-Sweetened Beverages ......................................................... 31
Table 3.11: Consumption of Foods Linked with Higher Sugar-Sweetened Beverage Intake Among Adults by Selected Characteristics ............................................................................................................................................................... 32
Perceptions of Neighborhood Healthy Food Access Among Adults ................................................................................. 33
Table 3.12: Perceptions of Neighborhood Food Access by Selected Characteristics .................................................. 34
Perceptions of Food Advertising and Marketing Among Adults ....................................................................................... 35
Table 3.13: Food Advertising and Marketing Perceptions Among Adults by Selected Characteristics ........................ 36
Household Food and Beverage Policies ............................................................................................................................ 37
Table 3.14: Household Nutrition Policies Among Adults by Selected Characteristics .................................................. 38
Workplace Food and Beverage Policies ............................................................................................................................ 39
Table 3.15: Workplace Food Policies Among Adults by Selected Characteristics ........................................................ 39
References ............................................................................................................................................................................ 40

3
Obesity, Physical Activity, and Nutrition in Santa Clara County This report summarizes findings for Santa Clara County from multiple data sources on obesity, physical activity, and nutrition. It reviews several topics concerning obesity, physical activity, and nutrition for adults and youth in the county, including: • Obesity and Overweight • Weight Management • Maternal Prepregnancy BMI and Infant Birthweight • Perceptions of Neighborhood Walkability and Healthy Food Access • Household and Worksite Policies on Active Living and Healthy Eating • Fruit and Vegetable Consumption • Fast Food Consumption • Food Stamp (CalFresh) Participation • Food Insecurity • Beverage Consumption, including Sugar-Sweetened Beverages • Food Advertising and Marketing • Walking and Biking to School New data on some of these topics will be available in early 2014. Check www.sccphd.org/statistics2 for updates..
Key Findings Obesity and overweight
• Overweight/obesity among Santa Clara County adults increased from 52% in 2000 to 55% in 2009. • Seventeen percent (17%) of fifth-, seventh-, and ninth-graders in Santa Clara County are overweight and 16% are
obese.
Physical Activity
• Only about 1 in 2 adults (57%) in Santa Clara County meet CDC’s recommendations for physical activity. • On a typical weekend day, over half of children (59%) and nearly two thirds of adolescents (64%) watch
television or play video games for two or more hours. • Forty percent (40%) of middle and high school students attend daily physical education (PE) class and 56%
engage in daily physical activity.
Nutrition
• Only 18% of adults report consuming five or more servings of fruits and vegetables the previous day. • Approximately 4 in 10 children ages 6-11 (39%) ate five or more fruits and vegetables the previous day. • From 2001 to 2008, the percentage of middle and high school students consuming one or more glasses of soda
the previous day decreased from 71% to 55%. • Fewer Latino (65%) than White adults (90%) report they often or always can find a variety of high quality and
affordable produce to purchase in their neighborhood. • Nearly all adults (90%) limit the amount of sugar-sweetened beverages children are allowed to drink at home.

4
1. Obesity and Overweight
Obesity and Overweight Among Adults In 2009, 38% of adults in Santa Clara County were overweight (25 ≤ BMI <30) and 17% were obese (BMI ≥ 30). The prevalence of obesity in Santa Clara County was less than half that nationwide (35.7%) [11], and well below the Healthy People 2020 target of 30.5% . Overweight/obesity among Santa Clara County adults increased from 52% in 2000 to 55% in 2009. In 2009, the prevalence of overweight and obesity was higher among men (59%) than women (50%). Latinos had the highest overweight/obesity prevalence (68%), while Asian/Pacific Islanders had the lowest prevalence (39%). The prevalence of overweight and obesity was higher among high school graduates than those with some college or more. The lower the household income, the higher the prevalence of overweight and obesity.

5
Table 1.1: Percentage of Adults Who Were Overweight or Obese by Selected Characteristics, 2000-2009 2000 2004 2006 2009
Overweight
(%)
Obese
(%)
Overweight
(%)
Obese
(%)
Overweight
(%)
Obese
(%)
Overweight
(%)
Obese
(%)
Santa Clara County 36 16 34 18 37 17 38 17
Sex Men 45 16 42 20 44 18 42 17
Women 26 18 26 17 29 16 33 17
Age Group 18-44 33 14 34 15 35 15 37 14
45-64 39 21 37 25 39 20 37 24
65+ 39 17 31 18 41 17 42 15
Race/
Ethnicity
African American 26 44 34 40 44 27 45 18
Asian/Pacific Islander 26 7 23 6 29 6 32 7
Latino 42 24 45 28 42 28 44 24
White 37 16 35 20 39 19 36 19
Education Less than high school diploma
46 24 44 31 40 32 35 16
High school graduate, GED, or equivalent
36 21 35 23 44 21 47 21
Some college or associate’s degree
35 22 35 21 33 22 33 24
Bachelor’s, graduate, or professional
34 11 32 14 35 12 37 13
Household Income
<$20,000 33 21 42 19 34 24 41 28
$20,000-$49,999 38 18 37 24 38 21 42 20
$50,000-$74,999 35 20 36 22 37 21 40 21
$75,000+ 35 14 33 15 39 14 35 15
Nativity U.S.-born -- -- -- -- -- -- 35 20
Foreign-born -- -- -- -- -- -- 42 12
Source: Santa Clara County Public Health Department, 2000-2009 Behavioral Risk Factor Survey Note: Results for some groups for some years not reported due to small sample size

6
Obesity and Overweight Among Youth From 2008 to 2012, 17% of fifth-, seventh-, and ninth-graders in Santa Clara County were overweight and 16% were obese. The prevalence of obesity among these grade levels was close to the Healthy People 2020 obesity targets of 15.7% for children and 16.1 adolescents.[8] In 2012, the prevalence of overweight and obesity was higher among boys than girls (17% versus 16% for overweight and 18% versus 13% for obesity, respectively). From 2008 to 2012, fifth-grade students had a higher prevalence of overweight and obesity than seventh- and ninth-grade students. In 2012, Latino youth had the highest overweight/obesity prevalence (21%/26%), while Asian/Pacific Islanders and Whites had the lowest prevalence (14%/9%). Overweight is defined as BMI-for-age ≥ 85th percentile to < 95th percentile. Obesity is defined as BMI-for-age ≥ 95th percentile.
Table 1.2: Percentage of Youth Who Were Overweight or Obese by Selected Characteristics, 2008-2012
2008-2009 2009-2010 2010-2011 2011-2012
Overweight
(%)
Obese
(%)
Overweight
(%)
Obese
(%)
Overweight
(%)
Obese
(%)
Overweight
(%)
Obese
(%)
Santa Clara County 17 16 17 16 17 16 17 16
Sex Male 17 19 17 19 18 18 17 18
Female 16 13 16 13 16 13 16 13
Grade Fifth 18 18 18 19 18 18 17 17
Seventh 17 16 16 15 17 16 17 16
Ninth 16 14 16 14 16 14 15 14
Race/
Ethnicity
African American 20 20 20 20 20 18 20 21
Asian/Pacific Islander 14 10 14 10 14 9 14 9
Latino 21 26 20 26 21 26 21 26
White 15 10 15 10 14 9 14 9
Source: California Department of Education, 2008-2012 FITNESSGRAM

7
Among low-income children in Santa Clara County in 2010, the prevalence of overweight and obesity increased with age. The prevalence of overweight and obesity was highest among Latino children for all ages. Overweight is defined as BMI-for-age ≥ 85th percentile to < 95th percentile. Obesity is defined as BMI-for-age ≥ 95th percentile.
Table 1.3: Overweight and Obesity Among Low-Income Children Participating in the Child Health and Disability Prevention (CHDP) Program by Race/Ethnicity
Age of Child
Ages 2-<5 Ages 5-8 Ages 9-11
Overweight (%)
Obese
(%)
Overweight (%)
Obese
(%)
Overweight (%)
Obese (%)
Santa Clara County 16 18 18 23 21 28
Race/Ethnicity African American -- -- -- -- -- --
Asian 14 14 15 17 20 15
Latino 18 18 16 25 21 32
White 18 16 -- -- -- --
Source: Pediatric Nutrition Surveillance (PedNSS), Table 16B, 2010 Note: Results for African Americans and Whites (for some ages) for overweight and obesity not reported due to small numbers of children examined; percentages were not calculated when less than 100 records were available

8
Weight Management Among Youth Among middle and high school students in Santa Clara County in 2007-08, 57% said they were trying to lose weight, 20% were trying to gain weight, 13% were trying to maintain their weight, and 10% were doing nothing. A higher percentage of White adolescents (62%) than African American (50%) or Latino (53%) adolescents were trying to lose weight.
Figure 1.1: Weight Management Among Middle and High School Students
Source: California Healthy Kids Survey, 2007-08
Maternal Prepregnancy BMI and Infant Birthweight Obesity before pregnancy is associated with increased infant birthweight. [9] In Santa Clara County in 2010, a higher percentage of mothers who were obese (13%) or overweight (9%) before pregnancy gave birth to infants with high birthweights than mothers who were normal weight (6%) or underweight (3%) before pregnancy.
Table 1.4: Infant Birthweight Status by Mother’s Prepregnancy BMI Infant Birthweight
Very low birthweight
(< 1500g)
Low birthweight
(1500-2499g)
Normal birthweight
(2500-3999g)
High birthweight
(≥4000g) Mother’s Pre-Pregnancy BMI
Underweight (BMI < 18.5) (%)
1 9 88 3
Normal (18.5 ≤ BMI < 25)
1 6 87 6
Overweight (25 ≤ BMI < 30) (%)
1 6 84 9
Obese (BMI ≥ 30) (%)
2 6 80 13
Source: California Department of Public Health, 2010 Vital Statistics Note: Percentages may not add to 100% due to rounding
57% 20%
13%
10% Trying to Lose WeightTrying to Gain WeightTrying to Maintain WeightDoing Nothing

9
2. Physical Activity
Physical Activity Among Adults The Centers for Disease Control and Prevention (CDC) suggests that adults ages 18 and older should get at least 2 hours and 30 minutes (150 minutes) of moderate intensity aerobic activity (i.e., brisk walking) every week for good health; 1 hour and 15 minutes (75 minutes) of vigorous intensity aerobic activity (i.e., jogging or running); or an equivalent mix of moderate and vigorous intensity activity.
In 2007, only about 1 in 2 adults (57%) in Santa Clara County met CDC’s recommendations for physical activity. The percentage of Latino adults who met CDC’s recommendations was below that of all adults in the county and White and Asian/Pacific Islander adults.
Figure 2.1: Percentage of Adults Who Met CDC Recommendations for Aerobic Physical Activity by Race/Ethnicity
Source: UCLA Center for Health Policy Research, 2007 California Health Interview Survey Note: Results for African Americans not reported due to small sample size
Physical Activity and Sedentary Behaviors Among Youth In Santa Clara County from 2007 to 2009, 35% of children (ages 5-11 who attended school) and 45% of adolescents (ages 12-19) walked, bicycled or skateboarded home from school at least once a week. [3,4] Fewer adolescent girls (38%) engaged in these activities than adolescent boys (52%). [3,4] The percentages for children were approximately the same for girls and boys (34% for girls, 35% for boys). [3,4]
Eighty-two percent (82%) of children ages 1 and older and 77% of adolescents visited a park or playground at least once in the past month. [3,4] The percentage of Asian (73%) and Latino (76%) children who had visited a park or playground was lower than Whites (92%) and children in the county overall (82%). [3,4] More female
60%
47%
59% 57%
0%
10%
20%
30%
40%
50%
60%
70%
Asian/PI Latino White SCC
Perc
ent

10
children (84%) visited a park or playground than male children (81%), whereas the reverse was true for adolescents (88% of boys compared to 66% of girls). [3,4]
In 2007-08, 40% of middle and high school students attended daily physical education (PE) class and 56% engaged in daily physical activity. Fifty-seven percent (57%) of adolescents exercised three or more days in the past week to strengthen or tone muscles.
Fewer eleventh-graders (15%) attended daily PE class than ninth-graders (38%) and seventh-graders (78%). Similarly, percentage of middle and high school students engaging in daily physical activity and exercising three or more days in the past week to strengthen or tone muscles was lowest among eleventh-graders (47%, 46% , 49%) and highest among seventh-graders (62%, 64%, 54%).
The percentage of middle and high school students attending daily PE class was lowest among Whites (30%) and highest among Latinos (44%). However, the percentage of students with daily physical activity was highest among Whites (65%) and lowest among Latinos (51%). A higher percentage of African American (62%) and White (59%) adolescents exercised three or more days in the past week to strengthen or tone muscles than Latino and Asian/Pacific Islander adolescents (56% for both groups).
From 2001 to 2008, the percentage of middle and high school students who engaged in daily physical activity in the past week changed little for all students. However, this percentage increased for Whites (60% to 65%) and Asian/Pacific Islanders (47% to 54%).
In 2007-08, 52% of middle and high school students watched TV or played video games for at least two hours on an average school day. The percentage of female students (49%) who watched TV or played video games was also lower than male students (54%). Watching TV or playing video games was lower in higher grades. On a typical school day, a higher percentage of African American (57%) and Latino middle and high school students (58%) watched TV or played video games for at least two hours than Asian/Pacific Islander (48%) or White students (47%).
Screen time (time spent watching TV or playing video games) patterns differed on weekend days and school days. From 2007 to 2009 on a typical weekend day, over half of children (59%) and nearly two thirds of adolescents (64%) watched television or played video games for two or more hours, while 24% of children and 44% of adolescents used a computer for fun for at least two hours. [3,4] Similar percentages of male (24%) and female (25%) children used a computer for fun on a typical weekend day. [3,4] A higher percentage of female adolescents (66%) than male adolescents (61%) reported watching TV or playing video games on a typical weekend day. [3,4]
11
Table 2.1: Physical Activity Among Adolescents by Selected Characteristics Attended daily PE
class
%
Daily physical activity
%
Exercised three or more days in the past week to strengthen or
tone muscles
%
Watched TV or played video games for at
least two hours on an average school day %
Santa Clara County 40 56 57 52
Sex Male 40 61 64 54
Female 39 51 50 49
Grade Seventh 78 62 67 54
Ninth 38 61 60 52
Eleventh 15 47 46 49
Race/Ethnicity African American 38 60 62 57
Asian/Pacific Islander
41 54 56 48
Latino 44 51 56 58
White 30 65 59 47
Source: California Healthy Kids Survey, 2007-08
Table 2.2: Percentage of Middle and High School Students Who Engaged in Daily Physical Activity in Past Seven Days by Race/Ethnicity, 2001-2008
2001-02 %
2003-04 %
2005-06 %
2007-08 %
Santa Clara County 54 55 58 56
Race/Ethnicity African American 58 54 60 60
Asian/Pacific Islander 47 53 56 54
Latino 53 50 54 51
White 60 62 65 65
Source: California Healthy Kids Survey, 2001-2008
12
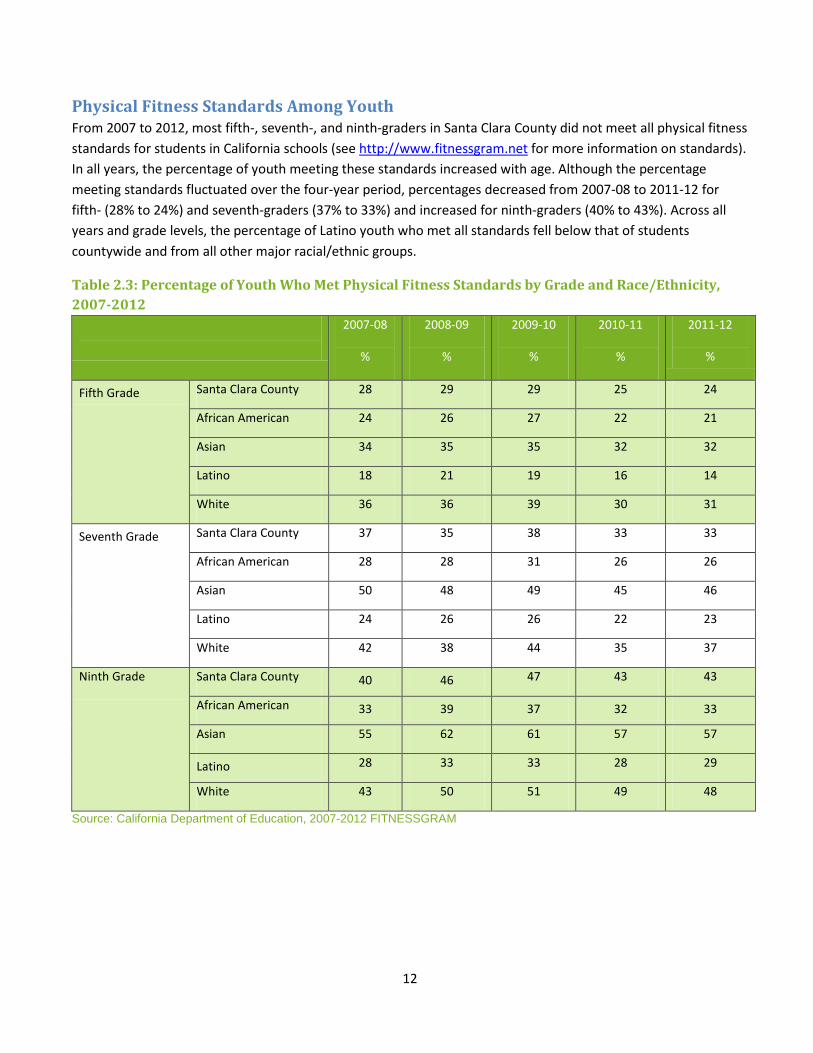
Physical Fitness Standards Among Youth From 2007 to 2012, most fifth-, seventh-, and ninth-graders in Santa Clara County did not meet all physical fitness standards for students in California schools (see http://www.fitnessgram.net for more information on standards). In all years, the percentage of youth meeting these standards increased with age. Although the percentage meeting standards fluctuated over the four-year period, percentages decreased from 2007-08 to 2011-12 for fifth- (28% to 24%) and seventh-graders (37% to 33%) and increased for ninth-graders (40% to 43%). Across all years and grade levels, the percentage of Latino youth who met all standards fell below that of students countywide and from all other major racial/ethnic groups.
Table 2.3: Percentage of Youth Who Met Physical Fitness Standards by Grade and Race/Ethnicity, 2007-2012
2007-08
%
2008-09
%
2009-10
%
2010-11
%
2011-12
%
Fifth Grade Santa Clara County 28 29 29 25 24
African American 24 26 27 22 21
Asian 34 35 35 32 32
Latino 18 21 19 16 14
White 36 36 39 30 31
Seventh Grade Santa Clara County 37 35 38 33 33
African American 28 28 31 26 26
Asian 50 48 49 45 46
Latino 24 26 26 22 23
White 42 38 44 35 37
Ninth Grade Santa Clara County 40 46 47 43 43
African American 33 39 37 32 33
Asian 55 62 61 57 57
Latino 28 33 33 28 29
White 43 50 51 49 48
Source: California Department of Education, 2007-2012 FITNESSGRAM

13
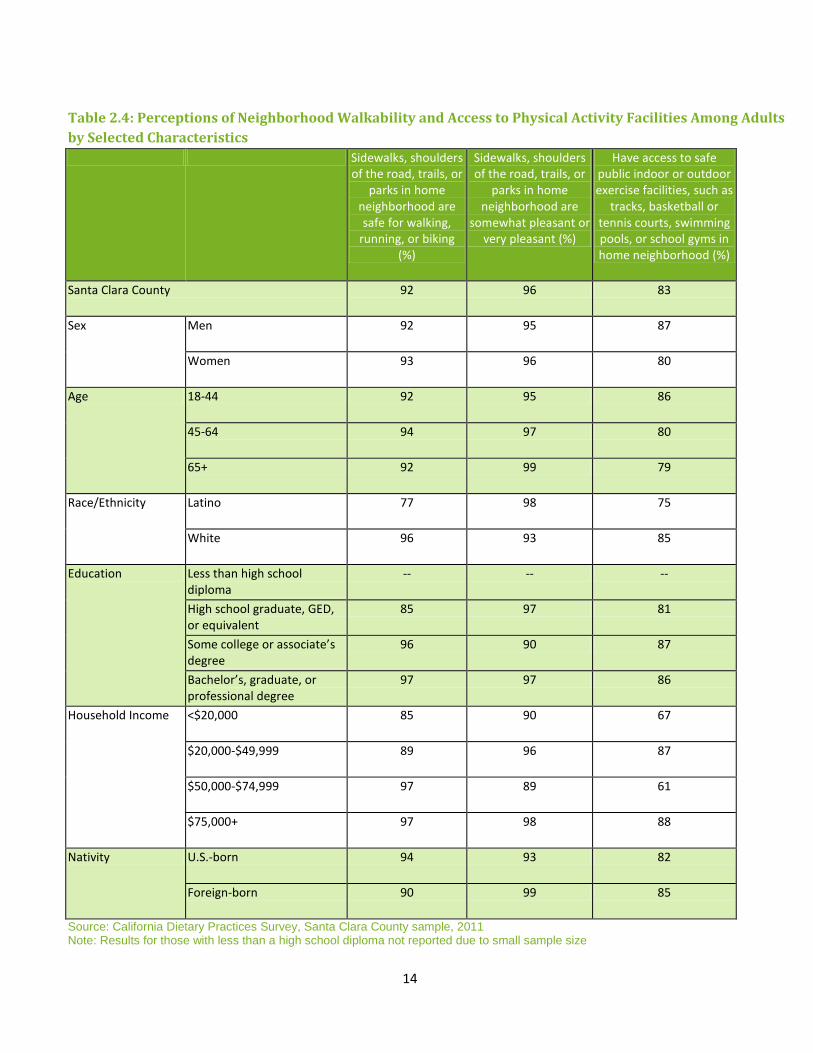
Perceptions of Neighborhood Walkability Living in a walkable community has been shown to promote physical activity by providing greater access and opportunities for walking, running, biking, and other forms of exercise. [10] In Santa Clara County in 2011, 92% of adults reported that the sidewalks, shoulders of the road, trails, or parks in their neighborhoods were safe for walking, running, or biking, and 96% reported that the sidewalks, shoulders of the road, trails, or parks in their neighborhoods were somewhat or very pleasant. In addition, 83% of adults reported that they had access to safe public indoor or outdoor exercise facilities in their neighborhoods. A lower percentage of Latino adults (77%) than White adults (96%) reported that their neighborhood environment was safe for walking, running, or biking. Similarly, a lower percentage of Latinos (75%) than Whites (85%) reported having access to safe public indoor or outdoor exercise facilities in their neighborhood.
14
Table 2.4: Perceptions of Neighborhood Walkability and Access to Physical Activity Facilities Among Adults by Selected Characteristics Sidewalks, shoulders
of the road, trails, or parks in home
neighborhood are safe for walking,
running, or biking (%)
Sidewalks, shoulders of the road, trails, or
parks in home neighborhood are
somewhat pleasant or very pleasant (%)
Have access to safe public indoor or outdoor exercise facilities, such as
tracks, basketball or tennis courts, swimming pools, or school gyms in home neighborhood (%)
Santa Clara County
92 96 83
Sex Men 92 95 87
Women 93 96 80
Age 18-44 92 95 86
45-64 94 97 80
65+ 92 99 79
Race/Ethnicity Latino 77 98 75
White 96 93 85
Education Less than high school diploma
-- -- --
High school graduate, GED, or equivalent
85 97 81
Some college or associate’s degree
96 90 87
Bachelor’s, graduate, or professional degree
97 97 86
Household Income <$20,000 85 90 67
$20,000-$49,999 89 96 87
$50,000-$74,999 97 89 61
$75,000+ 97 98 88
Nativity U.S.-born 94 93 82
Foreign-born 90 99 85
Source: California Dietary Practices Survey, Santa Clara County sample, 2011 Note: Results for those with less than a high school diploma not reported due to small sample size

15
Household Physical Activity Policies In 2011, nearly 7 in 10 adults (69%) in Santa Clara County reported limiting the amount of time their children watch television, and 8 in 10 adults (80%) reported limiting the amount of time their children were allowed to browse the internet, play video games, or watch videos/DVDs.
The presence of a television in a child’s bedroom has been associated with increased odds of childhood obesity. [7] Only 1 in 4 adults (26%) permitted their children to have a television in their bedroom.
Table 2.5: Household Physical Activity Policies Among Adults by Selected Characteristics Limited
amount of time child(ren)
watch TV (%)
Limited amount of time child(ren)
allowed to browse internet,
play video games, or watch
video/DVDs (%)
Child had a TV in the room where he or
she sleeps (%)
Allowed child to walk or bike to or from school
(%)
Santa Clara County
69 80 26 62
Sex Men 65 80 25 60
Women 75 79 28 63
Age 18-44 71 81 25 64
45-64 64 74 25 56
65+ -- -- -- --
Race/ Ethnicity
Latino 72 89 -- 65
White 63 74 14 68
Education Less than high school diploma -- -- -- --
High school graduate, GED, or equivalent -- -- -- 47
Some college or associate’s degree -- -- -- 67
Bachelor’s, graduate, or professional degree 83 85 11 61
Household Income
<$20,000 -- -- -- 72
$20,000-$49,999 -- -- -- 63
$50,000-$74,999 -- -- -- 79
$75,000+ 81 84 7 58
Nativity U.S.-born 55 72 24 64
Foreign-born 79 85 28 60
Source: California Dietary Practices Survey, Santa Clara County sample, 2011 Note: Results for some groups not reported due to small sample size

16
Workplace Physical Activity Policies Since employed adults often spend the majority of their day at the workplace, the work environment presents an opportunity to encourage adults to be more physically active. In Santa Clara County in 2011, 54% of adults reported access to indoor or outdoor facilities that made it easier for them to be physically active during work hours. However, fewer Latino adults (20%) had such access than White adults (59%). Only 34% of adults in the county reported that their employers provided physical activity benefits such as gym membership, sports teams, and onsite exercise classes.
Table 2.6: Workplace Physical Activity Policies Among Adults by Selected Characteristics Indoor or outdoor facilities
available that make it easier to be physically
active during work hours (%)
Employer provided physical activity benefits such as gym membership, sports teams, exercise classes
(%) Santa Clara County
54 34
Sex Men 59 33
Women 45 37
Age 18-44 50 31
45-64 63 42
65+ -- --
Race/ Ethnicity Latino 20 8
White 59 41
Education Less than high school diploma 55 31
High school graduate, GED, or equivalent 54 13
Some college or associate’s degree 61 32
Bachelor’s, graduate, or professional degree 60 45
Household Income
<$20,000 -- --
$20,000-$49,999 32 3
$50,000-$74,999 -- --
$75,000+ 66 47
Nativity U.S.-born 64 42
Foreign-born 45 28
Source: California Dietary Practices Survey, Santa Clara County sample, 2011 Note: Results for some groups not reported due to small sample size

17
3. Nutrition
Healthy Nutrition Among Adults In Santa Clara County in 2010, only 18% of adults (13% of men and 22% of women) reported consuming five or more servings of fruits and vegetables the previous day. Fruit and vegetable consumption was lowest among Latinos (16%) and highest among Whites (20%). Consumption of fruits and vegetables increased with age and was higher among those with a college degree than groups with lower educational attainment.
From 2004 to 2010, consumption of five or more servings of fruits and vegetables the previous day was fairly stable for all adults and was consistently lower among men than women, young adults ages 18-44 than older age groups, Latinos compared to Whites, and those with a lower versus higher level of education.

18
Table 3.1: Consumption of at Least Five Servings of Fruits and Vegetables the Previous Day Among Adults by Selected Characteristics, 2004-2010 Five or more servings of fruits and vegetables the previous day
(%) 2004 2006 2009 2010
Santa Clara County 19 20 14 18
Sex Men 13 15 9 13
Women 25 26 20 22
Age Group 18-44 17 19 13 17
45-64 20 21 16 17
65+ 28 27 17 22
Race/Ethnicity African American 12 -- -- --
Asian/Pacific Islander 23 23 13 17
Latino 12 16 10 16
White 21 21 18 20
Education Less than high school diploma 11 12 -- --
High school graduate, GED, or equivalent
15 19 12 16
Some college or associate’s degree
19 18 11 15
Bachelor’s, Graduate, or Professional Degree
22 23 19 21
Household Income <$20,000 17 19 13 18
$20,000-$49,999 15 20 13 14
$50,000-$74,999 24 18 17 18
$75,000+ 21 21 17 19
Nativity U.S.-born NA NA 16 NA
Foreign-born NA NA 13 NA
Source: Santa Clara County Public Health Department, 2004-2009 Behavioral Risk Factor Survey; Communities Putting Prevention to Work, 2010 Behavioral Risk Factor Survey Note: Results for some groups not reported due to small sample size

19
In 2010, a higher percentage of women ate fruit, cooked or canned beans, and dark green, orange-colored and other vegetables at least once per day in the past month than men.
Table 3.2: Consumption of Fruits and Vegetables at Least Once Per Day in the Past Month Among Adults by Selected Characteristics
Fruit (%)
Cooked or canned beans
(%)
Dark green vegetable
(%)
Orange-colored
vegetable (%)
Other vegetable
(%) Santa Clara County 56 13 29 8 39
Sex Men 52 11 26 6 34
Women 60 14 33 10 45
Age 18-24 -- 9 -- --
25-34 -- 9 -- 10 --
35-44 54 16 28 6 40
45-54 52 14 25 6 40
55-64 66 15 32 11 42
65+ 63 9 35 12 43
Race Other 56 17 29 8 35
White 56 7 29 9 45
Education Less than high school -- -- -- 8 --
High school or GED 55 6 27 7 37
Some post-high school 48 15 29 8 36
College graduate 60 11 32 9 47
Household Income
<$15,000 -- -- -- 12 --
$15,000-24,999 -- -- -- 8 --
$25,000- 34,999 -- 12 -- 13 --
$35,000-49,999 -- 8 -- 9 --
$50,000-74,999 -- 7 -- 6 --
$75,000+ 58 11 27 6 44
Source: Communities Putting Prevention to Work, 2010 Behavioral Risk Factor Survey Note: Results for some groups not reported due to small sample size In 2011, adults in Santa Clara County consumed on average 1.36 servings of whole grain bread, 0.54 servings of other whole grains, 2.34 servings of fruit, 2.26 servings of vegetables, 0.38 servings of beans, and 0.24 servings of soy products on a typical day. [2]

20
Fast Food Consumption Among Adults In 2009, 2 in 5 adults (40%) in Santa Clara County reported that they ate at a fast food restaurant at least once a week. A higher percentage of men (50%) than women (30%) ate fast food at least once in the past week. A higher percentage of Latinos (49%) reported eating fast food at least once a week followed by African Americans (43%), Asian/Pacific Islanders (37%) and Whites (36%). Consumption of fast food decreased with age.
Table 3.3: Consumption of Fast Food Among Adults by Selected Characteristics Consumed fast food one or more
times in the past week (%)
Santa Clara County 40
Sex Men 50
Women 30
Age Group 18-44 46
45-64 35
65+ 28
Race/Ethnicity African American 43
Asian/Pacific Islander 37
Latino 49
White 36
Education Less than high school diploma 63
High school graduate, GED, or equivalent 38
Some college or associate’s degree 47
Bachelor’s, graduate, or professional degree 34
Household Income <$20,000 30
$20,000-$49,999 42
$50,000-$74,999 42
$75,000+ 38
Nativity U.S.-born 43
Foreign-born 36
Source: Santa Clara County Public Health Department, 2009 Behavioral Risk Factor Survey

21
Healthy Nutrition and Fast Food Consumption Among Children and Adolescents From 2007 to 2009, approximately 4 in 10 children ages 6-11 (39%) in Santa Clara County ate five or more fruits and vegetables the previous day. Similar percentages were observed for boys (38%) and girls (40%). More than two thirds of children ages 6-11 (68%) ate fast food one or more times in the past week. A higher percentage of boys (74%) than girls (63%) consumed fast food.[3]
Less than one quarter of adolescents ages 12-19 (24%) in Santa Clara County from 2007 to 2009 ate five or more fruits and vegetables the previous day (26 % of boys and 21% of girls). Nearly three quarters of adolescents (74%) ate fast food one or more times in the past week. A higher percentage of boys (78%) than girls (71%) consumed fast food. [4]

22
Use of Menu Labeling Among Adults Only 11% of adults in Santa Clara County in 2010 reported always using calorie information on menus in fast food and chain restaurants to help decide what to order. A higher percentage of women (15%) than men (8%) always used this information. The percentage of adults that always use this information increased with educational attainment.
Table 3.4: Use of Calorie Information in Fast Food and Chain Restaurants to Help Decide What to Order Among Adults by Selected Characteristics
Always used calorie information (%)
Never used calorie information (%)
Santa Clara County 11 39
Sex Men 8 45
Women 15 33
Age 18-24 5 --
25-34 14 --
35-44 12 38
45-54 12 42
55-64 15 43
65+ 7 44
Race Other 10 35
White 13 43
Education Less than high school 4 --
High school or GED 7 38
Some post-high school 11 42
College graduate 16 34
Household Income
<$15,000 8 --
$15,000-24,999 6 --
$25,000- 34,999 6 --
$35,000-49,999 -- --
$50,000-74,999 -- --
$75,000+ 14 36
Source: Communities Putting Prevention to Work, 2010 Behavioral Risk Factor Survey Note: Results for some groups not reported due to small sample size

23
Food Stamp (CalFresh) Participation and Food Assistance In 2012, 4% of Santa Clara County residents were enrolled in CalFresh. The percentage enrolled was highest among African Americans (12%), followed by Latinos (9%) and lowest among Whites (2%) and Asian/Pacific Islanders (3%).
Table 3.5: Percentage of Population Enrolled in CalFresh Only and CalWorks/CalFresh Mixed by Race/Ethnicity Enrolled number Enrolled (%)
Santa Clara County 78,144 4
Race/Ethnicity African American 5,022 12
Asian/Pacific Islander 17,087 3
Latino 43,017 9
White 11,103 2
Sources: Santa Clara County, Social Services Agency, Quarterly Statistical Data of Public Assistance Families in the County of Santa Clara, Quarter 1, 2012; U.S. Census Bureau, 2010 Census In 2009, nearly 1 in 10 adults (9%) reported that either they or another adult in the household had obtained food from a food bank, food pantry, or church in the past 12 months. A higher percentage of Latinos (17%) obtained food from a food bank than Asian/Pacific Islanders and Whites (6% and 5%, respectively). Seven in 10 adults (68%) who had obtained food from a food bank, food pantry, or church also reported one or more children ages 17 and younger living in the household. [13]
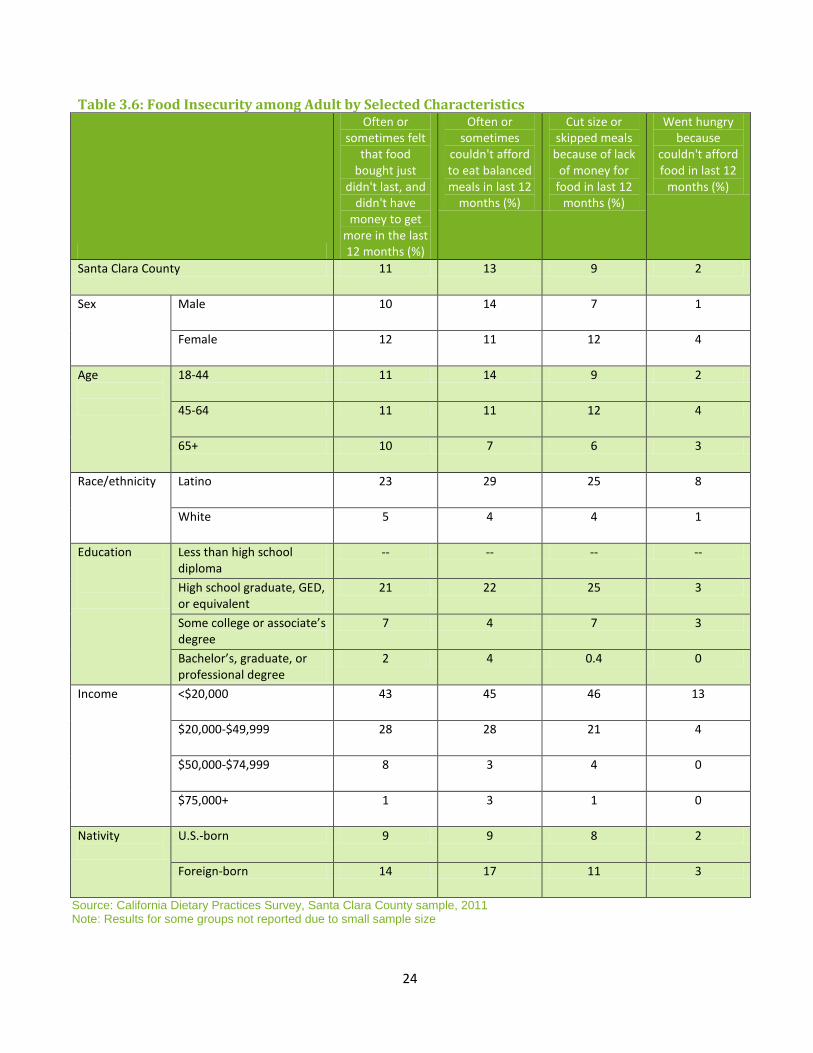
Food Insecurity Among Adults Food insecurity is defined as the condition of limited or uncertain access to adequate food.[11] Among adults in Santa Clara County in 2011, 11% said often or sometimes their food did not last and they did not have enough money to buy more food in the past 12 months. Thirteen percent (13%) of adults in Santa Clara County in 2011 reported that they often or sometimes could not afford to eat balanced meals in the past 12 months. Nine percent (9%) of adults in Santa Clara County in 2011 reported that they or others in their household skipped meals due to a lack of money in the past 12 months. Among adults in Santa Clara County in 2011, 2% said they went hungry because they could not afford food in the past 12 months.
Overall, food insecurity was higher among women, Latino adults, adults with lower incomes, adults with less education, and foreign-born adults.
24
Table 3.6: Food Insecurity among Adult by Selected Characteristics
Often or sometimes felt
that food bought just
didn't last, and didn't have
money to get more in the last 12 months (%)
Often or sometimes
couldn't afford to eat balanced meals in last 12
months (%)
Cut size or skipped meals because of lack
of money for food in last 12
months (%)
Went hungry because
couldn't afford food in last 12
months (%)
Santa Clara County 11 13 9 2
Sex
Male 10 14 7 1
Female 12 11 12 4
Age
18-44 11 14 9 2
45-64 11 11 12 4
65+ 10 7 6 3
Race/ethnicity
Latino 23 29 25 8
White 5 4 4 1
Education
Less than high school diploma
-- -- -- --
High school graduate, GED, or equivalent
21 22 25 3
Some college or associate’s degree
7 4 7 3
Bachelor’s, graduate, or professional degree
2 4 0.4 0
Income
<$20,000 43 45 46 13
$20,000-$49,999 28 28 21 4
$50,000-$74,999 8 3 4 0
$75,000+ 1 3 1 0
Nativity
U.S.-born 9 9 8 2
Foreign-born 14 17 11 3
Source: California Dietary Practices Survey, Santa Clara County sample, 2011 Note: Results for some groups not reported due to small sample size

25
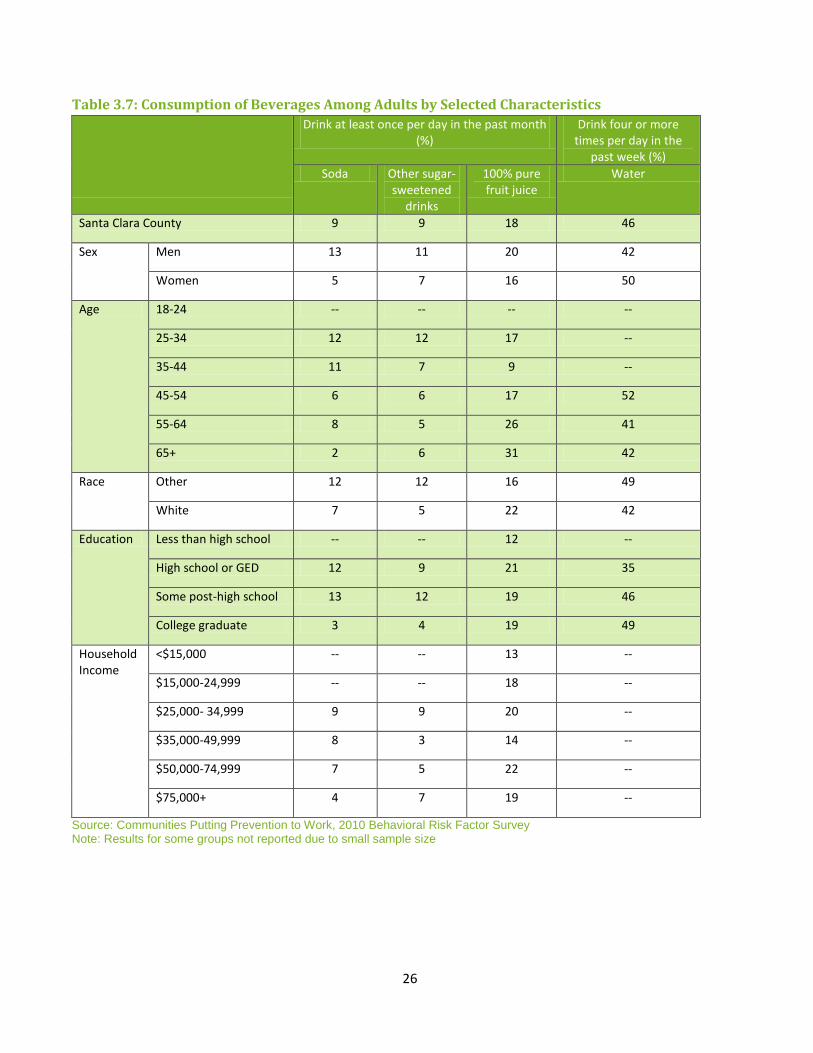
Beverage Consumption Among Adults In 2010, nearly 1 in 10 adults in Santa Clara County reported drinking soda (9%) and other sugar-sweetened drinks (such as Kool-aid, lemonade, sweet tea, sports or energy drinks) (9%) and nearly 1 in 5 (18%) reported drinking 100% pure fruit juice at least once per day in the past month. A higher percentage of men reported drinking soda (13%), sugar-sweetened fruit drinks (11%), and 100% pure fruit juice (20%) at least once per day in the past month compared to women (5%, 7%, and 16%, respectively). Soda consumption decreased with household income and was lower among adults with the highest education level.
Nearly half of adults (46%) reported drinking an 8-ounce glass of water at least four times per day in the past week. A higher percentage of women (50%) than men (42%) reported this level of water consumption. Water consumption increased with educational level.
26
Table 3.7: Consumption of Beverages Among Adults by Selected Characteristics
Drink at least once per day in the past month (%)
Drink four or more times per day in the
past week (%) Soda Other sugar-
sweetened drinks
100% pure fruit juice
Water
Santa Clara County 9 9 18 46
Sex Men 13 11 20 42
Women 5 7 16 50
Age 18-24 -- -- -- --
25-34 12 12 17 --
35-44 11 7 9 --
45-54 6 6 17 52
55-64 8 5 26 41
65+ 2 6 31 42
Race Other 12 12 16 49
White 7 5 22 42
Education Less than high school -- -- 12 --
High school or GED 12 9 21 35
Some post-high school 13 12 19 46
College graduate 3 4 19 49
Household Income
<$15,000 -- -- 13 --
$15,000-24,999 -- -- 18 --
$25,000- 34,999 9 9 20 --
$35,000-49,999 8 3 14 --
$50,000-74,999 7 5 22 --
$75,000+ 4 7 19 --
Source: Communities Putting Prevention to Work, 2010 Behavioral Risk Factor Survey Note: Results for some groups not reported due to small sample size

27
Adults in Santa Clara County in 2011 consumed on average 5.66 cups of water on a typical day, 1.11 glasses of milk or drinks made with milk yesterday, and 0.42 cans or glasses of soda or sweetened non-carbonated sweetened beverages (such as Gatorade, Tampico, Arizona Iced Tea, Sunny Delight, or Kool-Aid) yesterday. In addition, nearly a quarter of adults (23%) consumed one or more cans or glasses of soda or sweetened non-carbonated beverages the previous day.
Table 3.8: Beverage Consumption Patterns Among Adults by Selected Characteristics
Average cups of water on a
typical day
Average glasses of
milk or drinks made
with milk yesterday
Average cans or
glasses of soda or
sweetened non-
carbonated beverages consumed yesterday
Consumed one or
more cans or glasses of soda or sweetened
non-carbonated beverages yesterday
(%) Santa Clara County 5.66 1.11 0.42 23
Sex
Men 6.13 1.27 0.66 32
Women 5.18 0.94 0.18 13
Age
18-44 6.10 1.33 0.55 26
45-64 5.32 0.69 0.27 20
65+ 4.34 0.94 0.14 13
Race/Ethnicity
Latino 5.80 0.84 0.86 49
White 5.41 1.26 0.45 22
Education
Less than high school diploma -- -- -- --
High school graduate, GED, or equivalent 5.03 1.25 0.28 25
Some college or associate’s degree 6.40 1.76 1.02 38
Bachelor’s, graduate, or professional degree
5.70 0.91 0.26 14
Household Income
<$20,000 4.83 1.04 0.27 26
$20,000-$49,999 6.05 0.98 0.81 43
$50,000-$74,999 5.08 0.59 0.29 18
$75,000+ 5.70 1.05 0.15 13
Nativity
U.S.-born 5.56 1.14 0.47 25
Foreign-born 5.80 1.08 0.36 20
Source: California Dietary Practices Survey, Santa Clara County sample, 2011 Note: Results for those with less than a high school diploma not reported due to small sample size

28
Preferences Regarding Water Consumption Among Adults Water consumption is associated with lower sugar-sweetened beverage consumption and lower obesity risk. Public health organizations emphasize tap water consumption over bottled water consumption because it is a safe, no-cost alternative. [5]
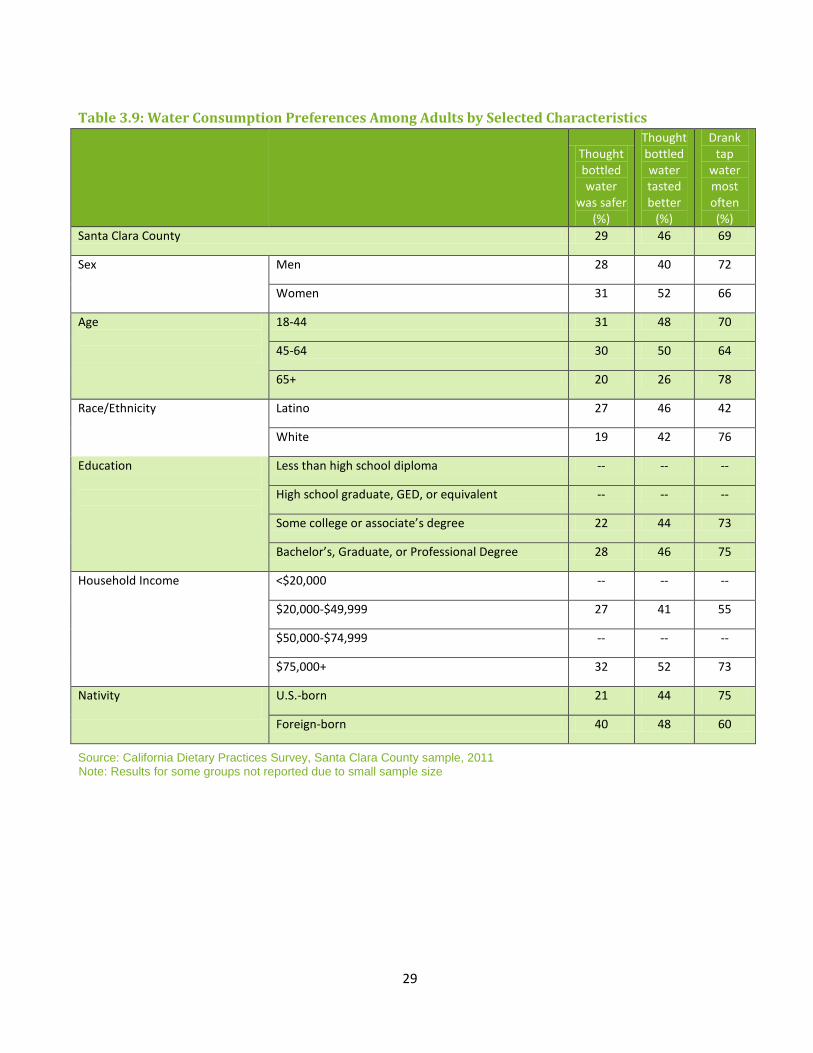
In 2011, more than a quarter of adults (29%) in Santa Clara County thought bottled water was safer than tap and nearly half (46%) thought bottled water tasted better than tap. However, most adults (69%) drank tap water (either filtered or unfiltered) most often.
A higher percentage of women (52%) thought bottled water tasted better than men (40%). More men (72%) than women (66%) reported drinking tap water most often. A higher percentage of Latino adults than White adults thought that bottled water was safer (27% versus 19%), and a lower percentage (42% versus 76%) drank tap water most often.
29
Table 3.9: Water Consumption Preferences Among Adults by Selected Characteristics
Thought bottled water
was safer (%)
Thought bottled water tasted better
(%)
Drank tap
water most often (%)
Santa Clara County 29 46 69
Sex
Men 28 40 72
Women 31 52 66
Age
18-44 31 48 70
45-64 30 50 64
65+ 20 26 78
Race/Ethnicity
Latino 27 46 42
White 19 42 76
Education
Less than high school diploma -- -- --
High school graduate, GED, or equivalent -- -- --
Some college or associate’s degree 22 44 73
Bachelor’s, Graduate, or Professional Degree 28 46 75
Household Income
<$20,000 -- -- --
$20,000-$49,999 27 41 55
$50,000-$74,999 -- -- --
$75,000+ 32 52 73
Nativity
U.S.-born 21 44 75
Foreign-born 40 48 60
Source: California Dietary Practices Survey, Santa Clara County sample, 2011 Note: Results for some groups not reported due to small sample size

30
Beverage Consumption Among Youth In Santa Clara County from 2001 to 2008, the percentage of middle and high school students consuming one or more glasses or cans of soda the previous day decreased from 71% to 55%. A decline in consumption was seen for each grade and racial/ethnic group. In 2007-08, a lower percentage of eleventh-graders (52%) reported consuming soda the previous day than ninth-graders (56%) and seventh-graders (59%). A higher percentage of Latino (64%) and African American (61%) adolescents consumed soda the previous day than Whites (55%) or Asian/Pacific Islanders (48%).
In Santa Clara County from 2007 to 2009, nearly one third of children ages 6-11 (31%) consumed one or more glasses or cans of soda the previous day. The percentage was higher among girls than boys (36% versus 26%).[3,4]
More than half of children ages 6-11 (57%) and adolescents ages 12-19 (57%) consumed one or more glasses of 100% juice in the past 24 hours. A higher percentage of girls than boys consumed 100% juice (59% versus 56%). For adolescents, the reverse was true for juice consumption (59% of boys versus 54% of girls). [3,4]
Table 3.10: Soda Consumption Among Middle and High School Students by Selected Characteristics, 2001-2008
Consumed one or more glasses or cans of soda
the previous day
2001-02
% 2003-04
% 2005-06
% 2007-08
% Santa Clara County 71 64 61 55
Grade Seventh 72 65 61 59
Ninth 73 65 63 56
Eleventh 68 60 56 52
Race/Ethnicity African American 77 71 68 61
Asian/Pacific Islander
63 54 52 48
Latino 78 74 72 64
White 70 61 56 55
Source: California Healthy Kids Survey, 2001-2008

31
Consumption of Foods Linked with Higher Intake of Sugar-Sweetened Beverages Intake of certain foods and beverages has been shown to have a strong relationship with sugar-sweetened beverage consumption. Sugar-sweetened beverages account for 13% of all calories consumed by adolescents, and many believe that sugar-sweetened beverage consumption has contributed to the rise in overweight and obesity. Consumption of food and beverages such as milk (including flavored milks and milkshakes), desserts and sweets, chips and fried food, french fries and fried vegetables, and fast food has been shown to be associated with an increase in sugar-sweetened beverage consumption [5].
As reported earlier, adults in Santa Clara County in 2011 on average consumed 0.42 cans or glasses of soda or sweetened non-carbonated beverages and 1.11 glasses of milk or drinks made with milk. In addition, they ate 0.63 servings of sweets, 0.18 servings of chips, and 0.30 servings of fried foods on average. Average consumption of chips and fried foods decreased with age and was higher among Latinos than Whites. There were few clear patterns by education or income.

32
Table 3.11: Consumption of Foods Linked with Higher Sugar-Sweetened Beverage Intake Among Adults by Selected Characteristics
Average servings of
sweets yesterday
Average servings of
chips yesterday
Average servings of fried foods yesterday
Santa Clara County 0.63 0.18 0.30
Sex
Men 0.62 0.17 0.30
Women 0.64 0.20 0.29
Age
18-44 0.65 0.19 0.41
45-64 0.53 0.18 0.15
65+ 0.76 0.14 0.10
Race/Ethnicity
Latino 0.47 0.28 0.48
White 0.79 0.18 0.32
Education
Less than high school diploma -- -- --
High school graduate, GED, or equivalent
0.50 0.28 0.38
Some college or associate’s degree
0.96 0.13 0.41
Bachelor’s, graduate, or professional degree
0.57 0.17 0.18
Household Income
<$20,000 0.30 0.07 0.22
$20,000-$49,999 0.70 0.10 0.62
$50,000-$74,999 0.67 0.15 0.26
$75,000+ 0.63 0.18 0.16
Nativity
U.S.-born 0.79 0.15 0.37
Foreign-born 0.42 0.23 0.20
Source: California Dietary Practices Survey, Santa Clara County sample, 2011 Note: Results for those with less than a high school diploma not reported due to small sample size

33
Perceptions of Neighborhood Healthy Food Access Among Adults In 2011, while the majority of Santa Clara County adults (81%) often or always could find a variety of high quality and affordable produce to purchase in their neighborhood, this percentage was lower among Latino adults (65%) than Whites (90%). In addition, this percentage was lower among low-income adults, with only 49% of adults with an annual household income of less than $20,000 reporting that they often or always could easily find high quality and affordable produce compared to 86% of those with incomes of $75,000 or more.
Nearly half of adults (46%) reported that it was challenging to find fruits and vegetables at work, with more adults (71%) with an annual household income of less than $20,000 reporting difficulty finding produce at work than those with higher incomes (40%). Perceptions of the affordability of fruits and vegetables also varied by household income, with 63% of those earning less than $20,000 per year compared to only 12% of those earning more than $75,000 per year reporting that fruits and vegetables were too expensive.

34
Table 3.12: Perceptions of Neighborhood Food Access by Selected Characteristics
Often or always could easily find
a variety of good quality, affordable,
fresh fruits and vegetables that they want (%)
Agreed that it is
hard to get fruits and
vegetables at
restaurants (%)
Agreed that it is hard to get
fruits and vegetables at
fast food restaurants
(%)
Agreed that it is hard to get
fruits and vegetables at
workplace (%)
Agreed that fruits and
vegetables are too
expensive (%)
Santa Clara County 81 26 78 46 23
Sex
Men 83 23 82 46 17
Women 79 29 73 46 28
Age
18-44 81 30 84 49 24
45-64 79 19 68 41 21
65+ 89 23 71 35 20
Race/Ethnicity
Latino 65 14 68 46 26
White 90 21 80 41 21
Education
Less than high school diploma
-- -- -- -- --
High school graduate, GED, or equivalent
77 31 72 41 34
Some college or associate’s degree
83 18 74 58 38
Bachelor’s, graduate, or professional degree
85 27 83 44 13
Household Income
<$20,000 49 52 57 71 63
$20,000-$49,999 85 16 76 54 24
$50,000-$74,999 80 13 85 32 35
$75,000+ 86 28 81 40 12
Nativity
U.S.-born 85 21 78 43 25
Foreign-born 76 33 77 49 19
Source: California Dietary Practices Survey, Santa Clara County sample, 2011 Note: Results for those with less than a high school diploma not reported due to small sample size

35
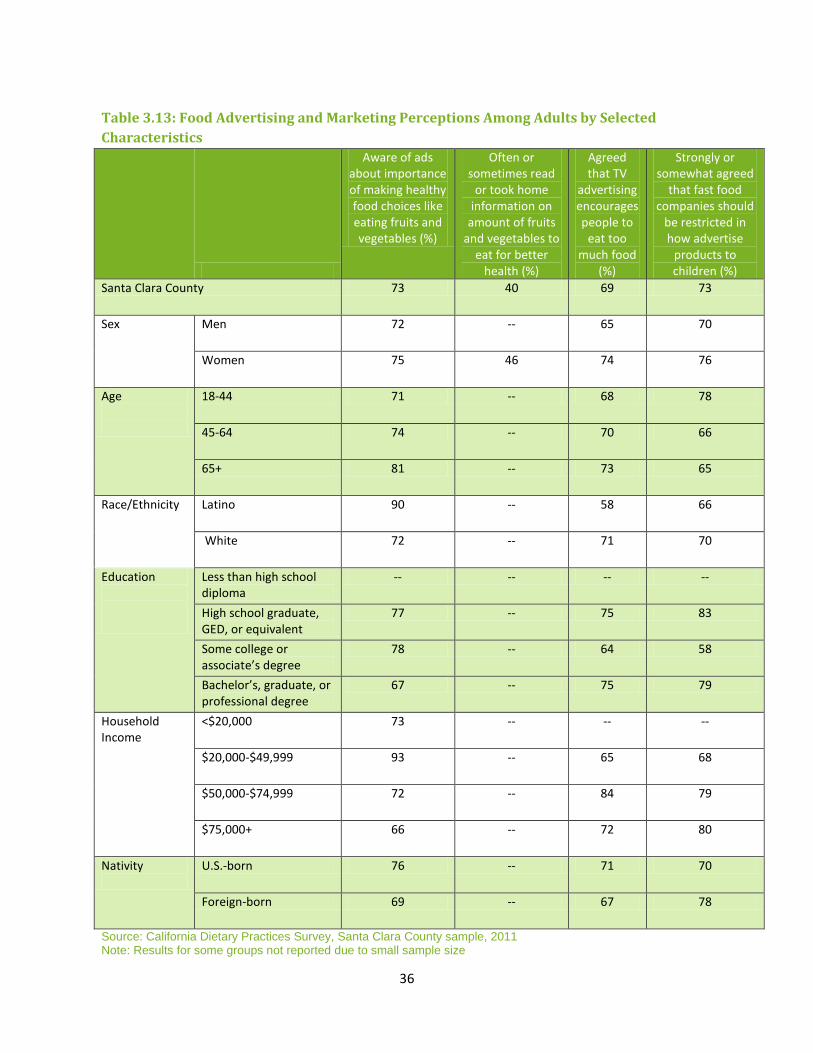
Perceptions of Food Advertising and Marketing Among Adults A majority of adults (73%) in Santa Clara County in 2011 were aware of advertisements about making healthy food choices. This awareness increased with age and was more common among Latinos (90%) than Whites (72%).
Sixty-nine percent (69%) of Santa Clara County adults agreed that TV advertising encourages people to overeat. Fewer Latino adults (58%) than White adults (71%) agreed with this statement. In addition, 73% of adults in Santa Clara County agreed that fast food companies should be restricted in how they advertise products to children.
36
Table 3.13: Food Advertising and Marketing Perceptions Among Adults by Selected Characteristics
Aware of ads about importance of making healthy food choices like eating fruits and vegetables (%)
Often or sometimes read
or took home information on
amount of fruits and vegetables to
eat for better health (%)
Agreed that TV
advertising encourages people to
eat too much food
(%)
Strongly or somewhat agreed
that fast food companies should
be restricted in how advertise
products to children (%)
Santa Clara County 73 40 69 73
Sex
Men 72 -- 65 70
Women 75 46 74 76
Age
18-44 71 -- 68 78
45-64 74 -- 70 66
65+ 81 -- 73 65
Race/Ethnicity
Latino 90 -- 58 66
White 72 -- 71 70
Education
Less than high school diploma
-- -- -- --
High school graduate, GED, or equivalent
77 -- 75 83
Some college or associate’s degree
78 -- 64 58
Bachelor’s, graduate, or professional degree
67 -- 75 79
Household Income
<$20,000 73 -- -- --
$20,000-$49,999 93 -- 65 68
$50,000-$74,999 72 -- 84 79
$75,000+ 66 -- 72 80
Nativity
U.S.-born 76 -- 71 70
Foreign-born 69 -- 67 78
Source: California Dietary Practices Survey, Santa Clara County sample, 2011 Note: Results for some groups not reported due to small sample size

37
Household Food and Beverage Policies Household rules can help limit access to unhealthy foods and beverages and promote healthier food choices at home. [6] In 2011, nearly all Santa Clara County adults (90%) limited the amount of sugar-sweetened beverages children are allowed to drink at home. Percentages were similar across most demographic groups.
Adults also tended to limit the number of times their family ate at fast food restaurants. Nearly three quarters (71%) of adults had such limits for their families. A higher percentage of Latinos had these limits than Whites (80% versus 63%).
Eating meals together as a family has been shown to increase children’s consumption of fruits and vegetables and reduce consumption of unhealthy foods. [12] In Santa Clara County in 2011, 66% of adults reported that all family members who lived in the household ate a meal together every day or most days in the past week. This percentage was lower among Latinos (46%) than Whites (72%) and among those with household incomes of $20,000-$49,999 (55%) versus $75,000 or more (78%).

38
Table 3.14: Household Nutrition Policies Among Adults by Selected Characteristics
Limit how much soda and other
sugary beverages child(ren)
drink(s) at home (%)
Limit number of times per week or month family ate
at fast food restaurants (%)
All family members who live in the
household ate a meal together most or every day in the
past week (%)
Santa Clara County
90 71 66
Sex
Men 95 68 68
Women 83 75 64
Age
18-44 91 75 62
45-64 85 71 74
65+ -- 55 70
Race/Ethnicity
Latino 96 80 46
White 92 63 72
Education
Less than high school diploma
-- -- --
High school graduate, GED, or equivalent
-- 63 62
Some college or associate’s degree
-- 52 63
Bachelor’s, graduate, or professional degree
92 77 73
Household Income
<$20,000 -- 70 --
$20,000-$49,999 -- 78 55
$50,000-$74,999 -- 58 51
$75,000+ 91 79 78
Nativity
U.S.-born 88 60 70
Foreign-born 90 86 62
Source: California Dietary Practices Survey, Santa Clara County Sample, 2011 Note: Results for some groups not reported due to small sample size

39
Workplace Food and Beverage Policies One in 5 adults (21%) in Santa Clara County in 2011 ate food from their worksite cafeteria, snack bar, or food service the previous day. A majority of adults responded that healthy foods (85%) and healthy beverages (91%) were available from their worksite cafeteria, snack bar, or food service. Few adults worked where healthy food was available from onsite vending machines (15%) or where their workplace provided an onsite farmers’ market, weekly produce delivery, or weekly free fresh fruit snack (17%).
Table 3.15: Workplace Food Policies Among Adults by Selected Characteristics Healthy
foods available
at cafeteria, snackbar, or food service
(%)
Healthy beverages available
at cafeteria, snackbar, or food service
(%)
Healthy foods
available at
worksite vending
machines (%)
Workplace provided onsite
farmers' market, weekly
produce delivery or weekly free
fresh fruit snack (%)
Santa Clara County 85 91 15 17
Sex
Men 87 88 11 18
Women 82 95 21 14
Age
18-44 81 90 12 16
45-64 95 95 22 17
65+ -- -- -- --
Race/Ethnicity
Latino -- -- -- 7
White 91 93 19 21
Education
Less than high school diploma -- -- -- --
High school graduate, GED, or equivalent -- -- -- --
Some college or associate’s degree -- -- -- 29
Bachelor’s, graduate, or professional degree 81 92 18 19
Household Income
<$20,000 -- -- -- --
$20,000-$49,999 -- -- -- 20
$50,000-$74,999 -- -- -- --
$75,000+ 78 92 17 16
Nativity
U.S.-born 96 95 17 16
Foreign-born 75 86 14 17
Source: California Dietary Practices Survey, Santa Clara County sample, 2011 Note: Results for some groups not reported due to small sample size

40
References 1. California Department of Public Health. “Education, Diet, and Environmental Factors Influence
Sugar-Sweetened Beverage Consumption among California, Teens, and Adults”. Network for a Healthy California.n.d.
2. California Dietary Practices Survey, Santa Clara County sample, 2011 3. California Health Interview Survey, Child Survey, 2007-2009. 4. California Health Interview Survey, Teen Survey, 2007 & 2009 5. Center for Disease Control and Prevention. "The CDC Guide to Strategies for Reducing the
Consumption of Sugar-Sweetened Beverages". Retrieved May 31, 2013 from http://www.cdph.ca.gov/SiteCollectionDocuments/StratstoReduce_Sugar_Sweetened_Bevs.pdf
6. De Bourdeaudhuij, Ilse. Family Food Rules and Healthy Eating in Adolescents. J Health Psychol, 1997 (2): p. 45-56.
7. Dennison, B., et al., Television Viewing and Television in Bedroom Associated with Overweight Risk Among Low-Income Preschool Children. Pediatrics. 2002 (109) p. 6.
8. Centers of Disease Control and Prevention. Healthy People 2020. 9. Kramer, M.S., et al., Why Are Babies Getting Bigger? Temporal Trends in Fetal Growth and Its
Determinants. J Pediatr, 2002. 141(4): p. 538-42. 10. Moudon, A. V. Operational Definitions of Walkable Neighborhood: Theoretical and Empirical
Insights. J Phys Act Health, 2006. p. 99-117. 11. Ogden, C.L., et al., Prevalence of Obesity in the United States, 2009-2010. NCHS Data Brief,
2012(82): p. 1-8. 12. "Plan a Healthy Meal". Retrieved May 14, 2013 from http://www.letsmove.gov/plan-healthy-
meal 13. Santa Clara County Public Health Department, 2009 Behavioral Risk Factor Survey.