Obesity in renal transplantation - KHA-CARI Mission recipient... · Recipient Assessment for...
12
____________________________________________________________________________________________________________ Recipient Assessment for Transplantation March 2013 Page 1 of 12 Obesity in renal transplantation Date written: November 2011 Author: Christine Russell GUIDELINES a. We recommend that obesity should not on its own preclude a patient from being considered for kidney transplantation (1B). b. As a pre-transplant Body Mass Index (BMI) > 40 kg/m2 may not be associated with a survival advantage compared to remaining on dialysis, we suggest that the suitability for transplant be carefully assessed on an individual basis (2C). c. As patient and graft survival of obese transplant recipients may be mediated by comorbid factors, particularly cardiovascular, we recommend that obese transplant candidates are screened for cardiovascular disease (refer to “Cardiovascular Disease” guidelines for recommendations) (1C). UNGRADED SUGGESTIONS FOR CLINICAL CARE None made IMPLEMENTATION AND AUDIT Body mass index and comorbidity data should continue to be collected by ANZDATA and further analyses performed in the future. BACKGROUND In the past, high BMI as a barrier for transplantation has tended to be a surgical issue. It was recognised as a problem by Starzl’s group in 1990 [1]. It appears, however, that there are also medical implications in terms of graft and patient loss. In the US, nearly 58.8% of subjects at the time of transplantation currently are overweight or obese [2]. SEARCH STRATEGY Databases searched: MeSH terms and text words for kidney transplantation and recipient were combined with MeSH terms for obesity and morbid obesity. The search was carried out in Medline (1950 – May 2011). In addition, MeSH terms and text words for kidney transplantation and recipient were combined with MeSH terms and text words for obesity, waist-hip ratio, abdominal girth, abdominal circumference and weight loss. The search was carried out in Medline (1950 – April, Week 3, 2010). The Cochrane Renal Group Trials Register was also searched for relevant trials not indexed in Medline. Date of search: May 2011
Transcript of Obesity in renal transplantation - KHA-CARI Mission recipient... · Recipient Assessment for...

____________________________________________________________________________________________________________ Recipient Assessment for Transplantation March 2013 Page 1 of 12
Obesity in renal transplantation Date written: November 2011 Author: Christine Russell
GUIDELINES
a. We recommend that obesity should not on its own preclude a patient from being considered for kidney transplantation (1B).
b. As a pre-transplant Body Mass Index (BMI) > 40 kg/m2 may not be associated with a survival advantage compared to remaining on dialysis, we suggest that the suitability for transplant be carefully assessed on an individual basis (2C).
c. As patient and graft survival of obese transplant recipients may be mediated by comorbid factors, particularly cardiovascular, we recommend that obese transplant candidates are screened for cardiovascular disease (refer to “Cardiovascular Disease” guidelines for recommendations) (1C).
UNGRADED SUGGESTIONS FOR CLINICAL CARE None made
IMPLEMENTATION AND AUDIT Body mass index and comorbidity data should continue to be collected by ANZDATA and further analyses performed in the future.
BACKGROUND In the past, high BMI as a barrier for transplantation has tended to be a surgical issue. It was recognised as a problem by Starzl’s group in 1990 [1]. It appears, however, that there are also medical implications in terms of graft and patient loss. In the US, nearly 58.8% of subjects at the time of transplantation currently are overweight or obese [2].
SEARCH STRATEGY Databases searched: MeSH terms and text words for kidney transplantation and recipient were combined with MeSH terms for obesity and morbid obesity. The search was carried out in Medline (1950 – May 2011). In addition, MeSH terms and text words for kidney transplantation and recipient were combined with MeSH terms and text words for obesity, waist-hip ratio, abdominal girth, abdominal circumference and weight loss. The search was carried out in Medline (1950 – April, Week 3, 2010). The Cochrane Renal Group Trials Register was also searched for relevant trials not indexed in Medline. Date of search: May 2011

____________________________________________________________________________________________________________ Recipient Assessment for Transplantation March 2013 Page 2 of 12
WHAT IS THE EVIDENCE? Graft and patient survival Many of the earlier studies are small single centre control-matched comparisons, and therefore may not be particularly helpful. There are now a number of larger national database studies, although not any controlled trials. The largest study is from Meier-Kreische, using the US renal data system registry [3]. Sample size was 51,927 adult patients with first graft, registered on the database between 1988 and 1997 and was divided into groups with BMI in blocks of two increments. Patients were followed until graft loss, death, or the end of the study on May 30
th 1998. Cox proportional hazard model was used and corrected for
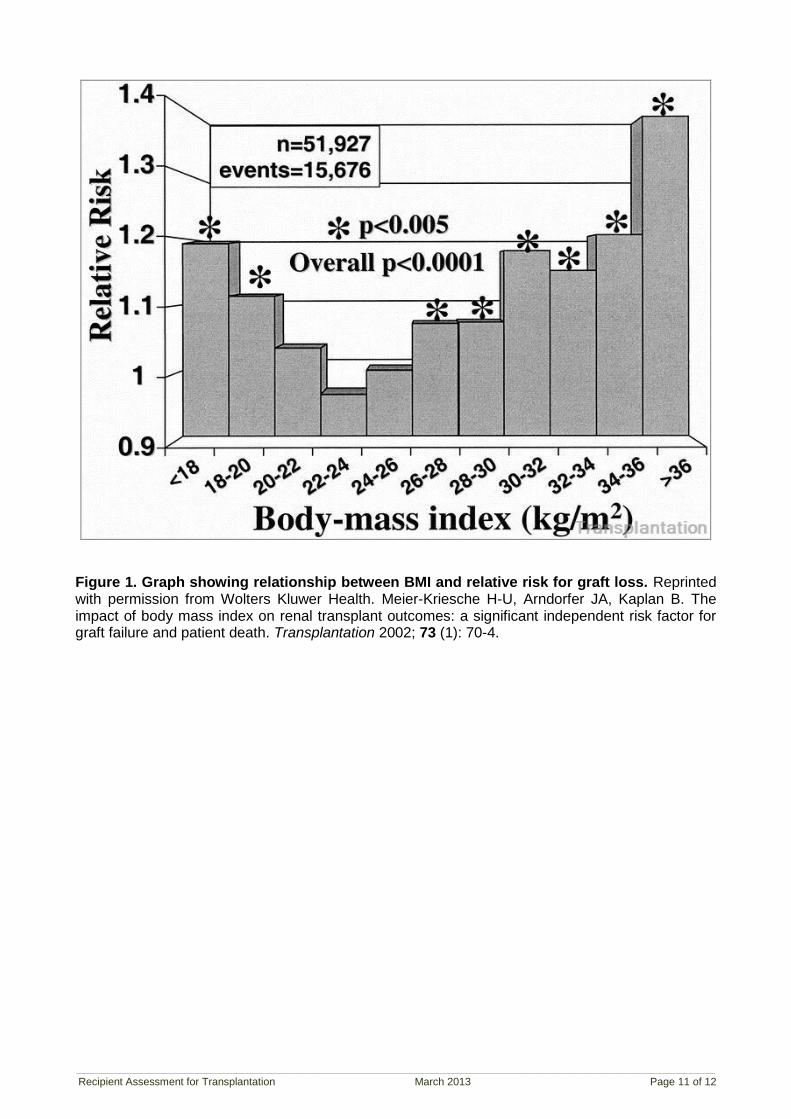
many confounding factors (donor and recipient age, race, gender, and CMV IgG antibody status; primary cause of ESKD (end-stage kidney disease); donor source; cold ischemia times; HLA mismatch; presensitization (PRA); cyclosporine versus tacrolimus treatment; induction versus no induction treatment; mycophenolate mofetil versus azathioprine, and delayed graft function). With respect to the reference sample of BMI 24-26, the group with BMI 30-32 had 1.181 relative risk of graft loss; the group with BMI 32-34 had 1.151 relative risk of graft loss; the group with BMI 34-36 had 1.205 relative risk of graft loss and the group with BMI >36 had 1.385 relative risk of graft loss. The group with BMI <18 also had an increased relative risk of graft loss of 1.213. Death-censored graft loss was similar in these groups, although the specific numbers are not given. With respect to the reference sample of BMI 24-26, the relative risk of death with functioning graft for BMI <18 was 1.55; for BMI 34-36 it was 1.30 and for BMI >36 it was 1.35. There was also an increased risk of cardiovascular-related death and infectious death (although with low numbers) with higher BMI. Higher BMI was also significantly associated with delayed graft function and chronic allograft failure (failure after 6 months) but not acute rejection episodes (Figure 1) [3]. Gore et al looked at the UNOS database for adult patients transplanted with a first renal transplant between the beginning of 1997 and the end of 1999 with full anthropometric data (27,377 patients; 89.5% of all patients undergoing kidney only transplantation during that time) [4]. Follow up was until July 2004.This was after the introduction of calcineurin inhibitors as compared to the previous study, and had longer follow-up of this group of patients. In univariate analysis, morbid obesity was associated with an increase in bleeding, delayed graft function, prolonged hospitalisation, early graft loss, acute rejection and worse overall graft survival. In multivariate analysis, the association between morbid obesity and increased risk of delayed graft function, prolonged hospitalisation and acute rejection remained. Multivariate analysis also showed an increased hazard ratio of graft loss of 1.22 in the morbidly obese group, compared with the group with normal BMI. Interestingly, in this study, there was not an increased risk of death with a functioning graft when adjusted for comorbidities (Figure 2) [4]. The ANZDATA registry looked at adult patients receiving a first graft between April 1991 and December 2004, who had commenced renal replacement therapy from April 1991 (5684 patients) [5]. Follow up was until the end of 2005. In 2003-04, 54.0% of adult kidney-only transplant recipients were overweight or obese. BMI was stratified according to the WHO classification and showed that obese patients have worse graft and patient survival in univariate analysis, but not in multivariate analysis. The hazard ratio for graft loss was 1.26 for obese recipients in the univariate analysis but 1.10 in the multivariate analysis. The hazard ratio for patient death was 1.51 for obese recipients in the univariate analysis but 1.02 in the multivariate analysis. Obesity was associated with greater odds for delayed graft function (DGF) (adjusted OR: 1.56 [1.23-1.97], P < 0.001) and 6-month risk of acute rejection (adjusted OR: 1.25 [1.01-1.54], P = 0.04). Interestingly, underweight patients had greater late death-censored graft loss. Recipients with BMI >35 were small in number and were not separately analysed. Obesity was not associated with death from cardiovascular disease or infections in multivariate analysis in this study. A study from the Dutch national database of adult primary renal transplant recipients from 1993 showed a decrease in both patient and graft survival at 1 year and 5 years with increasing BMI [6]. Cut-off was BMI of 30, although fewer than 50% of recipients had BMI data available. One- and 5- year patient survival were 94.0% vs. 97.0% and 81.0% vs. 89.0% respectively, (P < 0.01). One- and 5- year graft survival were respectively 86.0% vs. 92.0% and 71.0% vs. 80.0%, (P < 0.01).

____________________________________________________________________________________________________________ Recipient Assessment for Transplantation March 2013 Page 3 of 12
There are a number of smaller single centre studies which are split between a decrease in death-censored graft loss and no change, but they are all relatively small numbers compared with the nationwide renal registry data. A review by the Queensland group has listed single centre studies of death-censored graft survival in obese patients compared with normal patients [7]. Pre-1995, there appeared to be an increased risk of DGF, although this does not seem to have carried through to after 1995, in similar sized studies. There also appeared in some studies to be an increase in death-censored graft loss. They found no significant difference in graft and patient survival but noted an increase in wound breakdown (see below). Cardinal et al looked specifically at 256 patients aged 60 years and older in Quebec province who received a first cadaveric renal transplant between 1985 and 2000 [8]. Body Mass Index was associated with a hazard ratio of death in the first year of 1.34 for a 5-point increase. Modlin et al found worse patient survival at 5 years (89.0% v 67.0%) in a matched group of 127 obese (BMI > 30 kg/m
2) patients transplanted at the Cleveland Clinic, USA. In the obese group, 39.1% of
deaths were cardiovascular, compared with 20.0% in the control group [9]. Howard et al looked at 833 adult patients receiving a first kidney transplant between January 1990 and December 1999 at the University of Florida, USA [10]. Patients were divided according to BMI into normal, overweight or obese according to the WHO classification. Group 1, BMI < 25 kg/m
2 (n = 457);
group 2, BMI 25 kg/m2 and < 30 kg/m
2 (n = 278); and group 3, BMI 35 kg/m
2 (n = 98). Cadaveric
graft survival rates at 2 years were 85% for group 1, 88% for group 2, and 85% for group 3 (P > 0.10). Patient survival rates at 2 years were 92% for group 1, 91% for group 2, and 94% for group 3 (P > 0.10). There were no differences in technical losses or in post-transplantation wound complications. Yamamoto et al looked at paired kidneys from cadaveric donors that were transplanted into obese and non-obese recipients (28 pairs) [11]. They found a trend to reduced graft survival in the obese group, reaching significance at 5 years. Espejo et al looked at the incidence of surgical and infectious complications among 40 obese patients
(BMI pre-transplant 30 kg/m2) versus a matched non-obese control group (BMI < 30 kg/m
2)
transplanted in Madrid between June 1989 and March 2001 [12]. The obese group showed a higher incidence of DGF (30% versus 5%, P < 0.05) and wound infections (12.5%) post-transplant with similar incidences of wound dehiscence, peri-graft collections, and graft function at the end of follow up. One thousand consecutive patients from a different hospital in Madrid were also studied by Marcen et al [13]. At the time of transplantation, the BMI was 25 to 30 kg/m
2 in 25.4% and >30 kg/m
2 in 6.5%.
Graft survival was not clinically significantly different at 1, 5 and 10 years. Obese patients experienced a greater risk of DGF (P < 0.01) and surgical wound complications (12.3% vs 6.7%, P = 0.003). Cacciola et al. looked at results for obese (BMI 30-34.9 kg/m
2) and morbidly obese (BMI ≥35 kg/m
2)
patients. Of 822 transplant recipients, 90 were obese and 24 were morbidly obese [14]. Wound infection rates were similar in the two groups. The patient survival rate at 1 year in obese patients was 98.9% and 95.6% at 5 years. In morbidly obese patients, the patient survival rate at 1 year was 87.5% and at 5 years was 79.2% (P = 0.006). The graft survival rates were 98.9% and 75% at 1 year and 94.5% and 63% at 5 years (P < 0.0001). Obese recipients with a BMI of >35 kg/m
2 had poorer
outcomes. The results of the studies comparing outcomes for obese and non-obese transplant recipients are summarised in Tables 2 and 3 included in the Appendix. Table 2 (which draws on the review by Armstrong et al [15]) and Table 3 include 11 additional studies examining the effect of pre-transplant obesity on graft and patient survival that have not been noted above [16-25]. One study has looked at the use of bariatric surgery in transplant recipients [26]. Using the USRDS database and linking it to Medicare claims, they identified 188 patients undergoing bariatric surgery. Of these, 72 were performed pre-listing, 29 while on the waitlist and 87 post-transplant. Roux-en-Y gastric bypass was the most common procedure. Thirty-day mortality after bariatric surgery performed on the waitlist and post-transplant was 3.5%. BMI data were available for a subset and suggested median excess body weight loss of 31% - 61%. This is comparable to the results of published clinical trials of bariatric surgery in populations without kidney disease. However, the mortality rate was higher. Sixty-nine per cent of those who had surgery while already waitlisted, received a transplant.
____________________________________________________________________________________________________________ Recipient Assessment for Transplantation March 2013 Page 4 of 12
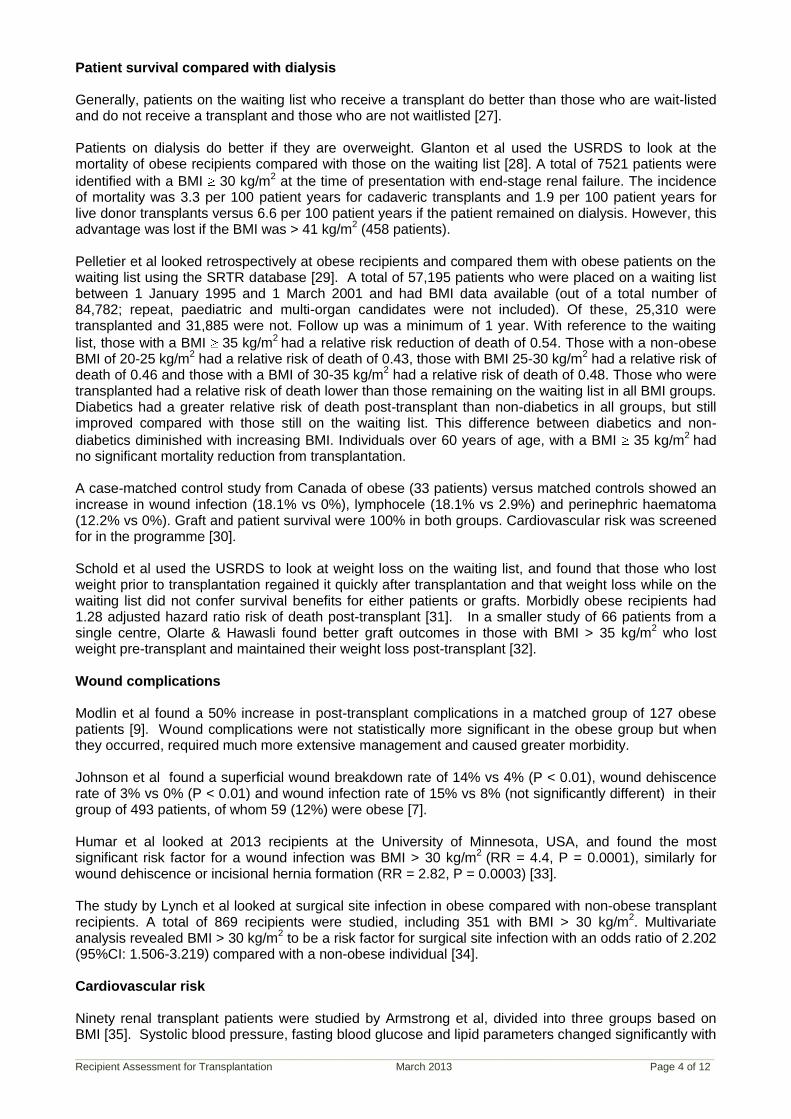
Patient survival compared with dialysis Generally, patients on the waiting list who receive a transplant do better than those who are wait-listed and do not receive a transplant and those who are not waitlisted [27]. Patients on dialysis do better if they are overweight. Glanton et al used the USRDS to look at the mortality of obese recipients compared with those on the waiting list [28]. A total of 7521 patients were
identified with a BMI 30 kg/m2 at the time of presentation with end-stage renal failure. The incidence
of mortality was 3.3 per 100 patient years for cadaveric transplants and 1.9 per 100 patient years for live donor transplants versus 6.6 per 100 patient years if the patient remained on dialysis. However, this advantage was lost if the BMI was > 41 kg/m
2 (458 patients).
Pelletier et al looked retrospectively at obese recipients and compared them with obese patients on the waiting list using the SRTR database [29]. A total of 57,195 patients who were placed on a waiting list between 1 January 1995 and 1 March 2001 and had BMI data available (out of a total number of 84,782; repeat, paediatric and multi-organ candidates were not included). Of these, 25,310 were transplanted and 31,885 were not. Follow up was a minimum of 1 year. With reference to the waiting
list, those with a BMI 35 kg/m2
had a relative risk reduction of death of 0.54. Those with a non-obese BMI of 20-25 kg/m
2 had a relative risk of death of 0.43, those with BMI 25-30 kg/m
2 had a relative risk of
death of 0.46 and those with a BMI of 30-35 kg/m2 had a relative risk of death of 0.48. Those who were
transplanted had a relative risk of death lower than those remaining on the waiting list in all BMI groups. Diabetics had a greater relative risk of death post-transplant than non-diabetics in all groups, but still improved compared with those still on the waiting list. This difference between diabetics and non-
diabetics diminished with increasing BMI. Individuals over 60 years of age, with a BMI 35 kg/m2
had no significant mortality reduction from transplantation. A case-matched control study from Canada of obese (33 patients) versus matched controls showed an increase in wound infection (18.1% vs 0%), lymphocele (18.1% vs 2.9%) and perinephric haematoma (12.2% vs 0%). Graft and patient survival were 100% in both groups. Cardiovascular risk was screened for in the programme [30]. Schold et al used the USRDS to look at weight loss on the waiting list, and found that those who lost weight prior to transplantation regained it quickly after transplantation and that weight loss while on the waiting list did not confer survival benefits for either patients or grafts. Morbidly obese recipients had 1.28 adjusted hazard ratio risk of death post-transplant [31]. In a smaller study of 66 patients from a single centre, Olarte & Hawasli found better graft outcomes in those with BMI > 35 kg/m
2 who lost
weight pre-transplant and maintained their weight loss post-transplant [32]. Wound complications Modlin et al found a 50% increase in post-transplant complications in a matched group of 127 obese patients [9]. Wound complications were not statistically more significant in the obese group but when they occurred, required much more extensive management and caused greater morbidity. Johnson et al found a superficial wound breakdown rate of 14% vs 4% (P < 0.01), wound dehiscence rate of 3% vs 0% (P < 0.01) and wound infection rate of 15% vs 8% (not significantly different) in their group of 493 patients, of whom 59 (12%) were obese [7]. Humar et al looked at 2013 recipients at the University of Minnesota, USA, and found the most significant risk factor for a wound infection was BMI > 30 kg/m
2 (RR = 4.4, P = 0.0001), similarly for
wound dehiscence or incisional hernia formation (RR = 2.82, P = 0.0003) [33]. The study by Lynch et al looked at surgical site infection in obese compared with non-obese transplant recipients. A total of 869 recipients were studied, including 351 with BMI > 30 kg/m
2. Multivariate
analysis revealed BMI > 30 kg/m2 to be a risk factor for surgical site infection with an odds ratio of 2.202
(95%CI: 1.506-3.219) compared with a non-obese individual [34]. Cardiovascular risk Ninety renal transplant patients were studied by Armstrong et al, divided into three groups based on BMI [35]. Systolic blood pressure, fasting blood glucose and lipid parameters changed significantly with
____________________________________________________________________________________________________________ Recipient Assessment for Transplantation March 2013 Page 5 of 12
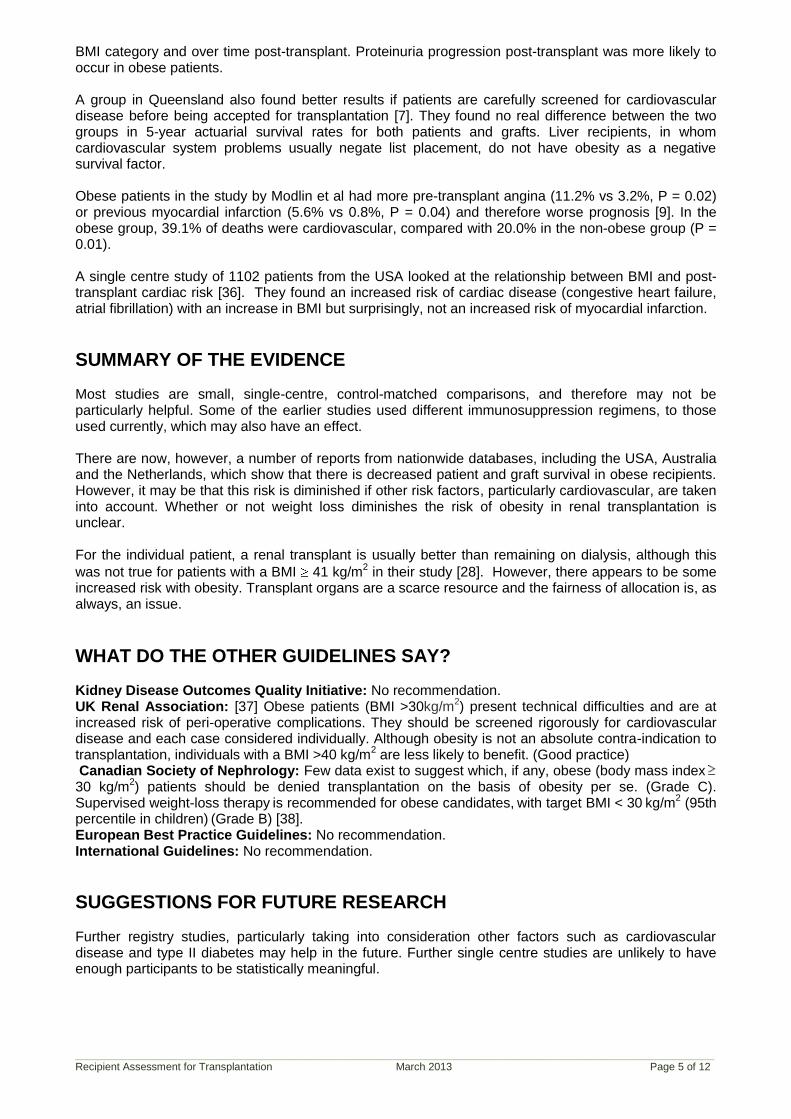
BMI category and over time post-transplant. Proteinuria progression post-transplant was more likely to occur in obese patients. A group in Queensland also found better results if patients are carefully screened for cardiovascular disease before being accepted for transplantation [7]. They found no real difference between the two groups in 5-year actuarial survival rates for both patients and grafts. Liver recipients, in whom cardiovascular system problems usually negate list placement, do not have obesity as a negative survival factor. Obese patients in the study by Modlin et al had more pre-transplant angina (11.2% vs 3.2%, P = 0.02) or previous myocardial infarction (5.6% vs 0.8%, P = 0.04) and therefore worse prognosis [9]. In the obese group, 39.1% of deaths were cardiovascular, compared with 20.0% in the non-obese group (P = 0.01). A single centre study of 1102 patients from the USA looked at the relationship between BMI and post-transplant cardiac risk [36]. They found an increased risk of cardiac disease (congestive heart failure, atrial fibrillation) with an increase in BMI but surprisingly, not an increased risk of myocardial infarction.
SUMMARY OF THE EVIDENCE Most studies are small, single-centre, control-matched comparisons, and therefore may not be particularly helpful. Some of the earlier studies used different immunosuppression regimens, to those used currently, which may also have an effect. There are now, however, a number of reports from nationwide databases, including the USA, Australia and the Netherlands, which show that there is decreased patient and graft survival in obese recipients. However, it may be that this risk is diminished if other risk factors, particularly cardiovascular, are taken into account. Whether or not weight loss diminishes the risk of obesity in renal transplantation is unclear. For the individual patient, a renal transplant is usually better than remaining on dialysis, although this
was not true for patients with a BMI 41 kg/m2 in their study [28]. However, there appears to be some
increased risk with obesity. Transplant organs are a scarce resource and the fairness of allocation is, as always, an issue.
WHAT DO THE OTHER GUIDELINES SAY? Kidney Disease Outcomes Quality Initiative: No recommendation. UK Renal Association: [37] Obese patients (BMI >30kg/m
2) present technical difficulties and are at
increased risk of peri-operative complications. They should be screened rigorously for cardiovascular disease and each case considered individually. Although obesity is not an absolute contra-indication to transplantation, individuals with a BMI >40 kg/m
2 are less likely to benefit. (Good practice)
Canadian Society of Nephrology: Few data exist to suggest which, if any, obese (body mass index
30 kg/m2) patients should be denied transplantation on the
basis of obesity per se. (Grade C).
Supervised weight-loss therapy is recommended for obese candidates,
with target BMI < 30
kg/m
2 (95th
percentile in children) (Grade B) [38].
European Best Practice Guidelines: No recommendation. International Guidelines: No recommendation.
SUGGESTIONS FOR FUTURE RESEARCH Further registry studies, particularly taking into consideration other factors such as cardiovascular disease and type II diabetes may help in the future. Further single centre studies are unlikely to have enough participants to be statistically meaningful.

____________________________________________________________________________________________________________ Recipient Assessment for Transplantation March 2013 Page 6 of 12
CONFLICT OF INTEREST Christine Russell has no relevant financial affiliations that would cause a conflict of interest according to the conflict of interest statement set down by KHA-CARI.
REFERENCES
1. Holley JL, Shapiro R, Lopatin WB et al. Obesity as a risk factor following cadaveric renal transplantation. Transplantation. 1990; 49: 387-9.
2. Friedman AN, Miskulin DC, Rosenberg IH et al. Demographics and trends in overweight and obesity in patients at time of kidney transplantation. American Journal of Kidney Diseases. 2003; 41: 480-7.
3. Meier-Kriesche H-U, Arndorfer JA, and Kaplan B. The impact of body mass index on renal transplant outcomes: a significant independent risk factor for graft failure and patient death. Transplantation. 2002; 73: 70-4.
4. Gore JL, Pham PT, Danovitch GM et al. Obesity and outcome following renal transplantation. American Journal of Transplantation. 2006; 6: 357-63.
5. Chang SH, Coates PTH, and McDonald SP. Effects of body mass index at transplant on outcomes of kidney transplantation. Transplantation. 2007; 84: 981-7.
6. Aalten J, Christiaans MH, de Fijter H et al. The influence of obesity on short- and long-term graft and patient survival after renal transplantation. Transplant International. 2006; 19: 901-7.
7. Johnson DW, Isbel NM, Brown AM et al. The effect of obesity on renal transplant outcomes. Transplantation. 2002; 74: 675-81.
8. Cardinal H, Hebert M-J, Rahme E et al. Modifiable factors predicting patient survival in elderly kidney transplant recipients. Kidney International. 2005; 68: 345-51.
9. Modlin CS, Flechner SM, Goormastic M et al. Should obese patients lose weight before receiving a kidney transplant? Transplantation. 1997; 64: 599-604.
10. Howard RJ, Thai VB, Patton PR et al. Obesity does not portend a bad outcome for kidney transplant recipients. Transplantation. 2002; 73: 53-5.
11. Yamamoto S, Hanley E, Hahn AB et al. The impact of obesity in renal transplantation: an analysis of paired cadaver kidneys. Clinical Transplantation. 2002; 16: 252-6.
12. Espejo B, Torres A, Valentin M et al. Obesity favors surgical and infectious complications after renal transplantation. Transplantation Proceedings. 2003; 35: 1762-3.
13. Marcen R, Fernandez A, Pascual J et al. High body mass index and posttransplant weight gain are not risk factors for kidney graft and patient outcome. Transplantation Proceedings. 2007; 39: 2205-7.
14. Cacciola RAS, Pujar K, Ilham MA et al. Effect of degree of obesity on renal transplant outcome. Transplantation Proceedings. 2008; 40: 3408-12.
15. Armstrong KA, Campbell SB, Hawley CM et al. Impact of obesity on renal transplant outcomes. Nephrology. 2005; 10: 405-13.
16. Merion RM, Twork AM, Rosenberg L et al. Obesity and renal transplantation. Surgery, Gynecology & Obstetrics. 1991; 172: 367-76.
17. Gill IS, Hodge EE, Novick AC et al. Impact of obesity on renal transplantation. Transplantation Proceedings. 1993; 25: 1047-8.
18. Pfeiffer T, Albrecht KH, Wagner K et al. [The effect of obesity on outcome of kidney transplantation]. Medizinische Klinik. 1994; 89: 635-9.
19. Halme L, Eklund B, and Salmela K. Obesity and renal transplantation. Transplantation Proceedings. 1995; 27: 3444-5.
20. Pirsch JD, Armbrust MJ, Knechtle SJ et al. Obesity as a risk factor following renal transplantation. Transplantation. 1995; 59: 631-3.
21. Drafts HH, Anjum MR, Wynn JJ et al. The impact of pre-transplant obesity on renal transplant outcomes. Clinical Transplantation. 1997; 11: 493-6.
22. Orofino L, Pascual J, Quereda C et al. Influence of overweight on survival of kidney transplant. Nephrology Dialysis Transplantation. 1997; 12: 855.

____________________________________________________________________________________________________________ Recipient Assessment for Transplantation March 2013 Page 7 of 12
23. Meier-Kriesche HU, Vaghela M, Thambuganipalle R et al. The effect of body mass index on long-term renal allograft survival. Transplantation. 1999; 68: 1294-7.
24. Marks WH, Florence LS, Chapman PH et al. Morbid obesity is not a contraindication to kidney transplantation. American Journal of Surgery. 2004; 187: 635-8.
25. Massarweh NN, Clayton JL, Mangum CA et al. High body mass index and short- and long-term renal allograft survival in adults. Transplantation. 2005; 80: 1430-4.
26. Modanlou KA, Muthyala U, Xiao H et al. Bariatric surgery among kidney transplant candidates and recipients: analysis of the United States renal data system and literature review. Transplantation. 2009; 87: 1167-73.
27. Wolfe RA, Ashby VB, Milford EL et al. Comparison of mortality in all patients on dialysis, patients on dialysis awaiting transplantation, and recipients of a first cadaveric transplant. New England Journal of Medicine. 1999; 341: 1725-30.
28. Glanton CW, Kao T-C, Cruess D et al. Impact of renal transplantation on survival in end-stage renal disease patients with elevated body mass index. Kidney International. 2003; 63: 647-53.
29. Pelletier SJ, Maraschio MA, Schaubel DE et al. Survival benefit of kidney and liver transplantation for obese patients on the waiting list. Clinical Transplants. 2003: 77-88.
30. Singh D, Lawen J, and Alkhudair W. Does pretransplant obesity affect the outcome in kidney transplant recipients? Transplantation Proceedings. 2005; 37: 717-20.
31. Schold JD, Srinivas TR, Guerra G et al. A "weight-listing" paradox for candidates of renal transplantation? American Journal of Transplantation. 2007; 7: 550-9.
32. Olarte IG and Hawasli A. Kidney transplant complications and obesity. American Journal of Surgery. 2009; 197: 424-6.
33. Humar A, Ramcharan T, Denny R et al. Are wound complications after a kidney transplant more common with modern immunosuppression? Transplantation. 2001; 72: 1920-3.
34. Lynch RJ, Ranney DN, Shijie C et al. Obesity, surgical site infection, and outcome following renal transplantation. Annals of Surgery. 2009; 250: 1014-20.
35. Armstrong KA, Campbell SB, Hawley CM et al. Obesity is associated with worsening cardiovascular risk factor profiles and proteinuria progression in renal transplant recipients. American Journal of Transplantation. 2005; 5: 2710-8.
36. Lentine KL, Rocca-Rey LA, Bacchi G et al. Obesity and cardiac risk after kidney transplantation: experience at one center and comprehensive literature review. Transplantation. 2008; 86: 303-12.
37. Dudley C and Harden P, Clinical Practice Guidelines: Assessment of the Potential Kidney Transplant Recipient. Evaluation, selection and preparation of the potential transplant recipient (Guidelines 2.1 - 2.9). 2011, UK Renal Association.
38. Knoll G, Cockfield S, Blydt-Hansen T et al. Canadian Society of Transplantation consensus guidelines on eligibility for kidney transplantation. CMAJ Canadian Medical Association Journal. 2005; 173: 1181-4.

_________________________________________________________________________________________________________________________________________________________________________________________
Recipient Assessment for Transplantation March 2013 Page 8 of 12
APPENDICES Table 1. Characteristics of registry studies
Study ID (author, year)
N
Study design
Participants
Comments and results
Meier-Kreische et al 2002 [3]
51,927
Retrospective registry study
Primary adult renal transplants from USRDS registered 1988-1997
Cox proportional hazard model used and corrected for many confounding factors
BMI 34-36 had 1.205 RR graft loss
BMI >36 had 1.385 RR graft loss
BMI<18 had 1.213 RR graft loss
Gore et al 2006 [4]
27,377 Retrospective registry study
Primary adult renal transplants from UNOS transplanted 1997-99
Cox proportional hazard model used
BMI >35 had 1.22 HR of graft loss
Chang et al 2007 [5] 5684 Retrospective registry study
Primary adult renal transplants from ANZDATA transplanted 1991-2004
Adjusted hazard ratio [HR] for graft loss: 1.10 [0.94-1.259], P=0.25; for patient death: 1.02 [0.83-1.25], P=0.87
Aalten et al 2006 [6] 2067 Retrospective registry study
Primary adult renal transplants from transplanted 1994-99
1 year graft survival 86.0% vs. 92.0%
5 yr graft survival 71.0% vs. 80.0%, (P < 0.01)
1 year patient survival 94.0% vs. 97.0%
5 year patient survival 81.0% vs. 89.0%
USRDS = United States Renal Data System; UNOS = United Network for Organ Sharing; ANZDATA = Australia and New Zealand Dialysis and Transplant Registry; NOTR = Netherlands Organ Transplantation Registry

_________________________________________________________________________________________________________________________________________________________________________________________
Recipient Assessment for Transplantation March 2013 Page 9 of 12
Table 2. Characteristics of included studies and effect of pre-transplant obesity on death-censored cadaveric graft survival
Reference
No. obese patients
No. controls Patients BMI (kg/m2) Control BMI (kg/m
2) Death-censored graft survival (%)
[obese vs non-obese]
Holley et al 1990 [1] 46 50 >30 <27 men <25 women 66 vs 84 (P = 0.05) at 1 year
Merion et al 1991 [16] 40 223 >120% IW <120% IW 65 vs 72 (P = NS) at 3 years
Gill et al 1993 [17] 85 85 >30 <27 42 vs 66 (P = 0.02) at 5 years
Pfeiffer et al 1994 [18] 51 283 >120% BI <120% BI 82 vs 91 (P < 0.05) at 1 year
Halme et al 1995 [19] 47 235 >30 20-25 25 vs 53 (P < 0.05) at 1 year
Pirsch et al 1995 [20] 59 466 >30 <27.5 72 vs 85 (P < 0.01) at 5 years
Drafts et al 1997 [21] 75 333 >30 <30 Numbers not given (P = NS) at 7 years Wound infections and DGF more common
Orofino et al 1997 [22] 115 447 >25 20-25 78 vs 78 (P = NS) at 1 year, 67 vs 65 (P=NS) at 5 years
Meier-Kriesche et al 1999 [23]
165 240 >25 <25 72 vs 88 (P = 0.002) at 7 years
Johnson et al 2002 [7] 59 434 >30 <30 92 vs 91 (P = 0.82) at 5 years
Yamamoto et al 2002 [11] 28 28 >30 <30 92 vs 92 (P = 0.7) at 1 year, 67 vs 89 (P = 0.05) at 5 years 64 vs 89 (P = 0.03) at 7 years
Howard et al 2002 [10] 98 457 >35 <25 85 vs 85 (P > 0.1) at 2 years
BI = Broca Index; BMI = body mass index; IW = ideal weight; NS = not significant; Reproduced from Armstrong et al 2005 [15]

_________________________________________________________________________________________________________________________________________________________________________________________
Recipient Assessment for Transplantation March 2013 Page 10 of 12
Table 3. Characteristics additional studies Reference
No. obese patients
No. controls
Patients BMI (kg/m
2)
Control BMI (kg/m2) Results
[obese vs non-obese]
Modlin et al 1997 [9] 127 127 >30 <27 Patient survival 67% vs. 89% at 5 years P=0.0002
Marks et al 2004 [24] 23 224 >35 25 75% v 90% 3 years NS cadaveric
Massarweh et al 2005 USA. [25]
56 137 >=30 <30 Individuals with a BMI > or =30 were not more likely to experience graft loss (O.R. 0.93, 95%)
Gore et al 2006. [4] 27,377 Stratified Death with functioning graft (univariates) >30 1.32 (1.16–1.49) P<0.001 1.19 (1.11–1.28) P<0.001 Overall graft failure >35 1.30 (1.09–1.55) P 0.004 1.38 (1.26–1.52) P<0.001
Pelletier et al 2003.[29] >30 >35
>30 on dialysis but waitlisted >35 but waitlisted
RR of death 0.48 RR of death 0.54
Glanton et al 2003. [28] 7521 wait-listed 458
>=30 >41
mortality was 3.3 per 100 pt years for cadaveric transplants and 1.9 per 100 pt years for live donor transplants versus 6.6 per 100 pt years if the patient remained on dialysis No advantage
Aalten et al 2006. [6] 196 1871 >=30 <30 1 and 5 year patient survival were respectively 94% vs. 97% and 81% vs. 89%, P < 0.01 1 and 5 year graft survival were respectively 86% vs. 92% and 71% vs. 80%, P < 0.01
Chang et al 2007. [5] 5684 Stratified adjusted hazard ratio [HR] for graft loss: 1.10 [0.94-1.259], P=0.25; for patient death: 1.02 [0.83-1.25], P=0.87
Espejo et al 2003. [12] 40 40 >30 <30 DGF 30% v 5%
Marcen et al 2007. [13] 65
255 617
>30
25-30 18.5-25
DGF 56% v 28.1% (P<.004) Wound complications 12.3% v 6.7% (P<.003) 1yr graft survival 81% v 82% 5 yr graft survival 69% v 76% 1 and 5 yr patient survival – no difference
Cacciola et al 2008. [14] 90 30-34.9 24 >35 1yr graft survival 98.9% v 75% 5 yr graft survival 94.5% v 63% 1yr patient survival 98.9% v 87.5% 5 yr patient survival 95.6% v 79.2%
________________________________________________________________________________________________________________________
Recipient Assessment for Transplantation March 2013 Page 11 of 12
Figure 1. Graph showing relationship between BMI and relative risk for graft loss. Reprinted with permission from Wolters Kluwer Health. Meier-Kriesche H-U, Arndorfer JA, Kaplan B. The impact of body mass index on renal transplant outcomes: a significant independent risk factor for graft failure and patient death. Transplantation 2002; 73 (1): 70-4.

________________________________________________________________________________________________________________________
Recipient Assessment for Transplantation March 2013 Page 12 of 12
Figure 2. Graft survival following renal transplantation stratified by recipient BMI at the time of transplantation. Reprinted with permission from John Wiley and Sons. Gore JL, Pham PT, Danovitch GM et al. Obesity and outcome following renal transplantation. Am J Transplant 2006; 6: 357-63.


![Kidney Transplantation (Renal Transplantation) Auto Saved]](https://static.fdocuments.in/doc/165x107/577d22b31a28ab4e1e9807d7/kidney-transplantation-renal-transplantation-auto-saved.jpg)