Obesity, Dietary Choices, and their Sociocultural...
353
1 Obesity, Dietary Choices, and their Sociocultural Influences among Fijian Adolescents By Jillian Tutuo Wate, BS Food & Nutr. Sc, MS Nutr. Sc Submitted in fulfilment of the requirements for the degree of Doctor of Philosophy Deakin University November 2014
Transcript of Obesity, Dietary Choices, and their Sociocultural...
1
Obesity, Dietary Choices, and their Sociocultural Influences among Fijian Adolescents
By
Jillian Tutuo Wate, BS Food & Nutr. Sc, MS Nutr. Sc
Submitted in fulfilment of the requirements for the degree of
Doctor of Philosophy
Deakin University
November 2014

sfol
Retracted Stamp

sfol
Retracted Stamp

iv
Acknowledgments
‘I do not pray for success, but I pray for faithfulness’—Mother Teresa
The above quotation has been my inspiration throughout my PhD journey in the last
three years and four months; prayerfully being faithful in all my work. The journey
could not have been bearable without the invaluable support and direction from a
group of amazingly intelligent individuals, who have been always on my side
throughout all the stages of this PhD, including the writing of this thesis. Professor
Boyd Swinburn, Dr Wendy Snowdon, Dr Helen Mavoa and Dr Melanie Nichols,
thank you very much for your wisdom, knowledge and guidance that has enabled me
to become a confident and independent researcher. Your attributes of patience,
kindness, understanding and being approachable really facilitate the quality of this
work. You all are the best supervisors any student could have. Thank you all for
having faith in me in completing this PhD journey.
Many thanks go to the College of Medicine, Nursing and Health Sciences, Fiji
National University and Deakin University, who through their collaboration provided
funding for this PhD. Special thanks go to Mrs Ateca Kama and Mr Ramneek
Goundar, my local advisors, for their support and advice on cultural interpretations
for the findings of this thesis; a role vital for its completion.
I would also like to acknowledge the staff of the Pacific Research Centre for
Prevention of Obesity and Non-communicable Diseases (C-POND), namely Mrs
Gade Waqa, Miss Susana Lolohea, Mrs Astika Prasad, Miss Arti Pillay and Miss
Arleen Suhuku, for their support, whether it be just having a meal together or sharing
ideas. You all have made my time in Fiji a well-deserved one.
A final thanks to my family. My spouse, Garnet, and my two daughters, Patisha Del
and Alahana Faith, thank you for your continuous support. Your presence inspired
me to carry on despite ups and downs of the study, my full schedule and stressful
days. Finally, to all the adolescents in Fiji who are faced with the challenge of
obesity, and other pacific researchers in this area, I dedicate this thesis to you.
v
Author’s Notes
Conference Presentations arising from this thesis:
Sociocultural factors affecting dietary change of adolescents in Fiji:
understanding influences. Paper presented at Future Challenges, Ancient
Solution: What we can learn from the past about managing the future in the
Pacific; University of South Pacific; 2010 Nov 29–Dec 3.
Adolescents’ dietary pattern and relationship with weight status in Fiji. Paper
presented at Pasifika Medical Association Conference; Sofitel Hotel, Nadi;
2011 Aug18–20.
Socio-cultural influences on ‘outside-home’ eating patterns for adolescents in
Fiji. Paper presented at Pacific Islands Health Research Symposium; Tanoa
Hotel, Nadi; 2012 Sep 6–9.
Adolescents’ dietary patterns in Fiji and relationship with standardized BMI.
Paper presented at Australia and New Zealand Obesity Scientific (ANZOS)
Meeting; Rendezvous Hotel, Auckland; 2012 Oct 18–20.
Publications arising from this thesis:
Wate JT, Snowdon W, Millar L, Nichols M, Mavoa H, Goundar R, Kama A
Swinburn B. Adolescent dietary patterns in Fiji and their relationships with
standardized body mass index. Int J Behav Nutr Phys Act. 2013;10(45):1–12.
vi
Contents
Student Declaration ii
Acknowledgments iv
Author’s Notes v
List of Tables x
List of Figures xvi
List of Abbreviations xviii
Glossary xx
Abstract xxi
CHAPTER ONE 2
Introduction 2 1.1 Research questions 4 1.2 Outline of thesis 5
CHAPTER 2 7
Literature Review—Part One 7 2.1 Obesity: definition, prevalence, aetiology and health implications 7
2.1.1 Defining obesity 7 2.1.2 BMI and body fat composition 8 2.1.3 Obesity prevalence 9 2.1.4 Determinants of obesity 13
2.1.4.1 Energy intake 16 2.1.4.2 Energy expenditure 20 2.1.4.3 Genetics 21
2.1.5 Obesity and health implications 22 2.2 Why target adolescents? 23 2.3 Environmental influences on obesity 24 2.4 Diets in Fiji: historical and current trends 27
CHAPTER 3 33
Literature Review—Part Two 33 3.1 Sociocultural factors influencing dietary patterns 33 3.2 Definition of culture 34 3.3 Social structure (rank and status) 36 3.4 Values 36 3.5 Beliefs 39 3.6 Attitudes 40 3.7 Fiji—geography 41
3.7.1 Population 42 3.7.2 Economic situation 42
3.8 Food and eating patterns in a cultural context 43 3.8.1 Sociocultural influences and dietary practices among Indigenous
Fijians 44
vii
3.8.2 Sociocultural Influences and dietary practices among IndoFijians 45 3.9 Body size perception 46
CHAPTER 4 49
Theoretical Frameworks, Concepts and General Methods 49 4.1 Theoretical framework and concepts 49
4.1.1 Socioecological framework (SEF) 49 4.1.2 Behavioural change theories 53
4.2 Social marketing 57 4.2.1 Exchange theory 60
4.3 General context and methods 61 4.3.1 Pacific OPIC study 61 4.3.2 HYHC baseline 63 4.3.3 HYHC intervention and follow-up 66 4.3.4 HYHC outcomes 67
4.4 Method of inquiry 70
CHAPTER 5 71
Study One 71 5.1 Background 71 5.2 Methods 72
5.2.1 Study design 72 5.2.2 Participants 73 5.2.3 Measures 73
5.2.3.1 Sociodemographic characteristics 73 5.2.3.2 Anthropometry 73 5.2.3.3 Dietary variables 73
5.2.4 Analysis 75 5.3 Results 76
5.3.1 Dietary patterns of adolescents and relationships with BMI-z 80 5.3.1.1 Meal frequency: breakfast, morning snacks and lunch 81 5.3.1.2 Fruit and vegetable consumption 90 5.3.1.3 SSB consumption 94 5.3.1.4 Consumption of takeaway (in general) and takeaway for dinner 94 5.3.1.5 After school high fat/salt snacks consumption 94 5.3.1.6 Fried food consumption 99 5.3.1.7 Consumption of confectionery 99
5.3.2 Summary of descriptive dietary patterns: overall, ethnicity and sex—an overview of key obesogenic dietary variables 99
5.3.3 Summary of dietary patterns and relationships with BMI-z 100 5.3.4 Dietary patterns and relationship with weight status: overall and
ethnicity 107 5.3.5 Dietary patterns and relationship with weight status: sex sub-group 108 5.3.6 Dietary patterns and associations with weight status: overall, ethnicity
and sex—an overview of key obesogenic dietary variables 113 5.4 Stratification by weight control attempts 116
5.4.1 Associations between weight status and dietary variables stratified by weight control attempts 116
viii
5.4.2 Association between weight status (BMI-z) and dietary patterns stratified by weight control attempts for overall 122
5.4.3 Associations between BMI and BMI-z and dietary patterns stratified by weight control attempt and ethnicity and sex 122
5.5 Discussion 128 5.5.1 Meal frequency 129 5.5.2 Fruit and vegetable consumption 129 5.5.3 SSB consumption 130 5.5.4 Takeaway behaviours 131 5.5.5 Takeaway for dinner 131 5.5.6 Consumption of snacks after school 131 5.5.7 Fried food consumption 132 5.5.8 Consumption of confectionery 132 5.5.9 Strengths and limitations of this study 133 5.5.10 Conclusion and implications 134
CHAPTER 6 136
Study Two 136 6.1 Background 136 6.2 Methods 138
6.2.1 Design 138 6.2.2 Sample 138 6.2.3 Measures 138 6.2.4 Analysis 143
6.3 Results 144 6.3.1 Population characteristics 144 6.3.2 Changes in dietary behaviour 150 6.3.3 Individual-level variables and prediction of change for each diet
variable 159 6.3.4 Individual-level variables and prediction of change for each diet
variable by ethnicity and sex 171 6.3.5 What changes in diet variables explained changes in BMI-z over two
years? 195 6.4 Discussion 201
6.4.1 Strength and Limitation 203 6.4.2 Conclusion and implications 204
CHAPTER 7 206
Study Three 206 7.1 Background 206
7.1.1 Aim 207 7.2 Methods 207
7.2.1 Study design 207 7.2.1.1 Data collection 208
7.3 Analysis 209 7.4 Results 210
7.4.1 Characteristics of participants 210 7.4.2 Reported influences on adolescents’ outside home eating patterns 210
7.4.2.1 Morning snacks and on the way home from school (after school)210
ix
7.4.2.2 Lunch food and drinks 212 7.4.2.3 Reported sociocultural influences on outside home and at home
food and drinks consumption 213 7.4.2.4 Reported sociocultural influences from family members 213 7.4.2.5 Religious beliefs and activities 216 7.4.2.6 Other influences 217
7.4.3 Perceived control over food 217 7.5 Discussion 217
7.5.1 Strengths and limitations 220
CHAPTER 8 222
Study Four 222 8.1 Background information 222
8.1.1 Aim 223 8.2 Method 223
8.2.1 Study design 223 8.2.1.1 Recruitment and data collection 225
8.2.2 Analysis 228 8.3 Results 230
8.3.1 Characteristics of participants 230 8.3.2 Dietary patterns 230
8.3.2.1 SSB consumption 230 8.3.3 Fruit and vegetable consumption 236 8.3.4 Meal frequency 242
8.3.4.1 Frequency of breakfast consumption 242 8.3.4.2 Frequency of lunch consumption 246 8.3.4.3 Perceived down-sides for regular lunch consumption 248
8.3.5 Weight loss strategies - Females only 250 8.4 Discussion 253
8.4.1 Strengths and limitations 262 8.4.2 Conclusions and implications 262
CHAPTER 9 263
Overall Discussion and Implications 263 9.1 Overall discussion and conclusions 263 9.2 Strengths, limitations and direction for future research 268 9.3 Implications 270
References 272
Appendix A: Baseline Questionnaire 302
Appendix B.1: Girls’ Focus Group Schedule 315
Appendix B.2: Boys Focus Group Schedule 319
Appendix C: Plain Language Statement For Participants 323
Appendix D: Plain Language Statement For Parents Or Guardians 326
Appendix E: Consent Form 330
Appendix F: Assent Form For Participants 331
x
List of Tables
Table 2.1: Changes in food and diet in Fiji: 1850s to present 31
Table 3.1: Process of valuing by Raths (171) 38
Table 3.2 Andreas’ (172) questions to clarify value 38
Table 4.1: OPIC or HYHC and OPIC sociocultural data sources 65
Table 4.2: HYHC intervention action plan— food-related objectives 66
Table 5.1: Dichotomised diet variables 75
Table 5.2: Descriptive characteristics of participants 78
Table 5.3: Unadjusted frequency (%) for diet-related behaviours by sex and
ethnicity (higher frequency indicates more obesogenic dietary
behaviour pattern) 82
Table 5.4: Adjusteda ß coefficients and p-values for the association between
healthy dietary variables and BMI-z for overall and ethnicity 95
Table 5.5: Adjusteda ß coefficients and p values for the association between
healthy dietary variables and BMI-z by sex 97
Table 5.6: Overview table for descriptive dietary patterns by overall, ethnicity
and sex 101
Table 5.7: Overview table for descriptive obesogenic dietary patterns by sex
within ethnic groups 103
Table 5.8: Overview table for the association of dietary patterns and BMI-z for
overall, ethnicity and sex 105
Table 5.9: Adjusted a odds ratios of overweight adolescents having healthy
dietary patterns compared to non-overweight adolescents: overall and
ethnicity 109
Table 5.10: Adjusted a odds ratios of overweight adolescents having healthy
dietary patterns compared to non-overweight adolescents: sex sub-
group 111
Table 5.11: Overview table for the association of dietary patterns and weight
status: overall, ethnicity and sex 114
Table 5.12: Descriptive characteristics of study population by weight attempts:
overall, ethnicity and sex 118
xi
Table 5.13: Descriptive dietary characteristics of study population stratified by
weight control attempts 119
Table 5.14: Descriptive characteristics of study population by mean BMI and
BMI-z stratified by weight control attempts 120
Table 5.15: Association between BMI and BMI-z and dietary patterns stratified
by weight control attempts 121
Table 5.16: Associations between BMI and dietary patterns stratified by weight
control attempts by ethnicity 124
Table 5.17: Associations between BMI-z and dietary patterns stratified by weight
control attempts by ethnicity 125
Table 5.18: Associations between BMI and dietary patterns stratified by weight
control attempt by sex 126
Table 5.19: Association between BMI-z and dietary patterns stratified by weight
control attempt by sex 127
Table 6.1: Dichotomised dietary behaviours for study two 140
Table 6.2: Dichotomised Individual-level variables 142
Table 6.3: Descriptive characteristics of participants at baseline and follow-up by
ethnicity 146
Table 6.4: Descriptive characteristics of participants at baseline and follow-up by
sex 148
Table 6.5: Baseline characteristics of participants ‘lost’ to follow-up 149
Table 6.6: Predictors of improved consumption of breakfast at follow-up versus
no change for total population 162
Table 6.7: Predictors of worsened consumption of breakfast versus no change at
follow-up for total population 162
Table 6.8: Predictors of improved consumption of morning snacks versus no
change at follow-up for total population 163
Table 6.9: Predictors of worsened consumption of morning snacks versus no
change at follow-up for total population 163
Table 6.10: Predictors of improved consumption of lunch versus no change at
follow-up for total population 164
Table 6.11: Predictors of worsened consumption of lunch at follow-up versus no
change for total population 164
xii
Table 6.12: Predictors of improved lunch source ‘from home’ versus no change
at follow-up for total population 165
Table 6.13: Predictors of worsened lunch source ‘from home’ versus no change
at follow-up for total population 165
Table 6.14: Predictors of improved fruit and vegetable consumption versus no
change at follow-up for total population 166
Table 6.15: Predictors of worsened fruit and vegetable consumption versus no
change at follow-up for total population 166
Table 6.16: Predictors of improved SSB consumption versus no change at
follow-up for total population 167
Table 6.17: Predictors of worsened SSB consumption versus no change at
follow-up for total population 167
Table 6.18: Predictors of improved high fat/salt snack consumption (decreased)
versus no change at follow-up for total population 168
Table 6.19: Predictors of worsened high fat/salt snack consumption (increased)
versus no change at follow-up for total population 168
Table 6.20: Predictors of improved (decreased) consumption of fried food versus
no change at follow-up for total population 169
Table 6.21: Predictors of worsened (increased) consumption of fried food versus
no change at follow-up for total population 169
Table 6.22: Predictors of improved (decreased) in consumption of confectionery
versus no change at follow-up for total population 170
Table 6.23: Predictors of worsened (increased) in consumption of confectionery
versus no change at follow-up for total population 170
Table 6.24: Predictors of improved consumption of breakfast versus no change at
follow-up by ethnicity and sex 177
Table 6.25: Predictors of worsened consumption of breakfast versus no change at
follow-up by ethnicity and sex 178
Table 6.26: Predictors of improved consumption of morning snack versus no
change at follow-up by ethnicity and sex 179
Table 6.27: Predictors of worsened consumption of morning snack versus no
change at follow-up by ethnicity and sex 180
xiii
Table 6.28: Predictors of improved consumption of lunch versus no change at
follow-up by ethnicity and sex 181
Table 6.29: Predictors of worsened consumption of lunch versus no change at
follow-up by ethnicity and sex 182
Table 6.30: Predictors of improved lunch source ‘from home’ versus no change
at follow-up by ethnicity and sex 183
Table 6.31: Predictors of worsened lunch source ‘from home’ versus no change
at follow-up by ethnicity and sex 184
Table 6.32: Predictors of improved fruit/vegetables consumption versus no
change at follow-up by ethnicity and sex 185
Table 6.33: Predictors of worsened fruit/vegetables consumption versus no
change at follow-up by ethnicity and sex 186
Table 6.34: Predictors of improved SSB consumption versus no change at
follow-up by ethnicity and sex 187
Table 6.35: Predictors of worsened SSB consumption versus no change at
follow-up by ethnicity and sex 188
Table 6.36: Predictors of improved high fat/salt snack consumption (decreased)
versus no change at follow-up by ethnicity and gender 189
Table 6.37: Predictors of worsened high fat/salt snack consumption (increased)
versus no change at follow-up by ethnicity and gender 190
Table 6.38: Predictors of improved consumption of fried food versus no change
at follow-up by ethnicity and sex 191
Table 6.39: Predictors of ‘worsened’ consumption of fried food versus no change
at follow-up by ethnicity and sex 192
Table 6.40: Predictors of improved consumption of confectionery versus no
change at follow-up by ethnicity and sex 193
Table 6.41: Predictors of ‘worsened’ consumption of confectionery versus no
change at follow-up by ethnicity and sex 194
Table 6.42: Dietary predictors of change in BMI-z for improved dietary variables
versus no change at follow-up for total population 195
Table 6.43: Dietary predictors of change in BMI-z for worsened dietary variables
versus no change at follow-up for total population 196
xiv
Table 6.44: Dietary predictors of change in BMI-z for improved dietary variables
versus no change at follow-up for ethnic groups 197
Table 6.45: Dietary predictors of change in BMI-z for worsened dietary variables
versus no change at follow-up for ethnic groups 198
Table 6.46: Dietary predictors of change in BMI-z for improved dietary variables
versus no change at follow-up for gender sub-groups 199
Table 6.47: Dietary predictors of change in BMI-z for worsened dietary variables
versus no change at follow-up for sex sub-groups 200
Table 7.1: Key questions used to explore adolescents’ outside home eating
patterns in the OPIC Sociocultural interviews 209
Table 7.2: Characteristics of participants for the sociocultural interviews 210
Table 7.3: Emerging themes on sociocultural explanation(s) of adolescents’
dietary patterns outside home (relating to the socioecological model) 219
Table 8.1: Characteristics of adolescents by ethnicity, sex and age 230
Table 8.2: Most common perceived benefits of and barriers to water
consumption at school 232
Table 8.3: Most common perceived barriers to water consumption on the way
home from school 234
Table 8.4: Suggested messages to encourage adolescents to drink water 235
Table 8.5: Motivators to encourage drinking water among adolescents 236
Table 8.6: Most common perceived benefits of and barriers to fruit and vegetable
consumption at school 237
Table 8.7: Most common perceived barriers to fruit and vegetable consumption
on the way home 239
Table 8.8: Suggested message to encourage consumption of fruit and vegetables
for adolescents 240
Table 8.9: Motivators to encourage consumption of fruit and vegetables for
adolescents 241
Table 8.10: Most common perceived benefits of and barriers to regular breakfast
consumption 243
Table 8.11: Suggested messages to encourage regular breakfast among
adolescents 244
Table 8.12: Motivators for regular breakfast consumption among adolescents 246
xv
Table 8.13: Most common perceived benefits of and barriers to regular lunch
consumption 247
Table 8.14: Suggested messages to encourage adolescents to consume regular
lunch 249
Table 8.15: Motivators for regular lunch consumption 250
Table 8.16: Most common barriers to eating less fried food, salty snacks and
sweets 251
Table 8.17: Messages to encourage less consumption of fried foods, salty snacks
and sweets 252
Table 8.18: Identified motivators for less consumption of fried food, salty snacks
and sweets 253
xvi
List of Figures
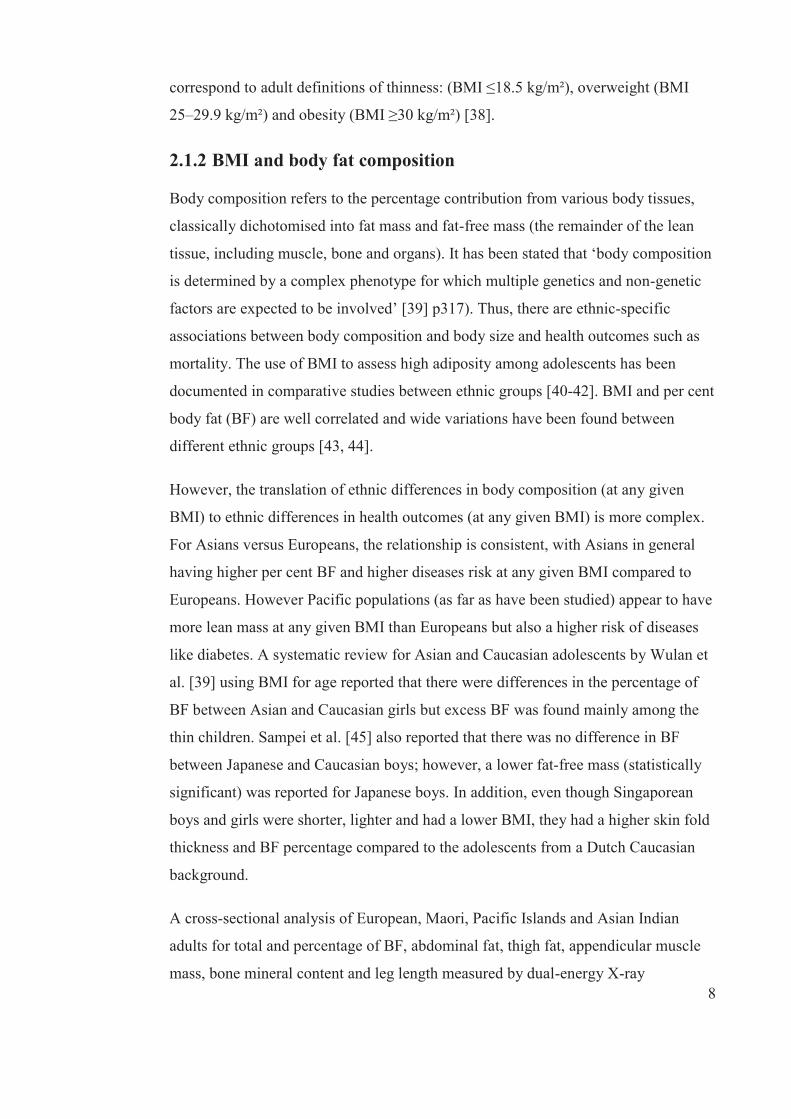
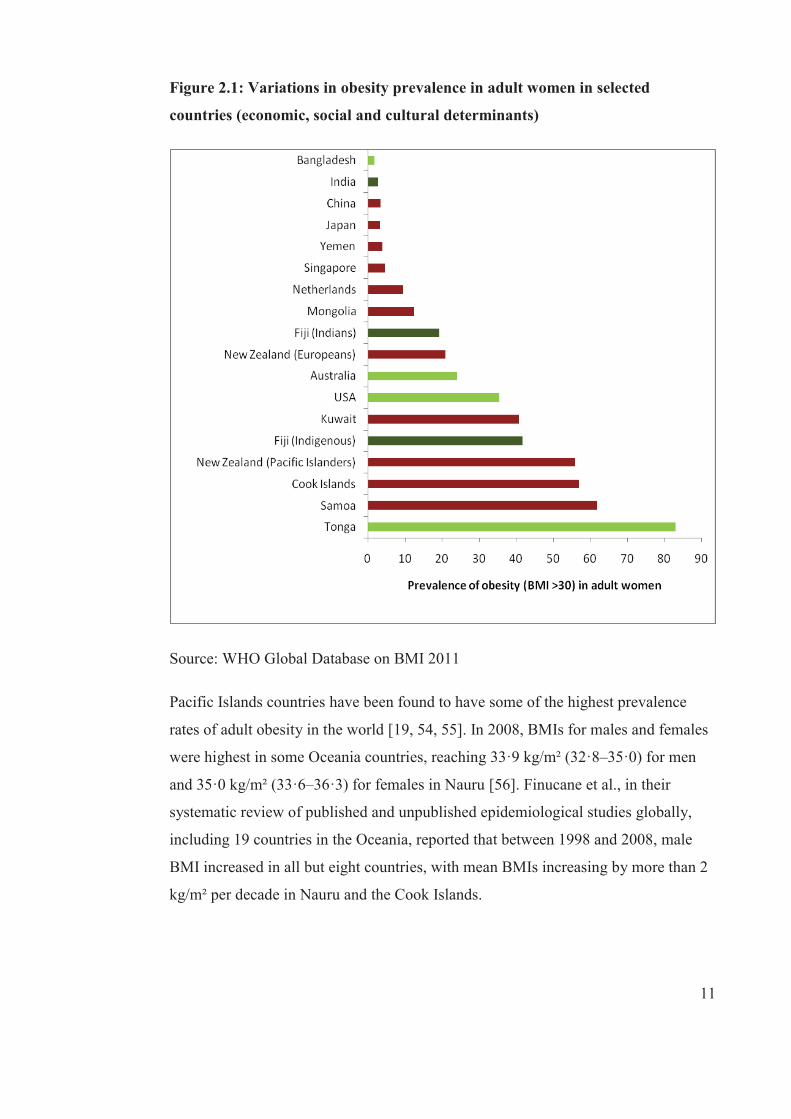
Figure 2.1: Variations in obesity prevalence in adult women in selected countries
(economic, social and cultural determinants) 11
Figure 2.2: Trend of overweight and obesity in Fiji 12
Figure 2.3: Determinants of obesity 14
Figure 3.1: Map of Fiji 41
Figure 4.1: Socioecological framework 52
Figure 4.2: The health belief model 55
Figure 4.3: Spiral model of the stages of behaviour change 56
Figure 4.4: Overall design of the Pacific OPIC Model 62
Figure 4.5: Logic Model for Pacific OPIC Intervention 63
Figure 5.1: BMI-z score distribution by ethnicity 80
Figure 5.2: Summary of dietary patterns of adolescents— percentage of all
adolescents with less healthier dietary behaviours 88
Figure 5.3: Total sample: adjusted BMI-z ß coefficients for the association
between selected less healthier dietary variables and BMI-z 91
Figure 5.4: By ethnicity: adjusted BMI-z ß coefficients for the association
between selected less healthier dietary variables and BMI-z 92
Figure 5.5: By sex: adjusted BMI-z ß coefficients for the association between
selected less healthier dietary variables and BMI-z 93
Figure 5.6: Association between BMI-z and dietary patterns after school
stratified by weight control attempts in the total sample 122
Figure 6.1: Flow diagram showing analyses approach for study two 143
Figure 6.2: Proportion of students changing frequency of breakfast consumption
from baseline to follow-up, overall and by ethnicity and sex 150
Figure 6.3: Proportion of students changing frequency of morning snacks
consumption from baseline to follow-up, overall and by ethnicity and
sex 151
Figure 6.4: Proportion of students changing frequency of lunch consumption
from baseline to follow-up, overall and by ethnicity and sex 152
Figure 6.5: Proportion of students changing source of lunch from baseline to
follow-up, overall and by ethnicity and sex 153
xvii
Figure 6.6: Proportion of students changing fruit and vegetable consumption
from baseline to follow-up, overall and by ethnicity and sex 154
Figure 6.7: Proportion of students changing SSB patterns from baseline to
follow-up, overall and by ethnicity and sex 155
Figure 6.8: Proportion of students changing high fat/salt snacks consumption
from baseline to follow-up, overall and by ethnicity and sex 156
Figure 6.9: Proportion of students changing fried food patterns after school from
baseline to follow-up, overall and by ethnicity and sex 157
Figure 6.10: Proportion of students changing confectionery consumption patterns
after school from baseline to follow-up, overall and by ethnicity and
sex 158
Figure 8.1: Study four recruitment process 227
xviii
List of Abbreviations
BF Body Fat
BMI Body Mass Index
BMI-z Standardised Body Mass Index
FBOs Faith-based Organisations
HBM Health Belief Model
HYHC SC Healthy Youth Healthy Communities Sociocultural
HYHC Healthy Youth Healthy Community
IDFF IndoFijian Female
IDFM IndoFijian Male
INDFF Indigenous Fijian Female
INDFM Indigenous Fijian Male
IOTF International Taskforce for Obesity
KAB Knowledge, Attitude and Behaviour
NCDs Non-communicable Diseases
NNS National Nutrition Survey
OPIC Obesity Prevention in Community
PAEE Physical Activity Energy Expenditure
PDAs Personal Digital Assistants
SEF Socioecological Framework
TEE Total Energy Expenditure

xix
TEF Thermal Effect of Food
TTM Transtheoretical Model
UN United Nations
WHO World Health Organization

xx
Glossary
Bean carts: carts containing Indian sweets and snacks. Bean carts are often situated
near school compounds in order to sell snacks and SSB to students.
Energy density: energy content in a given weight of a food (kcal/g or kJ/g).
Snacks: includes food items such as sweets and salty foods.
Spending: refers to extra money that households provide for children on a school
day in addition to bus fare and lunch money.
Sugar sweetened beverages (SSB): include fruit drinks and soft drinks, excluding
diet drinks.
Tarumba: a SSB locally made and distributed in Fiji.
xxi
Abstract
Obesity contributes to early deaths from non-communicable diseases in all Pacific
Islands populations. Fiji is no exception; these problems start at an early age and the
prevalence of overweight and obesity has tripled since 1993 in both ethnic groups to
different extents. There is a greater need for better understanding of dietary patterns
and relationships with body weight in adolescents, and their sociocultural influences,
in order to identify effective and appropriate messages and messengers to motivate
adolescents to improve their diets.
This thesis aims to: (1) identify important dietary patterns of adolescents in peri-
urban Fiji and their relationship with standardised Body Mass Index (BMI-z), (2)
determine changes in dietary patterns and BMI-z longitudinally, (3) examine
sociocultural influences on adolescents’ ‘outside home’ food-purchasing and
consumption patterns in Fiji, and (4) identify messages and motivators to encourage
adolescents to change to a healthier dietary pattern.
Study one utilised baseline measurements from the Pacific OPIC (Obesity Prevention
In Communities) project. Participants (6,871 students) aged 13 to 18 years from 18
secondary schools completed a questionnaire that included diet-related variables;
height and weight were measured. These data were analysed for participants’
characteristics and associations between dietary patterns and BMI-z. study one found
over 20% prevalence of overweight and obesity in the study population, although this
varied by ethnicity and sex. Eating patterns were found to be obesogenic and
reflected in frequent consumption of sugar-sweetened beverages (SSB) and low
intake of fruit and vegetables, and irregular meals (breakfast, morning snacks and
lunch) consumption on school days. IndoFijians were generally more likely than
Indigenous Fijians to have healthy dietary patterns. Significantly, this study also
found that regular meal consumption was significantly associated with a lower BMI-
z, while the consumption of high fat or salty snacks, fried foods and confectionery
was lower among participants with a higher BMI-z.
xxii
To further investigate changes in dietary patterns and BMI-z, an analysis of
longitudinal data from the OPIC project was conducted for participants’
characteristics, prioritised obesogenic dietary behaviours and predictors of change in
dietary behaviours and BMI-z (study two) in 18 secondary schools on the island of
Viti Levu, Fiji. The response rate at follow-up was 32.7% and 45.1% for intervention
and comparative schools, respectively. Among the 2,781 students in combined
intervention and comparison schools, no changes were found for weight status and
dietary patterns, although few behavioural changes were noted for certain diet
variables. Similar findings were also found for ethnicity and sex. Significantly,
individual-level variables such as older age, higher weight status, and trying to lose
weight were associated with higher odds of improving lunch and breakfast (only
those trying to lose weight). Higher BMI-z and weight status (being overweight and
obese) were associated with lower odds of improving high fat/salt consumption.
Participants who ‘strongly agreed/agreed that ‘sugar content of SSB is less than non-
diet drinks’, were more likely to improve SSB consumption. In addition, those who
‘strongly agreed/agreed that ‘skipping breakfast or lunch was a good way to lose
weight’ had lower odds of increasing or decreasing breakfast and lunch consumption.
Those who had access to spending money had the lower odds of improving SSB
consumption but more likely to worsen in fried food and confectionary consumption.
Findings varied by ethnicity and sex subgroups.
Further, the study did show not significant changes in BMI-z for most dietary
predictors (overall), except improved or worsened high fat/salt snack, and worsened
morning snack. Also, worsened high fat/salt snack consumption also predicted
changes in BMI-z (-0.07, p<0.05) for Indigenous Fijians and IndoFijians (-0.23,
p<0.05) and females (-0.24, p<0.05).
Study three aimed to identify sociocultural influences of ‘outside home’ food-
purchasing and consumption behaviours of adolescents as it sought to identify
explanatory values to the findings of previous studies. This involved semi-structured
interviews with 48 Indigenous Fijians and 48 IndoFijian adolescents (24 males and
24 females per group) recruited from schools participating in the ‘Healthy Youth,
Healthy Community’ project (the Fijian arm of OPIC). Results showed that recess
food and drinks were influenced by breakfast consumption, access to spending
xxiii
money and canteen provisions. More Indigenous Fijians purchased lunch from
school canteens than IndoFijians, who generally brought lunch from home.
IndoFijians’ mothers prepared lunches while Indigenous Fijian females prepared
their own. Peers influenced outside home food by sharing food and money. Females
were more likely to share food at school because they sat around in groups while
males played or went to prayer meetings. Further, it was found that the availability of
spending money and peers influenced food and drinks adolescents consumed on the
way home from school. More IndoFijians than Indigenous Fijian adolescents had
afternoon snacks prepared by their mothers at home.
Based on the findings of these three studies, a new, fourth study was conducted using
focus group discussions to examine the perceived benefits of and barriers to healthy
eating, and the types of messages and messengers among 56 adolescents. Further
exploration of weight loss strategies for girls was included. Results showed that peer
pressure, spending money, tastes, convenience of less healthful alternatives and costs
were the major barriers. These barriers to healthy eating were shared consistently
across ethnic, sex and age groups; however, some differences in prioritising the
barriers were noticed. Salient motivators for healthy eating were peers, health
workers, parents and family members, teachers, favourite models and national sport
icons. The need for targeting specific influential individuals was evident. Parents, in
particular, had scope to control and monitor spending money given to adolescents.
Adolescents also relied on grandparents and cousins (for girls) to guide food choices.
Tailored messages, such that linked health benefits and prevention of diseases, costs
and some environmental benefits, could facilitate behavioural change.
The findings from these four studies showed that adolescents must be prioritised for
dietary interventions to combat the obesogenic dietary patterns and the increasing
prevalence of obesity. Sociocultural factors underpinned most dietary behaviours
among adolescents from both ethnic groups. It was apparent that social marketing
efforts should be strengthened and tailored specifically for adolescents overall,
further targeting of groups and prioritised dietary behaviours. Moreover, the broader
food environments should place more emphasis on less obesogenic food
environments. In addition, further research is needed to fill the substantial evidence
gaps that remain for this age group.
2
C H A P T E R O N E
Introduction
Obesity is a risk factor for non-communicable diseases (NCDs) such as
cardiovascular diseases, diabetes, stroke, hypertension and some forms of cancer.
NCDs accounted for 54% of global deaths, around 34.5 million people, in 2010 [1]
and the World Health Organization (WHO) has predicted that NCDs will be
responsible for 73% of deaths and 60% of the global burden of disease by 2020 [2].
In 2011, the United Nations (UN), in its meeting of the General Assembly on the
Prevention and Control of Non-communicable Diseases, declared that NCDs were a
‘crisis’ that threatened development in the 21st century worldwide and must be
addressed [3]. WHO further reported that more people with obesity were found in
low-income countries compared to high-income countries [2]. In many low-income
countries, in the midst of the increasing prevalence of obesity and NCDs, under-
nutrition and infectious diseases remain prevalent. These multiple burdens place
substantial challenges on the countries’ health systems [2, 4-6].
Obesity is the second major burden of small Pacific Island countries and territories,
which have some of the highest rates of obesity in the world [7-10] alongside high
rates of NCDs [10, 11]. The most recent surveys indicate that 60%-80% of the adult
population in Tonga, Samoa and Nauru are obese, however there is wide variations;
Papua New Guinea experiences rates as low as 2% in its highlands [12, 13]. There is
also evidence of increasing rates of obesity among children and adolescents in the
region [14, 15].
In Fiji, the second largest Pacific Island country, obesity is becoming a problem [16].
In 2002, 29% of Fiji’s population aged 15 to 64 years were overweight (Body Mass
Index [BMI] 25–29.9kg/m²) and 18% were obese (BMI ≥30 kg/m²) [16]. Obesity is
also a growing concern among children and adolescents in Fiji, with marked ethnic
and sex differences observed. The latest Fiji National Nutrition Survey (NNS) 2004
reported that 11% Indigenous Fijian males and 21.9% females in the age group 10 to
17 years were overweight/obese, compared to 13% IndoFijian males and 10.2%
IndoFijian females [17]. Moreover, an increasing trend towards overweight/obesity
3
was observed over a decade, with overweight/obesity tripling in both ethnic groups
since 1993 [17, 18], while doubling in children from less than 10% in the early 1990s
to 20% in 2001 [19].
It has been suggested that the growing trend of overweight and obesity is due to
considerable lifestyle changes, including a ‘nutrition transition’ that has occurred and
that is linked with globalisation and environmental and social changes [20, 21].
Fijians have shifted from a traditional diet based on starchy root crops, fish and local
fruit and vegetables to one that is low in fibre and high in refined carbohydrates
(particularly sugar), salt and fatty meats [22-24]. This indicates the importance of
investigating the underlying contributors to changes in dietary patterns over time and
in particular the relationship between changes in dietary patterns and obesity.
While the overall cause of obesity is the imbalance between energy intake and
expenditure, other underlying determinants exist [25, 26]. International studies have
shown environmental and social changes, including policy and socioeconomics,
contribute to an increased intake of energy-dense food and a decrease in physical
activity [27-29]. There is a need to investigate the sociocultural factors at play in
order to enhance our understanding of the roles of these factors in the development
of obesity in the region, including Fiji. While obesity affects both ethnic groups in
Fiji at all ages, its levels vary significantly. Because of this, an ethnic-specific and
age-specific focus is needed to address weight status, especially among adolescents.
There are several reasons why it is important to target adolescents. First, adolescence
is a critical growth period during which adolescents grow into their adult height and
weight, but age-related weight gain is also often excessive during this period. In the
Pacific Islands particularly there is evidence that adolescence and early adulthood is
a period when weight gain can be quite substantial [13, 16]. Second, adolescents are
quite responsive to their environment, including food environments, and during this
time they develop behaviours about food and eating [30]. Last, adolescents are a
‘captive audience’, meaning that they are readily accessible through school obesity
intervention programmes and health promotion [30].
Given these reasons, there is a need to examine sociocultural factors that might
underlie adolescents’ dietary patterns in order to understand both the nature of
4
sociocultural changes and why adolescents behave in certain ways. These reasons
also raise concerns about the factors that might motivate or enable dietary behaviour
change among adolescents. This thesis addresses this important but poorly
understood issue for Fiji. Specifically, this PhD asks: ‘How can an understanding of
dietary patterns and relationships with body weight in adolescents, and the
sociocultural influences on these, be used to guide identification of messages and
messengers that would influence their diets?’
1.1 Research questions
There are four main research questions that inform this thesis:
1. What are the dietary patterns of adolescents in peri-urban Fiji and how do
they relate to weight status BMI and standardised BMI (BMI-z)?
2. What determines changes in the dietary patterns in adolescents in peri-urban
Fiji and what changes in dietary variables explain changes in BMI-z?
3. What sociocultural factors might explain the dietary patterns in adolescents in
peri-urban Fiji?
4. What messages and messengers might motivate Fijian adolescents to change
to healthier dietary patterns?
This thesis utilises existing data from an intervention study to assess the relationship
between dietary patterns of adolescents in Fiji and weight status: body BMI and
BMI-z, both cross-sectionally and longitudinally. In addition, qualitative interviews
from the sociocultural components of this existing study are further analysed to
investigate sociocultural influences on adolescents’ diets and explanations for
adolescents’ dietary patterns, especially outside of home. Informed by the findings of
three studies, research is undertaken to explore ethnic- sex- and age-appropriate
messages (sources, mode, content, language) and messengers that might motivate
adolescents to change to healthier dietary patterns, from the perspectives of
adolescents. This fourth study provides recommendation(s) for social marketing and
health promotion programmes that aim to improve the health of adolescents’ diets in
Fiji.
5
1.2 Outline of thesis
There are nine chapters in this thesis. In the next chapter (Chapter 2), the emerging
problem of obesity in the Pacific Islands and Fiji is reviewed in more depth. A
review of evidence of its development (aetiology, prevalence and implications) in the
Pacific region, along with the influences of the social and environmental changes on
population diets, in particular adolescent diets, are discussed. The ways in which
traditional Fijian diets have changed over time are also discussed.
In Chapter 3, sociocultural factors and the relationships between diet, society and
culture are reviewed. A review of sociocultural factors, such as social structure,
values, beliefs and attitudes and their influence on dietary patterns and increasing
obesity rates, are discussed. In order to familiarise the reader with the research sites,
further information about the Fiji Islands in regards to geography, economics and
culture is provided. A further in-depth literature review of the sociocultural
influences and dietary determinants of obesity, specifically in between the two main
ethnic groups in Fiji, is presented.
In Chapter 4, the overall theories, general context and methodology for the thesis are
outlined and discussed. A critical review of models and framework is presented,
along with a critical analysis of the socioecological model as an overarching
framework for this thesis. A detailed discussion about the Pacific OPIC project, in
particular the Fijian component (Healthy Youth, Healthy Communities [HYHC]),
including its research design and outcomes, is also presented. HYHC is the source of
the data utilised for the first three studies of this thesis. A review of key methods on
quantitative and qualitative data collection and analyses is discussed.
In chapters 5 to 8, each of the four studies of this thesis are presented and discussed
in detail. In Chapter 5, a cross-sectional investigation of the dietary patterns of
adolescents in Fiji and their relationship with BMI-z and BMI is presented. Ethnic
and sex differences are explored and discussed. Chapter 6 details the longitudinal
investigation of changes in selected dietary patterns and BMI-z among the
adolescents who participated in the OPIC study. Specific aims, methods and results
are discussed. Chapter 7 presents the third study, comprising interview data relating
6
to sociocultural influences on dietary patterns outside home. Chapter 8 describes in
detail the fourth study, which uses focus groups to explore adolescents’
perspective(s) on perceived benefits of, and barriers to, messages, messengers and
motivators for healthy dietary patterns. These findings are intended to inform the
development of effective social marketing. Results and discussions are presented,
highlighting ethnic, sex and age similarities and differences. Key recommendations
for social marketing and health promotion are outlined. In the final chapter of this
thesis, overall conclusions linking each component of this thesis and important
implications are discussed. Finally, a review of strengths and limitations and
suggestions for future research is provided.
The planning and development of this thesis commenced after the completion of the
OPIC Study (2003-2009). While this study uses OPIC data, the PhD Candidate had
no involvement in the OPIC study.
7
C H A P T E R 2
Literature Review—Part One
2.1 Obesity: definition, prevalence, aetiology and health
implications
2.1.1 Defining obesity
Obesity is defined by WHO as an abnormal or excessive fat accumulation in the
body that may impair a person’s health [31]. Important health outcomes in infancy,
childhood and later in adulthood are associated with the amount and distribution of
body fat. The excess fat is indirectly assessed by BMI, calculated as weight in
kilograms divided by height in metres squared [31, 32]. BMI is the most widely used
and accepted measure for population-based screening of overweight or obesity in
adults internationally. For adults, WHO classifies BMI values between 18.5 kg/m²
and 24.9 kg/m² as normal or healthy weight, BMI values between 25 kg/m² and 29.9
kg/m² as overweight and 30 kg/m² and above as obese. A BMI of 40 kg/m² or above
denotes morbid obesity; under 18.5 kg/m² is considered underweight [33, 34].
The developing of BMI cut-offs for children and adolescents has proven difficult due
to the changes in body dimensions and composition during the growth period [35,
36], so WHO reconstructed the 1977 NCHS/WHO growth charts to construct
reference growth curves, based on percentiles and z-scores (SD), which are based on
sex-specific distribution of BMI by age, in particular for ages 5 to 19 years. For
children and adolescents, using the WHO reference distribution, the recommended
cut-offs are: overweight: >+1SD (equivalent to BMI 25 kg/m2 at 19 years), obesity:
>+ 2SD (equivalent to BMI 30 kg/m2 at 19 years), thinness: <-2SD and severe
thinness: <-3SD [35, 36]. At 19 years, the new BMI values at + 1 SD are 25.4kg/m²
for boys and 25.0 kg/m² for girls and + 2 SD value 29.7 kg/m² for both sexes. This
closely compares with the adult cut-off points for overweight (25 kg/m²) and obesity
(30.0 kg/m²) [37]. The International Obesity Task Force (IOTF) has also developed a
set of definitions for overweight and obesity in children and adolescents based on the
back-extrapolation of the BMI for age centiles from cut-offs points at age 19, which
8
correspond to adult definitions of thinness: (BMI ≤18.5 kg/m²), overweight (BMI
25–29.9 kg/m²) and obesity (BMI ≥30 kg/m²) [38].
2.1.2 BMI and body fat composition
Body composition refers to the percentage contribution from various body tissues,
classically dichotomised into fat mass and fat-free mass (the remainder of the lean
tissue, including muscle, bone and organs). It has been stated that ‘body composition
is determined by a complex phenotype for which multiple genetics and non-genetic
factors are expected to be involved’ [39] p317). Thus, there are ethnic-specific
associations between body composition and body size and health outcomes such as
mortality. The use of BMI to assess high adiposity among adolescents has been
documented in comparative studies between ethnic groups [40-42]. BMI and per cent
body fat (BF) are well correlated and wide variations have been found between
different ethnic groups [43, 44].
However, the translation of ethnic differences in body composition (at any given
BMI) to ethnic differences in health outcomes (at any given BMI) is more complex.
For Asians versus Europeans, the relationship is consistent, with Asians in general
having higher per cent BF and higher diseases risk at any given BMI compared to
Europeans. However Pacific populations (as far as have been studied) appear to have
more lean mass at any given BMI than Europeans but also a higher risk of diseases
like diabetes. A systematic review for Asian and Caucasian adolescents by Wulan et
al. [39] using BMI for age reported that there were differences in the percentage of
BF between Asian and Caucasian girls but excess BF was found mainly among the
thin children. Sampei et al. [45] also reported that there was no difference in BF
between Japanese and Caucasian boys; however, a lower fat-free mass (statistically
significant) was reported for Japanese boys. In addition, even though Singaporean
boys and girls were shorter, lighter and had a lower BMI, they had a higher skin fold
thickness and BF percentage compared to the adolescents from a Dutch Caucasian
background.
A cross-sectional analysis of European, Maori, Pacific Islands and Asian Indian
adults for total and percentage of BF, abdominal fat, thigh fat, appendicular muscle
mass, bone mineral content and leg length measured by dual-energy X-ray
9
absorptiometry showed ethnic differences [43]. Asian Indian men and women (BMI
of 24 and 26 kg/m2, respectively) had the same percentage of BF as Europeans, with
a BMI of 30 kg/m2 or Pacific men and women with BMI of 34 and 35 kg/m2,
respectively. Asian Indians had more fat, both total and in the abdominal region, with
less lean mass, skeletal muscle and bone mineral than all other ethnic groups. Leg
length was relatively longer in Pacific men and Asian and Pacific women than in
other ethnic groups. In Asian Indians, abdominal fat increased with increasing age,
while the percentage of BF showed little change. In the other ethnic groups, both
abdominal and total BF increased with age.
Other studies [46-48], including Pacific Islands children’s and adolescents’ BMI and
relationship with per cent BF showed some ethnic differences. Children obesity rates
varied by ethnicity in New Zealand. It was found to be higher among Pacific
Islanders and Maoris than Europeans, but no significant difference between BMI and
per cent BF was found [49]. The same study, however, found that the per cent BF
was higher for girls than boys. Rush et al. [48] found that at a given BMI, the per
cent BF of Maori and Pacific Islands girls averaged lower (3.7%) than the New
Zealand European girls. The finding was inconsistent for boys. Another study by
Slutyer et al. also found that the per cent BF (after being adjusted for BMI), was
statistically significant 1.9% lower and 4.4% lower for Maori and Pacific Islanders,
but 3.6% higher for Asian Indian girls, when compared with European girls.
Similarly, compared to European boys, per cent BF was statistically significant 2.8%
lower, 5.2% lower for Maori and Pacific Islands boys, but 3.5% higher for Asian
Indian boys.
These findings suggest that ethnic-specific relationships between BMI and body
composition may contribute to some of the variations in the prevalence of obesity
among ethnic groups when using WHO cut-off points. The literature suggests that, in
general, Pacific populations have: 1) higher prevalence of obesity (by BMI), 2)
higher absolute adiposity (by total fat mass) and 3) higher proportion of lean mass.
2.1.3 Obesity prevalence
Obesity is escalating worldwide with about 1.2 billion adults being overweight
(BMI>25kg/m²) and approximately 300 million being obese (BMI ≥30kg/m²) [50].
10
WHO further reported that obesity has more than doubled for adults in the past
decades (1980 to 2008), making it a growing health concern worldwide [51, 52].
About 43 million children and adolescents were classified as overweight (>2SD) or
obese (> 3SD) in 2010 [51]. Among children, overweight and obesity had increased
worldwide from 4.2% in 1990 to 6.7 % in 2010. It is forecasted that in 2020, 60
million children of preschool age will be either overweight or obese. Obesity
prevalence in youth has also increased in the last decade.
There are wide variations in the global prevalence of obesity. Between 1998 and
2008, more men compared to women were obese worldwide. This can also be seen
for adult women in selected countries; sex differences in obesity prevalence may be
accounted for by economic, social and cultural determinants (see Figure 2.1).
Obesity prevalence varied from less than 2% in Bangladesh, around 40% in Australia
and the United States (US), to over 80% in Tonga, a Pacific Island country.
Variations in obesity prevalence can also be seen in a single country such as in New
Zealand, where obesity is higher among the New Zealand Pacific Islanders compared
to the Europeans [53]. Similarly, in Fiji the obesity prevalence is higher for
Indigenous Fijians compared to IndoFijians [17, 18]. Moreover, despite the lower
prevalence of obesity among IndoFijians, it is interesting to note that this prevalence
is higher compared to that in India.
11
Figure 2.1: Variations in obesity prevalence in adult women in selected
countries (economic, social and cultural determinants)
Source: WHO Global Database on BMI 2011
Pacific Islands countries have been found to have some of the highest prevalence
rates of adult obesity in the world [19, 54, 55]. In 2008, BMIs for males and females
were highest in some Oceania countries, reaching 33·9 kg/m² (32·8–35·0) for men
and 35·0 kg/m² (33·6–36·3) for females in Nauru [56]. Finucane et al., in their
systematic review of published and unpublished epidemiological studies globally,
including 19 countries in the Oceania, reported that between 1998 and 2008, male
BMI increased in all but eight countries, with mean BMIs increasing by more than 2
kg/m² per decade in Nauru and the Cook Islands.
12
The prevalence of overweight and obesity is high in Fiji across all age groups [16,
17]. The 2002 National NCD STEPS Survey1 reported that 29% of Fiji’s population
aged 15 to 64 years were overweight and 18% were obese, with Indigenous Fijians
(31% overweight; 11% obese) having a higher prevalence than IndoFijians (21%
overweight; 6% obese) (16). This survey reported that more females (26.4%) were
obese compared to males (9.8%).
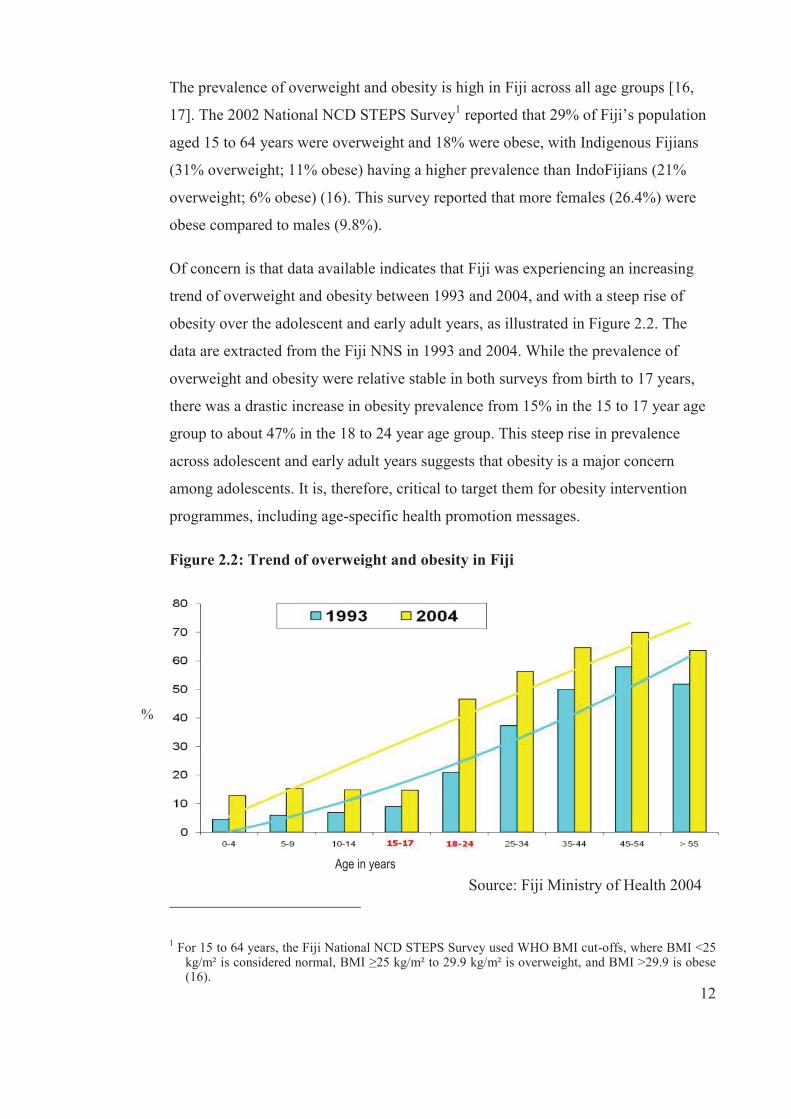
Of concern is that data available indicates that Fiji was experiencing an increasing
trend of overweight and obesity between 1993 and 2004, and with a steep rise of
obesity over the adolescent and early adult years, as illustrated in Figure 2.2. The
data are extracted from the Fiji NNS in 1993 and 2004. While the prevalence of
overweight and obesity were relative stable in both surveys from birth to 17 years,
there was a drastic increase in obesity prevalence from 15% in the 15 to 17 year age
group to about 47% in the 18 to 24 year age group. This steep rise in prevalence
across adolescent and early adult years suggests that obesity is a major concern
among adolescents. It is, therefore, critical to target them for obesity intervention
programmes, including age-specific health promotion messages.
Figure 2.2: Trend of overweight and obesity in Fiji
Source: Fiji Ministry of Health 2004
1 For 15 to 64 years, the Fiji National NCD STEPS Survey used WHO BMI cut-offs, where BMI <25 kg/m² is considered normal, BMI ≥25 kg/m² to 29.9 kg/m² is overweight, and BMI >29.9 is obese (16).
Age in years
%
13
NCDs are also an increasing threat to both Indigenous Fijians and IndoFijians.
According to the WHO, NCDs contributed to 77% of all deaths in 2008 [57]. In
2002, the NCD STEPS Survey reported a prevalence of hypertension of 19.1% in 15
to 64 year olds and diabetes at 16% for the 25 to 64 year age group [16]. While the
prevalence of hypertension was higher among Indigenous Fijians, diabetes was
higher among IndoFijians.
Obesity is not a problem limited only to adults in Fiji. The rates of overweight and
obesity among adolescents has also been found to be a problem. Data from the 2004
NNS2 (n=7,327), another cross-sectional study, showed that 14.9% in age group 10
to 14 years and 14.7% in age group 15 to 17 years were either overweight or obese
[17]. Within these same age groups, ethnic differences were seen. About 15% and
18.2% of Indigenous Fijians were classified as overweight or obese compared to
IndoFijians at 13.8% and 7.6%, respectively [17]. This 2004 study indicated that
overweight and obesity had tripled for both ethnic groups since the previous NNS
(n=4,604) in 1993 [17] . In one cross-sectional study, Khan et al. [58] in 2006
reported that in the three schools surveyed (n=), 18% of adolescents were overweight
and 16% were obese with a higher prevalence in Indigenous Fijians and among
females. There are, therefore, considerable and increasing problems in both adults
and adolescents in Fiji with overweight and obesity, with higher rates seen in
Indigenous Fijians compared to IndoFijians and females compared to males.
2.1.4 Determinants of obesity
The determinants of obesity are viewed differently across the literature. At its most
basic level, obesity is simply caused by a chronic positive energy balance, displayed
in Figure 2.3. The energy balance is determined by the interplay of energy intake and
expenditure. Thus, obesity results when energy intake in the form of food and
beverages consumed exceeds over a considerable period of time the energy
2 For ≥ 18 years, the Fiji NNS used WHO BMI cut-offs where <18.5 kg/m² is considered underweight, 18.5 kg/m² -24.9 kg/m² is considered normal/healthy weight, and BMI <25 kg/m² is considered overweight .While National Centre for Health Statistics (NCHS) standards were used as benchmarks where <80% is underweight, 80%-<120% healthy, and ≥ 120% overweight for weight for age and for children and adolescents under 18 years. NCHS standards are reported as a percentage of the NCHS median (NNS 2004).
14
expenditure, which is the sum of physical activity, basal metabolism and adaptive
thermogenesis [59-61]. While genetic factors are also important determinants of
obesity at the individual level, it is omitted from the figure for simplicity.
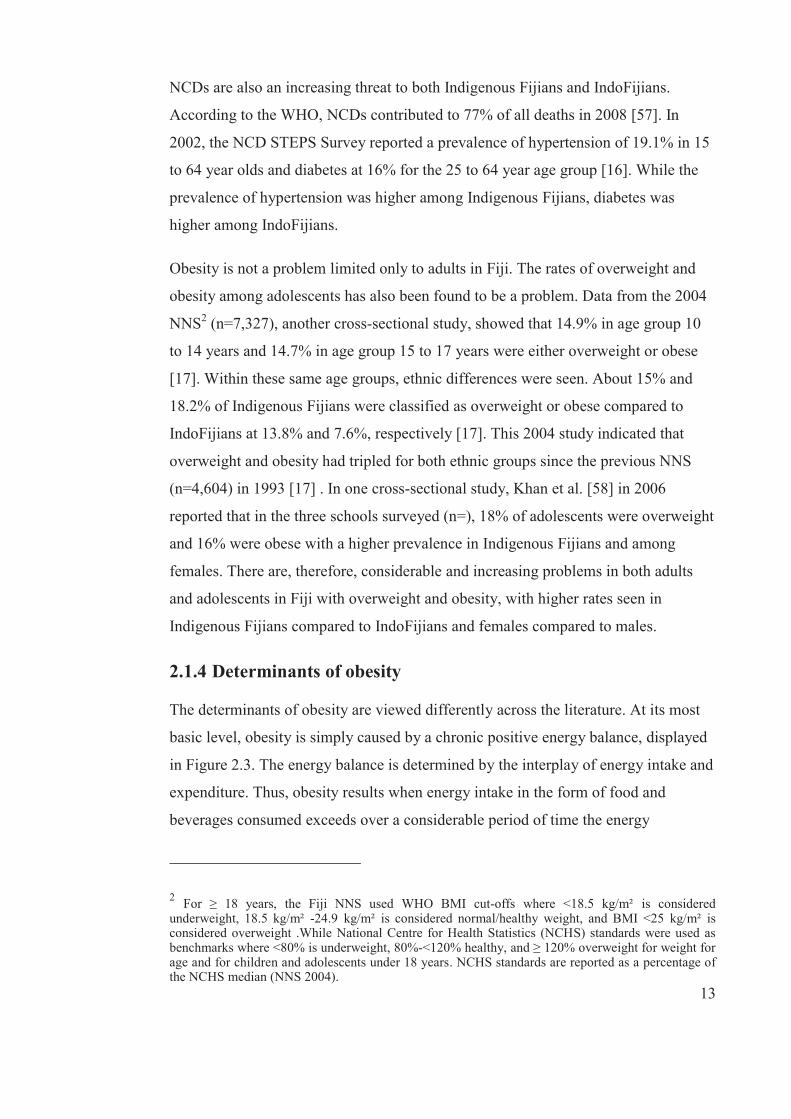
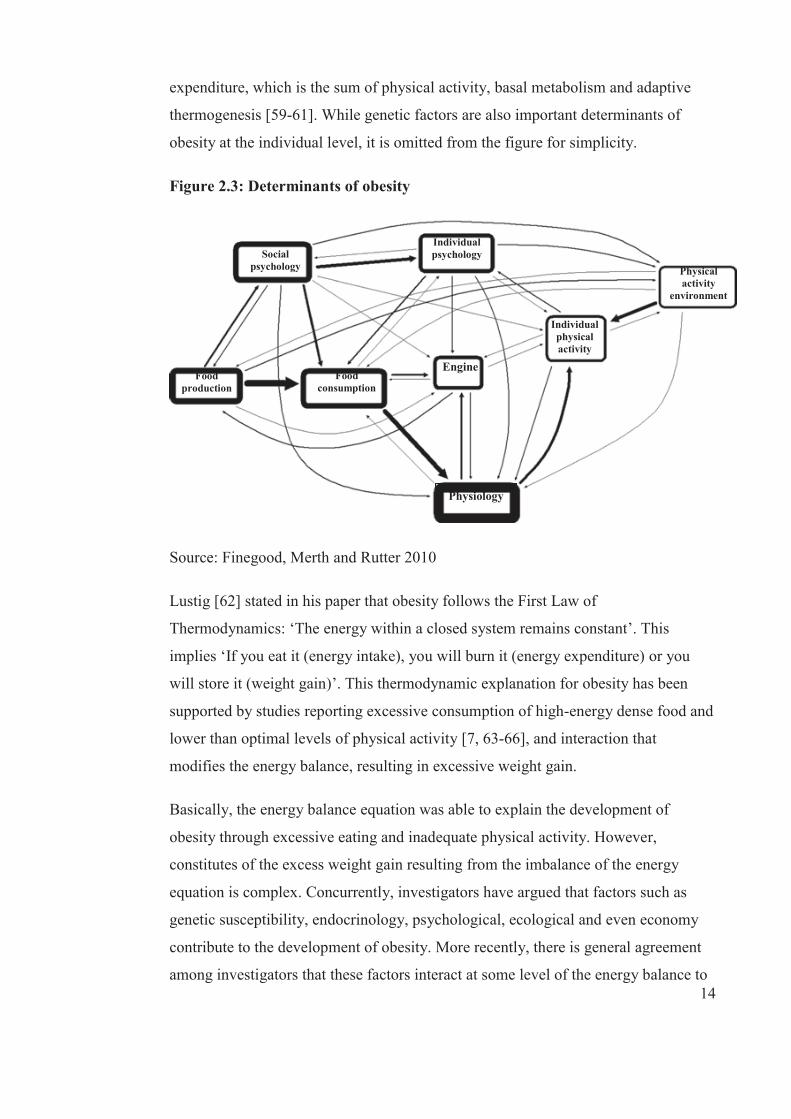
Figure 2.3: Determinants of obesity
Source: Finegood, Merth and Rutter 2010
Lustig [62] stated in his paper that obesity follows the First Law of
Thermodynamics: ‘The energy within a closed system remains constant’. This
implies ‘If you eat it (energy intake), you will burn it (energy expenditure) or you
will store it (weight gain)’. This thermodynamic explanation for obesity has been
supported by studies reporting excessive consumption of high-energy dense food and
lower than optimal levels of physical activity [7, 63-66], and interaction that
modifies the energy balance, resulting in excessive weight gain.
Basically, the energy balance equation was able to explain the development of
obesity through excessive eating and inadequate physical activity. However,
constitutes of the excess weight gain resulting from the imbalance of the energy
equation is complex. Concurrently, investigators have argued that factors such as
genetic susceptibility, endocrinology, psychological, ecological and even economy
contribute to the development of obesity. More recently, there is general agreement
among investigators that these factors interact at some level of the energy balance to
Social psychology
Food production
Individual psychology
Food consumption
Physiology
Engine
Individual physical activity
Physical activity
environment
15
cause obesity. It is now widely accepted that obesity is a multi-factorial, multi-
dimensional, multi-determinant and multi-casual disorder and there is no single
explanation for its development [67]. This was best illustrated by the Foresight
obesity project that related the complexity of obesity development and defined
obesity system as ‘the sum of all the relevant factors and their interdependencies that
determine the condition of obesity for an individual or a group of people’ [67, 68].
The Foresight obesity system is simplified in Figure 2.3.
According to Finegood, Merth and Rutter (68) ‘connections between clusters in the
reduced map reflect the number of individual connections between the variables in
each cluster of the full map. The width of the arrows is proportional to the number of
underlying connections. For example, the thickest arrow goes from Food production
to Food consumption and reflect that there are 22 direct influences from variables in
the Food Production cluster on variables in the Food consumption cluster in the
original map’. Although the Foresight obesity system map is useful to convey the
complexity of the obesity problem, the information is so dense that it might lead to
draw backs in the focus of obesity prevention. Further, the very detailed pathways
make it difficult to highlight the strength of evidence related to the importance of
policy approaches [67, 68].
While there are many scientific explanations for the onset of obesity, there is limited
focus on the cultural meaning of it. It is important to understand how obesity is
defined, especially among adolescents in the Pacific in the context of dietary
patterns, given the increasing burden of NCDs. While there are a number of scientific
explanations for obesity, little is known about the different cultural components of
obesity. Examination of cultural differences in diets and concepts of obesity is
important given the cultural differences in overweight and obesity. Fiji provides an
ideal opportunity to study two different ethnic groups in the same school settings.
While the determinants of obesity are complex, as illustrated by the Foresight
Obesity Map (see Figure 2.3), at the core or engine is the fundamental principle of
nutrition and metabolism: the energy balance equation. Factors that affect the
development of obesity must affect one or more components of energy balance, thus
it is important to understand them. The following section describes how excessive
16
energy intake, energy expenditure and genetics collectively contribute to the
development of obesity.
2.1.4.1 Energy intake
The dietary component is a fundamental principle in the development of obesity. The
energy intake is determined by the caloric intake of macronutrients such as
carbohydrates, proteins and fats. When there is excess energy consumed from food,
the body subsequently converts and stores this excess energy principally as
triglycerides (fats) in the adipose tissues as well some in lean tissues (the bigger the
muscle mass and organ mass). The excess triglycerides in the body lead to an
increase in the size and number of adipocytes (fat cells) in the body, resulting in
weight gain over time [59, 69].
Several studies [70-74] have investigated the relationships between nutrients, in
particular dietary fat and obesity, but the findings remain controversial. Swinburn
and Ravussin (73) have suggested that fat intake is an important determinant of the
imbalance of energy because it is energy-dense and has limited effect on satiety and
enhances fat oxidation in the body. Thus, a reduction in dietary fat is a most common
strategy in weight loss programmes or in treatment of obesity. In a review by Lissner
and Heitmann (71) on cross-sectional and short term experiment studies, the high-
energy per cent of fat was associated with subsequent weight gain (obesity). Similar
reviews indicated inconsistent findings with the prospective studies. Willet [72] also
reported a lack of evidence, linking a long term high fat diet intake and obesity.
Another review by Hill et al. (70), on animal studies, carefully controlled laboratory
studies, cross-sectional studies, clinical trials and studies in individuals at high risk of
developing obesity, indicated that high intake of fat diets increase the likelihood of
obesity and that the risk of obesity was found to lower among individuals who
consumed diets low in fat. Similar findings were noted by Bray et al. [74], but has
implications for different populations.
While dietary fat is an important determinant for the onset of obesity, the focus has
been shifted towards the total energy intake of individuals to explain its impact on
obesity. In fact, WHO (75), in its 2003 report titled ‘Diet, nutrition and the
Prevention of Chronic Diseases’, stated that the high intake of energy-dense foods
17
contribute to weight gain and thus recommended a diet low in fat, sugar and salt and
high in fruit and vegetables in order to protect against the development of obesity
[75]. Specifically, attention has been given to energy-supplying macronutrients as
well as the concept of a ‘balanced diet’, including proportions of various energy
sources. Based on these recommendations [76], dietary guidelines have been
developed to translate these global goals to country-specific dietary guidelines
targeting different sub-populations [77-79]. The specific dietary behaviours and their
recommended intake are: total fat (15–35%)—including saturated fats (<10%),
polyunsaturated fats (6–10%), monounsaturated fats3 and trans fats (<1%)—total
carbohydrate (55–75%), protein (10–15%), cholesterol (<300mg per day), sodium
chloride (5g per day) and fruit and vegetables (≥400g per day).
The energy density of a diet contributes to the total energy intake that can either
maintain weight or promote weight gain or weight loss [80, 81]. In this sense, a high
consumption of energy-dense foods such as high fat, high sugar and high starch and
energy-dense drinks such as SSB contribute to the increase of total energy intake,
which leads to weight gain over time. Conversely, a high intake of low energy-dense
foods (those rich in water and high in fibre) such as fruit and vegetables [82, 83],
legumes and wholegrains [81, 84-87] contribute to a reduction in total energy intake
and are inversely associated with BMI.
Increased intake of fruit and vegetables is recommended to decrease the risk of
overweight and obesity. This is due to their high content of water and fibre and low
density, which results in a reduction of total energy intake. These properties of fruit
and vegetables were beneficial to weight maintenance through increasing of satiety
and reducing hunger [88, 89]. A literature review by Tohill [82] provided convincing
evidence about fruit and vegetables and their role on satiety, satiation and weight
management based on short term and long term studies. Of interest, a similar review
of a long term trial showed that encouraging fruit and vegetable intake along with a
low fat (7% energy) diet over three weeks, as a weight loss programme in Hawaii,
successfully reduced energy density (0.8kcal/g) of the diet of participants who were
3 The recommendation for monosaturated fat is calculated as; Total fat - (saturated fatty acids + polyunsaturated fatty acids + trans fatty acids).
18
overweight and led to considerable weight loss (mean, 7.8kg). Another study
reported in this review, on obese men and women who were put on a fat contribution
of 12% and high intake of fruit and vegetables, also resulted in weight loss. While
these studies indicated a combination diet therapy of fruit and vegetables and fat, it
was clear that the increased intake of fruit and vegetables resulted in hunger control
and satiety and weight maintenance.
An epidemiological review by Tohill et al. [89] on the relationship between fruit and
vegetable intake and weight status. The fruit and vegetables were analysed
separately. Lin et al. [83] and Serdula et al. [90], the only two studies in this review
that adjusted for possible confounders such as age, sex and race/ethnicity, examined
the relationships between fruit and vegetables and weight status among adults.
Among men, obese men consumed less vegetables than those with lower BMIs, but
there were no significant differences found among the women sub-group. Among
women, no difference was found between BMI categories for both men and women.
Alinia et al. [91] analysed three interventions, eight prospective observational and
five cross-sectional studies that examined the relationship between fruit and
vegetable intake and body weight. Two of the intervention studies showed that fruit
intake reduced body weight, five of the prospective observational studies showed
that fruit consumption reduced the risk of developing overweight and obesity and
four of the cross-sectional studies found an inverse association between fruit intake
and body weight. A systematic review on longitudinal and experimental design
studies of fruit and vegetables and adiposity [92] showed inverse findings or weak
associations. Experimental studies found that increases in fruit and vegetable
consumption contributed to reduced adiposity among overweight or obese adults, but
no association was shown among children. Longitudinal studies among overweight
adults found greater fruit and/or vegetables consumption was associated with slower
weight gain, but only half of child longitudinal studies found a significant inverse
association.
Scientific evidence is increasing on the dietary behaviours associated with obesity,
specifically a low meal frequency (particularly skipping breakfast) and a high
consumption of energy-dense snacks and drinks (SSB), especially among children
19
and adolescents [93]. Some of these dietary behaviours, in particular consumption of
energy-dense snacks and drinks, have come about during dietary shifts experienced
in many parts of the world, including Fiji. These dietary shifts towards consuming
SSB are also reflected in the increasing prevalence of overweight and obesity.
Meal frequency is protective against obesity [94, 95]. Koletzko et al. [96] reviewed
five observational studies between 2004 and 2009 in children and adolescents of US
and Europe and found that an increased frequency of daily meals was protective
against obesity [89, 95]. Of particular interest, Toschke et al. [95] found a dose-
response effect in the relationship between meal frequency and obesity; for example,
the prevalence of overweight and obesity decreased as meal frequency increased.
However, two cross-sectional studies conducted in the US among children [97, 98]
did not show statistically significant associations between meal frequency and
obesity, when consuming three or less meals. In addition, two longitudinal studies
[99, 100] showed a significant relationship between increased meal frequency and
low BMI among adolescents, especially among girls in the US.
Skipping breakfast has also been associated with the development of obesity in a
number of cross-sectional and small prospective cohorts [101-104] and longitudinal
studies on children and adolescents [102, 105-107]. A cross-sectional by Utter et al.
[101] in New Zealand found that children and adolescents who missed breakfast
were significantly less likely to meet recommendations for fruit and vegetable
consumption (p=0.05) and more likely to be frequent consumers of unhealthy snacks.
In addition, children and adolescents who had irregular breakfast not only consumed
a nutrient poor diet, but skipping breakfast was significantly associated with a high
BMI [101]. However, frequency of breakfast was found to be inversely associated
with BMI in a prospective study over five years [102].
The data from these studies show that children and adolescents who have breakfast
regularly had a lower risk of having a high BMI or a high risk for developing
overweight and obesity compared to those who skipped breakfast.
The consumption of SSB has increased dramatically worldwide and in parallel with
the increasing prevalence of overweight and obesity. Two systematic reviews were
20
conducted by Malik et al. [108] and Foreshee et al. [109], who examined the
relationship between SSB and obesity. Malik et al. [108] reviewed 30 studies (15
cross-sectional, 10 prospective and five experimental) and found sufficient evidence
from these studies to indicate a positive association between a high consumption of
SSB and weight gain and obesity. While authors suggested the need for further
research in this area, evidence is sufficient for public health strategies to reduce SSB
consumption, especially among adolescents. Foreshee et al. [109] reviewed 12 (10
longitudinal and two randomised controlled trials) and eight longitudinal studies
(including quantitative meta-analysis) studies. The investigators found weak and
non-conclusive associations between SSB consumption and BMI. Despite these
findings, the high consumption of SSB among children and adolescents is an
important contributor to the development of obesity because of its energy-dense
properties, which contribute to the increase of total energy intake.
In Fiji, the National Dietary Guidelines were set up for use by professionals in 1991
and published as the Health and Nutrition Guidelines for Fiji. These have gone
through a number of reviews, with the most current updated version titled Food and
Health Guidelines for Fiji [110]. These guidelines have included both food and
health guidelines. Together, they focus on promoting nutritious food and healthy
lifestyles. There remains a need for investigation of these specific dietary behaviours
in order to incorporate them into the guidelines.
2.1.4.2 Energy expenditure
The total energy expenditure (TEE) refers to the energy spent, on average, in a day
(24 hours) by an individual [69, 111] . It mainly comprises resting metabolic rate
(RMR), the thermic effect of food (TEF) and physical activity energy expenditure
(PAEE). The reduction of any of these components may lead to obesity.
The majority of energy expenditure in humans occurs during resting (basal metabolic
rate). In fact, RMR is the largest part of the TEE because it represents 60 to 75% of
TEE in most sedentary people [112] and refers to the energy required by the body to
sustain basic physiological functions while lying quietly in a supine position [113].
The PAEE contributes to about 30% of TEE and is the most variable in terms of how
it is measured [114]. According to Levine and Kotz in Wilborn et al. [115]p7),
21
‘physical activity can be divided into two subclasses, namely 1) exercise activity
thermogenesis (volitional exercise); and 2) non-exercise activity exercise
thermogenesis (NEAT) (consists of all activity that one performs that is not related to
“sport-like” exercise’. Activity thermogenesis accounts for about 15 to 50% of total
daily expenditure in sedentary to very active populations, respectively [116]. For the
purpose of this literature review, the term physical activity is used to represent the
two subclasses.
Regular physical activity has been suggested as an important factor in the prevention
of obesity [64].While there are studies that have shown an inverse association
between physical activity and weight [117], other studies reported unclear or no
association [117-119] and some studies indicated a positive correlation between
regular physical activity and lower fat mass [117, 120]. It has also been found that
the association varies by sex.
The smallest component that accounted for about 10% of the TEE in humans is the
TEF. According to Rolfes et al. [121], TEF is the ‘energy that requires to process
food (digest, absorb, transport, metabolize and store ingested nutrients)’ through the
process of thermogenesis.4 While TEF is the smallest component of TEE, humans do
not have much control over it as they do physical activity and sedentary behaviours.
Meta analyses and systematic reviews have shown some relationships between body
composition and TEE, but they are not strong and consistent [119, 122]. However,
physical activity remains an important part of health promotion, but is not the focus
of this thesis.
2.1.4.3 Genetics
The role of genetics in obesity has been the subject of ongoing debate among
biomedical scientists since early days. It is only recently that a number of studies
have provided evidence on how genetics influence the development of obesity [123,
124]. Genetics’ influence on obesity could explain its role in metabolic function and
intrauterine influences in that genetics may help to explain body size and
4 Thermogenesis refers to the process in which RMR increases as a result of certain stimuli, which include psychological factors such as fear and stress, food intake, heat or cold exposures, or a response to drugs (73, p98).
22
composition differences between individuals living in the same environment at the
same point in time. Heritability studies suggest that 75 to 80% of human body weight
could be controlled by genetic make-up [125, 126]. Further, specific genes have been
identified as related to obesity susceptibility, but there are no convincing results as
yet [127].
Studies have been undertaken in the Pacific Islands on obesity and genetics. Duarte
et al. [128], in a study on obesity and genetics in an obese Tongan population,
reported that the determinants of weight gain were likely to be predisposed in utero.
Another study by Dai et al. [129] found that specific genes influencing adiposity
were present among American Samoans. A study combining sample from American
Samoa and Samoa on genomic regions associated with adiposity found some
suggestive linkages with phenotypes such as BMI, % Body fat, and Leptin [130].
While all of these studies exhibited the potential contribution of genes to the
development of obesity, the authors highlighted that the differences found in this
study are suggestive of environment and genetic interaction which should be taken
into account in further studies. Indeed, genetic changes cannot be solely responsible
for the global increase of obesity given the fact that the gene pool has not changed
significantly in the recent decades, but the prevalence of obesity has increased
steadily [126, 131] during the same period. Thus, an obesogenic environment is a
more likely explanation for the global increase of obesity [28, 131].
2.1.5 Obesity and health implications
Between 1990 and 2010, changes in the contribution of risk factors to global burden
of diseases were reported globally [10]. While the leading risks of the global burden
of diseases in 1990 were childhood underweight, household pollution from solid
fuels and tobacco smoking, including second hand smoking, in 2010 they were high
blood pressure, tobacco smoking, including second hand smoking, and alcohol use
[10]. High body mass was also highly ranked as a leading risk of global burden in
2010. However, findings differ substantially within the different WHO regions.
Moreover, high BMI contributed to 3.8% of global disability-adjusted life years
(DALYs); that is, the sum of years lived with disability in 2010 [1]. High BMI was
23
the second leading risk factor for global diseases in the Oceania region in 2010 after
tobacco smoking [10].
The association of BMI with mortality is well documented by the Prospective
Studies Collaboration in their 57 studies [132]. They reported that lower mortality
was linearly associated with lower BMI. A similar study further reported that in the
overweight and obese categories (BMI over 25) positive associations were found
with increased mortality from NCDs such as cardiovascular mortality, diabetes, renal
and respiratory diseases, while BMI over 30 was associated with mortality [132].
NCDs accounted for 65% of 52.8 million global deaths, which is around 34.5 million
people, in 2010 [1]. The Global Burden of Disease study also reported an 11%
increase of DALYs from NCDs between 1990 and 2010; that is, 54% of DALYs in
2010 from 43% in 1990. WHO has predicted that NCDs will be responsible for 73%
of deaths and 60% of the global burden of disease by 2020 [2]. Not only do NCDs
affect the health of an individual and his/her family, indirectly NCDs is associated
with productivity losses that affect families and economies. NCDs are also associated
with intangible costs, such as the loss of quality of life and premature mortality. In
2011, the UN, in its High-Level Meeting of the General Assembly on the Prevention
and Control of Non-communicable Diseases, declared that NCDs are a ‘crisis’ that
threatens development in the 21st century worldwide and must be addressed urgently
[3].
2.2 Why target adolescents?
Obesity during childhood and adolescence is a precursor for obesity in adulthood
thus children and adolescents are targets for obesity prevention, particularly as
dietary patterns established at earlier ages are often continued into adulthood, with
increasing risk for developing obesity and chronic diseases [133]. Specifically, there
are other reasons why it is important to target adolescents. First, adolescence is a
critical growth period during which adolescents grow into their adult height and
weight, but age-related weight gain experienced by Pacific adolescents is often
excessive during this period.
24
In the Pacific Islands, particularly, there is evidence that adolescence and early
adulthood is the time when weight gain can be quite substantial [16, 134, 135].
Excess weight is difficult to lose once it is gained, making it important to prevent.
Second, adolescents are quite responsive to their environment, including food
environments, and during this time they develop dietary patterns. Last, adolescents
are a ‘captive audience’, meaning that they are readily accessible through schools.
Health promotion programmes have a greater difficulty in accessing adults, and by
then the major approach is one of weight loss because the majority of the population
is above a healthy weight. For these reasons, the Pacific Islands, including Fiji, needs
to identify and develop context-appropriate intervention strategies to improve dietary
patterns in adolescents.
2.3 Environmental influences on obesity
As discussed in section 2.1.4, the main behavioural causes of obesity are obesogenic
diets, especially eating foods rich in fat and sugar, low servings of fruit and
vegetables and lack of physical activity [136, 137]. Lim et al. [10] reported that
dietary risk factors such as diets low in fruit and vegetables and high in sodium and
lack of physical activity collectively contributed to 10% of DALYs in 2010 globally.
These obesogenic diets are strongly influenced by the food environment [138-141].
For example, global food markets have increased the availability of unhealthy food
and drink choices at a cheaper price than healthy alternatives. With the heavy
promotion of these tasty, processed foods, which are high in energy, fat, sugar and
salt, there has been an increased consumption of obesogenic food and reduced fruit
and vegetable consumption.
In the last two decades, the Pacific Islands have experienced a shift in dietary
patterns associated with overweight and obesity. This shift has been linked with
changing environment, in particularly food environments. It has been documented in
a number of earlier studies on Pacific populations that this came about due to
urbanisation , migration [142, 143], globalisation and so-called coca-colonisation
[144]. Baker [142] reported rapid changes in the early 80s within the traditional
Samoan society, which has led to high rates of obesity among Samoans. This
worsened for Samoans who migrated to Hawaii and the mainland of United States.
25
Similar impacts have been documented for Tokelauans [145] who migrated to New
Zealand. The experiences in dietary changes toward westernised diets from
traditional ones have occurred across the Pacific but have been well documented in
Federated States of Micronesia [146, 147] Papua New Guinea [148-150], Nauru and
Tuvalu [151].
Likewise Fiji have also experienced a shift in dietary patterns associated with
increasing overweight and obesity [17, 152-154]. Fijians, including adolescents, have
changed from their traditional diet to one that is more dependent on imported and
processed food such as fatty, highly processed, salty and sugar-sweetened food [17,
154]. Given the change in the food environment, adolescents as well other age
groups have access to high calorie foods that are affordable, while intake of fruits
and vegetables are low.
The shifts in dietary patterns and body weight have been attributed to the ‘nutrition
transition’ which has been well-documented [155-160] and provides a theoretical
basis for this thesis. In particular, it captures the influences and patterns of changes to
diet and obesity in the Pacific region. ‘Nutrition transition’ describes the transition in
dietary patterns which are occurring under the influence of globalisation and
urbanisation and has been occurring rapidly worldwide. Specifically, it describes a
changing diet from traditional locally-accessed foods, to ones which are processed
and high in fat, sugar, salt and diets often with more meat and dairy products. These
food items are significant dietary risk factors and they contribute to the increasing
prevalence of obesity and non-communicable diseases both globally and in the
Pacific region.
Globalisation has played an influential role in nutrition transition, due to the changes
in the global food supply towards food items that are processed, affordable, and
heavily marketed. This has been linked to the obesity epidemic. Economic
development has shown positive and curvi-linear association with obesity, although
it was found to be unusual for low-income countries of the Pacific region. An
analysis by Swinburn et al. [28] showed that this relation was linear for countries
with up to a Gross Domestic Products (GDPs) of about US$5000 per person per year
but flat for countries with higher GDPs. Some Pacific Islands countries were unusual
26
in having both a low GDP but a high obesity prevalence. The authors also
highlighted the impact of globalisation on populations through a framework called
‘Framework to categorise obesity determinants and solutions’. It explains the
environmental drivers for changes in dietary patterns and obesity interventions,
taking into account energy imbalance due to high total energy intake. It is key that in
addressing obesity, upstream interventions should be targeted because they are likely
to carry a bigger impact on eating behaviour patterns and obesity. Targeting food
policy and actions will have positive effect on food environment such economic and
trade policies. However, the size of impact of such policies, in this case, is moderated
(attenuated or accentuated) by factors such as culture, wealth or education level of a
local environment or country. For instance, in the Pacific Islands, like Fiji and
Tonga, cultural food practices and values and body size perceptions [161, 162] are
critically important in determining diet.
Pacific Island countries, unlike high income countries, are still relatively early in
their economic development. They are at different stages of the nutrition transition;
however they are experiencing large and rapid explosion of obesity and diabetes. In
fact, Pacific region has the highest obesity and diabetes rates in the world, with no
indication of an improving trend.
Globalisation in terms of economic growth has been positive for the Pacific Island
countries but also problematic [155]. For example, the development of obesogenic
environments, including changes towards dietary patterns which predispose to
NCDs. According to Evans et al. [163](p309), “ …developments and globalisation
have often resulted in disrupted food supplies, new patterns of food consumption,
and in a great many contexts, a decrease in the quality (though not often the quantity
of foods)”. This is truly a problem for Pacific Islands where food supply has become
saturated with more energy-dense foods and declined in traditional foods. Such
transition in dietary patterns occurs in parallel to the increasing burdens of obesity
and non-communicable diseases in the region, which undermines national economic
productivity.
Urbanisation, reflected in the influx of migration from rural to urban centres as
people pursue improved economic prospects and quality of life, has also taken place
27
rapidly in the Pacific. According to the World Bank Report [164], a high rate of
population growth has been reported for the Pacific, with about 35% living in urban
setting and 8 out of the 22 Pacific Islands are now predominately urban. Migration to
urban settings allows people to access to unhealthy food such as those high in sugar,
salt and fat and there have been declines in the use of traditional foods. The problem
is much bigger for the Pacific Islands as these obesogenic foods have now found
their way to the rural areas and are replacing traditional foods.
The’ nutrition transition’ has significant effect on all Pacific Island countries [155,
157], including Fiji where significant shifts to poor dietary patterns and increasing
obesity prevalence are of great concern even among adolescents, and deaths from
non-communicable diseases among adult sub- populations.
The food environment and its influence on adolescents’ behaviour is well illustrated
by the socioecological framework (SEF) in Figure 4.1. The eating behaviour of an
individual is influenced by interpersonal, organisational, community and public
policy domains. The interplay between these environmental domains is complex,
making obesity prevention a complex problem as well (detailed discussion in
Chapter 4, section 4.1.1 and 4.1.2).
2.4 Diets in Fiji: historical and current trends
Fiji, like other Pacific Islands, has experienced demographic and epidemiological
changes that have resulted in the so-called ‘nutrition transition’. The nutrition
transition refers to a sequence of major shifts in food supply and dietary patterns over
time, with a corresponding increase of NCDs [153].
The recorded history of food consumption patterns in Fiji can be dated back to as
early as 1850, when the early missionaries arrived in Fiji and before Indians migrated
to the Pacific. The most frequently consumed foods were locally available root crops
such as taro or dalo (Colocasia antiquorum), cassava, yams or kawai (Dioscorea
spp.), breadfruit or uto (Artocarpus alitilis) and plantain or vudi (Musa spp.). These
were often eaten with varieties of green leafy vegetables such as bele (Hibiscus
manihot), dalo (taro) leaves or rourou and ferns or ota [165, 166]. The type of protein
differed by location; for instance, inland dwellers tended to consume prawns, fish
28
and eels, flying foxes, rats and some insects, whereas coastal dwellers depended
more on salt water fish and shell fish for their protein supply [165, 166]. Wild fruit
trees were abundant and provided citrus and other fruit and bananas. Fruit was
consumed as a snack food and was not seen as an essential part of a meal, as were for
vegetables.
There were significant changes in the food supply in Fiji in the 19th century, with the
arrival of increasing numbers of European traders, missionaries and settlers brought
the introduction of sugar and flour. There was also a significant change to Fijians’
diets in 1879 with the arrival of indentured Indian labourers to harvest sugar cane
[166]. Foods such as dried legumes and rice were imported and as they became more
available, these foods found their way into Indigenous Fijian diets, although taro and
yams were the preferred carbohydrate. The first recorded description of the
composition of the IndoFijian diet related to the rations that they received while
working on the plantations. Staple foods provided were rice, ata (wholemeal flour)
and roti, while vegetables were obtained from Indigenous Fijian villagers in
exchange for Indian clothes or spicy food [167].
In 1954, results from the ‘survey of economic and nutritional conditions in Indian
households’, reported that cassava comprised 50% of root vegetables consumed,
while each individual consumed 150g of wheat products and 50g of rice per day.
While fruit was of low significance, vegetables were an essential part of the diet,
whereas the consumption of meat was influenced by religion. Ghee was the preferred
fat used in cooking. The consumption of vegetarian dishes, sweets and snacks were
frequently linked to festival celebrations.
Changes to food consumption patterns were well documented for Indigenous Fijians
in inland Naitasiri between 1954 and 1980 [166]. While in 1954, people relied more
on traditional foods from their land rather than store food [168], by 1980 people were
buying more of their food from shops [169]. In 1981, a study on food production and
consumption on Indigenous Fijian and IndoFijian farms in the Sigatoka valley [170]
showed that these two ethnic groups still had different dietary preferences. The main
staples for Indigenous Fijians were cassava, sweet potatoes, taro and yams, which
constituted 50% of the daily calorie intake consumption. Other important sources of
29
energy in the Indigenous Fijian diet were rice, fresh meat, biscuit, ata (wheat flour)
and white flour and sugar.
The main staples and sources of protein in the diet for IndoFijians were rice and
pulses, Irish or white potatoes, eggplants and green beans, which constituted 51% of
the total daily energy and 59% of the daily intake of protein in an adult Indian diet.
An adult Indigenous Fijian consumed about 54% more food than an adult IndoFijian.
Food like fish and seafood, which were once part of a traditional Indigenous Fijian
diet, were now the most expensive items, whereas the most expensive items for
IndoFijians were purchased food such as the pulses, Irish or white potatoes, ata
(wholemeal flour) and white flour and fresh meat. IndoFijians depended more on
subsistence farming to supplement their diet, whereas Indigenous Fijians tended to
rely on more food purchased from stores than subsistence farming.
In 1982, the first NNS [171] reported that the traditional staple foods most frequently
consumed by Indigenous Fijians were cassava, dalo (taro) and rice, sugar and
coconut cream (lolo). The most frequently consumed proteins were fresh and canned
fish and milk, while rourou (taro leaf), bele and pawpaw were the most frequently
consumed vegetables and fruit. For IndoFijians, the staples that were most frequently
consumed were rice and roti, while milk and dhal were the most common sources of
protein. Vegetable curries were consumed frequently and were comprised of
vegetables to complement rice or roti. This survey found that both ethnic groups had
a low intake of fruit and vegetables (in particular, Indigenous Fijians), thus
suggesting a long-standing problem of low fruit and vegetables, which is an
important area to consider for health promotion even to this day.
By 1993, the NNS [18] showed some ‘borrowing’ of some traditional food items by
both ethnic groups. All Fijians purchased 79.9% of their daily food, while the rest
relied on their traditional root crops, green leafy vegetables and local fruit. The most
recent NNS in 2004 showed further shifts in the Indigenous Fijian diet, away from
traditional sources to more imported and processed food items. While traditional
staples were still an important source of energy, cereal products such as bread and
flour products, rice and roti were providing significant amounts of energy, with 34%,
13.9% and 7.7%, respectively [17]. There had, therefore, been a drastic shift from a
30
more traditional diet in the 1980s to a more westernised diet high in processed food,
fat and sugar and low fibre in the space of 10 years. Low consumption of fruit and
green leafy vegetables (among Indigenous Fijians) remained a continuation of
traditional dietary patterns [172].
Table 2.1 summarises the changes in the food and diet of Indigenous Fijians and
IndoFijians from the 1850s to the present, based on accessible literature and survey
reports. There has been a drastic change in composition of the Indigenous Fijian diet
(lesser for IndoFijians) in the last decade, with a shift from a traditional diet high in
complex carbohydrates and low in fat to a more ‘Westernised’ diet that is less
nutritious, with more refined foods that has less fibre and is high in fat and sugar.
As demonstrated in this overview of the literature on diets in Fiji, there have been
substantial changes in diets that correlate with the increasing prevalence of
overweight and obesity and associated NCDs in Fiji [17, 18, 171]. While poor
dietary pattern is an important contributor to obesity development, the
interrelationship between food intake and energy expended is complex because there
are multiple factors such as genetics, historical changes, socioeconomics, policy and
sociocultural factors. The level of complexity of these factors has been well
documented [17, 18, 138, 171, 173]. While acknowledging the important roles of
genetics, historical changes, socioeconomics and policy, the next part of this
literature review focuses on sociocultural factors: in particular, social structure,
beliefs, values and attitudes and their influence on the eating patterns of Indigenous
Fijians and IndoFijians.
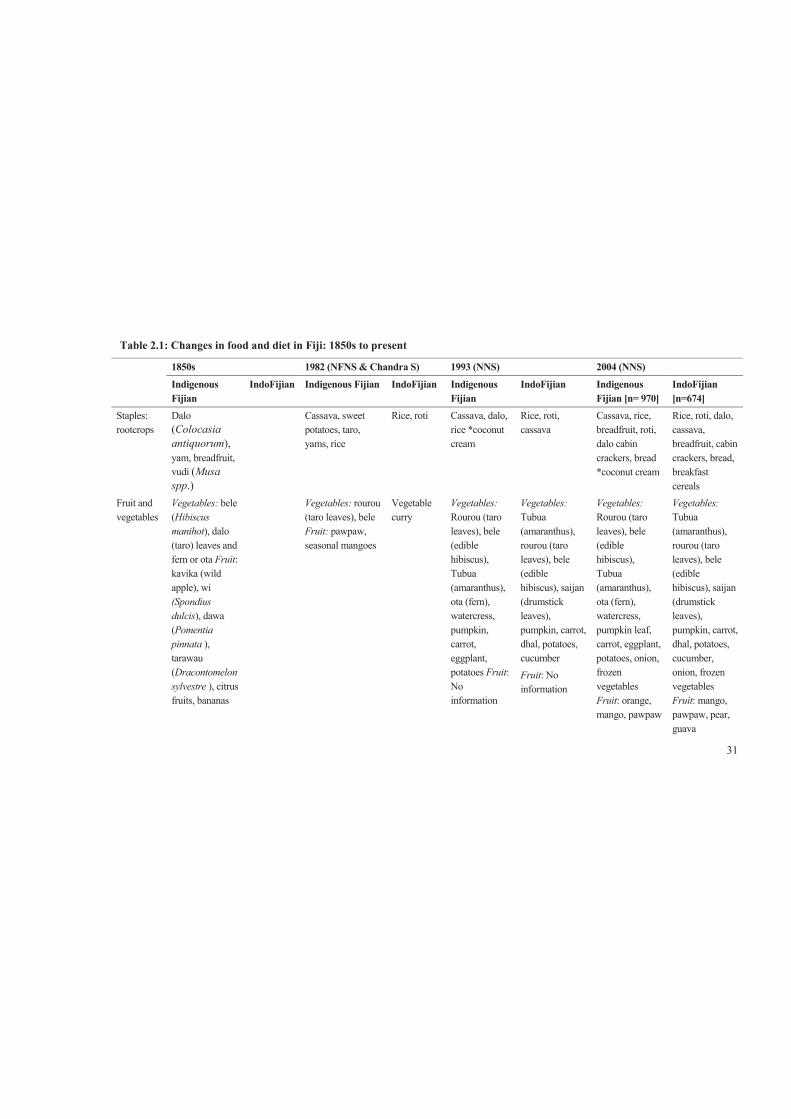
31
Table 2.1: Changes in food and diet in Fiji: 1850s to present
1850s 1982 (NFNS & Chandra S) 1993 (NNS) 2004 (NNS)
Indigenous Fijian
IndoFijian Indigenous Fijian IndoFijian Indigenous Fijian
IndoFijian Indigenous Fijian [n= 970]
IndoFijian [n=674]
Staples: rootcrops
Dalo (Colocasia antiquorum), yam, breadfruit, vudi (Musa spp.)
Cassava, sweet potatoes, taro, yams, rice
Rice, roti Cassava, dalo, rice *coconut cream
Rice, roti, cassava
Cassava, rice, breadfruit, roti, dalo cabin crackers, bread *coconut cream
Rice, roti, dalo, cassava, breadfruit, cabin crackers, bread, breakfast cereals
Fruit and vegetables
Vegetables: bele (Hibiscus manihot), dalo (taro) leaves and fern or ota Fruit: kavika (wild apple), wi (Spondius dulcis), dawa (Pomentia pinnata ), tarawau (Dracontomelon sylvestre ), citrus fruits, bananas
Vegetables: rourou (taro leaves), bele Fruit: pawpaw, seasonal mangoes
Vegetable curry
Vegetables: Rourou (taro leaves), bele (edible hibiscus), Tubua (amaranthus), ota (fern), watercress, pumpkin, carrot, eggplant, potatoes Fruit: No information
Vegetables: Tubua (amaranthus), rourou (taro leaves), bele (edible hibiscus), saijan (drumstick leaves), pumpkin, carrot, dhal, potatoes, cucumber Fruit: No information
Vegetables: Rourou (taro leaves), bele (edible hibiscus), Tubua (amaranthus), ota (fern), watercress, pumpkin leaf, carrot, eggplant, potatoes, onion, frozen vegetables Fruit: orange, mango, pawpaw
Vegetables: Tubua (amaranthus), rourou (taro leaves), bele (edible hibiscus), saijan (drumstick leaves), pumpkin, carrot, dhal, potatoes, cucumber, onion, frozen vegetables Fruit: mango, pawpaw, pear, guava
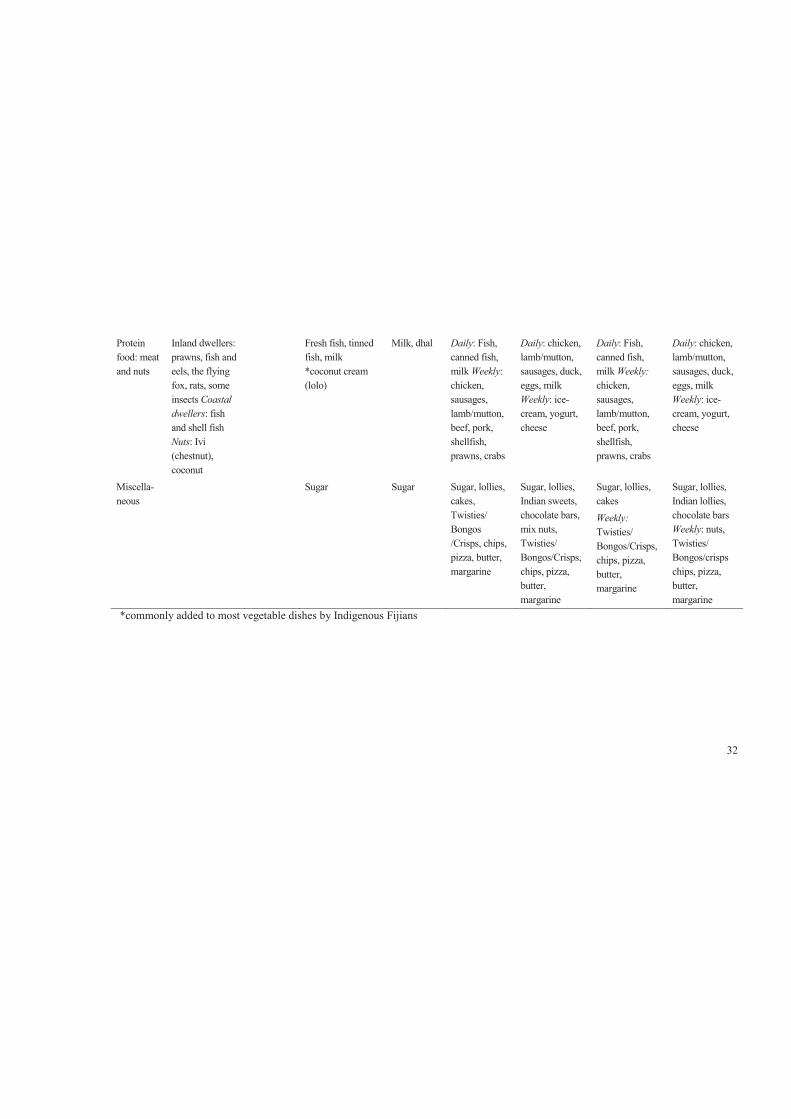
32
Protein food: meat and nuts
Inland dwellers: prawns, fish and eels, the flying fox, rats, some insects Coastal dwellers: fish and shell fish Nuts: Ivi (chestnut), coconut
Fresh fish, tinned fish, milk *coconut cream (lolo)
Milk, dhal Daily: Fish, canned fish, milk Weekly: chicken, sausages, lamb/mutton, beef, pork, shellfish, prawns, crabs
Daily: chicken, lamb/mutton, sausages, duck, eggs, milk Weekly: ice-cream, yogurt, cheese
Daily: Fish, canned fish, milk Weekly: chicken, sausages, lamb/mutton, beef, pork, shellfish, prawns, crabs
Daily: chicken, lamb/mutton, sausages, duck, eggs, milk Weekly: ice-cream, yogurt, cheese
Miscella-neous
Sugar Sugar Sugar, lollies, cakes, Twisties/ Bongos /Crisps, chips, pizza, butter, margarine
Sugar, lollies, Indian sweets, chocolate bars, mix nuts, Twisties/ Bongos/Crisps, chips, pizza, butter, margarine
Sugar, lollies, cakes Weekly: Twisties/ Bongos/Crisps, chips, pizza, butter, margarine
Sugar, lollies, Indian lollies, chocolate bars Weekly: nuts, Twisties/ Bongos/crisps chips, pizza, butter, margarine
*commonly added to most vegetable dishes by Indigenous Fijians
33
C H A P T E R 3
Literature Review—Part Two
3.1 Sociocultural factors influencing dietary patterns
Sociocultural influences on diet have until recently held little interest for many
researchers, especially in the Pacific region, despite society and culture playing an
integral role in shaping individuals’ food-related behaviours. This chapter discusses
sociocultural aspects, specifically social structure, values, beliefs and attitudes and
their possible role in dietary patterns, changes in diet and increasing obesity rates. In
order to contextualise sociocultural factors, further geographical, historical and
demographic information about the two largest cultural groups in the Fiji Islands is
provided. Evidence from Fiji on the links between sociocultural factors and dietary
determinants of obesity are presented.
There is a growing body of literature [161, 174-177] that indicates that the
sociocultural background of a person or group(s) has an enormous effect on dietary
patterns operating through the cuisine and food traditions of a group(s) the person
belongs to. Most Pacific Islands cultures have more collective world views than
Western cultures, which are more individualistic. In this sense, the family rather than
the individual is the most basic unit for most Pacific Islands culture. A review of
literature from the Pacific Islands suggests that sociocultural environment is a major
contributor to the poor diets that has led to the obesity epidemic in the region [161,
178], where traditional food events such as festive and special gatherings are widely
accepted. As a definition, sociocultural factors ‘include the way a cultural group is
organised, the dominant ethos or world view and key values, ideas and expectations
of group members’ [161] p379). Sociocultural factors influence the actions of an
individual, in this case, their eating patterns.
In any society where the prevalence of obesity is high, factors that underpin actions,
such as eating patterns, need exploration. Sociocultural factors have been
investigated in relation to their influence on dietary patterns [161]; however, the level
of investigation into sociocultural determinants of dietary patterns has been trivial
compared to genetic and metabolic determinants. These factors can be classified into
34
groups: social structure, values, beliefs and attitudes [179, 180]. However, before
discussing individual sociocultural factors and how each affects dietary patterns, a
brief discussion of culture itself is presented.
3.2 Definition of culture
The role of culture in dietary practices and obesity is complex and still largely under-
explored. There is a need for a proper review and understanding of the effect of
culture on a cultural group’s dietary practices and how culture relates to the problem
of obesity worldwide and especially in regions like the Pacific Islands where the
level of obesity is far greater than would be expected from the level of economic
development and national income, and where culture has a strong influence on eating
patterns.
There are many different social conceptualisations of ‘culture’ [181-183]. Many
definitions have been rejected because they were either vague or did not capture the
essential elements of human behaviour [184]. In the context of this doctoral thesis, a
social anthropological view is employed because this discipline examines culture
within a social group rather than at an individual level and how this affects
behavioural patterns, in this case, food-related practices.
Lawson [185] (p78,) described culture ‘as an abstract concept and is therefore a
heuristic device—a way of thinking about organising facts—whose meaning is
grasped best by examining the way it is used’. Leach in Helman [186](p9) provided a
definition of culture that highlighted the complexity of this concept: ‘Culture or
civilization is that complex whole which includes knowledge, beliefs, art, morals,
law, custom and any other capabilities and habits acquired by man as a member of
society’. This definition takes into account language and religious practices. Helman
in O’Hagan [187](p270) defined culture as ‘a set of guidelines (both explicit and
implicit), which individuals inherit as members of a particular society and which tell
them how to view the world, how to experience it emotionally and how to behave in
it in relation to other people, to supernatural forces or Gods and to the natural
environment’. Keesing [181] described culture as a ‘learned, accumulated
experience, to socially transmitted patterns of behaviour of a particular social group’.
In this sense, it encapsulates a cultural group gathering experiences from their
35
sociocultural and ecological environment and expressing these in behavioural
patterns, both every day and on special occasions.
Another component of culture is manifested through the structure and system of a
cultural group. Hofstede [188] defined culture as ‘the collective programming of the
mind which distinguishes the member of one group or category of people from
another’. Hofstede expanded the concept of ‘collective programming’ by suggesting
that culture could, therefore, be situated between human nature, which is not
programmed, nor programmable on the one side—and the individual’s personality on
the other side. This idea of culture in the individual or group is particularly useful for
explaining the concept of culture on the one side—as well as allowing for the
diversity of individual personalities and practices within any one cultural group.
Sewell [189] defined culture as a ‘concrete or bounded world of beliefs and
practices’. He argued that culture was dialectical, in that it had both structural as well
as practice elements and these two elements were always interacting with each other.
In this sense, culture remains both a structure and a system [183], but it is ‘modified
in its effect by the contradictory, contested and constantly changing ways in which it
was implemented in practice’[189] (p54).
For the focus of this review of sociocultural factors, a social anthropological point of
view is favoured, based on the notion that for all societies, it is through its culture
that values, beliefs and concepts are developed. While there are also various
definitions within social anthropology with regard to the term ‘culture’, Brown in
Tupoulahi [190](p42) had the best definition for this current study, referring to
culture as ‘those … learned patterns of behaviour and belief characteristics of a
social group’. As clearly stated by Tupoulahi [190], who expands on Lawson [182],
these beliefs and associated patterns of behaviour are often learned during childhood
when adults pass on ‘obvious’ or taken for granted knowledge and behavioural
patterns to their offspring, ‘as such, cultural values and beliefs are largely
unconscious factors in the motivation of individual behaviours’. The four cultural
constructs that are of interest to this thesis are social structure, values, beliefs and
attitudes and the following section will expand on each of them.
36
3.3 Social structure (rank and status)
Social structure relates to the ‘way that a cultural group is structured or organised
and both reflects and perpetuates the relative status of individuals within that group’
[161](p379). For example, the distribution of food may be determined by the way a
group is organised (e.g. males having high-status foods). Unlike rank, which is
‘relatively fixed at birth’, status is context-dependent and determined by a number of
intersecting variables ‘such as sex, seniority, life-stage, education level, employment
and wealth status’ [151] ( p379).
The principles of rank incorporate notions of sex, age, birth order and rank through
marriage. Often brothers have a higher rank than sisters and an older brother
outranks a younger one in a patriarchal society. In the case where there are two
siblings of the same sex, seniority determines the rank [190]. This principle was used
widely in determining chieftainship or rulers in certain societies. The concept of
status is determined by variables including sex, seniority and individual
achievements [161, 191, 192]. It is important to examine social structure, rank and
relative status because they determine access to and ideas about food and eating
patterns [179]. The research questions for this thesis relate to adolescents’ weekday
eating patterns outside the home; therefore, status is more relevant than rank.
Social structure gives rise to the expected role(s) of individuals within certain
cultural groups. Role expectations refer to ‘expected behaviours’ or norms that are
expected of an individual [161]. The examination of role expectations in relation to
patterns of eating is important because these are expectations related to food
practices; for example, care-giving roles that include the provision of food for
children. Role expectations in a Fijian society are further discussed in section 3.8.1.
The constructs of culture-specific values, beliefs and attitudes originated in the study
of human behaviour are discussed below as they are important sociocultural
influences on food and eating practices.
3.4 Values
The terms values and beliefs are often used interchangeably; however, it is important
to differentiate them in order to better understand their influence on dietary
behaviour. A review of the existing literature indicates that the concept of value is a
37
subject of interest in disciplines such as social psychology, anthropology, education,
sociology and history (reference). A cultural value underpins the way that culture is
manifested. Historically, the idea of value originated from an economics perspective
of ‘price’, which indicates the amount of money one is willing to exchange for a
specific item. Value is an indicator of how much one desires or wants something.
According to Homan in Palispis [193] (p28) a value refers to ‘that which is
considered desirable, which is thought worthy of pursuing, regardless of whether or
not it is actually being pursued’. In this sense, a value is prized by individuals or a
society and determines what is chosen. Hofstede [188](p7) postulated that values
represent a deeper manifestation of culture compared to more superficial symbols.
Raths [194] defined the process of valuing according to seven aspects and divided
them into three categories, as displayed in Table 3.1. In the category of choosing, an
individual is able to choose freely from alternatives after considering the
consequences of his/her choices. Important to this valuing process is the fact that
choices individuals make are part of life and acted on publicly as the individual is
happy with the choices because it enhances emotion and spiritual development of the
individual.
Andreas [195] proposed seven questions to clarify that a person’s view is valued (see
Table 3.2). These questions portray values as important priorities that individuals act
on in order to enhance not only their daily life, but those of others surrounding them
[193]. In this sense, an individual’s daily life and practices are motivated and guided
by their values.
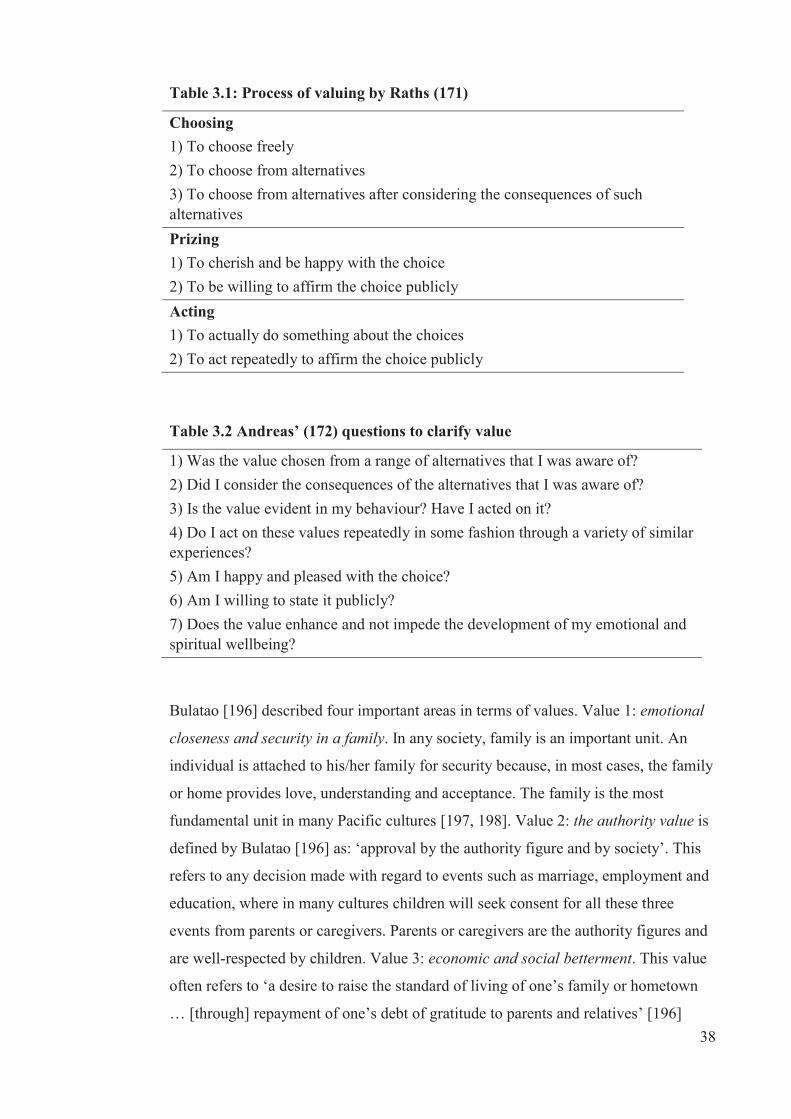
38
Table 3.1: Process of valuing by Raths (171)
Choosing 1) To choose freely 2) To choose from alternatives 3) To choose from alternatives after considering the consequences of such alternatives Prizing 1) To cherish and be happy with the choice 2) To be willing to affirm the choice publicly Acting 1) To actually do something about the choices 2) To act repeatedly to affirm the choice publicly
Table 3.2 Andreas’ (172) questions to clarify value
1) Was the value chosen from a range of alternatives that I was aware of? 2) Did I consider the consequences of the alternatives that I was aware of? 3) Is the value evident in my behaviour? Have I acted on it? 4) Do I act on these values repeatedly in some fashion through a variety of similar experiences? 5) Am I happy and pleased with the choice? 6) Am I willing to state it publicly? 7) Does the value enhance and not impede the development of my emotional and spiritual wellbeing?
Bulatao [196] described four important areas in terms of values. Value 1: emotional
closeness and security in a family. In any society, family is an important unit. An
individual is attached to his/her family for security because, in most cases, the family
or home provides love, understanding and acceptance. The family is the most
fundamental unit in many Pacific cultures [197, 198]. Value 2: the authority value is
defined by Bulatao [196] as: ‘approval by the authority figure and by society’. This
refers to any decision made with regard to events such as marriage, employment and
education, where in many cultures children will seek consent for all these three
events from parents or caregivers. Parents or caregivers are the authority figures and
are well-respected by children. Value 3: economic and social betterment. This value
often refers to ‘a desire to raise the standard of living of one’s family or hometown
… [through] repayment of one’s debt of gratitude to parents and relatives’ [196]
39
p31). Value four is patience, suffering and endurance. This value refers to the
spiritual aspect of life. It is associated with religious beliefs, such that a higher power
is called upon when other means fail.
In the Pacific Islands cultures, including Indigenous Fijian, the values of respect,
love and cooperation are important [191]. Values are played out in food-related
activities. Values are attached from its production to consumption. For example,
Becker suggested that the concept of respect is reflected in the act of offering food or
other goods and services to the recipient [162]. Becker also described how, in one
part of Fiji, Indigenous Fijian food providers would at times deprive themselves of
food in order to offer food to others and thus establish cooperation through mutual
respect [162].
Becker (176) also described how, in Fiji, food providers would at times deprive
themselves of food in order to establish cooperation through mutual respect. For
instance, it is a custom to offer visitors food if they arrive during a meal, even if it
means that there is not enough for the hosts. Becker suggested that it is through this
respect and cooperation that the value of love is also expressed. For instance, among
the Indigenous Fijian community that Becker studied, love is expressed through care
giving, which is demonstrated in part by providing food or goods and services.
Values are reflected in eating patterns; for example, foods such as root crops in
particular dalo (taro) and pork are seen as prestigious foods and used widely,
especially in special gatherings [161]. The Fijian values in terms of food behaviour
are discussed fully in section 3.8.
3.5 Beliefs
The concepts of belief and attitude were differentiated by investigators in the 1960s
and 1970s, which undoubtedly led to some of the confusion and ambiguity
surrounding the concept today [199-202]. A literature review of the concept of
beliefs presented in this section is followed by a section on attitudes.
Historically, Aristotle, in Underwood [203], distinguished beliefs from knowledge by
defining belief as ‘justified belief’ and as something ‘which can be true or false even
though held to be true by the subject’. Belief involves cognitive functions because it
encompasses knowledge, opinions, beliefs and thoughts in general. Probably the
40
clearest definition of belief is offered by Fishbein and Ajzen [202], who stated that
beliefs are the ‘the subjective associations between any two discriminable concepts’.
There are two types of beliefs described by Underwood [203], namely personal
beliefs and common beliefs. Personal beliefs are formed by individuals and not
shared with others because they relate to an individual’s mental processes, structures
and products [204]. Further, Underwood [203] highlighted that such a perspective of
beliefs is ‘based on the assumption that mental and cognitive processes are essential
to our understanding of human responses, whether those responses are social or non-
social in nature’. Common beliefs, conversely, are held by more than one individual,
which could include a group or a whole community [203]. It is through the
communication of shared or common beliefs that the social practices are expressed;
this includes eating patterns, the subject of this thesis. In this sense, shared beliefs
also have a significant role in the social structure of any culture and, in return, social
structure also influences beliefs. Unlike values, beliefs may change according to the
cultural norms.
3.6 Attitudes
Similar to beliefs, there are numerous definitions of the term attitude [205-207]. A
large contribution to the work related to attitude was Fishbein’s expected-value
model in 1963 [208]. This model conceptualised attitudes as the function of beliefs
and proposed that those attitudes can be evaluated from particular beliefs. Further,
Rokeach [209](p112) offered a definition of an attitude as ‘a relatively enduring
organisation of beliefs around an object or situation predisposing one to respond in
one preferential manner’.
Given these views about attitudes, probably the clearest definition of ‘attitude’ is
offered by Fishbein and Ajzen [202] (p222) who state that ‘a person’s attitude is a
function of his salient beliefs at a given point in time’. Fishbein and Ajzen developed
a conceptual framework on the relationship between beliefs and attitudes and
suggested that beliefs provide the basis for the formation of attitudes towards that
object or issue [202]. Moreover, in their work, Fishbein and Ajzen proposed that
attitudes can be measured by assessing one’s beliefs. An explicit conceptual
description of attitude, which is well-suited for the purpose of this study, is a ‘learnt
predisposition to respond in a consistently favourable or unfavourable manner with
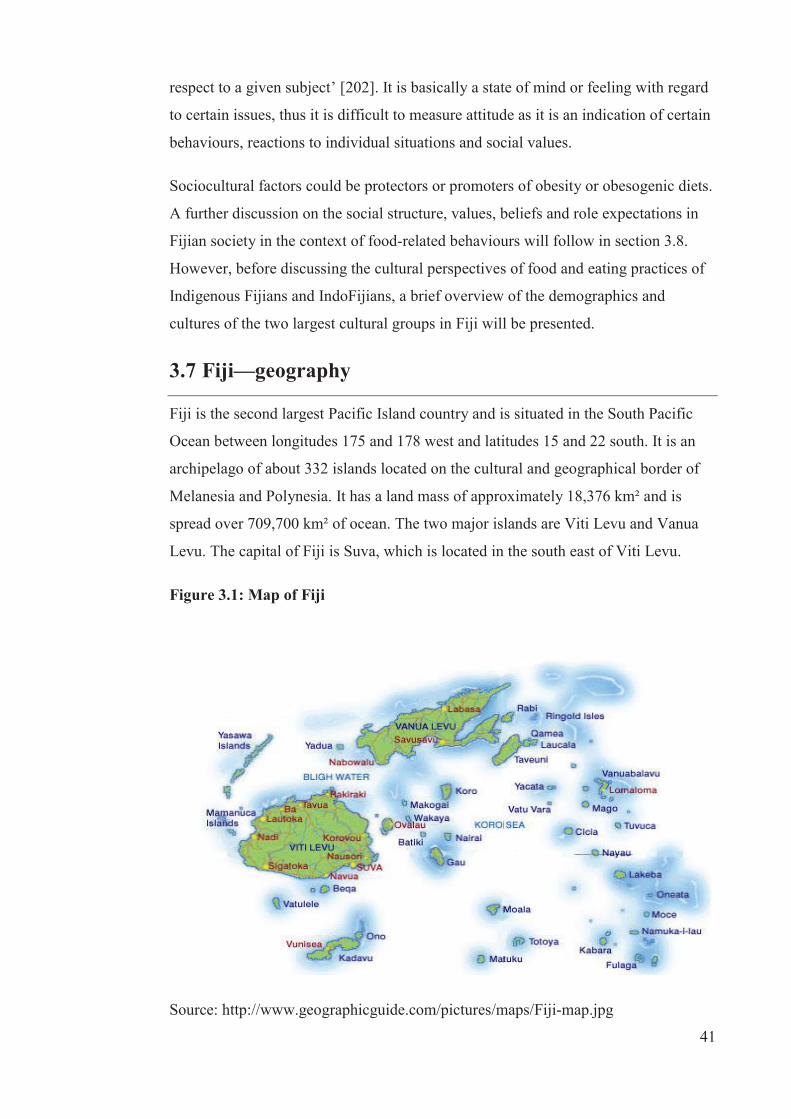
41
respect to a given subject’ [202]. It is basically a state of mind or feeling with regard
to certain issues, thus it is difficult to measure attitude as it is an indication of certain
behaviours, reactions to individual situations and social values.
Sociocultural factors could be protectors or promoters of obesity or obesogenic diets.
A further discussion on the social structure, values, beliefs and role expectations in
Fijian society in the context of food-related behaviours will follow in section 3.8.
However, before discussing the cultural perspectives of food and eating practices of
Indigenous Fijians and IndoFijians, a brief overview of the demographics and
cultures of the two largest cultural groups in Fiji will be presented.
3.7 Fiji—geography
Fiji is the second largest Pacific Island country and is situated in the South Pacific
Ocean between longitudes 175 and 178 west and latitudes 15 and 22 south. It is an
archipelago of about 332 islands located on the cultural and geographical border of
Melanesia and Polynesia. It has a land mass of approximately 18,376 km² and is
spread over 709,700 km² of ocean. The two major islands are Viti Levu and Vanua
Levu. The capital of Fiji is Suva, which is located in the south east of Viti Levu.
Figure 3.1: Map of Fiji
Source: http://www.geographicguide.com/pictures/maps/Fiji-map.jpg
42
3.7.1 Population
The population of Fiji in 2007 was 837,271, with 424,846 people in urban areas and
412,425 in rural areas [210]. Of the total population, 475,739 were Indigenous
Fijians and 313,798 were IndoFijians; the remaining 47,734 were classified as ‘other’
ethnic groups [210]. Indigenous Fijians refers to the native Melanesian/Polynesian
inhabitants of Fiji [211] and IndoFijians refers to Fijians whose ancestors came from
various parts of India and South East Asia, mostly as indentured labourers between
1879 and 1916, but also as free immigrants around the 1920s [212, 213]. These are
the definitions used in census surveys in Fiji [210].
The population in Fiji is relatively young, with 48% under 25 years of age in 2007.
Of interest to this thesis, about 19% of the total population were adolescents between
the ages of 10 to 19 years, with a slightly higher percentage of males (51%) than
females (49%). The crude birth rate per 1000 population for Indigenous Fijians in
2007 was 23.7 and 15.9 for IndoFijians [214], suggesting there will be more
Indigenous Fijian children and adolescents in the future than IndoFijians. There has
been increasing urbanisation in Fiji, with the extension of many town boundaries. By
2007, the time when the data for studies one and two were collected, internal
migration resulted in about 51% of the population residing in urban areas compared
to about 46% in 1996 [210].
3.7.2 Economic situation
There has been considerable improvement in Fiji’s economy since the 1970s when
the economy was driven by the sugar and tourism industries and agricultural produce
such as rice, copra and dairy. Respective governments have developed strategies to
support further growth of rice and sugar and invested in the infrastructure to optimise
economic growth. However, the 1987, 2000 and 2006 coups disrupted the positive
economic growth. According to Prasad [215], there was a progressive reduction in
growth from 5.5 to 0.8% between the 1980s and 2010, with a slight increase in 2011.
Despite natural disasters in 2012 and 2013, as of April 2013, the future outlook for
economic growth in Fiji is positive, with a 1.7% increase forecast for 2013, due
primarily to growth in the construction, mining and tourism sectors, leading to
economic growth in the country [216]. There has also been an increase in the total
household income. The Fiji Bureau of Statistics Household and Income Expenditure
43
Survey 2008 to 2009 [217] reported that total household income has increased by
28% per capita between 2002 and 2008. However, the increase in household income
was confined to urban areas where there was a 59% increase compared to a decline
in 11% for rural areas. This increase in total household income suggests that
households, in particular urban households, have increased financial capabilities to
purchase food. While economic challenges remain, there is hope for further
economic growth in the near future.
The changing political and economic situation in the Pacific Islands has contributed
to societal changes that have impacted on the way of life, including food supply and
practice. Efforts such as free trade and foreign direct investment [218, 219] have
caused Pacific Island countries signing up to unforeseen ventures which has health
implications [220, 221]. Trade liberalisation, an effort to improve and strengthen
global trade, has opened up a flow of not only essential goods and services but
obesogenic food and drinks into Pacific Islands, resulting in change towards
unhealthy dietary patterns [222, 223]. Likewise, foreign direct investments have in
some cases help to establish huge manufacturing plants or industries in some Pacific
Islands and manufacture goods, including unhealthy food and drinks.
Political instability in the region is an important contributor to poor economic
development, and can contribute to poor policy development processes or even lack
of policy related to food environments (e.g. trade). Equally important is the lack of
effective monitoring of such policies in the region if there is any.
Economic and political stability are important for good development in the Pacific
region. In addition, cultural factors are strong and influential in the Pacific, although
a gradual change is occurring over time to embrace the changing economic and
political situations. These changes are critical for adolescents in the Pacific as they
are responsive to environment changes [30].
3.8 Food and eating patterns in a cultural context
Food plays a significant role in culture of most Pacific Island countries [190, 191].
Apart from its physiological function to satisfy hunger and thirst, food and eating are
perhaps the most essential activities of all human activities [224]. The presentation of
food and drink is often central to social gatherings, which in turn demonstrate
44
wellbeing and good relationship between the giver and the recipient. “In most Pacific
Islands, food has significant cultural categories that state their importance, use and
provision whether at daily meals or gatherings or offering to guests. It has always
been associated with power and wellbeing. This strong and hierarchical nature of the
importance of food in these societies, particularly in Polynesia are well protected by
cultural expectations and roles [225]. Among Indigenous Fijians, beliefs, values and
attitudes relating to food are substantial and reflected in all food-related practices,
including food production, sharing and consumption. However, in Fiji there are two
diverse ethnic groups who have differing cultures and associated values, beliefs and
attitudes; thus it is important to review them separately.
3.8.1 Sociocultural influences and dietary practices among
Indigenous Fijians
Fiji practices a communal system where family is the centre of all daily activities,
including food and eating activities. Ravuvu [191], in his writing on a ‘Fijian
Cultural Perspective on Food’, presented a description of how in the traditional Fijian
culture the various tasks of food production were allocated according to sex and
seniority. Male children were expected to observe their father and learn skills and
knowledge about food production and females were expected to stay close to their
mothers and observe what females were expected to do. Males were taught to be
strong and manly because they were expected to do difficult and strength demanding
activities. For instance, males were required to hunt and also plant a garden, whereas
females would do less strenuous physical activities, including tending and gathering
foods from the garden or gathering greens from the nearby bush or gathering shells
from nearby streams. However, much of females’ work was related to home
activities, but males, for instance, prepared meals (e.g., lovo or food prepared using
an earth oven) and making sure that there was a surplus available in case of
unexpected visitors.
Meals were always shared by women at home to make sure that every member of the
family had enough according to their status in the home (sex and seniority). The only
exception was during ceremonies, when males would be involved in sharing large
amount of foods either cooked or raw or live (for pigs and cows), known traditionally
as magiti. On special occasions, staples or root crops such as yam and dalo (taro)
[166] and protein-rich foods such as pork [161] were highly valued and were
45
produced in large amounts for ceremonial feastings or gatherings [161, 179, 226].
While such food practices are still evident in Fiji, in the last decade imported foods
have also become more accessible and in some cases more highly valued in many
Pacific Islands, including Fiji [161, 191]. For example, mutton flaps, tinned corned
beef, flour-based foods, sweets (including sugar) and highly sweetened drinks and
salty snacks became more readily available [134, 161].
The access to and distribution of food in Indigenous Fijian culture was determined by
rank and status of an individual such as sex, seniority and life-stage [161, 191]. For
example, elderly males were more likely to consume more of the highly valued foods
in greater quantities than females of their age, and younger people [161, 226],
including children and adolescents. Life stages also determine the type and the
amount for an individual. For example, women were provided with more food during
pregnancy and breastfeeding periods [161]. Such differences in food access and
distribution of food according to sex and life-stage are important aspects of dietary
practices of Indigenous Fijians.
Over time certain distinctive cultural food practices has been protected against
change, although the impact of social changes due to globalisation has brought in
negative impacts in Fiji. These resulted in changing food practices especially among
Indigenous Fijian adolescents who are responsive to environment changes such as
dietary patterns.
3.8.2 Sociocultural Influences and dietary practices among
IndoFijians
This section draws on limited literature on the influence of sociocultural factors on
IndoFijians’ dietary patterns as well as on studies of culture that have examined
sociocultural factors influencing the food practices of Indians born outside of Fiji.
Many IndoFijians are primarily descendants of indentured labourers who arrived in
Fiji in the 1870s, although there were subsequent migrations of Indians from Gujarat
and family members of earlier migrants. IndoFijian culture is more individualistic
compared to Indigenous Fijians, but there is a strong network for organising mass
social gatherings and celebrations, whether it be family events (weddings, prayer
meetings, house warming) or mass celebrations for the Festival of Lights (Diwali)
and Festival of Colours (Holi) [227].
46
Like Indians who have migrated to other countries, IndoFijians have attempted to
maintain their identity and culture in their new homeland. This has been found of
Indian communities elsewhere. For example, Lakha and Stevenson 2001 [228]
reported that despite living in a diverse multi-cultural society such as Melbourne,
food and language were two important aspects of culture that establish the cohesion
and sense of belonging for Melbourne-based Indians. Further, food in Indian culture
is associated with sets of meanings connected to religious beliefs and is expressed in
every day rituals as well as special occasions. For example, among Muslim Indians
in Melbourne, a rich dish of meat and rice called biryani is usually served during the
religious event called Eid, as well as during wedding celebrations. Similarly, Indian
sweets are usually distributed to family and friends during joyous occasions such as
weddings and the birth of a child [228].
Social functions are rather more than social gatherings, as they are also associated
with a display of the culinary skills of the preparers, usually the wife, while the
quantity and quality of food conveys status of the household [228]. The household
income also indicates status of household and food-purchasing capabilities. A study
by Neil [229] indicated that urban high-embodied-capital households spent
significantly more money on weekly food purchases than urban low-embodied-
capital or rural households. This food spending, however, was mostly for processed
foods [229]. In addition, children with a higher BMI were also found mostly in
urban-embodied-capital households.
While cultural food likings and practices are still strong among IndoFijians, in the
last decade imported foods have also become more accessible in many Pacific
Islands, including Fiji [13]. For example, mutton flaps, tinned corned beef, flour-
based foods, sweets (including sugar) and highly sweetened drinks and salty snacks
became more readily available.
3.9 Body size perception
Sociocultural factors also influenced an individual’s and cultural group’s perception
on body image. Traditionally, in Polynesian and Micronesian societies large body
size is associated with high status, power and authority. It was also linked with
sexual attractiveness, lusty and high spirited individuals [230]. Fattening rituals were
practiced where young men and women from highly ranked family were fed
47
abundantly with prestigious food for a specific period of time purposely to become
fat. This has implication on body fat storage mechanism and the perception about
obesity. Although the ritual practices have ended, the large body size remains a
functional ideal in these Pacific societies. However, changes in the perception of
ideal body size is evident and associated with new ideal body size in modernising
societies. This has been documented by Craig et al. [231] and Brewis et al. [232]
among Cook Islanders and Samoans. The strong western influence on the ideal
body size has resulted in body dissatisfaction and weight loss attempts by these
Islanders. The pursuit of slimness could be seen as positive change towards healthy
weight, however, it may have cultural implications (e.g. their internal view of ideal
body size).
In Fiji, large body size is also associated with care, respect, particularly among
Indigenous Fijians [233]. These ideas are linked with traditional values that
emphasise a large body size and strong appetite. Other body ideals were also
identified with large body size in Fiji. For instance, big hips for women were
associated with enhanced reproduction and child bearing [234] while large leg and
calf muscles reflect increased ability to work and absence of laziness [234, 235, 330,
236].
However, values may be changing due to social transition. Becker [237] in 1998,
found that adolescent Fijian girls were vulnerable to social changes (i.e. television)
and begun to pay more attention to their weight and body size, purged to control
weight and criticised for their weight. Becker [238] also highlighted that adolescent
Fijian girls engaged in weight loss as a means of modelling themselves with
television characters thus exposing them to eating disorder. Body concerns were also
reported by adolescents and women in Fiji and has a strong link to acculturation
[239]. The OPIC study in 2006/08 found that obese individuals were dissatisfied
with their body size and were making attempts to lose weight [240]. Ricciardelli et
al. [241] reported that the pursuit of muscularity was a dominant theme and strategies
to achieve muscularity included eating more or less, eating healthy foods and various
kinds of exercise such as weight training activities.
However, there was an ethnic difference in the reasons for the pursuit of muscularity.
Indigenous Fijian male adolescents pursued muscularity for strength and fitness,
sporting performance, dominance and health, as well as the ability to do physical
48
work, while IndoFijian males indicated similar reasons, but did not indicate sport
performance and physical activity as attributes for muscularity [241]. Females’
perception of body image in the OPIC study found that those who were obese or
underweight in both ethnic groups were likely to be dissatisfied with their body size
and reported concerns about gaining weight or wanting to lose weight [242]. For
example, more overweight Indigenous Fijian females reported engaging in strategies
to lose weight than IndoFijian females.
49
C H A P T E R 4
Theoretical Frameworks, Concepts and
General Methods
4.1 Theoretical framework and concepts
The most important purposes of social science research is to explore, describe and
explain social phenomena [243, 244]. A number of theoretical concepts have been
developed by social scientists to explain behaviours in a social cultural and/or
ecological context. While there are numerous theoretical concepts, no one theory
dominates social research [245]; rather, the selection of theories is based on the
research questions. The aims of this doctoral research are to describe the dietary
patterns of adolescents in Fiji and how they relate to BMI-z, both cross-sectionally
and longitudinally (studies one and two), to understand sociocultural and
socioeconomic factors that might explain adolescents’ dietary patterns (study three)
and to promote behavioural changes in dietary patterns through developing
culturally, sex- and age-relevant messages that are delivered through the most
appropriate motivators (study four).
This chapter discusses the overall theories, context and methodology that form the
basis for this study. First, a critical review of models and frameworks is presented,
followed by a consideration of the socioecological framework (SEF) as an
overarching framework for this thesis. Second, a detailed discussion about the Pacific
OPIC project, in particular the Fiji component (HYHC), including its research design
and outcomes, are presented. The HYHC study was the source of the data utilised for
parts of this thesis. Third, a review of key methods on quantitative (studies one and
two) and qualitative (studies three and four) data collection and analyses will be
presented.
4.1.1 Socioecological framework (SEF)
The causal relationships between obesity and physiology, behavioural patterns and
the environment are extremely complex. ‘Environment’ refers to any event or
condition outside the individual that either influences or is influenced by the
50
individual, including social, cultural, economic, political and geographic factors [28].
A SEF has been selected as the overarching framework to offer explanations about
the dietary patterns of adolescents in Fiji. The SEF can be used to demonstrate
influences on dietary patterns and interrelating pathways (see Figure 4.1). The SEF
has been used to develop obesity-prevention strategies for children because it views
their behavioural patterns within the wider context of families, communities and
cultures, as well as taking into account socioeconomic and socio-political factors
(e.g., Caprio et al. [246] and Robinson [247]). The SEF conceptualises relationships
between dietary patterns and broader social environments [246, 248, 249]. In
essence, the SEF suggests that dietary patterns are influenced by environmental
factors, ranging from the most proximal interpersonal (families, culture) to the most
distal, which includes the policy environment and the media (see Figure 4.1). The
use of a SEF also allows a greater understanding of the role of sociocultural
influences on dietary patterns for adolescents in Fiji and the development of culture-,
sex- and age-appropriate messages that are likely to be effective.
The SEF used in this study draws from the work of Caprio et al. [246], who extended
and simplified Bronfenbrenner’s ecological model [248] and applied it to prevention
strategies to reduce childhood obesity .The SEF examines relationships between
individuals, behaviours and different components of their environments, which are
envisioned as a set of nested layers encompassing an individual. Each of these layers
are described by Blane, Brunner and Wilkinson [250] and Caprio et al. [246]. The
first layer is labelled as interpersonal and refers to the most proximal influences,
specifically family and the underpinning cultural factors. The second layer is
dedicated to organisational influences, such as schools, faith-based and other
community organisations. The third layer is the community or neighbourhood
influences, including the retail outlets for food, park and recreation and local media
exposure; for example, billboards. The fourth or most distal layer refers to more
public influences, including the media, food policy and regulations, government
economics and systems and laws pertaining to healthy food environments.
Many factors span more than one layer. One of the important features of the SEF is
that various layers are highly interactive. This means that the layers are ‘permeable’,
allowing feature(s) of one layer to interact with a feature of another layer. For
instance, schools, faith-based organisations (FBO) and community organisations are
51
interactive features of organisational and community layers. However, the direction
of influence is predominantly towards the target individuals or cultural group(s).
In the current thesis, the individuals are the adolescents from specific cultural groups
who were influenced by their immediate family members and sociocultural factors
such as values, beliefs and attitudes that influence eating practices and behaviours
within a cultural group. The school and community environments, in the second and
third layer of SEF, were also a focus area of investigation in this thesis, with an
examination of adolescents’ eating patterns at school (school canteens) and on the
way home (food retail outlets), respectively. Further, this research will likely identify
areas in public policy level (third and fourth layer of SEF) to get adolescents to
change their beliefs about certain behaviours—in this case, their dietary patterns.
While there are weaknesses related to the use of any behavioural framework or
model, the Caprio et al. [246] version is useful for this thesis because of its
explanatory function. Caprio et al. applied a SEF to childhood obesity and examined
obesity prevention among children in the context of their families, communities and
cultures, as well as environments of policy and practice. This SEF allows the
examination of the influence of sociocultural factors such as beliefs, values and
attitudes on adolescents’ dietary behaviours. In regards to this thesis, this is
specifically the ethnicity, sex, food-related spending, schools and sociocultural
factors that influence behaviours.
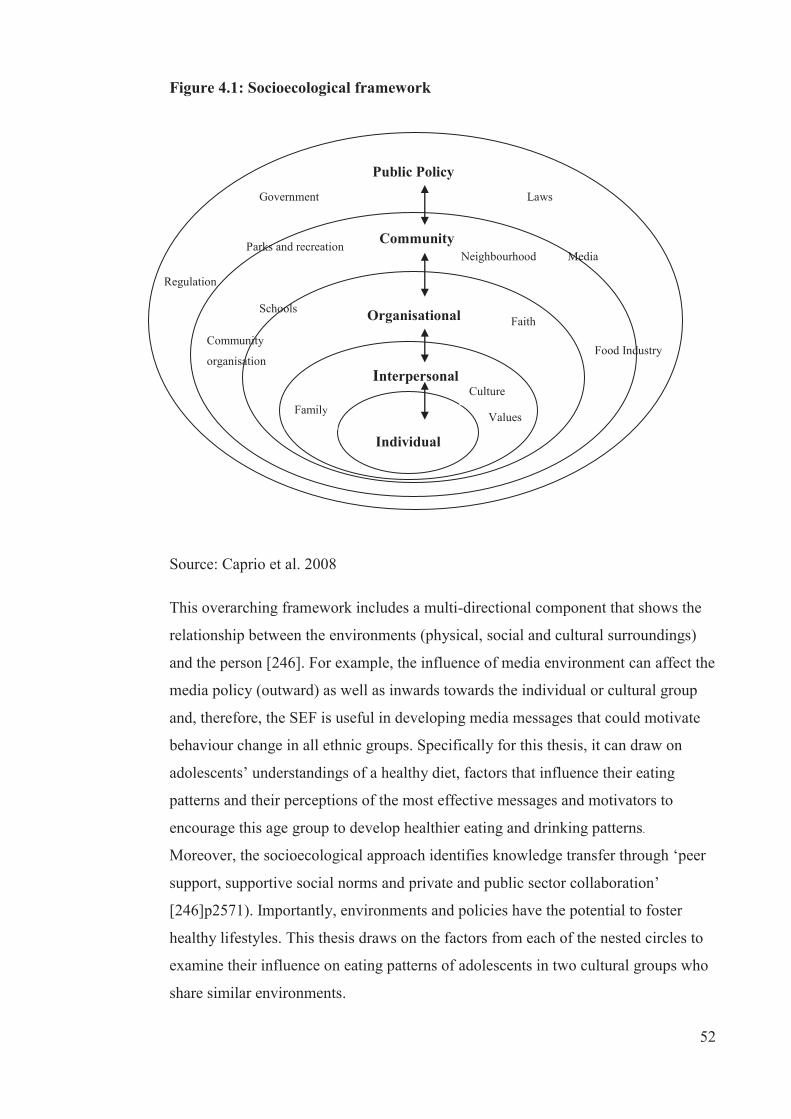
52
Figure 4.1: Socioecological framework
Source: Caprio et al. 2008
This overarching framework includes a multi-directional component that shows the
relationship between the environments (physical, social and cultural surroundings)
and the person [246]. For example, the influence of media environment can affect the
media policy (outward) as well as inwards towards the individual or cultural group
and, therefore, the SEF is useful in developing media messages that could motivate
behaviour change in all ethnic groups. Specifically for this thesis, it can draw on
adolescents’ understandings of a healthy diet, factors that influence their eating
patterns and their perceptions of the most effective messages and motivators to
encourage this age group to develop healthier eating and drinking patterns.
Moreover, the socioecological approach identifies knowledge transfer through ‘peer
support, supportive social norms and private and public sector collaboration’
[246]p2571). Importantly, environments and policies have the potential to foster
healthy lifestyles. This thesis draws on the factors from each of the nested circles to
examine their influence on eating patterns of adolescents in two cultural groups who
share similar environments.
Organisational
Interpersonal
Individual
Public Policy
Community
Family Values
Culture
Faith
Food Industry
Media
Laws Government
Parks and recreation
Regulation
Neighbourhood
Schools
Community
organisation
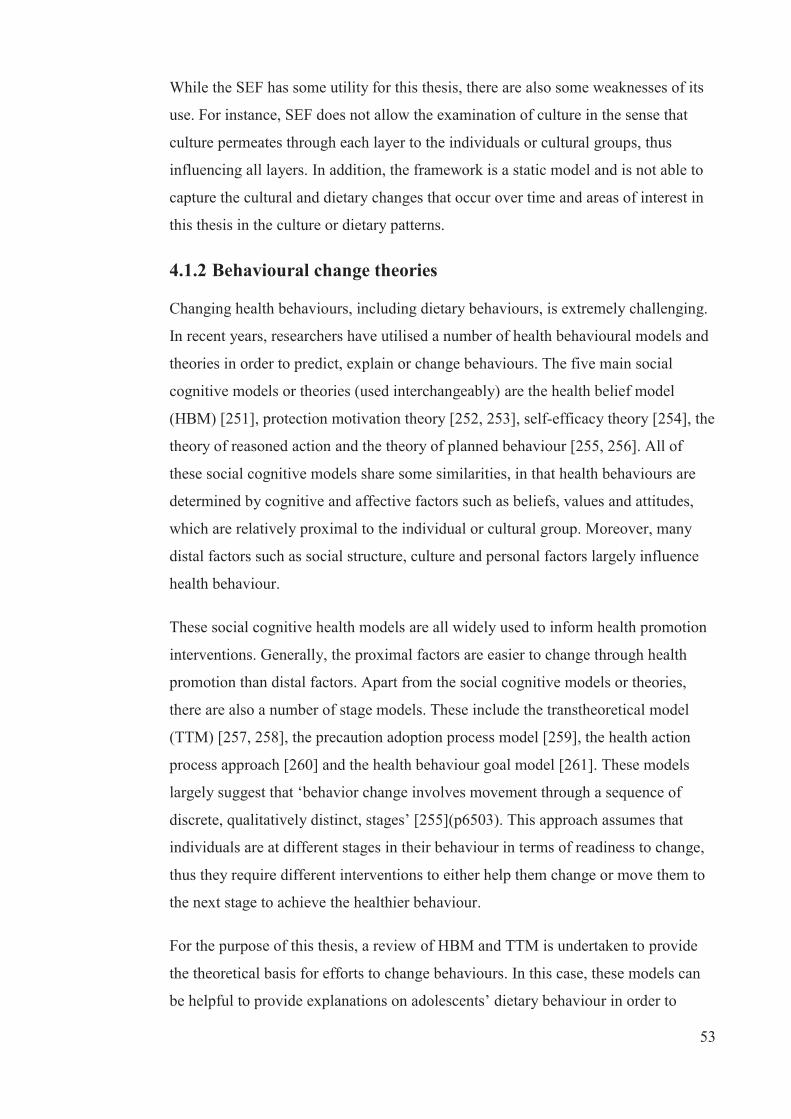
53
While the SEF has some utility for this thesis, there are also some weaknesses of its
use. For instance, SEF does not allow the examination of culture in the sense that
culture permeates through each layer to the individuals or cultural groups, thus
influencing all layers. In addition, the framework is a static model and is not able to
capture the cultural and dietary changes that occur over time and areas of interest in
this thesis in the culture or dietary patterns.
4.1.2 Behavioural change theories
Changing health behaviours, including dietary behaviours, is extremely challenging.
In recent years, researchers have utilised a number of health behavioural models and
theories in order to predict, explain or change behaviours. The five main social
cognitive models or theories (used interchangeably) are the health belief model
(HBM) [251], protection motivation theory [252, 253], self-efficacy theory [254], the
theory of reasoned action and the theory of planned behaviour [255, 256]. All of
these social cognitive models share some similarities, in that health behaviours are
determined by cognitive and affective factors such as beliefs, values and attitudes,
which are relatively proximal to the individual or cultural group. Moreover, many
distal factors such as social structure, culture and personal factors largely influence
health behaviour.
These social cognitive health models are all widely used to inform health promotion
interventions. Generally, the proximal factors are easier to change through health
promotion than distal factors. Apart from the social cognitive models or theories,
there are also a number of stage models. These include the transtheoretical model
(TTM) [257, 258], the precaution adoption process model [259], the health action
process approach [260] and the health behaviour goal model [261]. These models
largely suggest that ‘behavior change involves movement through a sequence of
discrete, qualitatively distinct, stages’ [255](p6503). This approach assumes that
individuals are at different stages in their behaviour in terms of readiness to change,
thus they require different interventions to either help them change or move them to
the next stage to achieve the healthier behaviour.
For the purpose of this thesis, a review of HBM and TTM is undertaken to provide
the theoretical basis for efforts to change behaviours. In this case, these models can
be helpful to provide explanations on adolescents’ dietary behaviour in order to
54
change them to a more healthy dietary behaviour. Also, their strengths and
weaknesses in relation to this study are discussed further.
The HBM was developed in the 1950s purposely to understand why some
individuals did not utilise health services such as immunisation and health screening
[251]. This approach is still commonly used in many studies, including social
support seeking for eating disordered individuals [262], developing diabetes
prevention programmes for youths in high-risk minority groups [263] and dietary
interventions [264]. As shown in Figure 4.2, there are four constructs of HBM,
namely susceptibility, severity, benefits and barriers. Each of these four constructs
were clearly defined by Sutton [255]:
Perceived susceptibility (or perceived vulnerability) is the individual’s
perceived risk of contracting the disease if he or she were to continue with the
current course of action. Perceived severity refers to the seriousness of the
disease and its consequences as perceived by the individual. Perceived benefits
refers to the perceived advantages of the alternative course of action, including
the extent to which it reduces the risk of the disease or the severity of its
consequences. Perceived barriers (or perceived costs) refers to the perceived
disadvantages of adopting the recommended action as well as perceived
obstacles that may prevent or hinder its successful performance.
The four constructs of HBM are useful when used together to explain an individual’s
willingness to perform the healthier behaviour. In this sense, it is assumed that an
individual possibly will change his or her health behaviour if there is either an
increase in their view of their susceptibility, severity, benefits and decrease barriers.
Relative to this current thesis, HBM is useful because it helps to explain why
adolescents are engaging in specific dietary behaviours. This thesis focuses on the
prevalence of overweight and obesity among adolescents and their high susceptibility
to obesity and obesity-related conditions such as NCDs. Also, part of this thesis
explores the benefits of and barriers to healthy dietary behaviours. However, there
are a few weaknesses of HBM in terms of its application to this thesis. First, it is
static and does not state the required actions that individuals need to take in order to
trigger the desired behaviour. Second, HBM might be a problem for adolescents and
how they perceive their susceptibility for and severity of the obesity and obesity-
related diseases. This might have implications for adolescents who have not
55
experienced the severity of obesity-related diseases. Another weakness of HBM in
relation to this thesis includes the lack of sociocultural explanations underlying the
four constructs. Additionally, it focuses on the individual rather than a cultural group,
which is the focus of this thesis.
Figure 4.2: The health belief model
Source: Adapted from Sutton 2001
The TTM, also known as the ‘stages of change theory’, was developed by Prochaska
and DiClemente [265, 266] in the early 1980s and it is the most widely used stage
model of health behaviour [255]. While it originated from addiction behaviour
studies involving smoking cessation, it also has been used in studying other health
behaviours, including healthy eating [267]. The TTM is complex in the sense that it
draws constructs from other behavioural change theories, which includes more than
15 constructs. A simpler version was developed by DiClemente et al. [268] in their
study on smoking cessation. As shown on Figure 4.3, there are five stages for
behavioural change, namely precontemplation. contemplation, preparation, action
and maintenance. TTM is conceptualised as a spiral because it is proposed that
individuals must go through all five stages to achieve behavioural change.
At the precontemplation stage, individuals do not intend to make any changes in their
health behaviour because they believe that they do not have any problems that
Benefits
Susceptibility
Severity
Barriers
Behaviour
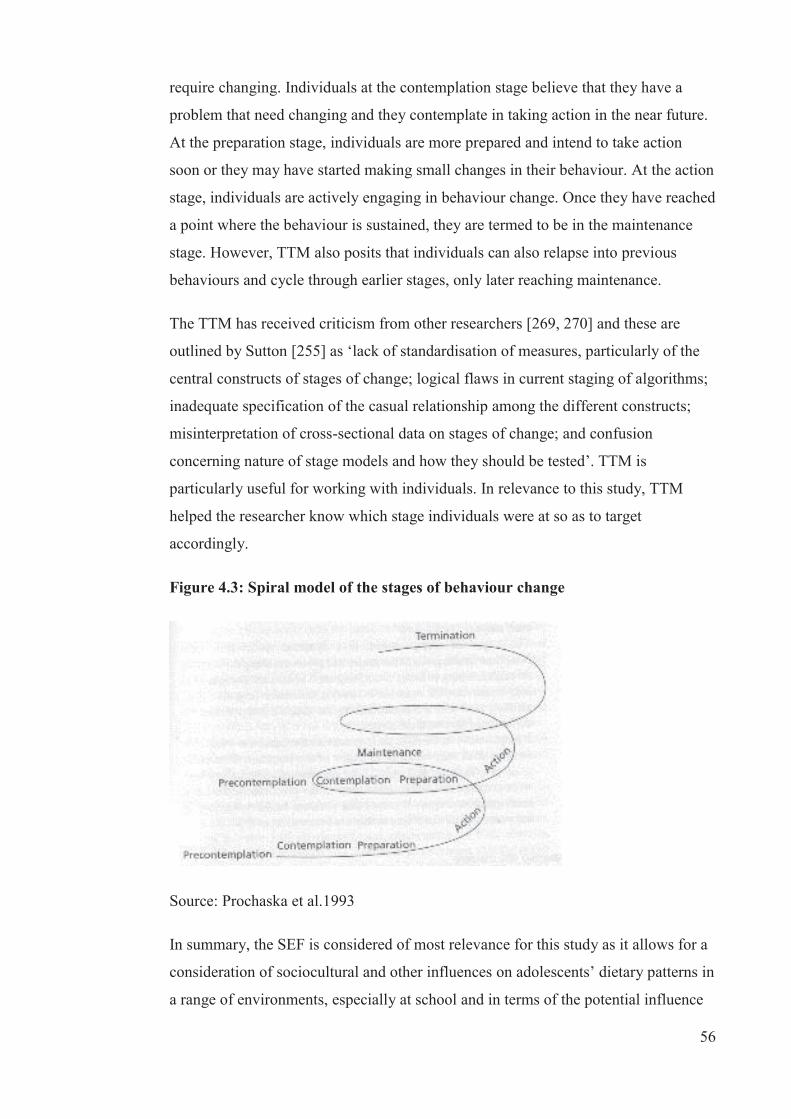
56
require changing. Individuals at the contemplation stage believe that they have a
problem that need changing and they contemplate in taking action in the near future.
At the preparation stage, individuals are more prepared and intend to take action
soon or they may have started making small changes in their behaviour. At the action
stage, individuals are actively engaging in behaviour change. Once they have reached
a point where the behaviour is sustained, they are termed to be in the maintenance
stage. However, TTM also posits that individuals can also relapse into previous
behaviours and cycle through earlier stages, only later reaching maintenance.
The TTM has received criticism from other researchers [269, 270] and these are
outlined by Sutton [255] as ‘lack of standardisation of measures, particularly of the
central constructs of stages of change; logical flaws in current staging of algorithms;
inadequate specification of the casual relationship among the different constructs;
misinterpretation of cross-sectional data on stages of change; and confusion
concerning nature of stage models and how they should be tested’. TTM is
particularly useful for working with individuals. In relevance to this study, TTM
helped the researcher know which stage individuals were at so as to target
accordingly.
Figure 4.3: Spiral model of the stages of behaviour change
Source: Prochaska et al.1993
In summary, the SEF is considered of most relevance for this study as it allows for a
consideration of sociocultural and other influences on adolescents’ dietary patterns in
a range of environments, especially at school and in terms of the potential influence
57
of the media. The HBM helps in identifying the messages and messengers for
healthy eating in order to better inform dietary intervention.
4.2 Social marketing
Communicating culturally and age-appropriate dietary messages is important to
motivate adolescents to change to healthier eating patterns. Equally important are the
modes of delivering the message, as well as the messengers who convey the
messages. To effectively design and develop obesity-prevention messages, the
concept of social marketing has been applied to health promotion campaigns in
attempts to influence behavioural change [271]. Unlike theoretical framework or
models, social marketing is an approach to the planning, designing and implementing
of campaign information [272].
Historically, in the late 1960s and early 1970s, the tools and techniques of social
marketing began to be used in commercial marketing in order to promote social
goods (e.g., items or services) and address social problems [273, 274]. It was agreed
that marketing was the core to all organisations with clients. However, there were
debates about its design and the definition of social marketing. Kotler and Zaltman
[275] proposed early that social marketing was ‘the design, implementation and
control of programmes calculated to influence the acceptability of social ideas and
involving considerations of product planning, pricing, communication, distribution
and marketing research’. Andreason [276] suggested this was confusing and
proposed that social marketing was the ‘adaptation of commercial marketing
technologies to programmes designed to influence the voluntary behaviour of target
audiences to improve their personal welfare and that of society of which they are a
part’. The later definition is more relevant and useful and has been adopted in public
health settings [277] to promote beneficial health behavioural change.
This thesis helps in identifying areas for social marketing. There are number of
intervention studies [278-281] in public health worldwide that have used the concept
of social marketing and showed successfully behavioural changes. In the Pacific
Islands, there have been a few studies conducted that partially used social marketing
strategies to address obesity [282-284]. However, one did not show an effect on
behavioural change [282] and others indicated change in production and dietary
intake (more towards traditional food) [283, 284].
58
The concept of social marketing has since been embraced by public health
professionals, but Grier and Bryant [277] indicated that the majority of public health
professionals did not have a complete understanding of the concepts underlying
social marketing. In fact, their so-called application of social marketing was
narrowed to predominantly promotional and/or communication efforts. Moreover,
Grier and Bryant highlighted two main problems among many public health
professionals: negligence of the most important concept of social marketing, which is
the exchange process, and lack of integrating the market mix when planning health
intervention programmes. While there are numerous marketing concepts that could
be applied in public health campaigns, the ‘5 Ps’, also known as the ‘marketing mix’,
are the core concept in social marketing [272, 277]. The purpose of the 5Ps ‘is to
develop a message strategy that offers consumers the optimal “marketing mix” of
product, price, place, promotion and positioning’[272] (p3).
In social marketing, product is the desirable health behaviour or action and their
associated benefits. The product and its benefits are used to target individuals to
perform the behaviour. For example, the product can be a reduction in SSB
consumption (action) or healthy dietary patterns (desirable health behaviour). A
distinction of different categories of product is made by Kotler et al. [285], who
discussed the two types of product: core product (individual benefits for performing
the behaviour) and actual product (desired behaviour). Also, Kotler et al. [285]
utilised the concept of ‘augmented product’, which refers to a product with added
value, in social marketing in order to facilitate desirable behavioural change. Another
important concept of product is the associated benefits of the desired behaviour. For
any social marketing efforts to be successful, social marketers must offer individuals
or clients benefits that are likely to be of greatest appeal to them for adopting the
behaviour or services.
Price refers to the costs associated with behaviour as seen from the customers’ point
of view. Grier and Bryant [277] stated ‘price usually encompasses intangible costs,
such as diminished pleasure, embarrassment, loss of time and the psychological
hassle that often accompanies change, especially modifying ingrained habits’. The
customer prefers that the ‘added value’ benefits for the behaviour is lower in price
than the current product or behaviour. Thus, it is important for any social marketers
to know the price that clients would be willing to pay for the desired behaviour. In
59
this case, what adolescents need to give up in order to change to healthier dietary
patterns.
Place refers to the distribution outlet where the product is available to target
individuals or customers. The place is also referred to as ‘action outlets’ [277]
‘where and when the target market will perform the desirable behaviour, acquire any
related tangible objects and receive any associated services’ [285]. Some examples
of these ‘action outlets’ include the physical location, operating hours, general
attractiveness and comfort and accessibility [286], organisations and people who are
providing the relevant product (information, services, goods) that will facilitate the
desired change in behaviour. The product, either in physical form or services or
health ideas must be able to be delivered directly through the distribution outlet
(place), taking into account the consequent cost to the target individuals or
customers. Wood [287] highlighted the importance for health professionals to work
with other relevant organisations such as schools, food industries, cultural and
community groups for effective distribution of products to facilitate the change in
behaviour.
Promotion is probably the most commonly used of the 5Ps in social marketing.
Promotion is where social marketers convey the products and associated benefits,
costs and distribution outlets to individuals or clients. Grier and Bryant [277]
highlighted this promotion strategy as ‘a carefully designed set of activities intended
to influence change … involves multiple elements: specific communication objective
for each target audience; guidelines for designing attention-getting and effective
messages; and designation of appropriate communication channels’. Promotion
strategies also include specific activities such as advertising, developing printed
materials and utilising other media to facilitate the desired behavioural change.
Examples are relative to public health target and community-based organisations
(school, food retail, churches) and policy changes (food-related policies and
regulations), cultural groups and skill building. For example, attention should also be
given to the increasing use of screen-based activities, especially for adolescents. All
these health promotion activities should be integrated into the communication
activities in order to optimise the desired behaviours of individuals or clients. While
health promotion activities are usually the last component of social marketing, Wood
60
[287], in Alcalay and Bell [272], suggested that positioning or branding was the last
component of social marketing.
Positioning of the product involves setting it in a more favourable way compared to
other products (or activities) in order to maximise benefits and minimise costs for the
clients. A similar concept of locating the product in the most appealing way is shared
with the concept of branding. Wood [287] discussed branding of products in adding
value to the products and building marketing relationships with the target individuals
or clients. Unfortunately, branding has often been associated with unfavourable
products or unhealthy behaviour, resulting in negative views of marketing, which is
seen as manipulative and exploitative. However, social marketers in public health
could use the concept of branding in a positive way to encourage the promotion of
healthy behaviour; for example, food choices among adolescents.
4.2.1 Exchange theory
As discussed in the preceding section, the central concept to social marketing is the
exchange of social behaviour whereby associated benefits and costs are conveyed to
the individual or consumer to facilitate a voluntary change in that behaviour. The
exchange theory is one of the theories used widely in marketing to explain the
transaction or the ‘exchange of the values between two parties’ [274, 276, 277, 288].
Bogozzi [288], in Grier and Bryant [277], viewed the exchange theory as ‘consumers
acting primarily out of self-interest as they seek ways to optimise value by doing
what gives them the greatest benefit for the least cost’. Normally, in commercial
marketing, the individual receives the product (goods and services) they value or
need and pay for the costs and the marketers make a profit for the product. In public
health settings, however, ‘there is rarely an immediate, explicit payback to target
audiences in return for their adoption of healthy behaviours’ [277] (p321). This could
be a challenge, especially for adolescents who expect immediate feedback to ensure
adaptation of healthy behaviours.
Lefebvre and Flora [289] further indicated that the exchange theory also applies to
voluntary exchanges of resources for health communication intervention. Thus,
resource owners—for example, individuals, groups or organisations—are willing to
exchange their resources for the perceived benefits. In this exchange, the important
entities are the ‘buyer’ and the ‘seller’ of the product. The ‘buyers’ (target audience)
61
are willing to pay a price such as ‘money, time or effort upon purchase of the
product’ [290]. While price and effort are equally important to consider prior to
paying for the product, effort-related costs are relevant to price in social marketing.
Effort-related costs include ‘inconvenience, physical and/or mental tasks, social
standing and comfort’ [277] (p9). Importantly, the social marketer needs to identify
what price or costs the target audience is willing to pay for the product. In order to
identify these costs, appropriate research techniques—for example, focus group
discussions—are used with the target audiences [272, 291].
After the ‘buyer’ pays for the product, the ‘seller’ or campaign planner provides the
product either in tangible or intangible forms. For example, a smoking cessation kit
is a tangible good and an intangible good is a service such as nutrition counselling or
an idea such as a health risk posed by high consumption of SSB. It is very important
for the ‘seller’ to convey the benefits that are associated with the adoption of the
healthy behaviour. The ‘seller’ must persuade the target audience to take part in the
exchange. In doing so, the target audience must believe that the costs and benefits
associated with the product or behaviour are worth buying or adopting.
Relative to study four (see Chapter 8) of this thesis, the exchange theory forms the
basis of investigating the perceived benefits, barriers, facilitators, messages and
messengers for adolescents in Fiji to adopt healthy dietary patterns. Also, study four
examines explicit information about the costs and benefits associated with specific
dietary behaviours, from the adolescents’ perspectives. It is anticipated that these
findings will be utilised by social marketers in public health to inform social
marketing campaign efforts to minimise costs and maximise benefits in order to
improve adolescents’ diets.
4.3 General context and methods
4.3.1 Pacific OPIC study
The Pacific OPIC project began in 2004 to address obesity, in particular reducing
unhealthy weight gain among adolescents in the Pacific. The Pacific OPIC Study was
quasi-experimental, with intervention schools and comparison schools with similar
demographics identified within each study site. Thus, it also aimed to evaluate the
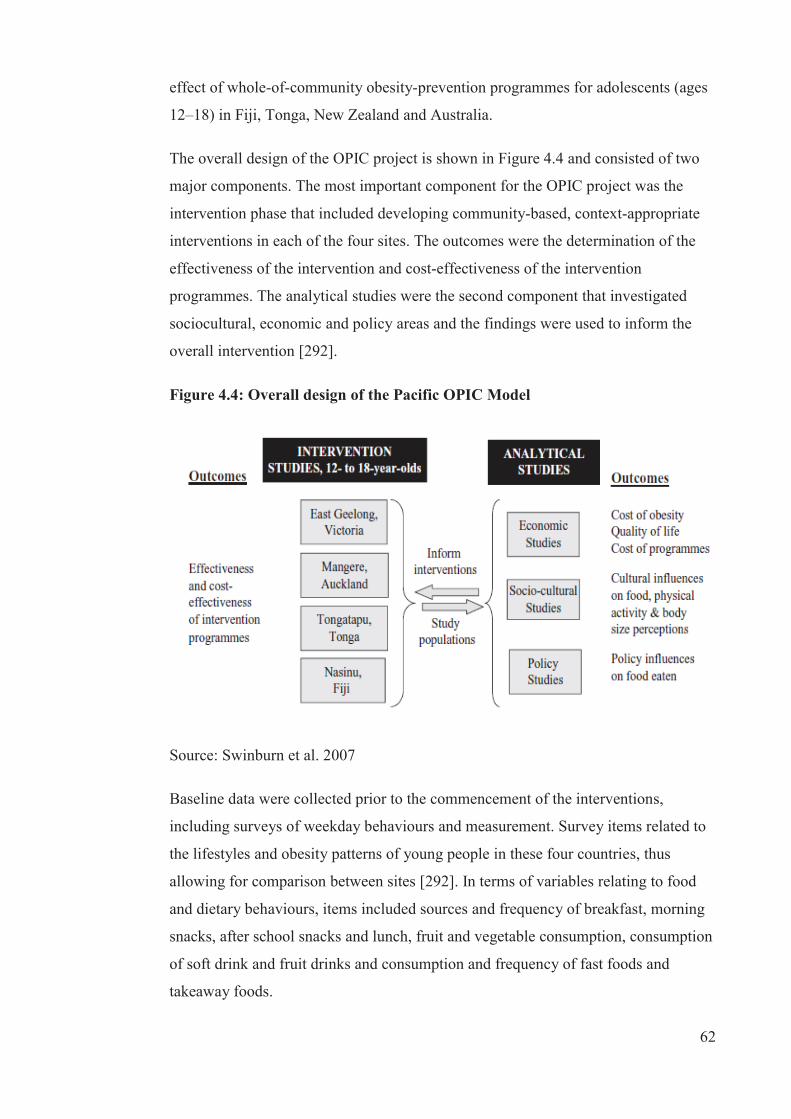
62
effect of whole-of-community obesity-prevention programmes for adolescents (ages
12–18) in Fiji, Tonga, New Zealand and Australia.
The overall design of the OPIC project is shown in Figure 4.4 and consisted of two
major components. The most important component for the OPIC project was the
intervention phase that included developing community-based, context-appropriate
interventions in each of the four sites. The outcomes were the determination of the
effectiveness of the intervention and cost-effectiveness of the intervention
programmes. The analytical studies were the second component that investigated
sociocultural, economic and policy areas and the findings were used to inform the
overall intervention [292].
Figure 4.4: Overall design of the Pacific OPIC Model
Source: Swinburn et al. 2007
Baseline data were collected prior to the commencement of the interventions,
including surveys of weekday behaviours and measurement. Survey items related to
the lifestyles and obesity patterns of young people in these four countries, thus
allowing for comparison between sites [292]. In terms of variables relating to food
and dietary behaviours, items included sources and frequency of breakfast, morning
snacks, after school snacks and lunch, fruit and vegetable consumption, consumption
of soft drink and fruit drinks and consumption and frequency of fast foods and
takeaway foods.
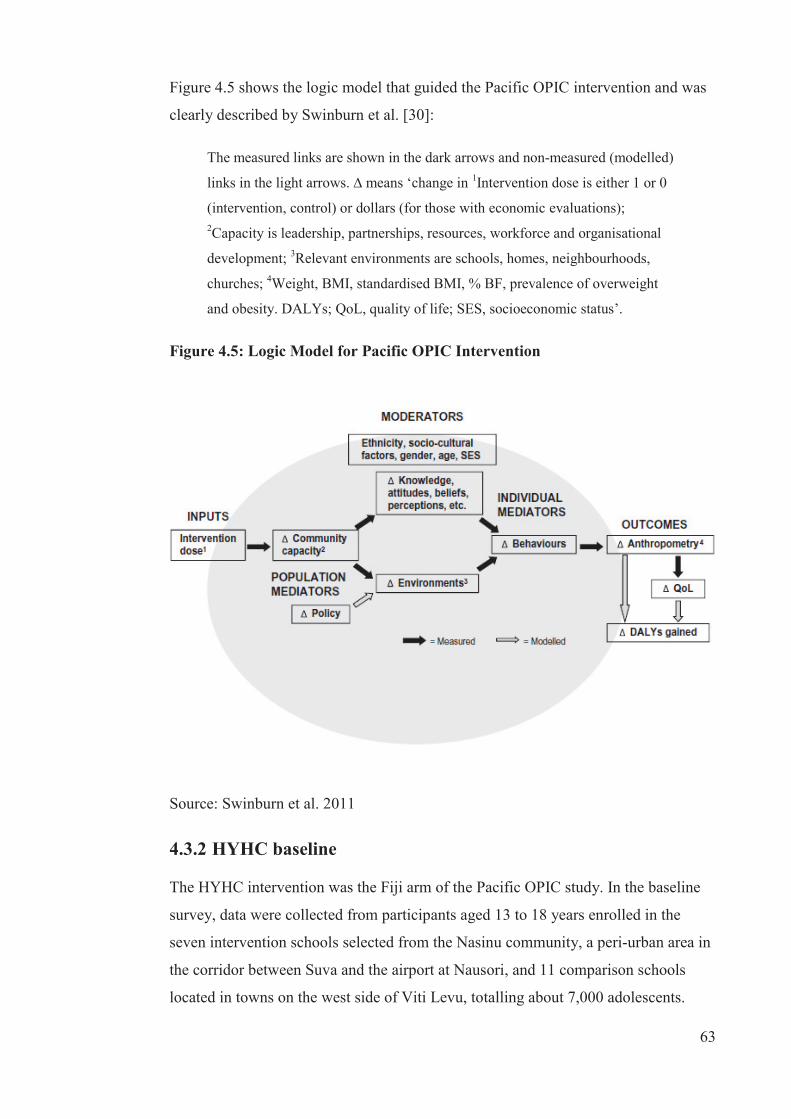
63
Figure 4.5 shows the logic model that guided the Pacific OPIC intervention and was
clearly described by Swinburn et al. [30]:
The measured links are shown in the dark arrows and non-measured (modelled)
links in the light arrows. ∆ means ‘change in 1Intervention dose is either 1 or 0
(intervention, control) or dollars (for those with economic evaluations); 2Capacity is leadership, partnerships, resources, workforce and organisational
development; 3Relevant environments are schools, homes, neighbourhoods,
churches; 4Weight, BMI, standardised BMI, % BF, prevalence of overweight
and obesity. DALYs; QoL, quality of life; SES, socioeconomic status’.
Figure 4.5: Logic Model for Pacific OPIC Intervention
Source: Swinburn et al. 2011
4.3.2 HYHC baseline
The HYHC intervention was the Fiji arm of the Pacific OPIC study. In the baseline
survey, data were collected from participants aged 13 to 18 years enrolled in the
seven intervention schools selected from the Nasinu community, a peri-urban area in
the corridor between Suva and the airport at Nausori, and 11 comparison schools
located in towns on the west side of Viti Levu, totalling about 7,000 adolescents.
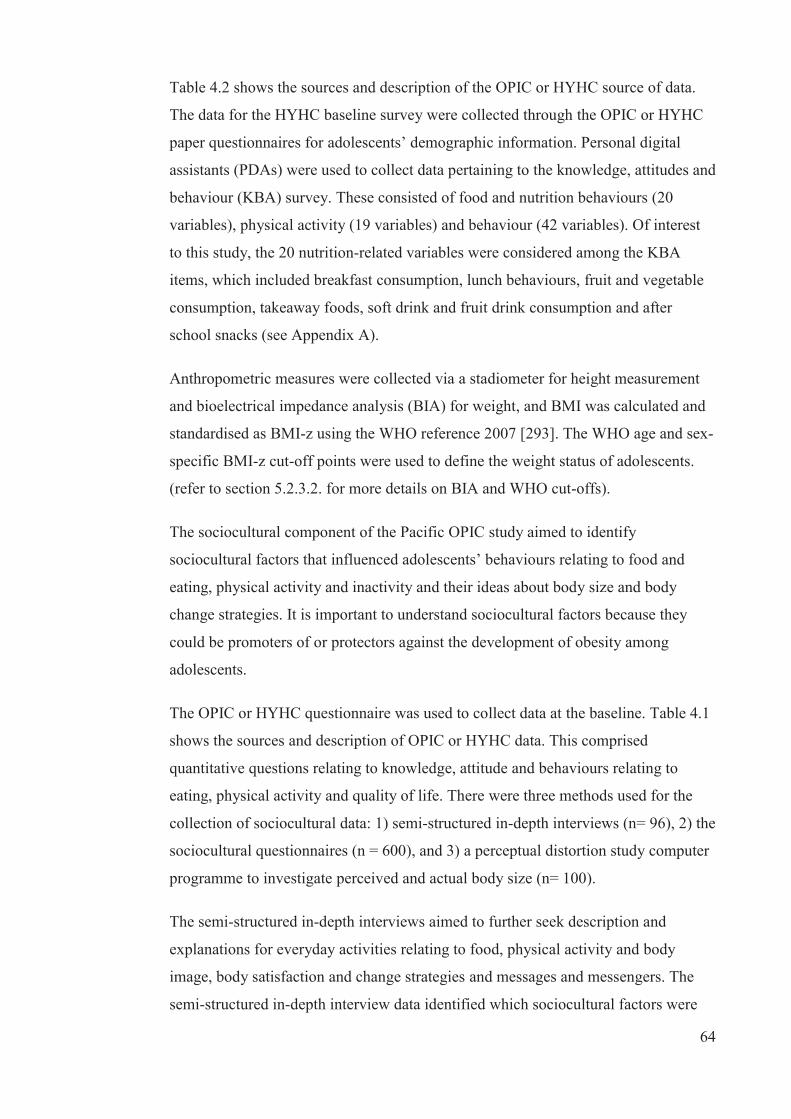
64
Table 4.2 shows the sources and description of the OPIC or HYHC source of data.
The data for the HYHC baseline survey were collected through the OPIC or HYHC
paper questionnaires for adolescents’ demographic information. Personal digital
assistants (PDAs) were used to collect data pertaining to the knowledge, attitudes and
behaviour (KBA) survey. These consisted of food and nutrition behaviours (20
variables), physical activity (19 variables) and behaviour (42 variables). Of interest
to this study, the 20 nutrition-related variables were considered among the KBA
items, which included breakfast consumption, lunch behaviours, fruit and vegetable
consumption, takeaway foods, soft drink and fruit drink consumption and after
school snacks (see Appendix A).
Anthropometric measures were collected via a stadiometer for height measurement
and bioelectrical impedance analysis (BIA) for weight, and BMI was calculated and
standardised as BMI-z using the WHO reference 2007 [293]. The WHO age and sex-
specific BMI-z cut-off points were used to define the weight status of adolescents.
(refer to section 5.2.3.2. for more details on BIA and WHO cut-offs).
The sociocultural component of the Pacific OPIC study aimed to identify
sociocultural factors that influenced adolescents’ behaviours relating to food and
eating, physical activity and inactivity and their ideas about body size and body
change strategies. It is important to understand sociocultural factors because they
could be promoters of or protectors against the development of obesity among
adolescents.
The OPIC or HYHC questionnaire was used to collect data at the baseline. Table 4.1
shows the sources and description of OPIC or HYHC data. This comprised
quantitative questions relating to knowledge, attitude and behaviours relating to
eating, physical activity and quality of life. There were three methods used for the
collection of sociocultural data: 1) semi-structured in-depth interviews (n= 96), 2) the
sociocultural questionnaires (n = 600), and 3) a perceptual distortion study computer
programme to investigate perceived and actual body size (n= 100).
The semi-structured in-depth interviews aimed to further seek description and
explanations for everyday activities relating to food, physical activity and body
image, body satisfaction and change strategies and messages and messengers. The
semi-structured in-depth interview data identified which sociocultural factors were
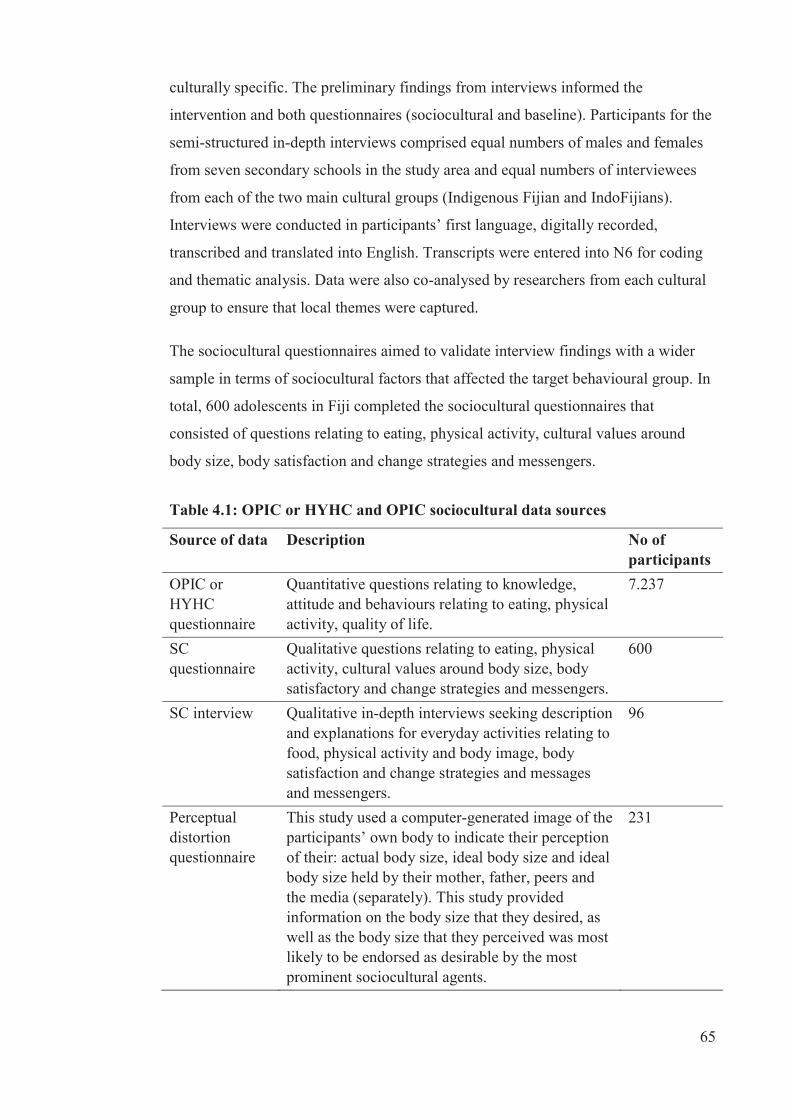
65
culturally specific. The preliminary findings from interviews informed the
intervention and both questionnaires (sociocultural and baseline). Participants for the
semi-structured in-depth interviews comprised equal numbers of males and females
from seven secondary schools in the study area and equal numbers of interviewees
from each of the two main cultural groups (Indigenous Fijian and IndoFijians).
Interviews were conducted in participants’ first language, digitally recorded,
transcribed and translated into English. Transcripts were entered into N6 for coding
and thematic analysis. Data were also co-analysed by researchers from each cultural
group to ensure that local themes were captured.
The sociocultural questionnaires aimed to validate interview findings with a wider
sample in terms of sociocultural factors that affected the target behavioural group. In
total, 600 adolescents in Fiji completed the sociocultural questionnaires that
consisted of questions relating to eating, physical activity, cultural values around
body size, body satisfaction and change strategies and messengers.
Table 4.1: OPIC or HYHC and OPIC sociocultural data sources
Source of data Description No of participants
OPIC or HYHC questionnaire
Quantitative questions relating to knowledge, attitude and behaviours relating to eating, physical activity, quality of life.
7.237
SC questionnaire
Qualitative questions relating to eating, physical activity, cultural values around body size, body satisfactory and change strategies and messengers.
600
SC interview Qualitative in-depth interviews seeking description and explanations for everyday activities relating to food, physical activity and body image, body satisfaction and change strategies and messages and messengers.
96
Perceptual distortion questionnaire
This study used a computer-generated image of the participants’ own body to indicate their perception of their: actual body size, ideal body size and ideal body size held by their mother, father, peers and the media (separately). This study provided information on the body size that they desired, as well as the body size that they perceived was most likely to be endorsed as desirable by the most prominent sociocultural agents.
231
66
4.3.3 HYHC intervention and follow-up
The HYHC intervention in Fiji was carried out with the aim to improve the health
and wellbeing of individuals and strengthen the Nasinu community through healthy
eating and physical activity [294]. The aim was generated after the Analysis Grid for
Elements Linked to Obesity (ANGELO) workshop assisted in the development of an
Action Plan for HYHC [295]. There were seven behavioural and innovative
objectives developed and key strategies identified, of which the first three were
related to encouragement of regular breakfast consumption, improving the
healthiness of food at school and decreasing consumption of high-energy-dense
snacks after school. The seventh objective related to the promotion of healthy eating
within churches, mosques and temples (see Table 4.2 for food-related objectives).
Behaviours in each of the key strategic areas were measured at the baseline in 2004–
05 and a follow-up was made in 2008 to evaluate the effectiveness of the HYHC
intervention.
Table 4.2: HYHC intervention action plan— food-related objectives
Behavioural and innovative objectives Key food-related strategies To significantly reduce the proportion of adolescents who skip breakfast on school days
1.1 Promote breakfast with students and parents through pamphlets and morning talks during school 1.2 School canteens provide breakfast
To improve the healthiness of food at school by significantly: i) decreasing the consumption of high sugar drinks and promoting the consumption of water and ii) increasing fruit and vegetable consumption
2.1 Develop school policies for canteens to support water, fruit and vegetable consumption 2.2 Develop relevant curriculum with home economics and agricultural science
To significantly decrease the consumption of energy- dense snacks and significantly increase consumption of fruit as afternoon snacks
3.1 Develop social marketing messages relating to the benefits of fruits and vegetables; what constitute a healthy snack 3.2 Provide information for student on healthy snacks, fruits and vegetable snacks
To develop programmes for promoting healthy eating and physical activity within churches, mosques and temples
4a. Build food preparation skills and budgeting skills
Source: OPIC, Fiji Country Report 2010
67
The follow-up data for the HYHC were collected from 879 and 2,061 participants
from intervention and comparative schools, respectively, totalling 2,938 used in the
analyses. Overall, the response rate was 41%, but specifically, it was 32.7% and
45.1% for intervention and comparative schools, respectively, at follow-up. The low
response rate was attributed to child refusal, child not available for measurement or
child moved elsewhere.
The baseline characteristics for the participants who were followed up and not
followed up (lost) was not significantly different for age and weight status (BMI and
BMI-z) however, there were more Indigenous Fijians (69%) than IndoFijians (52%)
who have been ‘lost’ at follow-up compared to a lesser proportion for their
counterparts at follow-up. For sex subgroups, more males (62%) than females (57%)
were lost at follow-up. By ethnicity, about 69% Indigenous Fijians and about 52%
IndoFijians were lost at follow-up whereas 31.6% and 48.1% Indigenous Fijians and
IndoFijians respectively were followed up. By study site, 55% of participants in
comparison and 67% of participants in the intervention schools were ‘lost’ at follow-
up. For those who were followed up, 45% and 33% were from comparison and
intervention schools respectively.
Deleted or missing data were excluded from all analyses at follow-up. These were
due to either the child moving into comparison or intervention areas or errors in
anthropometric measures and knowledge, attitude, behaviours and quality of life
related to equipment problem or data entry error. Data were then cleaned and
analysed using the statistical software STATA release 11.0 (Stata-Corp., College
Station, TX, USA, 2009).
4.3.4 HYHC outcomes
The HYHC project was delivered to schools and their communities in order to reduce
unhealthy weight gain in adolescents and to build community capacity to promote
healthy eating, physical activity and healthy body weight [294, 296]. This thesis
draws on results from the baseline and follow-up survey data as well as from
sociocultural (interview and questionnaire data) components of HYHC in order to
identify areas that require further examination in terms of adolescents’ dietary
patterns.
68
One of the strengths of the HYHC intervention was the involvement of community
members to optimise the success of the key strategies. However, despite intensive
‘doses’ of activities in the intervention sites, the only anthropometric measure to
show a significant decrease in the intervention group was the percentage of BF.
There were no significant changes for either BMI or BMI-z or for the targeted
behavioural outcomes. In fact, some obesogenic eating behaviours, such as ‘eating
one serve or less of vegetables per day’ and ‘potato chips or snacks available at home
every day or almost every day’ increased compared to the comparison group. While
awareness of HYHC messages was high in the intervention sites, the intervention
was not sufficient to show positive change in either behaviours or BMI-z.
Data from the eating components of the sociocultural interviews [297] indicated that
while adolescents understood about healthy and unhealthy foods, this did not always
translate into practice. Further findings were as follows:
missing breakfast was common among IndoFijian females
school canteens were the main source of food and drinks at recess time
the majority of adolescents had unmonitored spending money that they used
to buy junk food
food brought from home was not necessarily eaten, as both food and spending
money was usually shared among friends; more IndoFijians brought lunch
from home than Indigenous Fijians.
In terms of messages about food and eating, most adolescents:
understood the value of a balanced diet and related it to being fit and healthy
and being able to concentrate in school
believed that fruit juice was healthy
believed that their mothers selected food based on health
believed that their mothers selected food on the basis of cost in the case of
IndoFijians
believed that the main meal of the day was either dinner or breakfast.
69
When asked who provided messages about food and eating, the adolescents reported
that:
more mothers provided messages about food at home than fathers
peers and friends influenced what to buy or eat at school
while schools provide information about nutrition and healthy diets in the
curriculum, food and drinks available at the school canteen did not always
reflect what was taught
they had more control of their food and eating outside of home, thus also on
the purchase of ‘junk’ versus healthier ‘meal’ foods
religious beliefs and practices determined the type of food at home and at
school, especially for Hindu and Muslim adolescents.
The sociocultural questionnaire [298]also compared sociocultural factors that
affected adolescents’ eating in four cultural groups (Tongans, Indigenous Fijians,
IndoFijians, Australians), including the source and nature of related messages.
Findings indicated differences between IndoFijians and Indigenous Fijians:
Fijians and IndoFijians skipped meals more often than Australians
IndoFijians ate junk more than Indigenous Fijians
more Indigenous Fijians ate more than usual on special or religious occasions
compared to IndoFijians
IndoFijians received more messages about healthy eating from the media and
religious groups than Indigenous Fijians
males received more messages on healthy eating from adult male relatives
than females’ relatives, while females received these messages from female
adult family members, older sisters or female peers.
The findings from the interviews and sociocultural questionnaire are useful to
understand adolescents’ perception of the sociocultural influences on food and
eating. In addition, the ethnic and sex differences in messages about food and healthy
70
eating has implications for health promotion targeting adolescents in Fiji. However,
the broad areas covered in the sociocultural studies limited the depth of examination
of dietary patterns and influences, the subject of this thesis.
The null outcomes of the HYHC intervention project in Fiji has implications for
future obesity interventions given that HYHC was the first intervention conducted in
Fiji and the first to target adolescents. Possible reasons for the lack of intervention
effects include low ‘doses’ of intervention delivered to the intervention sites,
insufficient funds and intervention staff and the relatively short intervention duration.
However, the most likely reason is the strong influence of sociocultural factors on
adolescents’ eating behaviours in Fiji.
4.4 Method of inquiry
This thesis used mixed methods: studies one and two were quantitative, study three
was primarily qualitative and four was qualitative. In brief, study one examined
cross-sectional dietary patterns of adolescents and conducted linear regression
models to identify the relationship between the dietary patterns and standardised
BMI-z. Study two was longitudinal to determine the changes in dietary patterns and
BMI-z over a two-year duration (for more detailed methods see chapters 5 and 6).
Studies three and four were exploratory in that their main emphasis was on
discovering and unravelling new ideas, knowledge or understanding of adolescents’
dietary patterns, the influence of sociocultural factors and effective messages and
messengers for healthy diets, as well as identifying the most effective media for
conveying these messages.
71
C H A P T E R 5
Study One
5.1 Background
The prevalence of overweight and obesity has increased globally among both adults
and adolescents [299, 300]. In Fiji, the 2002 NCD STEPS Survey [16] found that
among those aged 15 to 64 years, 29% were overweight and 18% were obese. The
prevalence varied by ethnic and sex groups; it was higher for Indigenous Fijian than
IndoFijian and females than males. Among adolescents, data from the 2004 NNS
[17] showed that 15% in age groups 10 to 14 years and 15 to 17 years were
overweight or obese.
As with the adults, more Indigenous Fijians than IndoFijians and females than males
were either overweight and obese [16]. Obesity during adolescence increases the risk
for metabolic syndrome, diabetes and cardiovascular diseases and some forms of
cancer [301, 302] in adulthood. It is, therefore, critical to reduce obesity in this age
group to arrest the development of NCDs. There is evidence suggesting the rise in
overweight is very steep for older adolescents, rising from approximately 15% in the
age group 15 to 17 years to about 47% in the age group 18 to 24 years [17, 18].
Obesity in adolescence has been linked with poor diet and insufficient physical
activity [303-305]. WHO has recommended a diet low in fat, sugar and salt and high
in fruit and vegetables in order to protect against the development of obesity [76].
The association between poor diet and obesity is well established globally and
regionally [75, 94], with obesity or higher BMI being associated with a low
consumption of fruit and vegetables and high consumption of energy-dense food and
drinks, along with irregular meal consumption and frequent consumption of SSB and
snacks. However, increasing consumption of highly processed food, high fat, salt and
sugary foods and decreasing intake of fruit and vegetables has been documented in
many Pacific Islands countries [306].
In Fiji, these dietary changes have included a shift towards consumption of energy-
dense foods and decreased intake of fruit and vegetables [17, 307-309]. There has
been increased availability of processed food both locally produced and imported,
72
with the urban population increasingly reliant on store-bought food. While traditional
foods are highly valued in most urban families they are now mainly consumed at
special events and family gatherings with most meals instead being based on rice,
bread and canned food [17, 161]. There is little control over the food supply in
schools, including tuck-shop, canteens and outside vendors, who mainly provide
energy-dense snacks and drinks.
Studies undertaken in other parts of the world that have examined the association
between dietary patterns and weight status in primary school aged children and in
adolescents have found that regular meal patterns were associated with lower
standardised body mass (BMI-z), while breakfast skipping, high consumption of
snacks, SSB and low consumption of fruit and vegetables were associated with
increased BMI-z [310-313]. Such information is needed in Fiji given the escalating
problem of obesity among adolescents.
It is also important to consider the ethnic and sex differences in order to inform
health promotion interventions. Fiji’s two ethnic groups experience different rates of
NCDs [16] and have substantially different diet and lifestyles [17, 18]. A dietary
behaviour could be a priority for intervention because it is known to be obesogenic
and it has a high frequency in the population. A relatively low frequency dietary
behaviour may also be a priority target if it appears to have a major effect on BMI-z.
This chapter aims to identify the key dietary behaviours of adolescents in Fiji and
their relationship with weight status (BMI-z and BMI). The specific research
question addressed in this study was: What are the dietary patterns of adolescents in
peri-urban Fiji and how do they relate to weight status (BMI-z and BMI)?
5.2 Methods
5.2.1 Study design
The study analysed data derived from the existing baseline measures (2005/06)
obtained from adolescents in schools that were involved in the quasi-experimental
intervention study for the HYHC project (the Fiji component of the Pacific OPIC
Project). OPIC was a community-based obesity-prevention study conducted in
selected sites in Australia, New Zealand, Tonga and Fiji that aimed to prevent
obesity by building community capacity to promote healthy eating and physical
activity. Further details of the study design are available in Swinburn et al. [135] .
73
The study was granted ethical approval from the Fiji School of Medicine and Deakin
University, Australia, and was registered as a clinical trial
(ACTRN12608000345381).
5.2.2 Participants
Participants comprised students aged 13 to 18 years recruited from 18 secondary
schools on the island of Viti Levu in Fiji. The sample size was 6,871 from the two
main ethnic groups in Fiji: Indigenous Fijians and IndoFijians, after excluding 366
‘other’ ethnic groups. The sample comprised 3,271(47.6%; CI 46.4, 48.8) males and
3,600 (52.4%; CI 51.2, 53.6) females with a mean age of 15.6 (SD 1.37) years.
5.2.3 Measures
5.2.3.1 Sociodemographic characteristics
Students’ ethnicity, age and sex were self-reported. Students were asked which
ethnic groups they most identified with. Indigenous Fijians refer to the native
Melanesian/Polynesian inhabitants of Fiji [211] and the IndoFijians are Fijians
whose ancestors came from various parts of India and South East Asia, mostly as
indentured labourers between 1879 and 1916, but also as free immigrants around the
1920s [212, 213]. These are definitions used in census surveys in Fiji [314].
5.2.3.2 Anthropometry
Anthropometric data (weight and height) were collected by trained research staff
using a standardised protocol [135]. Briefly, students were measured using a portable
stadiometer (Surgical and Medical PE87) for height to the nearest 0.1cm and a
TANITA Body Composition Analyser (Model BC 418, Wedderburn Australia) for
body weight to the nearest 0.1kg [30]. BMI and BMI-z were calculated based on the
WHO categories [37, 293], where BMI-z scores over 1 and 2 denote overweight and
obesity, respectively, and BMI-z scores below-2 and -3 denotes thinness and severe
thinness, respectively.
5.2.3.3 Dietary variables
Students completed a questionnaire about their food and nutrition behaviours,
physical activity behaviours and quality of life. This study reports on the following
self-reported behaviours: frequency of breakfast, morning snacks and lunch
consumption. These were assessed with the questions, ‘In the last five school days,
74
on how many days did you … [have something to eat for breakfast before school
started/eat at morning recess/tea/interval/lunch at lunchtime]?’. Daily fruit and
vegetable consumption were separately assessed: ‘How many serves of
[fruit/vegetables] do you usually eat each day?’. SSB consumption (referring to non-
diet soft and fizzy, including fruit drinks and juices) was assessed with four
questions: ‘In the last five school days (including time spent at home), on how many
days did you have regular (non-diet) soft drinks (Coke, Sprite, Fanta) ?’ and ‘On the
last school day, how many glasses or cans of soft drinks [fruit drinks or cordial (fruit
squash or concentrate)] did you have?’
Frequency of takeaway consumption was assessed with two questions: ‘How often
do you usually eat food from a takeaway (e.g., McDonalds, KFC, Subway, fried
chicken, fish and chips, hamburgers, Chinese takeaway)?’ and ‘How often do you
have food from a takeaway shop for dinner?’ Frequent consumption of after school
snacks that were high in fat or high in sugar was assessed with three questions: ‘How
often do you usually eat biscuits, potato chips or snacks such as instant noodles after
school?’, ‘How often do you usually eat pies, takeaway or fried foods such as French
fries after school?’ and ‘How often do you usually eat chocolates, lollies, sweets or
ice-cream after school?’. The availability of fruit, potato chips and similar snacks,
confectionery and sweets and non-diet SSB at home was also investigated, using the
following question structure: ‘How often is/are [food or drink item] available at
home for you to eat/drink?’
Most of the food and nutrition behaviour questions were either taken directly from or
adapted from existing large surveys such as the 1995 Australian NNS [315], thee
National Children’s Nutrition Survey was used in New Zealand in 2002 [316] and
the 1996 Dietary Key Indicators Study [317]. These were pilot tested with
adolescents in Fiji to suit local context [30].
Most questionnaire items provided four to six response options and the responses
were dichotomised into ‘healthy behaviour’ and ‘less healthy behaviour’. For
example, the variable breakfast consumption was dichotomised into ‘ate breakfast 4–
5 days’ and ‘ate breakfast 0–3 days’ in the last five school days prior to the survey.
Consumption of takeaway and other foods were dichotomised using pragmatic
criteria, which resulted in different cut-marks due to the likely (and possible)
frequency of consumption and the frequency options that were available in the
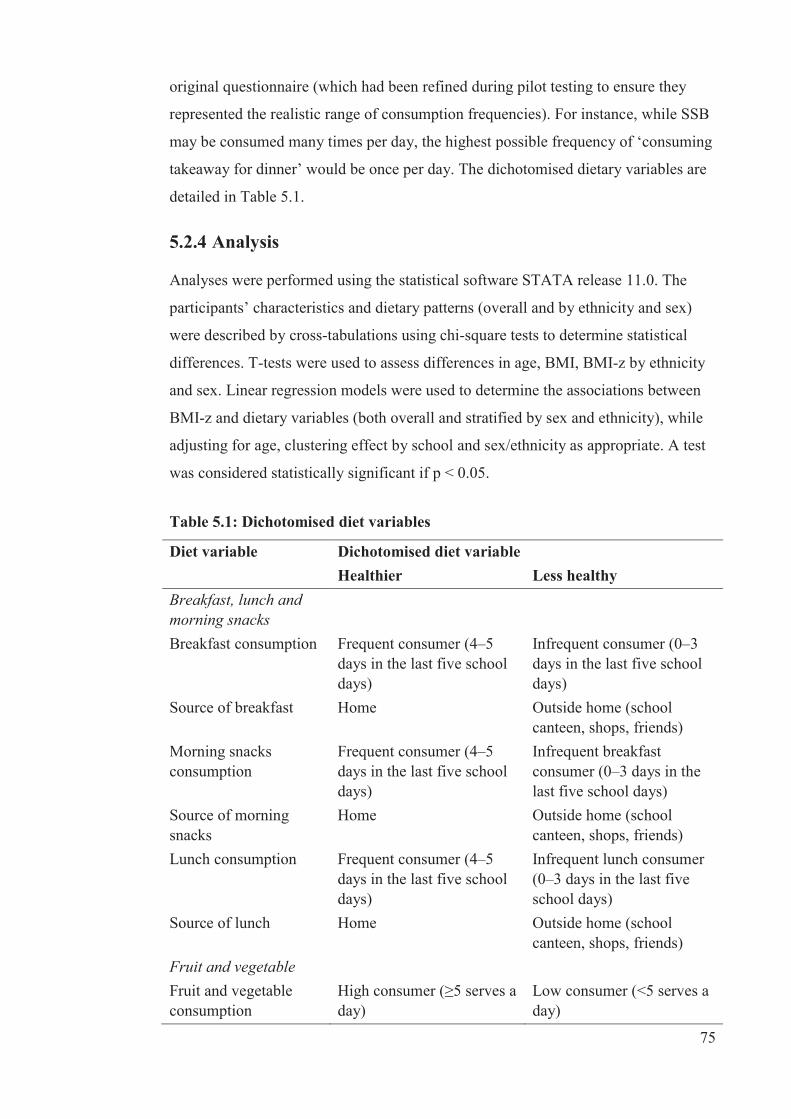
75
original questionnaire (which had been refined during pilot testing to ensure they
represented the realistic range of consumption frequencies). For instance, while SSB
may be consumed many times per day, the highest possible frequency of ‘consuming
takeaway for dinner’ would be once per day. The dichotomised dietary variables are
detailed in Table 5.1.
5.2.4 Analysis
Analyses were performed using the statistical software STATA release 11.0. The
participants’ characteristics and dietary patterns (overall and by ethnicity and sex)
were described by cross-tabulations using chi-square tests to determine statistical
differences. T-tests were used to assess differences in age, BMI, BMI-z by ethnicity
and sex. Linear regression models were used to determine the associations between
BMI-z and dietary variables (both overall and stratified by sex and ethnicity), while
adjusting for age, clustering effect by school and sex/ethnicity as appropriate. A test
was considered statistically significant if p < 0.05.
Table 5.1: Dichotomised diet variables
Diet variable Dichotomised diet variable Healthier Less healthy Breakfast, lunch and morning snacks
Breakfast consumption Frequent consumer (4–5 days in the last five school days)
Infrequent consumer (0–3 days in the last five school days)
Source of breakfast Home Outside home (school canteen, shops, friends)
Morning snacks consumption
Frequent consumer (4–5 days in the last five school days)
Infrequent breakfast consumer (0–3 days in the last five school days)
Source of morning snacks
Home Outside home (school canteen, shops, friends)
Lunch consumption Frequent consumer (4–5 days in the last five school days)
Infrequent lunch consumer (0–3 days in the last five school days)
Source of lunch Home Outside home (school canteen, shops, friends)
Fruit and vegetable
Fruit and vegetable consumption
High consumer (≥5 serves a day)
Low consumer (<5 serves a day)
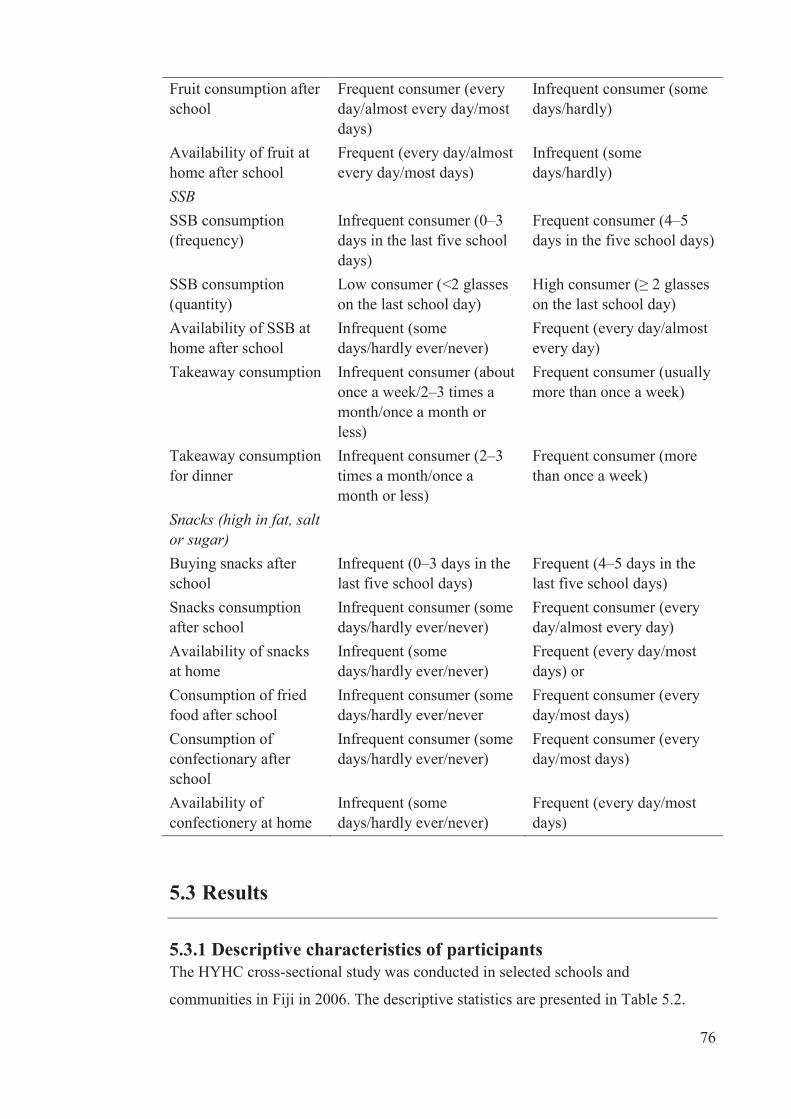
76
Fruit consumption after school
Frequent consumer (every day/almost every day/most days)
Infrequent consumer (some days/hardly)
Availability of fruit at home after school
Frequent (every day/almost every day/most days)
Infrequent (some days/hardly)
SSB
SSB consumption (frequency)
Infrequent consumer (0–3 days in the last five school days)
Frequent consumer (4–5 days in the five school days)
SSB consumption (quantity)
Low consumer (<2 glasses on the last school day)
High consumer (≥ 2 glasses on the last school day)
Availability of SSB at home after school
Infrequent (some days/hardly ever/never)
Frequent (every day/almost every day)
Takeaway consumption Infrequent consumer (about once a week/2–3 times a month/once a month or less)
Frequent consumer (usually more than once a week)
Takeaway consumption for dinner
Infrequent consumer (2–3 times a month/once a month or less)
Frequent consumer (more than once a week)
Snacks (high in fat, salt or sugar)
Buying snacks after school
Infrequent (0–3 days in the last five school days)
Frequent (4–5 days in the last five school days)
Snacks consumption after school
Infrequent consumer (some days/hardly ever/never)
Frequent consumer (every day/almost every day)
Availability of snacks at home
Infrequent (some days/hardly ever/never)
Frequent (every day/most days) or
Consumption of fried food after school
Infrequent consumer (some days/hardly ever/never
Frequent consumer (every day/most days)
Consumption of confectionary after school
Infrequent consumer (some days/hardly ever/never)
Frequent consumer (every day/most days)
Availability of confectionery at home
Infrequent (some days/hardly ever/never)
Frequent (every day/most days)
5.3 Results
5.3.1 Descriptive characteristics of participants The HYHC cross-sectional study was conducted in selected schools and
communities in Fiji in 2006. The descriptive statistics are presented in Table 5.2.
77
showing the characteristics of the participants at baseline, combining intervention
and comparison groups, after exclusion of the ‘other’ ethnic category. This is the
study population and data that are used throughout study one and will be referred to
as ‘combined baseline dataset’.
Overall, 24% of adolescents were either overweight or obese. Indigenous Fijians
were older, taller and heavier than IndoFijians. In addition, despite a similar mean
age across sexes, males were heavier, taller and had lower BMI and BMI-z than
females. The distribution of BMI-z is shown in figures 5.1a and 5.1b for the
Indigenous Fijian and IndoFijian participants, respectively. The distribution of BMI-
z scores was not significantly different from normal for either ethnic group; however,
the Indigenous Fijian distribution was shifted to the right (mean = +0.63) compared
to the distribution among IndoFijian participants (mean = -0.55).

78
Table 5.2: Descriptive characteristics of participants
Characteristics Ethnicity Sex
Total SD² or 95% CI3
Indigenous Fijian (SD² or 95% CI3)
IndoFijian (SD² or 95% CI3)
P-value4 Male (SD² or 95% CI3)
Female (SD² or 95% CI3)
P-value5
n 6,871 3,077 3,794 3,271 3,600 Age, mean, ¹ years 15.6 (1.37) 15.8 (1.48) 15.4 (1.24) <0.001 15.6 (1.4) 15.6 (1.4) NS Weight, mean, kg 56.5 (13.8) 63.0 (12.2) 51.2 (12.2) <0.001 57.9 (14.2) 55.2 (13.2) <0.001 Height, mean, m 163.2 (8.53) 165.6 (7.83) 161.2 (8.5) <0.001 167.6 (8.39) 159.1 (6.4) <0.001 BMI, mean, kg/m2 21.1 (4.28) 22.9 (3.75) 19.6 (4.12) <0.001 20.4 (4.04) 21.7 (4.41) <0.001 BMI-z scores mean -0.02 (1.37) 0.63 (0.97) -0.55 (1.42) <0.001 -0.21 (1.42) 0.15 (1.31) <0.001 Weight status (4 categories)6 <0.001 <0.001 Thin (%) 8.3 (7.6, 8.9) 0.45 (0.22, 0.69) 14.5 (13.5, 15.7) 11.4 (10.3, 12.5) 5.44 (4.7,6.2)
Normal weight (%) 67.9(66.8,69.0) 65.1 (63.4, 66.9) 70.1 (68.7, 71.6) 69.1 (67.5, 70.7) 66.8 (65.3, 68.7)
Overweight (%) 17.6(16.7, 18.5) 26.9 (25.3, 28,4) 10.1 (9.1, 11.0) 13.9 (12.7, 15.1) 21.0 (19.4, 22.3)
Obese (%) 6.2(5.7, 6.8) 7.5 (6.6, 8.5) 5.2 (4.5, 5.9) 5.7 (4.9, 6.4) 6.8 (6.0, 7.6)
Weight status (2 categories)6 <0.001 <0.001 Normal/Thin 76.2 (75.1, 77.20) 65.6 (63.9, 67.3) 84.7 (83.6, 85.9) 80.5 (79.1, 81.8) 72.3 (70.8, 73.7)
Overweight/Obese 23.8 (22.8, 24.9) 34.4 (32.7, 36.1) 15.3 (14.1, 16.4) 19.5 (18.2, 20.9) 27.7 (26.3, 29.2)
79
¹Means are unadjusted; ²SD is standard deviation for means; 395% CI is confidence interval for weight status categories; 4P-value for the difference in mean and proportion across ethnic groups tested using t-test or chi-square test, as appropriate; 5P-value for the difference in mean and proportion across sex groups tested using t-test or chi-square test, as appropriate; 6According to WHO classification.
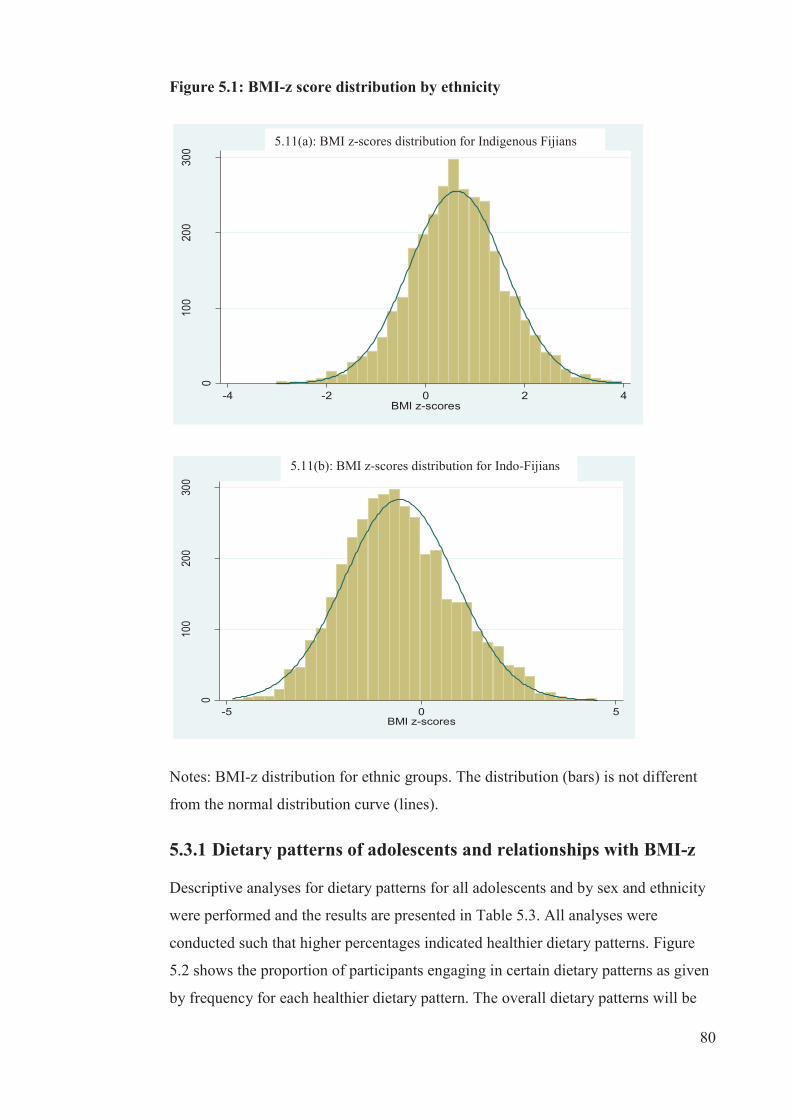
80
Figure 5.1: BMI-z score distribution by ethnicity
0
100
200
300
-4 -2 0 2 4BMI z-scores
1a: BMI z-scores distribution for Indigenous Fijians
0
100
200
300
-5 0 5BMI z-scores
1b: BMI z-scores distribution for IndoFijians
Notes: BMI-z distribution for ethnic groups. The distribution (bars) is not different
from the normal distribution curve (lines).
5.3.1 Dietary patterns of adolescents and relationships with BMI-z
Descriptive analyses for dietary patterns for all adolescents and by sex and ethnicity
were performed and the results are presented in Table 5.3. All analyses were
conducted such that higher percentages indicated healthier dietary patterns. Figure
5.2 shows the proportion of participants engaging in certain dietary patterns as given
by frequency for each healthier dietary pattern. The overall dietary patterns will be
5.11(a): BMI z-scores distribution for Indigenous Fijians
5.11(b): BMI z-scores distribution for Indo-Fijians
81
discussed in the next sections following the associations with weight status and BMI-
z, along with similarities and differences by ethnic and sex sub-group.
In general, dietary patterns were healthier for IndoFijians compared to Indigenous
Fijians, except for regular lunch consumption and eating of fried foods. Also, males
generally demonstrated healthier dietary patterns compared with females, except for
SSB consumption.
5.3.1.1 Meal frequency: breakfast, morning snacks and lunch
Overall, approximately one-third of adolescents skipped breakfast, morning snacks
and/or lunch on two to five days in the five school days preceding the survey.
Compared to IndoFijians, Indigenous Fijians skipped breakfast and morning snacks
more often. However, for lunch, the pattern was reversed, with IndoFijians skipping
lunch more often. Regardless of ethnicity, females skipped all three meals more often
than males. Figures 5.3, 5.4 and 5.5 display the association between meal frequency
and BMI-z. As expected, irregularity in meals was associated with higher BMI-z
(0.21, p<0.01) and morning snacks (0.16, p<0.05). There was a trend towards a
positive association between infrequent lunch consumption and BMI-z, but this was
not statistically significant. Patterns were similar for both sex and ethnic sub-groups.
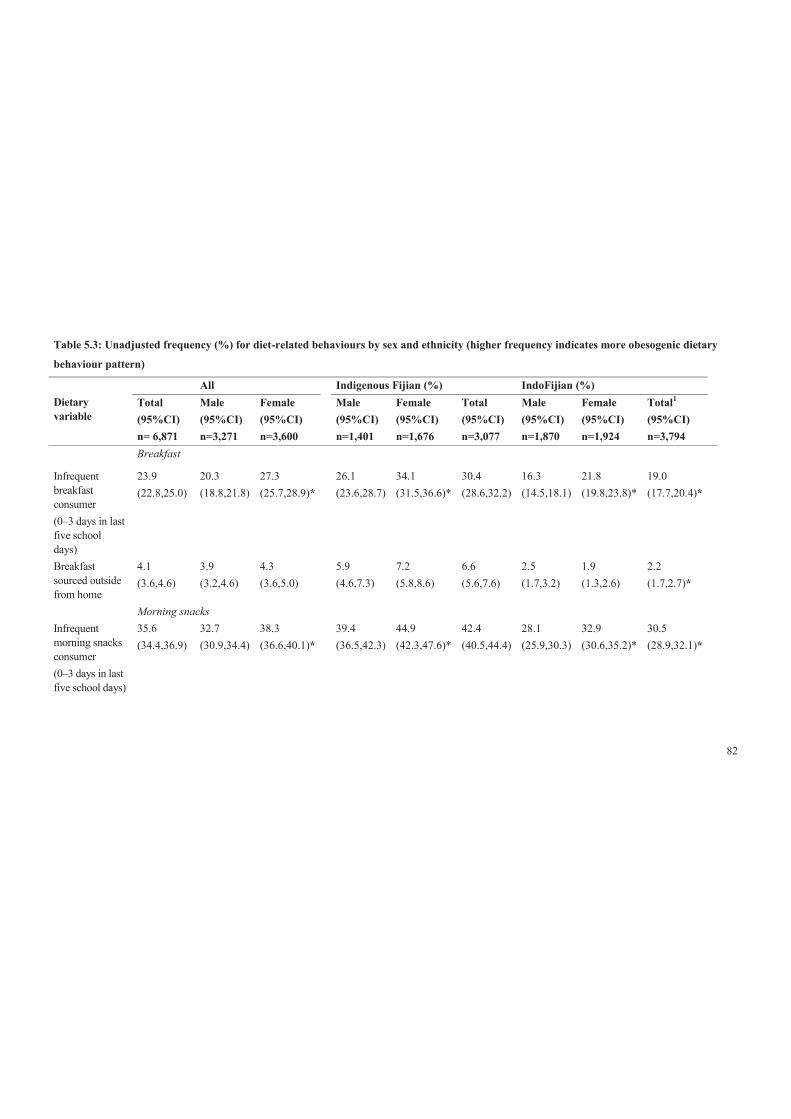
82
Table 5.3: Unadjusted frequency (%) for diet-related behaviours by sex and ethnicity (higher frequency indicates more obesogenic dietary
behaviour pattern)
Dietary variable
All Indigenous Fijian (%) IndoFijian (%) Total (95%CI) n= 6,871
Male (95%CI) n=3,271
Female (95%CI) n=3,600
Male (95%CI) n=1,401
Female (95%CI) n=1,676
Total (95%CI) n=3,077
Male (95%CI) n=1,870
Female (95%CI) n=1,924
Total1 (95%CI) n=3,794
Breakfast
Infrequent breakfast consumer (0–3 days in last five school days)
23.9 (22.8,25.0)
20.3 (18.8,21.8)
27.3 (25.7,28.9)*
26.1 (23.6,28.7)
34.1 (31.5,36.6)*
30.4 (28.6,32.2)
16.3 (14.5,18.1)
21.8 (19.8,23.8)*
19.0 (17.7,20.4)*
Breakfast sourced outside from home
4.1 (3.6,4.6)
3.9 (3.2,4.6)
4.3 (3.6,5.0)
5.9 (4.6,7.3)
7.2 (5.8,8.6)
6.6 (5.6,7.6)
2.5 (1.7,3.2)
1.9 (1.3,2.6)
2.2 (1.7,2.7)*
Morning snacks Infrequent morning snacks consumer (0–3 days in last five school days)
35.6 (34.4,36.9)
32.7 (30.9,34.4)
38.3 (36.6,40.1)*
39.4 (36.5,42.3)
44.9 (42.3,47.6)*
42.4 (40.5,44.4)
28.1 (25.9,30.3)
32.9 (30.6,35.2)*
30.5 (28.9,32.1)*
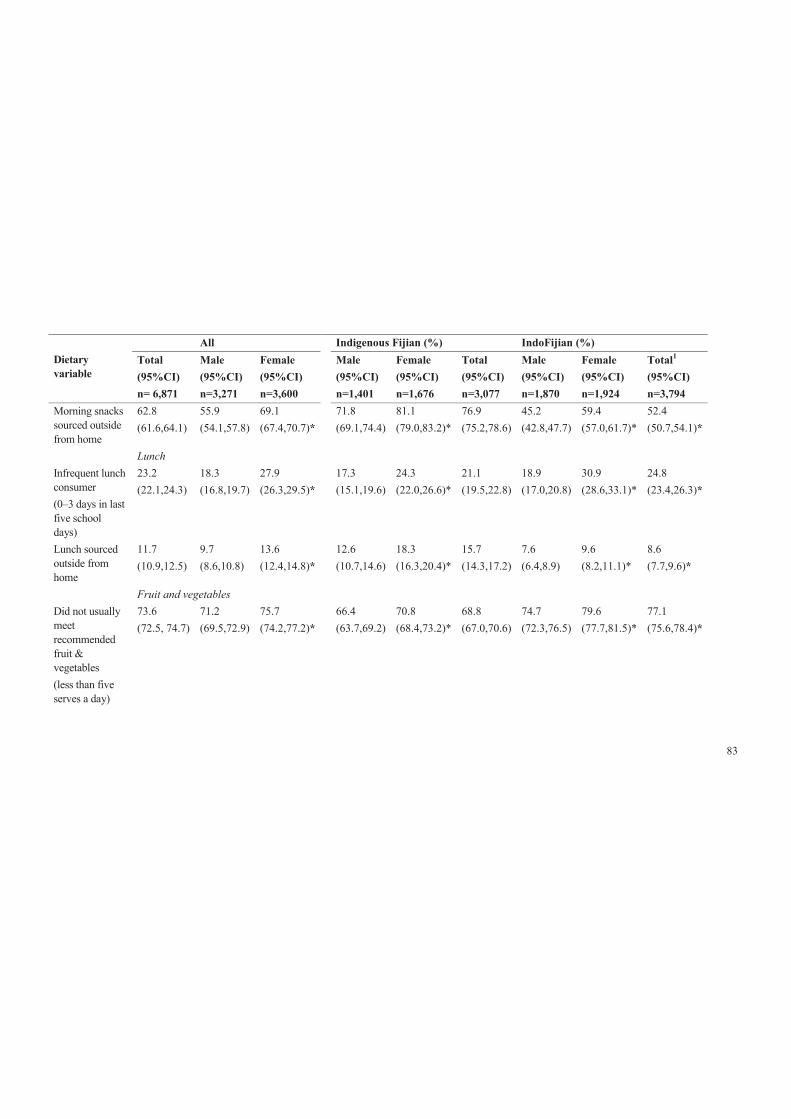
83
Dietary variable
All Indigenous Fijian (%) IndoFijian (%) Total (95%CI) n= 6,871
Male (95%CI) n=3,271
Female (95%CI) n=3,600
Male (95%CI) n=1,401
Female (95%CI) n=1,676
Total (95%CI) n=3,077
Male (95%CI) n=1,870
Female (95%CI) n=1,924
Total1 (95%CI) n=3,794
Morning snacks sourced outside from home
62.8 (61.6,64.1)
55.9 (54.1,57.8)
69.1 (67.4,70.7)*
71.8 (69.1,74.4)
81.1 (79.0,83.2)*
76.9 (75.2,78.6)
45.2 (42.8,47.7)
59.4 (57.0,61.7)*
52.4 (50.7,54.1)*
Lunch Infrequent lunch consumer (0–3 days in last five school days)
23.2 (22.1,24.3)
18.3 (16.8,19.7)
27.9 (26.3,29.5)*
17.3 (15.1,19.6)
24.3 (22.0,26.6)*
21.1 (19.5,22.8)
18.9 (17.0,20.8)
30.9 (28.6,33.1)*
24.8 (23.4,26.3)*
Lunch sourced outside from home
11.7 (10.9,12.5)
9.7 (8.6,10.8)
13.6 (12.4,14.8)*
12.6 (10.7,14.6)
18.3 (16.3,20.4)*
15.7 (14.3,17.2)
7.6 (6.4,8.9)
9.6 (8.2,11.1)*
8.6 (7.7,9.6)*
Fruit and vegetables Did not usually meet recommended fruit & vegetables (less than five serves a day)
73.6 (72.5, 74.7)
71.2 (69.5,72.9)
75.7 (74.2,77.2)*
66.4 (63.7,69.2)
70.8 (68.4,73.2)*
68.8 (67.0,70.6)
74.7 (72.3,76.5)
79.6 (77.7,81.5)*
77.1 (75.6,78.4)*
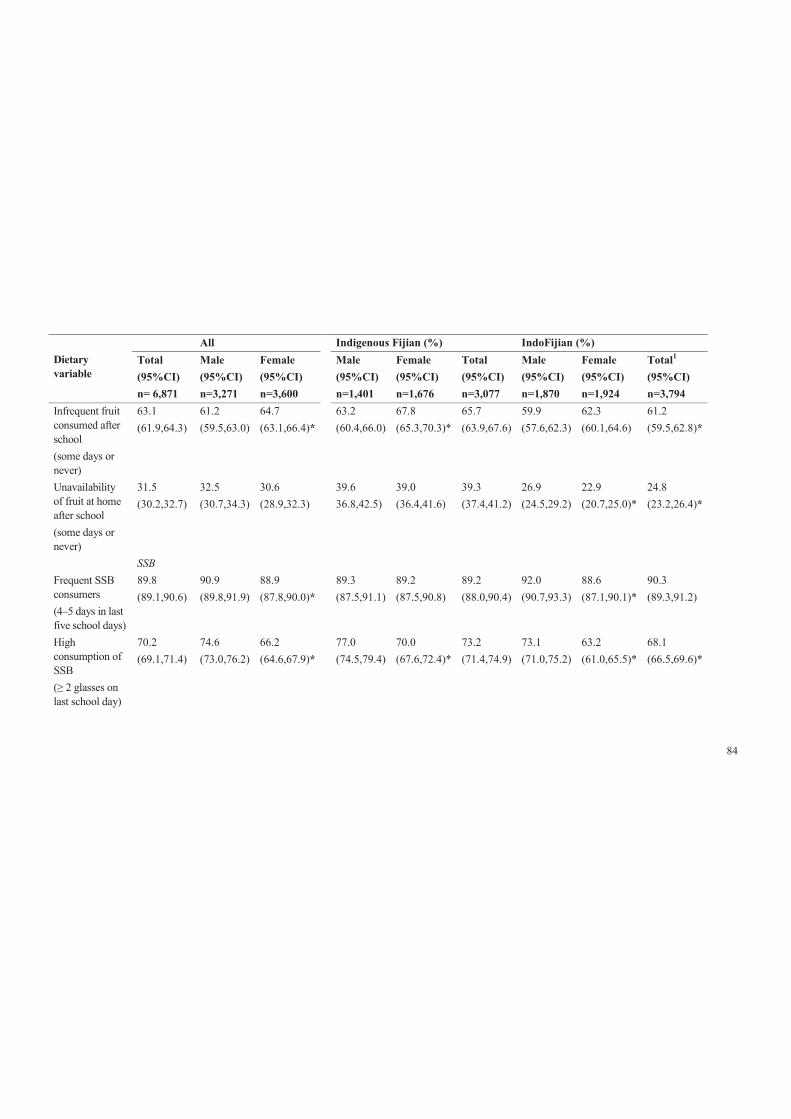
84
Dietary variable
All Indigenous Fijian (%) IndoFijian (%) Total (95%CI) n= 6,871
Male (95%CI) n=3,271
Female (95%CI) n=3,600
Male (95%CI) n=1,401
Female (95%CI) n=1,676
Total (95%CI) n=3,077
Male (95%CI) n=1,870
Female (95%CI) n=1,924
Total1 (95%CI) n=3,794
Infrequent fruit consumed after school (some days or never)
63.1 (61.9,64.3)
61.2 (59.5,63.0)
64.7 (63.1,66.4)*
63.2 (60.4,66.0)
67.8 (65.3,70.3)*
65.7 (63.9,67.6)
59.9 (57.6,62.3)
62.3 (60.1,64.6)
61.2 (59.5,62.8)*
Unavailability of fruit at home after school (some days or never)
31.5 (30.2,32.7)
32.5 (30.7,34.3)
30.6 (28.9,32.3)
39.6 36.8,42.5)
39.0 (36.4,41.6)
39.3 (37.4,41.2)
26.9 (24.5,29.2)
22.9 (20.7,25.0)*
24.8 (23.2,26.4)*
SSB Frequent SSB consumers (4–5 days in last five school days)
89.8 (89.1,90.6)
90.9 (89.8,91.9)
88.9 (87.8,90.0)*
89.3 (87.5,91.1)
89.2 (87.5,90.8)
89.2 (88.0,90.4)
92.0 (90.7,93.3)
88.6 (87.1,90.1)*
90.3 (89.3,91.2)
High consumption of SSB (≥ 2 glasses on last school day)
70.2 (69.1,71.4)
74.6 (73.0,76.2)
66.2 (64.6,67.9)*
77.0 (74.5,79.4)
70.0 (67.6,72.4)*
73.2 (71.4,74.9)
73.1 (71.0,75.2)
63.2 (61.0,65.5)*
68.1 (66.5,69.6)*
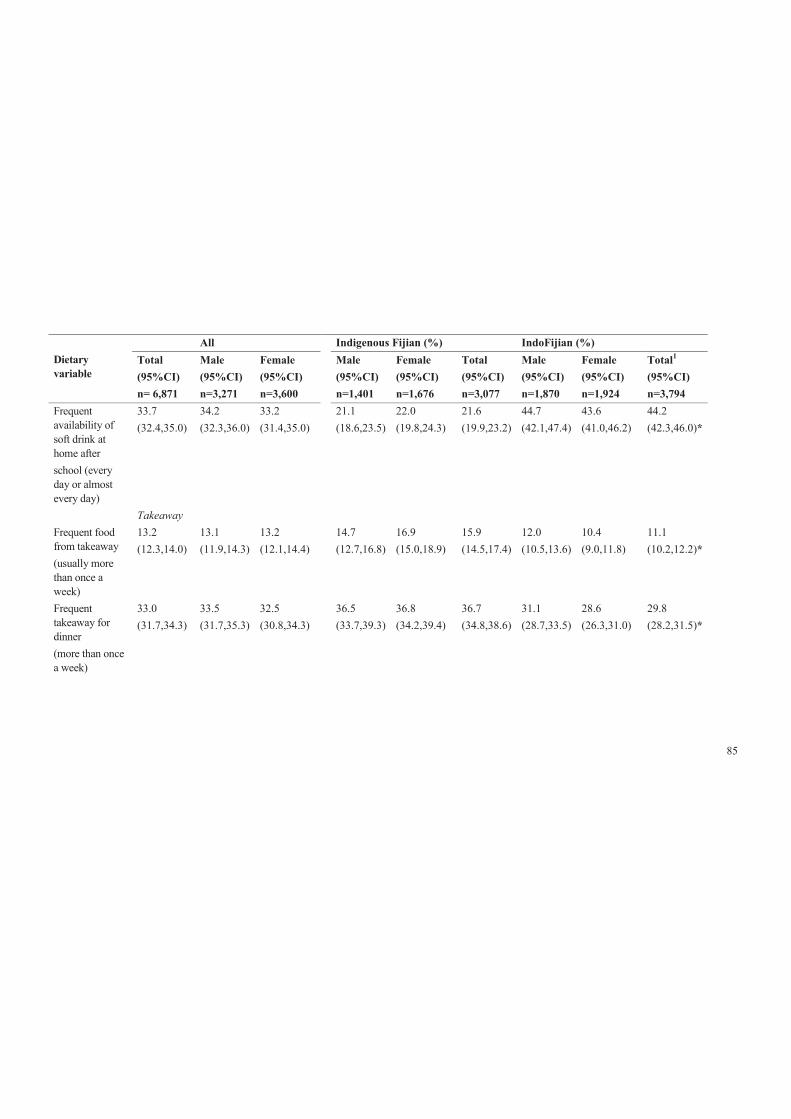
85
Dietary variable
All Indigenous Fijian (%) IndoFijian (%) Total (95%CI) n= 6,871
Male (95%CI) n=3,271
Female (95%CI) n=3,600
Male (95%CI) n=1,401
Female (95%CI) n=1,676
Total (95%CI) n=3,077
Male (95%CI) n=1,870
Female (95%CI) n=1,924
Total1 (95%CI) n=3,794
Frequent availability of soft drink at home after school (every day or almost every day)
33.7 (32.4,35.0)
34.2 (32.3,36.0)
33.2 (31.4,35.0)
21.1 (18.6,23.5)
22.0 (19.8,24.3)
21.6 (19.9,23.2)
44.7 (42.1,47.4)
43.6 (41.0,46.2)
44.2 (42.3,46.0)*
Takeaway Frequent food from takeaway (usually more than once a week)
13.2 (12.3,14.0)
13.1 (11.9,14.3)
13.2 (12.1,14.4)
14.7 (12.7,16.8)
16.9 (15.0,18.9)
15.9 (14.5,17.4)
12.0 (10.5,13.6)
10.4 (9.0,11.8)
11.1 (10.2,12.2)*
Frequent takeaway for dinner (more than once a week)
33.0 (31.7,34.3)
33.5 (31.7,35.3)
32.5 (30.8,34.3)
36.5 (33.7,39.3)
36.8 (34.2,39.4)
36.7 (34.8,38.6)
31.1 (28.7,33.5)
28.6 (26.3,31.0)
29.8 (28.2,31.5)*
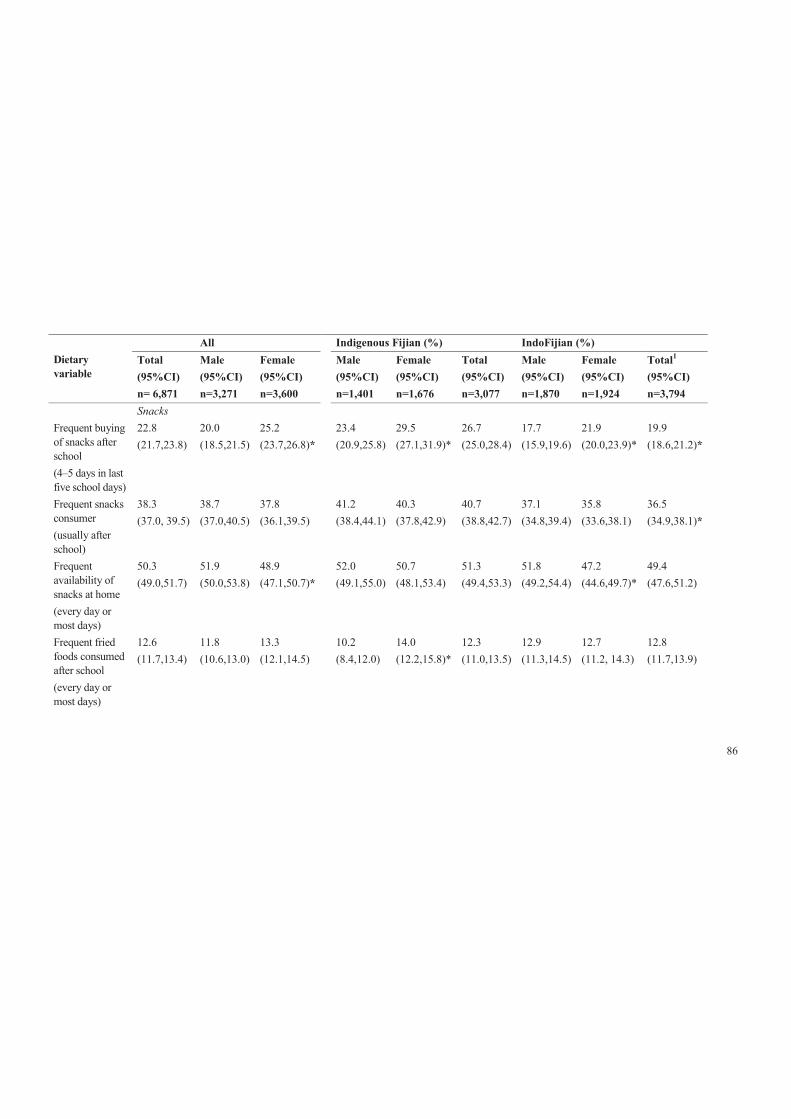
86
Dietary variable
All Indigenous Fijian (%) IndoFijian (%) Total (95%CI) n= 6,871
Male (95%CI) n=3,271
Female (95%CI) n=3,600
Male (95%CI) n=1,401
Female (95%CI) n=1,676
Total (95%CI) n=3,077
Male (95%CI) n=1,870
Female (95%CI) n=1,924
Total1 (95%CI) n=3,794
Snacks Frequent buying of snacks after school (4–5 days in last five school days)
22.8 (21.7,23.8)
20.0 (18.5,21.5)
25.2 (23.7,26.8)*
23.4 (20.9,25.8)
29.5 (27.1,31.9)*
26.7 (25.0,28.4)
17.7 (15.9,19.6)
21.9 (20.0,23.9)*
19.9 (18.6,21.2)*
Frequent snacks consumer (usually after school)
38.3 (37.0, 39.5)
38.7 (37.0,40.5)
37.8 (36.1,39.5)
41.2 (38.4,44.1)
40.3 (37.8,42.9)
40.7 (38.8,42.7)
37.1 (34.8,39.4)
35.8 (33.6,38.1)
36.5 (34.9,38.1)*
Frequent availability of snacks at home (every day or most days)
50.3 (49.0,51.7)
51.9 (50.0,53.8)
48.9 (47.1,50.7)*
52.0 (49.1,55.0)
50.7 (48.1,53.4)
51.3 (49.4,53.3)
51.8 (49.2,54.4)
47.2 (44.6,49.7)*
49.4 (47.6,51.2)
Frequent fried foods consumed after school (every day or most days)
12.6 (11.7,13.4)
11.8 (10.6,13.0)
13.3 (12.1,14.5)
10.2 (8.4,12.0)
14.0 (12.2,15.8)*
12.3 (11.0,13.5)
12.9 (11.3,14.5)
12.7 (11.2, 14.3)
12.8 (11.7,13.9)
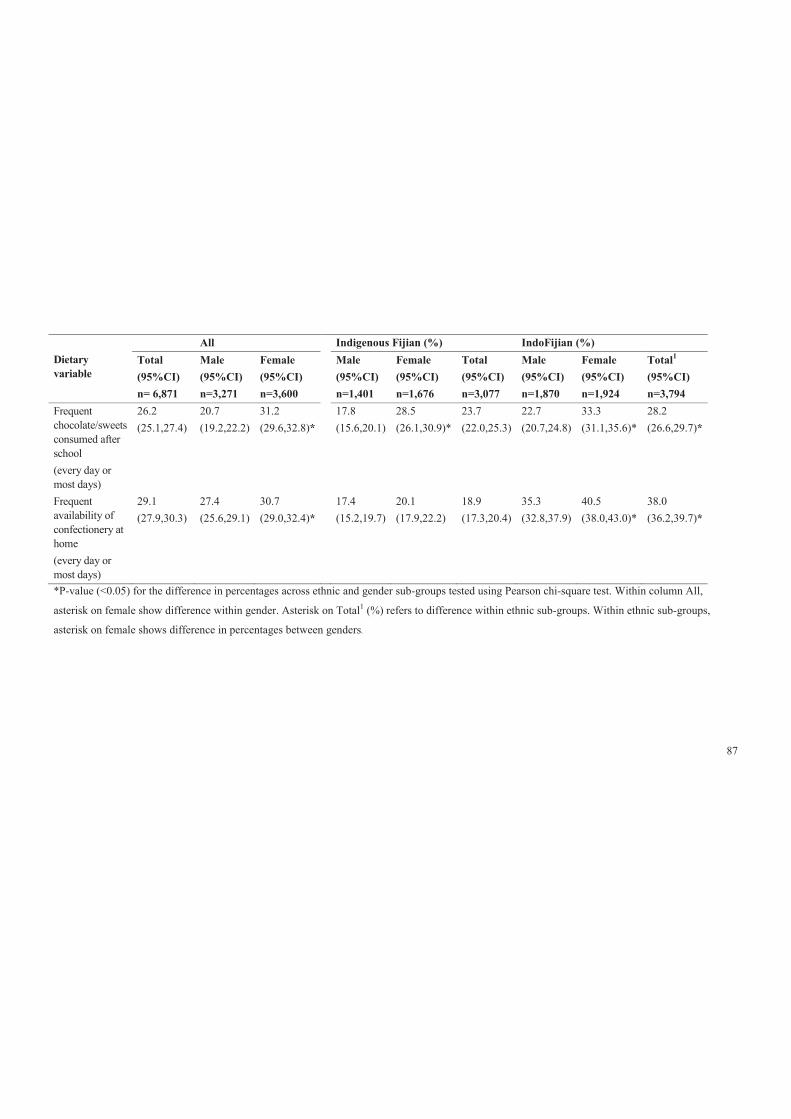
87
Dietary variable
All Indigenous Fijian (%) IndoFijian (%) Total (95%CI) n= 6,871
Male (95%CI) n=3,271
Female (95%CI) n=3,600
Male (95%CI) n=1,401
Female (95%CI) n=1,676
Total (95%CI) n=3,077
Male (95%CI) n=1,870
Female (95%CI) n=1,924
Total1 (95%CI) n=3,794
Frequent chocolate/sweets consumed after school (every day or most days)
26.2 (25.1,27.4)
20.7 (19.2,22.2)
31.2 (29.6,32.8)*
17.8 (15.6,20.1)
28.5 (26.1,30.9)*
23.7 (22.0,25.3)
22.7 (20.7,24.8)
33.3 (31.1,35.6)*
28.2 (26.6,29.7)*
Frequent availability of confectionery at home (every day or most days)
29.1 (27.9,30.3)
27.4 (25.6,29.1)
30.7 (29.0,32.4)*
17.4 (15.2,19.7)
20.1 (17.9,22.2)
18.9 (17.3,20.4)
35.3 (32.8,37.9)
40.5 (38.0,43.0)*
38.0 (36.2,39.7)*
*P-value (<0.05) for the difference in percentages across ethnic and gender sub-groups tested using Pearson chi-square test. Within column All,
asterisk on female show difference within gender. Asterisk on Total1 (%) refers to difference within ethnic sub-groups. Within ethnic sub-groups,
asterisk on female shows difference in percentages between genders.
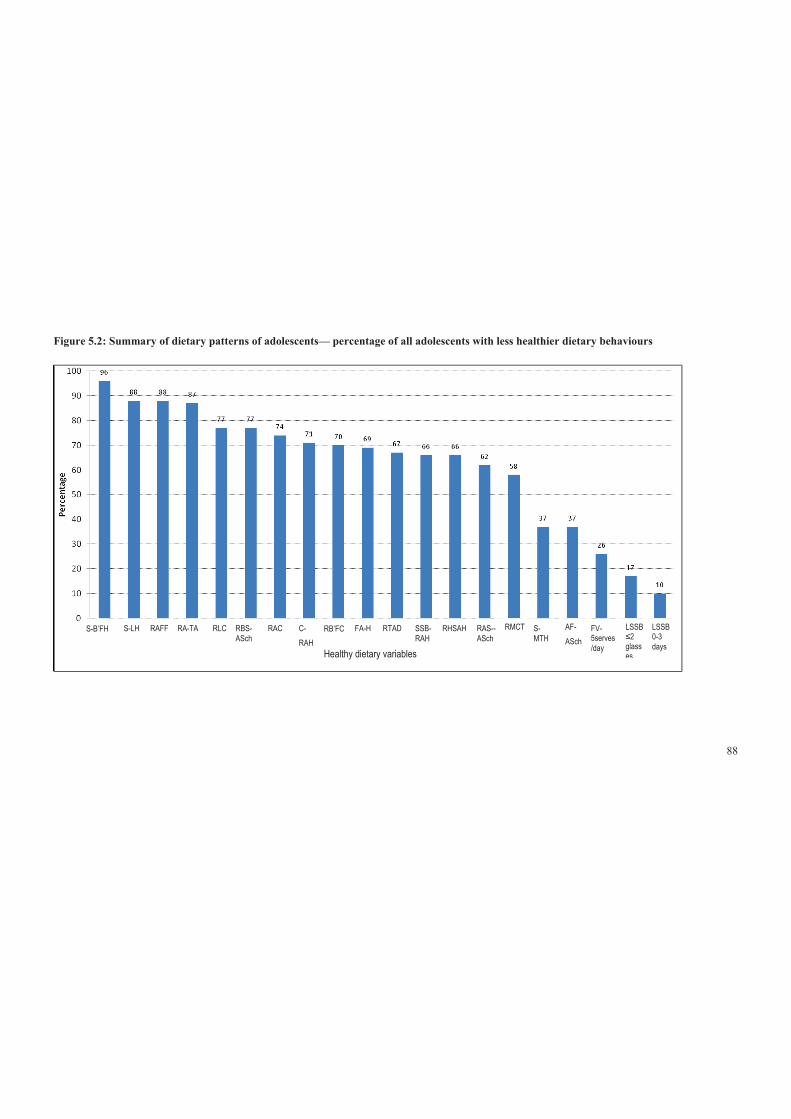
88
Figure 5.2: Summary of dietary patterns of adolescents— percentage of all adolescents with less healthier dietary behaviours
S-B’FH S-LH RAFF RA-TA RLC RBS-ASch
RAC C-RAH
RB’FC FA-H RTAD SSB- RAH
RHSAH RAS-- ASch
RMCT S- MTH
AF- ASch
FV- 5serves/day
LSSB ≤2 glasses
LSSB 0-3 days
Healthy dietary variables
89
Acronym: *SSB-sugar-sweetened beverages, diet drinks excluded; S-B’FH-Source of breakfast from home; S-LH-Source of lunch from home; RAFF-
Rarely ate fried foods; RA-TA-Rarely ate take-away; RLC- Regular lunch consumer; RBS_ASch- Regular bought snacks after school; RAC- Rarely
ate confectionary; C-RAH- Confectionary rarely available at home; RB’FC- Regular breakfast consumer; FA-H- Fruits available at home every day or
most days; RTAD- Rarely takeaway for dinner; SSB-RAH- Sugar sweetened beverages rarely available at home; RHSAH- Rarely have snacks
available at home; RAS-ASch- Rarely ate snack after school; RMTC- Regular morning tea consumer; S-MTH- Source of morning tea from home; AF-
ASch- Ate fruit every day or most days after school; FV-5serves/day- Consumer of 5 or more serves of fruit and vegetables/day; LSSB≤ 2 glasses -
Low SSB i.e. ≤ 2 glasses per day; LSSB 0-3days- Low SSB consumption i.e. 0-3 days.
90
5.3.1.2 Fruit and vegetable consumption
Overall, nearly three-quarters of adolescents failed to meet the recommended >5
serves of fruit and vegetables per day [75]; 77% and 69% for IndoFijians and
Indigenous Fijians, respectively. Similarly, about 71% of males and 76% females
failed to meet the recommendation. Figures 5.3, 5.4 and 5.5 show the association
between BMI-z consumption and fruit and vegetables, with no statistical
relationships either overall or by ethnic and sex sub-groups.
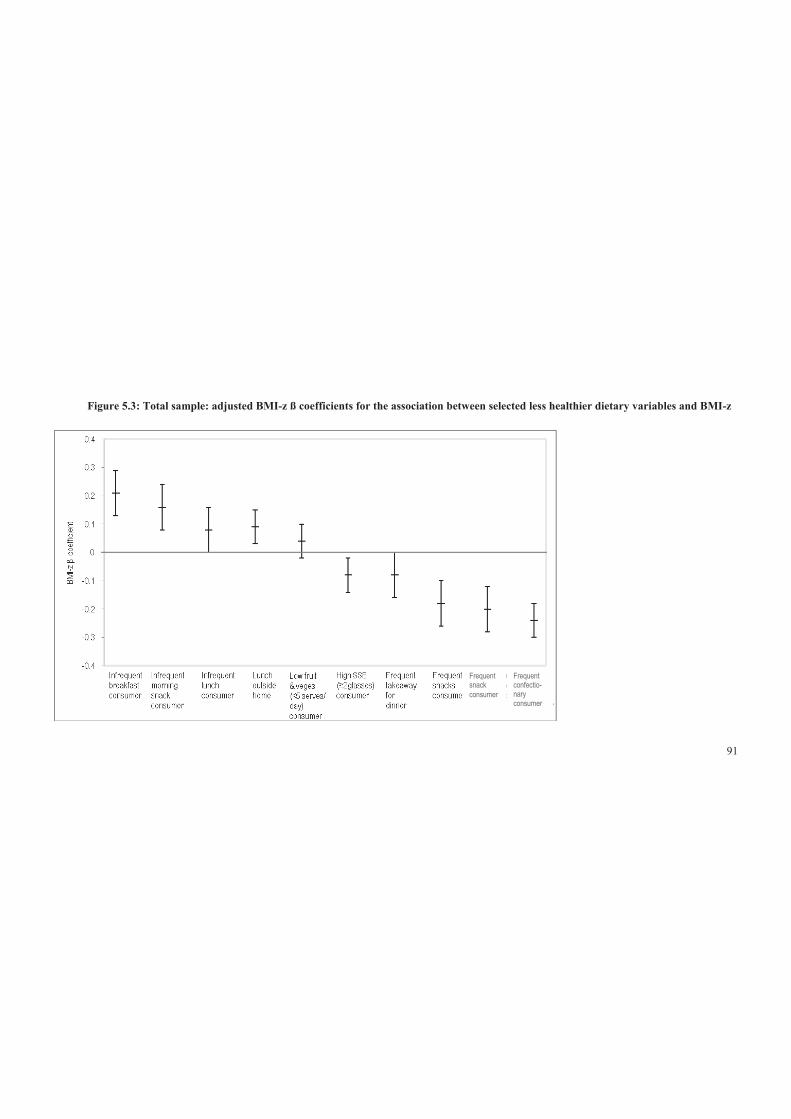
91
Figure 5.3: Total sample: adjusted BMI-z ß coefficients for the association between selected less healthier dietary variables and BMI-z
Frequent confectio- nary consumer
Frequent snack consumer
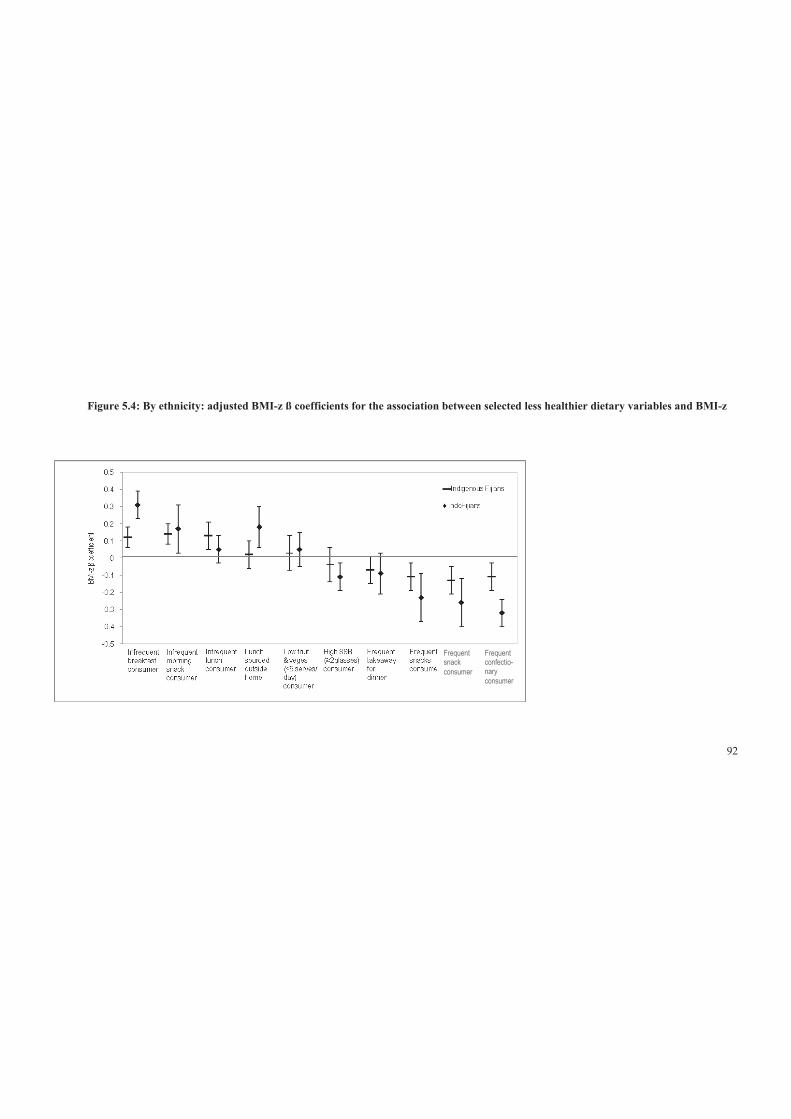
92
Figure 5.4: By ethnicity: adjusted BMI-z ß coefficients for the association between selected less healthier dietary variables and BMI-z
Frequent snack consumer
Frequent confectio- nary consumer
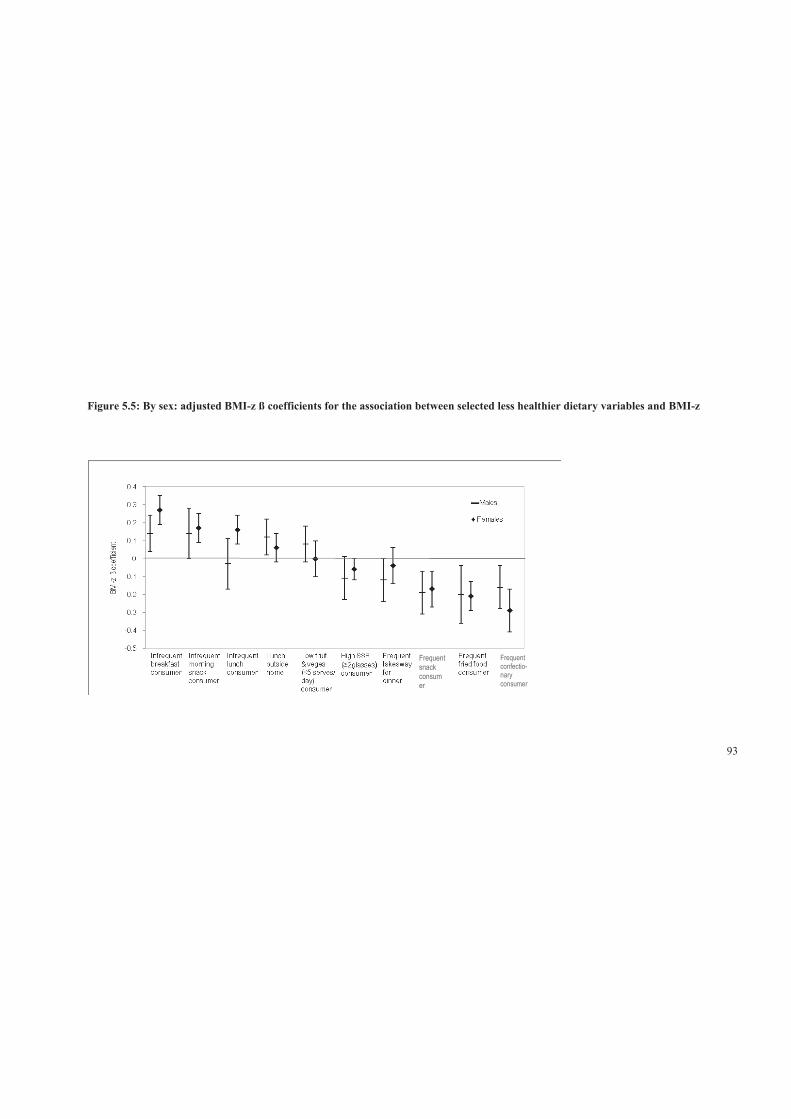
93
Figure 5.5: By sex: adjusted BMI-z ß coefficients for the association between selected less healthier dietary variables and BMI-z
Frequent snack consumer
Frequent confectio- nary consumer
94
5.3.1.3 SSB consumption
Almost 90% of adolescents consumed SSB on a regular basis and, of those, 70%
drank two or more glasses on the school day prior to the survey. Overall and in both
ethnic groups, males consumed more SSB than females. Interestingly, while
Indigenous Fijians reported higher consumption of SSB, they were less available in
Fijian homes compared to IndoFijian homes.
Figures 5.3, 5.4 and 5.5 show a statistically significant associations between high
SSB consumption and BMI-z, both for the total population and for IndoFijians as a
sub-group. This association was in an unexpected direction (i.e., higher SSB
consumption was associated with lower BMI-z).
5.3.1.4 Consumption of takeaway (in general) and takeaway for dinner
Generally, about 13% of adolescents in the overall sample often ate food from a
takeaway such as McDonalds, KFC, Subway, fried chicken, fish and chips,
hamburgers or Chinese takeaway (see Table 5.3). There are no significant differences
among ethnic and sex sub-groups. The association between takeaway consumption
and BMI-z was not statistically significant (see Tables 5.4 and 5.5).
Overall, a third of adolescents ate takeaway for dinner at least once a week. A
significantly higher proportion of Indigenous Fijians (37%) than IndoFijians (30%)
reported eating takeaway for dinner frequently (more than once a week). The
association between consumption of takeaway for dinner and BMI-z was not
statistically significant either for the overall population or by sub-groups (see tables
5.4 and 5.5 and figures 5.3, 5.4 and 5.5).
5.3.1.5 After school high fat/salt snacks consumption
Overall, 38% of the adolescents reported eating snacks such as biscuits, potato chips
or instant noodles after school, and there were significantly more Indigenous Fijians
(41%) than IndoFijians (37%). Overall, a lower BMI-z was associated with frequent
snacking after school. This association was unexpected and held for all the sub-
groups (tables 5.9 and 5.10 and figures 5.3, 5.4 and 5.5)
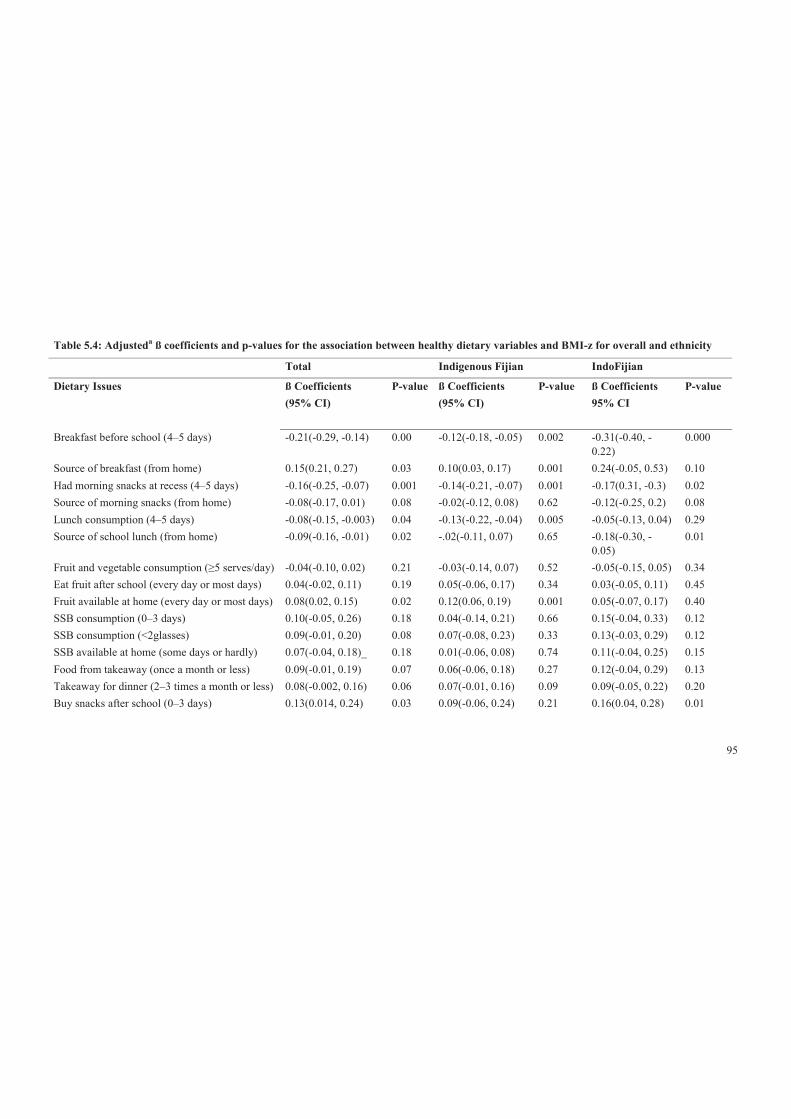
95
Table 5.4: Adjusteda ß coefficients and p-values for the association between healthy dietary variables and BMI-z for overall and ethnicity
Total Indigenous Fijian IndoFijian
Dietary Issues ß Coefficients (95% CI)
P-value ß Coefficients (95% CI)
P-value ß Coefficients 95% CI
P-value
Breakfast before school (4–5 days) -0.21(-0.29, -0.14) 0.00 -0.12(-0.18, -0.05) 0.002 -0.31(-0.40, -0.22)
0.000
Source of breakfast (from home) 0.15(0.21, 0.27) 0.03 0.10(0.03, 0.17) 0.001 0.24(-0.05, 0.53) 0.10 Had morning snacks at recess (4–5 days) -0.16(-0.25, -0.07) 0.001 -0.14(-0.21, -0.07) 0.001 -0.17(0.31, -0.3) 0.02 Source of morning snacks (from home) -0.08(-0.17, 0.01) 0.08 -0.02(-0.12, 0.08) 0.62 -0.12(-0.25, 0.2) 0.08 Lunch consumption (4–5 days) -0.08(-0.15, -0.003) 0.04 -0.13(-0.22, -0.04) 0.005 -0.05(-0.13, 0.04) 0.29 Source of school lunch (from home) -0.09(-0.16, -0.01) 0.02 -.02(-0.11, 0.07) 0.65 -0.18(-0.30, -
0.05) 0.01
Fruit and vegetable consumption (≥5 serves/day) -0.04(-0.10, 0.02) 0.21 -0.03(-0.14, 0.07) 0.52 -0.05(-0.15, 0.05) 0.34 Eat fruit after school (every day or most days) 0.04(-0.02, 0.11) 0.19 0.05(-0.06, 0.17) 0.34 0.03(-0.05, 0.11) 0.45 Fruit available at home (every day or most days) 0.08(0.02, 0.15) 0.02 0.12(0.06, 0.19) 0.001 0.05(-0.07, 0.17) 0.40 SSB consumption (0–3 days) 0.10(-0.05, 0.26) 0.18 0.04(-0.14, 0.21) 0.66 0.15(-0.04, 0.33) 0.12 SSB consumption (<2glasses) 0.09(-0.01, 0.20) 0.08 0.07(-0.08, 0.23) 0.33 0.13(-0.03, 0.29) 0.12 SSB available at home (some days or hardly) 0.07(-0.04, 0.18)_ 0.18 0.01(-0.06, 0.08) 0.74 0.11(-0.04, 0.25) 0.15 Food from takeaway (once a month or less) 0.09(-0.01, 0.19) 0.07 0.06(-0.06, 0.18) 0.27 0.12(-0.04, 0.29) 0.13 Takeaway for dinner (2–3 times a month or less) 0.08(-0.002, 0.16) 0.06 0.07(-0.01, 0.16) 0.09 0.09(-0.05, 0.22) 0.20 Buy snacks after school (0–3 days) 0.13(0.014, 0.24) 0.03 0.09(-0.06, 0.24) 0.21 0.16(0.04, 0.28) 0.01
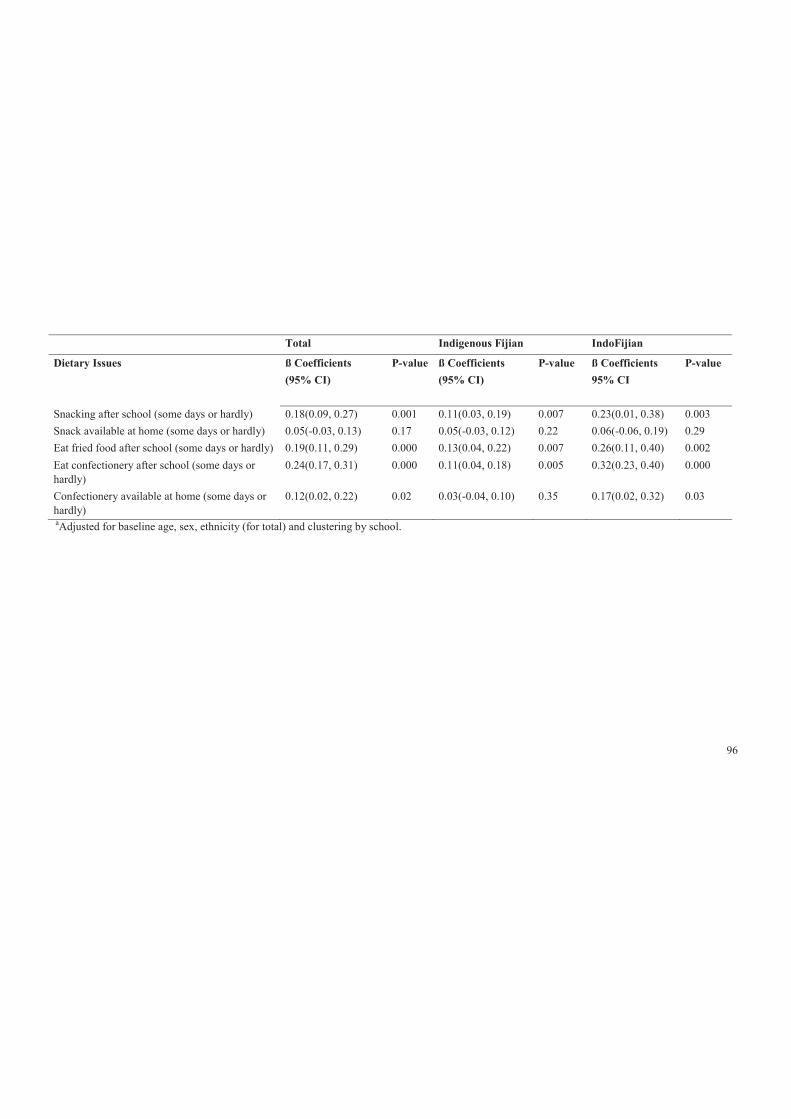
96
Total Indigenous Fijian IndoFijian
Dietary Issues ß Coefficients (95% CI)
P-value ß Coefficients (95% CI)
P-value ß Coefficients 95% CI
P-value
Snacking after school (some days or hardly) 0.18(0.09, 0.27) 0.001 0.11(0.03, 0.19) 0.007 0.23(0.01, 0.38) 0.003 Snack available at home (some days or hardly) 0.05(-0.03, 0.13) 0.17 0.05(-0.03, 0.12) 0.22 0.06(-0.06, 0.19) 0.29 Eat fried food after school (some days or hardly) 0.19(0.11, 0.29) 0.000 0.13(0.04, 0.22) 0.007 0.26(0.11, 0.40) 0.002 Eat confectionery after school (some days or hardly)
0.24(0.17, 0.31) 0.000 0.11(0.04, 0.18) 0.005 0.32(0.23, 0.40) 0.000
Confectionery available at home (some days or hardly)
0.12(0.02, 0.22) 0.02 0.03(-0.04, 0.10) 0.35 0.17(0.02, 0.32) 0.03
aAdjusted for baseline age, sex, ethnicity (for total) and clustering by school.
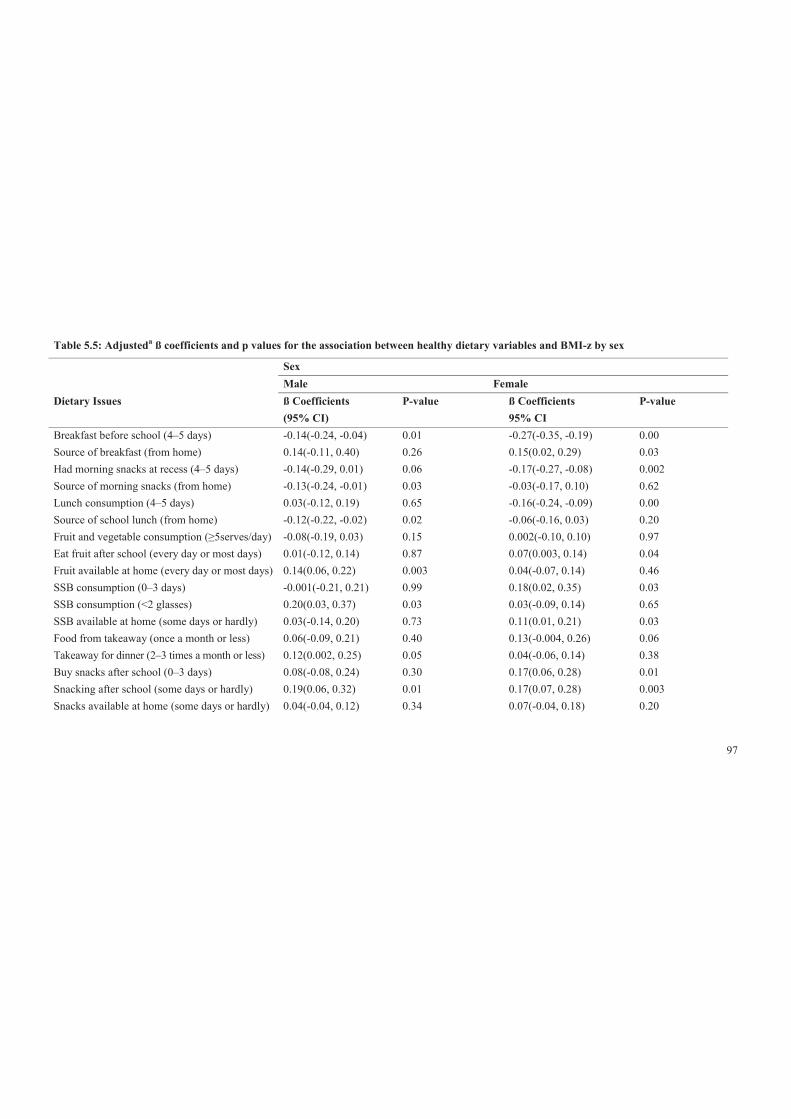
97
Table 5.5: Adjusteda ß coefficients and p values for the association between healthy dietary variables and BMI-z by sex
Sex Male Female Dietary Issues ß Coefficients
(95% CI) P-value ß Coefficients
95% CI P-value
Breakfast before school (4–5 days) -0.14(-0.24, -0.04) 0.01 -0.27(-0.35, -0.19) 0.00 Source of breakfast (from home) 0.14(-0.11, 0.40) 0.26 0.15(0.02, 0.29) 0.03 Had morning snacks at recess (4–5 days) -0.14(-0.29, 0.01) 0.06 -0.17(-0.27, -0.08) 0.002 Source of morning snacks (from home) -0.13(-0.24, -0.01) 0.03 -0.03(-0.17, 0.10) 0.62 Lunch consumption (4–5 days) 0.03(-0.12, 0.19) 0.65 -0.16(-0.24, -0.09) 0.00 Source of school lunch (from home) -0.12(-0.22, -0.02) 0.02 -0.06(-0.16, 0.03) 0.20 Fruit and vegetable consumption (≥5serves/day) -0.08(-0.19, 0.03) 0.15 0.002(-0.10, 0.10) 0.97 Eat fruit after school (every day or most days) 0.01(-0.12, 0.14) 0.87 0.07(0.003, 0.14) 0.04 Fruit available at home (every day or most days) 0.14(0.06, 0.22) 0.003 0.04(-0.07, 0.14) 0.46 SSB consumption (0–3 days) -0.001(-0.21, 0.21) 0.99 0.18(0.02, 0.35) 0.03 SSB consumption (<2 glasses) 0.20(0.03, 0.37) 0.03 0.03(-0.09, 0.14) 0.65 SSB available at home (some days or hardly) 0.03(-0.14, 0.20) 0.73 0.11(0.01, 0.21) 0.03 Food from takeaway (once a month or less) 0.06(-0.09, 0.21) 0.40 0.13(-0.004, 0.26) 0.06 Takeaway for dinner (2–3 times a month or less) 0.12(0.002, 0.25) 0.05 0.04(-0.06, 0.14) 0.38 Buy snacks after school (0–3 days) 0.08(-0.08, 0.24) 0.30 0.17(0.06, 0.28) 0.01 Snacking after school (some days or hardly) 0.19(0.06, 0.32) 0.01 0.17(0.07, 0.28) 0.003 Snacks available at home (some days or hardly) 0.04(-0.04, 0.12) 0.34 0.07(-0.04, 0.18) 0.20
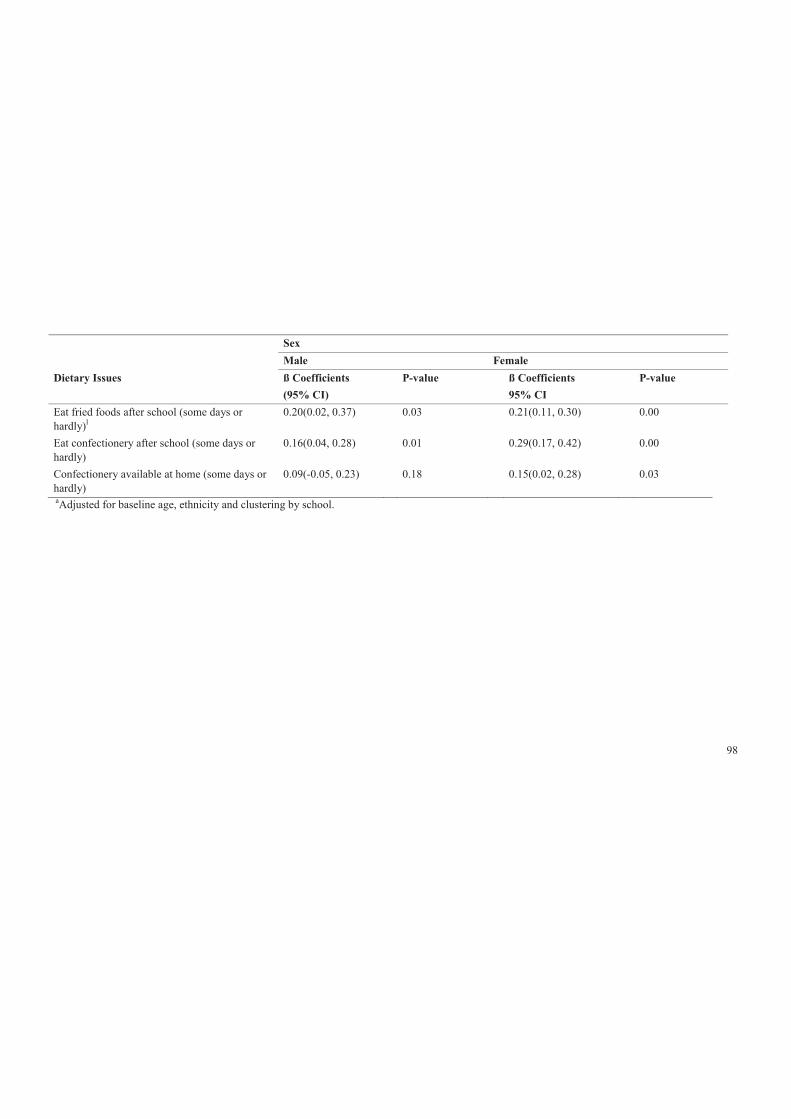
98
Sex Male Female Dietary Issues ß Coefficients
(95% CI) P-value ß Coefficients
95% CI P-value
Eat fried foods after school (some days or hardly)l
0.20(0.02, 0.37) 0.03 0.21(0.11, 0.30) 0.00
Eat confectionery after school (some days or hardly)
0.16(0.04, 0.28) 0.01 0.29(0.17, 0.42) 0.00
Confectionery available at home (some days or hardly)
0.09(-0.05, 0.23) 0.18 0.15(0.02, 0.28) 0.03
aAdjusted for baseline age, ethnicity and clustering by school.
99
5.3.1.6 Fried food consumption
Approximately 13% of adolescents reported consuming fried foods after school
‘every day’ or ‘most days’; there were no significant differences by either ethnicity
or sex. Unexpectedly, frequent consumption of fried foods after school was
associated with a lower BMI-z (-0.19, p<0.001) in the overall sample. This finding
was consistent across ethnic and sex sub-groups, with IndoFijians (-0.26, p <0.05)
having lower beta coefficients than Indigenous Fijians (-0.13, p<0.05).
5.3.1.7 Consumption of confectionery
About 26% (CI 25.1; 27.4) of adolescents in the overall sample reported consuming
confectionery ‘every day’ or ‘most days’. Confectionery consumption was
significantly higher among IndoFijians (28%) than Indigenous Fijians (24%), as well
as females (31%) compared to males (21%). Contrary to expectations, adolescents
with lower BMI-z reported more frequent eating of confectionery after school (see
Figure 5.3). This was consistent across ethnicity and sex sub-groups, with a
significantly stronger association among IndoFijians (see tables 5.4 and 5.5 and
figures 5.4 and 5.5).
5.3.2 Summary of descriptive dietary patterns: overall, ethnicity and
sex—an overview of key obesogenic dietary variables
Table 5.6 presents the overview of obesogenic dietary patterns based on descriptive
analysis for the ethnic and sex groups. The high consumption of SSB and low intake
of fruit and vegetables were significant dietary issues. The majority of adolescents
were consuming insufficient fruit and vegetables and drinking a lot of SSB. The
proportions were higher among IndoFijians and males. Meal regularity was also a
problem; about a quarter of the adolescents skipped breakfast occasionally before
school and the proportions were higher for Indigenous Fijians and females. Over
one-third of adolescents consumed takeaway for dinner frequently and this was more
common among Indigenous Fijians. Overall, the dietary patterns were healthier for
IndoFijians compared with Indigenous Fijians, except for the irregular lunch
consumption and frequent consumption of confectionery and sweets after school
seen among IndoFijians. For sex, overall dietary patterns were healthier for males
compared to females.
100
Table 5.7 presents the overview of obesogenic dietary patterns based on descriptive
analysis for male and female within the two main ethnic groups. The high
consumption of SSB and low intake of fruit and vegetables were significant dietary
issues. The majority of adolescents were consuming insufficient fruit and vegetables
and drinking a lot of SSB The proportions were higher among both males and
females within the two main ethnic groups, especially for SSB consumption which
was more common among Indigenous Fijian males and females and insufficient fruit
consumption was common among IndoFijian males and females.
Meal regularity was also a problem; over 1/4 of Indigenous Fijian males and over 1/3
of Indigenous Fijian females did not have breakfast 4–5 days. Substantial minority
(~1/5) skipped lunch. More common among IndoFijian and female sub-groups. Over
one-third of adolescents consumed takeaway for dinner frequently and this was more
common among Indigenous Fijians. In general, the dietary patterns were healthier for
males compared with females.
5.3.3 Summary of dietary patterns and relationships with BMI-z
In summary, Table 5. presents an overview of the associations between obesogenic
dietary patterns and BMI-z for overall, ethnicity and sex. For example, a higher
proportion of adolescents engaged in SSB consumption compared to skipping lunch.
Findings are quite consistent with analysis using dichotomous weight status for the
overall sample in terms of irregularity of meals, especially skipping breakfast,
morning snacks and lunch. In addition, for the unexpected outcomes, similar results
were found where frequently consumed high-energy/salt snacks, fried foods and
confectionery were obesogenic patterns.
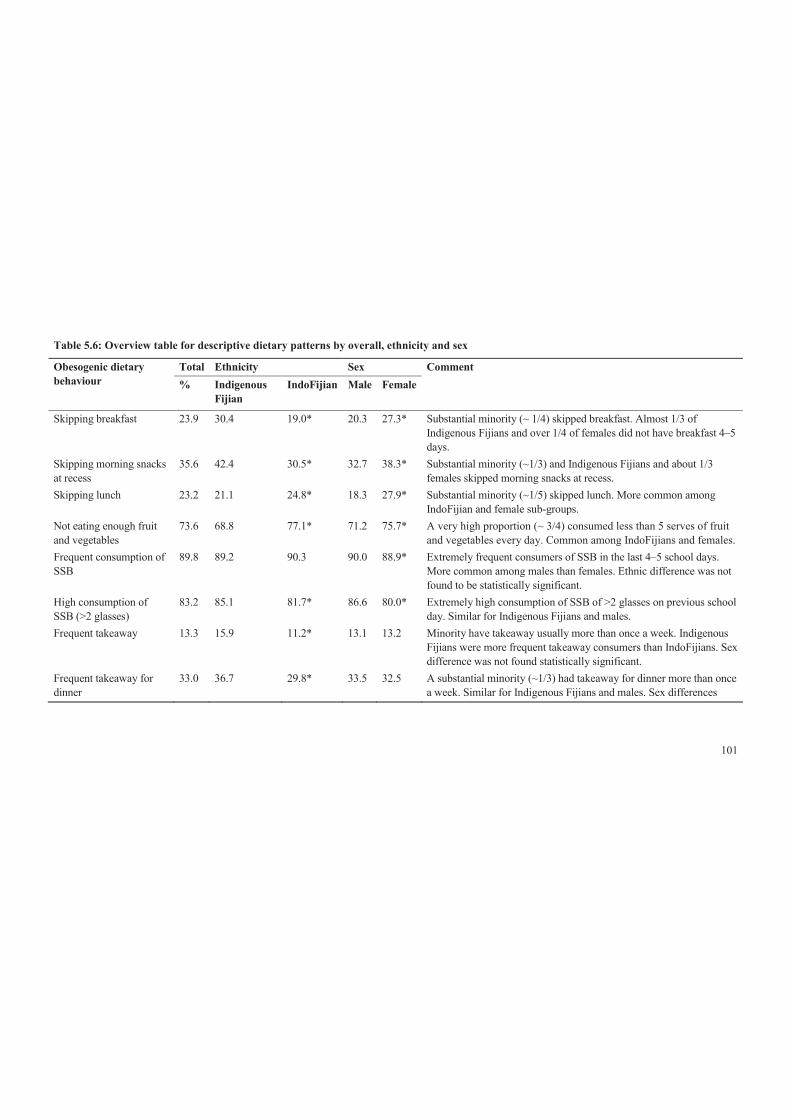
101
Table 5.6: Overview table for descriptive dietary patterns by overall, ethnicity and sex
Obesogenic dietary behaviour
Total Ethnicity Sex Comment % Indigenous
Fijian IndoFijian Male Female
Skipping breakfast 23.9 30.4 19.0* 20.3 27.3* Substantial minority (~ 1/4) skipped breakfast. Almost 1/3 of Indigenous Fijians and over 1/4 of females did not have breakfast 4–5 days.
Skipping morning snacks at recess
35.6 42.4 30.5* 32.7 38.3* Substantial minority (~1/3) and Indigenous Fijians and about 1/3 females skipped morning snacks at recess.
Skipping lunch 23.2 21.1 24.8* 18.3 27.9* Substantial minority (~1/5) skipped lunch. More common among IndoFijian and female sub-groups.
Not eating enough fruit and vegetables
73.6 68.8 77.1* 71.2 75.7* A very high proportion (~ 3/4) consumed less than 5 serves of fruit and vegetables every day. Common among IndoFijians and females.
Frequent consumption of SSB
89.8 89.2 90.3 90.0 88.9* Extremely frequent consumers of SSB in the last 4–5 school days. More common among males than females. Ethnic difference was not found to be statistically significant.
High consumption of SSB (>2 glasses)
83.2 85.1 81.7* 86.6 80.0* Extremely high consumption of SSB of >2 glasses on previous school day. Similar for Indigenous Fijians and males.
Frequent takeaway 13.3 15.9 11.2* 13.1 13.2 Minority have takeaway usually more than once a week. Indigenous Fijians were more frequent takeaway consumers than IndoFijians. Sex difference was not found statistically significant.
Frequent takeaway for dinner
33.0 36.7 29.8* 33.5 32.5 A substantial minority (~1/3) had takeaway for dinner more than once a week. Similar for Indigenous Fijians and males. Sex differences
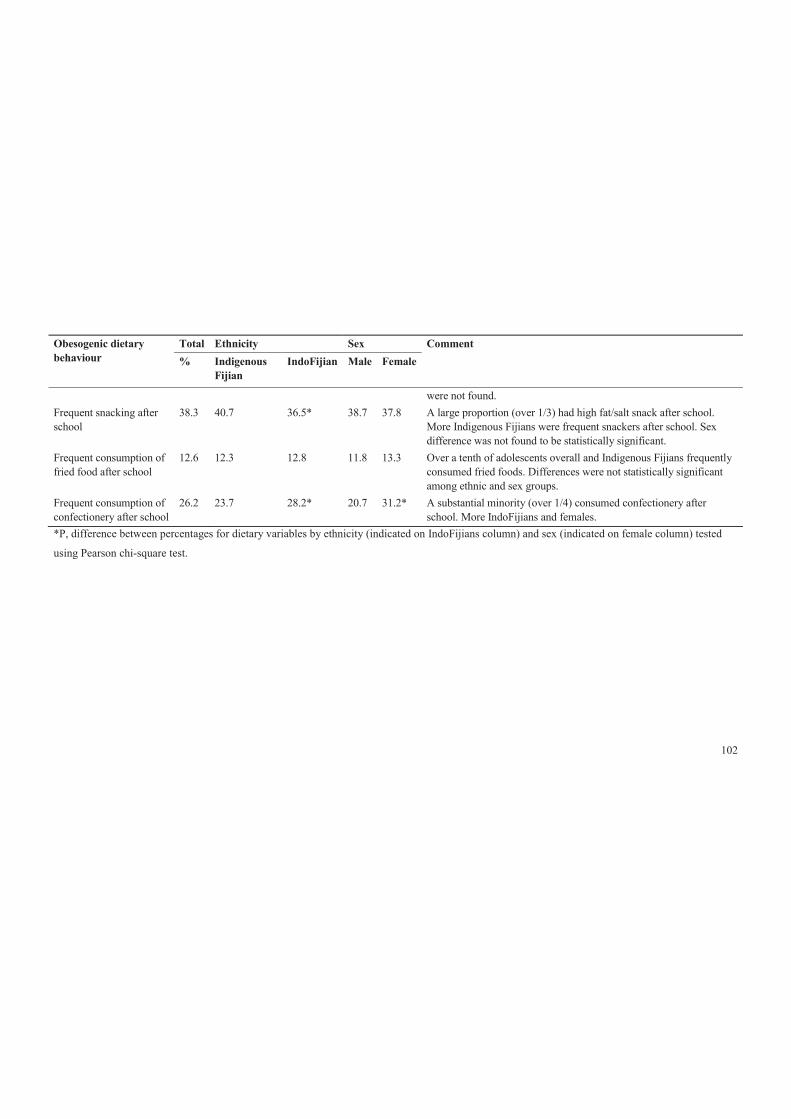
102
Obesogenic dietary behaviour
Total Ethnicity Sex Comment % Indigenous
Fijian IndoFijian Male Female
were not found. Frequent snacking after school
38.3 40.7 36.5* 38.7 37.8 A large proportion (over 1/3) had high fat/salt snack after school. More Indigenous Fijians were frequent snackers after school. Sex difference was not found to be statistically significant.
Frequent consumption of fried food after school
12.6 12.3 12.8 11.8 13.3 Over a tenth of adolescents overall and Indigenous Fijians frequently consumed fried foods. Differences were not statistically significant among ethnic and sex groups.
Frequent consumption of confectionery after school
26.2 23.7 28.2* 20.7 31.2* A substantial minority (over 1/4) consumed confectionery after school. More IndoFijians and females.
*P, difference between percentages for dietary variables by ethnicity (indicated on IndoFijians column) and sex (indicated on female column) tested
using Pearson chi-square test.
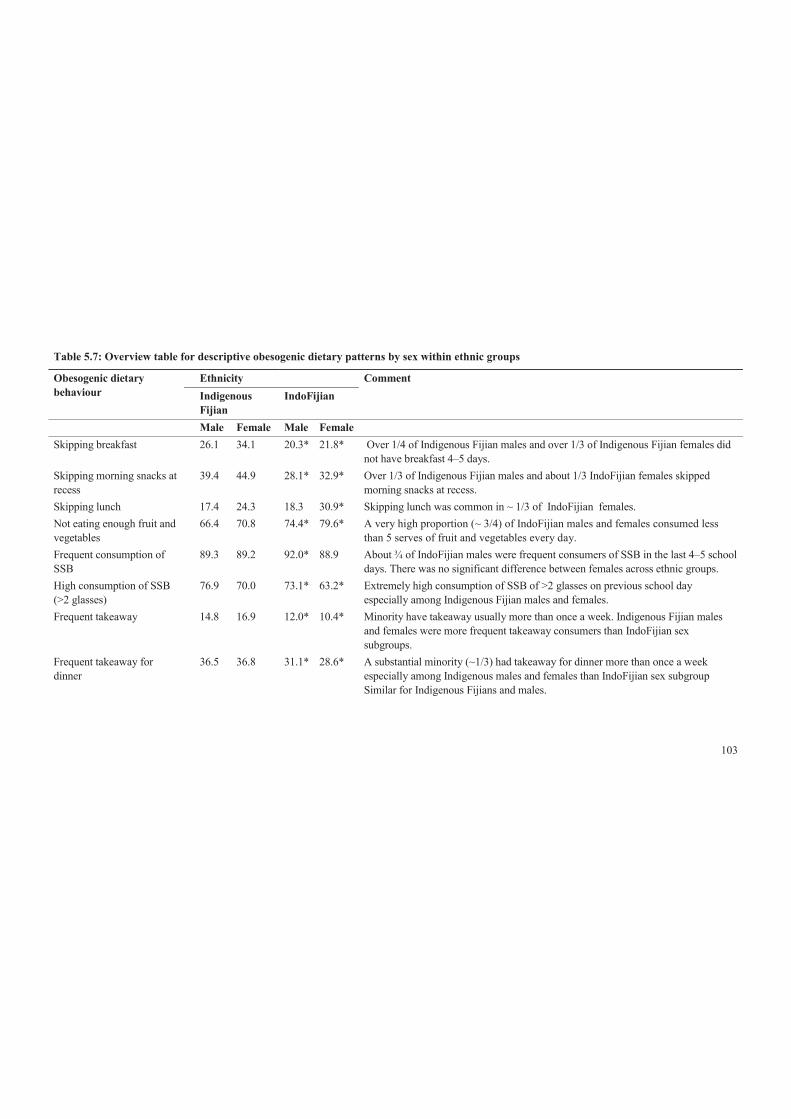
103
Table 5.7: Overview table for descriptive obesogenic dietary patterns by sex within ethnic groups
Obesogenic dietary behaviour
Ethnicity Comment Indigenous
Fijian IndoFijian
Male Female Male Female Skipping breakfast 26.1 34.1 20.3* 21.8* Over 1/4 of Indigenous Fijian males and over 1/3 of Indigenous Fijian females did
not have breakfast 4–5 days. Skipping morning snacks at recess
39.4 44.9 28.1* 32.9* Over 1/3 of Indigenous Fijian males and about 1/3 IndoFijian females skipped morning snacks at recess.
Skipping lunch 17.4 24.3 18.3 30.9* Skipping lunch was common in ~ 1/3 of IndoFijian females. Not eating enough fruit and vegetables
66.4 70.8 74.4* 79.6* A very high proportion (~ 3/4) of IndoFijian males and females consumed less than 5 serves of fruit and vegetables every day.
Frequent consumption of SSB
89.3 89.2 92.0* 88.9 About ¾ of IndoFijian males were frequent consumers of SSB in the last 4–5 school days. There was no significant difference between females across ethnic groups.
High consumption of SSB (>2 glasses)
76.9 70.0 73.1* 63.2* Extremely high consumption of SSB of >2 glasses on previous school day especially among Indigenous Fijian males and females.
Frequent takeaway 14.8 16.9 12.0* 10.4* Minority have takeaway usually more than once a week. Indigenous Fijian males and females were more frequent takeaway consumers than IndoFijian sex subgroups.
Frequent takeaway for dinner
36.5 36.8 31.1* 28.6* A substantial minority (~1/3) had takeaway for dinner more than once a week especially among Indigenous males and females than IndoFijian sex subgroup Similar for Indigenous Fijians and males.
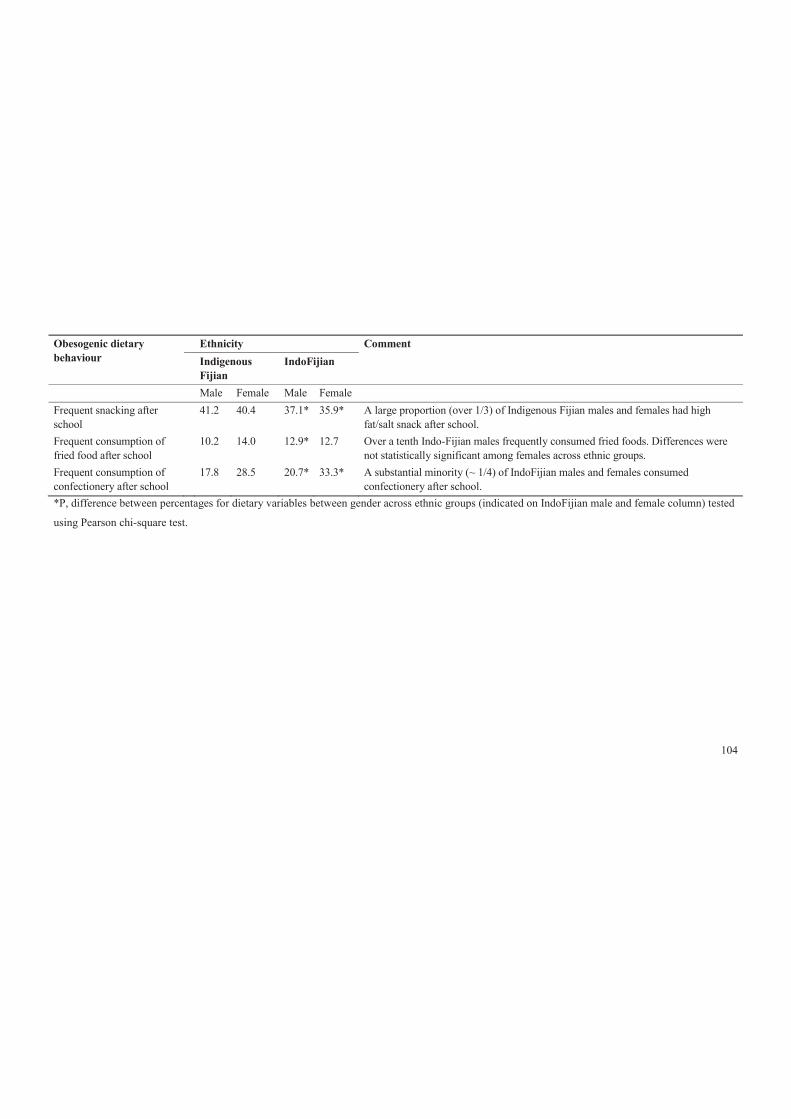
104
Obesogenic dietary behaviour
Ethnicity Comment Indigenous
Fijian IndoFijian
Male Female Male Female Frequent snacking after school
41.2 40.4 37.1* 35.9* A large proportion (over 1/3) of Indigenous Fijian males and females had high fat/salt snack after school.
Frequent consumption of fried food after school
10.2 14.0 12.9* 12.7 Over a tenth Indo-Fijian males frequently consumed fried foods. Differences were not statistically significant among females across ethnic groups.
Frequent consumption of confectionery after school
17.8 28.5 20.7* 33.3* A substantial minority (~ 1/4) of IndoFijian males and females consumed confectionery after school.
*P, difference between percentages for dietary variables between gender across ethnic groups (indicated on IndoFijian male and female column) tested
using Pearson chi-square test.
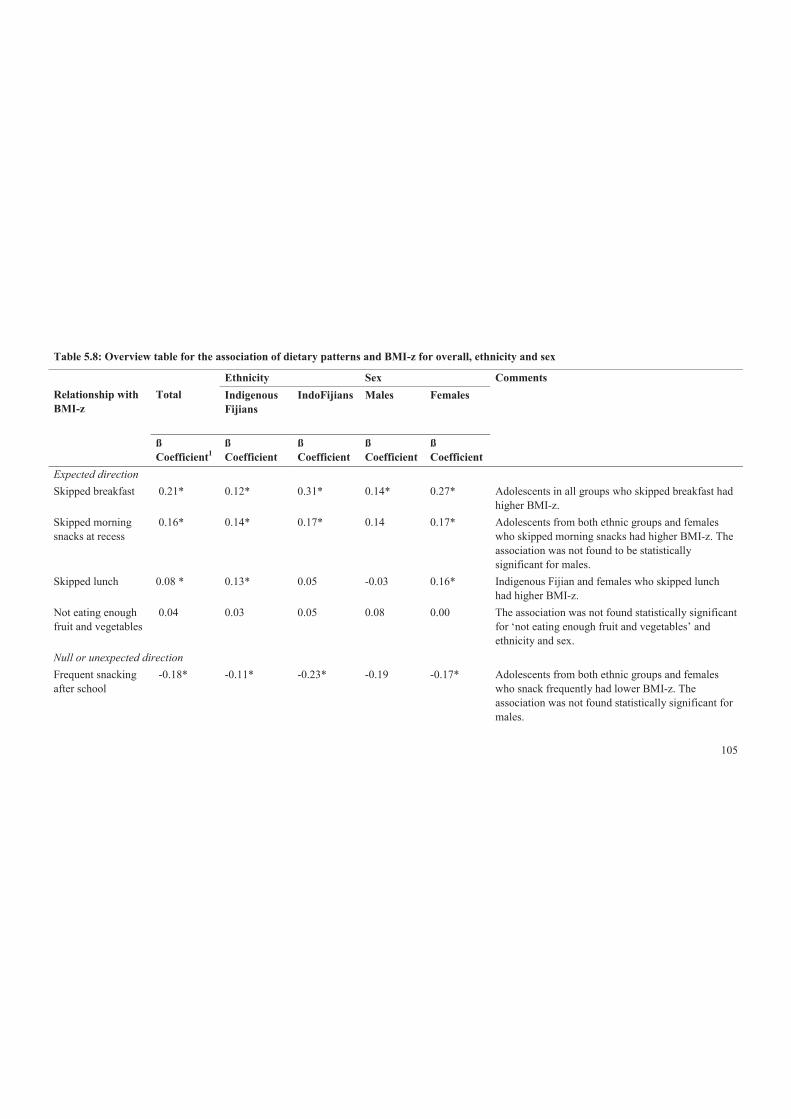
105
Table 5.8: Overview table for the association of dietary patterns and BMI-z for overall, ethnicity and sex
Relationship with BMI-z
Total
Ethnicity Sex Comments Indigenous Fijians
IndoFijians
Males
Females
ß Coefficient1
ß Coefficient
ß Coefficient
ß Coefficient
ß Coefficient
Expected direction Skipped breakfast 0.21* 0.12* 0.31* 0.14* 0.27* Adolescents in all groups who skipped breakfast had
higher BMI-z. Skipped morning snacks at recess
0.16* 0.14* 0.17* 0.14 0.17* Adolescents from both ethnic groups and females who skipped morning snacks had higher BMI-z. The association was not found to be statistically significant for males.
Skipped lunch 0.08 * 0.13* 0.05 -0.03 0.16* Indigenous Fijian and females who skipped lunch had higher BMI-z.
Not eating enough fruit and vegetables
0.04 0.03 0.05 0.08 0.00 The association was not found statistically significant for ‘not eating enough fruit and vegetables’ and ethnicity and sex.
Null or unexpected direction Frequent snacking after school
-0.18* -0.11* -0.23* -0.19 -0.17* Adolescents from both ethnic groups and females who snack frequently had lower BMI-z. The association was not found statistically significant for males.
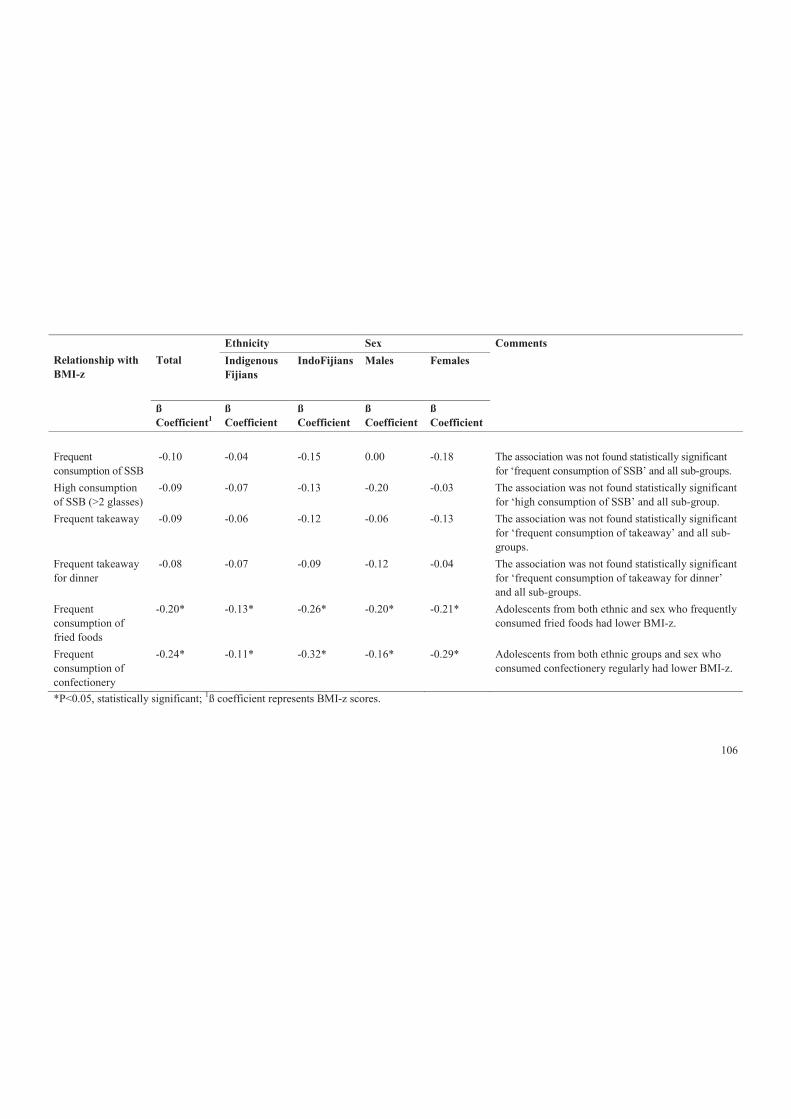
106
Relationship with BMI-z
Total
Ethnicity Sex Comments Indigenous Fijians
IndoFijians
Males
Females
ß Coefficient1
ß Coefficient
ß Coefficient
ß Coefficient
ß Coefficient
Frequent consumption of SSB
-0.10 -0.04 -0.15 0.00 -0.18 The association was not found statistically significant for ‘frequent consumption of SSB’ and all sub-groups.
High consumption of SSB (>2 glasses)
-0.09 -0.07 -0.13 -0.20 -0.03 The association was not found statistically significant for ‘high consumption of SSB’ and all sub-group.
Frequent takeaway -0.09 -0.06 -0.12 -0.06 -0.13 The association was not found statistically significant for ‘frequent consumption of takeaway’ and all sub-groups.
Frequent takeaway for dinner
-0.08 -0.07 -0.09 -0.12 -0.04 The association was not found statistically significant for ‘frequent consumption of takeaway for dinner’ and all sub-groups.
Frequent consumption of fried foods
-0.20* -0.13* -0.26* -0.20* -0.21* Adolescents from both ethnic and sex who frequently consumed fried foods had lower BMI-z.
Frequent consumption of confectionery
-0.24* -0.11* -0.32* -0.16* -0.29* Adolescents from both ethnic groups and sex who consumed confectionery regularly had lower BMI-z.
*P<0.05, statistically significant; 1ß coefficient represents BMI-z scores.
107
5.3.4 Dietary patterns and relationship with weight status: overall
and ethnicity
Table 5.9 shows the associations between dietary patterns and weight status for
overall and by ethnicity and adjusted for age, sex, ethnicity (for total only) and
clustering effect by school. Variables have been dichotomised and analysed such that
a higher odds ratio (>1) indicates a greater odds of healthy behaviour among
‘overweight’ adolescents than among the ‘not overweight’ (reference category). This
analysis assumes that eating breakfast, morning snacks and lunch regularly, ≥5serves
of fruit and vegetables, drinking less soft and fruit drinks, less snacking on high
fat/salt/sugar foods and less takeaway foods are the healthy eating patterns. It is
expected that those with ‘overweight’ will be less likely to have healthier eating
patterns and would thus show as a lower odds ratio.
Overall, the associations between dietary patterns and weight status showed that
‘overweight’ adolescents were less likely to have breakfast, morning snacks and
lunch regularly. Conversely, ‘overweight’ adolescents had higher odds of rarely
consuming takeaway for dinner (OR=1.17, p<0.05), snacks after school (OR=1.29,
p<0.05), fried foods (OR= 1.31, p<0.05) and confectionery (OR= 1.41, p<0.05) than
their ‘not overweight’ peers. There was a trend showing that ‘overweight’
adolescents had lower odds of meeting the fruit and vegetables recommendation;
however, it was not statistically significant.
Analyses within the ethnic groups showed that ‘overweight’ Indigenous Fijians and
IndoFijians had lower odds of regularly consuming breakfast (Indigenous Fijians
OR=0.83, p<0.05; IndoFijians OR= 0.63, p<0.05) and morning snacks (Indigenous
Fijians OR=0.74, p<0.05; IndoFijians OR= 0.70, p<0.05) compared to their ‘not
overweight’ peers. ‘Overweight’ Indigenous Fijians were also found to be less likely
to have lunch regularly than their ‘not overweight’ peers. Contrary to expectations,
‘overweight’ IndoFijians rarely consumed SSB, takeaway for dinner, snacks after
school, fried foods and confectionery than their ‘not overweight’ peers. No
statistically significant associations were detected for these dietary patterns among
Indigenous Fijians.
108
5.3.5 Dietary patterns and relationship with weight status: sex sub-
group
The associations between dietary variables and weight status by sex are presented in
Table 5.10, as unadjusted values and adjusted for baseline age, ethnicity and
clustering effect by school. As for the above analysis, variables have been
dichotomised and analysed such that a higher odds ratio indicates healthier behaviour
among the ‘overweight’ group, compared to the ‘not overweight’ reference group.
Similar to previous overall analyses for dietary patterns, regular consumption of
breakfast, morning snacks and lunch, which was significantly associated with weight
status in the overall analysis, after stratification by sex, the associations were only
significant among ‘overweight’ females, while significant for only regular morning
snacks consumption among ‘overweight’ males. Similarly, conversely, ‘overweight’
adolescents of both sexes had higher odds of rarely consuming snacks (Males
OR=1.30, p<0.05; Females OR=1.29, p<0.05) and fried foods (Males OR= 1.43,
p<0.05; Females OR=1.29, p<0.05), after school than their ‘not overweight’ peers.
However, there were differences found in the association between weight status and
dietary patterns such as consumption of breakfast, lunch, takeaway (including for
dinner) and confectionery.
.
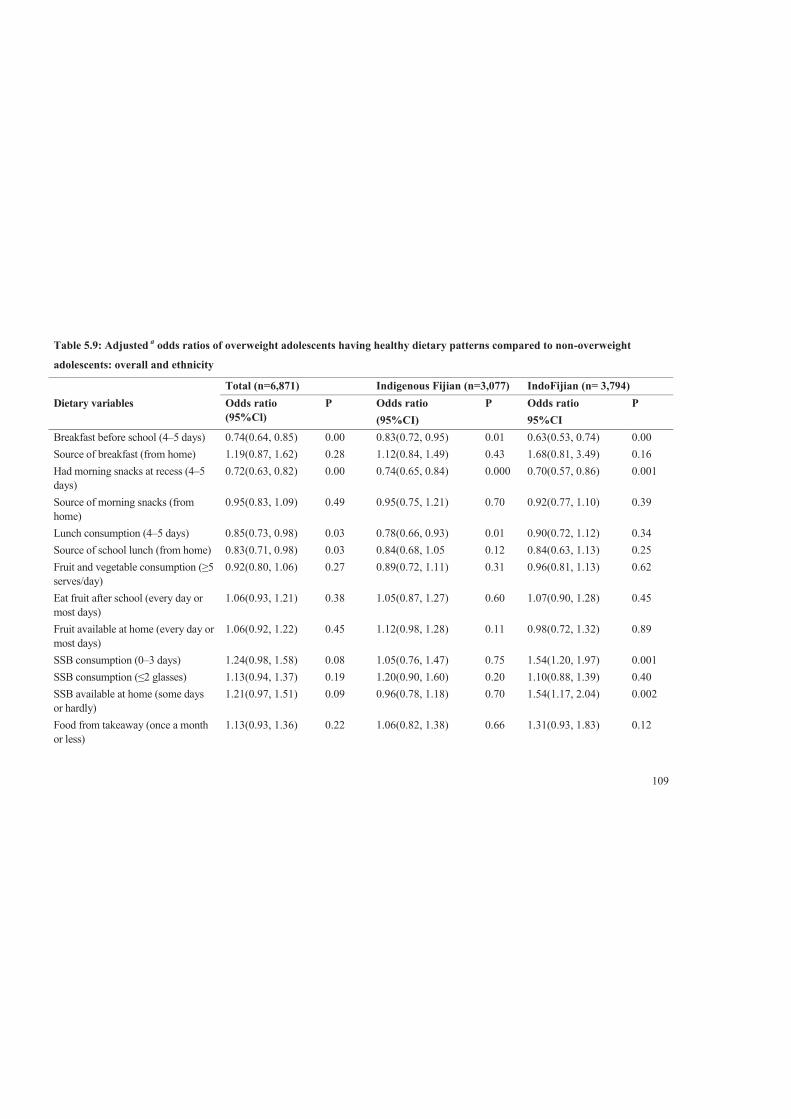
109
Table 5.9: Adjusted a odds ratios of overweight adolescents having healthy dietary patterns compared to non-overweight
adolescents: overall and ethnicity
Total (n=6,871) Indigenous Fijian (n=3,077) IndoFijian (n= 3,794) Dietary variables Odds ratio
(95%Cl) P Odds ratio
(95%CI) P Odds ratio
95%CI P
Breakfast before school (4–5 days) 0.74(0.64, 0.85) 0.00 0.83(0.72, 0.95) 0.01 0.63(0.53, 0.74) 0.00 Source of breakfast (from home) 1.19(0.87, 1.62) 0.28 1.12(0.84, 1.49) 0.43 1.68(0.81, 3.49) 0.16 Had morning snacks at recess (4–5 days)
0.72(0.63, 0.82) 0.00 0.74(0.65, 0.84) 0.000 0.70(0.57, 0.86) 0.001
Source of morning snacks (from home)
0.95(0.83, 1.09) 0.49 0.95(0.75, 1.21) 0.70 0.92(0.77, 1.10) 0.39
Lunch consumption (4–5 days) 0.85(0.73, 0.98) 0.03 0.78(0.66, 0.93) 0.01 0.90(0.72, 1.12) 0.34 Source of school lunch (from home) 0.83(0.71, 0.98) 0.03 0.84(0.68, 1.05 0.12 0.84(0.63, 1.13) 0.25 Fruit and vegetable consumption (≥5 serves/day)
0.92(0.80, 1.06) 0.27 0.89(0.72, 1.11) 0.31 0.96(0.81, 1.13) 0.62
Eat fruit after school (every day or most days)
1.06(0.93, 1.21) 0.38 1.05(0.87, 1.27) 0.60 1.07(0.90, 1.28) 0.45
Fruit available at home (every day or most days)
1.06(0.92, 1.22) 0.45 1.12(0.98, 1.28) 0.11 0.98(0.72, 1.32) 0.89
SSB consumption (0–3 days) 1.24(0.98, 1.58) 0.08 1.05(0.76, 1.47) 0.75 1.54(1.20, 1.97) 0.001 SSB consumption (≤2 glasses) 1.13(0.94, 1.37) 0.19 1.20(0.90, 1.60) 0.20 1.10(0.88, 1.39) 0.40 SSB available at home (some days or hardly)
1.21(0.97, 1.51) 0.09 0.96(0.78, 1.18) 0.70 1.54(1.17, 2.04) 0.002
Food from takeaway (once a month or less)
1.13(0.93, 1.36) 0.22 1.06(0.82, 1.38) 0.66 1.31(0.93, 1.83) 0.12
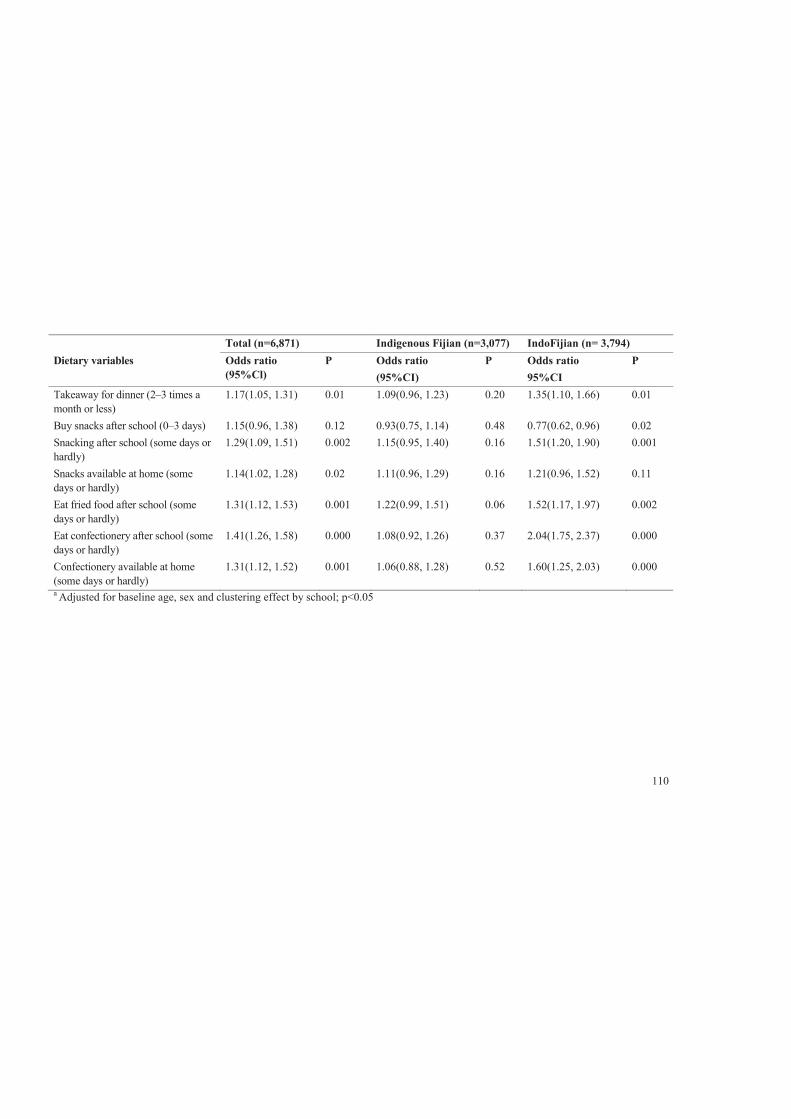
110
Total (n=6,871) Indigenous Fijian (n=3,077) IndoFijian (n= 3,794) Dietary variables Odds ratio
(95%Cl) P Odds ratio
(95%CI) P Odds ratio
95%CI P
Takeaway for dinner (2–3 times a month or less)
1.17(1.05, 1.31) 0.01 1.09(0.96, 1.23) 0.20 1.35(1.10, 1.66) 0.01
Buy snacks after school (0–3 days) 1.15(0.96, 1.38) 0.12 0.93(0.75, 1.14) 0.48 0.77(0.62, 0.96) 0.02 Snacking after school (some days or hardly)
1.29(1.09, 1.51) 0.002 1.15(0.95, 1.40) 0.16 1.51(1.20, 1.90) 0.001
Snacks available at home (some days or hardly)
1.14(1.02, 1.28) 0.02 1.11(0.96, 1.29) 0.16 1.21(0.96, 1.52) 0.11
Eat fried food after school (some days or hardly)
1.31(1.12, 1.53) 0.001 1.22(0.99, 1.51) 0.06 1.52(1.17, 1.97) 0.002
Eat confectionery after school (some days or hardly)
1.41(1.26, 1.58) 0.000 1.08(0.92, 1.26) 0.37 2.04(1.75, 2.37) 0.000
Confectionery available at home (some days or hardly)
1.31(1.12, 1.52) 0.001 1.06(0.88, 1.28) 0.52 1.60(1.25, 2.03) 0.000
a Adjusted for baseline age, sex and clustering effect by school; p<0.05
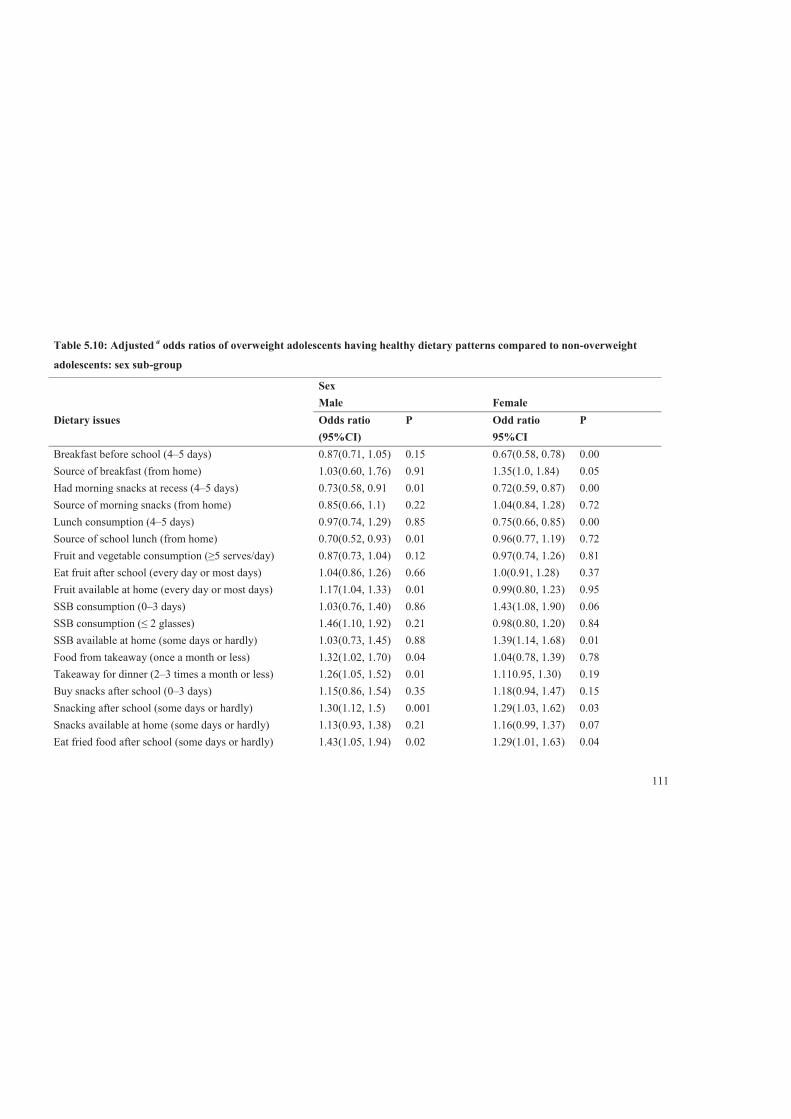
111
Table 5.10: Adjusted a odds ratios of overweight adolescents having healthy dietary patterns compared to non-overweight
adolescents: sex sub-group
Sex Male Female Dietary issues Odds ratio
(95%CI) P Odd ratio
95%CI P
Breakfast before school (4–5 days) 0.87(0.71, 1.05) 0.15 0.67(0.58, 0.78) 0.00 Source of breakfast (from home) 1.03(0.60, 1.76) 0.91 1.35(1.0, 1.84) 0.05 Had morning snacks at recess (4–5 days) 0.73(0.58, 0.91 0.01 0.72(0.59, 0.87) 0.00 Source of morning snacks (from home) 0.85(0.66, 1.1) 0.22 1.04(0.84, 1.28) 0.72 Lunch consumption (4–5 days) 0.97(0.74, 1.29) 0.85 0.75(0.66, 0.85) 0.00 Source of school lunch (from home) 0.70(0.52, 0.93) 0.01 0.96(0.77, 1.19) 0.72 Fruit and vegetable consumption (≥5 serves/day) 0.87(0.73, 1.04) 0.12 0.97(0.74, 1.26) 0.81 Eat fruit after school (every day or most days) 1.04(0.86, 1.26) 0.66 1.0(0.91, 1.28) 0.37 Fruit available at home (every day or most days) 1.17(1.04, 1.33) 0.01 0.99(0.80, 1.23) 0.95 SSB consumption (0–3 days) 1.03(0.76, 1.40) 0.86 1.43(1.08, 1.90) 0.06 SSB consumption (≤ 2 glasses) 1.46(1.10, 1.92) 0.21 0.98(0.80, 1.20) 0.84 SSB available at home (some days or hardly) 1.03(0.73, 1.45) 0.88 1.39(1.14, 1.68) 0.01 Food from takeaway (once a month or less) 1.32(1.02, 1.70) 0.04 1.04(0.78, 1.39) 0.78 Takeaway for dinner (2–3 times a month or less) 1.26(1.05, 1.52) 0.01 1.110.95, 1.30) 0.19 Buy snacks after school (0–3 days) 1.15(0.86, 1.54) 0.35 1.18(0.94, 1.47) 0.15 Snacking after school (some days or hardly) 1.30(1.12, 1.5) 0.001 1.29(1.03, 1.62) 0.03 Snacks available at home (some days or hardly) 1.13(0.93, 1.38) 0.21 1.16(0.99, 1.37) 0.07 Eat fried food after school (some days or hardly) 1.43(1.05, 1.94) 0.02 1.29(1.01, 1.63) 0.04
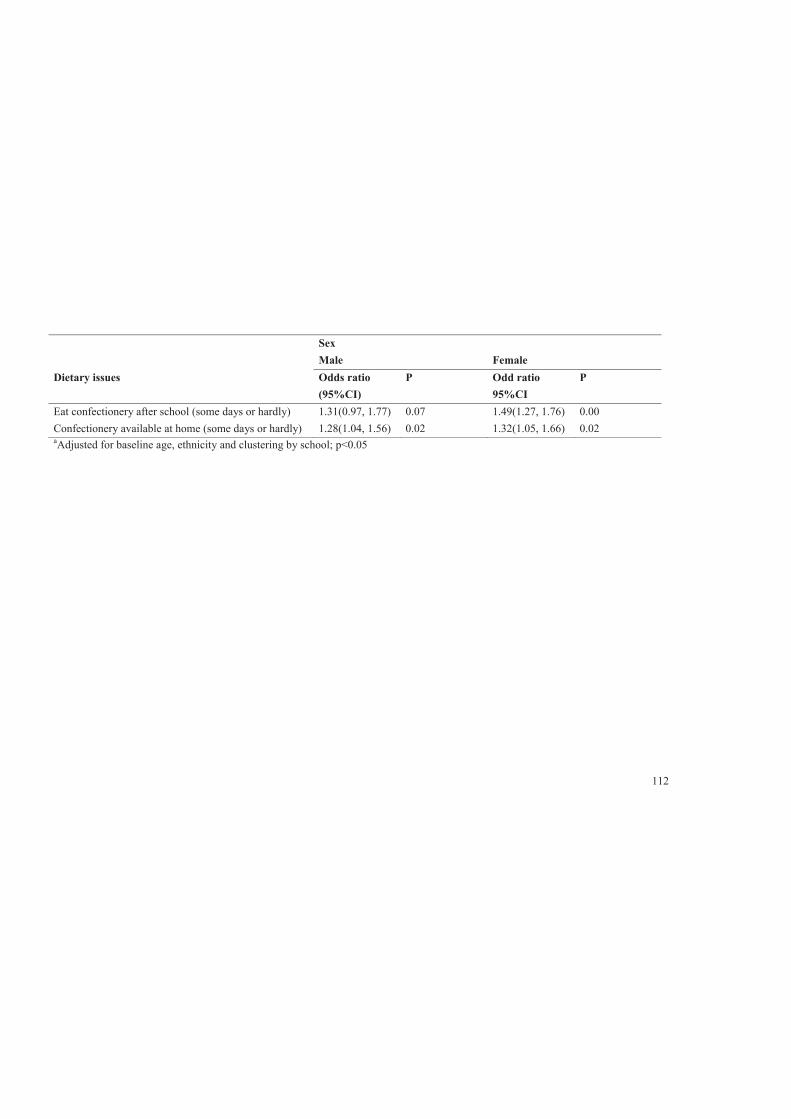
112
Sex Male Female Dietary issues Odds ratio
(95%CI) P Odd ratio
95%CI P
Eat confectionery after school (some days or hardly) 1.31(0.97, 1.77) 0.07 1.49(1.27, 1.76) 0.00 Confectionery available at home (some days or hardly) 1.28(1.04, 1.56) 0.02 1.32(1.05, 1.66) 0.02 aAdjusted for baseline age, ethnicity and clustering by school; p<0.05
113
5.3.6 Dietary patterns and associations with weight status: overall,
ethnicity and sex—an overview of key obesogenic dietary variables
An overview of the association between obesogenic dietary patterns and weight
status is presented in Table 5.11. In general, as expected, ‘overweight’ adolescents
were more likely to have irregular meal patterns in terms of skipping breakfast,
morning snacks and lunch. Conversely, ‘overweight’ adolescents appeared to be less
likely to consume snacks, fried foods and confectionery and sweets.
Similar patterns were noted across the ethnic groups, but some differences were
found. ‘Overweight’ Indigenous Fijians were more likely to skip lunch compared to
their ‘not overweight’ peers. Unexpected results were that ‘overweight’ IndoFijians
rarely consumed snacks, SSB and fruit drinks, fried foods and confectionery and
sweets compared to their not overweight peers.
‘Overweight’ females were more likely to skip breakfast, morning snacks at recess
and lunch compared to their ‘not overweight’ peers. Unexpectedly, ‘overweight’
females rarely consumed snacks, takeaway for dinner, fried foods and confectionery
and sweets compared to their ‘not overweight’ peers. As with ‘overweight’ females,
‘overweight’ males also rarely consumed snacks, takeaway for dinner and fried
foods. Unlike ‘overweight’ females, ‘overweight’ males consumed less SSB than
their ‘not overweight’ peers.
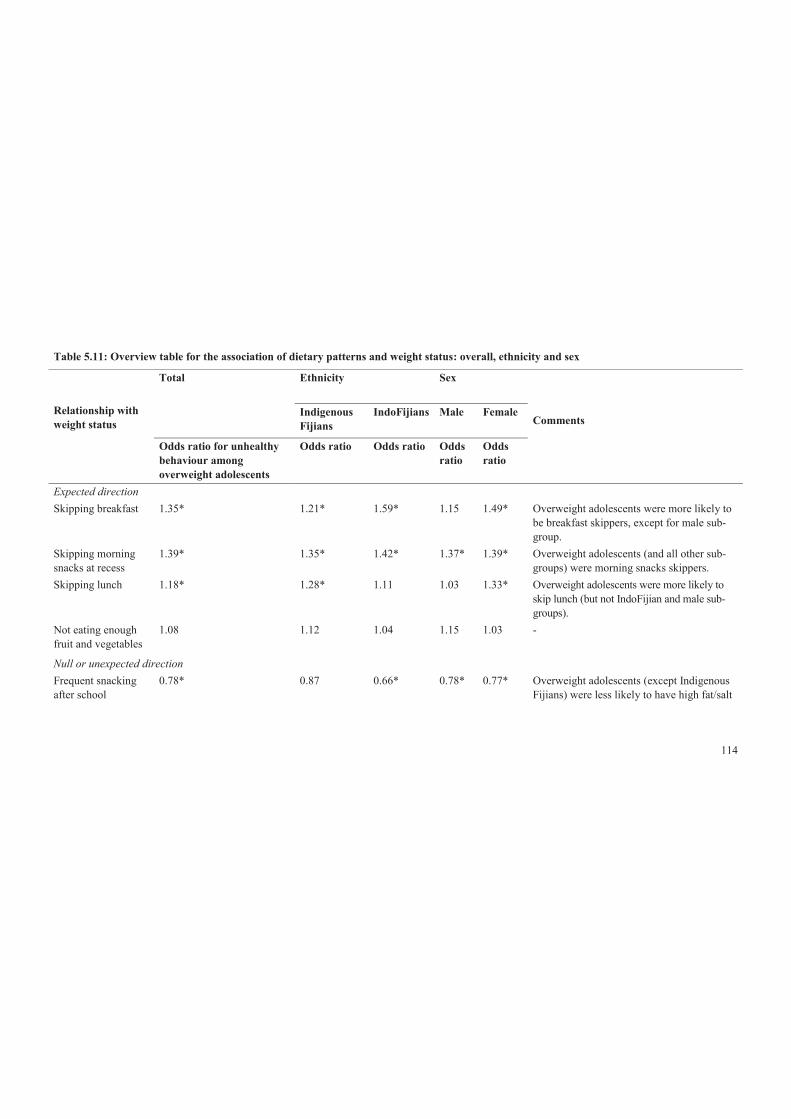
114
Table 5.11: Overview table for the association of dietary patterns and weight status: overall, ethnicity and sex
Relationship with weight status
Total Ethnicity Sex
Indigenous Fijians
IndoFijians
Male Female
Comments
Odds ratio for unhealthy behaviour among overweight adolescents
Odds ratio Odds ratio Odds ratio
Odds ratio
Expected direction Skipping breakfast 1.35* 1.21* 1.59* 1.15 1.49* Overweight adolescents were more likely to
be breakfast skippers, except for male sub-group.
Skipping morning snacks at recess
1.39* 1.35* 1.42* 1.37* 1.39* Overweight adolescents (and all other sub-groups) were morning snacks skippers.
Skipping lunch 1.18* 1.28* 1.11 1.03 1.33* Overweight adolescents were more likely to skip lunch (but not IndoFijian and male sub-groups).
Not eating enough fruit and vegetables
1.08 1.12 1.04 1.15 1.03 -
Null or unexpected direction Frequent snacking after school
0.78* 0.87 0.66* 0.78* 0.77* Overweight adolescents (except Indigenous Fijians) were less likely to have high fat/salt
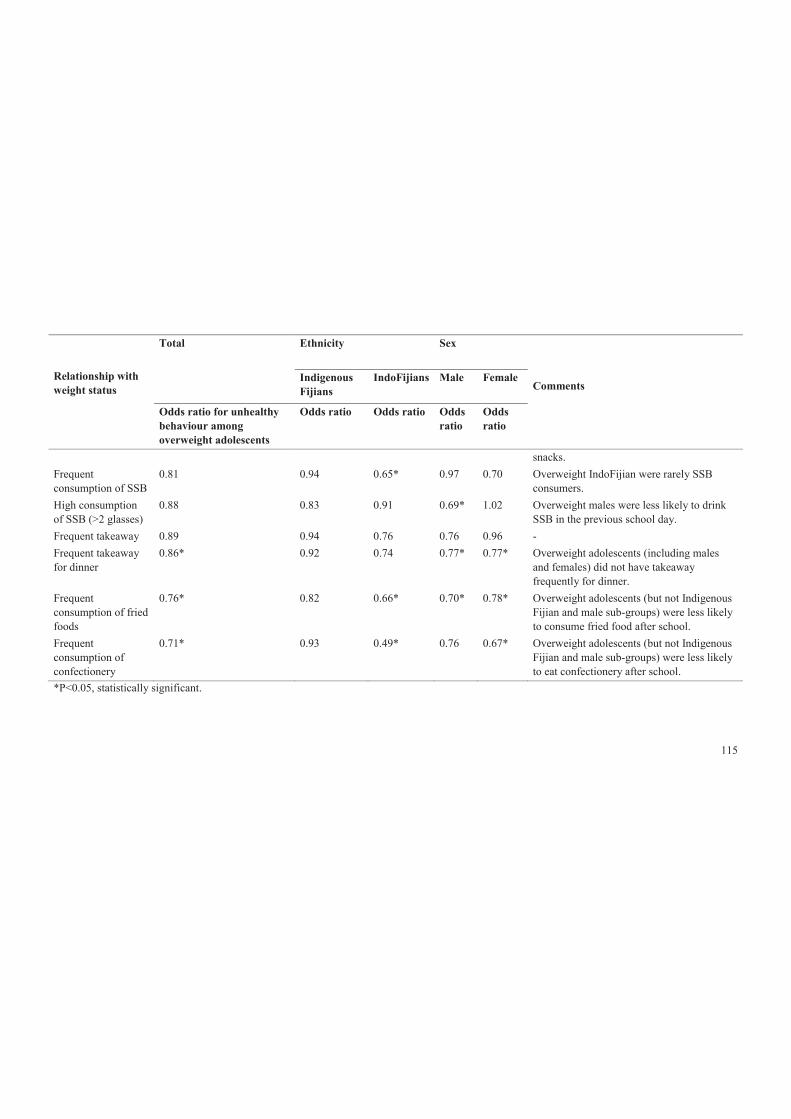
115
Relationship with weight status
Total Ethnicity Sex
Indigenous Fijians
IndoFijians
Male Female
Comments
Odds ratio for unhealthy behaviour among overweight adolescents
Odds ratio Odds ratio Odds ratio
Odds ratio
snacks. Frequent consumption of SSB
0.81 0.94 0.65* 0.97 0.70 Overweight IndoFijian were rarely SSB consumers.
High consumption of SSB (>2 glasses)
0.88 0.83 0.91 0.69* 1.02 Overweight males were less likely to drink SSB in the previous school day.
Frequent takeaway 0.89 0.94 0.76 0.76 0.96 - Frequent takeaway for dinner
0.86* 0.92 0.74 0.77* 0.77* Overweight adolescents (including males and females) did not have takeaway frequently for dinner.
Frequent consumption of fried foods
0.76* 0.82 0.66* 0.70* 0.78* Overweight adolescents (but not Indigenous Fijian and male sub-groups) were less likely to consume fried food after school.
Frequent consumption of confectionery
0.71* 0.93 0.49* 0.76 0.67* Overweight adolescents (but not Indigenous Fijian and male sub-groups) were less likely to eat confectionery after school.
*P<0.05, statistically significant.
116
5.4 Stratification by weight control attempts
5.4.1 Associations between weight status and dietary variables
stratified by weight control attempts
Weight control attempts among adolescents has been found to moderate the
association between dietary patterns and weight status [318, 319], especially among
overweight adolescents. Attempts to lose weight have been associated with
behaviours such as changing dietary patterns to healthier one and increasing physical
activity level [319, 320]. A study done with majority of Pacific Island adolescents in
New Zealand [319], found that almost half of the adolescents were trying to lose
weight, with those with highest BMI found to consume lesser unhealthy food and
more healthier foods (i.e. adolescents with higher BMI eat ≥5 serves of fruit and
vegetable per day or having fruit as after school snack). This is consistent with other
studies among adolescents in US [321, 322]. Such findings suggest that overweight
adolescents in this study have already been making positive changes in their dietary
patterns because they are overweight or obese However, these are cross sectional
studies and such intentional efforts to control weight especially through changing of
dietary patterns may confound the associations between dietary patterns and weight
status (BMI, BMI-z), resulting in reverse associations. Other factors such household
income may be important confounding factor.
Furthermore, it was hypothesised that frequent consumption of fried foods, high
fat/salt snacks and confectionery were associated with higher BMI-z . However,
findings in this study showed the opposite results, thus further analyses were
conducted to explore if the adolescents’ intentional attempts to lose weight
moderated the associations as in the other studies.
The dietary patterns that had statistically significant results in the unexpected
direction were after school consumption of SSB, high fat/salt snack, fried foods and
confectionery. The dietary patterns were stratified by stated weight control attempts
of adolescents. The weight control attempts were dichotomised into those who were
‘trying to lose weight’ and ‘not trying to lose weight’. Those who were ‘not trying to
117
lose weight’ included those who were trying to gain weight, trying to stay at current
weight or not doing anything with their weight.
Descriptive results for participants’ weight control attempts for overall, ethnicity and
sex are presented in Table 5.12. Overall, 41% of all adolescents were trying to lose
weight, while 59% were not trying to lose weight. A higher proportion of Indigenous
Fijians than IndoFijians were trying to lose weight and more females than males
reported trying to lose weight. Table 5.13 shows the percentages of adolescents
within each weight control groups that do each of the dietary behaviours. For
adolescents who reported trying to lose weight, about 12 %, 36% and 24% were
engaged in frequent consumption of fried food, high fat/salt snacks and
confectionery after school, respectively, compared with much higher proportions for
those who rarely consumed these foods after school (p<0.05). A similar pattern was
seen for adolescents who were not trying to lose weight.
In Table 5.14, further descriptive characteristics of adolescents in particular for mean
BMI and mean BMI-z are shown after stratified by their weight control attempts.
Overall, a higher proportion of overweight adolescents were trying to lose weight
than ‘not overweight’ adolescents, as would be expected. Table 5.15 shows the
differences in mean BMI and BMI-z and dietary patterns for the overall studied
population within each weight control attempt group. The BMI was found to be
higher among those trying to lose weight compared to those not trying to lose weight.
It was also found to be higher for those who were rarely consuming fried foods, high
fat/salt snacks and confectionery. This finding was consistent with BMI-z in
particular for those trying to lose weight. This finding was consistent with BMI-z in
particular for those trying to lose weight.
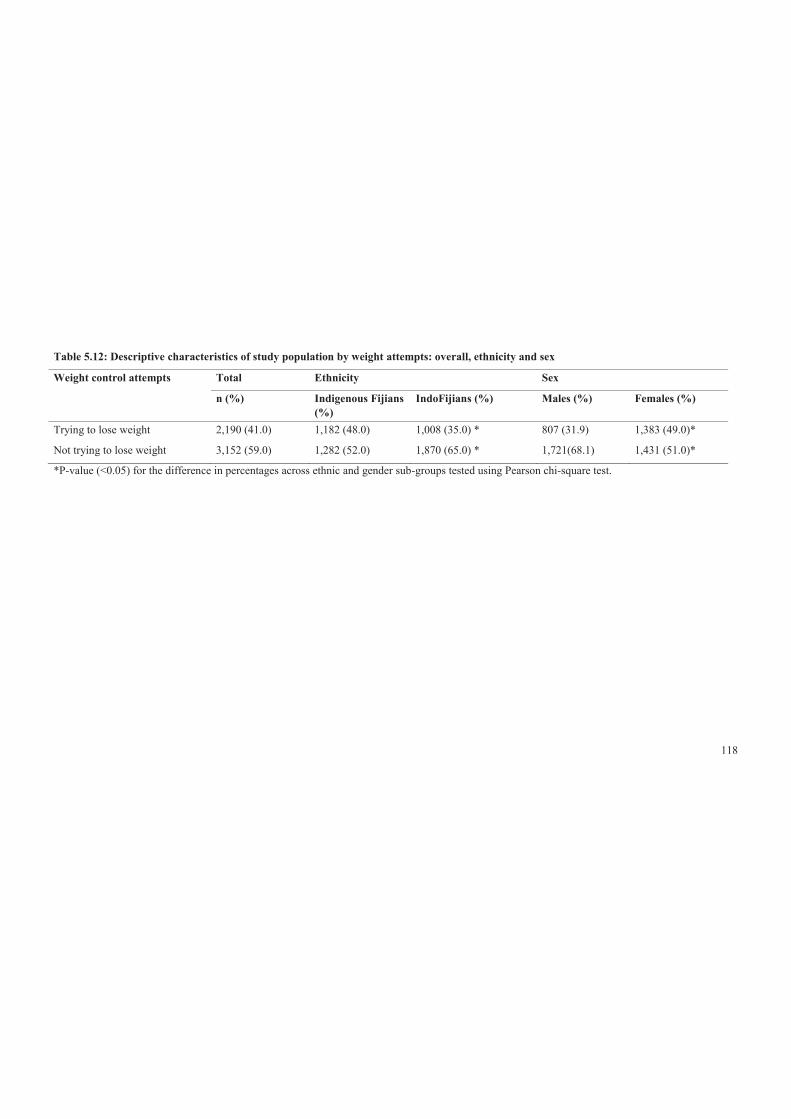
118
Table 5.12: Descriptive characteristics of study population by weight attempts: overall, ethnicity and sex
Weight control attempts Total Ethnicity Sex
n (%) Indigenous Fijians (%)
IndoFijians (%) Males (%) Females (%)
Trying to lose weight 2,190 (41.0) 1,182 (48.0) 1,008 (35.0) * 807 (31.9) 1,383 (49.0)*
Not trying to lose weight 3,152 (59.0) 1,282 (52.0) 1,870 (65.0) * 1,721(68.1) 1,431 (51.0)*
*P-value (<0.05) for the difference in percentages across ethnic and gender sub-groups tested using Pearson chi-square test.
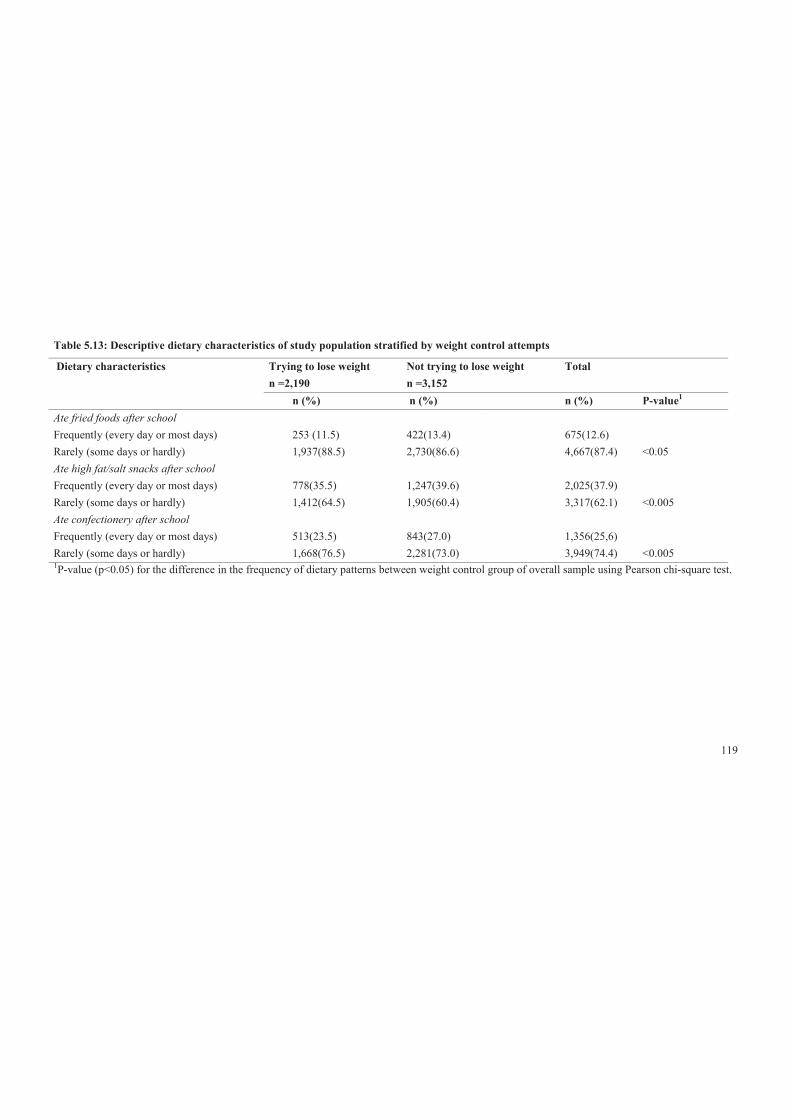
119
Table 5.13: Descriptive dietary characteristics of study population stratified by weight control attempts
Dietary characteristics Trying to lose weight n =2,190
Not trying to lose weight n =3,152
Total
n (%) n (%) n (%) P-value1 Ate fried foods after school Frequently (every day or most days) 253 (11.5) 422(13.4) 675(12.6)
<0.05
Rarely (some days or hardly) 1,937(88.5) 2,730(86.6) 4,667(87.4) Ate high fat/salt snacks after school Frequently (every day or most days) 778(35.5) 1,247(39.6) 2,025(37.9)
<0.005
Rarely (some days or hardly) 1,412(64.5) 1,905(60.4) 3,317(62.1) Ate confectionery after school Frequently (every day or most days) 513(23.5) 843(27.0) 1,356(25,6)
<0.005
Rarely (some days or hardly) 1,668(76.5) 2,281(73.0) 3,949(74.4) 1P-value (p<0.05) for the difference in the frequency of dietary patterns between weight control group of overall sample using Pearson chi-square test.
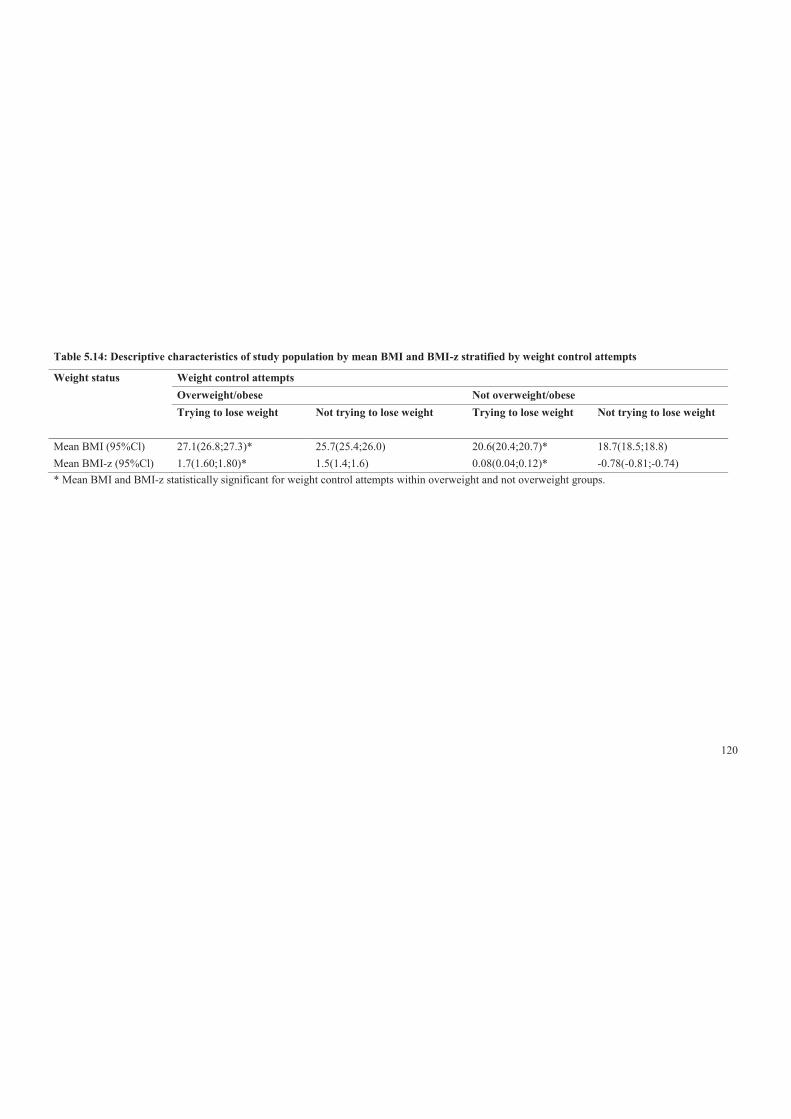
120
Table 5.14: Descriptive characteristics of study population by mean BMI and BMI-z stratified by weight control attempts
Weight status Weight control attempts Overweight/obese Not overweight/obese Trying to lose weight Not trying to lose weight Trying to lose weight Not trying to lose weight
Mean BMI (95%Cl) 27.1(26.8;27.3)* 25.7(25.4;26.0) 20.6(20.4;20.7)* 18.7(18.5;18.8) Mean BMI-z (95%Cl) 1.7(1.60;1.80)* 1.5(1.4;1.6) 0.08(0.04;0.12)* -0.78(-0.81;-0.74) * Mean BMI and BMI-z statistically significant for weight control attempts within overweight and not overweight groups.
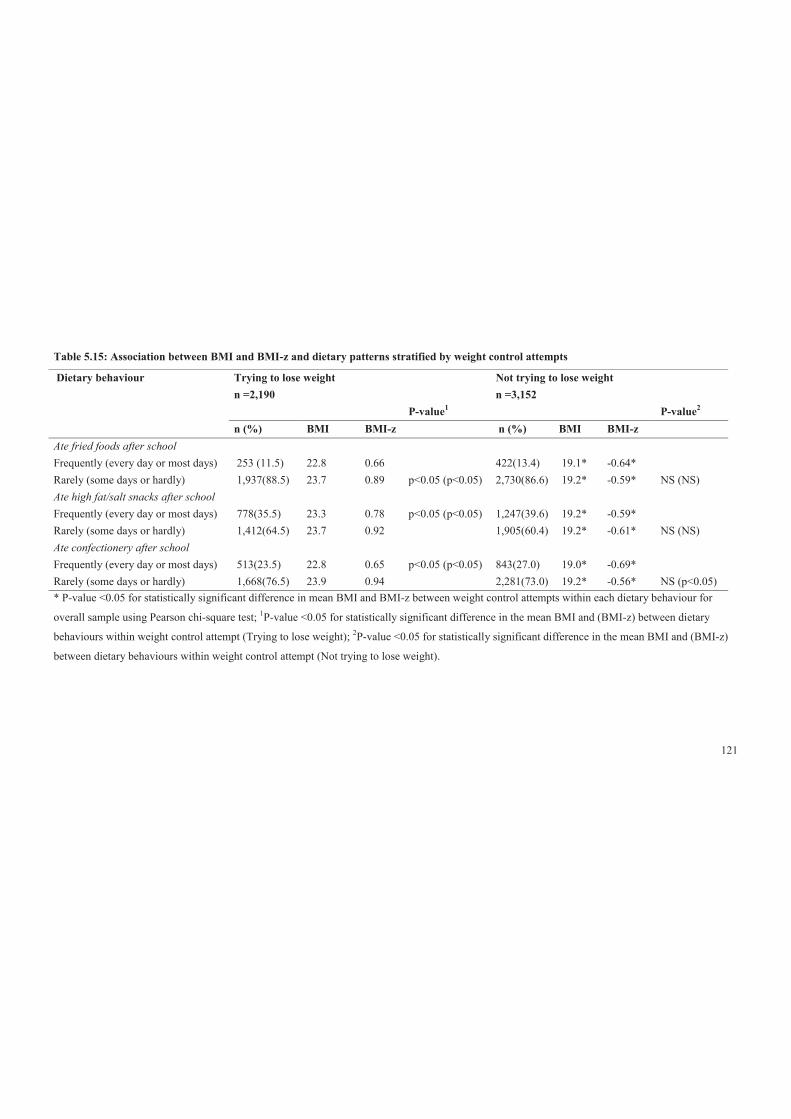
121
Table 5.15: Association between BMI and BMI-z and dietary patterns stratified by weight control attempts
Dietary behaviour Trying to lose weight n =2,190
Not trying to lose weight n =3,152
P-value1 P-value2 n (%) BMI BMI-z n (%) BMI BMI-z
Ate fried foods after school
Frequently (every day or most days) 253 (11.5) 22.8 0.66 p<0.05 (p<0.05)
422(13.4) 19.1* -0.64* NS (NS) Rarely (some days or hardly) 1,937(88.5) 23.7 0.89 2,730(86.6) 19.2* -0.59*
Ate high fat/salt snacks after school
Frequently (every day or most days) 778(35.5) 23.3 0.78 p<0.05 (p<0.05) 1,247(39.6) 19.2* -0.59* NS (NS) Rarely (some days or hardly) 1,412(64.5) 23.7 0.92 1,905(60.4) 19.2* -0.61*
Ate confectionery after school
Frequently (every day or most days) 513(23.5) 22.8 0.65 p<0.05 (p<0.05) 843(27.0) 19.0* -0.69* NS (p<0.05) Rarely (some days or hardly) 1,668(76.5) 23.9 0.94 2,281(73.0) 19.2* -0.56*
* P-value <0.05 for statistically significant difference in mean BMI and BMI-z between weight control attempts within each dietary behaviour for
overall sample using Pearson chi-square test; 1P-value <0.05 for statistically significant difference in the mean BMI and (BMI-z) between dietary
behaviours within weight control attempt (Trying to lose weight); 2P-value <0.05 for statistically significant difference in the mean BMI and (BMI-z)
between dietary behaviours within weight control attempt (Not trying to lose weight).
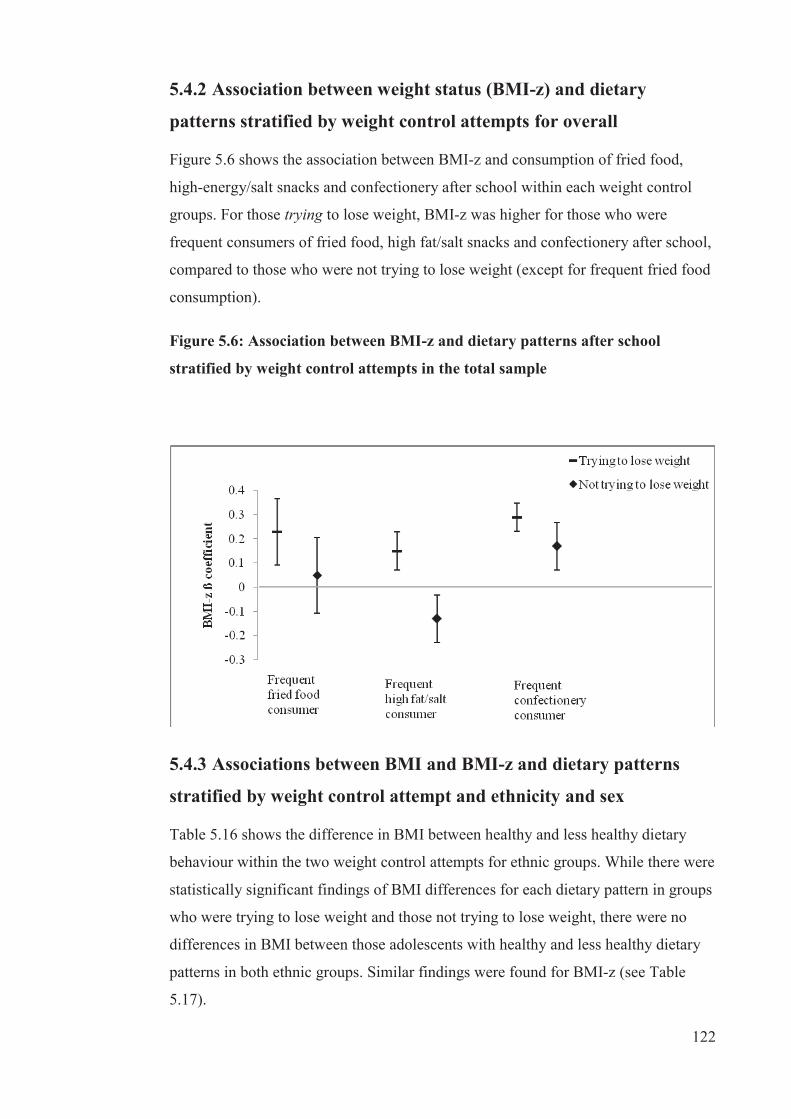
122
5.4.2 Association between weight status (BMI-z) and dietary
patterns stratified by weight control attempts for overall
Figure 5.6 shows the association between BMI-z and consumption of fried food,
high-energy/salt snacks and confectionery after school within each weight control
groups. For those trying to lose weight, BMI-z was higher for those who were
frequent consumers of fried food, high fat/salt snacks and confectionery after school,
compared to those who were not trying to lose weight (except for frequent fried food
consumption).
Figure 5.6: Association between BMI-z and dietary patterns after school
stratified by weight control attempts in the total sample
5.4.3 Associations between BMI and BMI-z and dietary patterns
stratified by weight control attempt and ethnicity and sex
Table 5.16 shows the difference in BMI between healthy and less healthy dietary
behaviour within the two weight control attempts for ethnic groups. While there were
statistically significant findings of BMI differences for each dietary pattern in groups
who were trying to lose weight and those not trying to lose weight, there were no
differences in BMI between those adolescents with healthy and less healthy dietary
patterns in both ethnic groups. Similar findings were found for BMI-z (see Table
5.17).
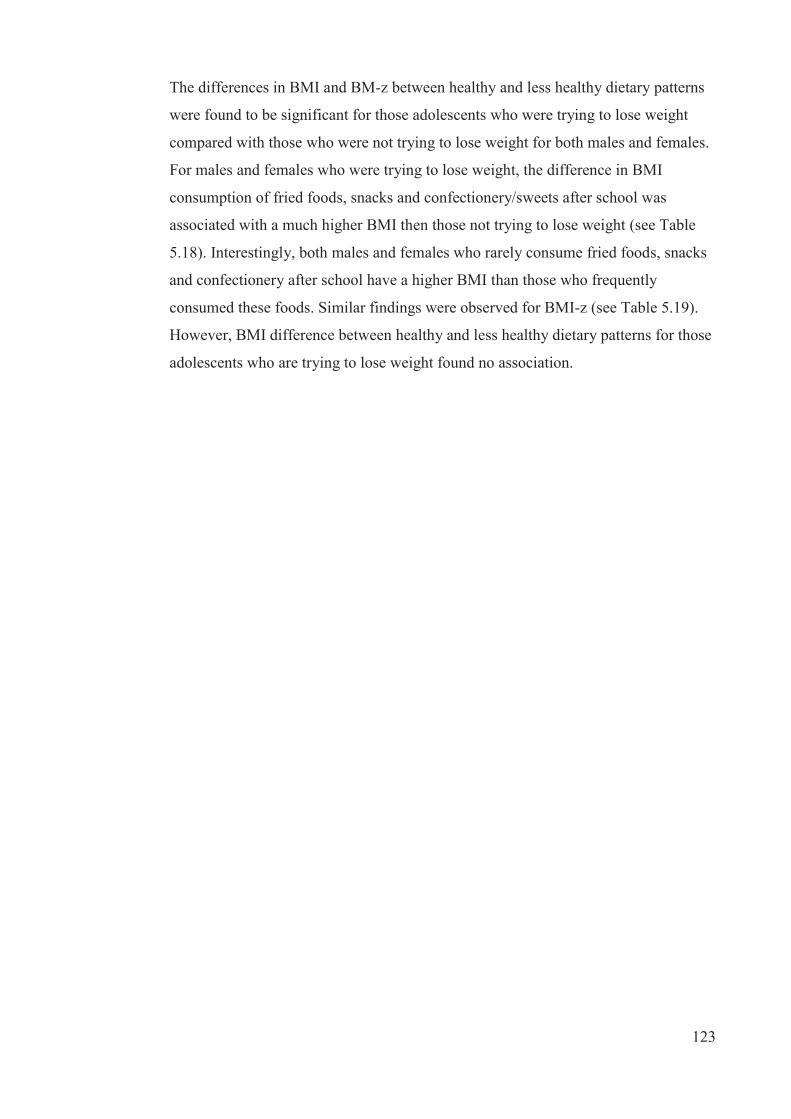
123
The differences in BMI and BM-z between healthy and less healthy dietary patterns
were found to be significant for those adolescents who were trying to lose weight
compared with those who were not trying to lose weight for both males and females.
For males and females who were trying to lose weight, the difference in BMI
consumption of fried foods, snacks and confectionery/sweets after school was
associated with a much higher BMI then those not trying to lose weight (see Table
5.18). Interestingly, both males and females who rarely consume fried foods, snacks
and confectionery after school have a higher BMI than those who frequently
consumed these foods. Similar findings were observed for BMI-z (see Table 5.19).
However, BMI difference between healthy and less healthy dietary patterns for those
adolescents who are trying to lose weight found no association.
124
Table 5.16: Associations between BMI and dietary patterns stratified by weight control attempts by ethnicity
Indigenous Fijians IndoFijians Dietary patterns Trying to lose weight Not trying to lose weight Trying to lose weight Not trying to lose weight n Mean BMI
(95% CI) Mean BMI (95% CI)
P-value*
n Mean BMI (95% CI)
Mean BMI (95% CI)
P-value*
Ate fried foods after school Frequently (every day or most days)
298 24.4(23.7, 25.0) 21.0(20.6, 20.4) <0.001 377 21.1(20.4, 21.7) 18.0(17.6, 18.3) <0.001
Rarely (some days or hardly) 2,166 24.6(24.4, 24.9) 21.0(20.8, 21.1) <0.001 2,501 22.6(22.3, 23.0) 18.0(17.8, 18.1) <0.001 Ate snacks after school Frequently (every day or most days)
998 24.3(24.0, 24.7) 21.0(20.8, 21.2) <0.001 1,024 21.9(21.4, 22.4) 17.8(17.6, 18.0) <0.001
Rarely (some days or hardly) 1,463 24.8(24.5, 25.1) 21.0(20.8, 21.2) <0.001 1,854 22.7(22.4, 23.1) 18.0(17.9, 18.2) <0.001 Ate confectionery/sweets after school Frequently (every day or most days)
575 24.4(24.0, 24.9) 21.1(20.8, 21.4) <0.001 781 21.2(20.7, 21.6) 17.7(17.5, 17.9) <0.001
Rarely (some days or hardly) 1,888 24.6(24.4, 24.8) 21.0(20.8, 21.1) <0.001 2,061 22.9(22.6, 23.3) 18.0(17.9, 18.2) <0.001 *P <0.05, indicating statistically significant association of the difference in BMI and dietary patterns between the weight control attempts within two
ethnic groups.
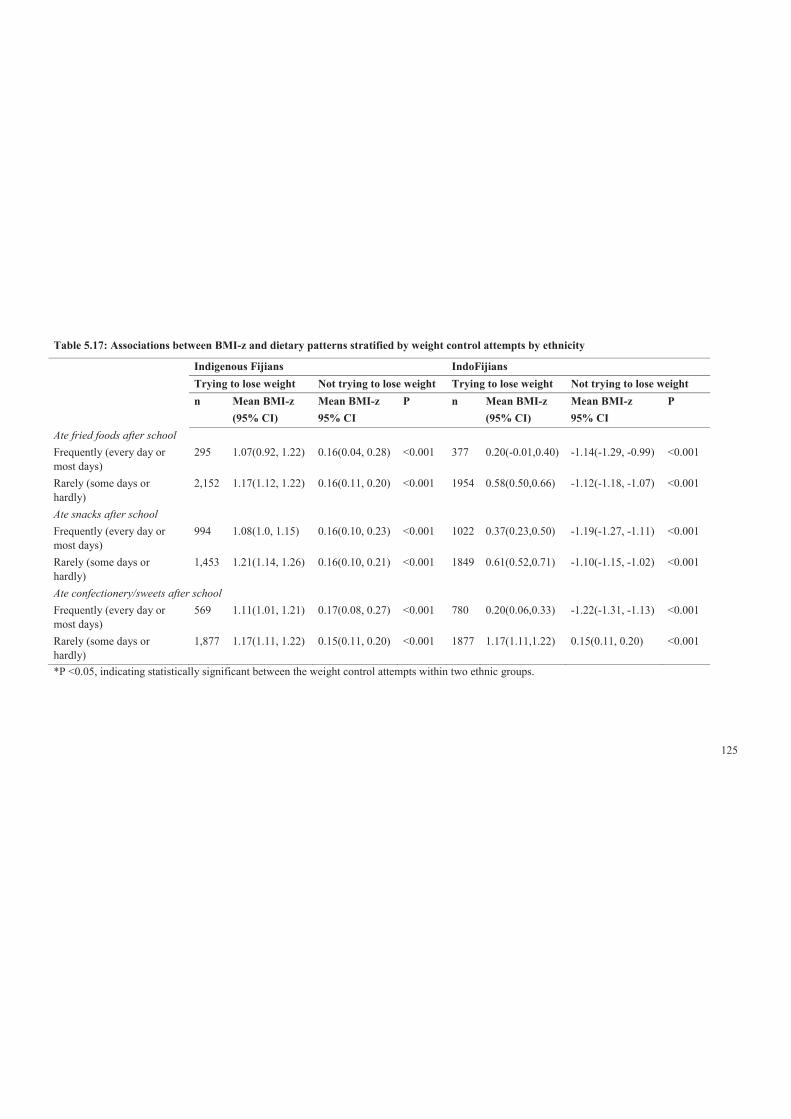
125
Table 5.17: Associations between BMI-z and dietary patterns stratified by weight control attempts by ethnicity
Indigenous Fijians IndoFijians Trying to lose weight Not trying to lose weight Trying to lose weight Not trying to lose weight n Mean BMI-z
(95% CI) Mean BMI-z 95% CI
P n Mean BMI-z (95% CI)
Mean BMI-z 95% CI
P
Ate fried foods after school Frequently (every day or most days)
295 1.07(0.92, 1.22) 0.16(0.04, 0.28) <0.001 377 0.20(-0.01,0.40) -1.14(-1.29, -0.99) <0.001
Rarely (some days or hardly)
2,152 1.17(1.12, 1.22) 0.16(0.11, 0.20) <0.001 1954 0.58(0.50,0.66) -1.12(-1.18, -1.07) <0.001
Ate snacks after school Frequently (every day or most days)
994 1.08(1.0, 1.15) 0.16(0.10, 0.23) <0.001 1022 0.37(0.23,0.50) -1.19(-1.27, -1.11) <0.001
Rarely (some days or hardly)
1,453 1.21(1.14, 1.26) 0.16(0.10, 0.21) <0.001 1849 0.61(0.52,0.71) -1.10(-1.15, -1.02) <0.001
Ate confectionery/sweets after school Frequently (every day or most days)
569 1.11(1.01, 1.21) 0.17(0.08, 0.27) <0.001 780 0.20(0.06,0.33) -1.22(-1.31, -1.13) <0.001
Rarely (some days or hardly)
1,877 1.17(1.11, 1.22) 0.15(0.11, 0.20) <0.001 1877 1.17(1.11,1.22) 0.15(0.11, 0.20) <0.001
*P <0.05, indicating statistically significant between the weight control attempts within two ethnic groups.
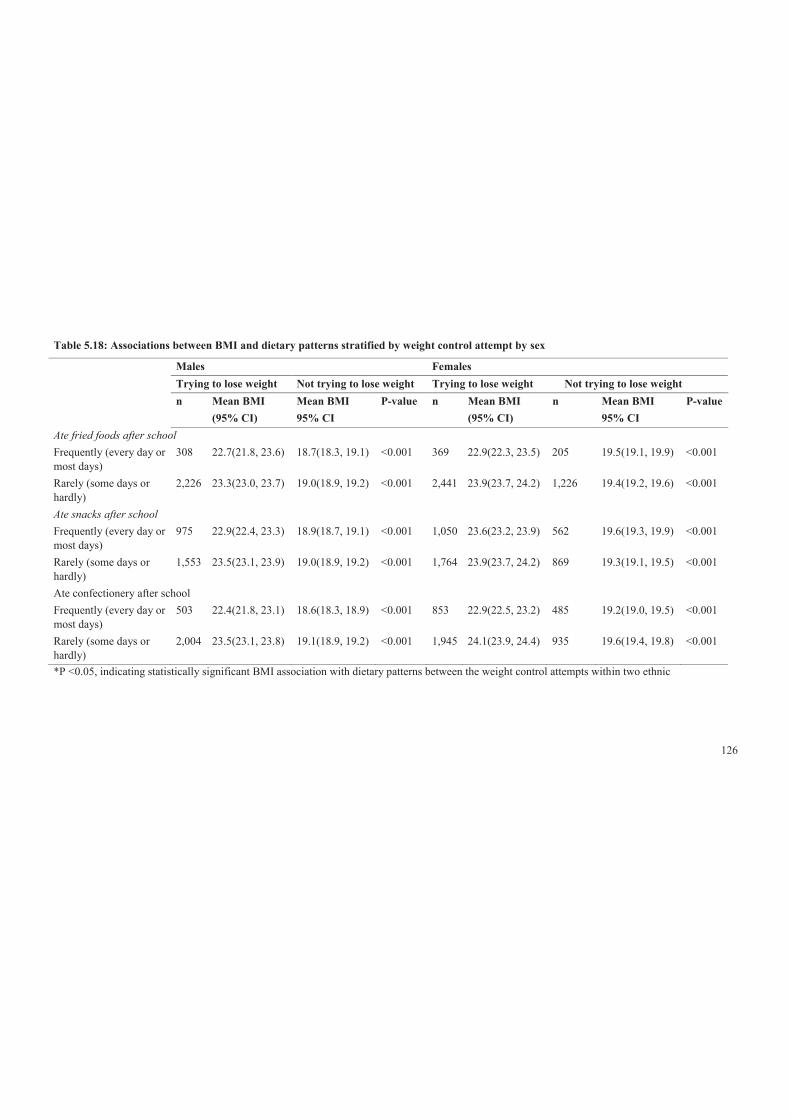
126
Table 5.18: Associations between BMI and dietary patterns stratified by weight control attempt by sex
Males Females Trying to lose weight Not trying to lose weight Trying to lose weight Not trying to lose weight n Mean BMI
(95% CI) Mean BMI 95% CI
P-value n Mean BMI (95% CI)
n Mean BMI 95% CI
P-value
Ate fried foods after school Frequently (every day or most days)
308 22.7(21.8, 23.6) 18.7(18.3, 19.1) <0.001 369 22.9(22.3, 23.5) 205 19.5(19.1, 19.9) <0.001
Rarely (some days or hardly)
2,226 23.3(23.0, 23.7) 19.0(18.9, 19.2) <0.001 2,441 23.9(23.7, 24.2) 1,226 19.4(19.2, 19.6) <0.001
Ate snacks after school Frequently (every day or most days)
975 22.9(22.4, 23.3) 18.9(18.7, 19.1) <0.001 1,050 23.6(23.2, 23.9) 562 19.6(19.3, 19.9) <0.001
Rarely (some days or hardly)
1,553 23.5(23.1, 23.9) 19.0(18.9, 19.2) <0.001 1,764 23.9(23.7, 24.2) 869 19.3(19.1, 19.5) <0.001
Ate confectionery after school Frequently (every day or most days)
503 22.4(21.8, 23.1) 18.6(18.3, 18.9) <0.001 853 22.9(22.5, 23.2) 485 19.2(19.0, 19.5) <0.001
Rarely (some days or hardly)
2,004 23.5(23.1, 23.8) 19.1(18.9, 19.2) <0.001 1,945 24.1(23.9, 24.4) 935 19.6(19.4, 19.8) <0.001
*P <0.05, indicating statistically significant BMI association with dietary patterns between the weight control attempts within two ethnic
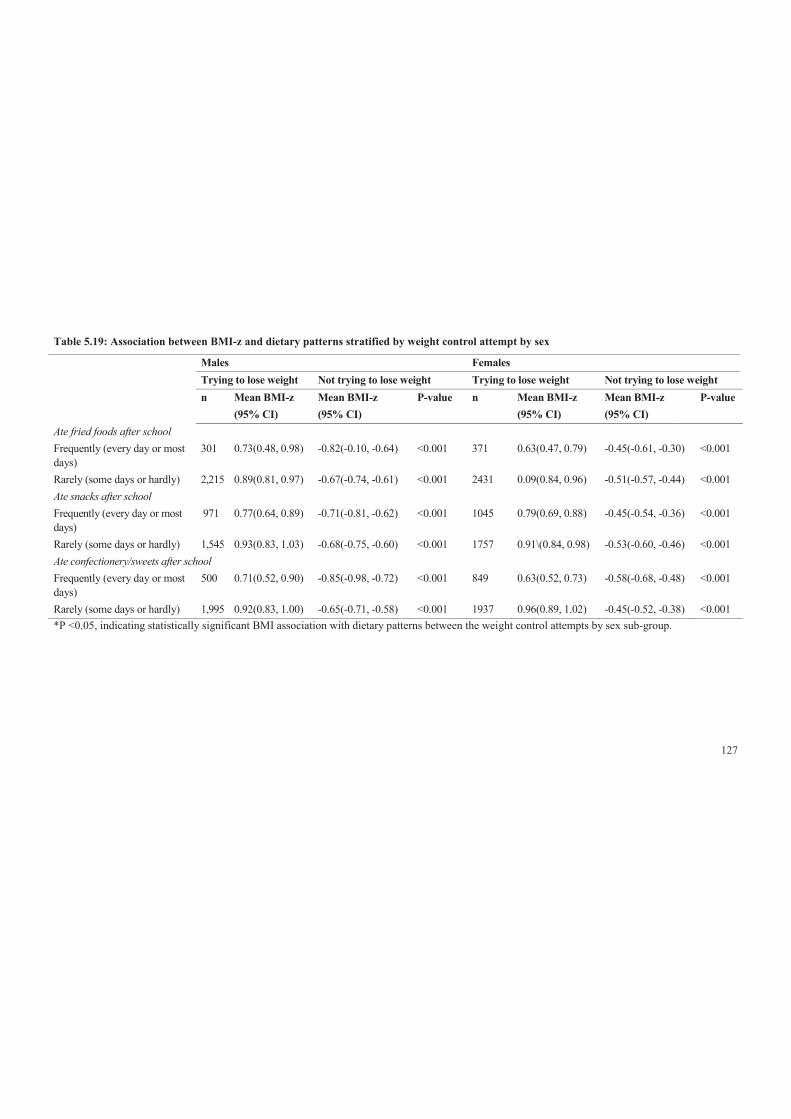
127
Table 5.19: Association between BMI-z and dietary patterns stratified by weight control attempt by sex
Males Females Trying to lose weight Not trying to lose weight Trying to lose weight Not trying to lose weight n Mean BMI-z
(95% CI) Mean BMI-z (95% CI)
P-value n Mean BMI-z (95% CI)
Mean BMI-z (95% CI)
P-value
Ate fried foods after school Frequently (every day or most days)
301 0.73(0.48, 0.98) -0.82(-0.10, -0.64) <0.001 371 0.63(0.47, 0.79) -0.45(-0.61, -0.30) <0.001
Rarely (some days or hardly) 2,215 0.89(0.81, 0.97) -0.67(-0.74, -0.61) <0.001 2431 0.09(0.84, 0.96) -0.51(-0.57, -0.44) <0.001 Ate snacks after school Frequently (every day or most days)
971 0.77(0.64, 0.89) -0.71(-0.81, -0.62) <0.001 1045 0.79(0.69, 0.88) -0.45(-0.54, -0.36) <0.001
Rarely (some days or hardly) 1,545 0.93(0.83, 1.03) -0.68(-0.75, -0.60) <0.001 1757 0.91\(0.84, 0.98) -0.53(-0.60, -0.46) <0.001 Ate confectionery/sweets after school Frequently (every day or most days)
500 0.71(0.52, 0.90) -0.85(-0.98, -0.72) <0.001 849 0.63(0.52, 0.73) -0.58(-0.68, -0.48) <0.001
Rarely (some days or hardly) 1,995 0.92(0.83, 1.00) -0.65(-0.71, -0.58) <0.001 1937 0.96(0.89, 1.02) -0.45(-0.52, -0.38) <0.001 *P <0.05, indicating statistically significant BMI association with dietary patterns between the weight control attempts by sex sub-group.
128
5.5 Discussion
This study aimed to identify the key obesogenic dietary patterns of adolescents in Fiji
and associations with BMI-z and BMI that could be targeted for obesity prevention.
This was done by analysing the frequencies of known obesogenic dietary behaviours
and then analysing their relationships with body size using a dichotomised variable
(not overweight versus overweight) or continuous variable (BMI-z). Also, this study
highlighted some important ethnic and sex differences in dietary behaviours, as well
as some unexpected associations between specific dietary behaviours and BMI-z and
BMI. Further, the study showed that weight control attempts, in particular ‘trying to
lose weight’, moderated some dietary behaviours that resulted in healthy dietary
patterns.
This study revealed a high prevalence of overweight or obesity (24% overall),
especially among Indigenous Fijians (34%) and females (28%). These prevalence
figures, which were calculated from data collected in 2005/6, are much higher than
the 2004 figures (15%) for a similar age group reported in the National Nutrition
report [17]. The 1993 and 2004 NNS data clearly indicated that the proportion of
overweight/obese children <18 years in Fiji has more than tripled during this period
[17, 18]. This finding suggests either that the prevalence of overweight or obesity has
increased very rapidly or that the results have been strongly influenced by data
collection methods (measured versus self-report) or systematic differences in the
sample compositions. The high prevalence, and the evidence of increasing trends of
overweight or obesity among adolescents in the currently study, highlights the need
for serious and targeted health promotion approaches to reduce obesity.
The results of this study highlighted some significant obesogenic dietary patterns that
were prevalent among the studied population. Obesogenic dietary patterns such as
irregular eating patterns, high consumption of SSB and low consumption of fruit and
vegetables were found to be common among adolescents understudied. Moderate
consumption of snacks has also been identified and low to moderate consumption of
fried foods, sweets and takeaway. Also, the current study supported the hypothesis
that obesogenic dietary patterns have a significant relationship with weight status and
BMI-z. While irregular eating patterns was significantly associated with weight
129
status and BMI-z, weight control attempts significantly moderated the association
between consumption of takeaway for dinner, snacks, fried foods and eating of
confectionery/sweets after school.
5.5.1 Meal frequency
While the majority of the adolescents surveyed reported eating regular meals, about a
quarter were found to be skipping meals, especially Indigenous Fijians and females.
This is a sizeable minority and meal skipping was associated with higher BMI-z.
This association is consistent with international evidence [94, 312, 323, 324].
Skipping breakfast consumption was higher in this study than that reported in the US
and Australia [325, 326]. A recent study of Indigenous Fijian adolescent females
found that those with more Westernised values skipped breakfast more commonly
than females with traditional values [327].
It can be argued that the ‘Westernisation of food environments’ has placed low value
on breakfast consumption. For example, breakfast becomes less relevant because of
easy access to energy-dense food outside the home. Other studies in Fiji have
suggested additional potential reasons for skipping breakfast, including lack of time
to prepare and eat breakfast before school [161, 328]. Sex differences in meal
skipping have been documented in several studies [326, 329, 330], showing that
females skipped breakfast more often than males and were likely to be either
overweight or obese, and this was consistent with the findings of this study.
IndoFijians tended to skip lunch more than Indigenous Fijians. A possible
explanation is that among IndoFijians, religious practices such as fasting on some
days (males and females) or attending prayer meetings at lunch time (males) are
common [297]. Promoting regular healthy meal consumption, particularly breakfast
and lunch, should be an important focus for obesity prevention, particularly among
females and Indigenous Fijians for both meals and among IndoFijian males for
lunch.
5.5.2 Fruit and vegetable consumption
Overall, fruit and vegetable consumption was found to be low for the adolescents
surveyed compared with adolescents in the US [331], with only 26% meeting the
130
WHO recommended fruit and vegetables recommendation [75] of five-plus serves a
day [332]. However, consumption was higher than found among adolescents in
Australia [333]. Low fruit and vegetable consumption was more prevalent among
IndoFijians and females in particular, suggesting that interventions that aim to
increase daily consumption of fruit and vegetables should be prioritised for these
sub-groups. Further, a systematic review on this topic by Geller and Dzewaltowski
[334], found that a low intake of fruit and vegetables by youth in general worsens
with age, thus appropriate age-specific strategies may be needed.
The current study found no statistically significant cross-sectional association
between fruit and vegetable consumption and BMI-z. A study by Lin and Morrison
[83] indicated approaches should be tailored to ensure effectiveness among
IndoFijians and females who were at most risk of having an inadequate fruit and
vegetable intake.
5.5.3 SSB consumption
In the analysis of the total sample, the consumption of SSB was very high in terms of
frequency of consumption for all groups, but especially among Indigenous Fijians
and males. The ready access to spending money—it is common for the majority of
Indigenous Fijians to receive $2 to $5/day as unmonitored spending money [292]—
and the wide availability of stores selling SSB undoubtedly contributed to this very
high consumption. The increase in consumption of SSB and access to spending
money can be linked to the changes occurring in the food environments. For
example, there is easy access to SSB outside of the home. In addition, SSB were less
available in Indigenous Fijian homes compared to IndoFijian homes (p<0.05). These
data suggest that Indigenous Fijians consumed more SSB at school or on the way
home.
An inverse association was detected between the high intake of SSB and BMI-z.
These findings are inconsistent with available evidence that indicates a link between
consumption of SSB and excess body weight [108, 109, 335-337]. Despite no
relationship being observed, the high prevalence of SSB consumption is of real
concern given its lack of nutritional value, association with poor dental health [338]
and potential to displace more nutritious foods and drinks in adolescent diets. Health
131
promotion programmes need to find effective ways of reducing SSB, especially with
strategies focused on Indigenous Fijian and male adolescents.
5.5.4 Takeaway behaviours
Consumption of takeaway was quite low for adolescents in Fiji. Consumption of
takeaway meals twice or more per week has been reported to predict the increase in
BMI-z between adolescence and adulthood [339]. However, this study did not find a
similar relationship. Overall, ‘overweight’ adolescents reported eating takeaway for
dinner less frequently (2–3 times a month or less [OR 1.35]) than their ‘not
overweight’ peers. This was similar across groups, but especially for IndoFijians and
males. When stratified for weight control attempts, no association was found. It was,
however, likely those ‘overweight’ adolescents, especially IndoFijians and males,
may not be eating takeaway for dinner frequently, but were consuming other energy-
dense foods during the day. Also, access to these foods is unaffordable for a larger
segment of population.
5.5.5 Takeaway for dinner
About a third of adolescents ate takeaway for dinner more than once a week (termed
‘frequently’ in this study), particularly among Indigenous Fijians. Frequency of
takeaway consumption in general was relatively lower in this study than found in
other countries [340]. The low prevalence of takeaway for dinner is possibly due to
inaccessibility for most households and the prohibitive costs (takeaway in Fiji are
often expensive).
No association was found between takeaway consumption for dinner and BMI-z.
This result is contrary to Niemeier et al. [105], who found a significant association
between relative high intake of takeaway, in this case, restaurant food and obesity.
Overall, takeaway consumption for dinner was low in the current study, thus it is a
lower priority at this time.
5.5.6 Consumption of snacks after school
Over one-third of the study group consumed high fat or salty snacks such as biscuits,
potato chips and instant noodles after school and this was higher among the
132
Indigenous Fijians than IndoFijians. The ethnic differences may be due to differences
in parental supervision between the groups, for example, picking children up from
school. Also, many IndoFijian adolescents have reported having dinner (evening
meal) soon after they arrived home from school [297], making snacks unnecessary.
Adolescents who consumed more of these high fat or salty snacks had a lower BMI-
z. This is an interesting finding, as other studies have showed that increased snacking
on these food items is significantly associated with excess body weight among
adolescents [310]. This may be due to snacking or eating of other high-energy-dense
food at other times, desire to lose weight or misreporting of snacking behaviour.
Also, the questionnaire did not assess all dietary intakes, but assessed only specific
foods, which may fail to identify other influential dietary factors. Thus, further
investigation is needed to understand the moderating factors in such relationship as
this information is needed to target health promotion interventions.
5.5.7 Fried food consumption
Only a minority (10%) of adolescents reported consuming fried foods every day or
most days and this was similar in all groups. Frequent intake of fried food was
associated with a lower BMI-z. This finding is not supported by number of studies
[341-343], which have shown excessive intake of fats in the diet as a significant
independent dietary contributor to obesity development. The reasons for this
unexpected result are unclear, but may be due to reverse causality or a poor
understanding of cooking practices leading to inaccurate responses.
5.5.8 Consumption of confectionery
Consumption of confectionery every day or most days after school was common
among more than 25% of adolescents, particularly the IndoFijians and females. The
ethnic difference may be due to IndoFijians having confectionery being more
frequently a part of the IndoFijians’ cuisine and it being available in their homes
after school. The sex difference is possibly due to greater peer influence and cravings
among females compared to males [344]. Also, the availability of confectionery at
home was higher for females compared to males.
133
An inverse association was found between frequent consumption of confectionery
after school and BMI-z. In particular, IndoFijians and females with lower BMI-z
more frequently consumed confectionery. This finding is inconsistent with available
evidence showing positive association between excess body weight and
confectionery [75, 345, 346]. However, Utter [319] has shown adolescents who were
trying to lose weight showed this inverse association, but it was not seen in those
who were not trying to lose weight. This could explain this study’s findings for these
adolescents. It is also possible that the findings of this study may be due to reporting
bias, which has been found among adolescents elsewhere [347, 348].
There are some good indications that adolescents are at least attempting some
appropriate weight control behaviour. Those restricting unhealthy food (or reporting
so) were heavier than those who frequently consumed unhealthy foods. This was also
seen with the direction of associations observed between BMI and BMI-z and dietary
patterns among adolescents who were trying to lose weight. It showed that the
dietary patterns were moderated by adolescents’ weight control attempts.
Given what the findings have shown, attempt to control weight is probably an
important determinant of dietary behaviours and would seem to imply that the
analysis should analyse all of the key dietary patterns according to weight control
attempts. This would help to get more information, for example, whether there is any
tendency for students who want to lose weight to less frequently consume SSB or
other behaviours that would be a good idea for weight control.
5.5.9 Strengths and limitations of this study
There has been no previous research on dietary patterns and associations with weight
status in this population or the moderators for the unexpected findings. The findings
of this study will contribute tremendously to health promotion efforts in Fiji. In
addition, the study involves a robust methodology, which also gives it its strength.
There are also some limitations. The current study predominantly assessed only
frequency of consumption, examining quantity only for SSB. While this provides
important information about the prominence of particular key foods and drinks in
adolescent diets and is simple to collect in a short survey from a very large sample
134
such as this, this approach may have resulted in some of the weak or unexpected
findings in this study. More detailed investigation of these dietary behaviours is
needed, including accurate assessment of quantities consumed and the social and
environmental context of consumption for Fijian adolescents. This would add further
to the evidence base, identifying key targets for health promotion and may also
provide more information to support the development of appropriate and effective
strategies. In addition, it was not possible to assess energy expenditure in the current
study, which may confound relationships between dietary intake and BMI-z.
Given the cross-sectional findings of this study, it is important to find out if
adolescents demonstrate changes in their dietary patterns and BMI-z over time. This
will be undertaken in the next chapter.
5.5.10 Conclusion and implications
This study has demonstrated that increasing meal regularity (breakfast, morning
snacks and lunch), decreasing SSB and increasing fruit and vegetable consumption
are likely to be important targets for health promotion in order to encourage a
healthful diet for adolescents in Fiji. There were ethnic and sex differences for
particular specific behaviours, indicating that it is important that obesity-prevention
interventions are tailored to meet the needs of population groups and that health
promotion efforts should be tailored accordingly. It is also important to examine in
more detail possible reasons for these dietary patterns.
Even though this study did not find a significant association between BMI-z and the
consumption of fruit and vegetables and SSB, the significant problems with intake of
these items indicated that these behaviours should be the priorities for targeting by
health programmes; for example, provision of healthy choices of food and drinks in
school canteens.
The inverse association found in this current study between BMI-z and dietary
variables such as snacking, eating of fried food and confectionery require further
consideration. Further research to investigate moderator(s) of inverse associations
found between BMI-z and consumption of snacks, fried foods and confectionery
found that weight control attempts moderated the dietary patterns. High BMI-z

135
caused adolescents to reduce their intakes of these known obesogenic foods by trying
to lose weight. However, this is a cross-sectional study, thus findings must be
interpreted with care.
136
C H A P T E R 6
Study Two
6.1 Background
Excess caloric intake by adolescents globally has been noted in terms of high-energy-dense food
and drinks and irregular meal patterns [63, 349]. This thesis has found a similar pattern of food
consumption in the OPIC study population. In brief, study one (Chapter 5) of this thesis reported
that adolescents’ dietary patterns in Fiji were obesogenic. In particular, meal skipping, especially
breakfast, high SSB consumption, low intake of fruit and vegetables and high consumption of
energy-dense snacks were identified. While SSB and fruit/vegetables consumption were not found
to be associated with BMI-z, meal skipping (especially breakfast) and energy-dense snacks were
associated with BMI-z.
There are existing cross-sectional studies that show that meal irregularity and clustering of less
healthy dietary behaviours, an area associated with poorer nutrient intake among children and
adolescents. A cross-sectional study on Swedish adolescents by Sjoberg et al. [350] reported that
adolescents 15 to 16 years who did not regularly eat breakfast were less likely to have lunch and/or
dinner and were significantly more likely to consume snack foods, mostly between meals. Utter et
al. [101] also found that children and adolescents in New Zealand who missed breakfast were
significantly less likely to meet recommendations for fruit and vegetable consumption (p=0.05) and
more likely to be frequent consumers of unhealthy snacks. In addition, children and adolescents
who had irregular breakfast not only consumed a nutrient poor diet, but skipping breakfast was
significantly associated with a high BMI [101].
Several lifestyle behaviours may influence whether an individual can maintain energy balance over
a longer period. A prospective study by Niemeier et al. [105] reported that breakfast skipping
during adolescence was associated with increased weight gain between adolescence and adulthood
years. Similarly, Berkey et al. [106] also reported that normal weight children who skipped
137
breakfast regularly gained weight relative to peers who ate breakfast nearly every day (boys: +0.21
kg/m2; girls: +0.08 kg/m2). Similarly, Tin et al. [351] in their longitudinal study over two years
among children in Hong Kong, found that baseline breakfast skippers had a higher mean BMI in the
subsequent two years compared with breakfast consumers. The association was found to be stronger
among lunch skippers compared to regular consumers.
A positive association between greater intakes of SSB and weight gain and obesity among children
and adults has been demonstrated in a systematic review of large cross-sectional studies in
conjunction with prospective cohort studies (with long periods of follow-up) by Malik et al. [108].
Vartanian et al. [349], in a meta-analysis of 88 studies, also reported a significant relationship
between SSB consumption and increased caloric intake and increased body weight. Berkey et al.
[337], in a prospective cohort study, including boys and girls, reported BMI gains of +0.03 kg/m²
per daily serving of SSB for boys and +0.02 kg/m² for girls at a one-year follow-up and BMI
increased with more servings of SSB in the preceding years. These findings contrasted with other
cross-sectional studies, where mixed results and/or no associations between SSB and weight status
were found [352, 353]. Further, Stookey et al. [354] found evidence that replacing SSB with water
was associated with reduced caloric intake among women in a weight loss clinical trial over 12
months.
While there is some existing global evidence of the specific dietary changes and change in weight
status for children and adolescents longitudinally, such evidence is absent for the Pacific Islands. It
would be valuable to understand what dietary changes might predict change, in particular of BMI-z,
so that appropriate and effective diet intervention strategies can be developed and implemented to
prevent obesity among adolescents in Fiji. This chapter explores the determinants of dietary
changes in adolescents in Fiji and changes in BMI-z between baseline and follow-up. Specific
research questions addressed in this study are: 1) What determines changes in the dietary patterns in
adolescents in Fiji? and 2) What changes in the dietary variables explain changes in BMI-z?
138
6.2 Methods
6.2.1 Design
This study utilised longitudinal data from the HYHC project, which was designed to reduce
unhealthy weight among adolescents in Fiji. The assessment of the HYHC intervention
incorporated a quasi-experiment, longitudinal design in seven secondary intervention schools in
peri-urban Suva and 11 comparison secondary schools on the western side of the island of Viti
Levu. The intervention phase of the HYHC project lasted for just over 2 years (2.12 years). For the
present analysis, the cohort combined both intervention and comparison groups, after the exclusion
of the ‘other’ ethnic category. Further details of the study design are available in Swinburn et al.
[135] and Kremer et al. [294]. The study was granted ethical approval from Fiji’s National Health
Research Committee and the Fiji National Research Ethics Review Committee and Deakin
University Human Research Ethics Committee, Australia, and was registered as a trial
(ACTRN12608000345381).
6.2.2 Sample
There were 2,781 individuals used as the cohort for this analysis, which includes both intervention
and comparison groups in 2006/08. Of the sample, 1,239 (44.6%; Cl 42.7.46.4) were males and
1,542 (55.4%; Cl 53.6, 57.3) were females with a mean age of 17.4 (SD1.0) years and from the two
main ethnic groups in Fiji—Indigenous and IndoFijians—after excluding ‘other’ ethnic groups.
6.2.3 Measures
6.2.3.1 Demographics
Demographic information was self-reported by adolescents through paper questionnaires. In
accordance with definitions used in the census survey in Fiji [210], Indigenous Fijian refers to the
Melanesian/Polynesian inhabitants of Fiji and the IndoFijians are Fijians whose ancestors came
from various parts of India and South East Asia, mostly as indentured labourers between 1879 and
1916, but also as free immigrants around the 1920s [211-213].
139
6.2.3.2 Weight status and BMI-z
Anthropometric measures (height, weight) were collected by trained research staff using a
standardised protocol [135]. Weight status and mean BMI-z were calculated according to the WHO
growth reference for children and adolescents [37, 293], where BMI-z scores over one and two
were cut-offs for overweight and obesity, respectively. Weight status was also dichotomised into
‘Not overweight or obese’ or ‘Overweight or obese’. Anthropometric information was collected at
baseline and again at follow-up.”
6.2.3.3 Diet variables and variables related to adolescents’ perception of school environment
Adolescents completed a questionnaire about their food and nutrition behaviour, physical activity
behaviours, leisure time activities, quality of life, perceptions of and attitudes toward body size,
family and home environment, school environment and neighbourhood environment, using PDAs.
However, this study focuses on food and nutrition and based on the findings from study one (see
section 5.3), this study reports only on nine self-reported key dietary behaviours, which were found
to be obesogenic cross-sectionally and were prioritised for this investigation. The dietary data were
collected at baseline and follow-up.
Frequency of breakfast, morning snacks and lunch consumption was assessed with the questions:
‘In the last five school days, on how many days did you. [have something to eat for breakfast before
school started/eat at morning recess/tea/interval/lunch at lunchtime]?’. Source of lunch was assessed
with question: ‘Where do you usually get your lunch from?’. Daily fruit and vegetable consumption
was separately assessed: ‘How many serves of [fruit/vegetables] do you usually eat each day?’. SSB
consumption (referring to soft and fizzy, fruit drinks and non-diet drinks) was assessed with the
question: ‘On the last school day, how many glasses or cans of soft drinks [fruit drinks or cordial
(fruit squash or concentrate)] did you have?’. Frequent consumption of after school snacks that
were high in fat or high in sugar was assessed with three questions: ‘How often do you usually eat
biscuits, potato chips or snacks such as instant noodles after school?’, ‘How often do you usually
eat pies, takeaway or fried foods such as French fries after school?’ and ‘How often do you usually
eat chocolates, lollies, sweets or ice-cream after school?’.
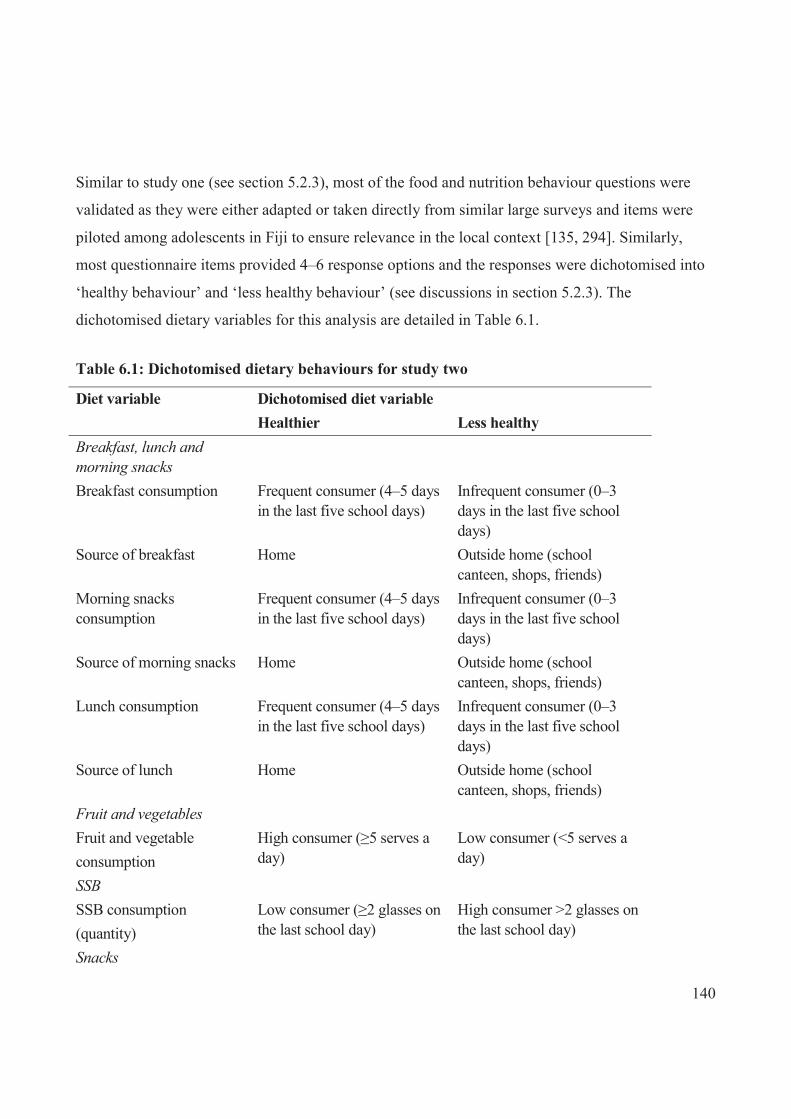
140
Similar to study one (see section 5.2.3), most of the food and nutrition behaviour questions were
validated as they were either adapted or taken directly from similar large surveys and items were
piloted among adolescents in Fiji to ensure relevance in the local context [135, 294]. Similarly,
most questionnaire items provided 4–6 response options and the responses were dichotomised into
‘healthy behaviour’ and ‘less healthy behaviour’ (see discussions in section 5.2.3). The
dichotomised dietary variables for this analysis are detailed in Table 6.1.
Table 6.1: Dichotomised dietary behaviours for study two
Diet variable Dichotomised diet variable Healthier Less healthy Breakfast, lunch and morning snacks
Breakfast consumption Frequent consumer (4–5 days in the last five school days)
Infrequent consumer (0–3 days in the last five school days)
Source of breakfast Home Outside home (school canteen, shops, friends)
Morning snacks consumption
Frequent consumer (4–5 days in the last five school days)
Infrequent consumer (0–3 days in the last five school days)
Source of morning snacks Home Outside home (school canteen, shops, friends)
Lunch consumption Frequent consumer (4–5 days in the last five school days)
Infrequent consumer (0–3 days in the last five school days)
Source of lunch Home Outside home (school canteen, shops, friends)
Fruit and vegetables
Fruit and vegetable consumption
High consumer (≥5 serves a day)
Low consumer (<5 serves a day)
SSB
SSB consumption (quantity)
Low consumer (≥2 glasses on the last school day)
High consumer >2 glasses on the last school day)
Snacks
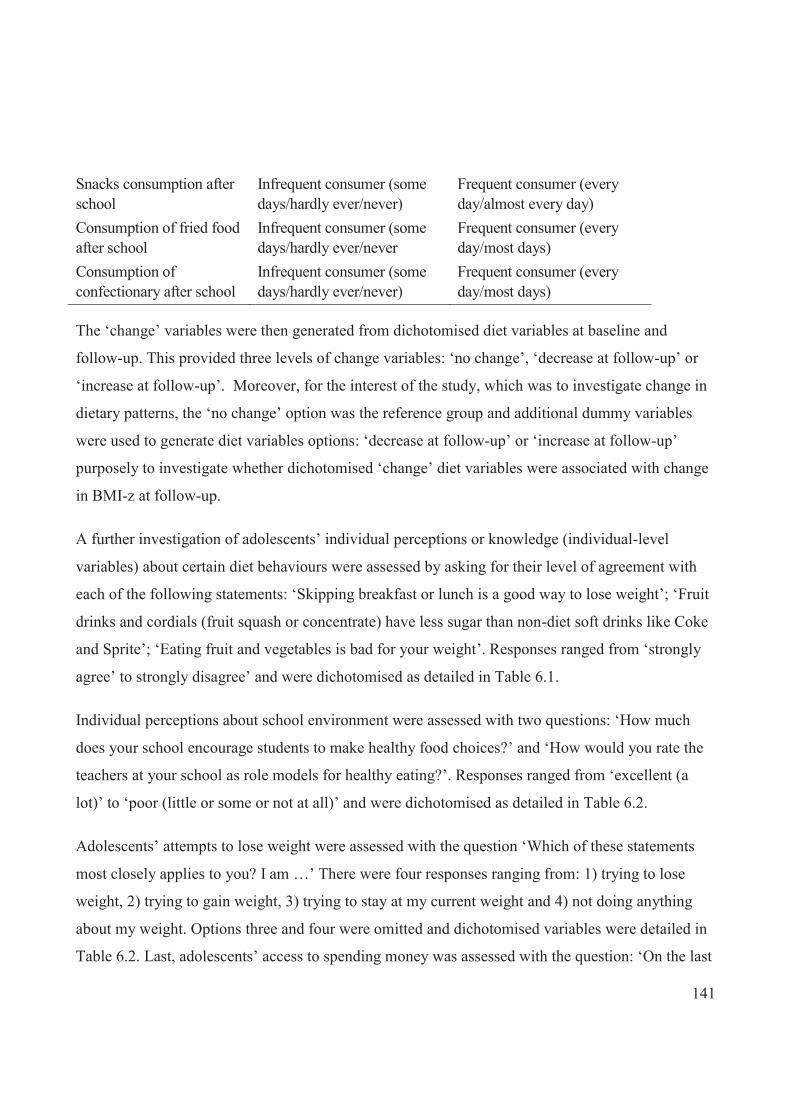
141
Snacks consumption after school
Infrequent consumer (some days/hardly ever/never)
Frequent consumer (every day/almost every day)
Consumption of fried food after school
Infrequent consumer (some days/hardly ever/never
Frequent consumer (every day/most days)
Consumption of confectionary after school
Infrequent consumer (some days/hardly ever/never)
Frequent consumer (every day/most days)
The ‘change’ variables were then generated from dichotomised diet variables at baseline and
follow-up. This provided three levels of change variables: ‘no change’, ‘decrease at follow-up’ or
‘increase at follow-up’. Moreover, for the interest of the study, which was to investigate change in
dietary patterns, the ‘no change’ option was the reference group and additional dummy variables
were used to generate diet variables options: ‘decrease at follow-up’ or ‘increase at follow-up’
purposely to investigate whether dichotomised ‘change’ diet variables were associated with change
in BMI-z at follow-up.
A further investigation of adolescents’ individual perceptions or knowledge (individual-level
variables) about certain diet behaviours were assessed by asking for their level of agreement with
each of the following statements: ‘Skipping breakfast or lunch is a good way to lose weight’; ‘Fruit
drinks and cordials (fruit squash or concentrate) have less sugar than non-diet soft drinks like Coke
and Sprite’; ‘Eating fruit and vegetables is bad for your weight’. Responses ranged from ‘strongly
agree’ to strongly disagree’ and were dichotomised as detailed in Table 6.1.
Individual perceptions about school environment were assessed with two questions: ‘How much
does your school encourage students to make healthy food choices?’ and ‘How would you rate the
teachers at your school as role models for healthy eating?’. Responses ranged from ‘excellent (a
lot)’ to ‘poor (little or some or not at all)’ and were dichotomised as detailed in Table 6.2.
Adolescents’ attempts to lose weight were assessed with the question ‘Which of these statements
most closely applies to you? I am …’ There were four responses ranging from: 1) trying to lose
weight, 2) trying to gain weight, 3) trying to stay at my current weight and 4) not doing anything
about my weight. Options three and four were omitted and dichotomised variables were detailed in
Table 6.2. Last, adolescents’ access to spending money was assessed with the question: ‘On the last
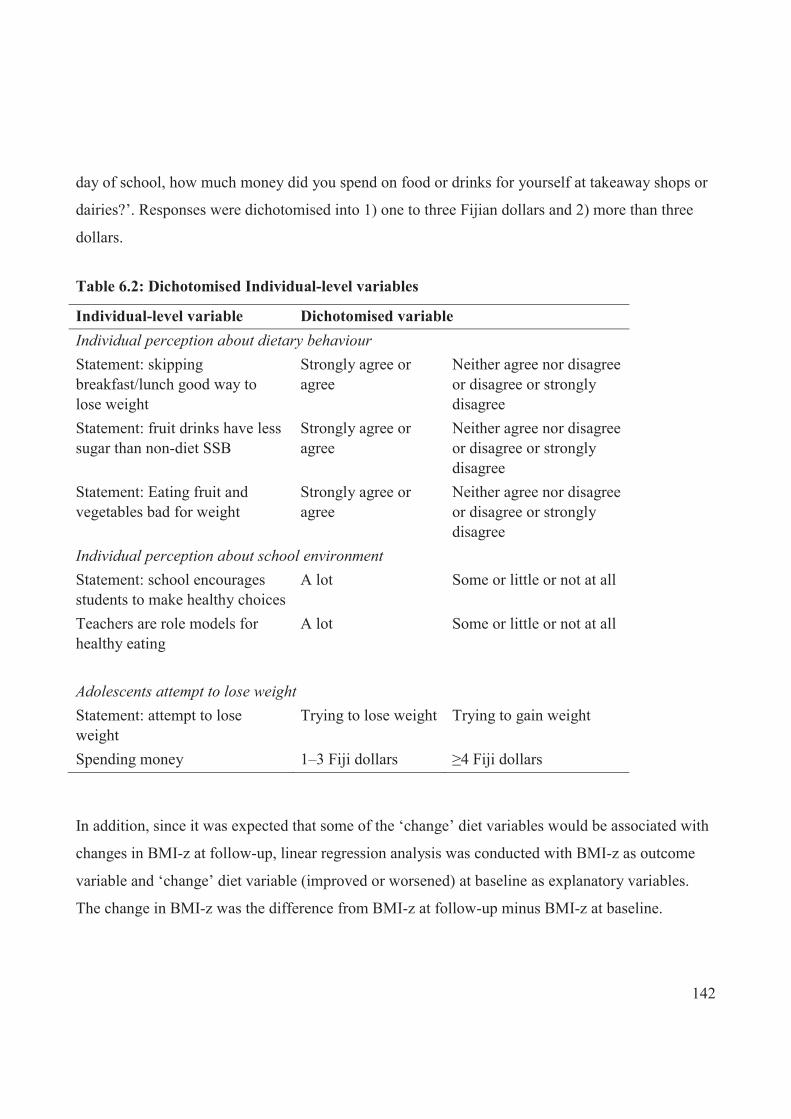
142
day of school, how much money did you spend on food or drinks for yourself at takeaway shops or
dairies?’. Responses were dichotomised into 1) one to three Fijian dollars and 2) more than three
dollars.
Table 6.2: Dichotomised Individual-level variables
Individual-level variable Dichotomised variable Individual perception about dietary behaviour Statement: skipping breakfast/lunch good way to lose weight
Strongly agree or agree
Neither agree nor disagree or disagree or strongly disagree
Statement: fruit drinks have less sugar than non-diet SSB
Strongly agree or agree
Neither agree nor disagree or disagree or strongly disagree
Statement: Eating fruit and vegetables bad for weight
Strongly agree or agree
Neither agree nor disagree or disagree or strongly disagree
Individual perception about school environment Statement: school encourages students to make healthy choices
A lot Some or little or not at all
Teachers are role models for healthy eating
A lot Some or little or not at all
Adolescents attempt to lose weight Statement: attempt to lose weight
Trying to lose weight Trying to gain weight
Spending money 1–3 Fiji dollars ≥4 Fiji dollars
In addition, since it was expected that some of the ‘change’ diet variables would be associated with
changes in BMI-z at follow-up, linear regression analysis was conducted with BMI-z as outcome
variable and ‘change’ diet variable (improved or worsened) at baseline as explanatory variables.
The change in BMI-z was the difference from BMI-z at follow-up minus BMI-z at baseline.
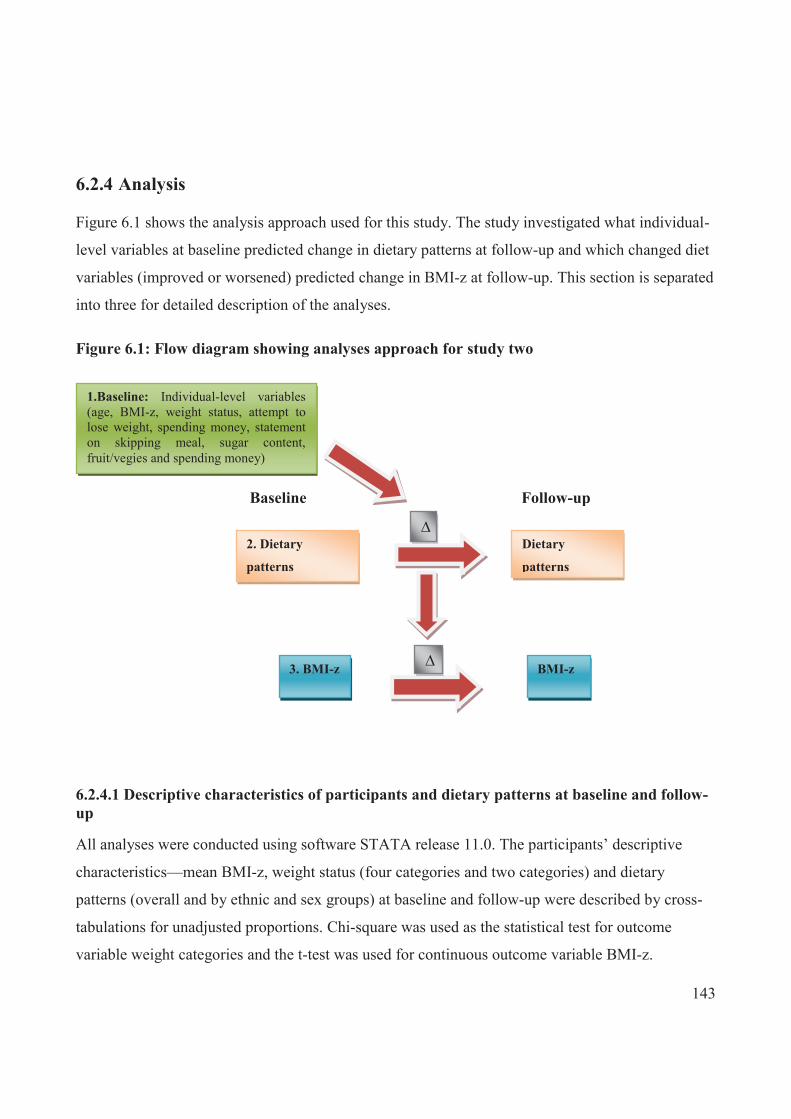
143
6.2.4 Analysis
Figure 6.1 shows the analysis approach used for this study. The study investigated what individual-
level variables at baseline predicted change in dietary patterns at follow-up and which changed diet
variables (improved or worsened) predicted change in BMI-z at follow-up. This section is separated
into three for detailed description of the analyses.
Figure 6.1: Flow diagram showing analyses approach for study two
6.2.4.1 Descriptive characteristics of participants and dietary patterns at baseline and follow-up
All analyses were conducted using software STATA release 11.0. The participants’ descriptive
characteristics—mean BMI-z, weight status (four categories and two categories) and dietary
patterns (overall and by ethnic and sex groups) at baseline and follow-up were described by cross-
tabulations for unadjusted proportions. Chi-square was used as the statistical test for outcome
variable weight categories and the t-test was used for continuous outcome variable BMI-z.
1.Baseline: Individual-level variables (age, BMI-z, weight status, attempt to lose weight, spending money, statement on skipping meal, sugar content, fruit/vegies and spending money)
Baseline
2. Dietary
patterns
Dietary
patterns
3. BMI-z BMI-z
∆
∆
Follow-up
144
6.2.4.2 Individual-level variables that predict change in dietary behaviour among adolescents
Logistic regression (reporting odds ratio) models were used to determine whether any individual
characteristics predicted changes in diet variables at follow-up. It was also stratified for ethnicity
and sex sub-groups. In this set of multi-variate analyses, outcome variables were the dichotomised
categorical diet variables (dietary patterns) and explanatory variables were the individual-level
variables. Each analysis was done separately for improved and worsened dietary behaviour with the
reference group as ‘no change’. However, certain analyses were done for specific outcome and
explanatory variables. For example, the explanatory variable ‘perceptions about skipping
breakfast/lunch as a good way to lose weight’ was analysed for outcome variable breakfast and
lunch consumption, and explanatory variable ‘perception about the sugar content of SSB’ was
analysed for outcome variable SSB consumption. The regressions were adjusted for covariates at
baseline, namely ethnicity, sex, clustering effect by school, duration (at follow-up) and condition
(comparison and intervention).
6.2.4.3 What changes in diet variables explain the change in BMI-z over two years?
Multi-linear regression adjusted for covariates ethnicity, age, sex, school clustering effect, duration
(at follow-up) and condition, was used to investigate change in BMI-z over two years for the total
population. In this analysis, the explanatory variables were changed diet variables (improved or
worsened) and the outcome was the change in BMI-z score (BMI-z at follow-up minus BMI-z at
baseline). ‘No change’ in dietary variables group was the reference group. In all analyses, p<0.05
was considered to be statistically significant.
6.3 Results
6.3.1 Population characteristics
The descriptive characteristics of participants overall and by ethnicity and sex across baseline and
follow-up are summarised in Table 6.3 and Table 6.4. Overall, the mean duration of the study was
2.12 years. There were no significant differences by ethnic and sex subgroups. There was also no
difference in mean BMI-z between baseline and follow-up overall. In terms of weight status (two
categories), proportions of overweight/obese participants at follow-up were similar to baseline; the
145
majority of the adolescents were within the normal/thin category (79.0% baseline; 79.4% follow-
up). The result indicated that population weight status, including BMI-z, was quite stable over time
and for both ethnic groups, and the same was true for both sexes (see Table 6.4).
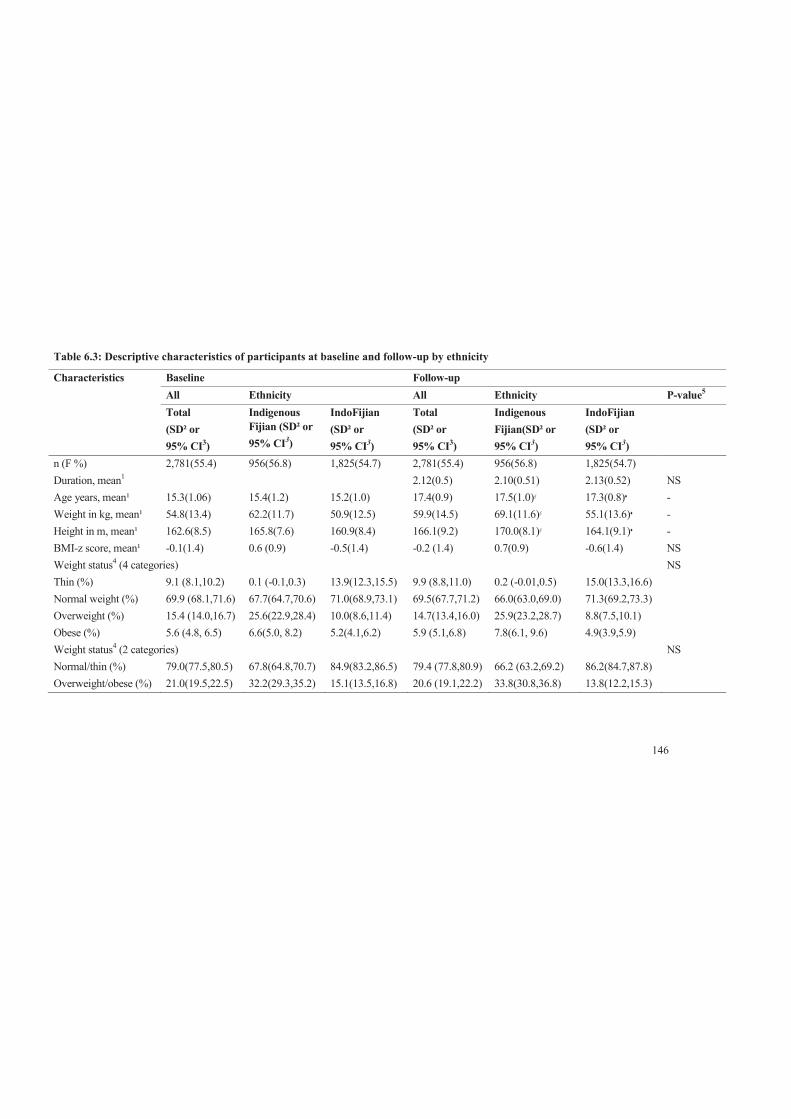
146
Table 6.3: Descriptive characteristics of participants at baseline and follow-up by ethnicity
Characteristics Baseline Follow-up
All Ethnicity All Ethnicity P-value5 Total
(SD² or 95% CI3)
Indigenous Fijian (SD² or 95% CI3)
IndoFijian (SD² or 95% CI3)
Total (SD² or 95% CI3)
Indigenous Fijian(SD² or 95% CI3)
IndoFijian (SD² or 95% CI3)
n (F %) 2,781(55.4) 956(56.8) 1,825(54.7) 2,781(55.4) 956(56.8) 1,825(54.7)
Duration, mean1 2.12(0.5) 2.10(0.51) 2.13(0.52) NS Age years, mean¹ 15.3(1.06) 15.4(1.2) 15.2(1.0) 17.4(0.9) 17.5(1.0)§ 17.3(0.8)♦ - Weight in kg, mean¹ 54.8(13.4) 62.2(11.7) 50.9(12.5) 59.9(14.5) 69.1(11.6)§ 55.1(13.6)♦ - Height in m, mean¹ 162.6(8.5) 165.8(7.6) 160.9(8.4) 166.1(9.2) 170.0(8.1)§ 164.1(9.1)♦ - BMI-z score, mean¹ -0.1(1.4) 0.6 (0.9) -0.5(1.4) -0.2 (1.4) 0.7(0.9) -0.6(1.4) NS Weight status4 (4 categories) NS Thin (%) 9.1 (8.1,10.2) 0.1 (-0.1,0.3) 13.9(12.3,15.5) 9.9 (8.8,11.0) 0.2 (-0.01,0.5) 15.0(13.3,16.6)
Normal weight (%) 69.9 (68.1,71.6) 67.7(64.7,70.6) 71.0(68.9,73.1) 69.5(67.7,71.2) 66.0(63.0,69.0) 71.3(69.2,73.3)
Overweight (%) 15.4 (14.0,16.7) 25.6(22.9,28.4) 10.0(8.6,11.4) 14.7(13.4,16.0) 25.9(23.2,28.7) 8.8(7.5,10.1)
Obese (%) 5.6 (4.8, 6.5) 6.6(5.0, 8.2) 5.2(4.1,6.2) 5.9 (5.1,6.8) 7.8(6.1, 9.6) 4.9(3.9,5.9)
Weight status4 (2 categories) NS Normal/thin (%) 79.0(77.5,80.5) 67.8(64.8,70.7) 84.9(83.2,86.5) 79.4 (77.8,80.9) 66.2 (63.2,69.2) 86.2(84.7,87.8)
Overweight/obese (%) 21.0(19.5,22.5) 32.2(29.3,35.2) 15.1(13.5,16.8) 20.6 (19.1,22.2) 33.8(30.8,36.8) 13.8(12.2,15.3)
147
1Unadjusted mean; ²SD is standard deviation for means; 395% CI for weight status categories; 4According to WHO classification; 5P-
value for the difference in mean and proportion between baseline and follow-up for overall (All) tested using t-test or chi-square test, as
appropriate.
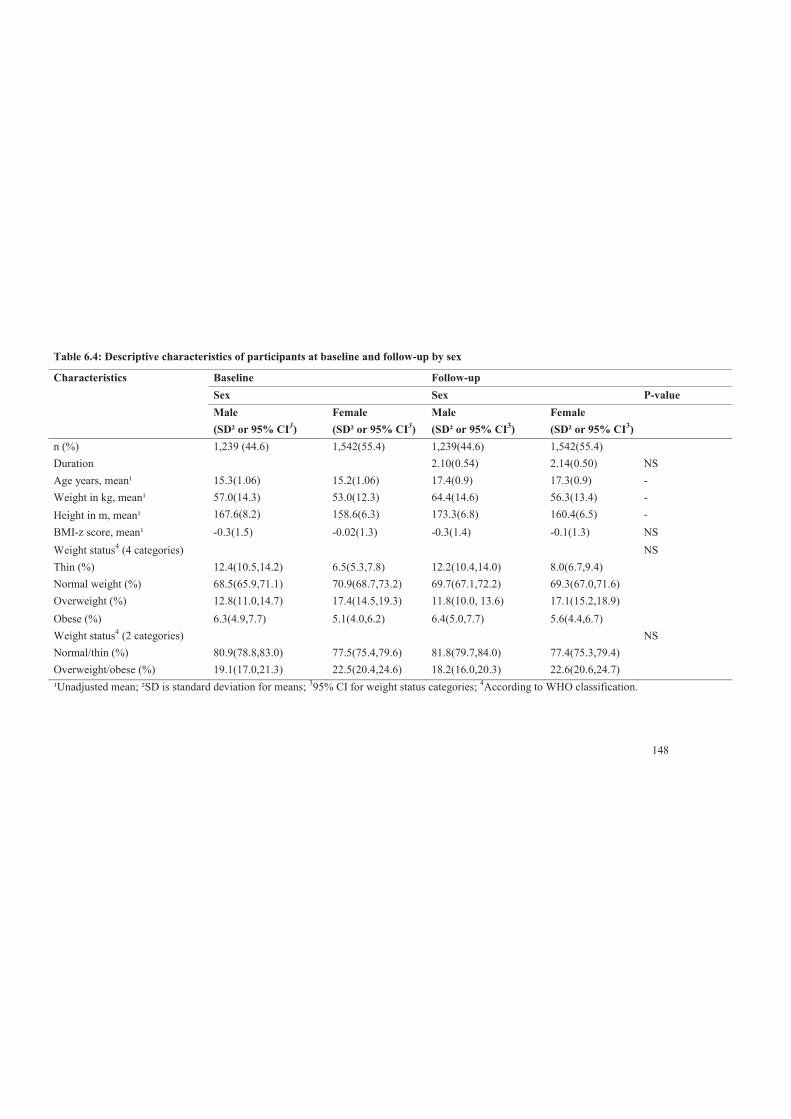
148
Table 6.4: Descriptive characteristics of participants at baseline and follow-up by sex
Characteristics Baseline Follow-up
Sex Sex P-value Male
(SD² or 95% CI3) Female (SD² or 95% CI3)
Male (SD² or 95% CI3)
Female (SD² or 95% CI3)
n (%) 1,239 (44.6) 1,542(55.4) 1,239(44.6) 1,542(55.4) Duration 2.10(0.54) 2.14(0.50) NS
Age years, mean¹ Weight in kg, mean¹ Height in m, mean¹
15.3(1.06) 57.0(14.3) 167.6(8.2)
15.2(1.06) 53.0(12.3) 158.6(6.3)
17.4(0.9) 64.4(14.6) 173.3(6.8)
17.3(0.9) 56.3(13.4) 160.4(6.5)
- - -
BMI-z score, mean¹ -0.3(1.5) -0.02(1.3) -0.3(1.4) -0.1(1.3) NS Weight status4 (4 categories) NS Thin (%) 12.4(10.5,14.2) 6.5(5.3,7.8) 12.2(10.4,14.0) 8.0(6.7,9.4) Normal weight (%) 68.5(65.9,71.1) 70.9(68.7,73.2) 69.7(67.1,72.2) 69.3(67.0,71.6) Overweight (%) 12.8(11.0,14.7) 17.4(14.5,19.3) 11.8(10.0, 13.6) 17.1(15.2,18.9) Obese (%) 6.3(4.9,7.7) 5.1(4.0,6.2) 6.4(5.0,7.7) 5.6(4.4,6.7) Weight status4 (2 categories) NS Normal/thin (%) 80.9(78.8,83.0) 77.5(75.4,79.6) 81.8(79.7,84.0) 77.4(75.3,79.4) Overweight/obese (%) 19.1(17.0,21.3) 22.5(20.4,24.6) 18.2(16.0,20.3) 22.6(20.6,24.7) ¹Unadjusted mean; ²SD is standard deviation for means; 395% CI for weight status categories; 4According to WHO classification.
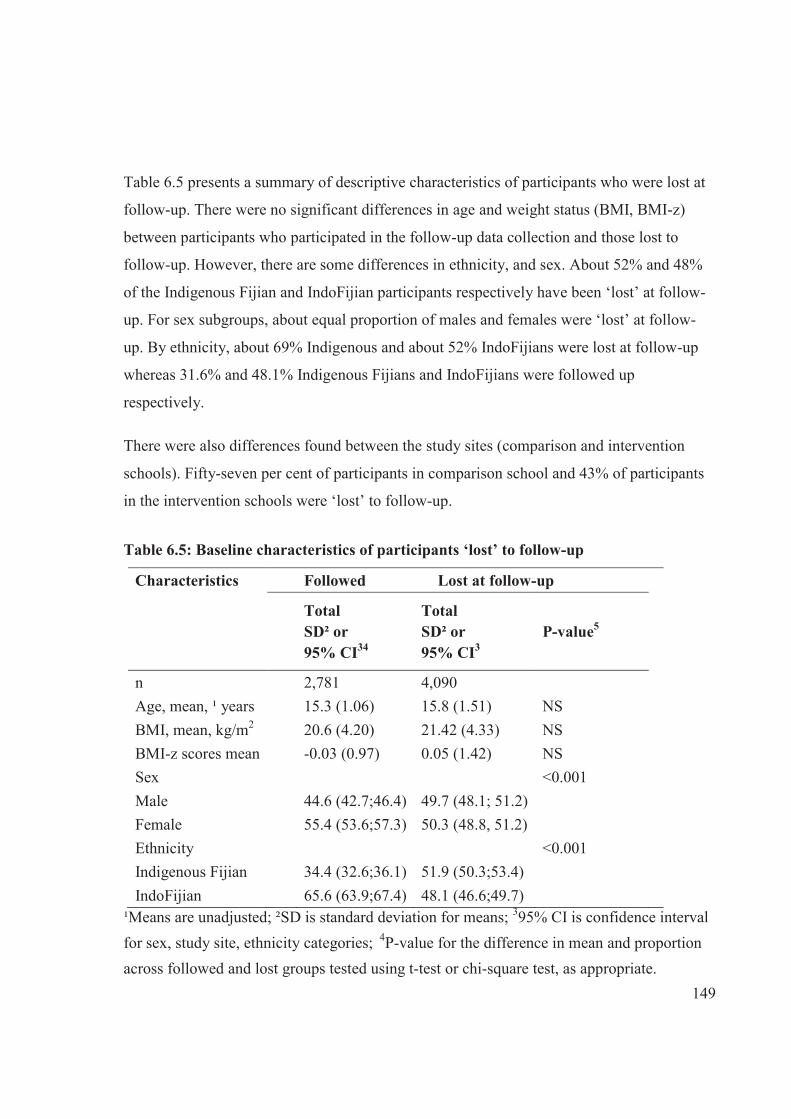
149
Table 6.5 presents a summary of descriptive characteristics of participants who were lost at
follow-up. There were no significant differences in age and weight status (BMI, BMI-z)
between participants who participated in the follow-up data collection and those lost to
follow-up. However, there are some differences in ethnicity, and sex. About 52% and 48%
of the Indigenous Fijian and IndoFijian participants respectively have been ‘lost’ at follow-
up. For sex subgroups, about equal proportion of males and females were ‘lost’ at follow-
up. By ethnicity, about 69% Indigenous and about 52% IndoFijians were lost at follow-up
whereas 31.6% and 48.1% Indigenous Fijians and IndoFijians were followed up
respectively.
There were also differences found between the study sites (comparison and intervention
schools). Fifty-seven per cent of participants in comparison school and 43% of participants
in the intervention schools were ‘lost’ to follow-up.
Table 6.5: Baseline characteristics of participants ‘lost’ to follow-up
Characteristics Followed Lost at follow-up
Total SD² or 95% CI34
Total SD² or 95% CI3
P-value5
n 2,781 4,090
Age, mean, ¹ years 15.3 (1.06) 15.8 (1.51) NS
BMI, mean, kg/m2 20.6 (4.20) 21.42 (4.33) NS
BMI-z scores mean -0.03 (0.97) 0.05 (1.42) NS
Sex <0.001
Male 44.6 (42.7;46.4) 49.7 (48.1; 51.2)
Female 55.4 (53.6;57.3) 50.3 (48.8, 51.2)
Ethnicity <0.001
Indigenous Fijian 34.4 (32.6;36.1) 51.9 (50.3;53.4)
IndoFijian 65.6 (63.9;67.4) 48.1 (46.6;49.7)
¹Means are unadjusted; ²SD is standard deviation for means; 395% CI is confidence interval for sex, study site, ethnicity categories; 4P-value for the difference in mean and proportion across followed and lost groups tested using t-test or chi-square test, as appropriate.
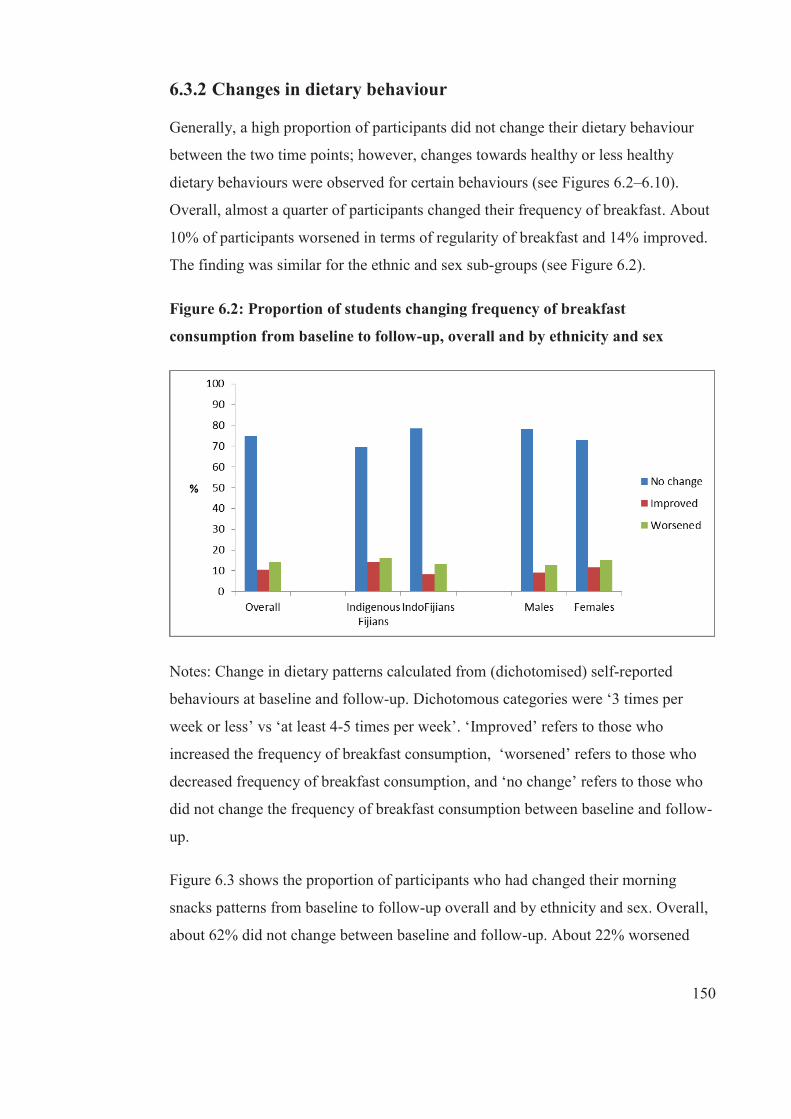
150
6.3.2 Changes in dietary behaviour
Generally, a high proportion of participants did not change their dietary behaviour
between the two time points; however, changes towards healthy or less healthy
dietary behaviours were observed for certain behaviours (see Figures 6.2–6.10).
Overall, almost a quarter of participants changed their frequency of breakfast. About
10% of participants worsened in terms of regularity of breakfast and 14% improved.
The finding was similar for the ethnic and sex sub-groups (see Figure 6.2).
Figure 6.2: Proportion of students changing frequency of breakfast
consumption from baseline to follow-up, overall and by ethnicity and sex
Notes: Change in dietary patterns calculated from (dichotomised) self-reported
behaviours at baseline and follow-up. Dichotomous categories were ‘3 times per
week or less’ vs ‘at least 4-5 times per week’. ‘Improved’ refers to those who
increased the frequency of breakfast consumption, ‘worsened’ refers to those who
decreased frequency of breakfast consumption, and ‘no change’ refers to those who
did not change the frequency of breakfast consumption between baseline and follow-
up.
Figure 6.3 shows the proportion of participants who had changed their morning
snacks patterns from baseline to follow-up overall and by ethnicity and sex. Overall,
about 62% did not change between baseline and follow-up. About 22% worsened
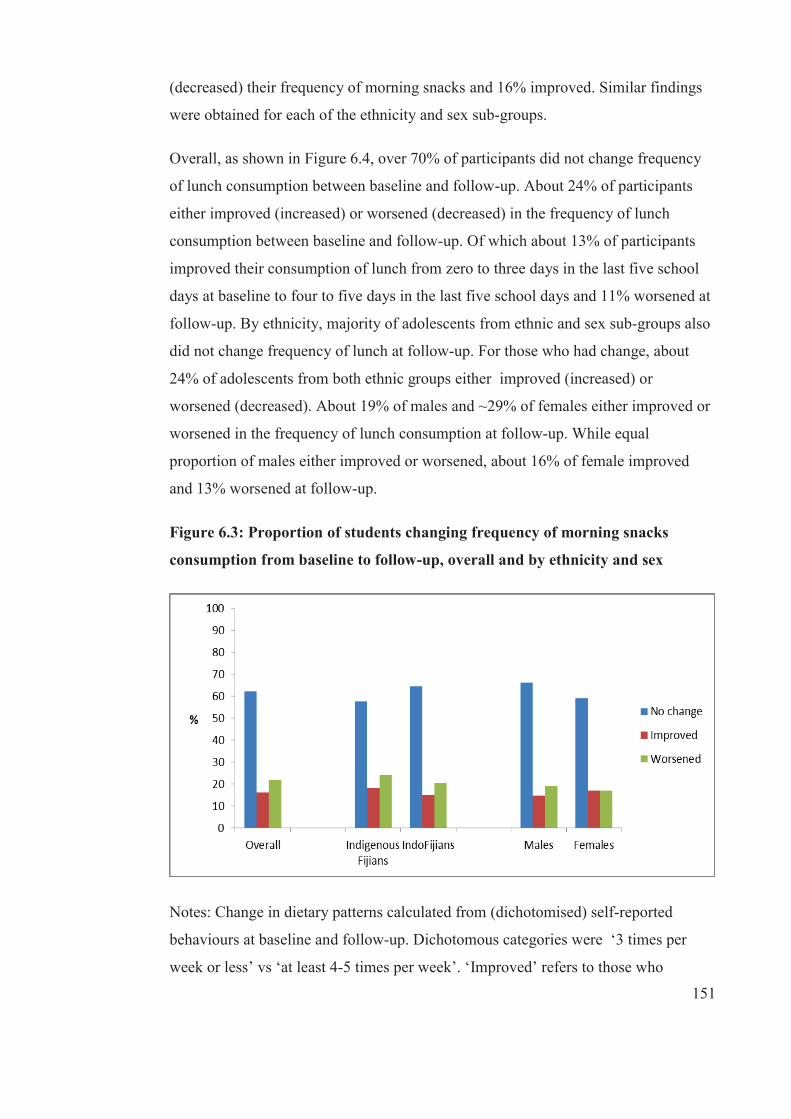
151
(decreased) their frequency of morning snacks and 16% improved. Similar findings
were obtained for each of the ethnicity and sex sub-groups.
Overall, as shown in Figure 6.4, over 70% of participants did not change frequency
of lunch consumption between baseline and follow-up. About 24% of participants
either improved (increased) or worsened (decreased) in the frequency of lunch
consumption between baseline and follow-up. Of which about 13% of participants
improved their consumption of lunch from zero to three days in the last five school
days at baseline to four to five days in the last five school days and 11% worsened at
follow-up. By ethnicity, majority of adolescents from ethnic and sex sub-groups also
did not change frequency of lunch at follow-up. For those who had change, about
24% of adolescents from both ethnic groups either improved (increased) or
worsened (decreased). About 19% of males and ~29% of females either improved or
worsened in the frequency of lunch consumption at follow-up. While equal
proportion of males either improved or worsened, about 16% of female improved
and 13% worsened at follow-up.
Figure 6.3: Proportion of students changing frequency of morning snacks
consumption from baseline to follow-up, overall and by ethnicity and sex
Notes: Change in dietary patterns calculated from (dichotomised) self-reported
behaviours at baseline and follow-up. Dichotomous categories were ‘3 times per
week or less’ vs ‘at least 4-5 times per week’. ‘Improved’ refers to those who
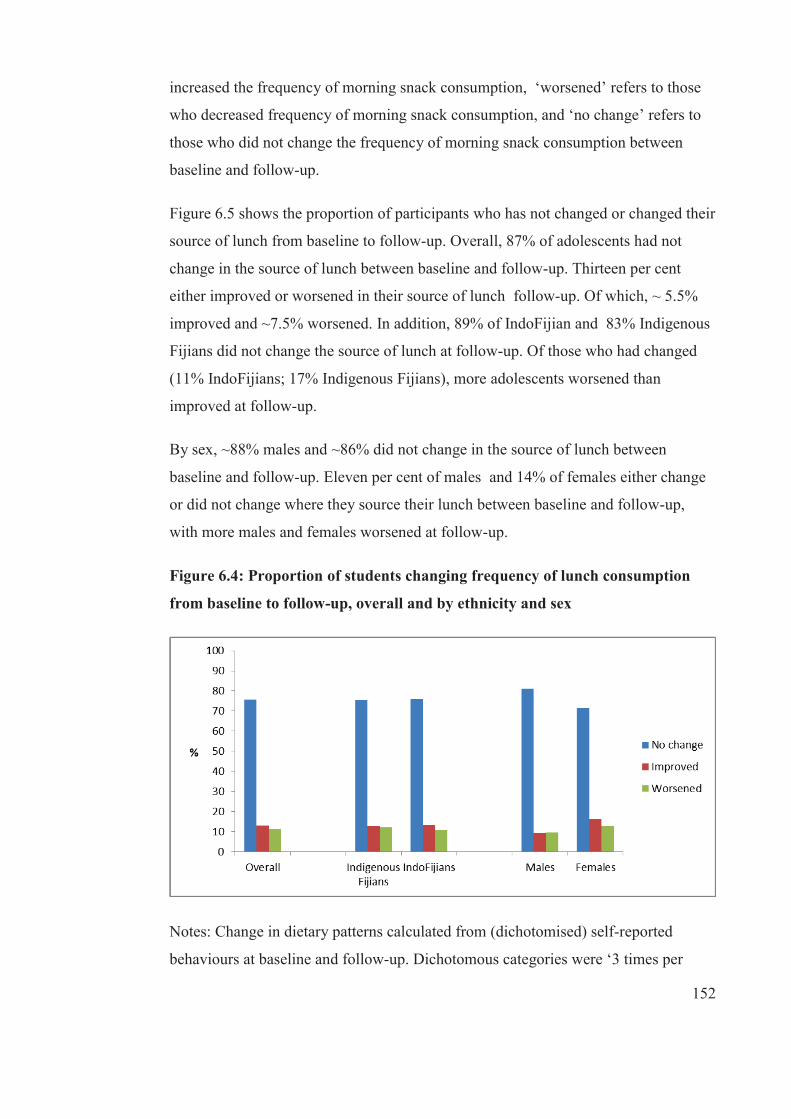
152
increased the frequency of morning snack consumption, ‘worsened’ refers to those
who decreased frequency of morning snack consumption, and ‘no change’ refers to
those who did not change the frequency of morning snack consumption between
baseline and follow-up.
Figure 6.5 shows the proportion of participants who has not changed or changed their
source of lunch from baseline to follow-up. Overall, 87% of adolescents had not
change in the source of lunch between baseline and follow-up. Thirteen per cent
either improved or worsened in their source of lunch follow-up. Of which, ~ 5.5%
improved and ~7.5% worsened. In addition, 89% of IndoFijian and 83% Indigenous
Fijians did not change the source of lunch at follow-up. Of those who had changed
(11% IndoFijians; 17% Indigenous Fijians), more adolescents worsened than
improved at follow-up.
By sex, ~88% males and ~86% did not change in the source of lunch between
baseline and follow-up. Eleven per cent of males and 14% of females either change
or did not change where they source their lunch between baseline and follow-up,
with more males and females worsened at follow-up.
Figure 6.4: Proportion of students changing frequency of lunch consumption
from baseline to follow-up, overall and by ethnicity and sex
Notes: Change in dietary patterns calculated from (dichotomised) self-reported
behaviours at baseline and follow-up. Dichotomous categories were ‘3 times per
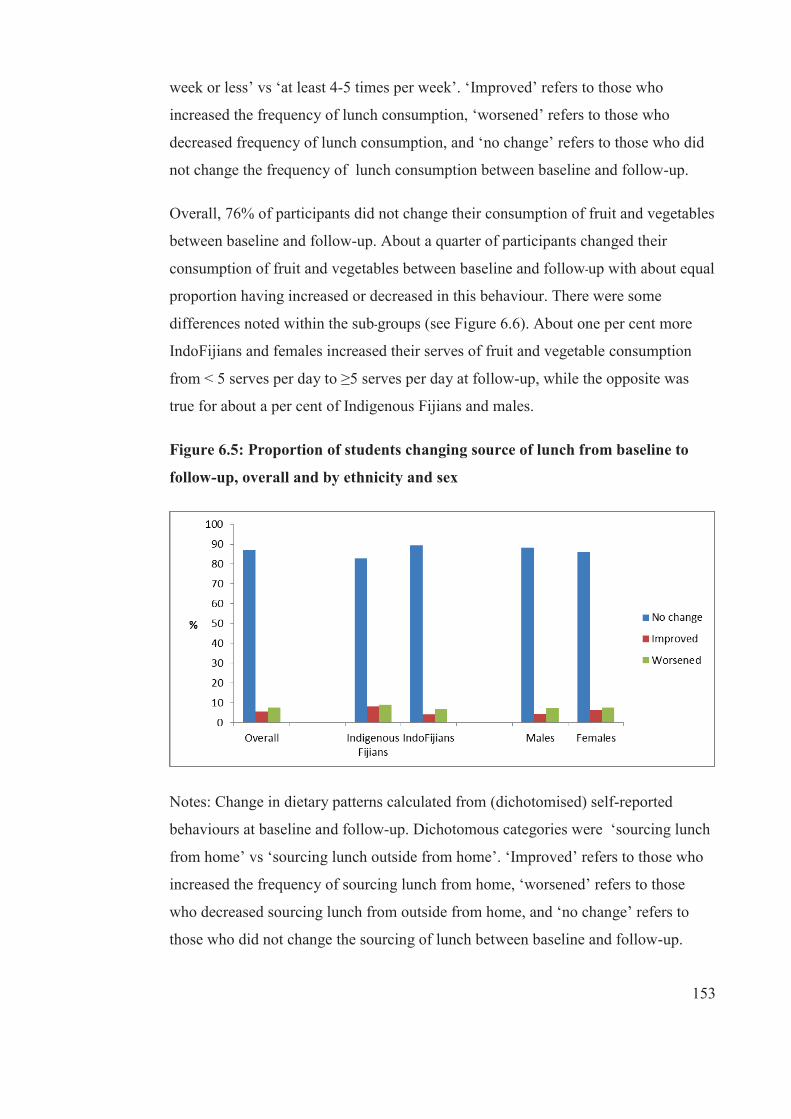
153
week or less’ vs ‘at least 4-5 times per week’. ‘Improved’ refers to those who
increased the frequency of lunch consumption, ‘worsened’ refers to those who
decreased frequency of lunch consumption, and ‘no change’ refers to those who did
not change the frequency of lunch consumption between baseline and follow-up.
Overall, 76% of participants did not change their consumption of fruit and vegetables
between baseline and follow-up. About a quarter of participants changed their
consumption of fruit and vegetables between baseline and follow-up with about equal
proportion having increased or decreased in this behaviour. There were some
differences noted within the sub-groups (see Figure 6.6). About one per cent more
IndoFijians and females increased their serves of fruit and vegetable consumption
from < 5 serves per day to ≥5 serves per day at follow-up, while the opposite was
true for about a per cent of Indigenous Fijians and males.
Figure 6.5: Proportion of students changing source of lunch from baseline to
follow-up, overall and by ethnicity and sex
Notes: Change in dietary patterns calculated from (dichotomised) self-reported
behaviours at baseline and follow-up. Dichotomous categories were ‘sourcing lunch
from home’ vs ‘sourcing lunch outside from home’. ‘Improved’ refers to those who
increased the frequency of sourcing lunch from home, ‘worsened’ refers to those
who decreased sourcing lunch from outside from home, and ‘no change’ refers to
those who did not change the sourcing of lunch between baseline and follow-up.
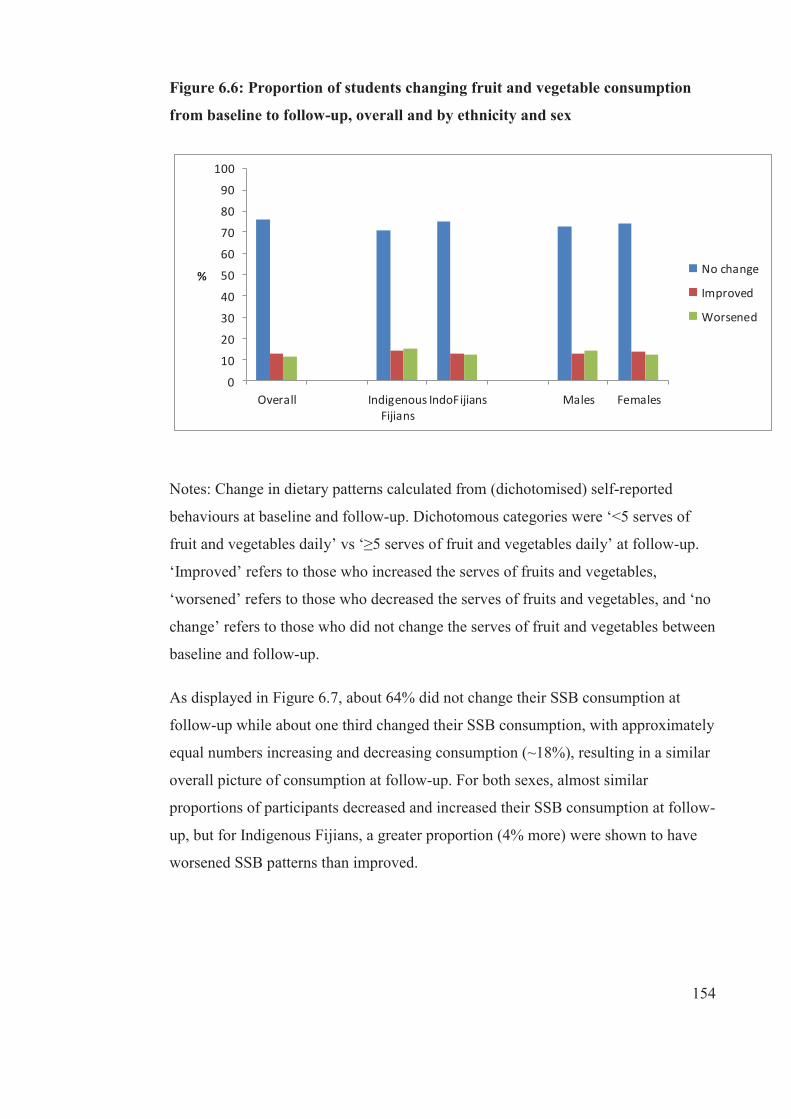
154
Figure 6.6: Proportion of students changing fruit and vegetable consumption
from baseline to follow-up, overall and by ethnicity and sex
0
10
20
30
40
50
60
70
80
90
100
Overall IndigenousFijians
IndoFijians Males Females
% No change
Improved
Worsened
Notes: Change in dietary patterns calculated from (dichotomised) self-reported
behaviours at baseline and follow-up. Dichotomous categories were ‘<5 serves of
fruit and vegetables daily’ vs ‘≥5 serves of fruit and vegetables daily’ at follow-up.
‘Improved’ refers to those who increased the serves of fruits and vegetables,
‘worsened’ refers to those who decreased the serves of fruits and vegetables, and ‘no
change’ refers to those who did not change the serves of fruit and vegetables between
baseline and follow-up.
As displayed in Figure 6.7, about 64% did not change their SSB consumption at
follow-up while about one third changed their SSB consumption, with approximately
equal numbers increasing and decreasing consumption (~18%), resulting in a similar
overall picture of consumption at follow-up. For both sexes, almost similar
proportions of participants decreased and increased their SSB consumption at follow-
up, but for Indigenous Fijians, a greater proportion (4% more) were shown to have
worsened SSB patterns than improved.
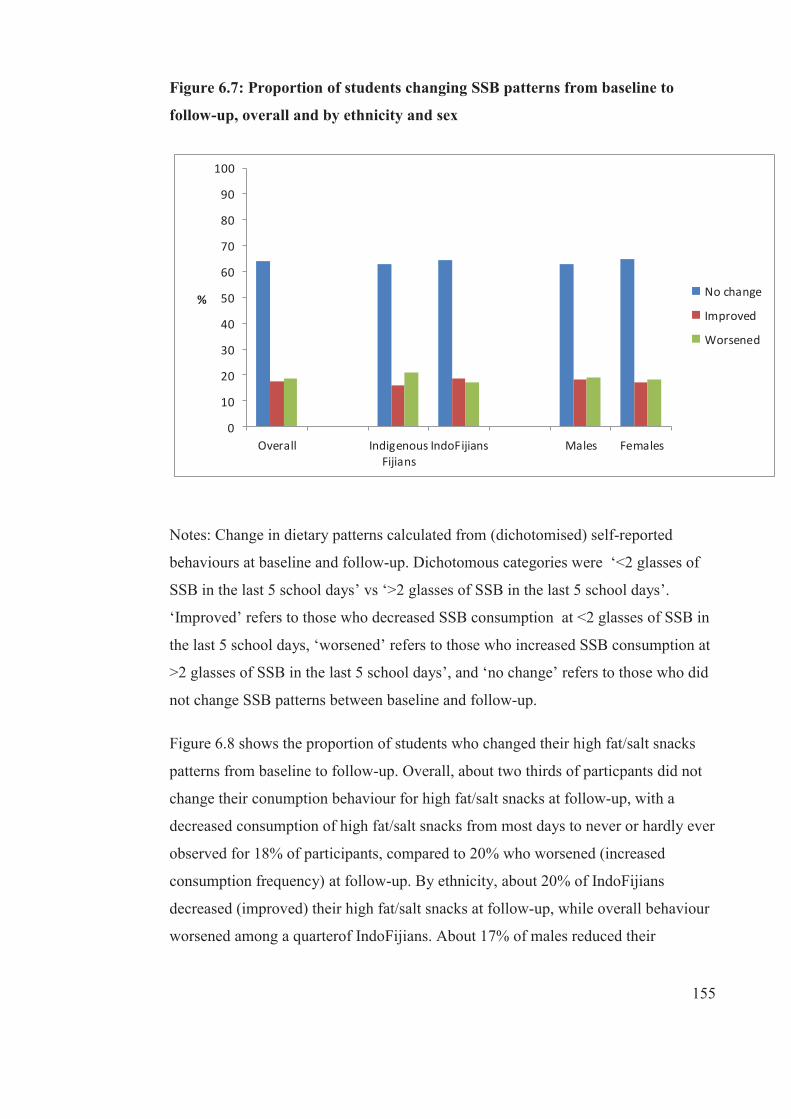
155
Figure 6.7: Proportion of students changing SSB patterns from baseline to
follow-up, overall and by ethnicity and sex
0
10
20
30
40
50
60
70
80
90
100
Overall IndigenousFijians
IndoFijians Males Females
% No change
Improved
Worsened
Notes: Change in dietary patterns calculated from (dichotomised) self-reported
behaviours at baseline and follow-up. Dichotomous categories were ‘<2 glasses of
SSB in the last 5 school days’ vs ‘>2 glasses of SSB in the last 5 school days’.
‘Improved’ refers to those who decreased SSB consumption at <2 glasses of SSB in
the last 5 school days, ‘worsened’ refers to those who increased SSB consumption at
>2 glasses of SSB in the last 5 school days’, and ‘no change’ refers to those who did
not change SSB patterns between baseline and follow-up.
Figure 6.8 shows the proportion of students who changed their high fat/salt snacks
patterns from baseline to follow-up. Overall, about two thirds of particpants did not
change their conumption behaviour for high fat/salt snacks at follow-up, with a
decreased consumption of high fat/salt snacks from most days to never or hardly ever
observed for 18% of participants, compared to 20% who worsened (increased
consumption frequency) at follow-up. By ethnicity, about 20% of IndoFijians
decreased (improved) their high fat/salt snacks at follow-up, while overall behaviour
worsened among a quarterof IndoFijians. About 17% of males reduced their
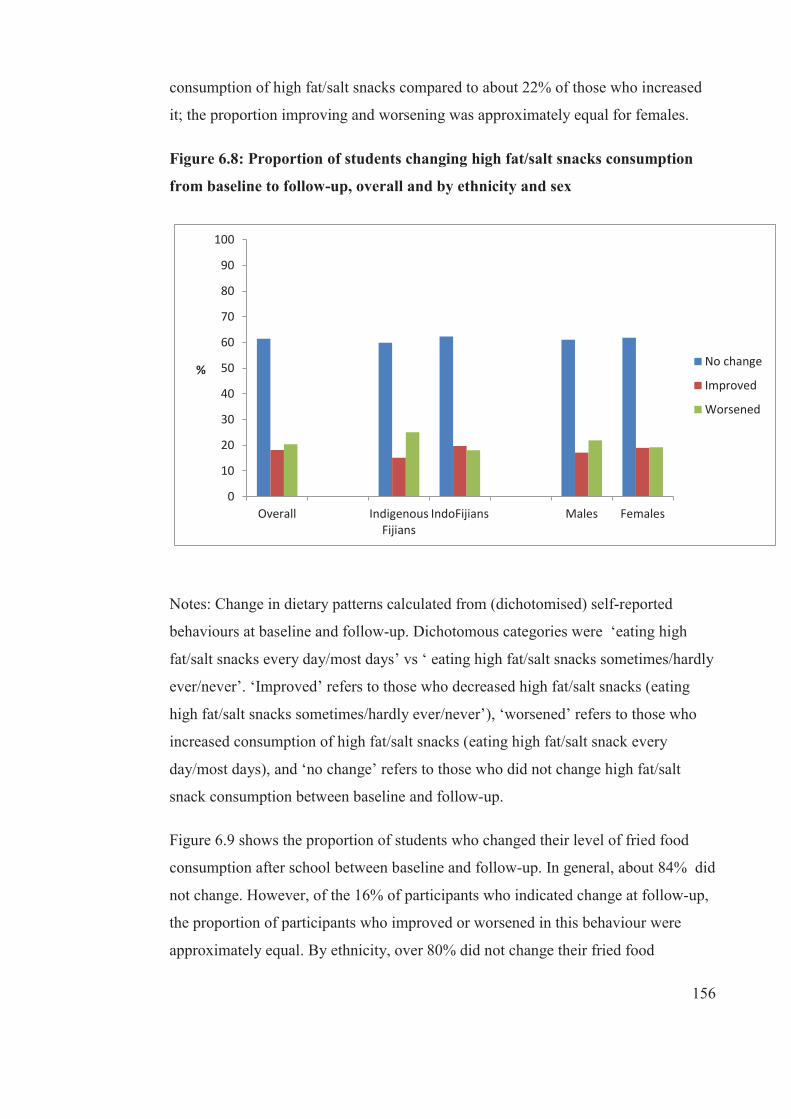
156
consumption of high fat/salt snacks compared to about 22% of those who increased
it; the proportion improving and worsening was approximately equal for females.
Figure 6.8: Proportion of students changing high fat/salt snacks consumption
from baseline to follow-up, overall and by ethnicity and sex
0
10
20
30
40
50
60
70
80
90
100
Overall IndigenousFijians
IndoFijians Males Females
%No change
Improved
Worsened
Notes: Change in dietary patterns calculated from (dichotomised) self-reported
behaviours at baseline and follow-up. Dichotomous categories were ‘eating high
fat/salt snacks every day/most days’ vs ‘ eating high fat/salt snacks sometimes/hardly
ever/never’. ‘Improved’ refers to those who decreased high fat/salt snacks (eating
high fat/salt snacks sometimes/hardly ever/never’), ‘worsened’ refers to those who
increased consumption of high fat/salt snacks (eating high fat/salt snack every
day/most days), and ‘no change’ refers to those who did not change high fat/salt
snack consumption between baseline and follow-up.
Figure 6.9 shows the proportion of students who changed their level of fried food
consumption after school between baseline and follow-up. In general, about 84% did
not change. However, of the 16% of participants who indicated change at follow-up,
the proportion of participants who improved or worsened in this behaviour were
approximately equal. By ethnicity, over 80% did not change their fried food
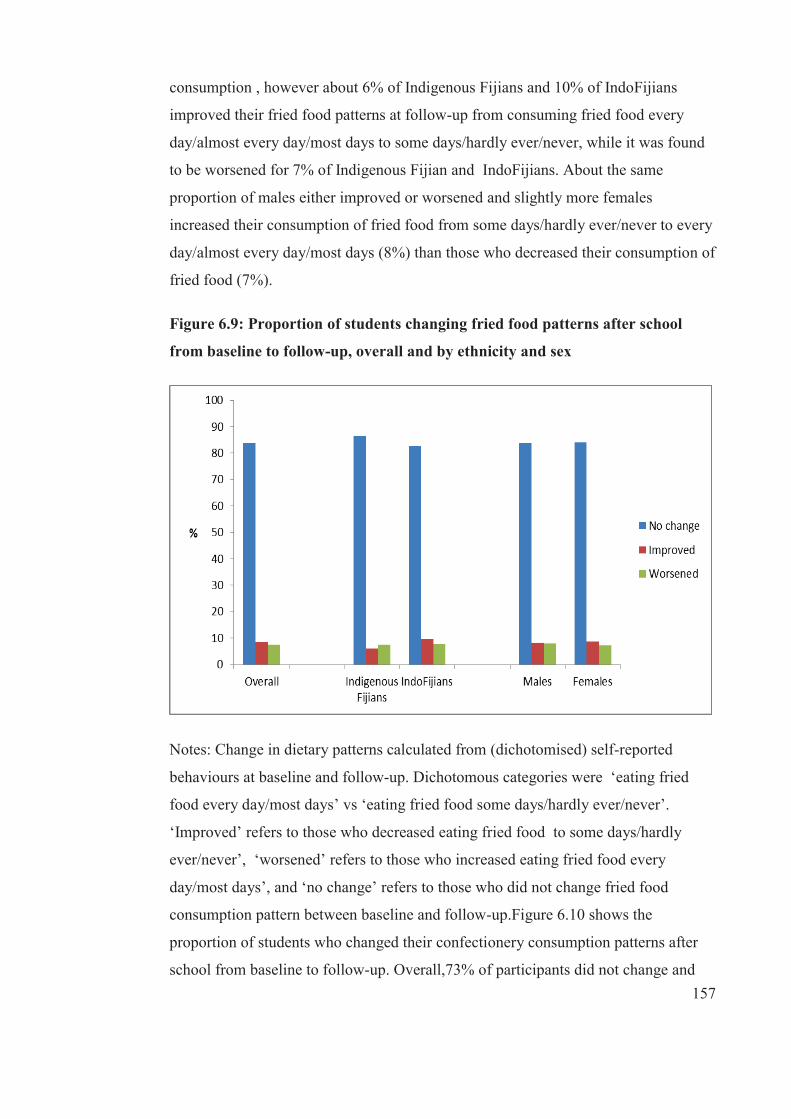
157
consumption , however about 6% of Indigenous Fijians and 10% of IndoFijians
improved their fried food patterns at follow-up from consuming fried food every
day/almost every day/most days to some days/hardly ever/never, while it was found
to be worsened for 7% of Indigenous Fijian and IndoFijians. About the same
proportion of males either improved or worsened and slightly more females
increased their consumption of fried food from some days/hardly ever/never to every
day/almost every day/most days (8%) than those who decreased their consumption of
fried food (7%).
Figure 6.9: Proportion of students changing fried food patterns after school
from baseline to follow-up, overall and by ethnicity and sex
Notes: Change in dietary patterns calculated from (dichotomised) self-reported
behaviours at baseline and follow-up. Dichotomous categories were ‘eating fried
food every day/most days’ vs ‘eating fried food some days/hardly ever/never’.
‘Improved’ refers to those who decreased eating fried food to some days/hardly
ever/never’, ‘worsened’ refers to those who increased eating fried food every
day/most days’, and ‘no change’ refers to those who did not change fried food
consumption pattern between baseline and follow-up.Figure 6.10 shows the
proportion of students who changed their confectionery consumption patterns after
school from baseline to follow-up. Overall,73% of participants did not change and
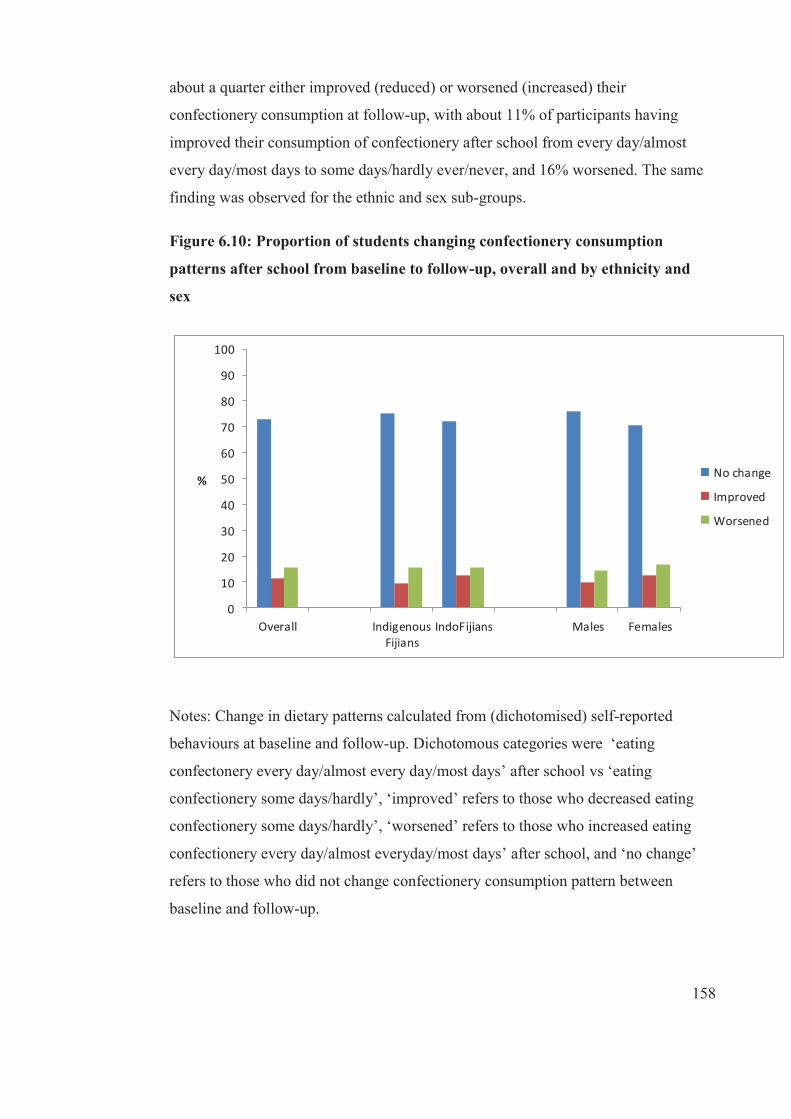
158
about a quarter either improved (reduced) or worsened (increased) their
confectionery consumption at follow-up, with about 11% of participants having
improved their consumption of confectionery after school from every day/almost
every day/most days to some days/hardly ever/never, and 16% worsened. The same
finding was observed for the ethnic and sex sub-groups.
Figure 6.10: Proportion of students changing confectionery consumption
patterns after school from baseline to follow-up, overall and by ethnicity and
sex
0
10
20
30
40
50
60
70
80
90
100
Overall IndigenousFijians
IndoFijians Males Females
% No change
Improved
Worsened
Notes: Change in dietary patterns calculated from (dichotomised) self-reported
behaviours at baseline and follow-up. Dichotomous categories were ‘eating
confectonery every day/almost every day/most days’ after school vs ‘eating
confectionery some days/hardly’, ‘improved’ refers to those who decreased eating
confectionery some days/hardly’, ‘worsened’ refers to those who increased eating
confectionery every day/almost everyday/most days’ after school, and ‘no change’
refers to those who did not change confectionery consumption pattern between
baseline and follow-up.
159
6.3.3 Individual-level variables and prediction of change for each
diet variable
In this section, the results of key individual-level variables at baseline that predicted
healthy change and unhealthy in dietary patterns over two years for the overall
population are presented. No individual-level variables were found to significantly
predict decreased morning snack (see Table 6.9), increased or decreased home-
sourced lunch (see Table 6.10 and Table 6.11), increased consumption of fruit and
vegetables (see Table 6.14), increased SSB consumption (see Table 6.17), or
improved (decreased) confectionery (see Table 6.22) for the overall population
between baseline and follow-up. Significant associations between individual
characteristics and changes in behaviours are described below according to each
individual-level variable.
Age
Older participants were more likely to improve morning snacks consumption (OR=
1.20 for each year of older age, p<0.05) (see Table 6.18), improve lunch (OR=1.14)
(see Table 6.10) and improve fruit and vegetables (OR=1.03) (see Table 6.14) from
baseline to follow-up.
BMI-z
As baseline BMI-z increased, adolescents were less likely to improve their
consumption of high fat/salt snacks (OR =0.90 per 1 unit increase in BMI-z, p <0.05)
or worsen (OR=0.87, p<0.05) (see Table 6.18 and Table 6.19). However, adolescents
with higher baseline BMI-z had lower odds of improving their fried foods (OR=
0.88, p<0.05) (Table 6.20).
Weight status (overweight/obese)
Adolescents who were overweight/obese were more likely to worsen in their
breakfast consumption (OR=1.58, p<0.05) (see Table 6.7) but either improved or
worsened in their lunch consumption (see Table 6.10 and Table 6.11). In addition,
they had the lower odds of worsened high fat/salt snack (OR=0.70, p<0.05) and
confectionery (OR=0.70, p<0.05) consumption (see Table 6.19 and Table 6.23).
160
Statement: Attempting to lose weight
Adolescents who stated that they were trying to lose weight were more likely to
improve their breakfast (OR= 1.49, p<0.05) and lunch (OR=1.66, p<0.05)
consumption (see Table 6.6 and Table 6.10). There was no association between
attempts to lose weight and worsening (decreasing) breakfast or lunch consumption.
Statement: Breakfast or lunch skipping a good way to lose weight
Adolescents who strongly agreed/agreed that breakfast or lunch skipping was a good
way to lose weight had the lower odds of either increased (OR=0.61,p<0.05) or
decreased breakfast (OR=0.65, p<0.05) and improved lunch (OR= 0.66, p<0.05)
consumption (see Table 6.6, Table 6.7 and Table 6.10). In addition, they had the
lower odds of increased (worsened) confectionery consumption (OR = 0.67, p<0.05)
between baseline and follow-up (see Table 6.23).
Statement: sugar content (Fruit drinks/cordial < Coke/Sprite)
Adolescents who believed that the sugar content of fruit drinks and cordials (fruit
cordial or concentrate) was less than non-diet soft drinks (e.g., Coke and Sprite) were
more likely (OR= 1.47, p<0.05) to improve their SSB consumption at follow-up (see
Table 6.16).
Statement: fruit and vegetables are bad for weight
Adolescents who strongly agreed or agreed that fruit and vegetables were bad for
weight had the lower odds of decreased fruit and vegetables (OR=0.70, p<0.05). But
had a lower odds of increased (worsened) fried food (OR =0.49, p<0.05)
consumption at follow-up (see Table 6.15 and Table 6.21).
Access to spending money
Adolescents who have access to spending money were less likely to improve SSB
consumption (OR= 0.49, p<0.05) (see Table 6.16) but more likely to worsen their
consumption of fried foods (OR=2.13, p<0.05) (see Table 6.21), or confectionery
(OR= 1.32, p<0.05) (see Table 6.23).
161
School encourages healthy food choices
Adolescents who reported that their school encourages healthy food choices were
less likely to worsen their fruit and vegetables consumption (OR=0.72, p<0.05) (see
Table 6.15).
Teachers as role models
Adolescents who reported that their teachers are role models for healthy eating were
more likely to improve their consumption of SSB (OR=1.27, p<0.05).These
adolescents were less likely to increase their consumption of high fat/salt snacks
(OR=0.76, p<0.05), or to decrease fruit and vegetables (OR=0.67, p<0.05) (see Table
6.15, Table 6.19.and Table 6.15).
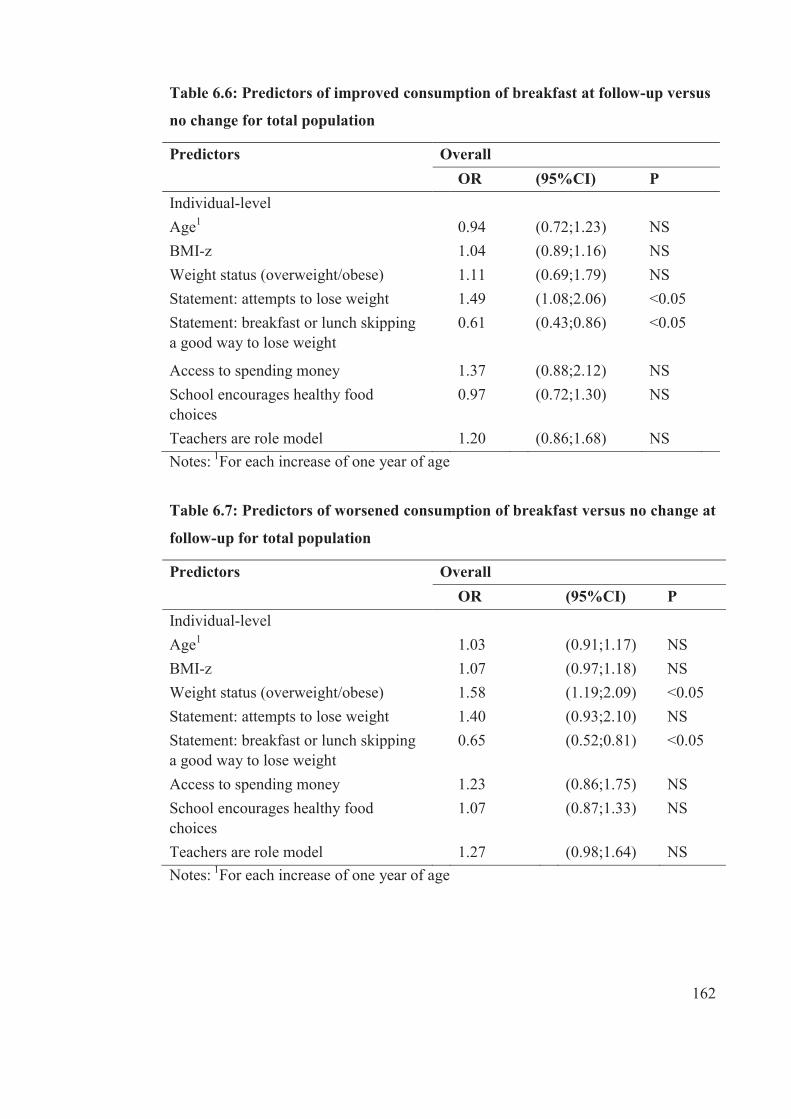
162
Table 6.6: Predictors of improved consumption of breakfast at follow-up versus
no change for total population
Notes: 1For each increase of one year of age
Table 6.7: Predictors of worsened consumption of breakfast versus no change at
follow-up for total population
Notes: 1For each increase of one year of age
Predictors Overall OR (95%CI) P Individual-level
Age1 0.94 (0.72;1.23) NS BMI-z 1.04 (0.89;1.16) NS Weight status (overweight/obese) 1.11 (0.69;1.79) NS Statement: attempts to lose weight 1.49 (1.08;2.06) <0.05 Statement: breakfast or lunch skipping a good way to lose weight
0.61 (0.43;0.86) <0.05
Access to spending money 1.37 (0.88;2.12) NS School encourages healthy food choices
0.97 (0.72;1.30) NS
Teachers are role model 1.20 (0.86;1.68) NS
Predictors Overall OR (95%CI) P Individual-level
Age1 1.03 (0.91;1.17) NS BMI-z 1.07 (0.97;1.18) NS Weight status (overweight/obese) 1.58 (1.19;2.09) <0.05 Statement: attempts to lose weight 1.40 (0.93;2.10) NS Statement: breakfast or lunch skipping a good way to lose weight
0.65 (0.52;0.81) <0.05
Access to spending money 1.23 (0.86;1.75) NS School encourages healthy food choices
1.07 (0.87;1.33) NS
Teachers are role model 1.27 (0.98;1.64) NS
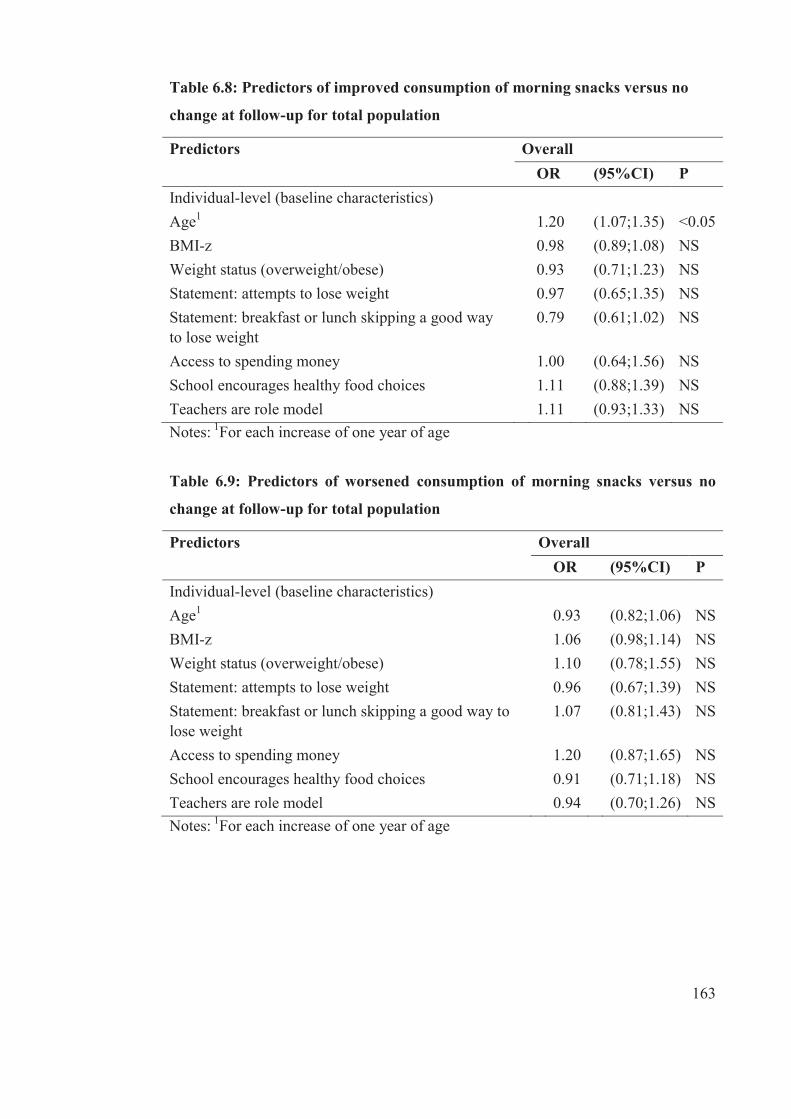
163
Table 6.8: Predictors of improved consumption of morning snacks versus no
change at follow-up for total population
Notes: 1For each increase of one year of age
Table 6.9: Predictors of worsened consumption of morning snacks versus no
change at follow-up for total population
Notes: 1For each increase of one year of age
Predictors Overall OR (95%CI) P Individual-level (baseline characteristics)
Age1 1.20 (1.07;1.35) <0.05 BMI-z 0.98 (0.89;1.08) NS Weight status (overweight/obese) 0.93 (0.71;1.23) NS Statement: attempts to lose weight 0.97 (0.65;1.35) NS Statement: breakfast or lunch skipping a good way to lose weight
0.79 (0.61;1.02) NS
Access to spending money 1.00 (0.64;1.56) NS School encourages healthy food choices 1.11 (0.88;1.39) NS Teachers are role model 1.11 (0.93;1.33) NS
Predictors Overall OR (95%CI) P Individual-level (baseline characteristics)
Age1 0.93 (0.82;1.06) NS BMI-z 1.06 (0.98;1.14) NS Weight status (overweight/obese) 1.10 (0.78;1.55) NS Statement: attempts to lose weight 0.96 (0.67;1.39) NS Statement: breakfast or lunch skipping a good way to lose weight
1.07 (0.81;1.43) NS
Access to spending money 1.20 (0.87;1.65) NS School encourages healthy food choices 0.91 (0.71;1.18) NS Teachers are role model 0.94 (0.70;1.26) NS
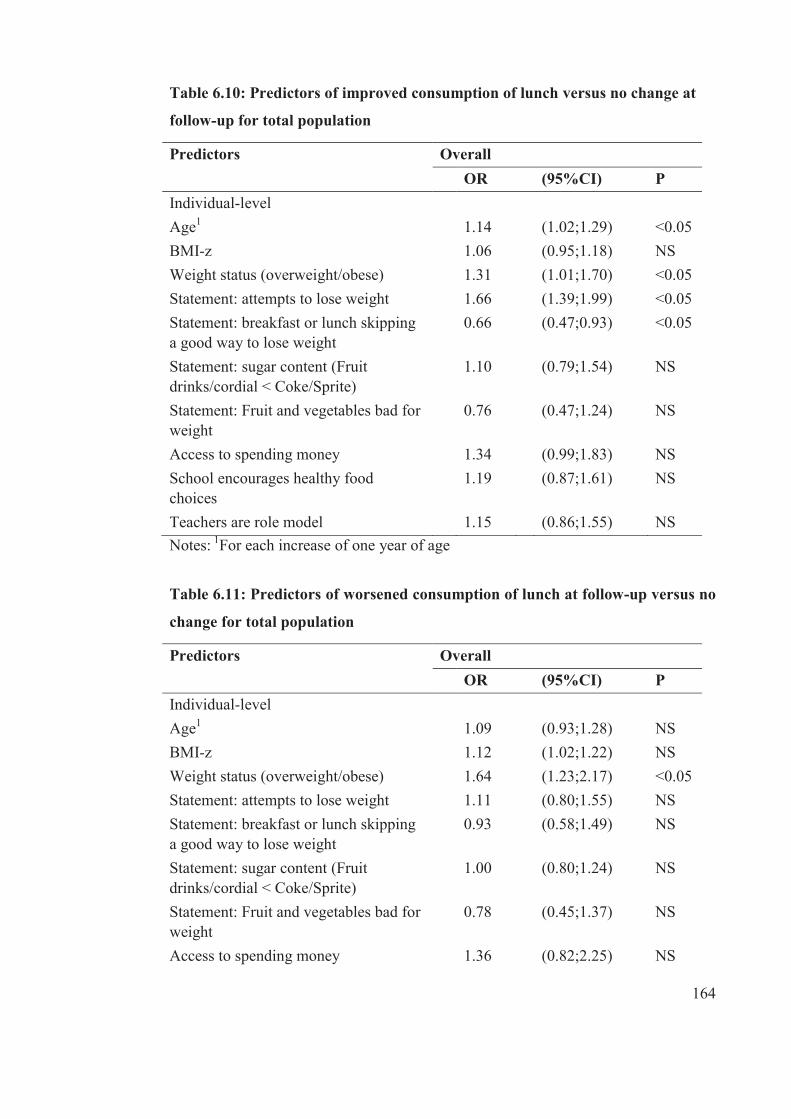
164
Table 6.10: Predictors of improved consumption of lunch versus no change at
follow-up for total population
Notes: 1For each increase of one year of age
Table 6.11: Predictors of worsened consumption of lunch at follow-up versus no
change for total population
Predictors Overall OR (95%CI) P Individual-level
Age1 1.14 (1.02;1.29) <0.05 BMI-z 1.06 (0.95;1.18) NS Weight status (overweight/obese) 1.31 (1.01;1.70) <0.05 Statement: attempts to lose weight 1.66 (1.39;1.99) <0.05 Statement: breakfast or lunch skipping a good way to lose weight
0.66 (0.47;0.93) <0.05
Statement: sugar content (Fruit drinks/cordial < Coke/Sprite)
1.10 (0.79;1.54) NS
Statement: Fruit and vegetables bad for weight
0.76 (0.47;1.24) NS
Access to spending money 1.34 (0.99;1.83) NS School encourages healthy food choices
1.19 (0.87;1.61) NS
Teachers are role model 1.15 (0.86;1.55) NS
Predictors Overall OR (95%CI) P Individual-level
Age1 1.09 (0.93;1.28) NS BMI-z 1.12 (1.02;1.22) NS Weight status (overweight/obese) 1.64 (1.23;2.17) <0.05 Statement: attempts to lose weight 1.11 (0.80;1.55) NS Statement: breakfast or lunch skipping a good way to lose weight
0.93 (0.58;1.49) NS
Statement: sugar content (Fruit drinks/cordial < Coke/Sprite)
1.00 (0.80;1.24) NS
Statement: Fruit and vegetables bad for weight
0.78 (0.45;1.37) NS
Access to spending money 1.36 (0.82;2.25) NS
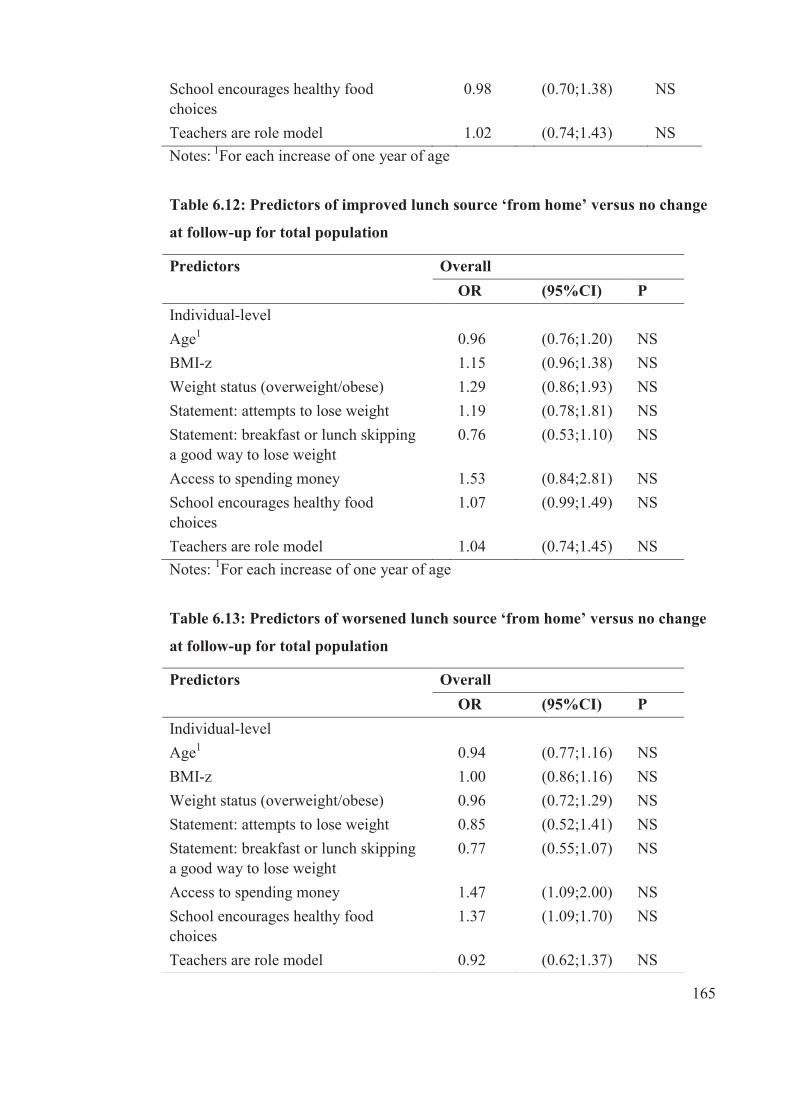
165
Notes: 1For each increase of one year of age
Table 6.12: Predictors of improved lunch source ‘from home’ versus no change
at follow-up for total population
Notes: 1For each increase of one year of age
Table 6.13: Predictors of worsened lunch source ‘from home’ versus no change
at follow-up for total population
School encourages healthy food choices
0.98 (0.70;1.38) NS
Teachers are role model 1.02 (0.74;1.43) NS
Predictors Overall OR (95%CI) P Individual-level
Age1 0.96 (0.76;1.20) NS BMI-z 1.15 (0.96;1.38) NS Weight status (overweight/obese) 1.29 (0.86;1.93) NS Statement: attempts to lose weight 1.19 (0.78;1.81) NS Statement: breakfast or lunch skipping a good way to lose weight
0.76 (0.53;1.10) NS
Access to spending money 1.53 (0.84;2.81) NS School encourages healthy food choices
1.07 (0.99;1.49) NS
Teachers are role model 1.04 (0.74;1.45) NS
Predictors Overall OR (95%CI) P Individual-level
Age1 0.94 (0.77;1.16) NS BMI-z 1.00 (0.86;1.16) NS Weight status (overweight/obese) 0.96 (0.72;1.29) NS Statement: attempts to lose weight 0.85 (0.52;1.41) NS Statement: breakfast or lunch skipping a good way to lose weight
0.77 (0.55;1.07) NS
Access to spending money 1.47 (1.09;2.00) NS School encourages healthy food choices
1.37 (1.09;1.70) NS
Teachers are role model 0.92 (0.62;1.37) NS
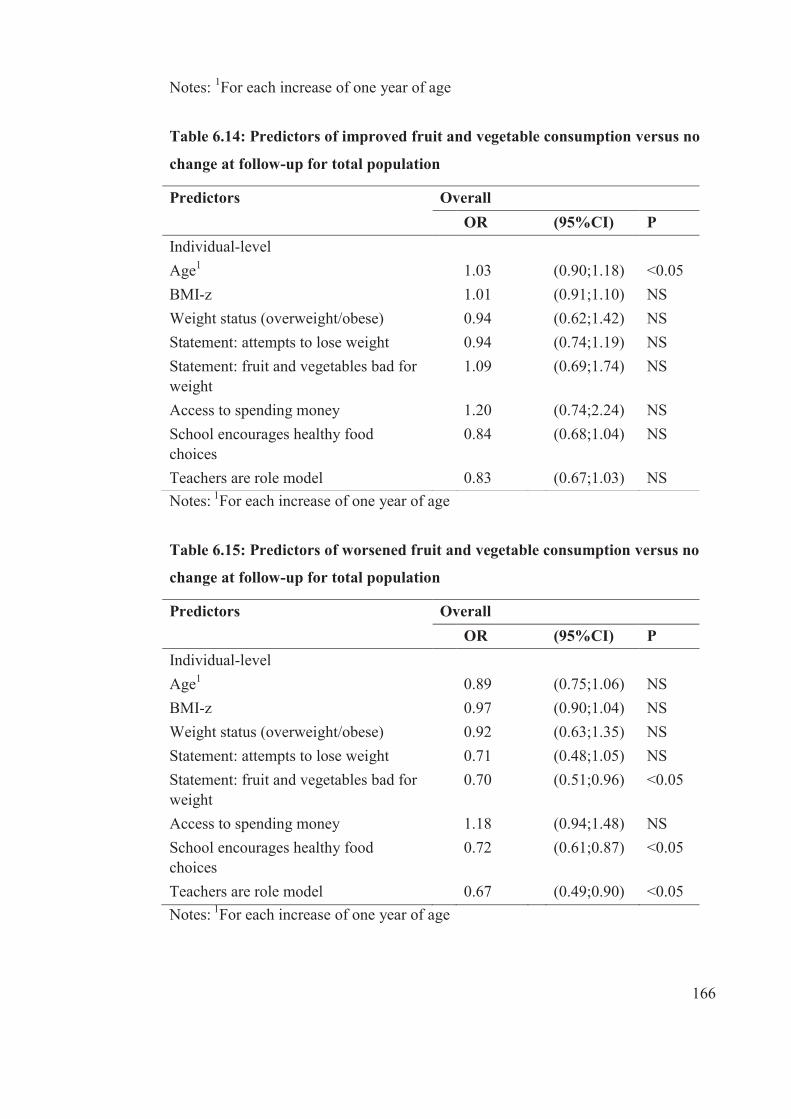
166
Notes: 1For each increase of one year of age
Table 6.14: Predictors of improved fruit and vegetable consumption versus no
change at follow-up for total population
Notes: 1For each increase of one year of age
Table 6.15: Predictors of worsened fruit and vegetable consumption versus no
change at follow-up for total population
Notes: 1For each increase of one year of age
Predictors Overall OR (95%CI) P Individual-level
Age1 1.03 (0.90;1.18) <0.05 BMI-z 1.01 (0.91;1.10) NS Weight status (overweight/obese) 0.94 (0.62;1.42) NS Statement: attempts to lose weight 0.94 (0.74;1.19) NS Statement: fruit and vegetables bad for weight
1.09 (0.69;1.74) NS
Access to spending money 1.20 (0.74;2.24) NS School encourages healthy food choices
0.84 (0.68;1.04) NS
Teachers are role model 0.83 (0.67;1.03) NS
Predictors Overall OR (95%CI) P Individual-level
Age1 0.89 (0.75;1.06) NS BMI-z 0.97 (0.90;1.04) NS Weight status (overweight/obese) 0.92 (0.63;1.35) NS Statement: attempts to lose weight 0.71 (0.48;1.05) NS Statement: fruit and vegetables bad for weight
0.70 (0.51;0.96) <0.05
Access to spending money 1.18 (0.94;1.48) NS School encourages healthy food choices
0.72 (0.61;0.87) <0.05
Teachers are role model 0.67 (0.49;0.90) <0.05
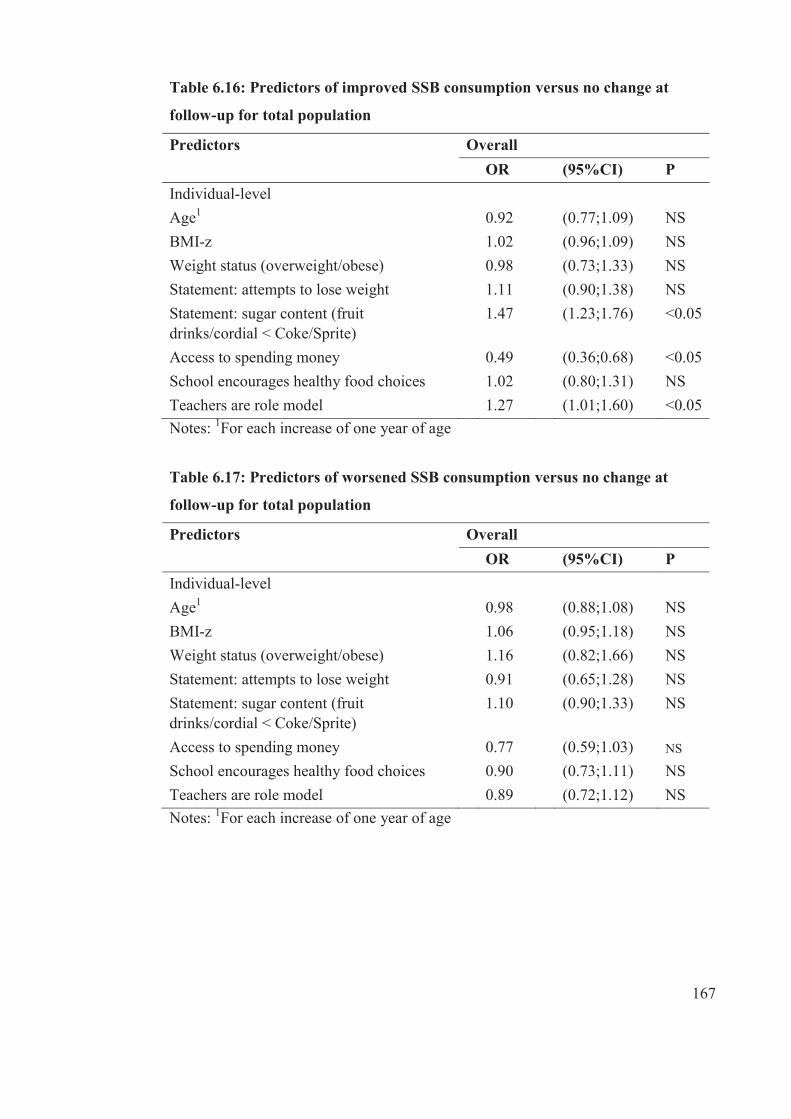
167
Table 6.16: Predictors of improved SSB consumption versus no change at
follow-up for total population
Predictors Overall OR (95%CI) P Individual-level
Age1 0.92 (0.77;1.09) NS BMI-z 1.02 (0.96;1.09) NS Weight status (overweight/obese) 0.98 (0.73;1.33) NS Statement: attempts to lose weight 1.11 (0.90;1.38) NS Statement: sugar content (fruit drinks/cordial < Coke/Sprite)
1.47 (1.23;1.76) <0.05
Access to spending money 0.49 (0.36;0.68) <0.05 School encourages healthy food choices 1.02 (0.80;1.31) NS Teachers are role model 1.27 (1.01;1.60) <0.05 Notes: 1For each increase of one year of age
Table 6.17: Predictors of worsened SSB consumption versus no change at
follow-up for total population
Predictors Overall OR (95%CI) P Individual-level
Age1 0.98 (0.88;1.08) NS BMI-z 1.06 (0.95;1.18) NS Weight status (overweight/obese) 1.16 (0.82;1.66) NS Statement: attempts to lose weight 0.91 (0.65;1.28) NS Statement: sugar content (fruit drinks/cordial < Coke/Sprite)
1.10 (0.90;1.33) NS
Access to spending money 0.77 (0.59;1.03) NS
School encourages healthy food choices 0.90 (0.73;1.11) NS Teachers are role model 0.89 (0.72;1.12) NS Notes: 1For each increase of one year of age
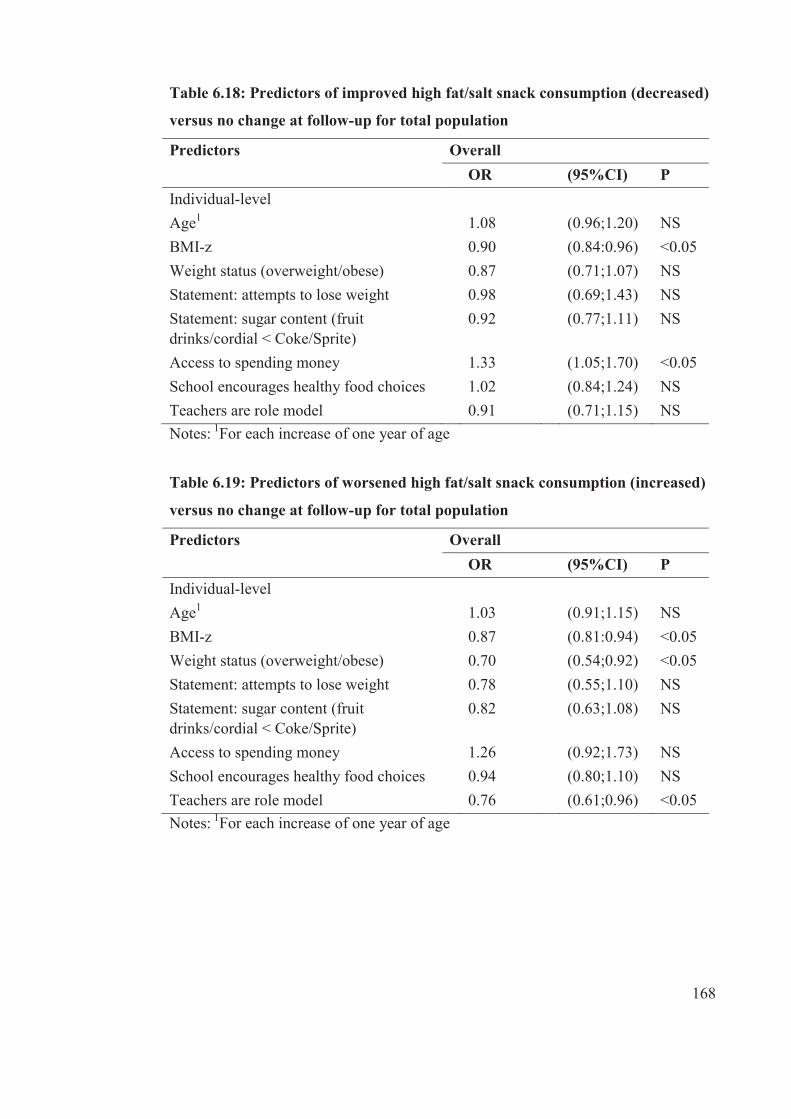
168
Table 6.18: Predictors of improved high fat/salt snack consumption (decreased)
versus no change at follow-up for total population
Predictors Overall OR (95%CI) P Individual-level
Age1 1.08 (0.96;1.20) NS BMI-z 0.90 (0.84:0.96) <0.05 Weight status (overweight/obese) 0.87 (0.71;1.07) NS Statement: attempts to lose weight 0.98 (0.69;1.43) NS Statement: sugar content (fruit drinks/cordial < Coke/Sprite)
0.92 (0.77;1.11) NS
Access to spending money 1.33 (1.05;1.70) <0.05 School encourages healthy food choices 1.02 (0.84;1.24) NS Teachers are role model 0.91 (0.71;1.15) NS Notes:
1For each increase of one year of age
Table 6.19: Predictors of worsened high fat/salt snack consumption (increased)
versus no change at follow-up for total population
Predictors Overall OR (95%CI) P Individual-level
Age1 1.03 (0.91;1.15) NS BMI-z 0.87 (0.81:0.94) <0.05 Weight status (overweight/obese) 0.70 (0.54;0.92) <0.05 Statement: attempts to lose weight 0.78 (0.55;1.10) NS Statement: sugar content (fruit drinks/cordial < Coke/Sprite)
0.82 (0.63;1.08) NS
Access to spending money 1.26 (0.92;1.73) NS School encourages healthy food choices 0.94 (0.80;1.10) NS Teachers are role model 0.76 (0.61;0.96) <0.05 Notes:
1For each increase of one year of age
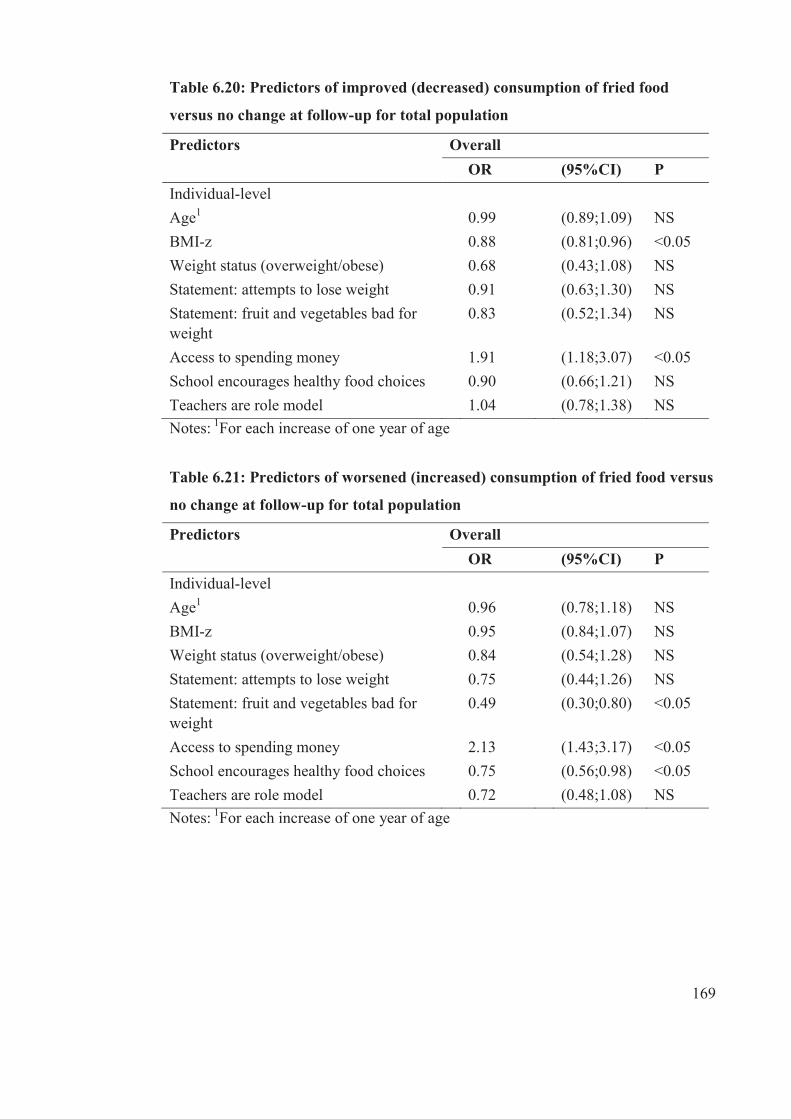
169
Table 6.20: Predictors of improved (decreased) consumption of fried food
versus no change at follow-up for total population
Predictors Overall OR (95%CI) P Individual-level
Age1 0.99 (0.89;1.09) NS BMI-z 0.88 (0.81;0.96) <0.05 Weight status (overweight/obese) 0.68 (0.43;1.08) NS Statement: attempts to lose weight 0.91 (0.63;1.30) NS Statement: fruit and vegetables bad for weight
0.83 (0.52;1.34) NS
Access to spending money 1.91 (1.18;3.07) <0.05 School encourages healthy food choices 0.90 (0.66;1.21) NS Teachers are role model 1.04 (0.78;1.38) NS Notes:
1For each increase of one year of age
Table 6.21: Predictors of worsened (increased) consumption of fried food versus
no change at follow-up for total population
Predictors Overall OR (95%CI) P Individual-level
Age1 0.96 (0.78;1.18) NS BMI-z 0.95 (0.84;1.07) NS Weight status (overweight/obese) 0.84 (0.54;1.28) NS Statement: attempts to lose weight 0.75 (0.44;1.26) NS Statement: fruit and vegetables bad for weight
0.49 (0.30;0.80) <0.05
Access to spending money 2.13 (1.43;3.17) <0.05 School encourages healthy food choices 0.75 (0.56;0.98) <0.05 Teachers are role model 0.72 (0.48;1.08) NS Notes:
1For each increase of one year of age
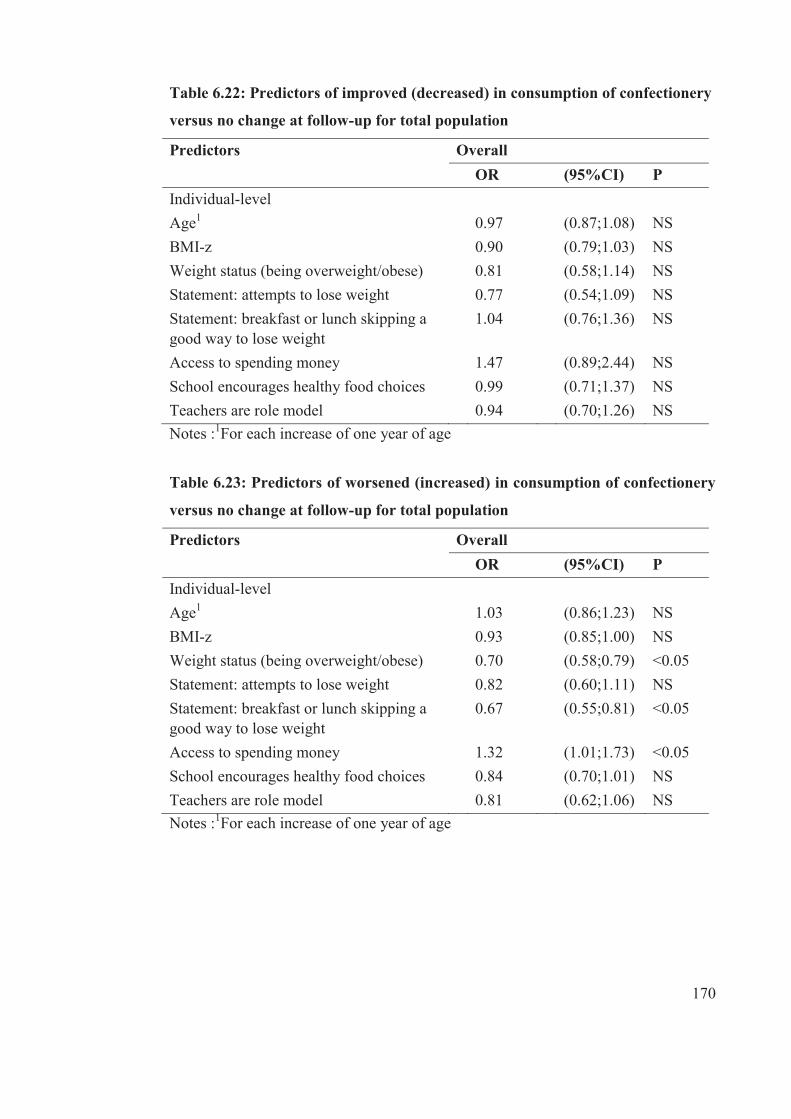
170
Table 6.22: Predictors of improved (decreased) in consumption of confectionery
versus no change at follow-up for total population
Predictors Overall OR (95%CI) P Individual-level
Age1 0.97 (0.87;1.08) NS BMI-z 0.90 (0.79;1.03) NS Weight status (being overweight/obese) 0.81 (0.58;1.14) NS Statement: attempts to lose weight 0.77 (0.54;1.09) NS Statement: breakfast or lunch skipping a good way to lose weight
1.04 (0.76;1.36) NS
Access to spending money 1.47 (0.89;2.44) NS School encourages healthy food choices 0.99 (0.71;1.37) NS Teachers are role model 0.94 (0.70;1.26) NS Notes :1For each increase of one year of age
Table 6.23: Predictors of worsened (increased) in consumption of confectionery
versus no change at follow-up for total population
Predictors Overall OR (95%CI) P Individual-level
Age1 1.03 (0.86;1.23) NS BMI-z 0.93 (0.85;1.00) NS Weight status (being overweight/obese) 0.70 (0.58;0.79) <0.05 Statement: attempts to lose weight 0.82 (0.60;1.11) NS Statement: breakfast or lunch skipping a good way to lose weight
0.67 (0.55;0.81) <0.05
Access to spending money 1.32 (1.01;1.73) <0.05 School encourages healthy food choices 0.84 (0.70;1.01) NS Teachers are role model 0.81 (0.62;1.06) NS Notes :1For each increase of one year of age
171
6.3.4 Individual-level variables and prediction of change for each
diet variable by ethnicity and sex
This section presents the results of key individual-level variables at baseline that
predicted healthy change and unhealthy in dietary patterns over two years within the
ethnic and sex subgroups. The individual-level variables were: age, BMI-z, weight
status (overweight/obese), statement on attempts to lose weight, statement on fruit
and vegetables bad for weight, access to spending money, school encourages health
food choices, and teachers being role model.
Generally, there were few significant findings on prediction of change for the key
dietary patterns at follow-up for the ethnic and sex sub-groups. For both ethnic
groups, unlike the overall population, no individual level variables predicted changes
at follow-up for dietary variable ‘worsened morning snack’ (see Table 6.27). Within
the sub-group, no individual level variables predicted change at follow-up for
improved breakfast consumption (see Table 6.24), improved lunch source (see Table
6.30), worsened lunch source (see Table 6.31) for Indigenous Fijians. Individual
level variables did not predict worsened consumption of lunch (see Table 6.29),
worsened SSB consumption (see Table 3.35), or improved consumption of
confectionery (see Table 3.40) for IndoFijians.
Age
Older Indigenous Fijian participants were more likely to improve morning snacks
consumption (OR= 1.20 for each year of older age, p<0.05) (see Table 6.26) at
follow-up whereas no significant findings were found among IndoFijian participants
and overall
For sex sub-groups, older male participants were more likely that they would
improve their consumption of morning snack (OR=1.24 for each year of older age,
p<0.05) (see Table 6.26) and lunch (OR=1.24 for each year of older age, p<0.05)
(see Table 6.28). Unlike males, older female participants has the lower odds for
improved fruit and vegetables (OR=0.89 for each year of older age, p<0.05) (see
Table 6.32) and fried foods (OR= 0.81 for each year of older age, p<0.05) (see Table
172
6.38). In addition, older females had the lower odds for worsened fruit and
vegetables (OR=0.83 for each year of older age, p<0.05) (see Table 6.37).
BMI-z
As baseline BMI-z increased, participants from both ethnic groups were less likely to
improve high fat/salt snack consumption (Table 6.36). By ethnicity, as baseline BMI-
z increased, Indigenous Fijian participants were more likely to decrease breakfast
consumption at follow-up (OR= 1.36 per one unit increase, p<0.05) (see Table 6.25).
As baseline BMI-z increased, IndoFijian participants were more likely to worsen
(decrease) in their morning snack consumption (OR=1.08 per one unit increase,
p<0.05) (see Table 6.27). In addition, as baseline BMI-z increased, IndoFijian
participants had lower odds of improved (decreased) fried foods (OR= 0.88 per one
unit increase, p<0.05) consumption (see Table 6.38).
For the sex sub-groups, males were more likely to worsen in their consumption of
morning snack (OR=1.13 per one unit increase, p<0.05) (see Table 6.27) at follow-
up as baseline BMI-z increased. However, as baseline BMI-z increased, females
have lower odds of improving their consumption of fruit and vegetables (OR-=0.89
per one unit increase, p<0.05) (see Table 6.32) and fried foods (OR=0.81 per one
unit increase, p<0.05) (see Table 6.38). In addition, as baseline BMI-z increased,
females have lower odds to worsen (increase) high fat/salt snacks consumption
(OR=0.83 per one unit increase, p<0.05) (see Table 6.37) at follow-up.
Weight status
Weight status (being overweight/obese) predicted some changes in dietary patterns
between baseline and follow-up. Overweight/obese Indigenous Fijian participants at
baseline were more likely to worsen their lunch consumption patterns at follow-up
(OR=1.97, p<0.05) (see Table 6.29). In contrary, overweight/obese IndoFijian
participants had lower odds of improving their fried food consumption (OR=0.54,
p<0.05) (see Table 6.38) and confectionery (OR=0.68, p<0.05) (see Table 6.40) at
follow-up. Additionally, they had lower odds of worsening their consumption of high
173
fat/salt snacks (OR=0.70, p<0.05) (see Table 6.37) and confectionery (OR= 0.45,
p<0.05) (see Table 6.41) at follow-up.
By sex sub-groups, overweight/obese females were less likely to worsen (increase)
high fat/snack consumption at follow-up (OR=0.73, p<0.05) (see Table 6.38).
Statement: attempt to lose weight
Adolescents’ attempts to lose weight also predicted few dietary changes within
ethnic and sex sub-groups. Unlike overall and Indigenous Fijian participants,
IndoFijians who attempted to lose weight were more likely to source their lunch
from home (OR=1.97, p<0.05) at follow-up (see Table 6.30) but were less likely to
increase (worsen) their fried foods consumption (OR=0.05, p<0.05) (see Table 6.39).
Unlike overall and IndoFijian participants, Indigenous Fijian participants who
attempted to lose weight were less likely to decrease (worsen) their fruit and
vegetables consumption at follow-up compared to those who did not change (OR=
0.53, p<0.05) (see Table 6.33). There were no differences found among sex sub-
groups.
Statement: breakfast or lunch skipping a good way to lose weight
Adolescents from both ethnic groups who strongly agreed or agreed that breakfast or
lunch skipping is a good way to lose weight were less likely to increase (improve)
their consumption of breakfast (see Table 6.25) and lunch (for IndoFijians) (see
Table 6.28). IndoFijian adolescents (OR=0.58, p<0.05) (see Table 6.41) and males
(OR=0.58,p<0.05) (see Table 6.41) who strongly agreed or agreed that breakfast or
lunch skipping is a good way to lose weight, has the lower odds of increasing
(worsening) their consumption of confectionery at follow-up compared to other who
did not change.
Females who strongly agreed or agreed that breakfast or lunch skipping is a good
way to lose weight have the lower odds to improve their lunch consumption at
follow-up compared to lose who did not change (OR=0.67, p<0.05) (see Table 6.28).
174
Statement: Fruit and vegetables bad for weight
IndoFijian adolescents who strongly agreed or agreed that fruit and vegetables are
bad for weight have the lower odds of improving their fried food consumption at
follow-up compared to those who did not change (OR=0.06,p<0.05) (see Table
6.38). Adolescents who also strongly agreed or agreed to this statement had the lower
odds of increasing (worsening) their consumption of fruit and vegetables
(Indigenous Fijians), fried foods (IndoFijians and males) (see Table 6.33, Table
6.39).
Statement: sugar content (Fruit drinks/cordial < Coke/Sprite)
Adolescents from both ethnic groups who strongly agreed or agreed that sugar
content of fruit drinks/cordial is less than Coke/Sprite were more likely to improve
their consumption of SSB at follow-up compared to those who did not change (see
Table 6.34). Additionally, IndoFijian adolescents who strongly agreed or agreed that
sugar content of fruit drinks/cordial is less than Coke/Sprite have the lower odds of
increasing (worsening) their consumption of high fat/salt snacks (OR=0.75,p<0.05)
(see Table 6.37). Similar finding was reported for females and their consumption of
high fat/salt snacks (see Table 6.36).
Access to spending money
Adolescents from both ethnic groups were less likely to improve their SSB
consumption at follow-up compared to the adolescents who did not change (see
Table 6.34). Also, they were more likely to increase (worsen) in their consumption of
fried foods (OR= 2.14,p<0.05 Indigenous Fijian; OR=1.80,p<0.05 IndoFijian) (see
Table 6.39). IndoFijian who had access to spending money were more likely to
worsen in their lunch source i.e. they had increased their lunch sourced outside from
home (OR=1.84,p<0.05) (see Table 6.31).
However, adolescents from both ethnic groups who had access to spending money
were more likely to improve in their consumption of fried foods (Table 6.38). In
addition, IndoFijian adolescents who had access to spending money were more likely
to improve in their lunch source (from home) OR=2.47, p<0.05) (see Table 6.30),
175
consumption of lunch (OR=1.51, p<0.05) (see Table 6.28), high fat/salt snacks
(OR=1.51, p<0.05) (see Table 6.36), fried foods at follow-up (see Table 6.38).
By sexes, both male and females who had access to spending money were less likely
to improve in SSB consumption (see Table 6.34) and worsened in fried food
consumption (see Table 6.39). Female adolescents who had access to spending
money were more likely to worsen in their consumption breakfast (OR=1.57,
p<0.05) (see Table 6.25) whereas males worsened in lunch sourced from home
(OR=1.90, p<0.05) (see Table 6.31), fruit and vegetables (OR=1.63, p<0.05) (see
Table 6.33).
Males and females who had access to spending money were more likely to improve
in their consumption of fried foods (see Table 6.38). Males with access to spending
money were more likely to decrease (improve) in their consumption of high fat/salt
snacks at follow-up (OR=1.37,p<0.05) (see Table 6.36).
School encourages healthy food choices
Indigenous Fijian adolescents who strongly agreed or agreed that their school
encourages healthy food choices have the lower odds to increase (worsen)
consumption of SSB (OR=0.71, p<0.05) (see Table 6.35) and confectionery at
follow-up for IndoFijians and males (see Table 6.41).
By sexes, females who strongly agreed or agreed that their school encourages healthy
food choices were less likely to worsen in their consumption of breakfast (OR=0.72,
p<0.05) (see Table 6.27), fruit and vegetables (OR=0.72, p<0.05) (see Table 6.33).
Similarly, males who strongly agreed or agreed that their school encourages healthy
food choices had the lower odds of increasing their consumption of fried foods
(OR=0.66, p<0.05) (see Table 6.39) and confectionery (OR=0.66, p<0.05) (see Table
6.41).
Findings showed that females who strongly agreed or agreed that their school
encourages healthy food choices have the lower odds of increasing (worsen)
consumption of high fat/salt snacks (OR=0.76,p<0.05) (see Table 6.37).
176
Teachers are role model
Adolescents from both ethnic groups who strongly agreed or agreed that teachers in
their school were role model in making healthy food choices were less likely to
increase (worsen) in their consumption of fruit and vegetables and high fat/salt
snacks (IndoFijians), SSB and confectionery (Indigenous Fijians).
By sexes, females who strongly agreed or agreed that teachers in their school were
role model in making healthy food choices had the lower odds of decreasing their
fruit and vegetables consumption (see Table 6.33), high fat/snack (see Table 6.36),
confectionery (see Table 6.41). Also, males who strongly agreed or agreed that
teachers in their school were role model in making healthy food choices had the
lower odds of increasing (worsen) their fried food consumption at follow-up
compared to those who did not change (see Table 6.39).

177
Table 6.24: Predictors of improved consumption of breakfast versus no change at follow-up by ethnicity and sex
Predictors Ethnicity Sex
Indigenous
Fijians
IndoFijian Males Female
OR (95% CI) P OR (95%CI) P OR (95%CI) P OR (95%CI) P
Individual variables
Age1 0.86 0.61;1.22 NS 1.04 0.76;1.43 NS 0.89 0.68;1.15 NS 0.97 0.70;1.34 NS
BMI-z 0.96 0.76;1.23 NS 1.08 0.91;1.28 NS 1.10 0.92;1.31 NS 1.00 0.81;1.24 NS
Weight status (overweight/obese)
0.89 0.59;1.34 NS 1.55 0.86;2.78 NS 1.62 0.91;2.85 NS 0.90 0.52;1.55 NS
Statement: attempts to lose weight
1.28 0.65;2.49 NS 1.88 1.28;2.76 <0.05 1.59 0.82;3.09 NS 1.48 1.05;2.08 <0.05
Statement: breakfast or lunch skipping a good way to lose weight
0.55 0.30;1.02 NS 0.67 0.47;0.96 <0.05 0.67 0.43;1.03 NS 0.56 0.37;0.84 <0.05
Access to spending money 0.87 0.56;1.35 NS 2.22 1.19;4.18 <0.05 1.13 0.53;2.42 NS 1.57 0.99;2.49 NS
School encourages healthy food choices
0.91 0.54;1.51 NS 1.03 0.63;1.70 NS 0.78 0.47;1.30 NS 1.11 0.75;1.64 NS
Teachers are role model 0.82 0.51;1.33 NS 1.62 1.15;2.28 <0.05 0.95 0.54;1.65 NS 1.39 0.99;1.95 NS Notes :1For each increase of one year of age
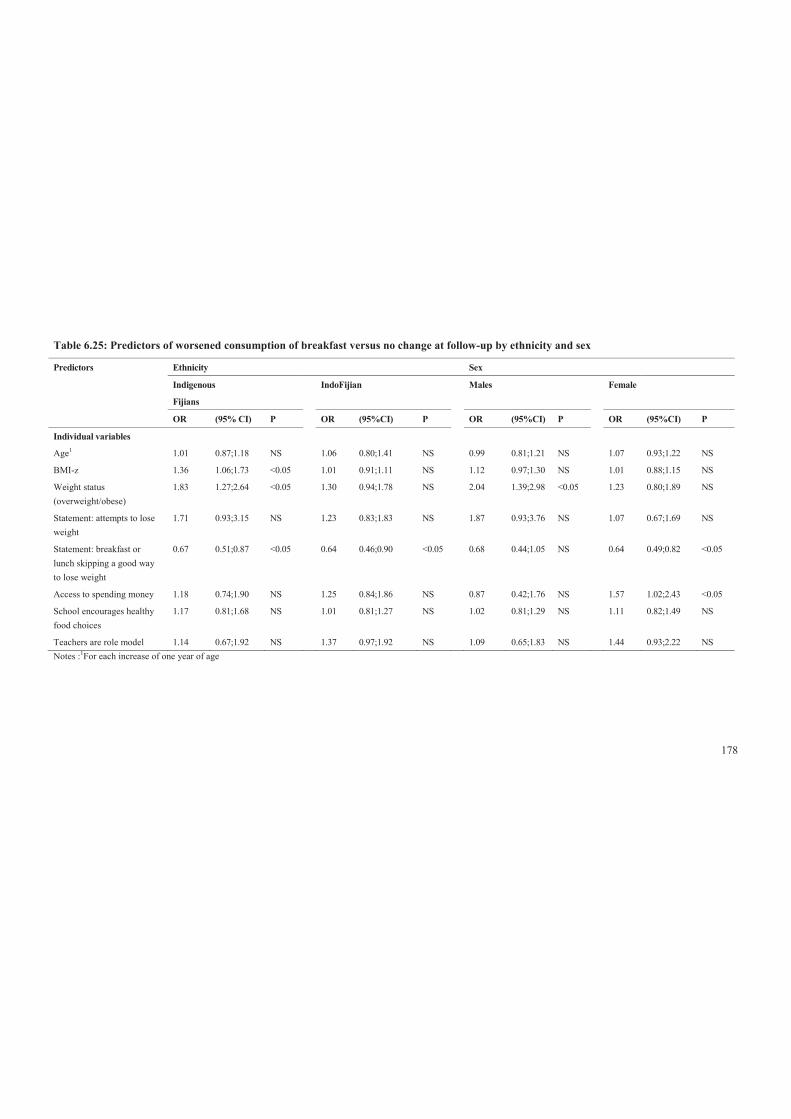
178
Table 6.25: Predictors of worsened consumption of breakfast versus no change at follow-up by ethnicity and sex
Predictors Ethnicity Sex
Indigenous
Fijians
IndoFijian Males Female
OR (95% CI) P OR (95%CI) P OR (95%CI) P OR (95%CI) P
Individual variables
Age1 1.01 0.87;1.18 NS 1.06 0.80;1.41 NS 0.99 0.81;1.21 NS 1.07 0.93;1.22 NS
BMI-z 1.36 1.06;1.73 <0.05 1.01 0.91;1.11 NS 1.12 0.97;1.30 NS 1.01 0.88;1.15 NS
Weight status (overweight/obese)
1.83 1.27;2.64 <0.05 1.30 0.94;1.78 NS 2.04 1.39;2.98 <0.05 1.23 0.80;1.89 NS
Statement: attempts to lose weight
1.71 0.93;3.15 NS 1.23 0.83;1.83 NS 1.87 0.93;3.76 NS 1.07 0.67;1.69 NS
Statement: breakfast or lunch skipping a good way to lose weight
0.67 0.51;0.87 <0.05 0.64 0.46;0.90 <0.05 0.68 0.44;1.05 NS 0.64 0.49;0.82 <0.05
Access to spending money 1.18 0.74;1.90 NS 1.25 0.84;1.86 NS 0.87 0.42;1.76 NS 1.57 1.02;2.43 <0.05
School encourages healthy food choices
1.17 0.81;1.68 NS 1.01 0.81;1.27 NS 1.02 0.81;1.29 NS 1.11 0.82;1.49 NS
Teachers are role model 1.14 0.67;1.92 NS 1.37 0.97;1.92 NS 1.09 0.65;1.83 NS 1.44 0.93;2.22 NS Notes :1For each increase of one year of age
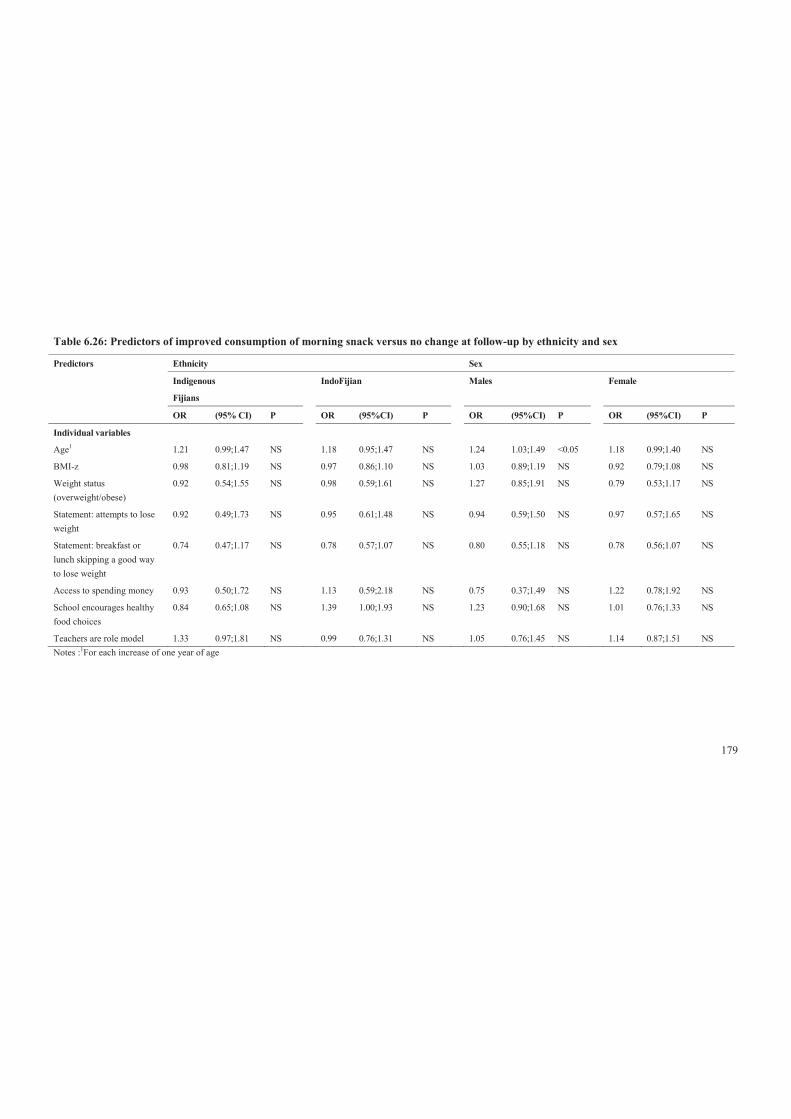
179
Table 6.26: Predictors of improved consumption of morning snack versus no change at follow-up by ethnicity and sex
Predictors Ethnicity Sex
Indigenous
Fijians
IndoFijian Males Female
OR (95% CI) P OR (95%CI) P OR (95%CI) P OR (95%CI) P
Individual variables
Age1 1.21 0.99;1.47 NS 1.18 0.95;1.47 NS 1.24 1.03;1.49 <0.05 1.18 0.99;1.40 NS
BMI-z 0.98 0.81;1.19 NS 0.97 0.86;1.10 NS 1.03 0.89;1.19 NS 0.92 0.79;1.08 NS
Weight status (overweight/obese)
0.92 0.54;1.55 NS 0.98 0.59;1.61 NS 1.27 0.85;1.91 NS 0.79 0.53;1.17 NS
Statement: attempts to lose weight
0.92 0.49;1.73 NS 0.95 0.61;1.48 NS 0.94 0.59;1.50 NS 0.97 0.57;1.65 NS
Statement: breakfast or lunch skipping a good way to lose weight
0.74 0.47;1.17 NS 0.78 0.57;1.07 NS 0.80 0.55;1.18 NS 0.78 0.56;1.07 NS
Access to spending money 0.93 0.50;1.72 NS 1.13 0.59;2.18 NS 0.75 0.37;1.49 NS 1.22 0.78;1.92 NS
School encourages healthy food choices
0.84 0.65;1.08 NS 1.39 1.00;1.93 NS 1.23 0.90;1.68 NS 1.01 0.76;1.33 NS
Teachers are role model 1.33 0.97;1.81 NS 0.99 0.76;1.31 NS 1.05 0.76;1.45 NS 1.14 0.87;1.51 NS Notes :1For each increase of one year of age
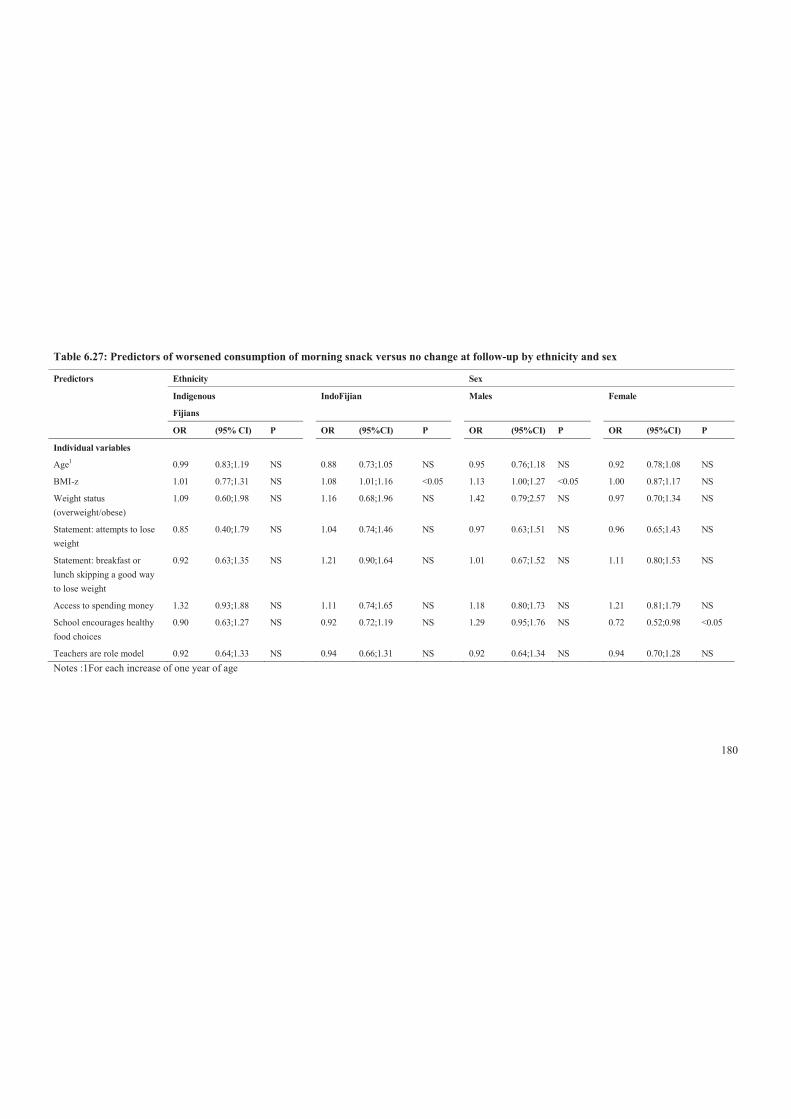
180
Table 6.27: Predictors of worsened consumption of morning snack versus no change at follow-up by ethnicity and sex
Predictors Ethnicity Sex
Indigenous
Fijians
IndoFijian Males Female
OR (95% CI) P OR (95%CI) P OR (95%CI) P OR (95%CI) P
Individual variables
Age1 0.99 0.83;1.19 NS 0.88 0.73;1.05 NS 0.95 0.76;1.18 NS 0.92 0.78;1.08 NS
BMI-z 1.01 0.77;1.31 NS 1.08 1.01;1.16 <0.05 1.13 1.00;1.27 <0.05 1.00 0.87;1.17 NS
Weight status (overweight/obese)
1.09 0.60;1.98 NS 1.16 0.68;1.96 NS 1.42 0.79;2.57 NS 0.97 0.70;1.34 NS
Statement: attempts to lose weight
0.85 0.40;1.79 NS 1.04 0.74;1.46 NS 0.97 0.63;1.51 NS 0.96 0.65;1.43 NS
Statement: breakfast or lunch skipping a good way to lose weight
0.92 0.63;1.35 NS 1.21 0.90;1.64 NS 1.01 0.67;1.52 NS 1.11 0.80;1.53 NS
Access to spending money 1.32 0.93;1.88 NS 1.11 0.74;1.65 NS 1.18 0.80;1.73 NS 1.21 0.81;1.79 NS
School encourages healthy food choices
0.90 0.63;1.27 NS 0.92 0.72;1.19 NS 1.29 0.95;1.76 NS 0.72 0.52;0.98 <0.05
Teachers are role model 0.92 0.64;1.33 NS 0.94 0.66;1.31 NS 0.92 0.64;1.34 NS 0.94 0.70;1.28 NS Notes :1For each increase of one year of age

181
Table 6.28: Predictors of improved consumption of lunch versus no change at follow-up by ethnicity and sex
Predictors Ethnicity Sex
Indigenous
Fijians
IndoFijian Males Female
OR (95% CI) P OR (95%CI) P OR (95%CI) P OR (95%CI) P
Individual variables
Age1 1.04 0.92;1.19 NS 1.23 1.00;1.50 NS 1.24 1.04;1.47 <0.05 1.09 0.94;1.28 NS
BMI-z 1.23 0.84;1.51 NS 1.05 0.93;1.18 NS 1.01 0.92;1.11 NS 1.11 0.96;1.28 NS
Weight status 1.13 0.62;2.07 NS 1.53 0.99;2.37 NS 1.19 0.81;1.74 NS 1.43 1.02;1.99 <0.05
Statement: attempts to lose weight
1.62 1.04;2.52 <0.05 1.69 1.33;2.17 <0.05 1.57 1.01;2.41 <0.05 1.75 1.12;2.73 <0.05
Statement: breakfast or lunch skipping a good way to lose weight
0.66 0.44;1.00 NS 0.64 0.44;0.92 <0.05 0.62 0.34;1.11 NS 0.67 0.49;0.91 <0.05
Statement: sugar content (Fruit drinks/cordial < Coke/Sprite)
1.18 0.87;1.59 NS 1.08 0.68;1.69 NS 0.90 0.61;1.30 NS 1.25 0.82;1.89 NS
Statement: Fruit and vegetables bad for weight
0.74 0.28;1.97 NS 0.84 0.55;1.30 NS 0.76 0.39;1.49 NS 0.75 0.36;1.55 NS
Access to spending money 1.20 0.79;1.85 NS 1.51 1.03;2.21 <0.05 1.27 0.80;2.02 NS 1.40 0.93;2.13 NS
School encourages healthy food choices
0.97 0.59;1.58 NS 1.36 0.95;1.95 NS 1.11 0.73;1.69 NS 1.20 0.87;1.65 NS
Teachers are role model 1.03 0.63;1.69 NS 1.21 0.87;1.67 NS 1.61 0.76;1.77 NS 1.12 0.79;1.58 NS Notes :1For each increase of one year of age
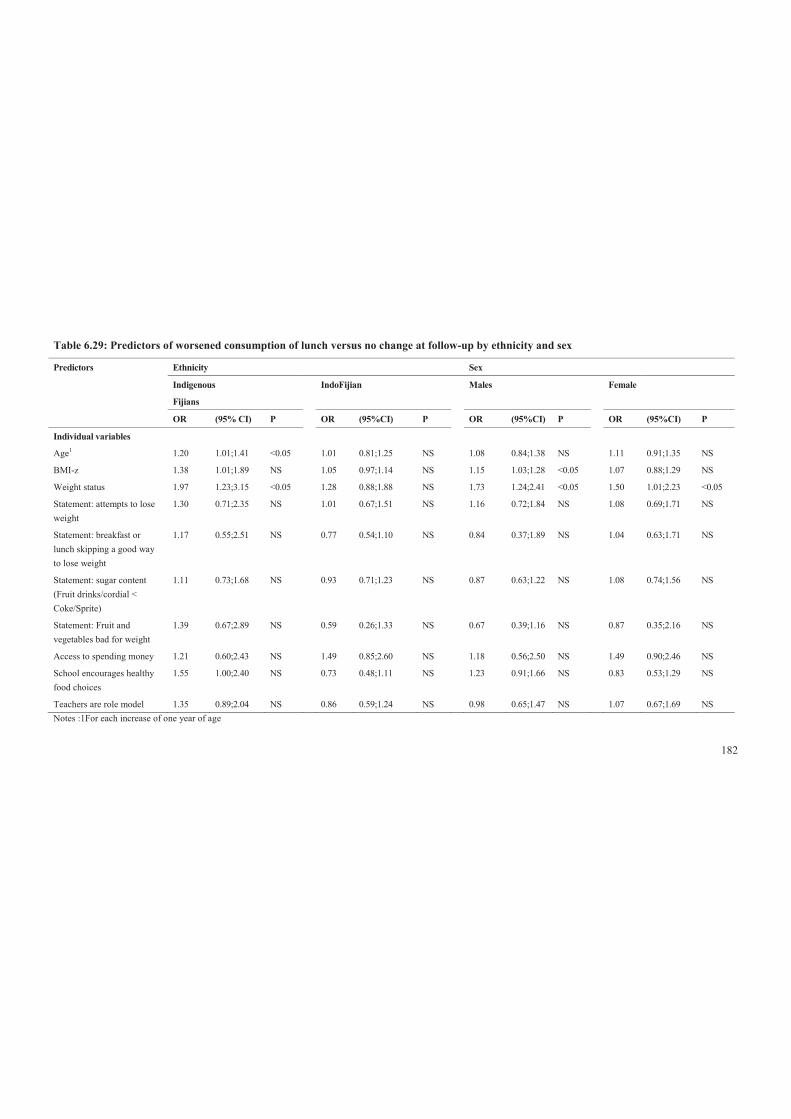
182
Table 6.29: Predictors of worsened consumption of lunch versus no change at follow-up by ethnicity and sex
Predictors Ethnicity Sex
Indigenous
Fijians
IndoFijian Males Female
OR (95% CI) P OR (95%CI) P OR (95%CI) P OR (95%CI) P
Individual variables
Age1 1.20 1.01;1.41 <0.05 1.01 0.81;1.25 NS 1.08 0.84;1.38 NS 1.11 0.91;1.35 NS
BMI-z 1.38 1.01;1.89 NS 1.05 0.97;1.14 NS 1.15 1.03;1.28 <0.05 1.07 0.88;1.29 NS
Weight status 1.97 1.23;3.15 <0.05 1.28 0.88;1.88 NS 1.73 1.24;2.41 <0.05 1.50 1.01;2.23 <0.05
Statement: attempts to lose weight
1.30 0.71;2.35 NS 1.01 0.67;1.51 NS 1.16 0.72;1.84 NS 1.08 0.69;1.71 NS
Statement: breakfast or lunch skipping a good way to lose weight
1.17 0.55;2.51 NS 0.77 0.54;1.10 NS 0.84 0.37;1.89 NS 1.04 0.63;1.71 NS
Statement: sugar content (Fruit drinks/cordial < Coke/Sprite)
1.11 0.73;1.68 NS 0.93 0.71;1.23 NS 0.87 0.63;1.22 NS 1.08 0.74;1.56 NS
Statement: Fruit and vegetables bad for weight
1.39 0.67;2.89 NS 0.59 0.26;1.33 NS 0.67 0.39;1.16 NS 0.87 0.35;2.16 NS
Access to spending money 1.21 0.60;2.43 NS 1.49 0.85;2.60 NS 1.18 0.56;2.50 NS 1.49 0.90;2.46 NS
School encourages healthy food choices
1.55 1.00;2.40 NS 0.73 0.48;1.11 NS 1.23 0.91;1.66 NS 0.83 0.53;1.29 NS
Teachers are role model 1.35 0.89;2.04 NS 0.86 0.59;1.24 NS 0.98 0.65;1.47 NS 1.07 0.67;1.69 NS Notes :1For each increase of one year of age

183
Table 6.30: Predictors of improved lunch source ‘from home’ versus no change at follow-up by ethnicity and sex
Predictors Ethnicity Sex
Indigenous
Fijians
IndoFijian Males Female
OR (95% CI) P OR (95%CI) P OR (95%CI) P OR (95%CI) P
Individual variables
Age1 0.85 0.61;1.17 NS 1.16 0.87;1.57 NS 0.87 0.62;1.22 NS 1.01 0.78;1.31 NS
BMI-z 0.93 0.67;1.31 NS 1.24 1.02;1.51 <0.05 1.13 0.89;1.43 NS 1.14 0.94;1.38 NS
Weight status (overweight/obese)
1.14 0.73;1.78 NS 1.46 0.75;2.86 NS 1.52 0.78;2.99 NS 1.08 0.68;1.70 NS
Statement: attempts to lose weight
0.75 0.49;1.15 NS 1.97 1.11;3.48 <0.05 1.12 0.59;2.13 NS 1.18 0.61;2.30 NS
Statement: breakfast or lunch skipping a good way to lose weight
0.77 0.50;1.19 NS 0.80 0.35;1.79 NS 1.12 0.48;2.63 NS 0.65 0.41;1.01 NS
Access to spending money 1.01 0.45;2.28 NS 2.47 1.23;4.91 <0.05 2.12 1.04;4.27 <0.05 1.24 0.69;2.23 NS
School encourages healthy food choices
0.91 0.67;1.23 NS 1.27 0.77;2.09 NS 0.76 0.46;1.26 NS 1.28 0.75;2.21 NS
Teachers are role model 0.74 0.49;1.11 NS 1.46 0.94;2.24 NS 1.63 0.93;2.85 NS 0.77 0.44;1.36 NS Notes :1For each increase of one year of age
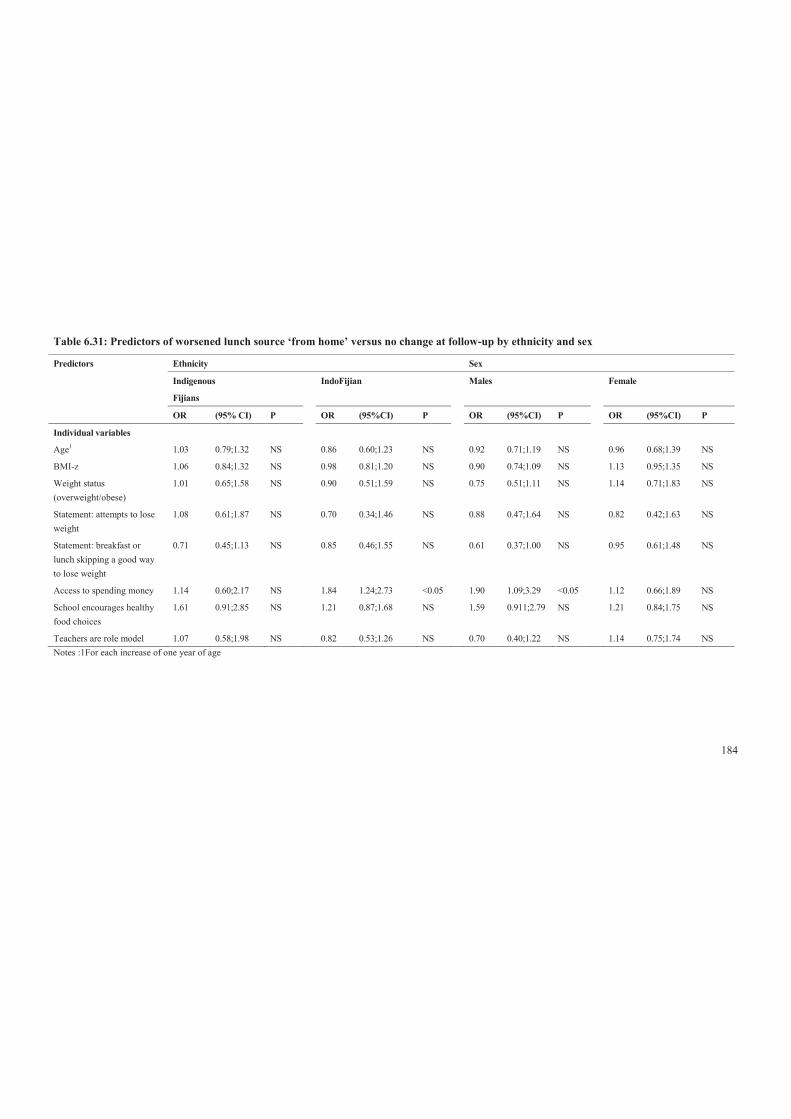
184
Table 6.31: Predictors of worsened lunch source ‘from home’ versus no change at follow-up by ethnicity and sex
Predictors Ethnicity Sex
Indigenous
Fijians
IndoFijian Males Female
OR (95% CI) P OR (95%CI) P OR (95%CI) P OR (95%CI) P
Individual variables
Age1 1.03 0.79;1.32 NS 0.86 0.60;1.23 NS 0.92 0.71;1.19 NS 0.96 0.68;1.39 NS
BMI-z 1.06 0.84;1.32 NS 0.98 0.81;1.20 NS 0.90 0.74;1.09 NS 1.13 0.95;1.35 NS
Weight status (overweight/obese)
1.01 0.65;1.58 NS 0.90 0.51;1.59 NS 0.75 0.51;1.11 NS 1.14 0.71;1.83 NS
Statement: attempts to lose weight
1.08 0.61;1.87 NS 0.70 0.34;1.46 NS 0.88 0.47;1.64 NS 0.82 0.42;1.63 NS
Statement: breakfast or lunch skipping a good way to lose weight
0.71 0.45;1.13 NS 0.85 0.46;1.55 NS 0.61 0.37;1.00 NS 0.95 0.61;1.48 NS
Access to spending money 1.14 0.60;2.17 NS 1.84 1.24;2.73 <0.05 1.90 1.09;3.29 <0.05 1.12 0.66;1.89 NS
School encourages healthy food choices
1.61 0.91;2.85 NS 1.21 0.87;1.68 NS 1.59 0.911;2.79 NS 1.21 0.84;1.75 NS
Teachers are role model 1.07 0.58;1.98 NS 0.82 0.53;1.26 NS 0.70 0.40;1.22 NS 1.14 0.75;1.74 NS Notes :1For each increase of one year of age

185
Table 6.32: Predictors of improved fruit/vegetables consumption versus no change at follow-up by ethnicity and sex
Predictors Ethnicity Sex
Indigenous
Fijians
IndoFijian Males Female
OR (95% CI) P OR (95%CI) P OR (95%CI) P OR (95%CI) P
Individual variables
Age1 0.95 0.81;1.12 NS 1.11 0.91;1.35 NS 1.07 0.86;1.32 NS 1.00 0.80;.26 NS
BMI-z 0.89 0.64;1.23 NS 1.03 0.93;1.14 NS 1.10 0.97;1.26 NS 0.89 0.81;0.99 <0.05
Weight status (overweight/obese)
0.69 0.35;1.36 NS 1.20 0.72;2.02 NS 1.31 0.81;2.12 NS 0.70 0.40;1.23 NS
Statement: attempts to lose weight
1.00 0.74;1.37 NS 0.90 0.59;1.38 NS 1.15 0.78;1.70 NS 0.77 0.52;1.11 NS
Statement: fruit and vegetables bad for weight
1.03 0.54;1.98 NS 1.11 0.53;1.31 NS 0.73 0.49;1.09 NS 1.59 0.64;3.92 NS
Access to spending money 1.512 0.73;3.12 NS 1.14 0.66;1.98 NS 1.40 0.71;2.76 NS 1.23 0.72;2.12 NS
School encourages healthy food choices
0.76 0.53;1.09 NS 0.89 0.71;1.12 NS 0.89 0.67;1.17 NS 0.80 0.58;1.11 NS
Teachers are role model 0.87 0.63;1.19 NS 0.82 0.60;1.10 NS 0.78 0.51;1.19 NS 0.88 0.63;1.21 NS Notes :1For each increase of one year of age
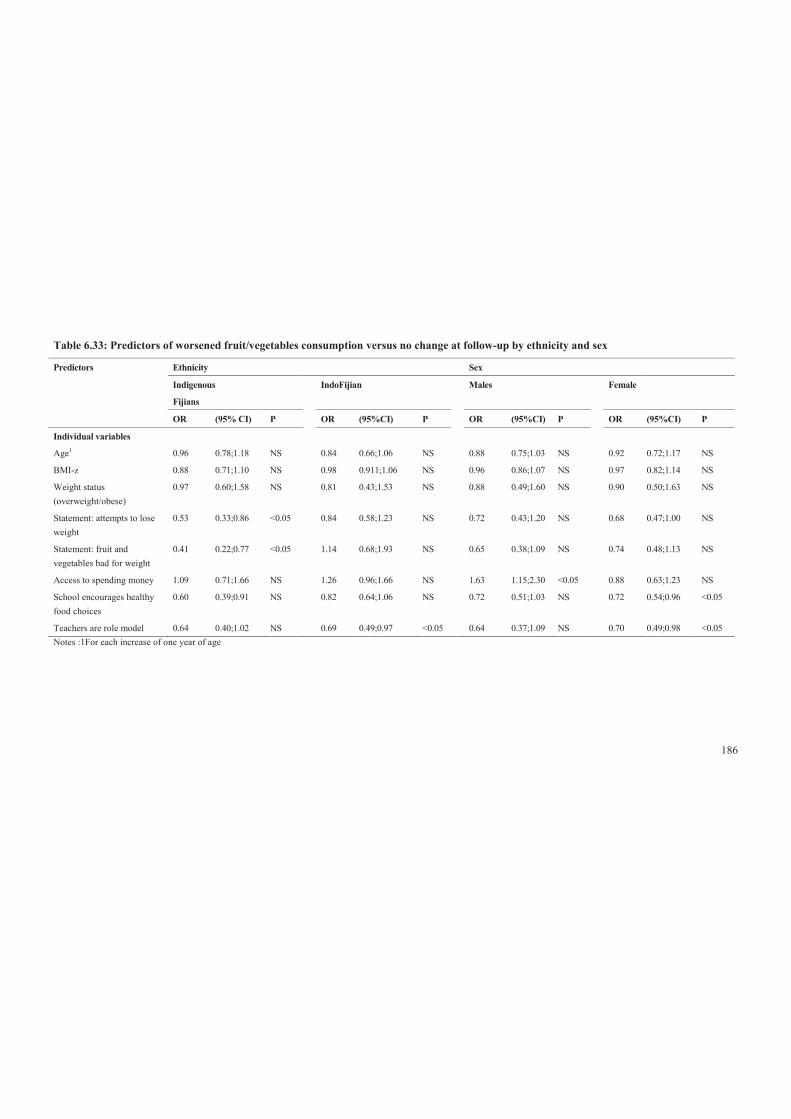
186
Table 6.33: Predictors of worsened fruit/vegetables consumption versus no change at follow-up by ethnicity and sex
Predictors Ethnicity Sex
Indigenous
Fijians
IndoFijian Males Female
OR (95% CI) P OR (95%CI) P OR (95%CI) P OR (95%CI) P
Individual variables
Age1 0.96 0.78;1.18 NS 0.84 0.66;1.06 NS 0.88 0.75;1.03 NS 0.92 0.72;1.17 NS
BMI-z 0.88 0.71;1.10 NS 0.98 0.911;1.06 NS 0.96 0.86;1.07 NS 0.97 0.82;1.14 NS
Weight status (overweight/obese)
0.97 0.60;1.58 NS 0.81 0.43;1.53 NS 0.88 0.49;1.60 NS 0.90 0.50;1.63 NS
Statement: attempts to lose weight
0.53 0.33;0.86 <0.05 0.84 0.58;1.23 NS 0.72 0.43;1.20 NS 0.68 0.47;1.00 NS
Statement: fruit and vegetables bad for weight
0.41 0.22;0.77 <0.05 1.14 0.68;1.93 NS 0.65 0.38;1.09 NS 0.74 0.48;1.13 NS
Access to spending money 1.09 0.71;1.66 NS 1.26 0.96;1.66 NS 1.63 1.15;2.30 <0.05 0.88 0.63;1.23 NS
School encourages healthy food choices
0.60 0.39;0.91 NS 0.82 0.64;1.06 NS 0.72 0.51;1.03 NS 0.72 0.54;0.96 <0.05
Teachers are role model 0.64 0.40;1.02 NS 0.69 0.49;0.97 <0.05 0.64 0.37;1.09 NS 0.70 0.49;0.98 <0.05 Notes :1For each increase of one year of age
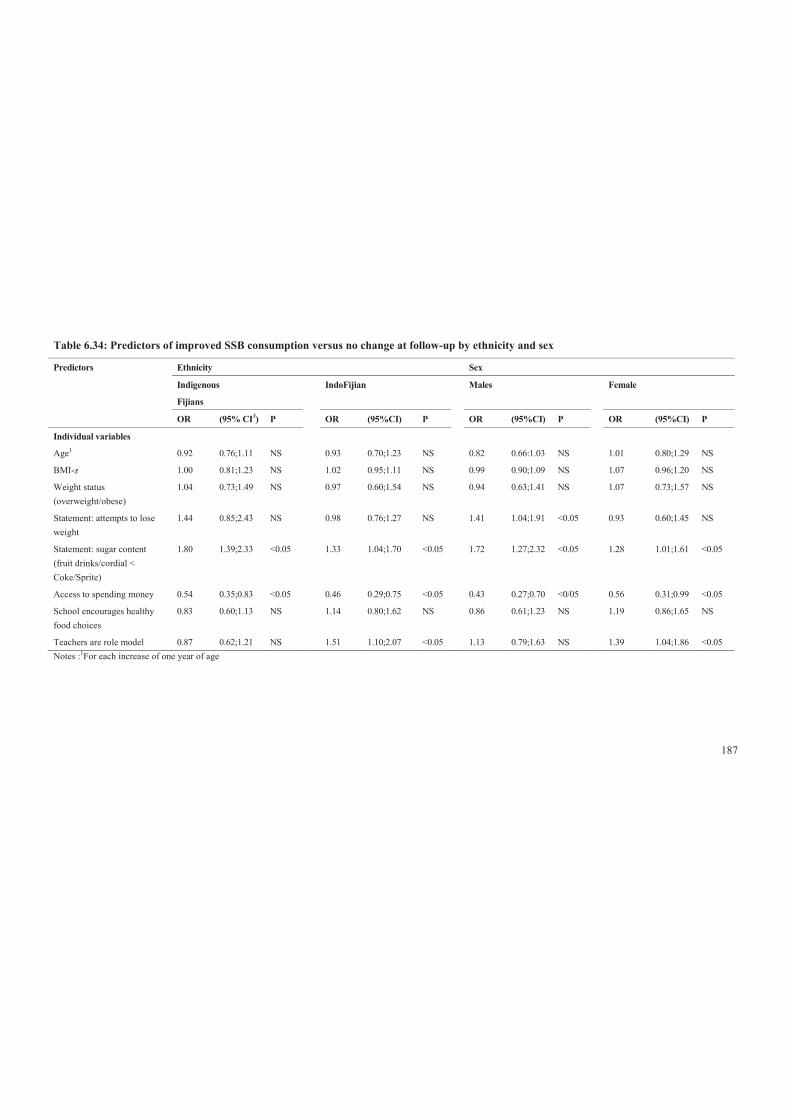
187
Table 6.34: Predictors of improved SSB consumption versus no change at follow-up by ethnicity and sex
Predictors Ethnicity Sex
Indigenous
Fijians
IndoFijian Males Female
OR (95% CI3) P OR (95%CI) P OR (95%CI) P OR (95%CI) P
Individual variables
Age1 0.92 0.76;1.11 NS 0.93 0.70;1.23 NS 0.82 0.66:1.03 NS 1.01 0.80;1.29 NS
BMI-z 1.00 0.81;1.23 NS 1.02 0.95;1.11 NS 0.99 0.90;1.09 NS 1.07 0.96;1.20 NS
Weight status (overweight/obese)
1.04 0.73;1.49 NS 0.97 0.60;1.54 NS 0.94 0.63;1.41 NS 1.07 0.73;1.57 NS
Statement: attempts to lose weight
1.44 0.85;2.43 NS 0.98 0.76;1.27 NS 1.41 1.04;1.91 <0.05 0.93 0.60;1.45 NS
Statement: sugar content (fruit drinks/cordial < Coke/Sprite)
1.80 1.39;2.33 <0.05 1.33 1.04;1.70 <0.05 1.72 1.27;2.32 <0.05 1.28 1.01;1.61 <0.05
Access to spending money 0.54 0.35;0.83 <0.05 0.46 0.29;0.75 <0.05 0.43 0.27;0.70 <0/05 0.56 0.31;0.99 <0.05
School encourages healthy food choices
0.83 0.60;1.13 NS 1.14 0.80;1.62 NS 0.86 0.61;1.23 NS 1.19 0.86;1.65 NS
Teachers are role model 0.87 0.62;1.21 NS 1.51 1.10;2.07 <0.05 1.13 0.79;1.63 NS 1.39 1.04;1.86 <0.05 Notes :1For each increase of one year of age
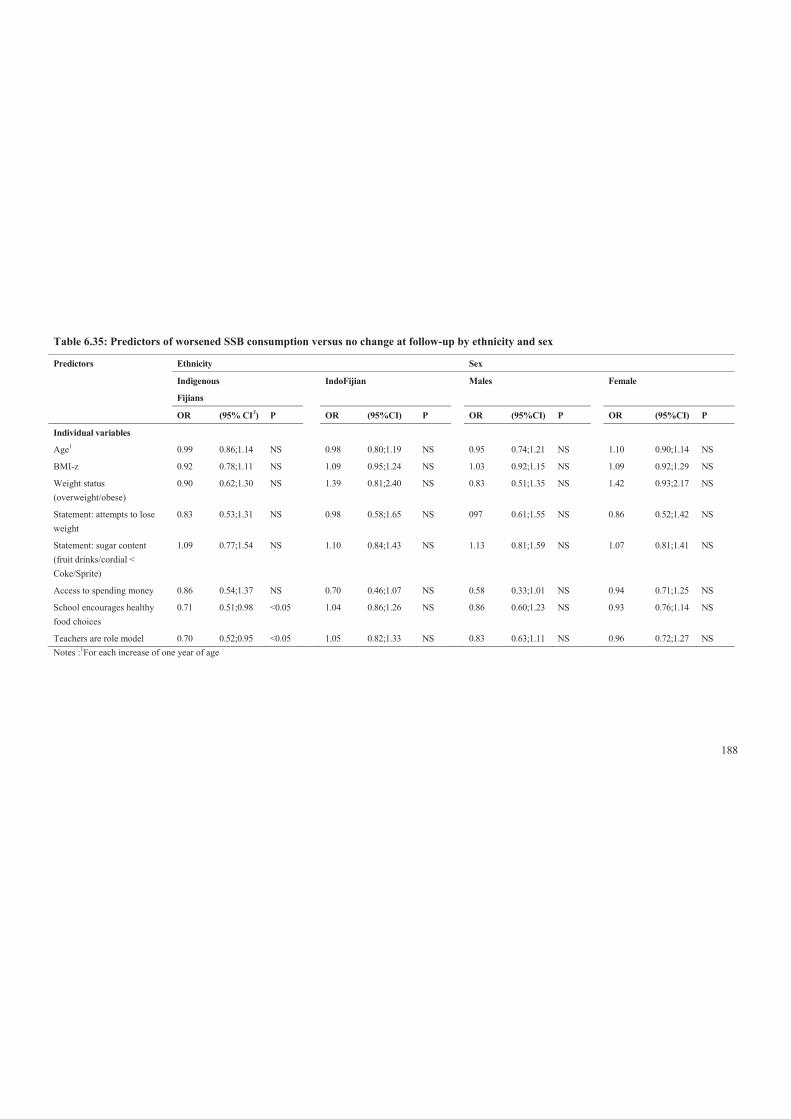
188
Table 6.35: Predictors of worsened SSB consumption versus no change at follow-up by ethnicity and sex
Predictors Ethnicity Sex
Indigenous
Fijians
IndoFijian Males Female
OR (95% CI3) P OR (95%CI) P OR (95%CI) P OR (95%CI) P
Individual variables
Age1 0.99 0.86;1.14 NS 0.98 0.80;1.19 NS 0.95 0.74;1.21 NS 1.10 0.90;1.14 NS
BMI-z 0.92 0.78;1.11 NS 1.09 0.95;1.24 NS 1.03 0.92;1.15 NS 1.09 0.92;1.29 NS
Weight status (overweight/obese)
0.90 0.62;1.30 NS 1.39 0.81;2.40 NS 0.83 0.51;1.35 NS 1.42 0.93;2.17 NS
Statement: attempts to lose weight
0.83 0.53;1.31 NS 0.98 0.58;1.65 NS 097 0.61;1.55 NS 0.86 0.52;1.42 NS
Statement: sugar content (fruit drinks/cordial < Coke/Sprite)
1.09 0.77;1.54 NS 1.10 0.84;1.43 NS 1.13 0.81;1.59 NS 1.07 0.81;1.41 NS
Access to spending money 0.86 0.54;1.37 NS 0.70 0.46;1.07 NS 0.58 0.33;1.01 NS 0.94 0.71;1.25 NS
School encourages healthy food choices
0.71 0.51;0.98 <0.05 1.04 0.86;1.26 NS 0.86 0.60;1.23 NS 0.93 0.76;1.14 NS
Teachers are role model 0.70 0.52;0.95 <0.05 1.05 0.82;1.33 NS 0.83 0.63;1.11 NS 0.96 0.72;1.27 NS Notes :1For each increase of one year of age
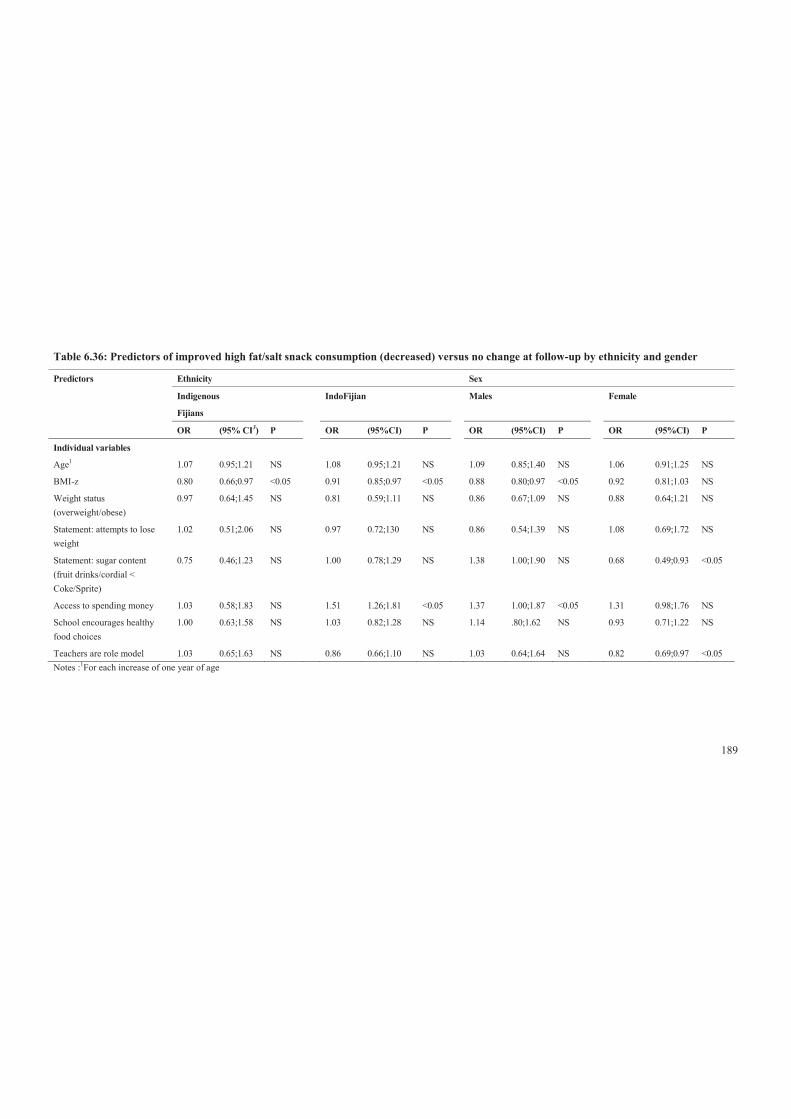
189
Table 6.36: Predictors of improved high fat/salt snack consumption (decreased) versus no change at follow-up by ethnicity and gender
Predictors Ethnicity Sex
Indigenous
Fijians
IndoFijian Males Female
OR (95% CI3) P OR (95%CI) P OR (95%CI) P OR (95%CI) P
Individual variables
Age1 1.07 0.95;1.21 NS 1.08 0.95;1.21 NS 1.09 0.85;1.40 NS 1.06 0.91;1.25 NS
BMI-z 0.80 0.66;0.97 <0.05 0.91 0.85;0.97 <0.05 0.88 0.80;0.97 <0.05 0.92 0.81;1.03 NS
Weight status (overweight/obese)
0.97 0.64;1.45 NS 0.81 0.59;1.11 NS 0.86 0.67;1.09 NS 0.88 0.64;1.21 NS
Statement: attempts to lose weight
1.02 0.51;2.06 NS 0.97 0.72;130 NS 0.86 0.54;1.39 NS 1.08 0.69;1.72 NS
Statement: sugar content (fruit drinks/cordial < Coke/Sprite)
0.75 0.46;1.23 NS 1.00 0.78;1.29 NS 1.38 1.00;1.90 NS 0.68 0.49;0.93 <0.05
Access to spending money 1.03 0.58;1.83 NS 1.51 1.26;1.81 <0.05 1.37 1.00;1.87 <0.05 1.31 0.98;1.76 NS
School encourages healthy food choices
1.00 0.63;1.58 NS 1.03 0.82;1.28 NS 1.14 .80;1.62 NS 0.93 0.71;1.22 NS
Teachers are role model 1.03 0.65;1.63 NS 0.86 0.66;1.10 NS 1.03 0.64;1.64 NS 0.82 0.69;0.97 <0.05 Notes :1For each increase of one year of age
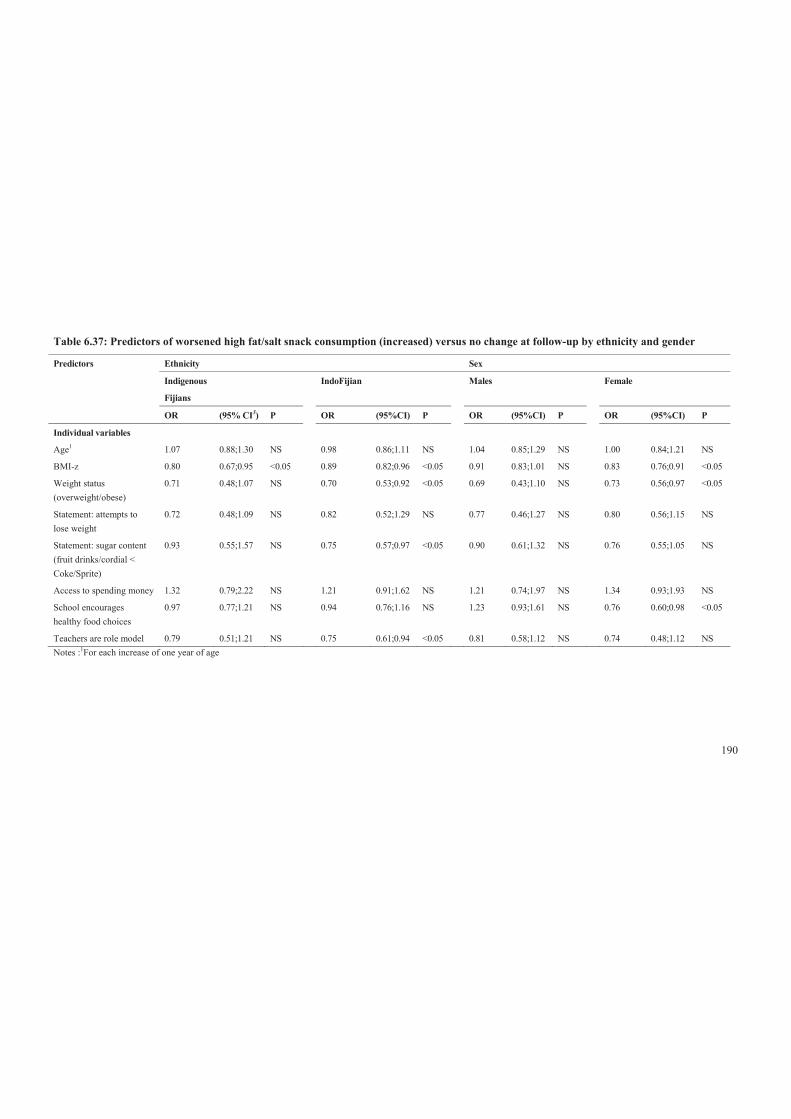
190
Table 6.37: Predictors of worsened high fat/salt snack consumption (increased) versus no change at follow-up by ethnicity and gender
Predictors Ethnicity Sex
Indigenous
Fijians
IndoFijian Males Female
OR (95% CI3) P OR (95%CI) P OR (95%CI) P OR (95%CI) P
Individual variables
Age1 1.07 0.88;1.30 NS 0.98 0.86;1.11 NS 1.04 0.85;1.29 NS 1.00 0.84;1.21 NS
BMI-z 0.80 0.67;0.95 <0.05 0.89 0.82;0.96 <0.05 0.91 0.83;1.01 NS 0.83 0.76;0.91 <0.05
Weight status (overweight/obese)
0.71 0.48;1.07 NS 0.70 0.53;0.92 <0.05 0.69 0.43;1.10 NS 0.73 0.56;0.97 <0.05
Statement: attempts to lose weight
0.72 0.48;1.09 NS 0.82 0.52;1.29 NS 0.77 0.46;1.27 NS 0.80 0.56;1.15 NS
Statement: sugar content (fruit drinks/cordial < Coke/Sprite)
0.93 0.55;1.57 NS 0.75 0.57;0.97 <0.05 0.90 0.61;1.32 NS 0.76 0.55;1.05 NS
Access to spending money 1.32 0.79;2.22 NS 1.21 0.91;1.62 NS 1.21 0.74;1.97 NS 1.34 0.93;1.93 NS
School encourages healthy food choices
0.97 0.77;1.21 NS 0.94 0.76;1.16 NS 1.23 0.93;1.61 NS 0.76 0.60;0.98 <0.05
Teachers are role model 0.79 0.51;1.21 NS 0.75 0.61;0.94 <0.05 0.81 0.58;1.12 NS 0.74 0.48;1.12 NS Notes :1For each increase of one year of age
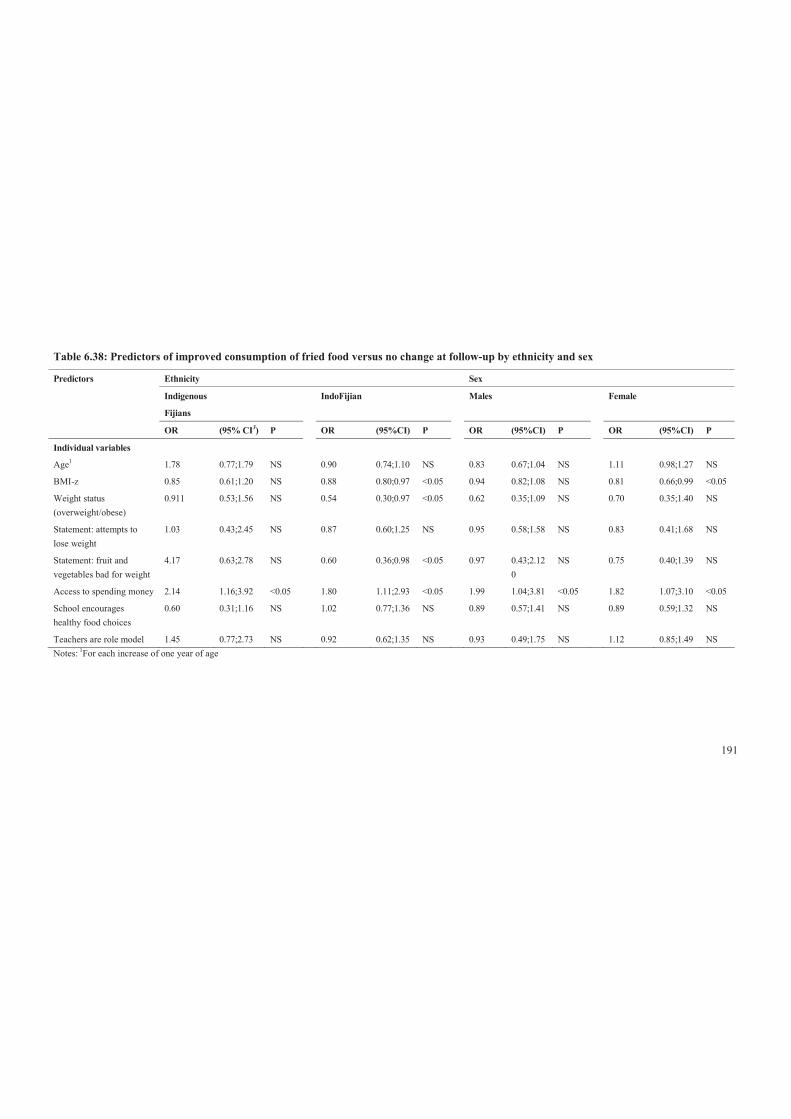
191
Table 6.38: Predictors of improved consumption of fried food versus no change at follow-up by ethnicity and sex
Predictors Ethnicity Sex
Indigenous
Fijians
IndoFijian Males Female
OR (95% CI3) P OR (95%CI) P OR (95%CI) P OR (95%CI) P
Individual variables
Age1 1.78 0.77;1.79 NS 0.90 0.74;1.10 NS 0.83 0.67;1.04 NS 1.11 0.98;1.27 NS
BMI-z 0.85 0.61;1.20 NS 0.88 0.80;0.97 <0.05 0.94 0.82;1.08 NS 0.81 0.66;0.99 <0.05
Weight status (overweight/obese)
0.911 0.53;1.56 NS 0.54 0.30;0.97 <0.05 0.62 0.35;1.09 NS 0.70 0.35;1.40 NS
Statement: attempts to lose weight
1.03 0.43;2.45 NS 0.87 0.60;1.25 NS 0.95 0.58;1.58 NS 0.83 0.41;1.68 NS
Statement: fruit and vegetables bad for weight
4.17 0.63;2.78 NS 0.60 0.36;0.98 <0.05 0.97 0.43;2.120
NS 0.75 0.40;1.39 NS
Access to spending money 2.14 1.16;3.92 <0.05 1.80 1.11;2.93 <0.05 1.99 1.04;3.81 <0.05 1.82 1.07;3.10 <0.05
School encourages healthy food choices
0.60 0.31;1.16 NS 1.02 0.77;1.36 NS 0.89 0.57;1.41 NS 0.89 0.59;1.32 NS
Teachers are role model 1.45 0.77;2.73 NS 0.92 0.62;1.35 NS 0.93 0.49;1.75 NS 1.12 0.85;1.49 NS Notes:
1For each increase of one year of age
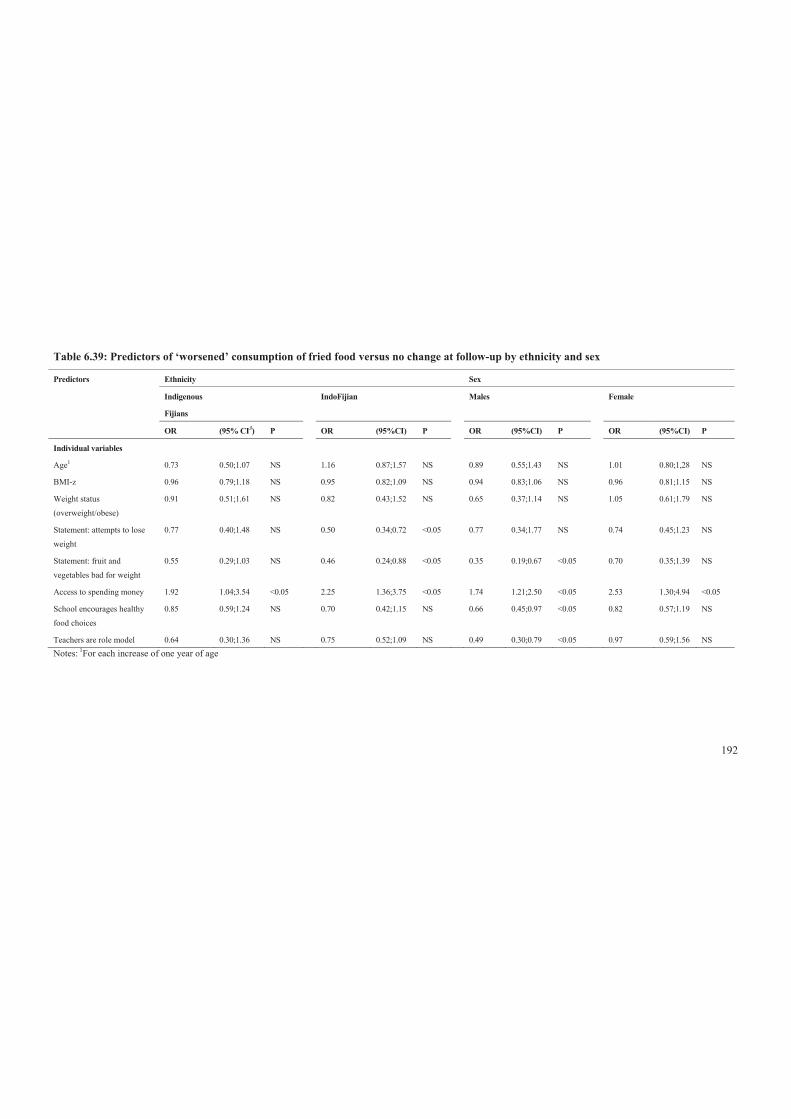
192
Table 6.39: Predictors of ‘worsened’ consumption of fried food versus no change at follow-up by ethnicity and sex
Predictors Ethnicity Sex
Indigenous
Fijians
IndoFijian Males Female
OR (95% CI3) P OR (95%CI) P OR (95%CI) P OR (95%CI) P
Individual variables
Age1 0.73 0.50;1.07 NS 1.16 0.87;1.57 NS 0.89 0.55;1.43 NS 1.01 0.80;1,28 NS
BMI-z 0.96 0.79;1.18 NS 0.95 0.82;1.09 NS 0.94 0.83;1.06 NS 0.96 0.81;1.15 NS
Weight status
(overweight/obese)
0.91 0.51;1.61 NS 0.82 0.43;1.52 NS 0.65 0.37;1.14 NS 1.05 0.61;1.79 NS
Statement: attempts to lose
weight
0.77 0.40;1.48 NS 0.50 0.34;0.72 <0.05 0.77 0.34;1.77 NS 0.74 0.45;1.23 NS
Statement: fruit and
vegetables bad for weight
0.55 0.29;1.03 NS 0.46 0.24;0.88 <0.05 0.35 0.19;0.67 <0.05 0.70 0.35;1.39 NS
Access to spending money 1.92 1.04;3.54 <0.05 2.25 1.36;3.75 <0.05 1.74 1.21;2.50 <0.05 2.53 1.30;4.94 <0.05
School encourages healthy
food choices
0.85 0.59;1.24 NS 0.70 0.42;1.15 NS 0.66 0.45;0.97 <0.05 0.82 0.57;1.19 NS
Teachers are role model 0.64 0.30;1.36 NS 0.75 0.52;1.09 NS 0.49 0.30;0.79 <0.05 0.97 0.59;1.56 NS Notes:
1For each increase of one year of age
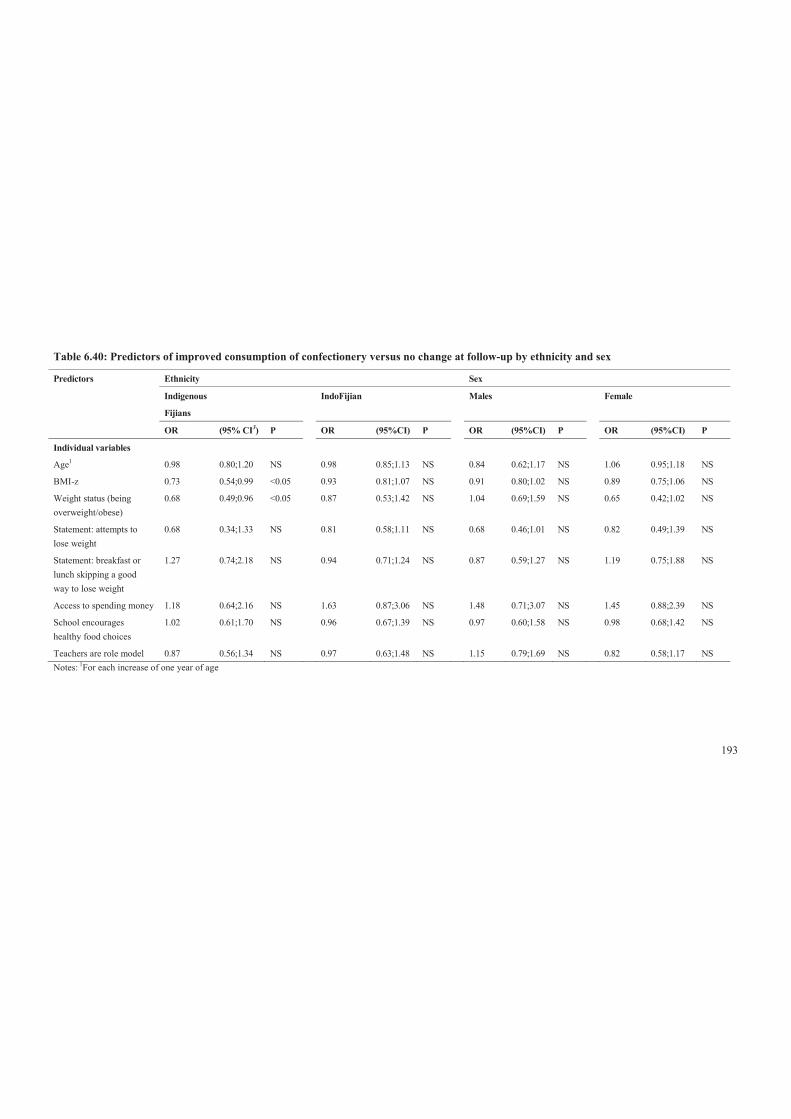
193
Table 6.40: Predictors of improved consumption of confectionery versus no change at follow-up by ethnicity and sex
Predictors Ethnicity Sex
Indigenous
Fijians
IndoFijian Males Female
OR (95% CI3) P OR (95%CI) P OR (95%CI) P OR (95%CI) P
Individual variables
Age1 0.98 0.80;1.20 NS 0.98 0.85;1.13 NS 0.84 0.62;1.17 NS 1.06 0.95;1.18 NS
BMI-z 0.73 0.54;0.99 <0.05 0.93 0.81;1.07 NS 0.91 0.80;1.02 NS 0.89 0.75;1.06 NS
Weight status (being overweight/obese)
0.68 0.49;0.96 <0.05 0.87 0.53;1.42 NS 1.04 0.69;1.59 NS 0.65 0.42;1.02 NS
Statement: attempts to lose weight
0.68 0.34;1.33 NS 0.81 0.58;1.11 NS 0.68 0.46;1.01 NS 0.82 0.49;1.39 NS
Statement: breakfast or lunch skipping a good way to lose weight
1.27 0.74;2.18 NS 0.94 0.71;1.24 NS 0.87 0.59;1.27 NS 1.19 0.75;1.88 NS
Access to spending money 1.18 0.64;2.16 NS 1.63 0.87;3.06 NS 1.48 0.71;3.07 NS 1.45 0.88;2.39 NS
School encourages healthy food choices
1.02 0.61;1.70 NS 0.96 0.67;1.39 NS 0.97 0.60;1.58 NS 0.98 0.68;1.42 NS
Teachers are role model 0.87 0.56;1.34 NS 0.97 0.63;1.48 NS 1.15 0.79;1.69 NS 0.82 0.58;1.17 NS Notes:
1For each increase of one year of age
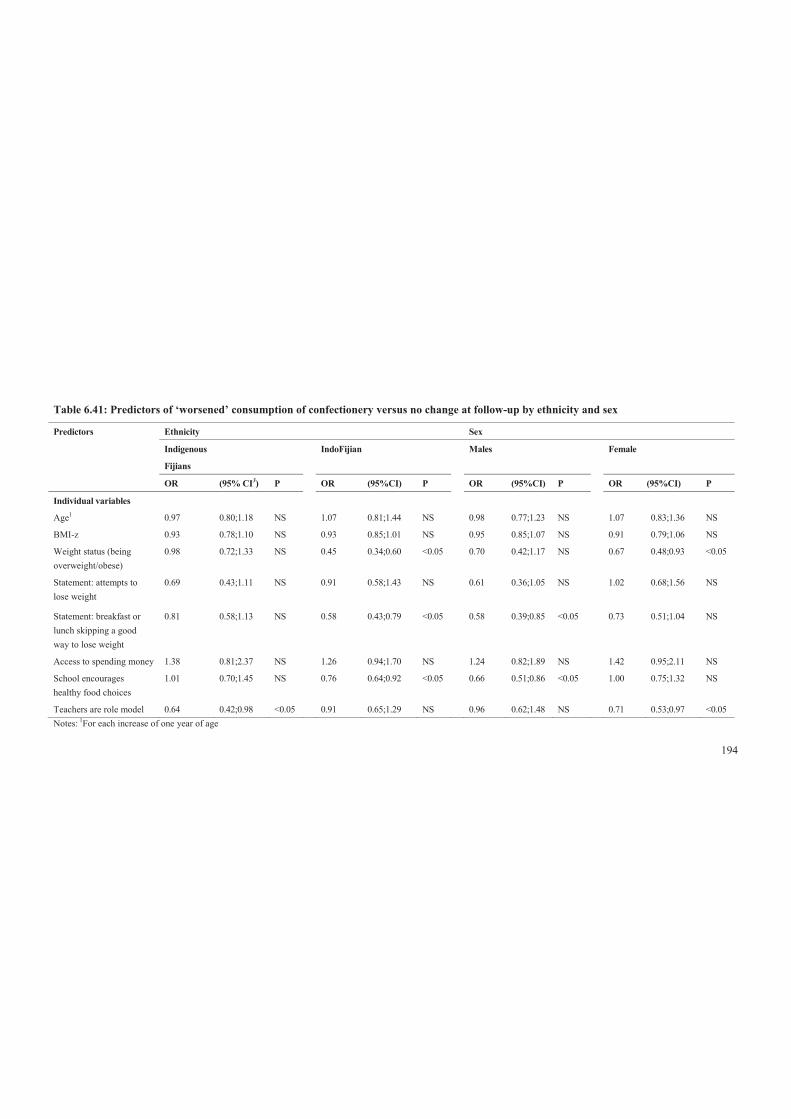
194
Table 6.41: Predictors of ‘worsened’ consumption of confectionery versus no change at follow-up by ethnicity and sex
Predictors Ethnicity Sex
Indigenous
Fijians
IndoFijian Males Female
OR (95% CI3) P OR (95%CI) P OR (95%CI) P OR (95%CI) P
Individual variables
Age1 0.97 0.80;1.18 NS 1.07 0.81;1.44 NS 0.98 0.77;1.23 NS 1.07 0.83;1.36 NS
BMI-z 0.93 0.78;1.10 NS 0.93 0.85;1.01 NS 0.95 0.85;1.07 NS 0.91 0.79;1.06 NS
Weight status (being overweight/obese)
0.98 0.72;1.33 NS 0.45 0.34;0.60 <0.05 0.70 0.42;1.17 NS 0.67 0.48;0.93 <0.05
Statement: attempts to lose weight
0.69 0.43;1.11 NS 0.91 0.58;1.43 NS 0.61 0.36;1.05 NS
1.02 0.68;1.56 NS
Statement: breakfast or lunch skipping a good way to lose weight
0.81 0.58;1.13 NS 0.58 0.43;0.79 <0.05 0.58 0.39;0.85 <0.05 0.73 0.51;1.04 NS
Access to spending money 1.38 0.81;2.37 NS 1.26 0.94;1.70 NS 1.24 0.82;1.89 NS 1.42 0.95;2.11 NS
School encourages healthy food choices
1.01 0.70;1.45 NS 0.76 0.64;0.92 <0.05 0.66 0.51;0.86 <0.05 1.00 0.75;1.32 NS
Teachers are role model 0.64 0.42;0.98 <0.05 0.91 0.65;1.29 NS 0.96 0.62;1.48 NS 0.71 0.53;0.97 <0.05 Notes:
1For each increase of one year of age
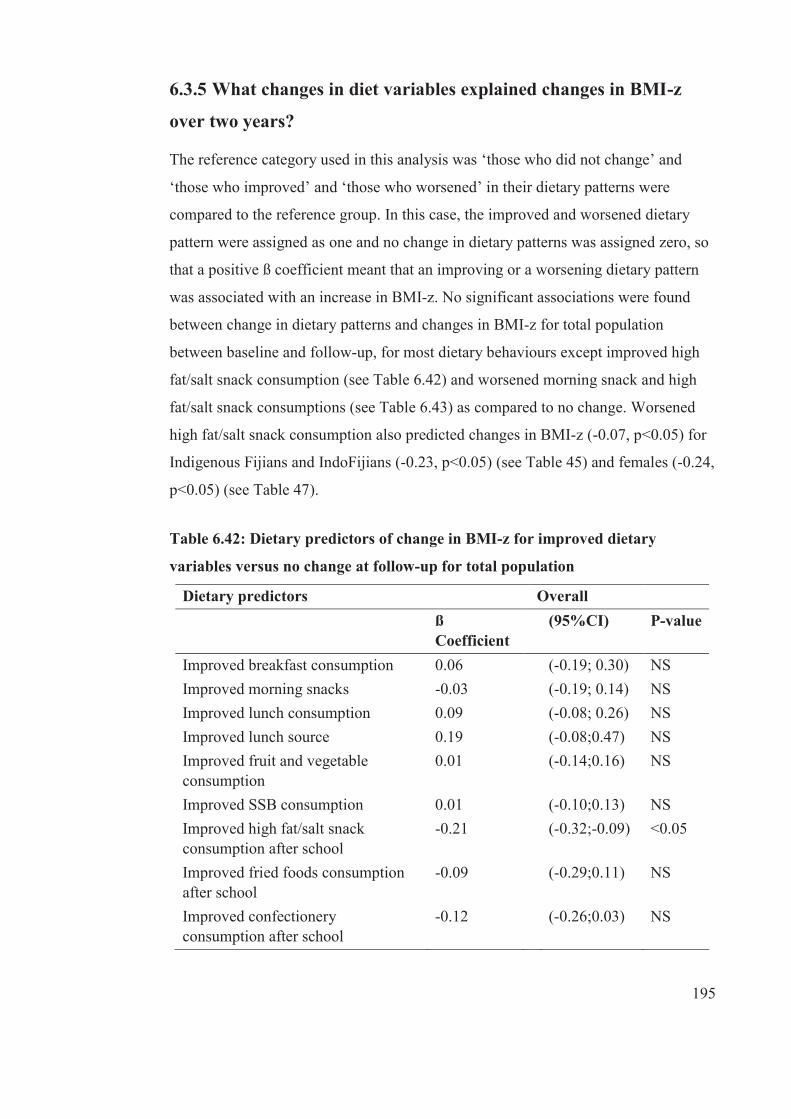
195
6.3.5 What changes in diet variables explained changes in BMI-z
over two years?
The reference category used in this analysis was ‘those who did not change’ and
‘those who improved’ and ‘those who worsened’ in their dietary patterns were
compared to the reference group. In this case, the improved and worsened dietary
pattern were assigned as one and no change in dietary patterns was assigned zero, so
that a positive ß coefficient meant that an improving or a worsening dietary pattern
was associated with an increase in BMI-z. No significant associations were found
between change in dietary patterns and changes in BMI-z for total population
between baseline and follow-up, for most dietary behaviours except improved high
fat/salt snack consumption (see Table 6.42) and worsened morning snack and high
fat/salt snack consumptions (see Table 6.43) as compared to no change. Worsened
high fat/salt snack consumption also predicted changes in BMI-z (-0.07, p<0.05) for
Indigenous Fijians and IndoFijians (-0.23, p<0.05) (see Table 45) and females (-0.24,
p<0.05) (see Table 47).
Table 6.42: Dietary predictors of change in BMI-z for improved dietary
variables versus no change at follow-up for total population
Dietary predictors Overall
ß Coefficient
(95%CI) P-value
Improved breakfast consumption 0.06 (-0.19; 0.30) NS Improved morning snacks -0.03 (-0.19; 0.14) NS Improved lunch consumption 0.09 (-0.08; 0.26) NS Improved lunch source 0.19 (-0.08;0.47) NS Improved fruit and vegetable consumption
0.01 (-0.14;0.16) NS
Improved SSB consumption 0.01 (-0.10;0.13) NS Improved high fat/salt snack consumption after school
-0.21 (-0.32;-0.09) <0.05
Improved fried foods consumption after school
-0.09 (-0.29;0.11) NS
Improved confectionery consumption after school
-0.12 (-0.26;0.03) NS
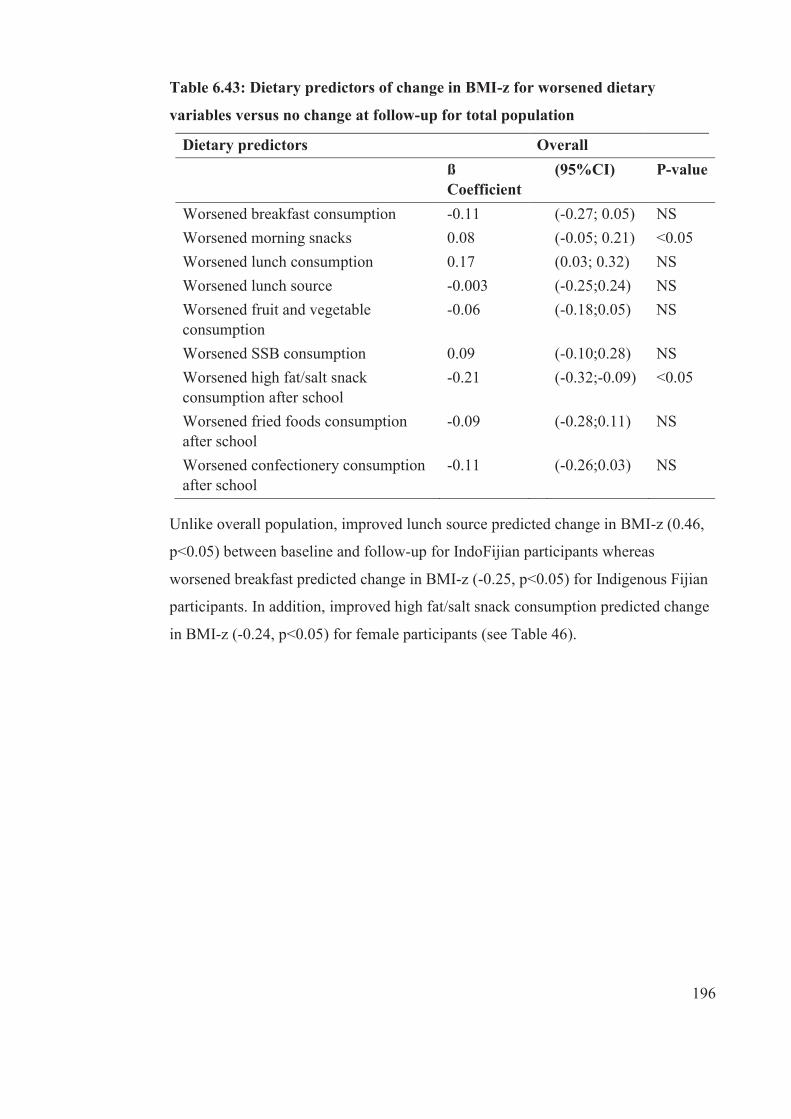
196
Table 6.43: Dietary predictors of change in BMI-z for worsened dietary
variables versus no change at follow-up for total population
Unlike overall population, improved lunch source predicted change in BMI-z (0.46,
p<0.05) between baseline and follow-up for IndoFijian participants whereas
worsened breakfast predicted change in BMI-z (-0.25, p<0.05) for Indigenous Fijian
participants. In addition, improved high fat/salt snack consumption predicted change
in BMI-z (-0.24, p<0.05) for female participants (see Table 46).
Dietary predictors Overall
ß Coefficient
(95%CI) P-value
Worsened breakfast consumption -0.11 (-0.27; 0.05) NS Worsened morning snacks 0.08 (-0.05; 0.21) <0.05 Worsened lunch consumption 0.17 (0.03; 0.32) NS Worsened lunch source -0.003 (-0.25;0.24) NS Worsened fruit and vegetable consumption
-0.06 (-0.18;0.05) NS
Worsened SSB consumption 0.09 (-0.10;0.28) NS Worsened high fat/salt snack consumption after school
-0.21 (-0.32;-0.09) <0.05
Worsened fried foods consumption after school
-0.09 (-0.28;0.11) NS
Worsened confectionery consumption after school
-0.11 (-0.26;0.03) NS
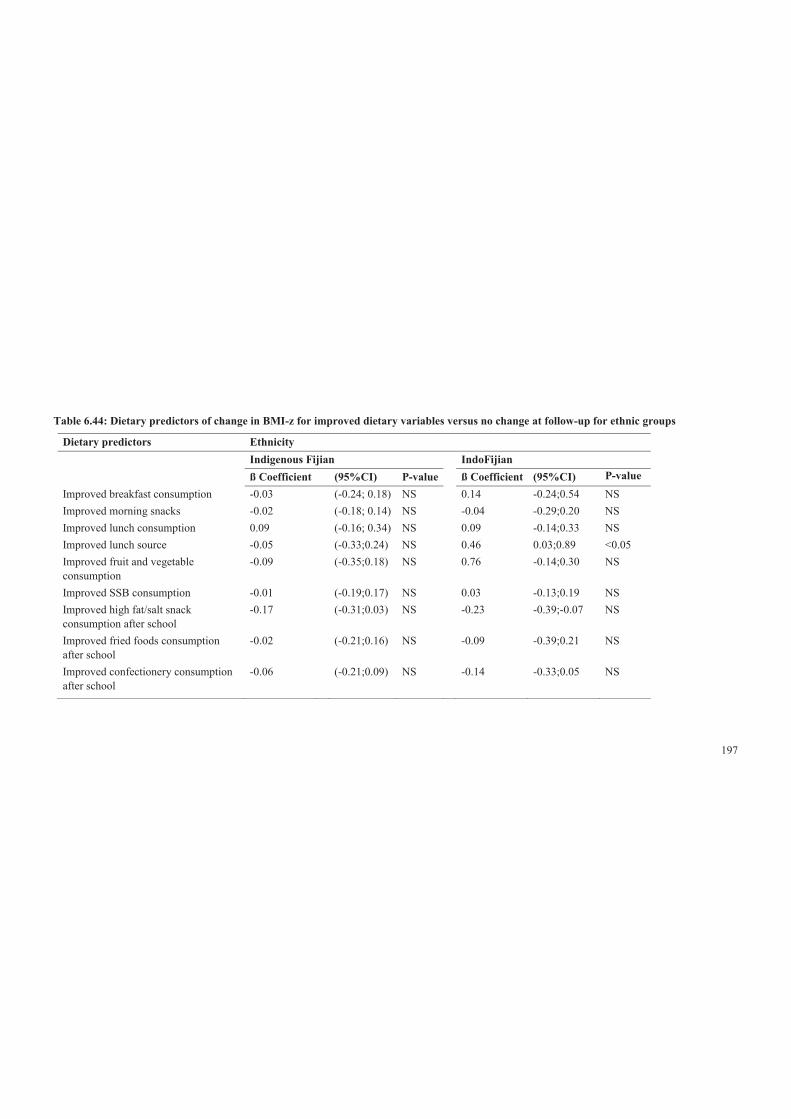
197
Table 6.44: Dietary predictors of change in BMI-z for improved dietary variables versus no change at follow-up for ethnic groups
Dietary predictors Ethnicity
Indigenous Fijian IndoFijian
ß Coefficient (95%CI) P-value ß Coefficient (95%CI) P-value Improved breakfast consumption -0.03 (-0.24; 0.18) NS 0.14 -0.24;0.54 NS Improved morning snacks -0.02 (-0.18; 0.14) NS -0.04 -0.29;0.20 NS Improved lunch consumption 0.09 (-0.16; 0.34) NS 0.09 -0.14;0.33 NS Improved lunch source -0.05 (-0.33;0.24) NS 0.46 0.03;0.89 <0.05 Improved fruit and vegetable consumption
-0.09 (-0.35;0.18) NS 0.76 -0.14;0.30 NS
Improved SSB consumption -0.01 (-0.19;0.17) NS 0.03 -0.13;0.19 NS Improved high fat/salt snack consumption after school
-0.17 (-0.31;0.03) NS -0.23 -0.39;-0.07 NS
Improved fried foods consumption after school
-0.02 (-0.21;0.16) NS -0.09 -0.39;0.21 NS
Improved confectionery consumption after school
-0.06 (-0.21;0.09) NS -0.14 -0.33;0.05 NS
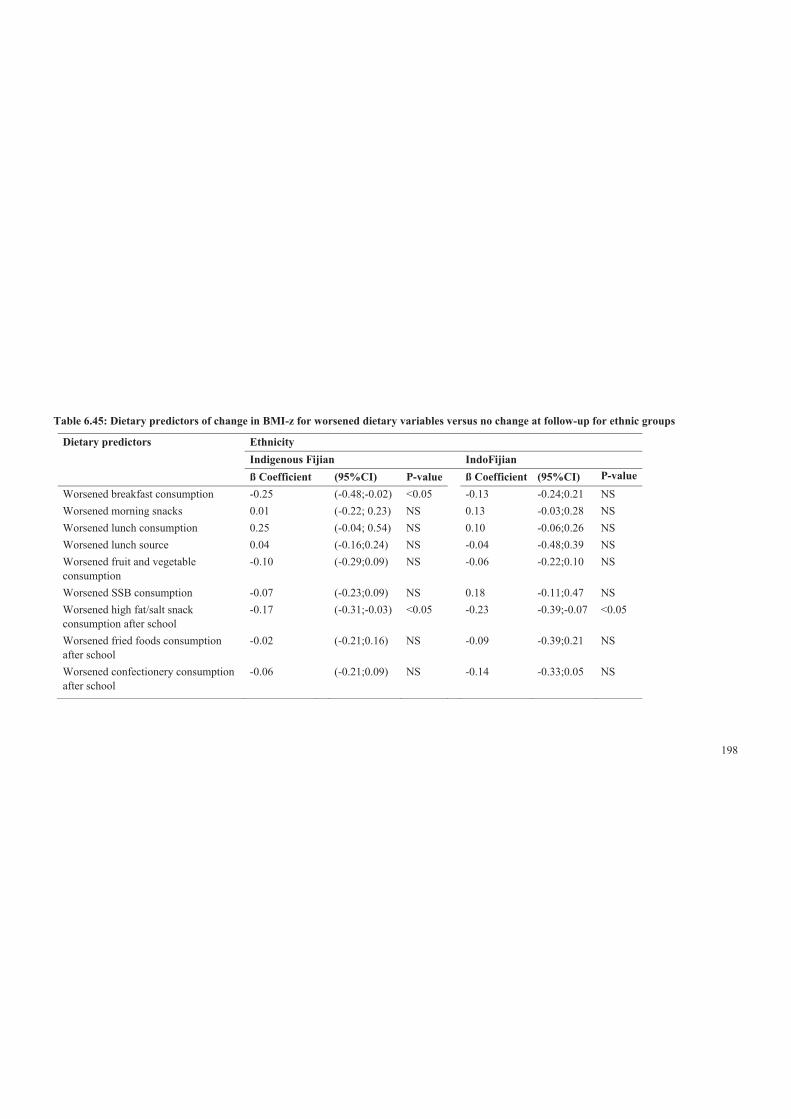
198
Table 6.45: Dietary predictors of change in BMI-z for worsened dietary variables versus no change at follow-up for ethnic groups
Dietary predictors Ethnicity
Indigenous Fijian IndoFijian
ß Coefficient (95%CI) P-value ß Coefficient (95%CI) P-value Worsened breakfast consumption -0.25 (-0.48;-0.02) <0.05 -0.13 -0.24;0.21 NS Worsened morning snacks 0.01 (-0.22; 0.23) NS 0.13 -0.03;0.28 NS Worsened lunch consumption 0.25 (-0.04; 0.54) NS 0.10 -0.06;0.26 NS Worsened lunch source 0.04 (-0.16;0.24) NS -0.04 -0.48;0.39 NS Worsened fruit and vegetable consumption
-0.10 (-0.29;0.09) NS -0.06 -0.22;0.10 NS
Worsened SSB consumption -0.07 (-0.23;0.09) NS 0.18 -0.11;0.47 NS Worsened high fat/salt snack consumption after school
-0.17 (-0.31;-0.03) <0.05 -0.23 -0.39;-0.07 <0.05
Worsened fried foods consumption after school
-0.02 (-0.21;0.16) NS -0.09 -0.39;0.21 NS
Worsened confectionery consumption after school
-0.06 (-0.21;0.09) NS -0.14 -0.33;0.05 NS
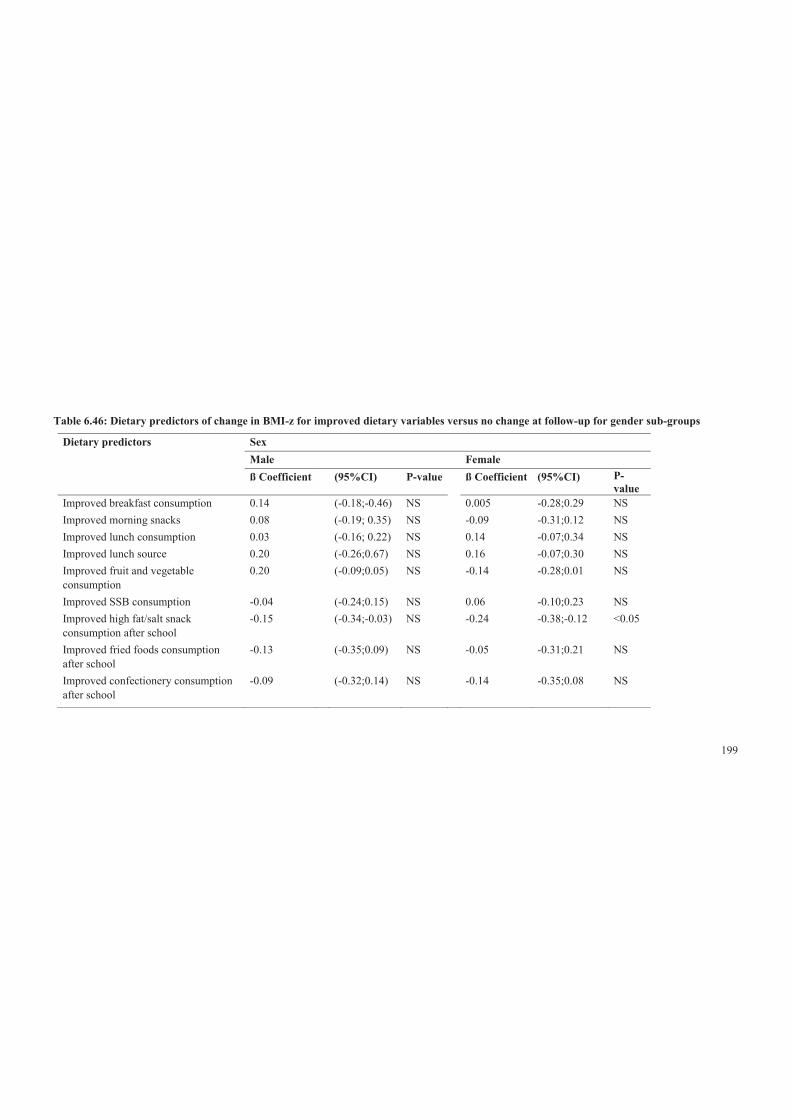
199
Table 6.46: Dietary predictors of change in BMI-z for improved dietary variables versus no change at follow-up for gender sub-groups
Dietary predictors Sex
Male Female
ß Coefficient (95%CI) P-value ß Coefficient (95%CI) P-value
Improved breakfast consumption 0.14 (-0.18;-0.46) NS 0.005 -0.28;0.29 NS Improved morning snacks 0.08 (-0.19; 0.35) NS -0.09 -0.31;0.12 NS Improved lunch consumption 0.03 (-0.16; 0.22) NS 0.14 -0.07;0.34 NS Improved lunch source 0.20 (-0.26;0.67) NS 0.16 -0.07;0.30 NS Improved fruit and vegetable consumption
0.20 (-0.09;0.05) NS -0.14 -0.28;0.01 NS
Improved SSB consumption -0.04 (-0.24;0.15) NS 0.06 -0.10;0.23 NS Improved high fat/salt snack consumption after school
-0.15 (-0.34;-0.03) NS -0.24 -0.38;-0.12 <0.05
Improved fried foods consumption after school
-0.13 (-0.35;0.09) NS -0.05 -0.31;0.21 NS
Improved confectionery consumption after school
-0.09 (-0.32;0.14) NS -0.14 -0.35;0.08 NS
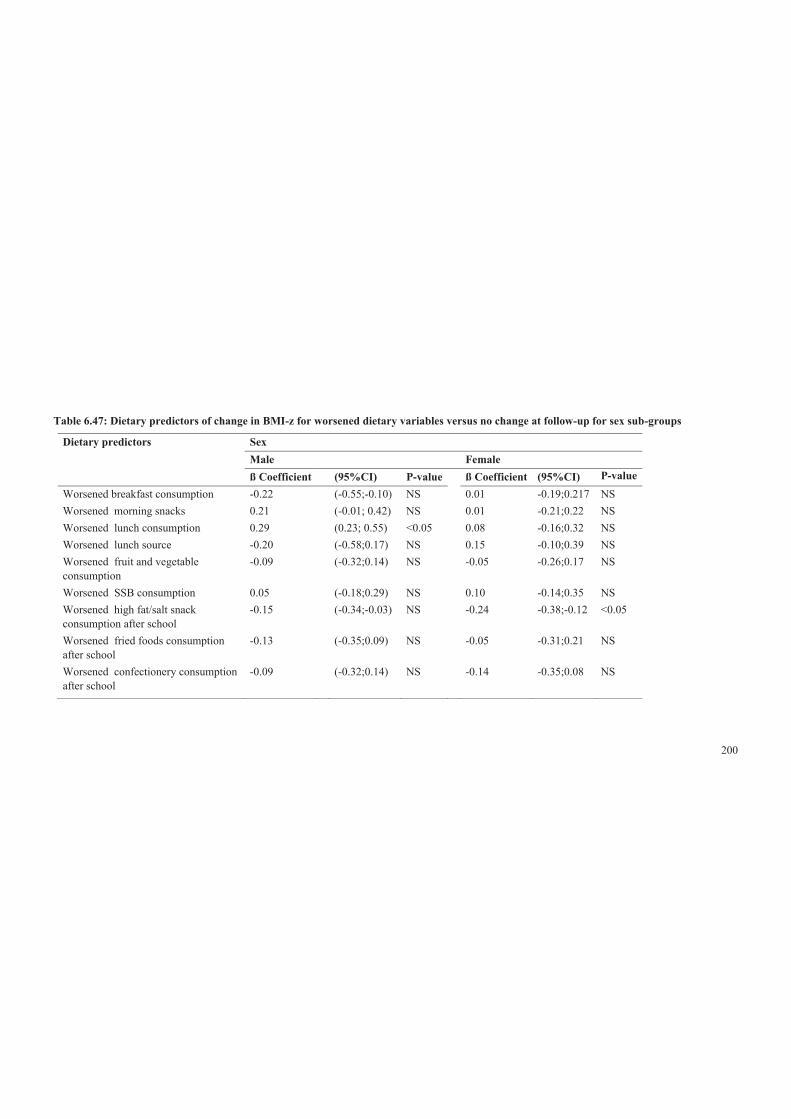
200
Table 6.47: Dietary predictors of change in BMI-z for worsened dietary variables versus no change at follow-up for sex sub-groups
Dietary predictors Sex
Male Female
ß Coefficient (95%CI) P-value ß Coefficient (95%CI) P-value Worsened breakfast consumption -0.22 (-0.55;-0.10) NS 0.01 -0.19;0.217 NS Worsened morning snacks 0.21 (-0.01; 0.42) NS 0.01 -0.21;0.22 NS Worsened lunch consumption 0.29 (0.23; 0.55) <0.05 0.08 -0.16;0.32 NS Worsened lunch source -0.20 (-0.58;0.17) NS 0.15 -0.10;0.39 NS Worsened fruit and vegetable consumption
-0.09 (-0.32;0.14) NS -0.05 -0.26;0.17 NS
Worsened SSB consumption 0.05 (-0.18;0.29) NS 0.10 -0.14;0.35 NS Worsened high fat/salt snack consumption after school
-0.15 (-0.34;-0.03) NS -0.24 -0.38;-0.12 <0.05
Worsened fried foods consumption after school
-0.13 (-0.35;0.09) NS -0.05 -0.31;0.21 NS
Worsened confectionery consumption after school
-0.09 (-0.32;0.14) NS -0.14 -0.35;0.08 NS
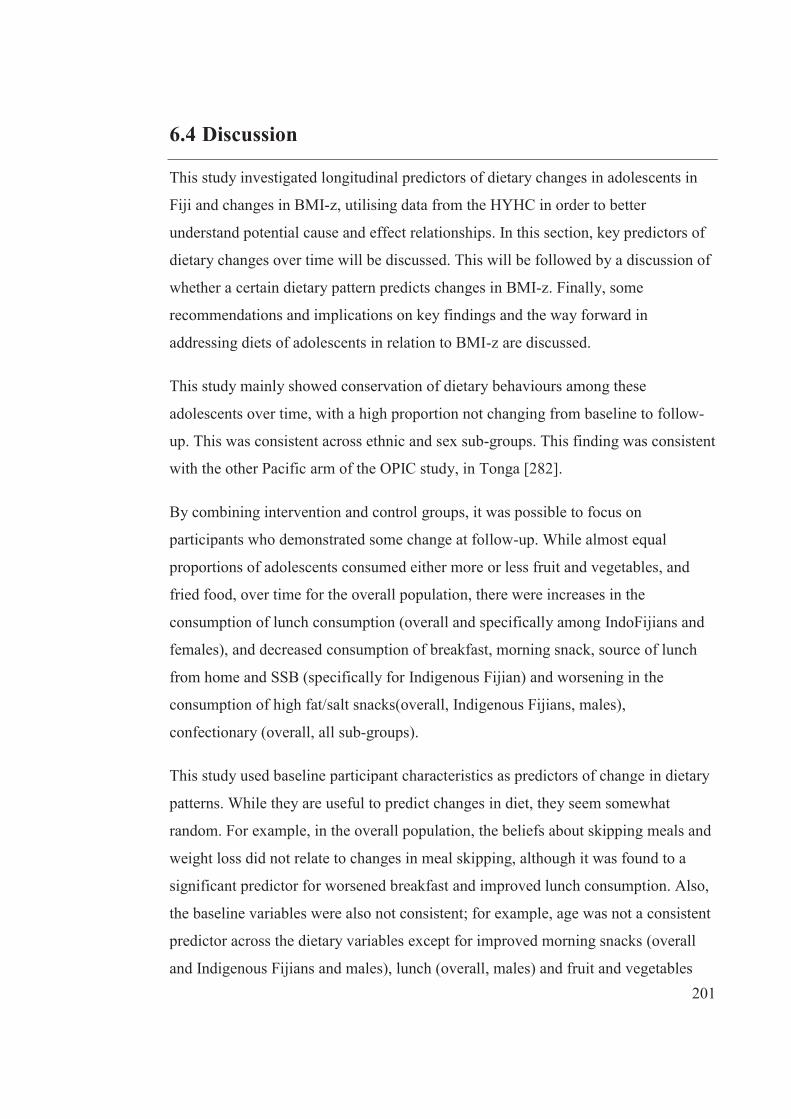
201
6.4 Discussion
This study investigated longitudinal predictors of dietary changes in adolescents in
Fiji and changes in BMI-z, utilising data from the HYHC in order to better
understand potential cause and effect relationships. In this section, key predictors of
dietary changes over time will be discussed. This will be followed by a discussion of
whether a certain dietary pattern predicts changes in BMI-z. Finally, some
recommendations and implications on key findings and the way forward in
addressing diets of adolescents in relation to BMI-z are discussed.
This study mainly showed conservation of dietary behaviours among these
adolescents over time, with a high proportion not changing from baseline to follow-
up. This was consistent across ethnic and sex sub-groups. This finding was consistent
with the other Pacific arm of the OPIC study, in Tonga [282].
By combining intervention and control groups, it was possible to focus on
participants who demonstrated some change at follow-up. While almost equal
proportions of adolescents consumed either more or less fruit and vegetables, and
fried food, over time for the overall population, there were increases in the
consumption of lunch consumption (overall and specifically among IndoFijians and
females), and decreased consumption of breakfast, morning snack, source of lunch
from home and SSB (specifically for Indigenous Fijian) and worsening in the
consumption of high fat/salt snacks(overall, Indigenous Fijians, males),
confectionary (overall, all sub-groups).
This study used baseline participant characteristics as predictors of change in dietary
patterns. While they are useful to predict changes in diet, they seem somewhat
random. For example, in the overall population, the beliefs about skipping meals and
weight loss did not relate to changes in meal skipping, although it was found to a
significant predictor for worsened breakfast and improved lunch consumption. Also,
the baseline variables were also not consistent; for example, age was not a consistent
predictor across the dietary variables except for improved morning snacks (overall
and Indigenous Fijians and males), lunch (overall, males) and fruit and vegetables
202
(overall, females) for each year of older age. The only predictors with some
coherence was that participants who did not know that the sugar content of fruit and
cordial drinks was similar to soft drinks (Coke and Sprite) were more likely to
improve their SSB consumption over the following two years. In addition,
participants who thought that fruit and vegetables were bad for weight were less
likely to decrease (overall) and improve (Indigenous Fijians) their fruit and vegetable
consumption. Moreover, participants who stated that they were trying to lose weight
were more likely to improve their breakfast and lunch consumption. These findings
showed that longitudinal analyses of relationships between baseline factors and
dietary change variables have not been very informative and have not added further
information to the cross-sectional study.
The lack of obvious, intuitive associations found in this study may also reflect the
fact that the changes in dietary patterns were demonstrated by a small number of
participants, which could explain why they did not detect many changes in BMI-z
but also very random. However, in general, about 10 to 20% of the participants made
changes for better or worse. This amounts to about 135 to 270 participants in each
group of improving or worsening, which provided sufficient power to test the
relationships with BMI-z. Improved high fat/salt snacks consumption (lower
consumption frequency at follow-up) was associated with a reduction of BMI-z of -
0.21 for overall participants. Whereas worsened (increased) high fat/salt snacks
consumption was also associated with a reduction in BMI-z for both ethnic groups
and females.
In addition, the duration of the OPIC baseline and follow-up studies was just over
two years (2.12 years), which is long enough to achieve a step change in dietary
intake, as about half of its effect on body weight is apparent in one year and most of
the final weight change will have occurred by two years [355]. The largest beta
coefficient effect size was 0.19 for improved lunch source (Table 6.42) and 0.17 (see
Table 6.43) for worsened lunch consumption. Thus, those who became reliant on
lunch sourced from home gained 0.19 of a BMI-z score over two years compared
with those who did not change their lunch source between baseline and follow-up. In
addition, those who decreased in their lunch consumption gained 0.17 of a BMI-z
203
score at follow-up compared to those who did not change between baseline and
follow-up.
While both were not statistically significant, the beta coefficient of 0.19 had a big
point estimate (with wide confidence intervals), thus would suggest that a big effect
may be present, but it is hidden by the substantial variability in the independent
variable. A BMI-z of 0.17 translates to about a 1700g body weight effect, which is
not a trivial effect of a change in behaviour on adolescents’ weight. Based on these
findings, it is possible that the effects for some of the dietary variables may be
important, but are hidden by the bluntness of the instruments used and that these null
findings should not counteract the positive findings in other longitudinal studies as
outlined in the background.
Unfortunately, the longitudinal study did not provide any substantial further insights
into the dietary determinants of weight status in Pacific adolescents, over and above
what came from the cross-sectional study. Despite the superiority of longitudinal
studies in being able to better tease out cause and effect relationships, they suffer
from other characteristics (like lack of variation in behaviours or the ability to detect
small changes), which might obscure important relationships and thus be of less
value for health promotion. For Fiji, the combination of the cross-sectional data
(frequencies of dietary patterns and relationships with BMI-z and other variables)
plus the international literature has provided the richest evidence base to inform local
action, with the longitudinal study not being able to add much more.
Even though this study did not provide the anticipated results, another important area
that is needed to inform action in Fiji is an understanding of the sociocultural context
for these eating behaviours. In this way, actions can be embedded within the cultural
values, beliefs and perceptions and the social structures and identifying messages and
messengers that could motivate dietary change among these adolescents. This is the
subject of the next two chapters.
6.4.1 Strength and Limitation
There were some strengths and limitations of this study. The main strength of this
study was its longitudinal design, which has greater explanatory powers to infer
204
cause and effect relationships than cross-sectional designs. Other strengths include
the large number of participants and the duration of 2.12 years, which is long enough
to see the effects of dietary change on body weight. However, the main risk for these
studies is a lack of variance in either independent or dependent variables, giving the
study a low power to detect changes. The finding that the majority of participants did
not change their dietary patterns between baseline and follow-up may be because
they did not actually change (i.e., participants continued with their usual habits) or
they did change, but it was too subtle or the instruments were blunt for this to be
detected.
Given the complexity of the analysis and large numbers of independent and
dependent variables in this study, it is necessary to dichotomise the variables used in
the analysis of change. This inevitably resulted in information loss and decreased the
power to detect change over time. Further caution in interpretation is needed because
of the large numbers of tests for significance. The researcher did not choose to
reduce significance to <0.01, as recommended by Bonferonni [356]. For example, 72
significance tests were done on baseline predictors of change in dietary patterns, thus
one would expect three to four p-values <0.05 by chance alone, so that the seven
statistically significant relationships that were found need to be interpreted in this
light.
6.4.2 Conclusion and implications
Although there were few additional insights generated in this study, it is clear that
dietary patterns among Fijian adolescents have the potential to impact negatively on
health and weight status. As a result, enhanced health promotion efforts should be
put in place to change the dietary patterns of adolescents, in particular, to promote
consumption of water and other low calorie drinks and fruit and vegetables in place
of higher calorie foods and drinks. With indications of worsening in lunch
consumption, this dietary pattern should be targeted for health promotion
interventions. While the SSB consumption worsened at follow-up overall, and
especially for the Indigenous Fijian adolescents, the non-significant difference of
BMI-z score between baseline and follow-up for overall and all sub-groups calls for
further investigation.
205
It may be important to also examine the influence of total energy intake in these dietary
patterns. Equally important is the need to examine in more detail other possible reasons
why adolescents are behaving this way, as the intervention phase was part of the OPIC
study. Moreover, a qualitative approach becomes useful to explore perceived barriers,
facilitators and effective messages to motivate adolescents to better understand what
adolescents would exchange for a healthy dietary pattern.
206
C H A P T E R 7
Study Three
7.1 Background
As highlighted in Chapter 5 of this thesis, the weekday dietary patterns among
adolescents in the OPIC baseline sample were poor. Overall, adolescents were
frequent consumers of SSB, low consumers of fruit and vegetables, breakfast
skippers and regular consumers of high-energy/salt snacks at school and after school.
In addition, consumption of unhealthy food and drinks at recess was significantly
associated with the availability of spending money (separate analysis). By ethnicity
and sex, IndoFijians and males were generally more likely than Indigenous Fijians
and females to have healthy dietary patterns.
The high prevalence of adolescents engaging in such BMI-related dietary behaviours
is a health concern and raises the need to explore explanations for such unhealthy
diets. Exploration of these explanatory factors is important for Fiji in order to
develop culturally relevant and age-appropriate health promotion messages and to
determine if sub-groups (ethnicity, sex) respond to different messages.
Although there are multiple factors that contribute to obesogenic diets, sociocultural
factors were the focus of this study given that they are powerful influences on dietary
patterns, especially in Pacific populations [161, 328]. The SEF [246] (see Figure 4.1)
conceptualises the relationship between the broader social environments and
individuals’ dietary behaviour, in particular, for this study, eating patterns. Individual
eating patterns are influenced by those of one’s culture, sex and age groups and
population eating patterns, as well as the wider food environments.
Previous studies comparing home-sourced food versus outside home food have
shown that food consumed at home is healthier and lower in fat and calories than
outside home [357]. Studies predominantly with Western adolescent populations and
Cree adolescents in Quebec reported that food consumed outside home was found to
be associated with poor dietary quality and higher weight status [358-360]. Based on
207
these findings, health experts have emphasised the value of frequent consumption of
meals prepared from home.
Other studies have suggested that consumption patterns at home differ by ethnicity,
thus family or individual beliefs, values, ideas and attitudes influence home meals.
For example, among IndoFijians, home preparation of meals is encouraged by
parents. While there is evidence suggestive of a relationship between sociocultural
influences on home meals and obesity [357, 358, 361], studies are needed to explore
the sociocultural influences on outside home dietary patterns. This examination of
sociocultural factors that influence outside home diets is especially important for
adolescents in Fiji because of the increasing prevalence of overweight and obesity
and unhealthy diets among this age group. Also, given that these adolescents are
from the two main ethnic groups, it is important to identify sociocultural
explanations of outside home dietary patterns.
7.1.1 Aim
The aim of study three was to identify the possible explanatory value, especially the
sociocultural influences for adolescents’ food and drinks purchasing and
consumption outside home, and whether and how this differed between ethnic and
sex sub-groups in Fiji. The key research questions that study three addressed were:
What sociocultural factors might explain the obesogenic dietary patterns of
adolescents in Fiji? Do the sociocultural influences on these selected behaviours
differ by ethnic and sex sub-groups?
7.2 Methods
7.2.1 Study design
This qualitative study utilised data from the existing sociocultural in-depth
interviews that were conducted during the HYHC programme. Semi-structured
interviews were conducted with 48 Indigenous Fijians and 48 IndoFijian adolescents
(24 males and 24 females per group) who were recruited from six of the seven
secondary schools participating in the HYHC project, namely Amadhiya Muslim
College, Assemblies of God High School, Bhawani Dayal College, Nasinu Muslim
208
College, Nasinu Secondary School and Rishikul College. Approval of the study was
obtained from the Fiji National Research Committee, the Fiji National Research
Ethics Review Committee (FNRERC) and Deakin University (Melbourne,
Australia).
7.2.1.1 Data collection
Trained interviewers conducted the interviews, which were 40 to 50 minutes long.
The interviews were semi-structured, meaning that all adolescents were asked the
same questions, but not necessarily in the same order [362, 363] and probing
questions were used to yield in-depth information when necessary. Interviewers were
the same sex as the interviewees and spoke the same first language. Participants were
given the choice to be interviewed in their first language or English or a combination
of both.
The interview protocol included creating a relaxed environment so adolescents felt
free to share and discuss their experience and ideas regarding food behaviours
outside of home. As this is an existing data set, the interview comprised questions
pertaining to ‘food and eating’, ‘physical activity’, body image and body change
strategies. The results largely concurred with the OPIC larger behavioural surveys
pre- and post-intervention and provided more in-depth information about
adolescents’ perceptions of sociocultural factors that influenced the target
behaviours. For study three, only data related to adolescents’ patterns of food and
eating (see Table 7.1) were analysed.
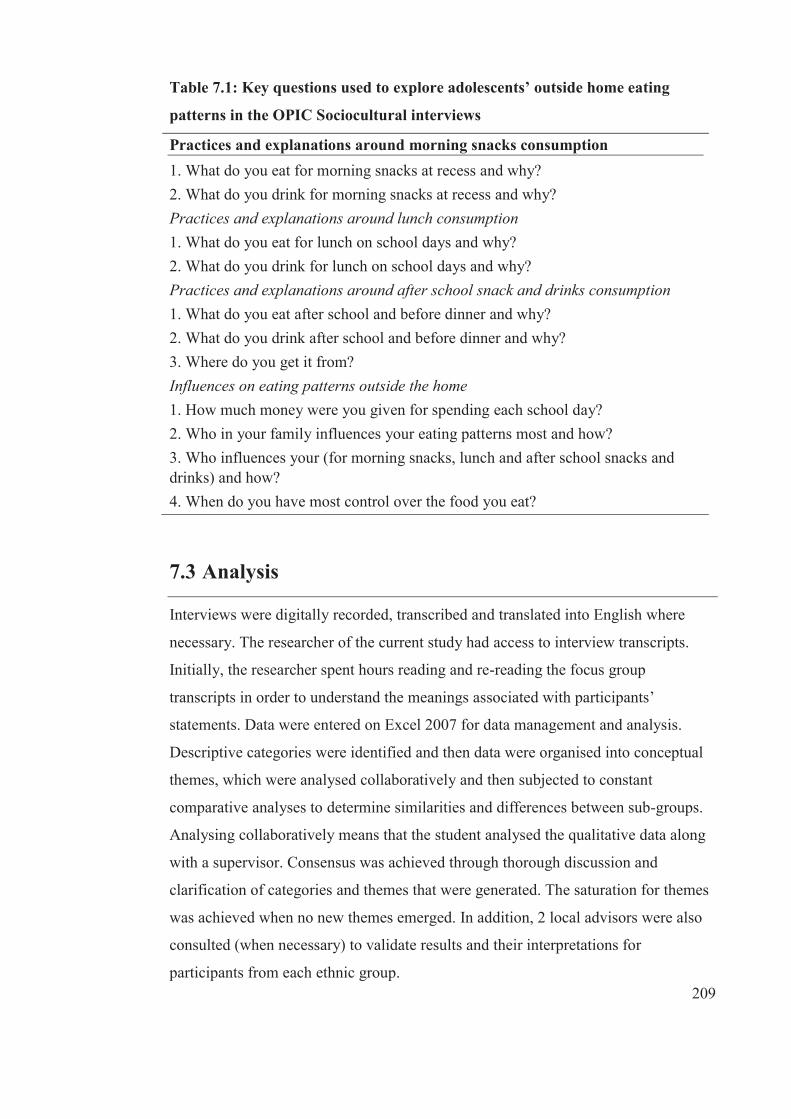
209
Table 7.1: Key questions used to explore adolescents’ outside home eating
patterns in the OPIC Sociocultural interviews
Practices and explanations around morning snacks consumption 1. What do you eat for morning snacks at recess and why? 2. What do you drink for morning snacks at recess and why? Practices and explanations around lunch consumption 1. What do you eat for lunch on school days and why? 2. What do you drink for lunch on school days and why? Practices and explanations around after school snack and drinks consumption 1. What do you eat after school and before dinner and why? 2. What do you drink after school and before dinner and why? 3. Where do you get it from? Influences on eating patterns outside the home 1. How much money were you given for spending each school day? 2. Who in your family influences your eating patterns most and how? 3. Who influences your (for morning snacks, lunch and after school snacks and drinks) and how? 4. When do you have most control over the food you eat?
7.3 Analysis
Interviews were digitally recorded, transcribed and translated into English where
necessary. The researcher of the current study had access to interview transcripts.
Initially, the researcher spent hours reading and re-reading the focus group
transcripts in order to understand the meanings associated with participants’
statements. Data were entered on Excel 2007 for data management and analysis.
Descriptive categories were identified and then data were organised into conceptual
themes, which were analysed collaboratively and then subjected to constant
comparative analyses to determine similarities and differences between sub-groups.
Analysing collaboratively means that the student analysed the qualitative data along
with a supervisor. Consensus was achieved through thorough discussion and
clarification of categories and themes that were generated. The saturation for themes
was achieved when no new themes emerged. In addition, 2 local advisors were also
consulted (when necessary) to validate results and their interpretations for
participants from each ethnic group.
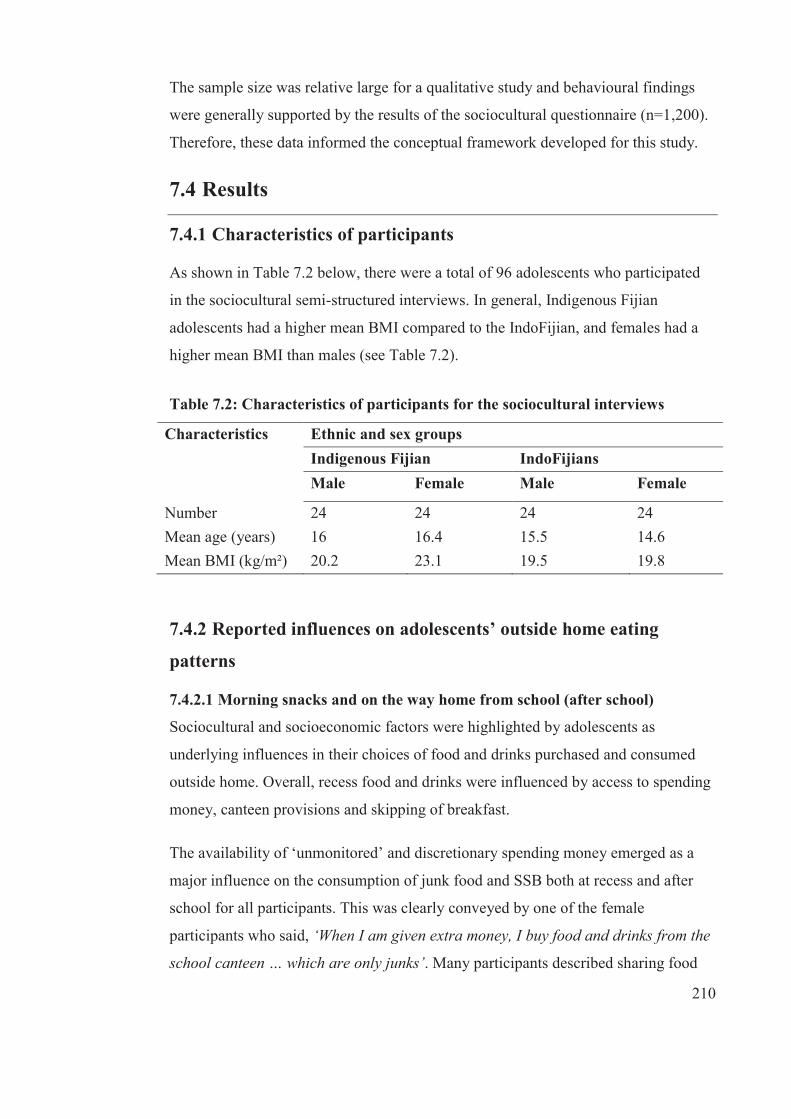
210
The sample size was relative large for a qualitative study and behavioural findings
were generally supported by the results of the sociocultural questionnaire (n=1,200).
Therefore, these data informed the conceptual framework developed for this study.
7.4 Results
7.4.1 Characteristics of participants
As shown in Table 7.2 below, there were a total of 96 adolescents who participated
in the sociocultural semi-structured interviews. In general, Indigenous Fijian
adolescents had a higher mean BMI compared to the IndoFijian, and females had a
higher mean BMI than males (see Table 7.2).
Table 7.2: Characteristics of participants for the sociocultural interviews
Characteristics Ethnic and sex groups Indigenous Fijian IndoFijians
Male Female Male Female
Number 24 24 24 24 Mean age (years) 16 16.4 15.5 14.6 Mean BMI (kg/m²) 20.2 23.1 19.5 19.8
7.4.2 Reported influences on adolescents’ outside home eating
patterns
7.4.2.1 Morning snacks and on the way home from school (after school)
Sociocultural and socioeconomic factors were highlighted by adolescents as
underlying influences in their choices of food and drinks purchased and consumed
outside home. Overall, recess food and drinks were influenced by access to spending
money, canteen provisions and skipping of breakfast.
The availability of ‘unmonitored’ and discretionary spending money emerged as a
major influence on the consumption of junk food and SSB both at recess and after
school for all participants. This was clearly conveyed by one of the female
participants who said, ‘When I am given extra money, I buy food and drinks from the
school canteen … which are only junks’. Many participants described sharing food
211
and drinks by pooling spending money to buy junk food and SSB at recess and after
school, thus suggesting that peer influence plays an important role in the
consumption of food and drinks. Another participant explained how they shared
money to buy drinks at recess: ‘When it is recess time, we go and buy beans and
sweets from school canteen and, for drinks, we contribute to buy one litre of Sprint
[SSB] and share’.
Females shared food and drinks among other females more than males and explained
how they sat around and talked while males were more involved in playing sports or
attending prayer session (in the case of Muslim boys). Apart from sharing spending
money and food, another reason that females gave for eating junk food at recess was
skipping breakfast before school and thus being hungry mid-morning. Previous
analysis of the sociocultural questionnaire [240] indicated that the most common
reasons for skipping breakfast were getting up too late and not feeling hungry. More
IndoFijian females than Indigenous Fijian females gave explanatory comments
regarding why they skipped breakfast:
I often miss breakfast … [Why is that?] I don’t like to eat that early in the
morning. I would like to have my breakfast at about 10 am. (Indigenous Fijian
female)
I normally don’t eat anything in the morning … [At recess] I usually have a big
appetite so I buy stuff from the canteen to fill me up. (IndoFijian female)
If I am rushing, sometimes I don’t have breakfast … After doing the chores; I
have my shower and … rush to school. (Indigenous Fijian female)
The majority of females, especially Indigenous Fijian females, reported that feeling
hungry after school encouraged them to buy either junk food and/or SSB on the way
home. The most common reason for purchasing SSB such as Fanta, Coke and Sun-
pop was taste preference for females in both ethnic sub-groups.
Similarly, males’ explanations for eating junk food and drinking SSB at recess and
after school were consistent with females’ accounts. The availability of
‘unmonitored’ spending money, as well as food sharing, influenced the type of food
212
and drinks purchased both at recess and after school. The influence of ‘unmonitored’
spending money was common during recess and after school.
Umm … normally recess, I spend $1 and lunch another $1. [Alright, and how
much spending do you get from home?] Umm … .normally for one week I get
$10 and spend about $2 a day.
In addition to the findings on the availability of spending money, an additional cross-
tabulation analysis (separate analysis) showed a significant positive relationship
between spending money and eating ‘junk’ food at recess as a morning snacks.
Another reason expressed by males for purchasing and consuming junk food
especially after school was being hungry after school. An example of a response was;
[What time does school finish?] 3.20. [After that?] Sometimes we go to the
Chinese shop, buy some coconut rolls, cream bun(s). [Then you go home?] Yes.
Because after school we are hungry again.
Food and drink sharing at recess was common, with male participants describing
how they pooled spending money to buy SSB. Examples of responses were:
[What do you eat or drink during recess?] At recess time, I drink Sprite with my
friends … [And how much do you get in a day for spending?] $1. And then we
put in money together to buy drinks.
7.4.2.2 Lunch food and drinks
The adolescents had explanations for the food and drinks they purchased and
consumed at lunch. Overall, adolescents expressed how their lunch diets were being
influenced at school. Most adolescents highlighted the influence of peers and canteen
provision. There were few cultural and sex differences noted.
A higher number of Indigenous Fijians reported that peers influenced what they ate
and drank for lunch. Food and drinks purchased from the school canteen were always
shared and often adolescents pooled in money together to purchase these food items.
Conversely, the majority of IndoFijians reported sourcing their lunch from home.
213
By sex, more Indigenous Fijian females than IndoFijian females indicated that
friends were the biggest influence at school. Friends pooled their spending money for
food and drinks and ate together. More females from both ethnic groups indicated
that their friends influenced the type and amount of food consumed through
persuading each other. Examples were:
They [friends] tell me not to eat big amount of fatty foods … I have to eat a lot
of green vegetables because it’s good for my health as well as my body … [So
are you saying your friends influence you to eat fatty foods?] Yes.
My best friend. [What does she say?] … she always tells me ‘Why you don’t
want to eat?’ and I’ll say ‘No, I don’t want to eat’ and she’ll force me to eat.
There were very few males from both ethnic groups who reported that peers
influenced the type and amount of food they consumed. Such influence was more
expressed by females than males. More IndoFijian females than Indigenous Fijian
females reported that lunch food was from home, thus the mother influenced the type
and amount of food consumed for lunch.
7.4.2.3 Reported sociocultural influences on outside home and at home food and
drinks consumption
Further exploration of the sociocultural interview data revealed sociocultural
influences on food and drink that were relevant to this study. Generally, the major
influences on food and drink purchase and consumption were parents and peers.
Parents tended to influence the type and amount of food accessed at home, while
friends were the main influence at school. However, parents influenced food outside
of home indirectly by preparing lunches or not and providing spending money. Other
influences reported were grandparents, aunts, siblings, religious beliefs, teachers and
the media. However, the relative influence of each of these sociocultural and
socioeconomic factors differed by ethnicity and sex and location (school or home).
7.4.2.4 Reported sociocultural influences from family members
More Indigenous Fijians than IndoFijians reported that their father influenced food-
purchasing decisions, while their mothers prepared, cooked and served food for the
family members. The influence from grandparents and older siblings was frequently
214
mentioned by Indigenous Fijians, in particular, to do with advice about the type and
amount of food that should be consumed.
Interestingly, females appeared to be more influenced by friends than males. Further,
more females reported that older female relatives such as mothers, grandmothers,
aunts and older sisters influenced the amount of food consumed more than types of
food at home. The majority of IndoFijians females explained that their mother
influenced their diet, encouraging and persuading them to eat greater quantities.
Examples of quotations from both ethnic groups were:
My mother says that you eat very little and you should eat more.
[Does anyone influence the amount of food that you eat?] I think my mum …
she still says that you eat less and get healthy.
Grandmothers also encouraged IndoFijian females to eat more. This was expressed
by a participant who explained the family influences on her diet:
My mother and my grandmother, because we live near so when they see us
eating, not eating the proper meal, so they tell us to eat. If we don’t [giggles]
they get angry, they want us to eat the right amount and sometimes they are a
bit strict because we are not eating enough.
Some IndoFijian females also mentioned that their sisters encouraged them to eat
better, for example:
My sister she says that she eats more [than me]. That’s why she is healthier
than me. She says that she has no sickness, she can run fast and she is younger
than me. [Pause] So she tells me to eat more.
As with IndoFijian females, Indigenous Fijian females described how the types and
amount of food they consumed was influenced by family members, for example,
both parents and grandmothers. In addition, some participants indicated that aunts
also influenced their eating behaviours, while few participants indicated that their
sisters influenced their diets. Parents, especially fathers, decided on the types of food
to be cooked while mothers prepared, cooked and most times served the family
215
members. With regard to the type of influence, both parents advised or encouraged
their daughters on the amount of food they should consume.
My parents. [How do they influence you?] They say to eat the right amount of
foods and not too much or a lot of fat … I feel good when they tell me because
it’s for our health.
My parents … Every day meal … they will check on the type and amount of food
that I eat … a lot of times they tell me to eat a lot … Because I’m getting
smaller every day.
Specifically, mothers informed and encouraged daughters to eat healthy foods and in
the right amounts. Examples of responses were:
[Who influences you in the type and amount of food that you eat?] My mother
… My mum says to cut down on the eating so that I have a good figure.
[Who influences the amount and the type of food that you eat?] Mostly my mum
… [What does your mum say?] Say that umm … eating too much. Mean for a
girl to eat too much has been … being fat is not good … Because probably they
want me … not to grow fat, but to be slim and to be healthy.
Fathers also influenced the amount of food that their daughters consumed through
the provision of healthy foods and providing advice on a healthy amount to eat.
Examples of responses were:
[Who influences you on the amount and type of food that you eat?] My father
… [Why do you say your father?] Umm … because like … umm … he picks on
the food we eat, but sometimes we are only allowed to eat whatever we eat, but
sometimes he gets angry, like it’s not balanced. [So what does he say?] Says it’s
not healthy, not good for us, we’re still young and will grow fat … [giggles].
[He says that you’ll go fat?] Yes.
A participant expressed how her sister influenced the amount of food she consumed.
For example:
My sister. [What does she say?] She says ‘you eat too much’ [laughs]. [Why
does she say that?] … She says I have to lose a lot of weight.
216
The majority of males reported that parents, in particular, their mothers, influenced
the type and amount of food they consumed by advising them to eat a lot. This was
clearly stated by a participant: ‘She always advise me to eat a lot. [How do you feel
about it?] I feel good’.
Brothers also influenced the type and amount of food male participants consumed
especially in the case of Indigenous Fijian males. This was clearly conveyed by a
participant when asked who influenced his food, ‘My brother, sometimes in joking.
[In what way?] He sometimes jokes on the amount of food that I eat or he teases me
that he is too big and strong and I am not. [How do you feel about it?] I feel good
because he is my brother’.
7.4.2.5 Religious beliefs and activities
Generally, religious beliefs and practices are part of the daily life for all adolescents
in Fiji, given that the vast majority of the population are active within their FBO. Not
surprisingly, faith-based beliefs and practices provided possible explanations for
some of the adolescents’ obesogenic dietary patterns. A high number of IndoFijians,
especially males, indicated that religious beliefs and festivities influenced the type
and amount of food that they consumed. Most IndoFijians described excluding
specific food types from their diets, for example, meat. Similarly, most IndoFijians
interviewees either fasted on a specific day each week or at a certain time of the year
when special religious festivals were observed. Examples of comments from
IndoFijians were:
On Mondays, they [IndoFijians] don’t eat anything. In the morning they pray
and come to school, they have nothing and they have fruits and drink water at
day time. And in the afternoon, they go home, pray and have food … [Do you
also observe fasting?] Yes. It is only one time of the year [Shiv Raatri], fasting
for a day. I don’t drink anything else throughout the day. I just drink water …
Six in the morning till six in the afternoon.
Our fasting season is like we don’t eat or drink anything … in the day time …
like we do eat things before sun rises about 4.30 am and after that we don’t
usually eat anything till 6.30 in the afternoon.
217
There were also some Indigenous Fijians who described that they fasted, especially
prior to examinations.
7.4.2.6 Other influences
A few participants indicated that teachers, sports coaches or the media influenced the
type and amount of food they consumed. More IndoFijians than Indigenous Fijians
mentioned that teachers and the media influenced the type and amount of food they
consumed. A few IndoFijian males articulated that their teachers or coaches
influenced the type of food that they ate. Examples of responses were:
Our teachers. They say eat less. [And how does it feel, your teachers
encouraging you?] I feel good. Yeah, it feels good.
Normally our coach. [What does he say?] He tells us … like eat boiled foods
and exercise.
7.4.3 Perceived control over food
In general, adolescents from both cultural groups believed that they had more control
over their food choices when they were on their own, specifically when they were
away from home or their parents were not at home. Generally, IndoFijians perceived
that they had little control of their food choices, either at home or outside home.
Even outside of home, they also had less control over food; the majority reported that
they ate what was provided. This was common among IndoFijian adolescents who
believed that they ate what they were given as sign of respect to their mothers who
prepared the food.
7.5 Discussion
The findings of this study highlighted a number of issues that are pertinent to
enhancing our understanding of the influence of sociocultural and socioeconomic
factors on outside home dietary patterns of adolescents in Fiji. In particular, the
results provided important information about the various influences on the type and
amount of food and drinks that these adolescents consumed on weekdays outside of
home. Important ethnic and sex differences were noted in terms of outside home
dietary patterns and the influence on these. These differences are important to target
218
obesity interventions to promote healthy eating for specific sub-groups of
adolescents in Fiji.
The socioecological model provided a framework for identifying the possible
sociocultural and socioeconomic influences at different system levels and between
and among the different layers within the model. The literature has shown an
association between poor dietary outcomes and factors emerging from a variety of
sections within the socioecological model. In other words, obesogenic dietary
patterns are attributed not only to an individual’s attributes such as poor lifestyle in
general, but also the wider social and physical environments. For example, poor
dietary patterns were associated with intra-level factors (individual choices) [364],
intrapersonal factors (peers, family and culture influences) [161] and organisational
and community-level factors (affiliation with specific social groups, food
environments, population eating behaviour) [28]. The major themes that emerged
from the findings of this study are shown in Table 7.3.
Peer influences demonstrated through the pooling of spending money and sharing of
food by adolescents, especially Indigenous Fijians and females during recess, lunch
and after school, reflect sociocultural influences in terms of the cultural value of
sharing. The finding on the sharing of resources has been reported among students in
Tonga [178]. Other studies from Europe [365] reported that, during adolescence,
peer influence flourished and parental influences on dietary behaviour diminished
and that peers were an important social support, especially for girls [366].
Importantly, study three also highlighted the indirect influence of parents on
adolescents’ outside home dietary patterns in Fiji through the provision of a
substantial amount of spending money, which adolescents used to buy unhealthy
food and drinks. This is an important finding, given that an average household
income in Fiji is about FJD17,394 [217]. Most adolescents reported having more
control (autonomy) over their choices of food and drinks choices outside of home
compared to at home. A Canadian study on food choice autonomy among teenagers,
reported similar findings [178]. There could have been other underlying reasons for
parents giving spending money. Further investigation should be conducted on
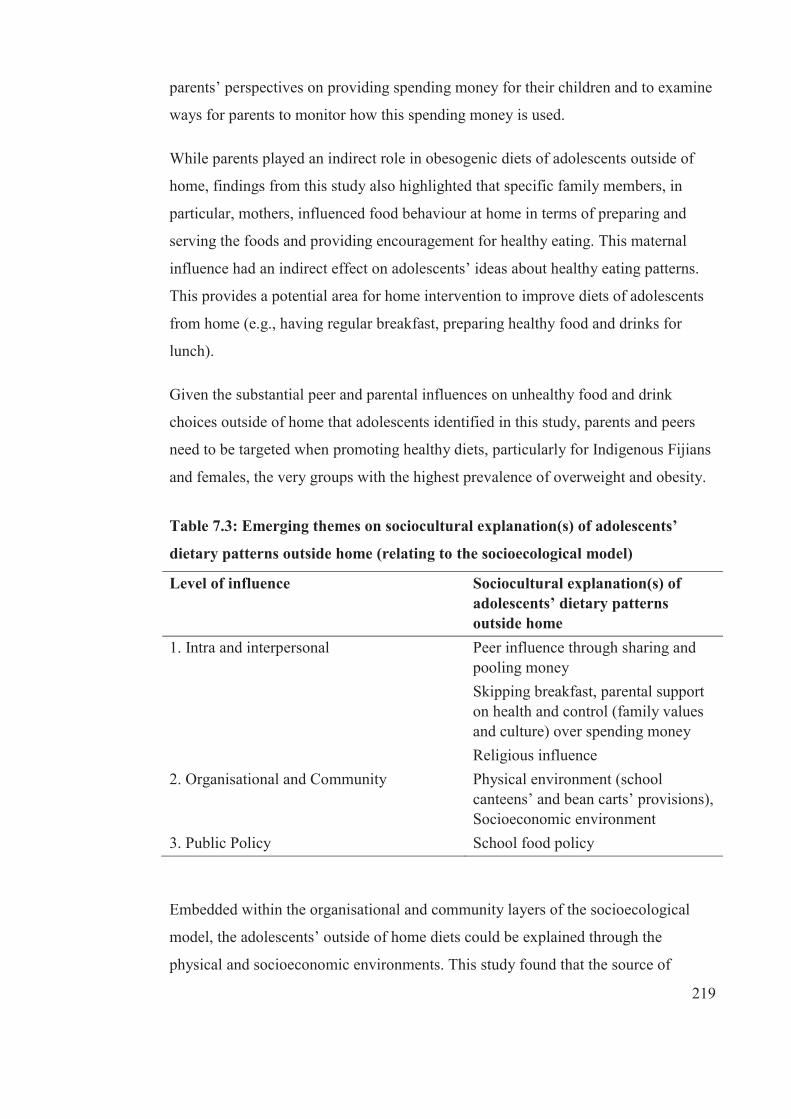
219
parents’ perspectives on providing spending money for their children and to examine
ways for parents to monitor how this spending money is used.
While parents played an indirect role in obesogenic diets of adolescents outside of
home, findings from this study also highlighted that specific family members, in
particular, mothers, influenced food behaviour at home in terms of preparing and
serving the foods and providing encouragement for healthy eating. This maternal
influence had an indirect effect on adolescents’ ideas about healthy eating patterns.
This provides a potential area for home intervention to improve diets of adolescents
from home (e.g., having regular breakfast, preparing healthy food and drinks for
lunch).
Given the substantial peer and parental influences on unhealthy food and drink
choices outside of home that adolescents identified in this study, parents and peers
need to be targeted when promoting healthy diets, particularly for Indigenous Fijians
and females, the very groups with the highest prevalence of overweight and obesity.
Table 7.3: Emerging themes on sociocultural explanation(s) of adolescents’
dietary patterns outside home (relating to the socioecological model)
Level of influence Sociocultural explanation(s) of adolescents’ dietary patterns outside home
1. Intra and interpersonal Peer influence through sharing and pooling money Skipping breakfast, parental support on health and control (family values and culture) over spending money Religious influence
2. Organisational and Community Physical environment (school canteens’ and bean carts’ provisions), Socioeconomic environment
3. Public Policy School food policy
Embedded within the organisational and community layers of the socioecological
model, the adolescents’ outside of home diets could be explained through the
physical and socioeconomic environments. This study found that the source of
220
morning snacks, lunch and afternoon snack was either from the school canteen or
nearby bean carts. This suggests that school canteens and surrounding compounds
should be targeted for intervention to improve diets of students in general. Schools
should ensure they provide nutritious choices of snacks and lunch foods. Canteen
policies that have clear guidelines for healthy food should be enforced and monitored
as canteen guidelines have already been developed in Fiji. There should be
regulations to guide the healthiness of bean carts’ food items. In Singapore, the
government developed and enforced regulations and standards for street hawkers to
register and comply with these food regulations and standards [367].
Based on the findings of this study, adolescents’ unhealthy dietary patterns outside of
home are unlikely to be improved unless some underlying sociocultural influences
are addressed, including targeting people and groups who adolescents see as key
influences, for example, parents and peers. Also, as religious beliefs and practices
play an important role in influencing adolescents’ dietary patterns, FBOs could be
targeted to channel messages about healthy eating be worked with to find effective
ways that they can help to increase the healthiness of diets of adolescents in their
organisation—importantly, without changing religious values.
This study provides insight into adolescents’ outside of home diets and the potential
sociocultural and socioeconomic influences. Understanding these behaviours from
adolescents’ perspectives is important so that health promotion can develop
appropriate messages and messengers for each sub-group (ethnicity, sex) and use the
medium that is most likely to convey these messages effectively. It is, however,
important to identify messages and messengers that could motivate adolescents to
change to healthier dietary patterns. These will be investigated further in study four
of this thesis.
7.5.1 Strengths and limitations
There were strengths and limitations of this study. Qualitative studies are not
designed to generalise findings, but rather to gain in-depth explanations. The
limitations may include the use of an existing dataset that examined sociocultural
factors underpinning a broad range of behaviours and, therefore, did not examine
outside of home eating patterns in-depth. The use of existing data also precluded the
221
researcher from further exploration of dietary behaviours. The strengths of this study
are that it provided possible explanations for the unhealthy dietary patterns of
adolescents in Fiji and identified key health-promoting messengers for different sub-
groups within the study.
222
C H A P T E R 8
Study Four
8.1 Background information
This study builds on findings from studies one, two and three of this thesis that drew
on the same population of Indigenous Fijian and IndoFijian adolescents in order to
examine sociocultural influences on adolescents’ diets outside the home. Study one
indicated that dietary patterns such as high intake of SSB, skipping of meals and low
fruit and vegetable intake were common among all adolescents in this sample.
Breakfast skipping was most common among Indigenous Fijians and females.
Females who were trying to lose weight tended to eat fewer energy-dense foods than
those who were not trying to lose weight. Study two showed that most participants
did not change their dietary patterns between baseline in 2006 and follow-up in 2008.
The findings were similar in each of the ethnic and sex groups. There were, however,
decreases in the frequency of consumption of breakfast, morning snacks and lunch,
increased consumption of fried foods (overall and IndoFijians) and reduction in the
consumption of high-energy/fat snacks, confectionery and SSB (overall, Indigenous
Fijians). Further, study two did not show significant changes in BMI-z with many of
the investigated dietary predictors.
Study three found that a high proportion of students interviewed consumed SSB
frequently, both at school and on the way home from school, and that individual taste
preferences and access to spending money predicted consumption (separate
quantitative analysis). Morning recess was reported as the most common time for
consumption of SSB and unhealthy snacks. More IndoFijians ate lunch prepared by
their mothers than Indigenous Fijians, who cited lack of time as a reason for not
bringing lunch from home. Indigenous Fijians and females were more likely to share
food at school than either IndoFijians or males. Spending money contributed to the
increased consumption of unhealthy food and drinks, both at school and on the way
home, in particular for Indigenous Fijian adolescents, making it easier for them to
access their preferred food and drinks.
223
The alarming increase of obesity prevalence coupled with poor diets among
adolescents underscores the need to address the dietary patterns of Fiji adolescents.
While there is some information about possible sociocultural influences on the
dietary patterns of Fiji adolescents, we need to know about the most effective social
marketing messages for this age group. It is, therefore, important to build on the
findings from studies one, two and three in order to determine the most effective
messages and motivators to promote change in adolescents’ diets in Fiji.
Given the high levels of both underweight and obesity in Fiji adolescents, as well as
the evidence for unhealthy diets and lifestyles, it is critical to identify culture- sex-
and age-appropriate messages (sources, mode, content and language) and motivators
to encourage Fiji adolescents from all of these sub-groups to change to healthier
dietary patterns. Improving adolescents’ diets is a challenge in any country, given
that this age group generally has more autonomy than younger children and they
have more access to unhealthy food and drinks both inside and outside home.
8.1.1 Aim
Study four aimed to gain a better understanding of culture-, sex- and age-appropriate
messages (sources, mode, content, language) and messengers likely to motivate
Indigenous Fijian and IndoFijian adolescents to change to healthier dietary patterns.
Further, the study examined adolescents’ perceived benefits of and barriers to
healthful diets. The study aimed to provide recommendation(s) for social marketing
efforts and educational programmes developed to improve the healthiness of
adolescents’ diets in Fiji.
8.2 Method
Before the commencement of this study, ethics approvals were obtained from the
University of Deakin Human Research Ethics Committee [2012 082] and the
FNRERC [2012 27].
8.2.1 Study design
Given that little is known about effective messages and messengers to improve diets
of adolescents, a qualitative approach has been selected based on the descriptive and
224
exploratory nature of the study. Qualitative approach provides textual description of
a given issue [368]; in this case, exploring effective messages and messengers to
improve adolescents’ diets. A focus group was selected as the means for examining
appropriate messages and messengers to promote healthy diets because it is a
qualitative method that enables the researcher to see reality from the respondents’
point of view [363, 369]. A focus group is:
a carefully planned discussion designed to obtain perceptions on a defined area
of interest in a permissive, non-threatening environment. It is conducted with
approximately 7 to 10 people by a skilled interviewer. The discussion is
comfortable and often enjoyable for participants as they share their ideas and
perceptions. Group members influence each other by responding to ideas and
comments in the discussion. [370]
The methodology provides insight into perceptions, feelings, interests and attitudes
of a defined target audience [370] and allows a range of ideas and opinions to be
expressed and discussed within the group. This is appropriate for exploring social
messages appropriate for promoting healthy diets [371, 372]. In this case, focus
groups allow in-depth discussion of adolescents’ perceived barriers, benefits,
messages and messengers for healthy dietary patterns. Group discussions are highly
accepted among adolescents because they share their daily experiences inside and
outside the classroom [371]. Further, focus groups allow an opportunity for
adolescents to ‘witness the expression of opinions and views on an issue and to
observe how they are shaped and censored by the responses of others in the group’
[371].
Groups were organised according to ethnic group (Indigenous Fijian; IndoFijian),
class level (forms 3 to 5; forms 6 to 7) and sex (male, female) in order for each group
to be relatively homogenous, thus facilitating a relaxed environment, promoting
within-group discussion and yielding group-specific information [373]. This is in line
with the aims of this study. Focus groups were conducted for 60 to 90 minutes with
eight groups, each comprising six to eight adolescents.
A semi-structured schedule of questions (see Appendix B1 and Appendix B2) was
developed by the researcher; drawing on the previous studies of this thesis, as well as
225
the literature. The schedule was reviewed and validated by local advisors, then
piloted with four adolescents to determine clarity. The semi-structured nature of the
schedule also allowed the researcher to probe in-depth [362] in order to obtain
adolescents’ ideas and perceptions about the most effective messages and
messengers to promote healthy diets, and in the order that worked for each group.
8.2.1.1 Recruitment and data collection
Adolescents were recruited through FBOs in peri-urban Suva. The FBOs were
appropriate for recruitment given that most participants were affiliated with one. In
2007, the population of Fiji was 837,271. Of which, 64% were Christian, 28%
Hindu, 6.3% Muslim, 0.3% Sikh and the rest either were ‘Other Religion’ or ‘No
Religion’ [374]. Most of these FBOs had active youth and/or women’s groups that
were able to facilitate recruitment.
Methodist5 and Assembly of God6 churches were used to recruit Indigenous Fijian
adolescents via their respective youth groups as they (especially Methodist) have the
highest membership of all Christian churches in Fiji. IndoFijian adolescents were
recruited via women’s groups within their FBOs mainly from Hindu7 and Muslim
religious organisations. The recruitment process is detailed in Figure 8.1. A letter
was sent to the head of each FBO seeking permission to recruit adolescents from the
relevant groups within their organisation and asking them to nominate a focal point
to facilitate recruitment and participation. Upon receiving approval for recruitment,
the researcher met with the focal points to further explain the study and the
recruitment process.
The focal point in each FBO group identified potential participants and invited them
to take part. The focal point then signed up interested participants and forwarded the
potential participants list and contacts to the researcher, along with information
regarding nominated date, venue and time for the focus group. Potential participants
who accepted the invitation to take part were then provided with Plain Language
5 Methodist membership comprised about 93% Indigenous Fijian population in 1996. 6 Assembly of God membership comprised about 6.3 % Indigenous Fijian population in 1996. 7 Hindu membership comprised 81.6% Indo-Fijian population and Muslim membership was 18.0%,
the remaining percentage accounts for others.
226
Statements (PLS) for themselves (see Appendix C) and parents (see Appendix D), as
well as a consent form (see Appendix E) for their parents to complete and return
prior to the focus group. Potential participants and their parents were informed that
participation was voluntary and that there were no penalties for declining the
invitation to take part, and were told of the non-disclosure of information. At the
nominated venue, prior to focus group discussions, the researcher collected parental
consent forms and distributed assent forms (see Appendix F) for participants to sign
and return.
The researcher made sure that participants met the criteria for the focus groups and
further explained the study and highlighted steps to maintain confidentiality of
participants. In particular: (1) non-disclosure of adolescents’ identity to researchers,
(2) request that participants respected the confidentiality of other focus group
members and (3) reporting results in such a way that individual participants could not
be identified. Participants’ questions and concerns were answered and/or addressed
and then focus groups were facilitated by the researcher with support from a co-
moderator. All focus groups were conducted in English. A co-moderator from the
same ethnic group as focus group participants audio-recorded and took relevant notes
during each session. Audio records were transcribed and translated (where necessary)
and used for analysis. At the end of each session, each participant was given FJD10
for transport reimbursement. Data from the focus group discussions were collected in
August 2012.
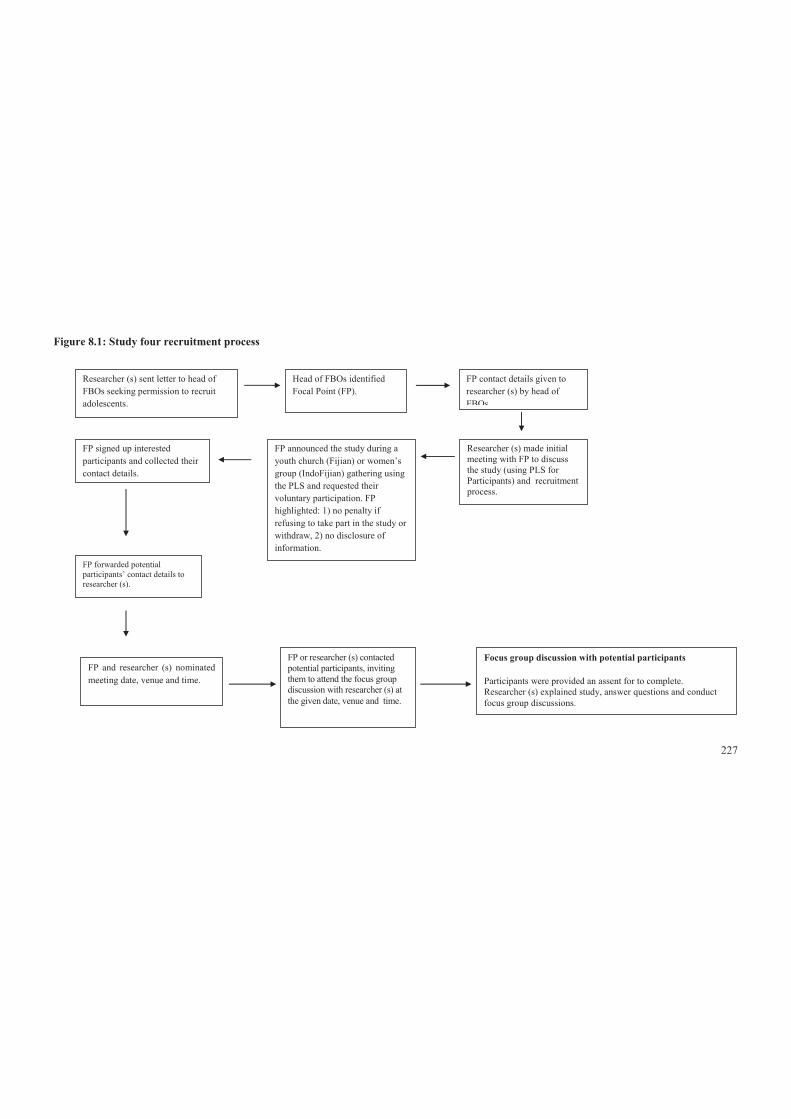
227
Figure 8.1: Study four recruitment process
Researcher (s) sent letter to head of FBOs seeking permission to recruit adolescents.
Head of FBOs identified Focal Point (FP).
FP contact details given to researcher (s) by head of FBOs.
Researcher (s) made initial meeting with FP to discuss the study (using PLS for Participants) and recruitment process.
FP announced the study during a youth church (Fijian) or women’s group (IndoFijian) gathering using the PLS and requested their voluntary participation. FP highlighted: 1) no penalty if refusing to take part in the study or withdraw, 2) no disclosure of information.
FP signed up interested participants and collected their contact details.
FP forwarded potential participants’ contact details to researcher (s).
FP and researcher (s) nominated meeting date, venue and time.
Focus group discussion with potential participants
Participants were provided an assent for to complete. Researcher (s) explained study, answer questions and conduct focus group discussions.
FP or researcher (s) contacted potential participants, inviting them to attend the focus group discussion with researcher (s) at the given date, venue and time.
228
8.2.2 Analysis
In detail, the process of data analysis was based on Green et al. [375], who
demonstrated four key steps that were needed to generate the best qualitative
evidence: (1) immersion in the data, (2) coding, (3) creating categories and (4)
identifying themes.
Following the focus groups, recordings were transcribed by hired transcribers and
translated by moderators (where necessary) and then entered by the PhD student into
NVivo 9 (qualitative data analysis software, QSR, Melbourne) for analysis. Constant
comparative analyses were used to identify: (1) the perceived benefits of and barriers
to a healthy diet and (2) messages, messengers and motivators for healthy diets
among adolescents. These findings were then analysed thematically.
Both constant comparative and thematic analyses were related to adolescents’
perceptions about perceived benefits of and barriers of and messages, messengers
and motivators in the consumption of: (1) SSB, (2) fruit and vegetable, and (3) meal
frequency (particularly breakfast and lunch). An additional area about females’
strategies to lose weight was explored, in particular their consumption behaviour
regarding high-energy snacks. This was because previous findings (study one) found
a statistically significant difference between females and males in their attempts to
lose weight (more females attempted to lose weight than males).
The process initially involved immersion in the data. The researcher spent hours
reading and re-reading the focus group transcripts and moderators’ notes and listened
to the audio recordings in order to understand the meanings associated with
participants’ statements. This helped the researcher to begin generating ideas about
emergent themes [376] and also helped to manage the large amount of data [375].
The second step employed in this data analysis was ‘coding’, which means ‘the
process of examining and organising the information contained in each interview and
the whole dataset’ [375]p548). The process initially involved tagging sections of
transcripts, sorting and coding the information [363, 377]. Codes are ‘descriptive
labels that applied to the segment of the transcript’ [375]. While there are different
methods used for coding, for this study, the researcher examined and organised the
229
responses of all individuals, identifying common responses within each through
colour coding the transcripts using markers. All the data from codes were than
collated, entered as nodes into NVivo 9 software and subjected to overall thematic
analysis.
Following the development of codes (nodes in NVivo 9), the researcher re-examined
the coded responses of individual participants and sorted them into categories to find
interrelationships between different nodes; this step is called ‘creating of categories’.
The process involved a detailed examination of codes, which were then categorised
by patterns and then organised into reasonable categories that summarised and
brought meaning to the text [375, 378]. In essence, this step is ‘concerned with
looking for a “good fit” between codes that share a relationship’ [375]p548), thus
considered creating an analytic category.
At times, there was a need to re-visit the coding process when contradictions and
exceptions (including misconceptions) became apparent or there were new
explanation(s) about a behaviour when categories were created. The new
explanations were then sorted into new categories. The categories were created until
‘saturation’ or when there was sufficient information or explanations for the target
dietary behaviours and the messages and motivators for healthy dietary patterns. By
doing so, the researcher also looked at interrelationships between different questions
to develop themes.
Eventually, the researcher was able to provide logical and explicit explanations of all
adolescents’ dietary behaviours and perspectives towards benefits, barriers, messages
and motivators to healthy dietary patterns, in all categories in the study. For this
study, this was the descriptive analysis, the first level of analysis used in this study.
The second level of analysis was identifying themes, which is also the final step of
the analysis process utilised in this study.
Green et al. [375] stated that: ‘The generation of themes requires moving beyond a
descriptive of a range of categories; it involves shifting to an explanation or, even
better, an interpretation of the issue under investigation’. The researcher, together
with supervisors, compared explanations and interpretations of themes generated
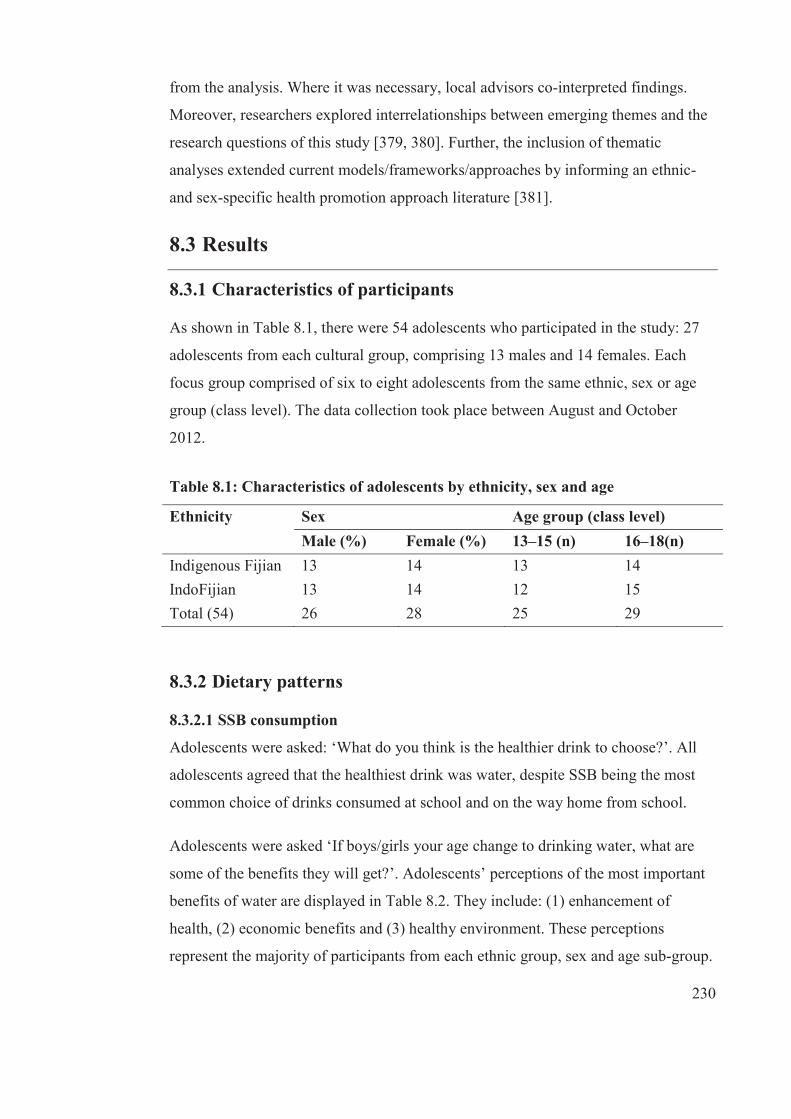
230
from the analysis. Where it was necessary, local advisors co-interpreted findings.
Moreover, researchers explored interrelationships between emerging themes and the
research questions of this study [379, 380]. Further, the inclusion of thematic
analyses extended current models/frameworks/approaches by informing an ethnic-
and sex-specific health promotion approach literature [381].
8.3 Results
8.3.1 Characteristics of participants
As shown in Table 8.1, there were 54 adolescents who participated in the study: 27
adolescents from each cultural group, comprising 13 males and 14 females. Each
focus group comprised of six to eight adolescents from the same ethnic, sex or age
group (class level). The data collection took place between August and October
2012.
Table 8.1: Characteristics of adolescents by ethnicity, sex and age
Ethnicity Sex Age group (class level) Male (%) Female (%) 13–15 (n) 16–18(n) Indigenous Fijian 13 14 13 14 IndoFijian 13 14 12 15 Total (54) 26 28 25 29
8.3.2 Dietary patterns
8.3.2.1 SSB consumption
Adolescents were asked: ‘What do you think is the healthier drink to choose?’. All
adolescents agreed that the healthiest drink was water, despite SSB being the most
common choice of drinks consumed at school and on the way home from school.
Adolescents were asked ‘If boys/girls your age change to drinking water, what are
some of the benefits they will get?’. Adolescents’ perceptions of the most important
benefits of water are displayed in Table 8.2. They include: (1) enhancement of
health, (2) economic benefits and (3) healthy environment. These perceptions
represent the majority of participants from each ethnic group, sex and age sub-group.
231
Adolescents clearly articulated the perceived benefits of drinking water in preventing
dehydration, cleaning of the digestive system and the general feeling of being strong
throughout the day. Some participants suggested contrasting ideas pertaining to the
benefits of drinking water, including the negative effects of SSB, which were thought
to make an individual sick or lazy and contribute to obesity. The theme of
availability and convenience of less healthy choices (SSB) was well articulated by
adolescents.
There is some contradictory information regarding water consumption. While some
adolescents indicated that water was considered dirty at times, most participants
believed that drinking water was convenient, cheap and readily accessible at school.
Cost benefit of water was articulated by some students through saving of money as
water is free rather than purchasing SSB. Further, adolescents discussed the
environmental advantages of drinking water, with ‘less pollution’ from the
production of SSB cans and bottles, which causes factory gas emission to the
atmosphere.
The major barriers to drinking water at school, as perceived by the adolescents, are
presented in Table 8.2. There was a strong theme of peer pressure being a barrier,
with the majority of the adolescents from all ethnic groups, sex and class level
indicating that their peers influenced them to drink SSB at school. Peer pressure was
demonstrated in the availability and pooling of unmonitored spending money among
peers, providing ready access to the purchase of SSB. Adolescents also indicated TV
advertisements for SSB, in particular, new SSB, were a barrier to drinking water in
school because they wanted to try out new products in the market.
Another important theme that emerged from the findings of this study is taste
preference. Most of the participants indicated that they had a strong preference for
the taste of SSB compared to water. Participants commonly used descriptive words
such as ‘sweet’, tastier’, ‘refreshing’, ‘gassy (fizzy)’, ‘cooling’ and ‘flavourish’.
Adolescents also described their habit of drinking soft drinks as a barrier to changing
to water. Some participants noted that they became more addicted to drinking SSB as
they grew older.

232
Table 8.2: Most common perceived benefits of and barriers to water
consumption at school
Most common benefits Typical comments Enhancement of health Prevent dehydration Cleans digestive system Feeling strong
‘Our body needs water so that we don’t get dehydrated easily’ [INDFM13] ‘It washes you; it cleans your digestive system’ [INDFF03] ‘It will make our body strong’ [IDFM04]
Cost benefits Save money
‘We can save money rather than going to the shops to buy fizzy drinks’ [IDFF09] ‘Water saves money because it’s free’ [INDFM02]
Healthy environment Less pollution Healthy surrounding
‘Mass production of fizzy drinks will decrease as less gas released to the atmosphere, there will be less fizzy drinks … we are going to drink more water’ [INDFF04]
Common barriers to drinking water
Typical comments
Peer pressure, TV advertising and lack of support Peer pressure Spending money Increased TV advertisements on SSB Lack of school support
‘Friends persuade us to drink SSB’ [INDFM 07] ‘We put in some money like give 50 cents, 20 cents so we can just put in and buy a drink (SSB)’ [IDFM10] ‘Uhmm, there are new drinks that arrive in Fiji and it’s advertise on TV, when our school sells that drink, we all went to buy the new drink … it’s new and everybody wants to try’ [IDFF01]
Convenience of less healthier choices (SSB) Availability of SSB at school canteens
‘Because the school canteen only sells it’ [IDFM09]
Taste and personal preference Preferred taste for SSB Developed habit Addiction
‘SSB tastier than water’ [INDFF07] ‘It’s (drinking SSB) a habit … because when they were small they started drinking SSB and growing up, they are used to them’ [INDFM05] ‘It’s hard to when I’m addicted to something; it’s hard to leave the drinks (SSB) so it is easy for me to stick to the Coke’ [IDFM07]
233
Adolescents were asked, ‘What are some of the barriers to drinking water on the way
home from school?’ The most common barriers to drinking water on the way home
from school were similar to those during the school day: convenience of less
healthier choices of drinks, taste preference for SSB and peer pressure. A moderate
number of adolescents also indicated that hot weather increased their choice for SSB
on the way home (see Table 8.3). These four themes were expressed by participants
in each ethnic, sex and age (class level) group.
A contrasting theme with water about the taste preference for SSB in terms of
quenching the thirst was noticed. More adolescents reported that SSB quenched thirst
and water could not. An overlapping theme was well articulated by adolescents
between the influences of peers and drinking SSB. Adolescents clearly indicated that
‘going in groups’ or peer influence contributed to purchasing and consumption of
SBBs, in particular, through pooling of spending money and fear of friends’ negative
perceptions about drinking water.
While all groups shared these six themes, there were some differences, especially
among sex and age (class level) groups. Female adolescents drank SSB because they
wanted to be seen as part of the group, while the males tended to drink SSB as a way
to attract opposite sex. A number of younger adolescents (13–15 years) indicated that
they pooled their spending money on the way home to buy SSB; this was not evident
among older adolescents.
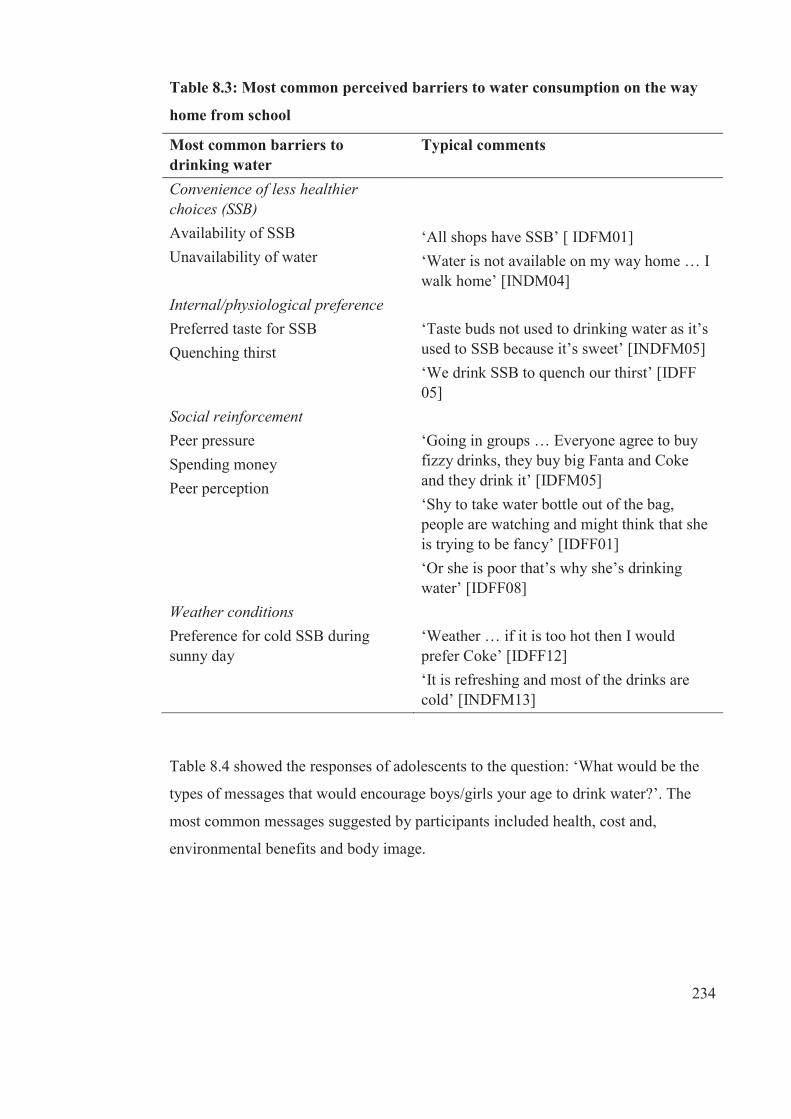
234
Table 8.3: Most common perceived barriers to water consumption on the way
home from school
Most common barriers to drinking water
Typical comments
Convenience of less healthier choices (SSB) Availability of SSB Unavailability of water
‘All shops have SSB’ [ IDFM01] ‘Water is not available on my way home … I walk home’ [INDM04]
Internal/physiological preference Preferred taste for SSB Quenching thirst
‘Taste buds not used to drinking water as it’s used to SSB because it’s sweet’ [INDFM05] ‘We drink SSB to quench our thirst’ [IDFF 05]
Social reinforcement Peer pressure Spending money Peer perception
‘Going in groups … Everyone agree to buy fizzy drinks, they buy big Fanta and Coke and they drink it’ [IDFM05] ‘Shy to take water bottle out of the bag, people are watching and might think that she is trying to be fancy’ [IDFF01] ‘Or she is poor that’s why she’s drinking water’ [IDFF08]
Weather conditions Preference for cold SSB during sunny day
‘Weather … if it is too hot then I would prefer Coke’ [IDFF12] ‘It is refreshing and most of the drinks are cold’ [INDFM13]
Table 8.4 showed the responses of adolescents to the question: ‘What would be the
types of messages that would encourage boys/girls your age to drink water?’. The
most common messages suggested by participants included health, cost and,
environmental benefits and body image.
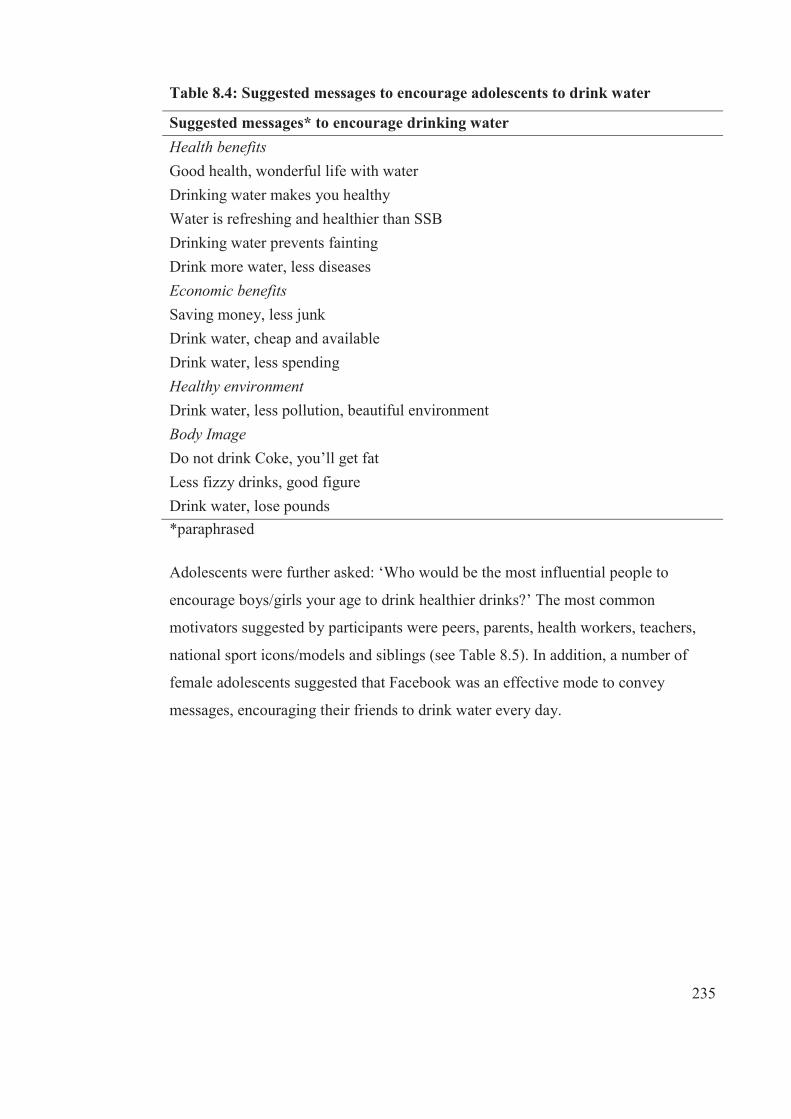
235
Table 8.4: Suggested messages to encourage adolescents to drink water
Suggested messages* to encourage drinking water Health benefits Good health, wonderful life with water Drinking water makes you healthy Water is refreshing and healthier than SSB Drinking water prevents fainting Drink more water, less diseases Economic benefits Saving money, less junk Drink water, cheap and available Drink water, less spending Healthy environment Drink water, less pollution, beautiful environment Body Image Do not drink Coke, you’ll get fat Less fizzy drinks, good figure Drink water, lose pounds *paraphrased
Adolescents were further asked: ‘Who would be the most influential people to
encourage boys/girls your age to drink healthier drinks?’ The most common
motivators suggested by participants were peers, parents, health workers, teachers,
national sport icons/models and siblings (see Table 8.5). In addition, a number of
female adolescents suggested that Facebook was an effective mode to convey
messages, encouraging their friends to drink water every day.
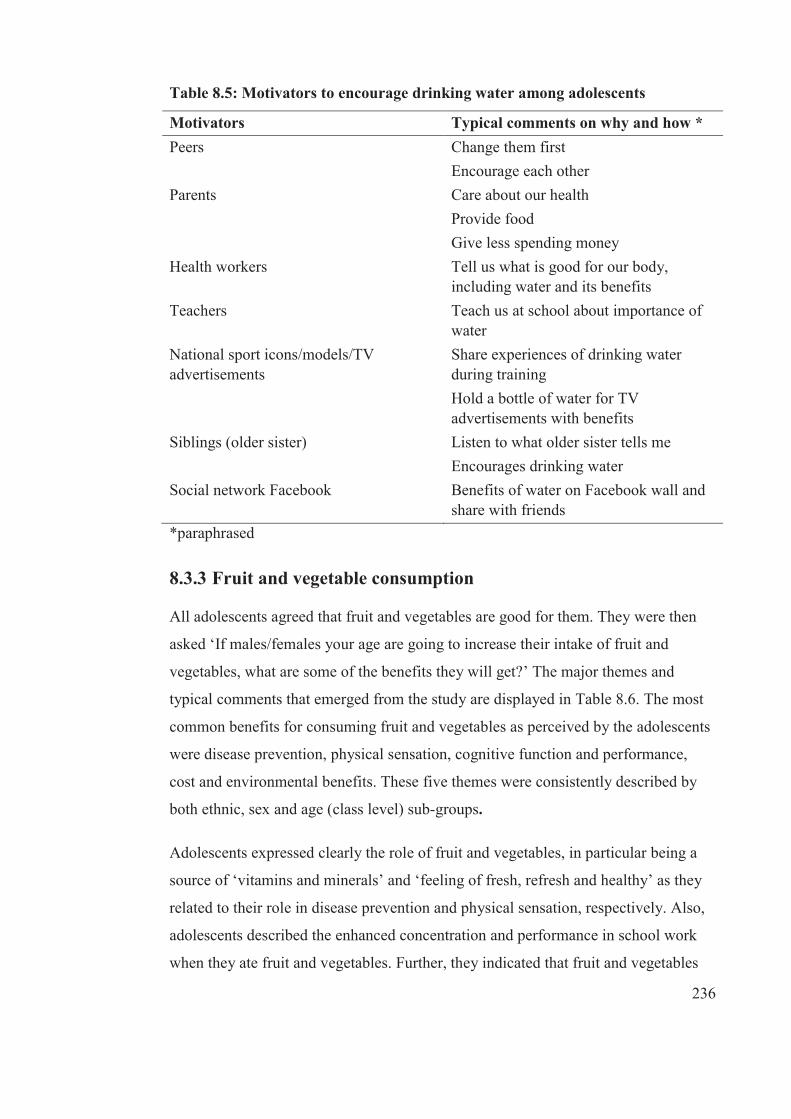
236
Table 8.5: Motivators to encourage drinking water among adolescents
Motivators Typical comments on why and how * Peers Change them first
Encourage each other Parents Care about our health
Provide food Give less spending money
Health workers Tell us what is good for our body, including water and its benefits
Teachers Teach us at school about importance of water
National sport icons/models/TV advertisements
Share experiences of drinking water during training Hold a bottle of water for TV advertisements with benefits
Siblings (older sister) Listen to what older sister tells me Encourages drinking water
Social network Facebook Benefits of water on Facebook wall and share with friends
*paraphrased
8.3.3 Fruit and vegetable consumption
All adolescents agreed that fruit and vegetables are good for them. They were then
asked ‘If males/females your age are going to increase their intake of fruit and
vegetables, what are some of the benefits they will get?’ The major themes and
typical comments that emerged from the study are displayed in Table 8.6. The most
common benefits for consuming fruit and vegetables as perceived by the adolescents
were disease prevention, physical sensation, cognitive function and performance,
cost and environmental benefits. These five themes were consistently described by
both ethnic, sex and age (class level) sub-groups.
Adolescents expressed clearly the role of fruit and vegetables, in particular being a
source of ‘vitamins and minerals’ and ‘feeling of fresh, refresh and healthy’ as they
related to their role in disease prevention and physical sensation, respectively. Also,
adolescents described the enhanced concentration and performance in school work
when they ate fruit and vegetables. Further, they indicated that fruit and vegetables
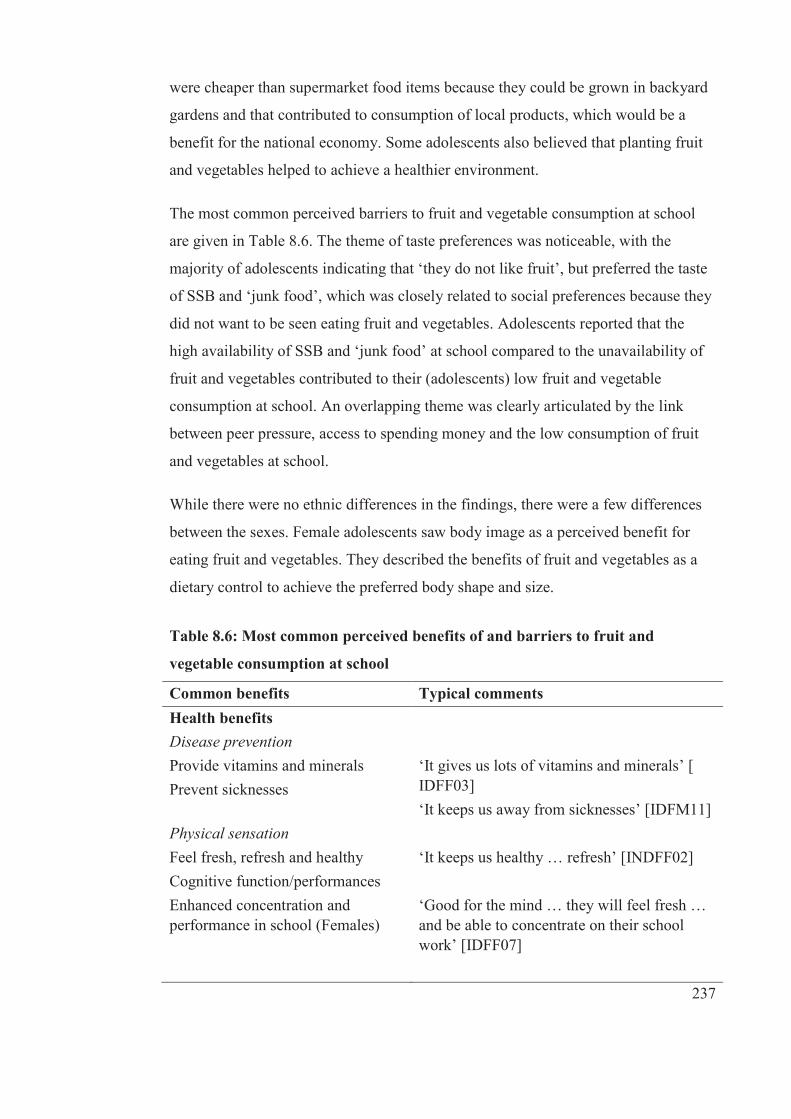
237
were cheaper than supermarket food items because they could be grown in backyard
gardens and that contributed to consumption of local products, which would be a
benefit for the national economy. Some adolescents also believed that planting fruit
and vegetables helped to achieve a healthier environment.
The most common perceived barriers to fruit and vegetable consumption at school
are given in Table 8.6. The theme of taste preferences was noticeable, with the
majority of adolescents indicating that ‘they do not like fruit’, but preferred the taste
of SSB and ‘junk food’, which was closely related to social preferences because they
did not want to be seen eating fruit and vegetables. Adolescents reported that the
high availability of SSB and ‘junk food’ at school compared to the unavailability of
fruit and vegetables contributed to their (adolescents) low fruit and vegetable
consumption at school. An overlapping theme was clearly articulated by the link
between peer pressure, access to spending money and the low consumption of fruit
and vegetables at school.
While there were no ethnic differences in the findings, there were a few differences
between the sexes. Female adolescents saw body image as a perceived benefit for
eating fruit and vegetables. They described the benefits of fruit and vegetables as a
dietary control to achieve the preferred body shape and size.
Table 8.6: Most common perceived benefits of and barriers to fruit and
vegetable consumption at school
Common benefits Typical comments Health benefits
Disease prevention Provide vitamins and minerals Prevent sicknesses
‘It gives us lots of vitamins and minerals’ [ IDFF03] ‘It keeps us away from sicknesses’ [IDFM11]
Physical sensation Feel fresh, refresh and healthy
‘It keeps us healthy … refresh’ [INDFF02]
Cognitive function/performances Enhanced concentration and performance in school (Females)
‘Good for the mind … they will feel fresh … and be able to concentrate on their school work’ [IDFF07]
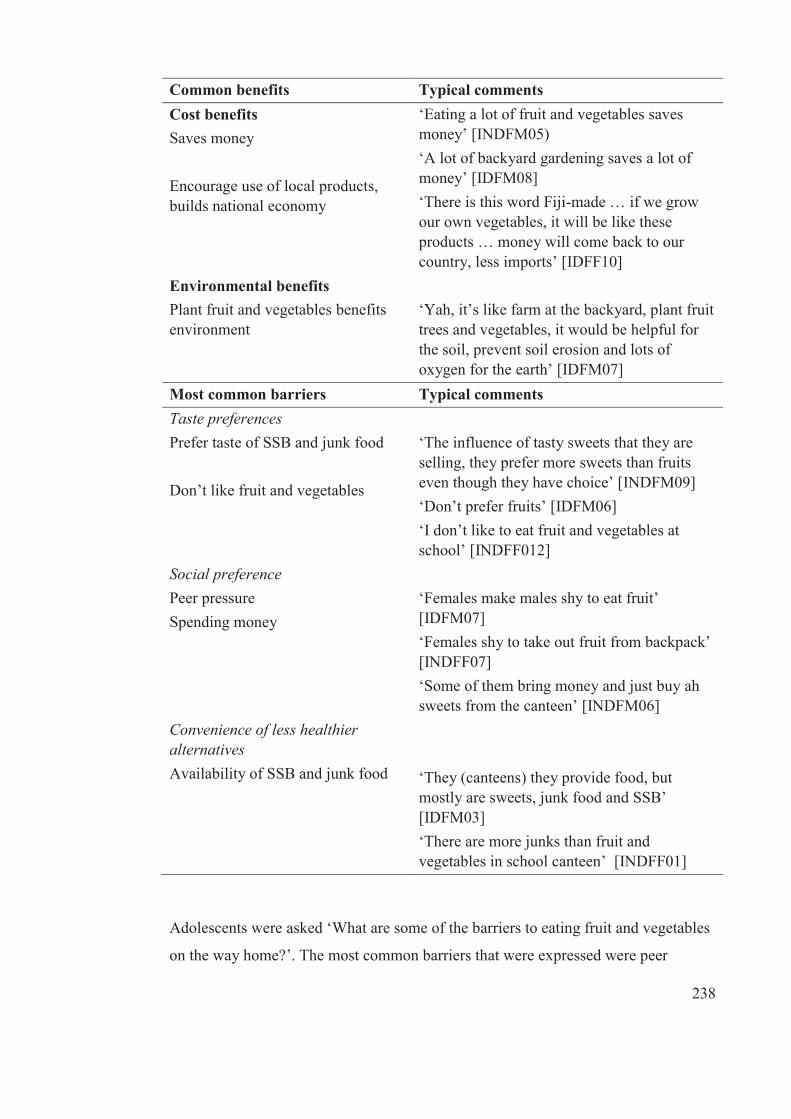
238
Common benefits Typical comments Cost benefits Saves money Encourage use of local products, builds national economy
‘Eating a lot of fruit and vegetables saves money’ [INDFM05) ‘A lot of backyard gardening saves a lot of money’ [IDFM08] ‘There is this word Fiji-made … if we grow our own vegetables, it will be like these products … money will come back to our country, less imports’ [IDFF10]
Environmental benefits Plant fruit and vegetables benefits environment
‘Yah, it’s like farm at the backyard, plant fruit trees and vegetables, it would be helpful for the soil, prevent soil erosion and lots of oxygen for the earth’ [IDFM07]
Most common barriers Typical comments Taste preferences Prefer taste of SSB and junk food Don’t like fruit and vegetables
‘The influence of tasty sweets that they are selling, they prefer more sweets than fruits even though they have choice’ [INDFM09] ‘Don’t prefer fruits’ [IDFM06] ‘I don’t like to eat fruit and vegetables at school’ [INDFF012]
Social preference Peer pressure Spending money
‘Females make males shy to eat fruit’ [IDFM07] ‘Females shy to take out fruit from backpack’ [INDFF07] ‘Some of them bring money and just buy ah sweets from the canteen’ [INDFM06]
Convenience of less healthier alternatives Availability of SSB and junk food
‘They (canteens) they provide food, but mostly are sweets, junk food and SSB’ [IDFM03] ‘There are more junks than fruit and vegetables in school canteen’ [INDFF01]
Adolescents were asked ‘What are some of the barriers to eating fruit and vegetables
on the way home?’. The most common barriers that were expressed were peer
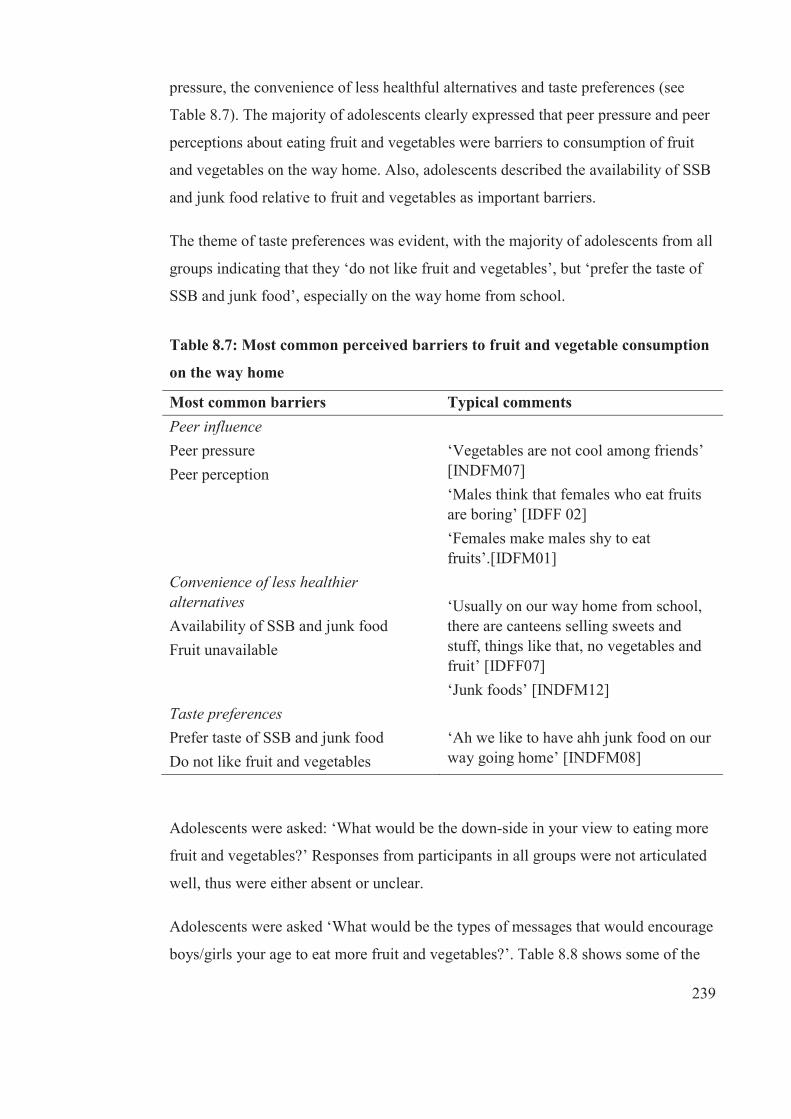
239
pressure, the convenience of less healthful alternatives and taste preferences (see
Table 8.7). The majority of adolescents clearly expressed that peer pressure and peer
perceptions about eating fruit and vegetables were barriers to consumption of fruit
and vegetables on the way home. Also, adolescents described the availability of SSB
and junk food relative to fruit and vegetables as important barriers.
The theme of taste preferences was evident, with the majority of adolescents from all
groups indicating that they ‘do not like fruit and vegetables’, but ‘prefer the taste of
SSB and junk food’, especially on the way home from school.
Table 8.7: Most common perceived barriers to fruit and vegetable consumption
on the way home
Most common barriers Typical comments Peer influence Peer pressure Peer perception
‘Vegetables are not cool among friends’ [INDFM07] ‘Males think that females who eat fruits are boring’ [IDFF 02] ‘Females make males shy to eat fruits’.[IDFM01]
Convenience of less healthier alternatives Availability of SSB and junk food Fruit unavailable
‘Usually on our way home from school, there are canteens selling sweets and stuff, things like that, no vegetables and fruit’ [IDFF07] ‘Junk foods’ [INDFM12]
Taste preferences Prefer taste of SSB and junk food Do not like fruit and vegetables
‘Ah we like to have ahh junk food on our way going home’ [INDFM08]
Adolescents were asked: ‘What would be the down-side in your view to eating more
fruit and vegetables?’ Responses from participants in all groups were not articulated
well, thus were either absent or unclear.
Adolescents were asked ‘What would be the types of messages that would encourage
boys/girls your age to eat more fruit and vegetables?’. Table 8.8 shows some of the
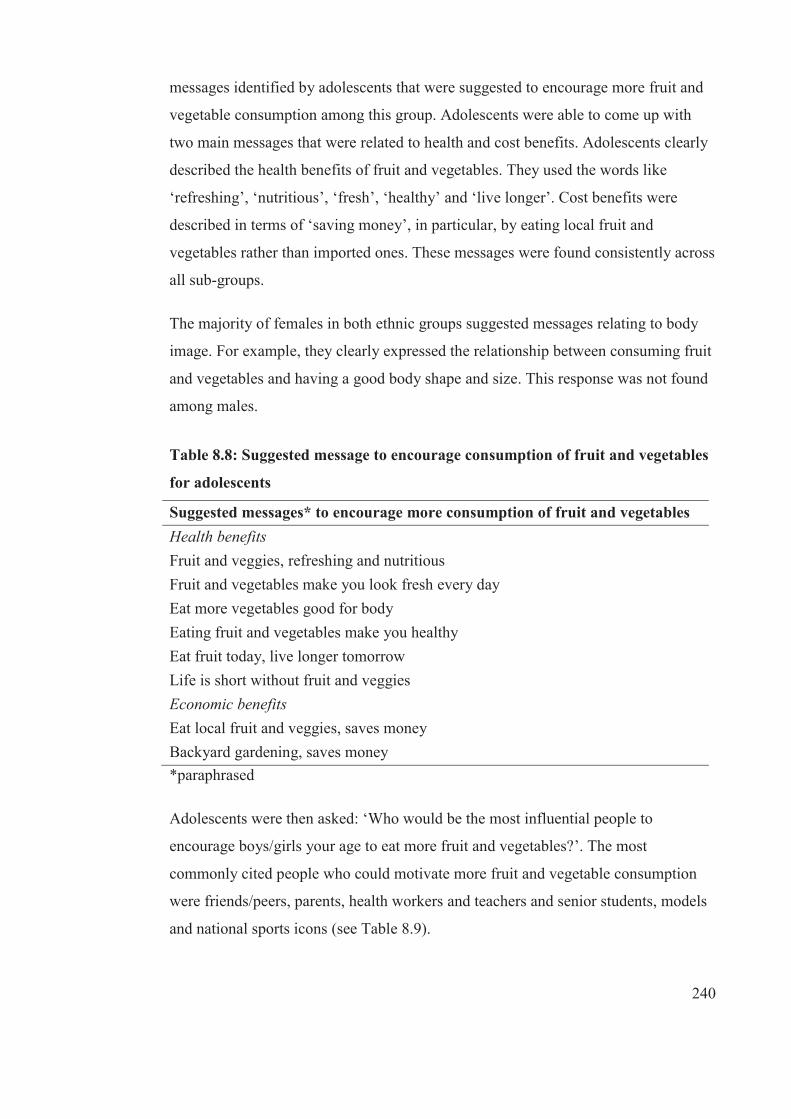
240
messages identified by adolescents that were suggested to encourage more fruit and
vegetable consumption among this group. Adolescents were able to come up with
two main messages that were related to health and cost benefits. Adolescents clearly
described the health benefits of fruit and vegetables. They used the words like
‘refreshing’, ‘nutritious’, ‘fresh’, ‘healthy’ and ‘live longer’. Cost benefits were
described in terms of ‘saving money’, in particular, by eating local fruit and
vegetables rather than imported ones. These messages were found consistently across
all sub-groups.
The majority of females in both ethnic groups suggested messages relating to body
image. For example, they clearly expressed the relationship between consuming fruit
and vegetables and having a good body shape and size. This response was not found
among males.
Table 8.8: Suggested message to encourage consumption of fruit and vegetables
for adolescents
Suggested messages* to encourage more consumption of fruit and vegetables Health benefits Fruit and veggies, refreshing and nutritious Fruit and vegetables make you look fresh every day Eat more vegetables good for body Eating fruit and vegetables make you healthy Eat fruit today, live longer tomorrow Life is short without fruit and veggies Economic benefits Eat local fruit and veggies, saves money Backyard gardening, saves money *paraphrased
Adolescents were then asked: ‘Who would be the most influential people to
encourage boys/girls your age to eat more fruit and vegetables?’. The most
commonly cited people who could motivate more fruit and vegetable consumption
were friends/peers, parents, health workers and teachers and senior students, models
and national sports icons (see Table 8.9).
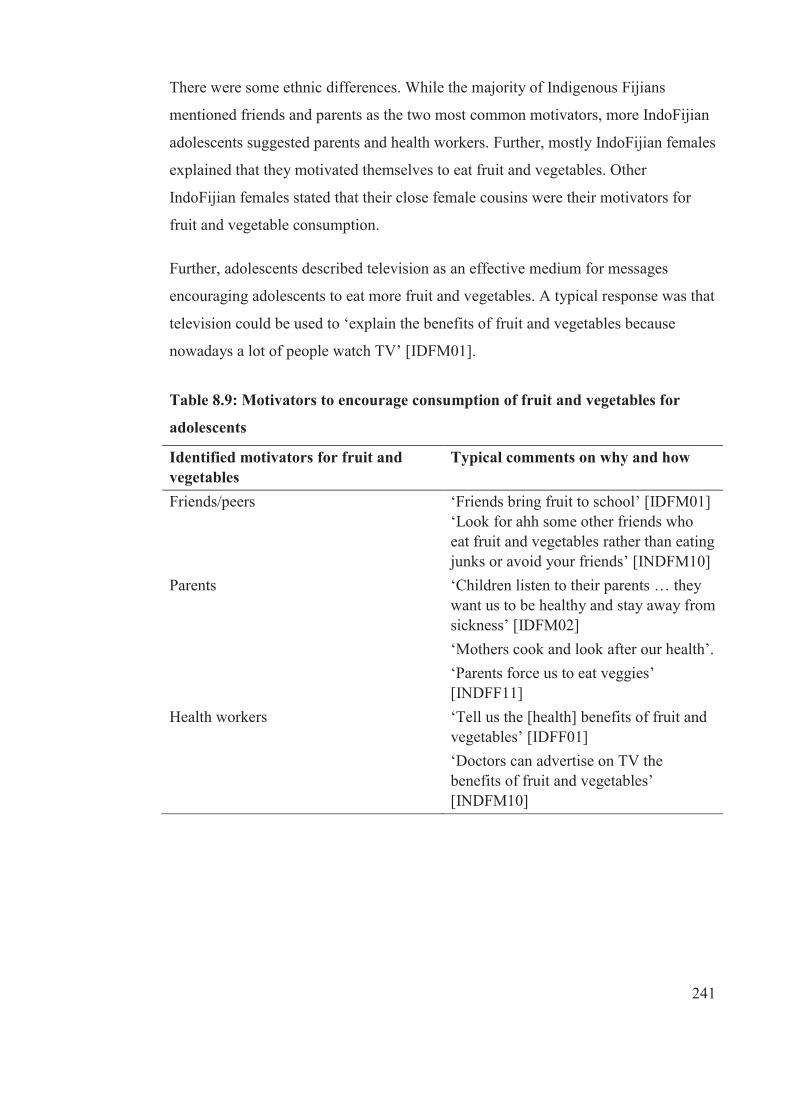
241
There were some ethnic differences. While the majority of Indigenous Fijians
mentioned friends and parents as the two most common motivators, more IndoFijian
adolescents suggested parents and health workers. Further, mostly IndoFijian females
explained that they motivated themselves to eat fruit and vegetables. Other
IndoFijian females stated that their close female cousins were their motivators for
fruit and vegetable consumption.
Further, adolescents described television as an effective medium for messages
encouraging adolescents to eat more fruit and vegetables. A typical response was that
television could be used to ‘explain the benefits of fruit and vegetables because
nowadays a lot of people watch TV’ [IDFM01].
Table 8.9: Motivators to encourage consumption of fruit and vegetables for
adolescents
Identified motivators for fruit and vegetables
Typical comments on why and how
Friends/peers ‘Friends bring fruit to school’ [IDFM01] ‘Look for ahh some other friends who eat fruit and vegetables rather than eating junks or avoid your friends’ [INDFM10]
Parents ‘Children listen to their parents … they want us to be healthy and stay away from sickness’ [IDFM02] ‘Mothers cook and look after our health’. ‘Parents force us to eat veggies’ [INDFF11]
Health workers ‘Tell us the [health] benefits of fruit and vegetables’ [IDFF01] ‘Doctors can advertise on TV the benefits of fruit and vegetables’ [INDFM10]
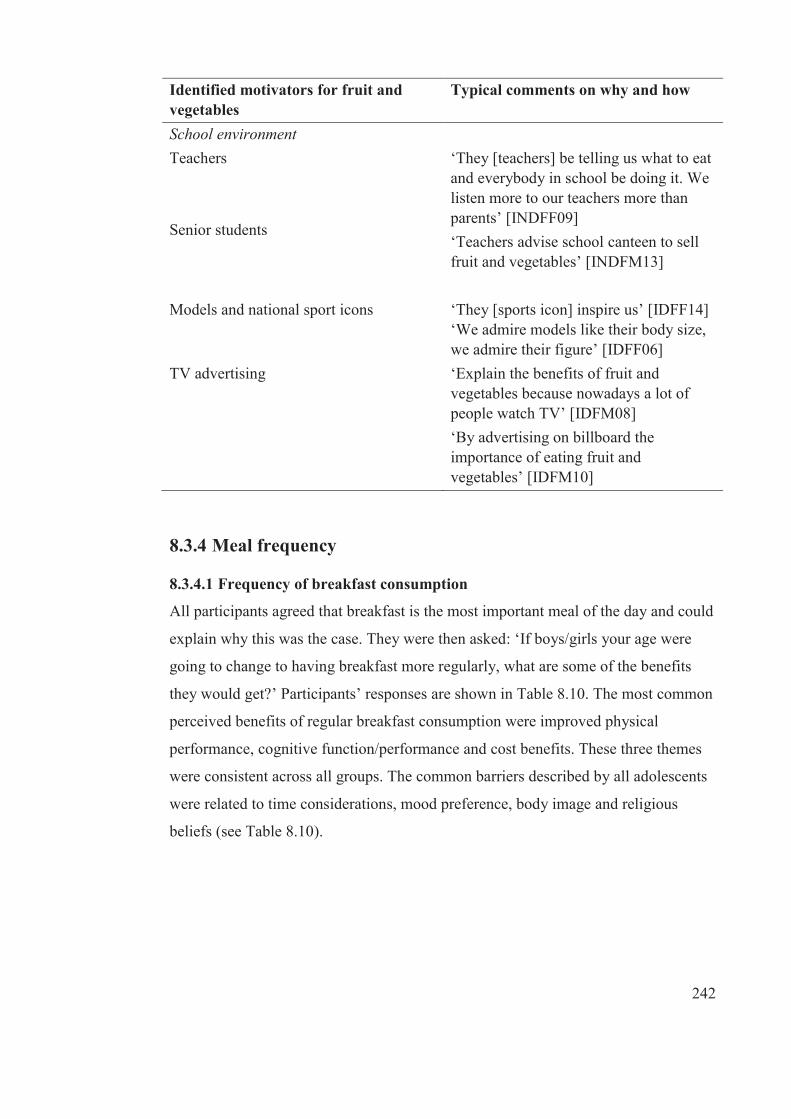
242
Identified motivators for fruit and vegetables
Typical comments on why and how
School environment Teachers Senior students
‘They [teachers] be telling us what to eat and everybody in school be doing it. We listen more to our teachers more than parents’ [INDFF09] ‘Teachers advise school canteen to sell fruit and vegetables’ [INDFM13]
Models and national sport icons ‘They [sports icon] inspire us’ [IDFF14] ‘We admire models like their body size, we admire their figure’ [IDFF06]
TV advertising ‘Explain the benefits of fruit and vegetables because nowadays a lot of people watch TV’ [IDFM08] ‘By advertising on billboard the importance of eating fruit and vegetables’ [IDFM10]
8.3.4 Meal frequency
8.3.4.1 Frequency of breakfast consumption
All participants agreed that breakfast is the most important meal of the day and could
explain why this was the case. They were then asked: ‘If boys/girls your age were
going to change to having breakfast more regularly, what are some of the benefits
they would get?’ Participants’ responses are shown in Table 8.10. The most common
perceived benefits of regular breakfast consumption were improved physical
performance, cognitive function/performance and cost benefits. These three themes
were consistent across all groups. The common barriers described by all adolescents
were related to time considerations, mood preference, body image and religious
beliefs (see Table 8.10).
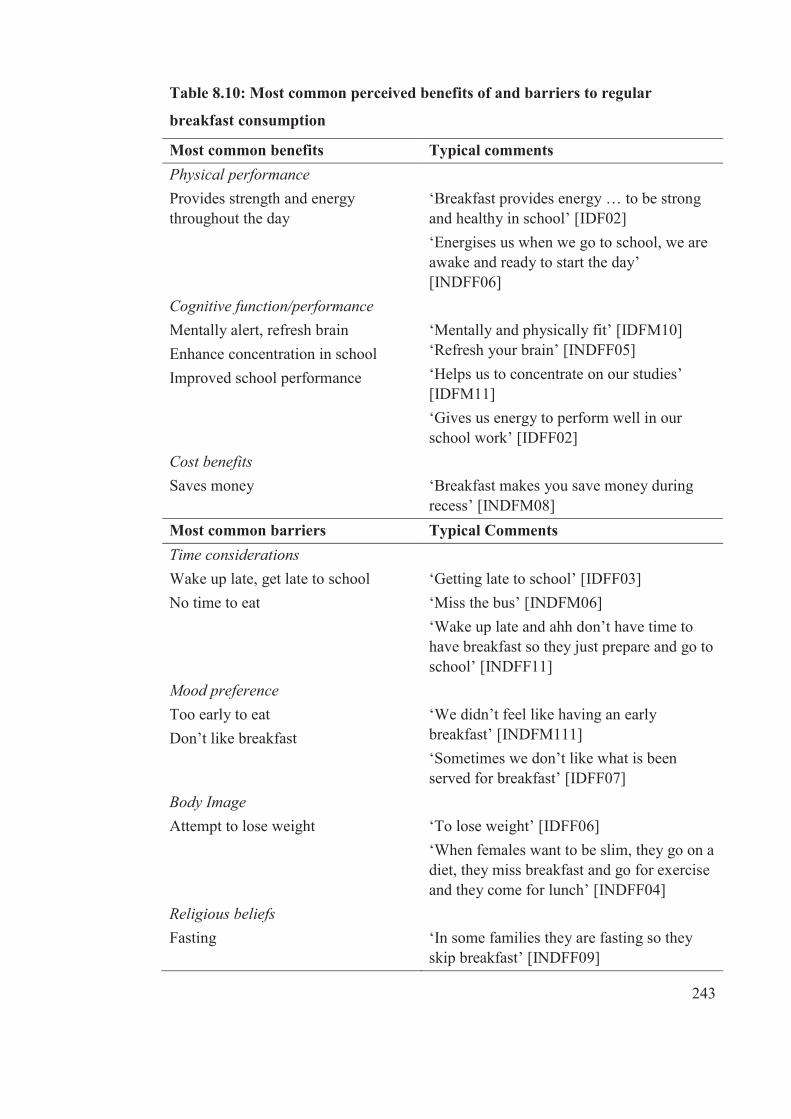
243
Table 8.10: Most common perceived benefits of and barriers to regular
breakfast consumption
Most common benefits Typical comments Physical performance Provides strength and energy throughout the day
‘Breakfast provides energy … to be strong and healthy in school’ [IDF02] ‘Energises us when we go to school, we are awake and ready to start the day’ [INDFF06]
Cognitive function/performance Mentally alert, refresh brain Enhance concentration in school Improved school performance
‘Mentally and physically fit’ [IDFM10] ‘Refresh your brain’ [INDFF05] ‘Helps us to concentrate on our studies’ [IDFM11] ‘Gives us energy to perform well in our school work’ [IDFF02]
Cost benefits Saves money
‘Breakfast makes you save money during recess’ [INDFM08]
Most common barriers Typical Comments Time considerations Wake up late, get late to school No time to eat
‘Getting late to school’ [IDFF03] ‘Miss the bus’ [INDFM06] ‘Wake up late and ahh don’t have time to have breakfast so they just prepare and go to school’ [INDFF11]
Mood preference Too early to eat Don’t like breakfast
‘We didn’t feel like having an early breakfast’ [INDFM111] ‘Sometimes we don’t like what is been served for breakfast’ [IDFF07]
Body Image Attempt to lose weight
‘To lose weight’ [IDFF06] ‘When females want to be slim, they go on a diet, they miss breakfast and go for exercise and they come for lunch’ [INDFF04]
Religious beliefs Fasting
‘In some families they are fasting so they skip breakfast’ [INDFF09]
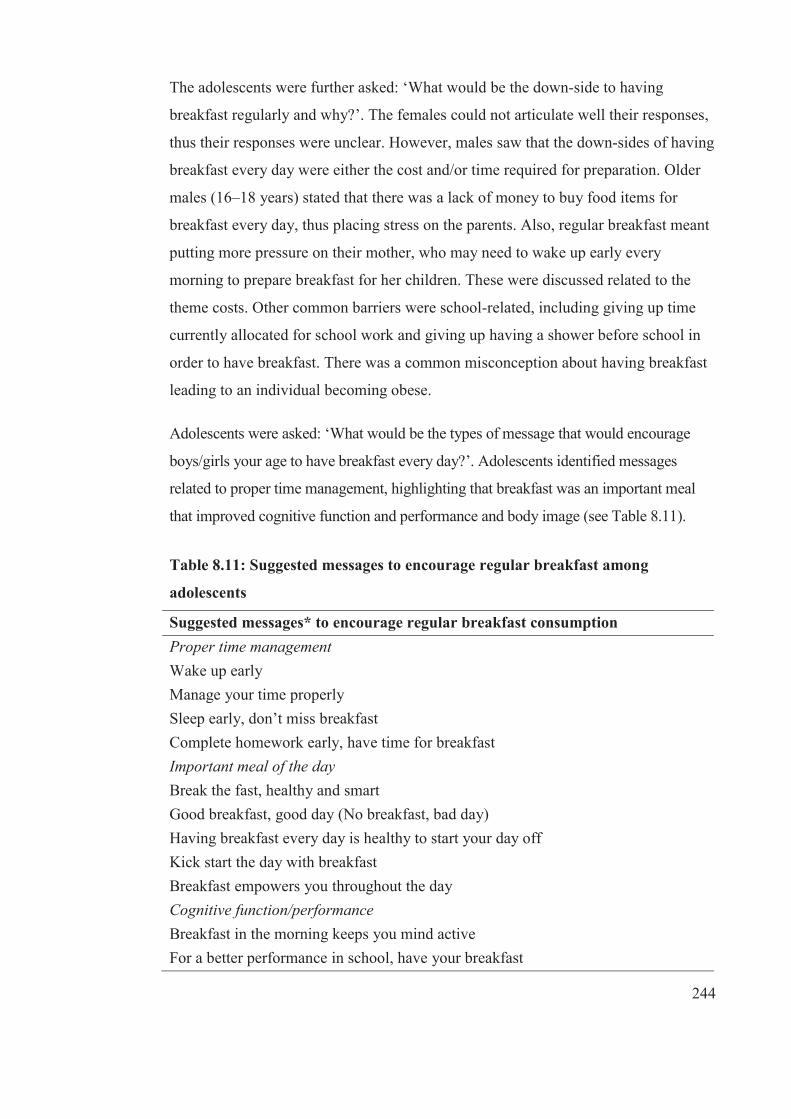
244
The adolescents were further asked: ‘What would be the down-side to having
breakfast regularly and why?’. The females could not articulate well their responses,
thus their responses were unclear. However, males saw that the down-sides of having
breakfast every day were either the cost and/or time required for preparation. Older
males (16–18 years) stated that there was a lack of money to buy food items for
breakfast every day, thus placing stress on the parents. Also, regular breakfast meant
putting more pressure on their mother, who may need to wake up early every
morning to prepare breakfast for her children. These were discussed related to the
theme costs. Other common barriers were school-related, including giving up time
currently allocated for school work and giving up having a shower before school in
order to have breakfast. There was a common misconception about having breakfast
leading to an individual becoming obese.
Adolescents were asked: ‘What would be the types of message that would encourage
boys/girls your age to have breakfast every day?’. Adolescents identified messages
related to proper time management, highlighting that breakfast was an important meal
that improved cognitive function and performance and body image (see Table 8.11).
Table 8.11: Suggested messages to encourage regular breakfast among
adolescents
Suggested messages* to encourage regular breakfast consumption Proper time management Wake up early Manage your time properly Sleep early, don’t miss breakfast Complete homework early, have time for breakfast Important meal of the day Break the fast, healthy and smart Good breakfast, good day (No breakfast, bad day) Having breakfast every day is healthy to start your day off Kick start the day with breakfast Breakfast empowers you throughout the day Cognitive function/performance Breakfast in the morning keeps you mind active For a better performance in school, have your breakfast
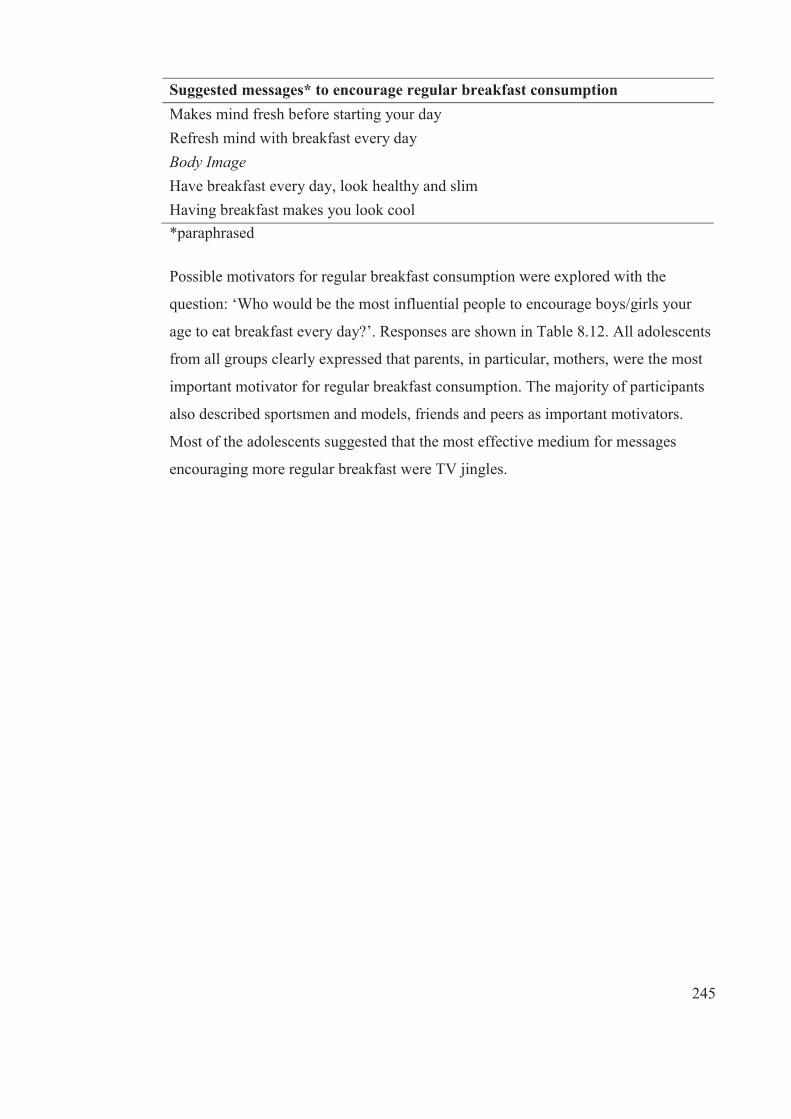
245
Suggested messages* to encourage regular breakfast consumption Makes mind fresh before starting your day Refresh mind with breakfast every day Body Image Have breakfast every day, look healthy and slim Having breakfast makes you look cool *paraphrased
Possible motivators for regular breakfast consumption were explored with the
question: ‘Who would be the most influential people to encourage boys/girls your
age to eat breakfast every day?’. Responses are shown in Table 8.12. All adolescents
from all groups clearly expressed that parents, in particular, mothers, were the most
important motivator for regular breakfast consumption. The majority of participants
also described sportsmen and models, friends and peers as important motivators.
Most of the adolescents suggested that the most effective medium for messages
encouraging more regular breakfast were TV jingles.
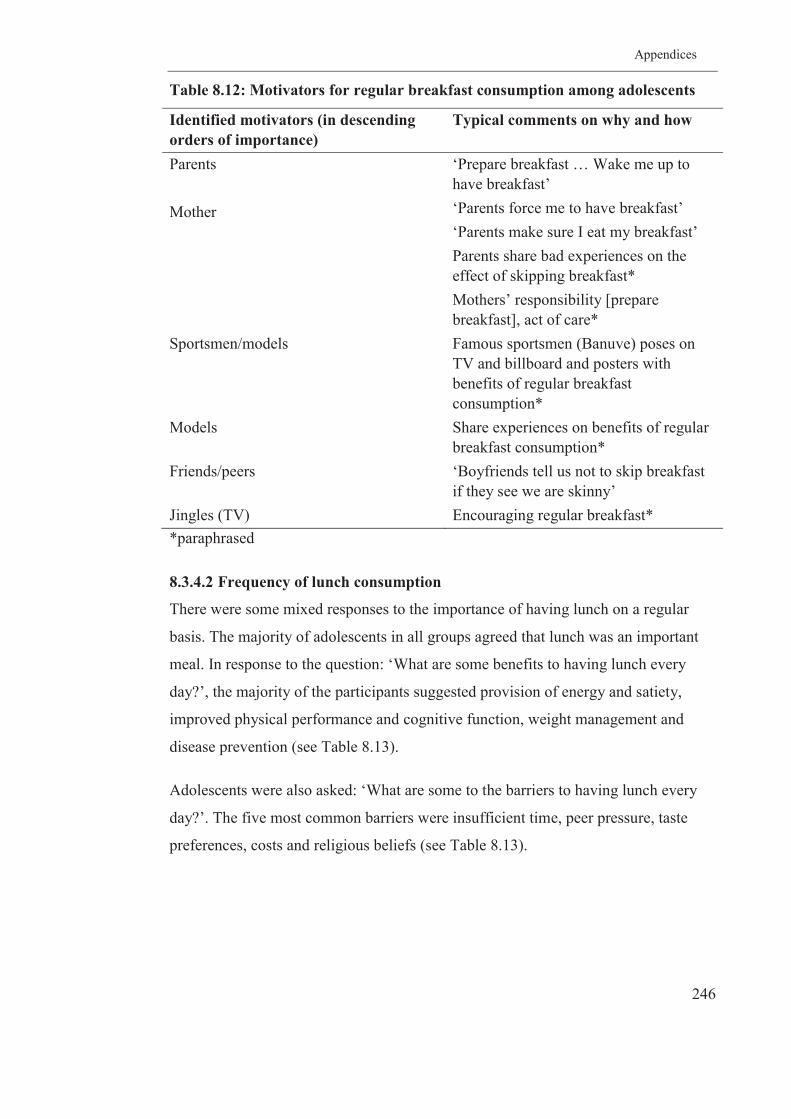
Appendices
246
Table 8.12: Motivators for regular breakfast consumption among adolescents
Identified motivators (in descending orders of importance)
Typical comments on why and how
Parents Mother
‘Prepare breakfast … Wake me up to have breakfast’ ‘Parents force me to have breakfast’ ‘Parents make sure I eat my breakfast’ Parents share bad experiences on the effect of skipping breakfast* Mothers’ responsibility [prepare breakfast], act of care*
Sportsmen/models Famous sportsmen (Banuve) poses on TV and billboard and posters with benefits of regular breakfast consumption*
Models Share experiences on benefits of regular breakfast consumption*
Friends/peers ‘Boyfriends tell us not to skip breakfast if they see we are skinny’
Jingles (TV) Encouraging regular breakfast* *paraphrased
8.3.4.2 Frequency of lunch consumption
There were some mixed responses to the importance of having lunch on a regular
basis. The majority of adolescents in all groups agreed that lunch was an important
meal. In response to the question: ‘What are some benefits to having lunch every
day?’, the majority of the participants suggested provision of energy and satiety,
improved physical performance and cognitive function, weight management and
disease prevention (see Table 8.13).
Adolescents were also asked: ‘What are some to the barriers to having lunch every
day?’. The five most common barriers were insufficient time, peer pressure, taste
preferences, costs and religious beliefs (see Table 8.13).

247
Table 8.13: Most common perceived benefits of and barriers to regular lunch
consumption
Most common benefits to regular lunch consumption
Typical comments
Provision of energy and satiety Energises Satisfies hunger
‘It energises’ [IDFM05] ‘Lunch is the time we get hungry, so we must eat’ [INDFM09]
Physical performance Enhance strength, energy Feel ‘active and strong’
‘It is important for our day’s work … for strength’ [IDFM03] ‘They will be active in class’ [IDFF03]
Cognitive function/performance Enhanced concentration and mental function Keeps ‘brain fresh for next class’ Improved school performance
‘You need to study the whole day, you need nutritious food to keep your brain active while studying’ [IDFF05] ‘[Lunch] keeps your brain fresh for the next class’ [INDFM10] ‘Helps us to perform well during our school work’ [IDFF02]
Weight maintenance Have ‘good body’
‘You get good body maintenance’. [INDFM12]
Disease prevention ‘They (individuals having lunch) will be healthy and free from diseases’. [IDFF01]
Most common barriers to regular lunch consumption
Typical comments
Time consideration Lack of time
‘There is no time to prepare lunch in the morning’. [INDFF02]
Peer influence Peer pressure Peer perception
‘Coz you eat with your friends, your friends expect you to bring your lunch coz you guys will share, I mean we share our lunch together’ [INDFM07] ‘When a child is lonely like there is no friends with her … she can’t be eating alone, she’s shy that everyone is watching’. [IDFF04]
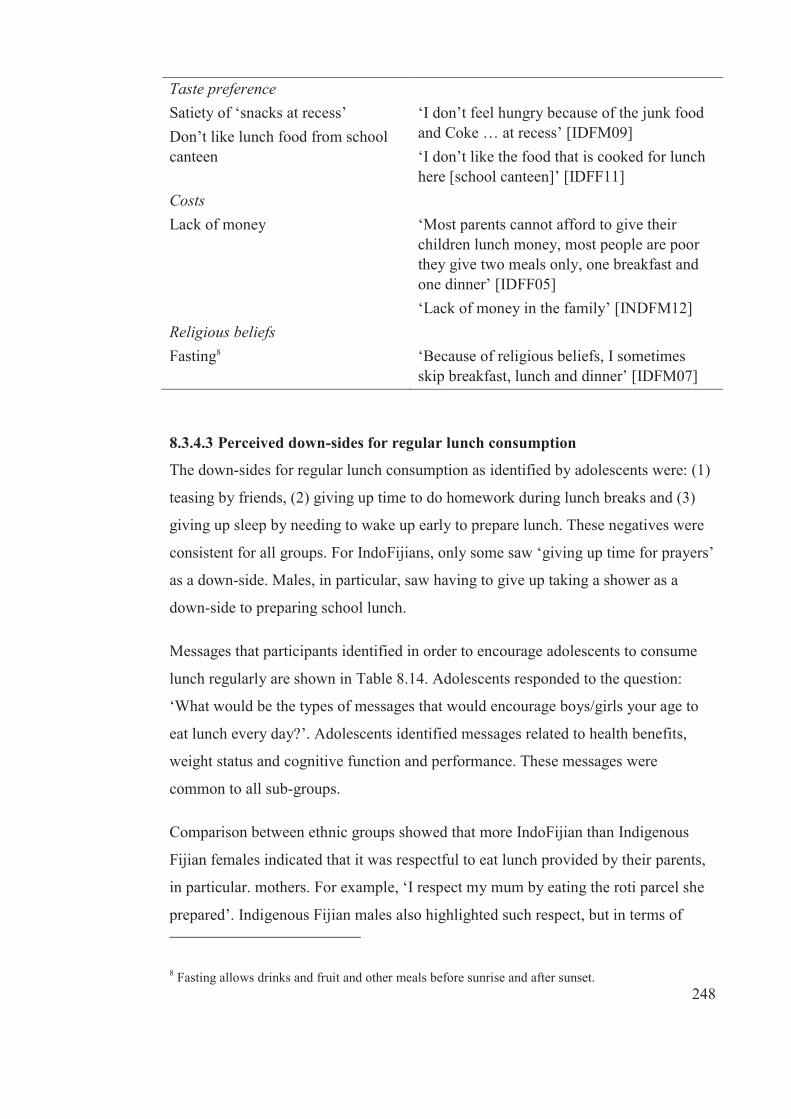
248
Taste preference Satiety of ‘snacks at recess’ Don’t like lunch food from school canteen
‘I don’t feel hungry because of the junk food and Coke … at recess’ [IDFM09] ‘I don’t like the food that is cooked for lunch here [school canteen]’ [IDFF11]
Costs Lack of money
‘Most parents cannot afford to give their children lunch money, most people are poor they give two meals only, one breakfast and one dinner’ [IDFF05] ‘Lack of money in the family’ [INDFM12]
Religious beliefs Fasting8
‘Because of religious beliefs, I sometimes skip breakfast, lunch and dinner’ [IDFM07]
8.3.4.3 Perceived down-sides for regular lunch consumption
The down-sides for regular lunch consumption as identified by adolescents were: (1)
teasing by friends, (2) giving up time to do homework during lunch breaks and (3)
giving up sleep by needing to wake up early to prepare lunch. These negatives were
consistent for all groups. For IndoFijians, only some saw ‘giving up time for prayers’
as a down-side. Males, in particular, saw having to give up taking a shower as a
down-side to preparing school lunch.
Messages that participants identified in order to encourage adolescents to consume
lunch regularly are shown in Table 8.14. Adolescents responded to the question:
‘What would be the types of messages that would encourage boys/girls your age to
eat lunch every day?’. Adolescents identified messages related to health benefits,
weight status and cognitive function and performance. These messages were
common to all sub-groups.
Comparison between ethnic groups showed that more IndoFijian than Indigenous
Fijian females indicated that it was respectful to eat lunch provided by their parents,
in particular. mothers. For example, ‘I respect my mum by eating the roti parcel she
prepared’. Indigenous Fijian males also highlighted such respect, but in terms of
8 Fasting allows drinks and fruit and other meals before sunrise and after sunset.
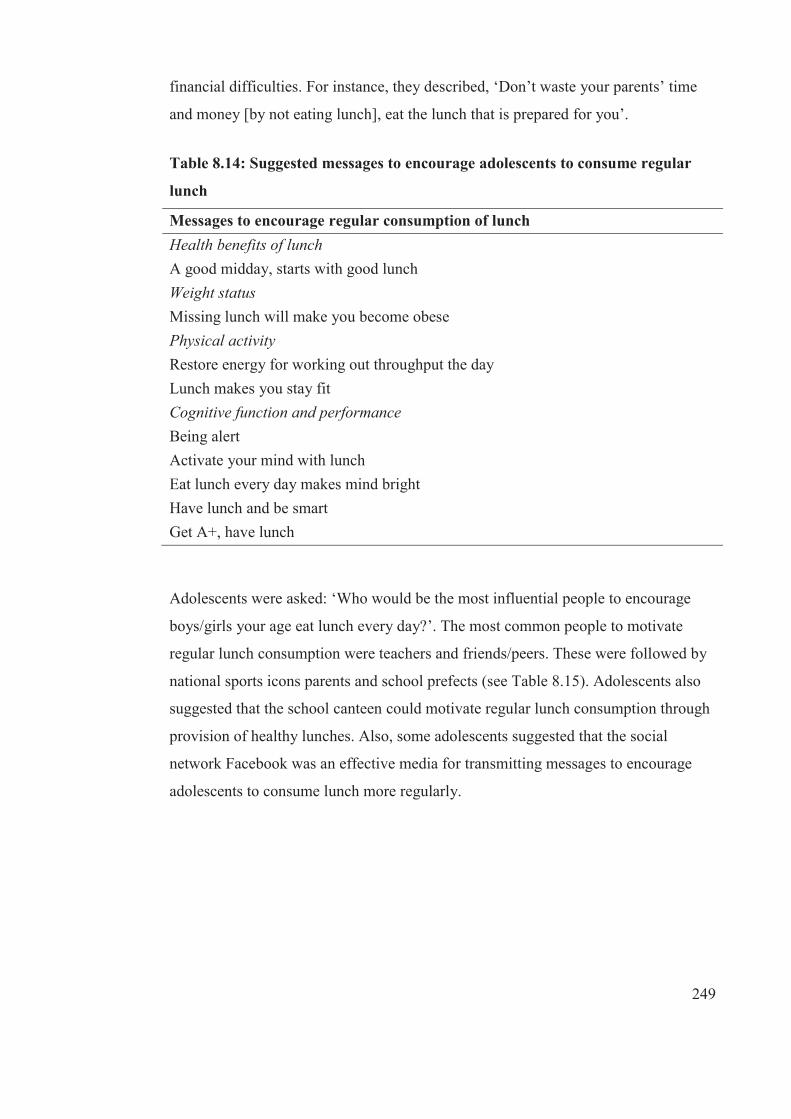
249
financial difficulties. For instance, they described, ‘Don’t waste your parents’ time
and money [by not eating lunch], eat the lunch that is prepared for you’.
Table 8.14: Suggested messages to encourage adolescents to consume regular
lunch
Messages to encourage regular consumption of lunch Health benefits of lunch A good midday, starts with good lunch Weight status Missing lunch will make you become obese Physical activity Restore energy for working out throughput the day Lunch makes you stay fit Cognitive function and performance Being alert Activate your mind with lunch Eat lunch every day makes mind bright Have lunch and be smart Get A+, have lunch
Adolescents were asked: ‘Who would be the most influential people to encourage
boys/girls your age eat lunch every day?’. The most common people to motivate
regular lunch consumption were teachers and friends/peers. These were followed by
national sports icons parents and school prefects (see Table 8.15). Adolescents also
suggested that the school canteen could motivate regular lunch consumption through
provision of healthy lunches. Also, some adolescents suggested that the social
network Facebook was an effective media for transmitting messages to encourage
adolescents to consume lunch more regularly.
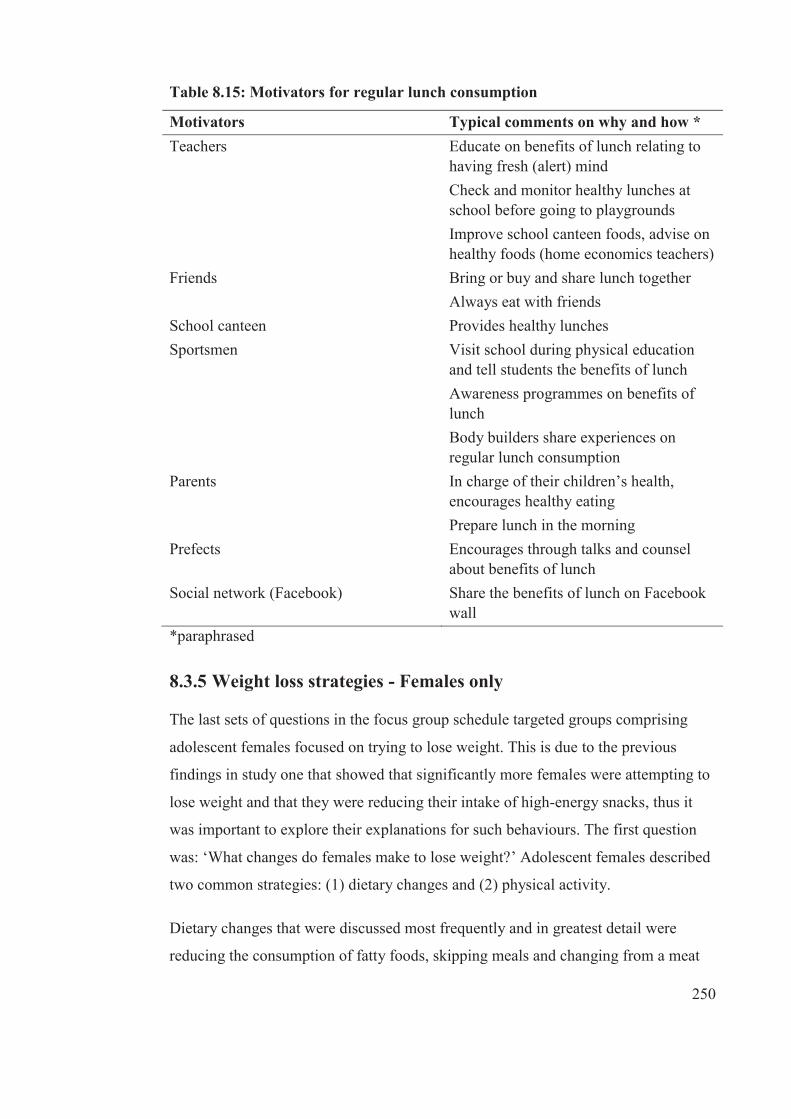
250
Table 8.15: Motivators for regular lunch consumption
Motivators Typical comments on why and how * Teachers Educate on benefits of lunch relating to
having fresh (alert) mind Check and monitor healthy lunches at school before going to playgrounds Improve school canteen foods, advise on healthy foods (home economics teachers)
Friends Bring or buy and share lunch together Always eat with friends
School canteen Provides healthy lunches Sportsmen Visit school during physical education
and tell students the benefits of lunch Awareness programmes on benefits of lunch Body builders share experiences on regular lunch consumption
Parents In charge of their children’s health, encourages healthy eating Prepare lunch in the morning
Prefects Encourages through talks and counsel about benefits of lunch
Social network (Facebook) Share the benefits of lunch on Facebook wall
*paraphrased
8.3.5 Weight loss strategies - Females only
The last sets of questions in the focus group schedule targeted groups comprising
adolescent females focused on trying to lose weight. This is due to the previous
findings in study one that showed that significantly more females were attempting to
lose weight and that they were reducing their intake of high-energy snacks, thus it
was important to explore their explanations for such behaviours. The first question
was: ‘What changes do females make to lose weight?’ Adolescent females described
two common strategies: (1) dietary changes and (2) physical activity.
Dietary changes that were discussed most frequently and in greatest detail were
reducing the consumption of fatty foods, skipping meals and changing from a meat
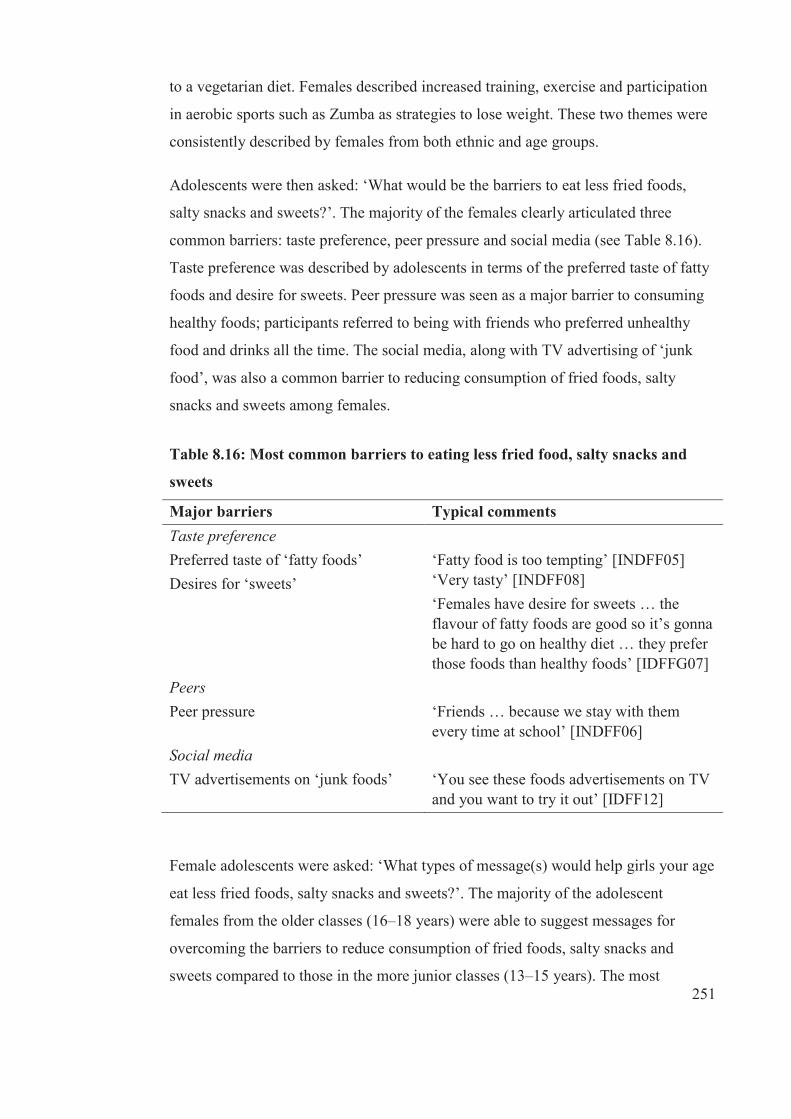
251
to a vegetarian diet. Females described increased training, exercise and participation
in aerobic sports such as Zumba as strategies to lose weight. These two themes were
consistently described by females from both ethnic and age groups.
Adolescents were then asked: ‘What would be the barriers to eat less fried foods,
salty snacks and sweets?’. The majority of the females clearly articulated three
common barriers: taste preference, peer pressure and social media (see Table 8.16).
Taste preference was described by adolescents in terms of the preferred taste of fatty
foods and desire for sweets. Peer pressure was seen as a major barrier to consuming
healthy foods; participants referred to being with friends who preferred unhealthy
food and drinks all the time. The social media, along with TV advertising of ‘junk
food’, was also a common barrier to reducing consumption of fried foods, salty
snacks and sweets among females.
Table 8.16: Most common barriers to eating less fried food, salty snacks and
sweets
Major barriers Typical comments Taste preference Preferred taste of ‘fatty foods’ Desires for ‘sweets’
‘Fatty food is too tempting’ [INDFF05] ‘Very tasty’ [INDFF08] ‘Females have desire for sweets … the flavour of fatty foods are good so it’s gonna be hard to go on healthy diet … they prefer those foods than healthy foods’ [IDFFG07]
Peers Peer pressure
‘Friends … because we stay with them every time at school’ [INDFF06]
Social media TV advertisements on ‘junk foods’
‘You see these foods advertisements on TV and you want to try it out’ [IDFF12]
Female adolescents were asked: ‘What types of message(s) would help girls your age
eat less fried foods, salty snacks and sweets?’. The majority of the adolescent
females from the older classes (16–18 years) were able to suggest messages for
overcoming the barriers to reduce consumption of fried foods, salty snacks and
sweets compared to those in the more junior classes (13–15 years). The most
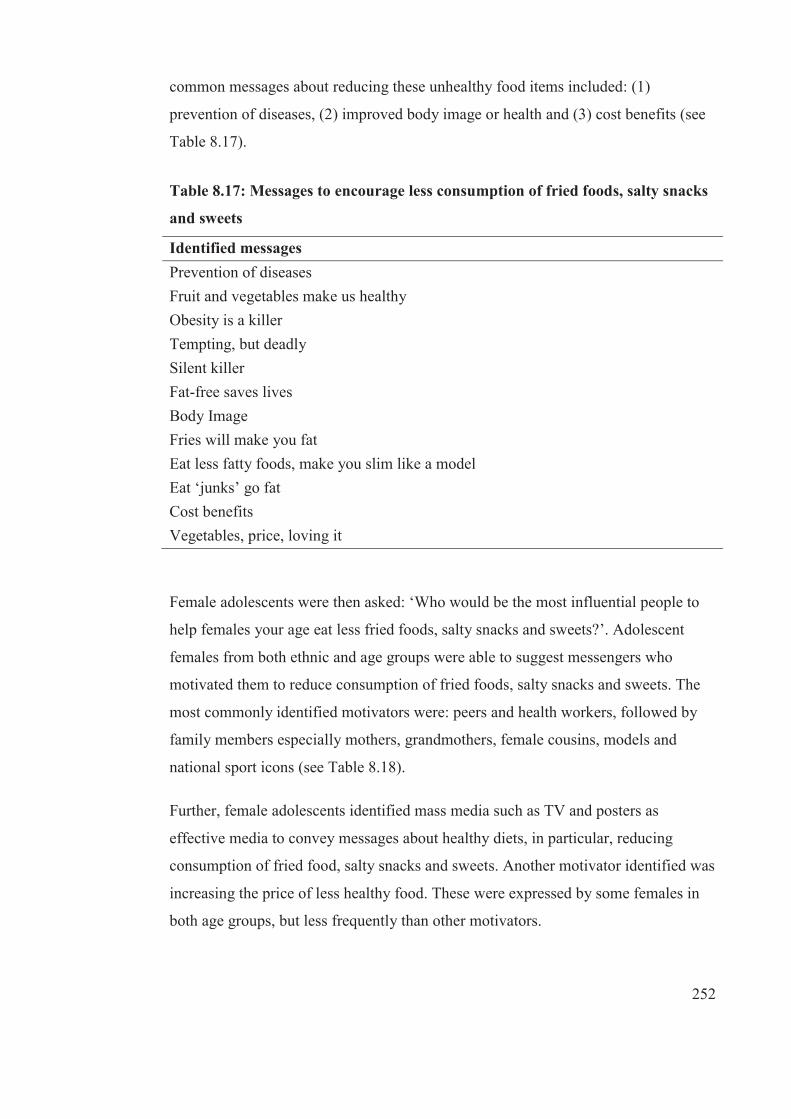
252
common messages about reducing these unhealthy food items included: (1)
prevention of diseases, (2) improved body image or health and (3) cost benefits (see
Table 8.17).
Table 8.17: Messages to encourage less consumption of fried foods, salty snacks
and sweets
Identified messages Prevention of diseases Fruit and vegetables make us healthy Obesity is a killer Tempting, but deadly Silent killer Fat-free saves lives Body Image Fries will make you fat Eat less fatty foods, make you slim like a model Eat ‘junks’ go fat Cost benefits Vegetables, price, loving it
Female adolescents were then asked: ‘Who would be the most influential people to
help females your age eat less fried foods, salty snacks and sweets?’. Adolescent
females from both ethnic and age groups were able to suggest messengers who
motivated them to reduce consumption of fried foods, salty snacks and sweets. The
most commonly identified motivators were: peers and health workers, followed by
family members especially mothers, grandmothers, female cousins, models and
national sport icons (see Table 8.18).
Further, female adolescents identified mass media such as TV and posters as
effective media to convey messages about healthy diets, in particular, reducing
consumption of fried food, salty snacks and sweets. Another motivator identified was
increasing the price of less healthy food. These were expressed by some females in
both age groups, but less frequently than other motivators.
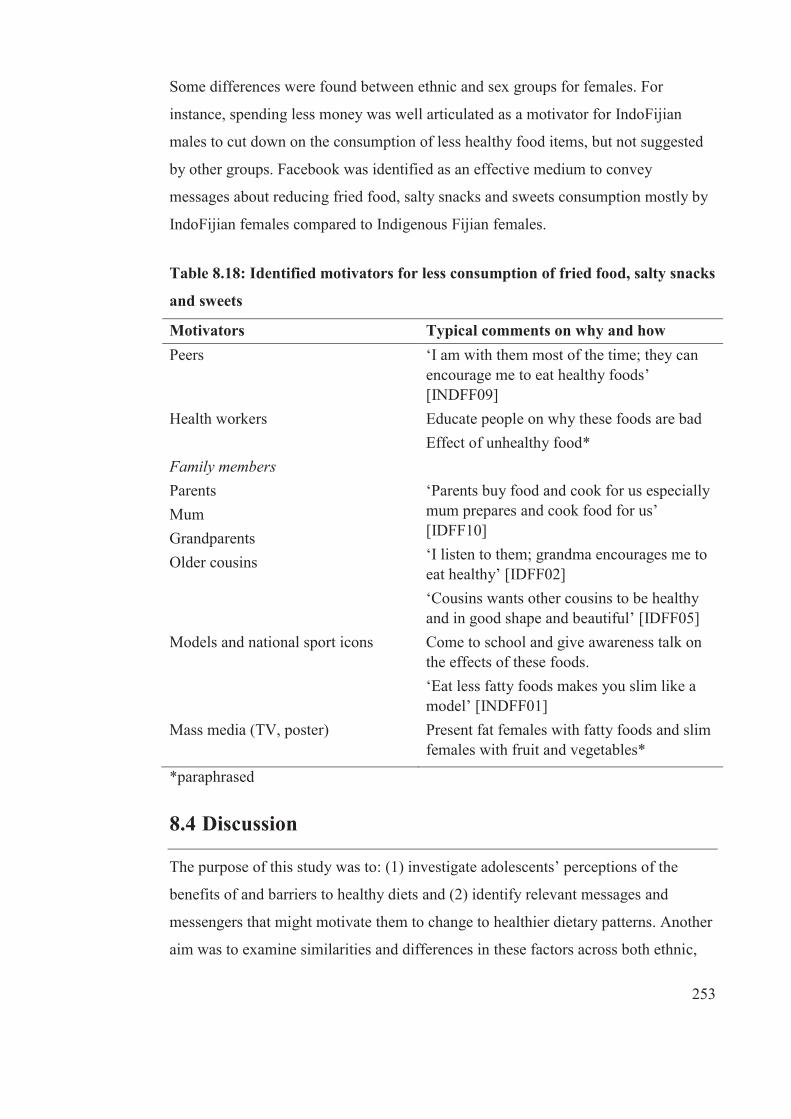
253
Some differences were found between ethnic and sex groups for females. For
instance, spending less money was well articulated as a motivator for IndoFijian
males to cut down on the consumption of less healthy food items, but not suggested
by other groups. Facebook was identified as an effective medium to convey
messages about reducing fried food, salty snacks and sweets consumption mostly by
IndoFijian females compared to Indigenous Fijian females.
Table 8.18: Identified motivators for less consumption of fried food, salty snacks
and sweets
Motivators Typical comments on why and how Peers ‘I am with them most of the time; they can
encourage me to eat healthy foods’ [INDFF09]
Health workers Educate people on why these foods are bad Effect of unhealthy food*
Family members Parents Mum Grandparents Older cousins
‘Parents buy food and cook for us especially mum prepares and cook food for us’ [IDFF10] ‘I listen to them; grandma encourages me to eat healthy’ [IDFF02] ‘Cousins wants other cousins to be healthy and in good shape and beautiful’ [IDFF05]
Models and national sport icons Come to school and give awareness talk on the effects of these foods. ‘Eat less fatty foods makes you slim like a model’ [INDFF01]
Mass media (TV, poster)
Present fat females with fatty foods and slim females with fruit and vegetables*
*paraphrased
8.4 Discussion
The purpose of this study was to: (1) investigate adolescents’ perceptions of the
benefits of and barriers to healthy diets and (2) identify relevant messages and
messengers that might motivate them to change to healthier dietary patterns. Another
aim was to examine similarities and differences in these factors across both ethnic,
254
sex and age groups. The key dietary patterns targeted for this study were reducing
SSB (increasing water) and increasing fruit and vegetable consumption and regular
meal consumption. For females, in particular, who were found in study one to engage
in weight control behaviours (lose weight) and were also reducing consumption of
energy-dense snacks, this study aimed to explore their explanations for such
behaviours.
The first part of this section will be a discussion of adolescents’ perceptions of the
benefits of dietary behaviours that were targeted for this study and their perceptions
of barriers and down-sides to changing to healthier dietary patterns. This will be
followed by a discussion of the messages to overcome perceived barriers and down-
sides to changing to healthier dietary patterns, then the motivational messengers for
whom adolescents identified for each dietary pattern that was targeted. Some
recommendations on strategies to improve the overall dietary patterns of adolescents
are made. The strengths and weaknesses of the study are addressed and finally the
implications of the results are discussed.
The OPIC study has previously demonstrated that overall knowledge of basic aspects
of healthy eating is good and this was confirmed in studies three and four.
Adolescents in study four, however, identified multiple barriers (perceived and
actual) to changing to healthier dietary patterns (drinking more water and fewer SSB,
eating more fruit and vegetables, having regular meals). Study four results showed
that adolescents have a basic knowledge regarding the nature and benefits of healthy
beverages and fruit and vegetables, consistent with other components of this thesis.
Despite this knowledge, focus group participants indicated that they found it difficult
to practice healthy drinking and eating patterns at school and/or on the way home
and consumed SSB during and after school and, generally, insufficient fruit and
vegetables. Such obesogenic behaviours could be explained by the overwhelming
barriers to drinking healthier beverages such as water and consuming more fruit and
vegetables and considerable enablers and facilitators to drinking SSB and consuming
fruit and vegetables that adolescents also highlighted in this study.
It was well articulated by adolescents in this study that perceived peer pressure was
the most common barrier for a healthy diet, in particular, drinking water and eating
255
fruit and vegetables, either at school or on the way home, because there was pressure
to eat and drink the same things as their peers. This response was the same for all
groups. Adolescents clearly articulated the desire to be with friends who then
‘persuaded’ them to drink SSB and also encouraged sharing (pooling) of spending
money to purchase soft drinks. This is similar to other studies [382-386], where peers
were found to exert a major influence on adolescents’ dietary behaviour and
attitudes, including food acceptability and selection and acceptance among
adolescents [387]. In this current study, peer pressure was particularly prominent in
relation to pooled spending money. This is an important finding, given that
adolescents in this study also suggested peers as effective messengers for reducing
SSB and increasing fruit and vegetable consumption, both at school and on the way
home
The food environment with ready access to unhealthy food and drinks further
aggravated the problem. One of the frequently identified facilitators of less healthy
eating was the ready availability of unhealthy food and drinks. This was particularly
the case within the school grounds. There were number of reasons for this, but most
importantly, school canteens in Fiji have a high availability of SSB and junk food
due to limited enforcement of food guidelines and policies and a lack of awareness of
the importance of implementing school food guidelines by head teachers and
teachers [388]. Clearly, extra work is needed in improving the food and drinks that
school canteens offer.
While there are national school canteen guidelines in Fiji [389, 390], a recent study
reported that only about 16% of primary schools were fully compliant with national
school canteen guidelines, while the remaining 84% only complied partially with the
guidelines [388]. The situation is likely to be similar in high (secondary) schools in
Fiji. The school environments can have a large effect on adolescents’ food choices
and the quality of their overall diets because adolescents may consume over half of
their total daily calorie in school on a school day [384]. A recent study conducted in
Fiji found that noncompliant schools had a higher proportion of overweight and
obese students than schools that were fully compliant with the canteen guidelines
[388]. Given this evidence, there is a need to strengthen the enforcement of canteen
256
guidelines and policies as well as identify how well these school canteen guidelines
could be monitored in schools.
It is also clear that environmental barriers to healthy eating patterns are substantial
and well recognised by adolescents. Although this might not be directly related to
social marketing messages, there is a need to change both home and school
environments to address these barriers.
The extensive TV advertising of SSB and junk food was also an important perceived
barrier for these adolescents to making healthy food and drink choices. This was
found consistently among all sub-groups. A number of studies have investigated the
influence of TV viewing on children and adolescents’ dietary patterns [391-394].
Prior studies done in New Zealand [391] and Boston [392] found that children and
adolescents who watched the most TV were significantly more likely to be higher
consumers of the food most commonly advertised on TV, including SSB. A more
recent study by Scully et al. [394] suggested that the cumulative exposure to
television (>2 hours) was positively linked to adolescents’ food choices and dietary
patterns, which were often energy-dense and nutrient poor, compared to children
who watched TV less than two hours a day.
A study undertaken in Korea suggested that having a government regulation on TV
advertising of energy-dense and nutrient poor food and drinks was effective in
reducing children’s exposure to TV advertising of these types of food and drinks and
promoted a conducive environment for child health improvement [395]. With the
effects of food and beverages advertising on adolescents less well established in Fiji,
the findings of this study make an important contribution in this area. This study
suggests there is a need to develop and pass regulations to restrict marketing of
unhealthy food to children, across media, even though the exposure is not as great as
in the US and other high income countries. This is in line with international
recommendations [396-398]. There is currently no policy on restricting advertising
of unhealthy food and drinks to children in Fiji. An attempt to pursue regulation in
2012 was unsuccessful due to industry lobbying (Snowdon 2013, pers. comm.).
257
Many of the adolescents in the focus group believed that taste preferences for drinks
and foods that were high in sugar, fat or salt was also a common barrier to
consuming healthy drinks and food at school and on the way home. The response
was consistent for all sub-groups. There are a few studies among children and
adolescents [382, 386, 399] that have reported taste preference as being one of the
determinants of SSB consumption. The findings of this study is consistent with a
study on adolescents in Costa Rica [386]. The same study also recommended that
establishing a peer-group social norm for healthy eating and drinking would be
effective in changing dietary behaviours of adolescents.
Fruit and vegetable consumption was low among adolescents in Fiji. All adolescents
in the focus groups recognised the important benefits of daily fruit and vegetable
consumption, including preventing sicknesses through vitamins and mineral contents
of fruit and vegetables. Participants further described their enhanced concentration
and performance in school when they consumed fruit and vegetables. The perceived
health benefits of adequate amounts of fruit and vegetables that were identified in the
current study were consistent with other previous studies elsewhere [385, 400].
In line with studies in other countries [383, 385], the most important barriers for low
consumption of fruit and vegetables at school and on the way home were taste
preferences for SSB and junk foods, peer pressure and limited availability of healthy
food (fruit and vegetables) in school. In study four, the influence of peers was linked
to the availability of unmonitored spending money that was primarily spent on SSB
and junk food rather than fruit.
Regular meals as part of a healthful diet and lifestyle can positively affect children’s
health and wellbeing and reduce the prevalence of overweight and obesity. The
findings from this study indicated that all of the participants, regardless of ethnicity,
sex and age groups, agreed that breakfast was the most important meal of the day.
However, participants had mixed feelings about the importance of lunch. In the
current study, benefits of meal regularity were related to increased energy, strength
and cognitive function and performance in school. These findings relating to the
benefits of regular meals are consistent with findings with children in other countries
[101, 401].
258
The majority of participants perceived that eating breakfast regularly provided
increased energy and strength and increased ability to concentrate in school. These
findings are consistent with findings elsewhere [401]. In agreement with a previous
study [401], commonly held perception of barriers to regular breakfast consumption
were lack of time and not being hungry in the morning. Body image was also
perceived as a barrier because some adolescents, especially girls, skipped breakfast
as a strategy to lose weight. Some adolescents also reported that religious practices
such as fasting on certain days of the week or at certain times of the year contributed
to skipping breakfast.
While there is evidence that regular meals, especially breakfast, are associated with a
more favourable nutrient intake and weight status [402], this was not well understood
by adolescents in this study. Further, some adolescents perceived cost savings
specifically for breakfast consumption because they were not hungry at recess, a time
when they frequently purchased unhealthy food and drinks if they skipped breakfast.
This could mean that it is beneficial to eat breakfast regularly, although participants
in this study did not believe that it was beneficial. Thus, social marketing should
incorporate nutrition messages targeting increased awareness about the benefits of
regular meals, including breakfast, focusing on weight maintenance.
There were mixed responses regarding the importance of lunch among the
adolescents studied. While some indicated that it was an important meal after
breakfast, others thought otherwise. However, during the course of focus group
discussions, perceived benefits shared were provision of energy and satiety,
enhanced physical performance, cognitive function and performance, weight
management and prevention of diseases. The commonly held perceptions of barriers
to eating lunch were lack of time to prepare lunch before going to school, individual
preferences, lack of money and religious practices.
Another common perception held by the adolescents in the focus groups was about
the relative lack of importance of lunch consumption if they had eaten a good
breakfast or eaten at recess. This was the case for females, in particular, as they
tended to skip meals as a strategy to lose weight.
259
The adolescents agreed that taste preference was also a common barrier to
consuming healthy drinks and food at school and on the way home. The response
was consistent for all sub-groups. There were also some studies on children and
adolescents that found taste preferences a barrier to healthy eating [386, 399, 403].
The study conducted in Costa Rico [386] recommended that targeting peers to
develop a peer-group social norm for healthy eating would be effective in changing
dietary behaviours of adolescents. This recommendation could also be useful for Fiji.
It was also clear that environmental barriers to healthy eating patterns were
substantial and well recognised by adolescents. Although this might not be directly
related to social marketing messages, there is a need to change both home and school
environments to address these barriers. These issues could be achieved through
community healthy setting strategies.
Messages that adolescents in this study believed would encouraged people their age
to increase their fruit and vegetable consumption include health benefits and
economic benefits. Participants suggested the use of words such as ‘refreshing’ and
‘nutritious’ in messages. Having messages that linked fruit and vegetable intake with
disease prevention and longevity was highlighted. Further, participants suggested
that messages could address the cost-saving benefits of consuming local rather than
imported fruit and vegetables. Participants suggested that backyard gardening had
economic benefits.
Participants suggested that the most effective messages to motivate adolescents to
consume breakfast regularly would be related to proper time management, the
importance of breakfast, the benefits in terms of school performance (cognitive
function and performance) and body image.
Identified messages to motivate adolescents to have regular lunch every day were
related to health benefits, weight status, physical activity and cognitive function and
academic performance. Adolescents suggested tailoring messages towards health
benefits. For instance, ‘a good midday starts with a good lunch’. Weight status was
described by using the message, ‘Missing lunch will make you become obese’.
Physical activity was more targeted as restoration of energy and staying fit
260
throughout the day. Messages related to cognitive function and performances were
focused on being ‘alert’, ‘active and bright mind’, ‘smart’ and ‘get A+’.
Peers and parents were identified as the most important motivators to encourage
adolescents to consume fruit and vegetables every day, followed by health workers,
school environments, models/national sport icons and media. While participants
recognised that peers can influence dietary change, they agreed that most adolescents
respect and listen to their parents regarding what to eat, as parents are the daily
providers of food. The findings about peers and parents being important influences
during adolescence are consistent with Story et al. [384]. Adolescents in this current
study specifically indicated that they listened more to their teachers than they did to
parents. Participants believed that teachers were in a better position to teach them
about healthy diets and to advise school canteens to have fruit and vegetables
available every day. The findings of this study show that adolescents are looking to
their peers, parents, as well as teachers, to encourage, support and enable them to
increase their fruit and vegetable consumption, as well as increasing water intake and
regularity of meals and reducing SSB.
The study results suggested that the most important motivators for regular breakfast
consumption were parents. Adolescents clearly expressed the role of their father in
purchasing food items, whereas the mothers prepared breakfast in the morning and
saw this as an ‘act of love’. Participants further indicated that some parents ‘forced’
them to eat breakfast. A systematic review [404] indicated that parental breakfast
eating was reported as a motivator for increased breakfast consumption among
children and adolescents.
Adolescents also indicated that sportsmen/models could be motivators for regular
breakfast consumption. The most effective way would be to have them pose on TV
or billboards engaging in healthy eating with benefits of a regular breakfast
highlighted. Media exposure among adolescents in Fiji is growing and is a potential
motivator for these adolescents. Friends or peers and the use of jingles to motivate
adolescents to eat breakfast regularly were less important, but certainly not
considered unimportant. Results from study four suggested that the best motivators
of regular lunch consumption among these adolescents are the school teachers and
261
peers. Adolescents described the role of teachers in educating them about the health
benefits of lunch, including ‘fresh and alert mind’. Adolescents suggested that
teachers do regular checks and continuous monitoring of healthy lunches.
Based on the findings of this study, some strategies to promote change to healthier
dietary behaviours include:
1) The removal of environmental barriers that could be achieved through
community healthy setting strategies. A healthy setting approach to social
marketing would facilitate making environments less obesogenic.
2) In line with international recommendations [396-398], this study suggests
that there is a need to develop and pass regulations to restrict the marketing of
unhealthy food to children, across all media.
3) Schools could encourage students to bring fruit to school every day.
4) Improving the choices of food and drinks in the school canteen to ensure
healthy choices are readily available.
The findings of this study also suggest strategies that are relative to school and peers
and these include:
1) Strategies to monitor and enforce school canteen guidelines that include
subsidies from schools from the Ministry of Education (MOE), as such
schools rely on profit from canteens. Also, MOE should have a monitoring
policy and budget.
2) Identifying opinion leaders who are well-supported by schools to influence
adolescents to make healthy food and drink choices.
3) The use of peer ambassadors that has proven successful in New Zealand and
Australia. This could be achieved through school programmes such as student
ambassadors or champions, which were found to be effective in Australia,
where leadership was supported within schools as well as education sectors
[405].
262
8.4.1 Strengths and limitations
One of the strengths of this study is providing health promotion information relating
to ways to promote healthier dietary patterns, an area that is of high importance, but
has not been investigated widely, especially in Fiji. Another strength is that this study
focused on adolescents, an important development phase for establishing lifelong
dietary patterns. A further strength is assessing ethnic-, sex- and age-specific ideas
about barriers to change, messages and the most influential messengers in order to
determine whether optimal health promotion messages differ for each sub-group.
Weaknesses of the study included some difficulties in answering some questions
because they participants did not know the answer, resulting in no or unclear
responses related to health promotion messages that were likely to motivate
adolescents to change to healthier dietary patterns. This meant that some of the
components of the original research questions could not be answered, specifically the
down-sides of changing to healthier dietary patterns.
This study used a sample from peri-urban Suva and findings may not be
generalisable to adolescent populations living in other parts of Fiji. However, the
results provide a useful starting point for developing messages and utilising
messengers whom adolescents see as influential to promote healthier eating patterns.
The findings could be utilised for social marketing as a large number of adolescents
reside in peri-urban settings and the previous components of this thesis have
demonstrated the poor dietary practices of adolescents in the OPIC sampling frame.
8.4.2 Conclusions and implications
This study provided an insight into perceived benefits of and barriers to healthy
eating among adolescents as well as effective messages and motivators, from the
perspective of adolescents. This is despite the fact that they may have not been
necessarily accurate about most effective influences, as some influences are less
apparent. The incorporation of adolescents’ perceptions into health promotion
messages that target this age group, and that are applied within appropriate settings,
could be a powerful way of improving dietary patterns by social marketing.
263
C H A P T E R 9
Overall Discussion and Implications
9.1 Overall discussion and conclusions
This study is among the first in Fiji that has described adolescents’ dietary patterns
and relationships with body weight and the sociocultural influences on these. Also, it
is the first to identify messages and motivators that would positively influence
adolescents’ diets, and from the perspectives of adolescents. The findings of this
study from both the quantitative and qualitative components have contributed
significant knowledge to this poorly studied area. This section provides the overall
conclusion of this research, linking each component, followed by a review of
strengths and limitations and suggestions for future research in this important area.
There were four components to this thesis. The first component described
adolescents’ dietary patterns and their cross-sectional relationships with weight
status, and then investigated predictors of longitudinal changes in dietary patterns
and BMI-z as the second component. The third component identified the
sociocultural explanations for adolescent’s dietary patterns and, last, the thesis
identified perceived benefits of and barriers of healthy diets and messages and
messengers that motivated adolescents to change to a healthier diet.
This thesis significantly adds to the existing evidence base on the dietary
determinants of obesity for Pacific populations, in particular, analysing the
significant sociocultural influences on obesogenic dietary patterns. Specifically,
these contributions are: (1) identification of empirical data on the dietary patterns of
most concern and solutions for change, (2) wrapping sociocultural explanatory value
through qualitative data around that of quantitative behavioural data, (3) the use of
methodology one (cross-sectional), which alerted reverse causality and potential
explanations and ways to show these, and (4) the unhelpful longitudinal analyses
relative to helpful cross-sectional analyses.
264
The empirical findings help to fill the large gaps in evidence for this region of the
world, which has some of the highest burdens from obesity and diet-related NCDs.
The sociocultural determinants of obesogenic eating patterns have not been widely
studied despite the well-known powerful influences of culture on cuisine and eating
patterns in general. Thus, these studies contribute important knowledge and
empirical data for an area where there is a high need to better understand both the
determinants and potential solutions in terms of salient messages and messengers for
healthier dietary patterns. In examining sociocultural factors that influenced diet, it
was clear that sociocultural and socioeconomic factors were closely linked, as
demonstrated by the availability of unmonitored spending money.
In addition, some unexpected findings were found. First, some less healthy eating
patterns were associated with lower BMI-z. Second, longitudinal studies (which are
generally considered more robust methodologically than cross-sectional studies)
were not as valuable in uncovering important evidence as the cross-sectional studies.
When there is a significant potential for reverse causality (i.e. high BMI-z causing
healthier eating patterns in this case) and when dietary patterns do not change very
much over time, the analyses produced either null findings or findings in the opposite
direction to expectations. Therefore, the areas in which this thesis has advanced
scholarship include bringing some much needed empirical evidence to two
important, but understudied, issues—obesity in the Pacific region and sociocultural
determinants of obesity—re-assessing the implications from cross-sectional and
longitudinal analyses.
In this study, some key dietary patterns were highlighted to be important for health
promotion and public health policy. Adolescents from both Fiji ethnic groups were
found to follow obesogenic dietary patterns, in particular, high SSB consumption and
low intake of fruit and vegetables and meal (breakfast, morning snacks and lunch)
irregularity. The unhealthy dietary patterns are particularly of concern given results
from other parts of this study, which indicated that adolescents’ dietary patterns
remained the same over two years of the OPIC project intervention and that there
were some relationships with the prevalence of overweight and obesity.
265
While irregular meal consumption was found to be significantly associated with high
BMI-z, interestingly, high consumption of SSB and low intake of fruit and
vegetables showed significant associations in the opposite direction than expected.
Adolescents who were overweight/obese and knew that high SSB and low fruit and
vegetable consumption were obesogenic dietary patterns reported that they were
making changes accordingly and this was linked with their wish to lose weight.
However, there was a general lack of knowledge among Fijian adolescents about the
value of meal regularity in weight control.
In fact, many female adolescents thought that skipping meals was a good way to lose
weight. Thus, the skipping of meals was more commonly practiced (or at least
reported so) among overweight/obese than those who were not overweight/obese.
Despite the null findings found for the relationships between high SSB and
consumption of low fruit and vegetable and BMI-z, they are still an important area
for intervention, given their other risks to health [75, 94]. The study also found ethnic
and sex differences in particular behaviours, highlighting the need for the targeting of
health promotion campaigns to specific sub-groups. In general, Indigenous Fijian
adolescents and females were more likely to engage in obesogenic dietary behaviours
than other sub-groups.
There is evidence from this study that school environments and surroundings were
important contributing factors of poor diets. Thus, improving and monitoring food
environments in and near schools is critical in order to increase fruit and vegetable
and reduce SSB intake among adolescents at school and on the way home.
Enforcement of school food policies and/or guidelines by schools and other
appropriate authorities should be a way forward in the provision of healthy food and
drink choices in the school canteens/menus and nearby food carts. It was indicated
from this thesis that food costs and food advertising were powerful in influencing
adolescents’ choices of food and drinks; therefore, an increased focus on wider
policy-based approaches such as taxation of less healthy foods and control of
advertising of less healthy food and drink choices to children may also be critical to
ensuring a healthier food environment for children and adolescents in Fiji.
266
One of the findings that emerged from this thesis was the unexpected or opposite
associations between dietary patterns such as consumption of snacks, fried food and
confectionery after school and BMI-z. Adolescents with high BMI-z have the general
knowledge that high intake of these foods is obesogenic, thus they have reported that
they have healthier consumption of these foods. This could reflect either a social
desirability bias in answering the questions or that they were actually making
positive changes in their eating patterns, particularly to lose weight. In a population
where weight gain in adolescents is excessive and the obesity trend is fast rising [17],
these findings have significant implications for dietary improvement, although they
are subject to several limitations, discussed below in section 9.2.
During the OPIC study, maintenance of dietary behaviours was observed for most
adolescents with minimal changes in dietary patterns over two years. The only
statistically significant finding was that older adolescents were less likely to improve
their morning snacks and fruit and vegetable consumption than younger participants.
Overall, therefore, this study suggests that adolescents’ dietary patterns were
relatively unchanging over time even though there was an intervention part of the
OPIC study. Also, longitudinal studies that depend on variation in diets as a
dependent or independent variable are likely to give null results, as this study found.
It would potentially be more effective to target dietary patterns in younger
adolescents or possibly before adolescence.
Analysis of the participant characteristic data also found that there were no
statistically significant changes in categorical weight status and mean BMI-z
between baseline and follow-up for overall or by ethnicity and sex. These
characteristics were stable over time.
Worryingly, there were misconceptions about what constituted healthy behaviours
among these adolescents. Adolescents who strongly agreed or agreed that the sugar
content of SSB fruit drinks/cordials was less than SSB such as Coke and Sprite were
less likely to reduce their SSB consumption compared to those who strongly
disagreed or disagreed on the statement at follow-up. Further, adolescents who stated
that skipping breakfast or lunch was a good way to lose weight were less likely to
reduce their confectionery consumption between baseline and follow-up compared to
267
those who thought the opposite. These specific misconceptions demonstrated poor
nutrition knowledge and indicated that even those motivated to lose excess weight
may be making changes in eating patterns for the worse, which are unlikely to help
with weight loss. A school-based education programme with a focus on a greater
understanding of nutrition is needed to address these misconceptions.
This thesis has also demonstrated that sociocultural influences on dietary patterns of
adolescents, in particular, outside home, are substantial and could possibly explain
why positive changes in adolescents’ dietary patterns were not found longitudinally.
Adolescents reported that family, peers, school environment and religious practices
were the most influential factors in shaping their eating patterns, in particular,
outside home. Specifically, parental involvement in the home preparation of food for
breakfast and school lunch, particularly for IndoFijians, was associated with less
purchasing and/or consuming food at school, which were mostly less healthy options.
The parental provision of spending money encouraged obesogenic diets outside the
home because adolescents elected to buy either SSB or energy-dense snacks with this
discretionary money. Equally important, in terms of influencing diets, were other
family members, primarily female, (grandmothers, aunts, siblings) who indirectly
influenced adolescents’ diets through advice on both the choice and amount of food
consumed. As well as family members, religious beliefs and practices were found to
be salient determinants of adolescents’ diets, in particular for IndoFijian males.
In addition to the sociocultural influences that greatly determined adolescents’
dietary behaviours, there were also overwhelming barriers that adolescents saw as
preventing them from having healthier dietary patterns. Most adolescents reported
that the barriers to having a regular breakfast were poor attitudes towards time
management in the morning, chores (females) and food preferences for breakfast.
The meals and snacks outside of home were influenced by peers, social desirability,
spending money and the high accessibility of obesogenic food and drinks, both at
school and on the way home from school, and the TV advertising of less healthy
food and drinks. Although multiple barriers to change were identified by adolescents,
even at this early age, the participants were very aware of the cost savings associated
with healthy eating. Promoting the potential to save personal and family money
268
through consumption of water and home produced fruits and vegetables could be
valuable approaches to employ in social marketing or other health promotion
interventions.
Although many barriers to healthy eating were identified by adolescents from all
groups, this study adds to knowledge regarding the motivational messages and
messengers to promote healthy diets, especially for adolescents in the Pacific Islands.
The motivational messages identified were mostly related to health and cost benefits.
In addition, specific individuals (messengers) should be targeted. Parents, in
particular, have the scope to control spending money and also to influence meal
regularity and dietary patterns. Family members (grandmothers and cousins) also
indirectly control the choice and amount of food consumed. Peers were found to
strongly influence the choices of food and drinks both at school and on the way
home, thus they should be targeted for ambassadors programmes in schools. Some
aspects of these behaviours can be influenced by social marketing, but also there is a
need for environmental changes to ensure healthy food environments for a long-
lasting dietary change among adolescents.
9.2 Strengths, limitations and direction for future research
The major strengths of the study included the use of a large cross-sectional and
longitudinal data set that was robust and rigorous in design, the use of qualitative
research methods to describe and explain the quantitative data sets and the
comparison of two distinct cultural groups within a common geographical
environment. While this study has significant strengths, there are some limitations
that need to be considered.
One limitation associated with studies one and two was that dietary patterns were
only based on self-reported frequency of consumption. While the use of food
frequency questionnaires is a practical and affordable method in larger population
surveys [406, 407], including studying diets of adolescents [408-410], there have
been some concerns raised with regard to its accuracy and validity for looking at the
overall diet [411]. There is probably a need for a detailed investigation of these
dietary behaviours (e.g., 24-hour recall) to assess the wider scope of diet and also see
269
if other dietary factors might be important in obesity development and to explore
whether misreporting plays a role in some of the null and inverse relationships
identified in these studies [412]. This would add further to the evidence base,
identifying key targets for health promotion, and may also provide more information
to support the development of appropriate and effective strategies. In addition, it was
not possible to assess PAEE in the current study, which may confound relationships
between dietary intake and BMI-z.
Another limitation encountered in studies one and two was that the key variables
used in the analyses were dichotomised, which may be too blunt to detect smaller
changes in dietary patterns and weight status. The longitudinal study (study two),
which investigated predictors of change in dietary patterns and BMI-z only, found a
very small number of participants who indicated change in their dietary patterns
between baseline and follow-up. This meant that the analysis in part 6.2.4 of the
study was based on a relatively small sample size. However, there were no
associations between dietary patterns and BMI-z over time.
A limitation of study three was that it used only the existing HYHC sociocultural
interviews dataset. The original focus of the OPIC sociocultural studies was to
further seek description and explanations for a range of everyday activities, including
food-related explanations on messages and messengers. In the current study, the data
set was used to focus on outside of home dietary patterns of adolescents and thus was
limited in addressing in-depth the research questions for this study directly.
Study four utilised a focus group methodology. Although this method has many
advantages, there are limitations [363, 369, 413, 414] that could be relevant to this
study. A potential limitation in the use of focus groups in the current study was that
participants were unlikely to express their individual views within their focus group,
but rather were influenced by what other participants in the group were saying.
Further, participants were reluctant to talk about sensitive issues regarding their diets,
either because certain individuals dominated the discussions or participants were shy
and were less confident in participating during the discussion [363]. Thus, it might be
difficult for the researcher or moderator to capture each individual’s honest
explanation of the issues raised. In this study, some of the participants were unable to
270
answer certain questions in a focus group, especially among younger participants.
Relevant to both studies three and four, a concern in qualitative research is the
tendency of respondents to answer and present themselves in a more socially
desirable manner [415, 416].
9.3 Implications
This thesis has generated a number of new and valuable findings that have important
implications for policy and practice in relation to adolescents’ health in Fiji. Based
on these findings, the health promotion or public health approach to reducing
obesogenic dietary patterns and unhealthy weight gain in adolescents in Fiji should
include:
1) A focus on reducing SSB, increasing fruit and vegetable consumption and
increasing regularity of meals.
2) A more active family engagement (including parents being role models) on
dietary issues such as food preparation at home for breakfast and lunches,
food and drinks consumed at school for morning snacks and lunch and
afternoon snacks.
3) An attention to sociocultural interventions targeting the strong influences
(sharing of spending money and purchasing of unhealthy food and drinks at
recess and after school on the way home) from peers and family members, in
particular, parents. Parents indirectly influence outside home dietary patterns
through provision of school lunches and significant amounts of unmonitored
spending money.
4) Ensuring that the food environment is healthier through the provision of
healthy choices of food and drinks in school canteens and on the way home
from school. A way forward would be to enforce school food policies and/or
guidelines by schools and other appropriate authorities. Additionally,
development of relevant policies related to the taxation of unhealthy food
items and advertising of junk food and SSB is needed.
271
5) A review or strengthening of school-based education programmes with a
focus on a greater understanding of nutrition is needed to address dietary
misconceptions found in this study.
6) The use of messages around health benefits, physical wellbeing and
prevention of diseases, cognitive function and academic performances and
body image (females) and cost benefits of healthy dietary patterns are
important in future social marketing approaches. The use of key messengers
such as peers, parents, teachers, family members and national sports icons to
motivate adolescents to change to a healthier dietary pattern is likely to be
effective.
The findings from these four studies showed that adolescents must be prioritised for
dietary interventions to combat the obesogenic dietary patterns and the increasing
prevalence of obesity. Sociocultural factors underpin most dietary behaviours among
adolescents from both ethnic groups. It is apparent that social marketing efforts
should be strengthened and tailored specifically for adolescents overall and with
targeting of groups and prioritised dietary behaviours. Moreover, the broader food
environments should place more emphasis on less obesogenic food environments. In
addition, further research is needed to fill the substantial evidence gaps that remain
for this age group. In conclusion, the findings of this thesis provide a platform for
effective promotion of healthy diets among different groups of adolescents, not only
in Fiji, but in the Pacific region.
272
References
1. Lozano R, et al.. Global and regional mortality from 235 causes of death for 20 age groups in 1990 and 2010: a systematic analysis for the Global Burden of Disease Study 2010. The Lancet. 2012. 380: p. 2095–2128.
2. World Health Organization. Global health risks: Mortality and burden of disease attributed to selected major risks. 2009, WHO: Geneva.
3. World Health Organization. Political Declaration of the High-level Meeting of the General Assembly on the Prevention and Control of Non-communicable Diseases. 2012; Available from: http://www.who.int/nmh/events/un_ncd_summit2011/political_declaration_en.pdf.
4. Capstick S, et al. Relationships between health and culture in Polynesia–A review. Social Science & Medicine. 2009. 68(7): p. 1341-1348.
5. Parry J. Pacific Islanders pay heavy price for abandoning traditional diet. . Bull World Health Organ. 2010. 88: p. 484–5.
6. Doak CM, et al. The dual burden household and the nutrition transition paradox. Int J Obes Relat Metab Disord. 2005. 29: p. 129-36.
7. Popkin BM and Doak CM. The obesity epidemic is a worldwide phenomenon. Nutrition Reviews. 2009. 56(4): p. 106-114.
8. Prentice AM. The emerging epidemic of obesity in developing countries. International Journal of Epidemiology. 2006. 35(1): p. 93-99.
9. Hodge A, Dowse G, and Zimmet P. Obesity in Pacific populations. Public Health Dialoque. 1996. 3(1): p. 9.
10. Lim SS, et al. A comparative risk assessment of burden of disease and injury attributable to 67 risk factors and risk factor cluster in 21 regions, 1990–2010: a systematic analysis for the Global Burden of Disease Study 2010. Lancet. 2012. 380: p. 2224–60.
11. Gill T. Epidemiology and health impact of obesity: an Asia Pacific perspective. Asia Pacific Journal Of Clinical Nutrition. 2006. 15 p. 3-14.
12. Asia Pacific Cohort Studies. The burden of overweight and obesity in the Asia–Pacific region. Obesity Reviews. 2007. 8(3): p. 191-196.
13. Coyne T, Hughes R, and Langi S. Lifestyle diseases in Pacific communities. 2000: Secretariat of the Pacific Community Noumea, New Caledonia.
273
14. Smith B, et al. Body mass index, physical activity and dietary behaviours among adolescents in the Kingdom of Tonga. Public Health Nutrition. 2007. 10(02): p. 137-144.
15. Goulding A, et al. Ethnic Differences in Extreme Obesity. The Journal of Pediatrics, 2007. 151(5): p. 542-544.
16. Pryor J, Cornelius M, and De Courten M. Fiji Non-communicable Diseases (NCD) STEPS Survey 2002. 2004, Ministry of Health, Fiji: Suva.
17. Schultz JT, Vatucawaqa P, and Tuivaga J. 2004 Fiji National Nutrition Survey. 2005 [cited 2010 13 May]; Available from: https://apps.who.int/infobase/mddetails.aspx?surveycode=102722a1.
18. Saito S. 1993 National Nutrition Survey- Main Report. 1995, National Food and Nutrition Committee: Suva, Fiji.
19. Becker AE, Gilman SE, and Burwell RA, Changes in prevalence of overweight and in body image among Fijian women between 1989 and 1998. Obes Res. 2005. 13(1): p. 7.
20. Hughes R and Lawrence M. Globalization, food and health in Pacific Island countries. Asia Pacific Journal Clinical Nutrition. 2005. 14(4): p. 8.
21. Evans M, et al. Globalization, diet, and health:An example from Tonga. Bull World Health Organization. 2001. 79(9): p. 6.
22. Lako JV and Nguyen C. Dietary pattern and risk factors of diabetes mellitus among urban indigenous women in Fiji. Asia Pacific Journal of Clinical Nutrition. 2001. p. 188-193.
23. Sio B, Tunidau-Schultz J, and Chand M. Professional challenges in the Pacific region. Australian Journal of Nutrition and Dietetics. 1996. 53: p. 13- 19.
24. Thow AM and Snowdon W. The Effect of Trade and Trade Policy on Diet and Health in the Pacific Islands. In Trade, food, diet and health: Perspectives and policy options. Hawkes C, et al. 2009, Wiley-Blackwell: Oxford, United Kingdom. p. 147-168.
25. Grosvenor M and Smolin L. Visualizing Nutrition: Everyday Choices, in Energy balance and weight management, Grosvenor M and Smolin L, Editors. 2009, John Wiley and Sons: New Jersey, USA. p. 288-229.
26. Vandenbroeck P, Gossens J, and Clemens M. Foresight. Tackling Obesities: Future Choices - Obesity System Atlas. 2007, Government Office for Science, London.: Government Office for Science, London.
27. Cohen DA. Obesity and the built environment: changes in environmental cues cause energy imbalances. International Journal of Obesity. 2008. 32: p. S137-S142.
274
28. Swinburn BA., et al. The global obesity pandemic: shaped by global drivers and local environments. The Lancet 2011. 378(9793): p. 804-814.
29. Evans M, et al. Diet, health and the nutrition transition:some impacts of economic and soci-economic factors on food consumption patterns in the Kingdom of Tonga. Pac Health Dialoq. 2002. 9(2): p. 309-315.
30. Swinburn BA, et al. The Pacific Obesity Prevention in Communities project: project overview and methods_921 3.11. Obesity Reviews. 2011. 12(Suppl. 2): p. 3–11.
31. World Health Organization. Obesity and overweight. 2006 08/12/2010]; Available from: http://www.who.int/mediacentre/factsheets/fs311/en/index.html.
32. Hiza HA, et al. Body Mass Index and Health. Family Economics and Nutrition Review. 2001. 13(2): p. 52-54.
33. Deurenburg P and Yap M. The assessment of obesity: methods for measuring body fat and global prevalence of obesity. Baillieres Best Pract Res Clin Endocrinol Metab. 1999. 13(1): p. 1-11.
34. Weisell RC. Body mass index as an indictator for obesity. Asia Pac J Clin Nutr, 2002. 11 (suppl 8): p. S681-4.
35. Cole TJ, et al. Establishing a standard definition for child overweight and obesity worldwide:International survey. British Medical Journal. 2000. 320(6): p. 1-6.
36. Riberio M. What are the cut-offs of BMI percentiles to define underweight, normality, risk of obesity and obesity ( and its subclasses) in children and adolescents? 12/17/2010]; Available from: http://www.eufic.org/page/en/page/FAQ/faqid/bmi-percentages.
37. de Onis, M., et al. Development of a WHO growth reference for school-aged children and adolescents. Bulletin of the World Health Organization, 2007. 85(9): p. 660-667.
38. Cole TJ, et al. Body mass index cut offs to define thinness in children and adolescents:International survey. BMJ: British Medical Journal. 2007. 335(7612): p. 194-197.
39. Wulan SN, Westerterp KR, and Plasqui G. Ethnic differences in body composition and the associated metabolic profile: A comparative study between Asians and Caucasians. Maturitas. 2010. 65(4): p. 315-319.
40. Flegal KM, et al. High adiposity and high body mass index–for-age in US children and adolescents overall and by race-ethnic group. The American Journal of Clinical Nutrition. 2010. 91(4): p. 1020-1026.
275
41. Parks EP, et al. Change in body composition during a weight loss trial in obese adolescents. Pediatric Obesity. 2013: p. 1-10.
42. Kagawa M, et al. Ethnic differences in body composition and anthropometric characteristics in Australian Caucasian and urban Indigenous children. British Journal of Nutrition. 2009. 102: p. 938-946.
43. Rush EC, Freitas I, and Plank LD. Body size, body composition and fat distribution: comparative analysis of European, Maori, Pacific Island and Asian Indian adults. British Journal of Nutrition. 2009. 102(04): p. 632-641.
44. Deurenberg P, Yap M, and van Staveren WA, Body mass index and percent body fat: a meta analysis among different ethnic groups. Int J Obes Relat Metab Disord 1998. 22: p. 1164–1171.
45. Sampei MA, et al. Anthropometry and body composition in ethnic Japanese and Caucasian adolescent boys. Pediatr Int. 2008. 50(5): p. 679–86.
46. Sluyter JD, et al. Body mass index and percent body fat in a New Zealand multi-ethnic adolescent population. International Journal of Pediatric Obesity. 2011. 6: p. 36–44.
47. Rush EC, et al. BMI, fat and muscle differences in urban women of five ethnicities from two countries. International Journal of Obesity. 2007. 31(8): p. 1232–1239.
48. Rush EC, et al. Body composition and physical activity in New Zealand Maori, Pacific and European children aged 5–14 years. British Journal of Nutrition. 2003. 90(6): p. 1133–1139.
49. Tyrrel VJ, et al. Obesity in Auckland school children: a comparison of the body mass index and percentage body fat as the diagnostic criterion. International Journal of Obesity 2001. 25: p. 164-169.
50. WHO Global Health Observatory. 2012; Available from: www.who.int.org.
51. de Onis, M., M. Blossner, and E. Borghi, Global prevalence and trends of overweight and obesity among preschool children. American Journal of Clinical Nutrition. 2010. 92(5): p. 1257-64.
52. World Health Organization. Obesity. 2010 [cited 2010 14 September]; Available from: http://www.who.int/topics/obesity/en/.
53. Ministry of Health. Appendix 5 − Online Data Tables of 2006/07 New Zealand Health Survey Results − Chapter 2: Health Behavoiurs and Risk Factors: Adult Data. In: A Portrait of Health: Key Results of the 2006/07 2008 [cited 2013 12 June ]; Available from: http://www.health.govt.nz/publication/portrait-health-key-results-2006-07-new-zealand-health-survey.
276
54. Gani A. Some Aspects of Communicable and Non-communicbale Diseases in Pacific Islands Countries. Soc Indic Res. 2009. 91(2): p. 171 -187.
55. World Health Organization. WHO Global infobase. 2001 [cited 2010 13 May]; Available from: http://www.who.int/infobase/compare.aspx?dm=5.
56. Mariel M Finucane, et al. National, regional, and global trends in body-mass index since 1980: systematic analysis of health examination surveys and epidemiological studies with 960 country-years and 9·1 million participants. Lancet 2011 [cited 2013; Available from: www.thelancet.com.
57. World Health Organization. Noncommunicable Disease Country profile. 2011, World Health Organization: Geneva.
58. Khan N, et al. Evidence for a Curriculum Review for Secondary Schools in Fiji. Pac Health Dialog. 2006. 13(2): p. 97 -102.
59. Spiegelman BM and Flier JS. Obesity and the Regulation of Energy Balance. Cell. 2001. 104(4): p. 531-543.
60. Woo R, Daniels-Kush R, and Horton ES. Regulation of Energy Balance. Annual Review of Nutrition. 1985. 5(1): p. 411-433.
61. Webber J. Energy balance in obesity. Proceedings of the Nutrition Society, 2003. 62(2): p. 539-543.
62. Lustig RH. Childhood obesity: behavioral aberration or biochemical drive? Reinterpreting the First Law of Thermodynamics. Nat Clin Pract End Met. 2006. 2(8): p. 447-458.
63. Bray GA and Popkin BM. Dietary fat intake does affect obesity! The American Journal of Clinical Nutrition. 1998. 68(6): p. 1157-1173.
64. Warburton D. The physical activity and exercise continuum, in Physical activity and obesity, Bouchard C and Katzmarzyk PT. 2010. Human Kinetics Publishers: Champaign, IL.
65. Hill J. Physical activity and obesity. The Lancet. 2004. 363(9404): p. 182.
66. Fox KR and Hillsdon M, Physical activity and obesity. Obesity Reviews, 2007. 8 (Suppl. 1): p. 115-121.
67. Vandenbroeck P, Gossens J, and Clemens M. Foresight. Tackling Obesities: Future Choices - Building the Obesity System Atlas. 2007 [cited 2010 02 February]; Available from: http://www.foresight.gov.uk/obesity/12.pdf.
68. Finegood DT, Merth TDN, and Rutter H. Implications of the Foresight Obesity System Map for Solutions to Childhood Obesity. Obesity. 2010. 18 (suppl 1): p. S13-S16.
277
69. Hall KD, et al. Energy balance and its components: implications for body weight regulation. The American Journal of Clinical Nutrition. 2012. 95(4): p. 989-994.
70. Hill JO, Melanson EL, and Wyatt HT. Dietary fat intake and regulation of energy balance: implications for obesity. The Journal of Nutrition. 2000. 130(2): p. 284S-288S.
71. Lissner L and Heitmann BL. Dietary fat and obesity: evidence from epidemiology. European Journal of Clinical Nutrition. 1995. 49(2): p. 79.
72. Willett WC.Is dietary fat a major determinant of body fat? The American journal of clinical nutrition. 1998. 67(3): p. 556S-562S.
73. Swinburn B. andRavussin E. Energy balance or fat balance? The American journal of clinical nutrition. 1993. 57(5): p. 766S-770S.
74. Bray GA, Paeratakul S, and Popkin BM. Dietary fat and obesity: a review of animal, clinical and epidemiological studies. Physiology & Behavior. 2004. 83(4): p. 549-555.
75. World Health Organization. Diet, nutrition and the prevention of chronic diseases:Report of the joint WHO/FAO expert consultation-WHO Technical Report Series, No.916. 2012 [cited 2012 31 January]; Available from: http://www.who.int/dietphysicalactivity/publications/trs916/en/index.html.
76. World Health Organization. Global Strategy on Diet, Physical Activity and Health. 2012 [cited 2012 31 January]; Available from: http://www.who.int/dietphysicalactivity/diet/en/index.html.
77. National Health and Medical Research Council (NHMRC). Dietary guidelines for all Australians. 2013 [cited 2013 17 June]; Available from: http://www.nhmrc.gov.au/guidelines/publications/n29-n30-n31-n32-n33-n34.
78. Ministry of Health. Food and Nutrition Guidelines. 2008 [cited 2013 17 June]; Available from: http://www.health.govt.nz/our-work/preventative-health-wellness/nutrition/food-and-nutrition-guidelines.
79. Gidding SS, et al. Dietary recommendation for children and adolescents: A Guide for Practioners: Consensus Statement From the American Heart Association. Circulation. 2005. 112(13): p. 2061-2075.
80. Yao M and Roberts SB. Dietary Energy Density and Weight Regulation. Nutrition Reviews.2001. 59(8): p. 247-258.
81. Pereira MA and Ludwig DS. Dietary fiber and body-weight regulation: observations and mechanisms. Pediatric Clinics of North America.2001. 48(4): p. 969-980.
82. Tohill BC. Dietary intake of fruit and vegetables and management of body weight. 2005; Available from:
278
http://www.who.int/dietphysicalactivity/publications/f&v_weight_management.pdf.
83. Lin BH and Morrison RM. Higher Fruit Consumption Linked With Lower Body Mass Index. Food Review. 2002. 25(3): p. 28-32.
84. Schroeder N, et al. Influence of whole grain barley, whole grain wheat, and refined rice-based foods on short-term satiety and energy intake. Appetite. 2009. 53(3): p. 363-369.
85. Newby PK, et al. Dietary patterns and changes in body mass index and waist circumference in adults. The American Journal of Clinical Nutrition. 2003. 77(6): p. 1417-1425.
86. Steffen LM, et al. Whole grain intake is associated with lower body mass and greater insulin sensitivity among adolescents. American Journal of Epidemiology. 2003. 158(3): p. 243-250.
87. Giacco R, et al. Whole grain intake in relation to body weight: From epidemiological evidence to clinical trials. Nutrition, Metabolism and Cardiovascular Diseases. 2011. 21(12): p. 901-908.
88. Rolls BJ, Ello-Martin JA, and Tohill BC. What can intervention studies tell us about the relationship between fruit and vegetable consumption and weight management? Nutrition Review. 2004. 62(1): p. 1 - 17.
89. Tohill B, Seymour J, and Serdula M. What epidemiologic studies tell us about the relationship between fruit and vegetable consumption and body weight. Nutrition Review. 2004. 62(10): p. 365 - 74.
90. Serdula MK, et al. The association between fruit and vegetable intake and chronic disease risk factors. Epidemiology. 1996. 7(2): p. 161-165.
91. Alinia S, Hels O, and Tetens I. The potential association between fruit intake and body weight-a review. Obesity Reviews. 2009. 10(6): p. 639-47.
92. Ledoux TA, Hingle MD, and Baranowski T. Relationship of fruit and vegetable intake with adiposity: a systematic review. Obesity Reviews. 2011. 12(5): p. 143-150.
93. Moreno L, et al. Trends of Dietary Habits in Adolescents. Critical Reviews in Food Science and Nutrition. 2010. 50(2): p. 106-112.
94. Mota J, et al. Relationships between physical activity, obesity and meal frequency in adolescents. Annals of Human Biology. 2008. 35(1): p. 1-10.
95. Toschke AM, et al. Meal frequency and childhood obesity. Obesity research. 2005. 13(11): p. 1932-1938.
279
96. Koletzko B. and AM. Toschke, Meal Patterns and Frequencies: Do They Affect Body Weight in Children and Adolescents? Critical Reviews in Food Science and Nutrition. 2010. 50(2): p. 100-105.
97. Nicklas T, et al. Eating patterns and obesity in children. The Bogalusa Heart Study. American Journal of Preventive Medicine. 2003. 25(1): p. 9 - 16.
98. Nicklas TA, et al. Children’s meal patterns have changed over a 21-year period: the Bogalusa Heart Study. Journal of American. Dietetics. Association. 2004. 104(5): p. 753–61.
99. Thompson OM, et al. Dietary pattern as predictor of change in BMI z-score amon girls. Internation Journal of Obesity. 2006. 30: p. 176-182.
100. Franko DL, et al. The relationship between meal frequency and body mass index in black and white adolescent girls: more is less. International Journal of Obesity. 2008. 32(1): p. 23-29.
101. Utter J, et al., At-Home Breakfast Consumption among New Zealand Children: Associations with Body Mass Index and Related Nutrition Behaviors. Journal of the American Dietetic Association. 2007. 107(4): p. 570-576.
102. Timlin MT, et al., Breakfast Eating and Weight Change in a 5-Year Prospective Analysis of Adolescents: Project EAT (Eating Among Teens). Pediatrics, 2008. 121(3): p. e638-e645.
103. Dubois L, Girard M, and Potvin Kent M. Breakfast eating and overweight in a pre-school population: is there a link? Public Health Nutrition- Cab International. 2006. 9(4): p. 436.
104. Duncan JS, et al. Risk factors for excess body fatness in New Zealand children. Asia Pacific Journal of Clinical Nutrition. 2008. 17(1): p. 138-147.
105. Niemeier HM, et al. Fast Food Consumption and Breakfast Skipping: Predictors of Weight Gain from Adolescence to Adulthood in a Nationally Representative Sample. Journal of Adolescent Health. 2006. 39(6): p. 842-849.
106. Berkey CS, et al. Longitudinal study of skipping breakfast and weight change in adolescents. International Journal of Obesity. 2003. 27: p. 1258 - 1266.
107. Maddah, M. and B. Nikooyeh. Factors associated with overweight in children in Rasht, Iran: gender, maternal education, skipping breakfast and parental obesity. Public Health Nutrition. 2010. 13(02): p. 196-200.
108. Malik VS, Schulze MB, and Hu FB. Intake of sugar-sweetened beverages and weight gain: a systematic review. The American Journal of Clinical Nutrition. 2006. 84(2): p. 274-288.
280
109. Forshee RA, Anderson PA, and Storey ML. Sugar-sweetened beverages and body mass index in children and adolescents: a meta-analysis. The American Journal of Clinical Nutrition. 2008. 87(6): p. 1662-1671.
110. National Food & Nutrition Centre. Food and health guidelines for Fiji. 2013 [cited 2013 27 June]; Available from: http://www.nutrition.gov.fj/wp-content/uploads/2013/02/FoodandHealthGuidelines-FINAL-V3.pdf.
111. Astrup A and Tremblay A. Chapter 3: Energy metabolism, in Introduction to human nutrition, Gibney MJ, et al., Editors. 2009, Wiley-Blackwell: Oxford, UK. p. 31-48.
112. Harris JA and Benedict FG. Biometric study of basal metabolism in man. 1919, Carnegie Institute of Washington: Washington, DC.
113. Shils ME, et al. Modern Nutrition in Health and Diseases. 10 ed. 2006, Lippincott Williams & Wilkins: Springhous PA. 2024.
114. DeLany JP and Lovejoy JC. Energy Expenditure. Endocrinology and Metabolism Clinics of North America. 1996. 25(4): p. 831-846.
115. Wilborn C, et al. Obesity: Prevalence, Theories, Medical Consequences, Management, and Research Directions. Journal of the International Society of Sports Nutrition. 2005. 2(2): p. 4 - 31.
116. Hill O, Saris W, and Levine J. The Handbook of Obesity: Etiology and Pathophysiology. 2004, Marcel Dekker Inc: New York.
117. Westerterp KR and Goran MI. Relationship between physical activity related energy expenditure and body composition: a gender difference. International Journal of Obesity. 1997. 21(3): p. 184-188.
118. Black AE, et al. Human energy expediture in affluent societies: an analysis of 574 doubly-labelled water measurements. European Journal of Clinical Nutrition. 1996. 50: p. 72-92.
119. Carpenter WH, et al. Influence of body composition and resting metabolic rate on variation in total energy expenditure: a meta-analysis. American Journal of Clinical Nutrition. 1995. 61(1): p. 4-10.
120. Schultz LO and Schoeller DA. A compilation of total daily energy expenditures and body weights in healthy adults. American Journal of Clinical Nutrition. 1994. 60(5): p. 676-681.
121. Rolfes SR, Pinna K, and Whitney EN. Chapter 8: Energy balance and body composition. In Understanding normal and clinical nutrition, Rolfes SR, Pinna K, and Whitney EN. 2006, Thompson Learning Inc: Belmont, CA.
122. DeLany JP, et al. High energy expenditure masks low physical activity in obesity. International Journal of Obesity. 2012. online publication: p. 1-6.
281
123. van den Berg SW, et al. Genetic variations in regulatory pathways of fatty acid and glucose metabolism are associated with obesity phenotypes: a population-based cohort study. International Journal Of Obesity. 2009. 33(10): p. 1143-1152.
124. Furusawa T, et al. The Q223R polymorphism in LEPR is associated with obesity in Pacific Islanders. Human Genetics. 2010. 127(3): p. 287-294.
125. Bircan I. Genetics of Obesity. J Clin Res Ped Endo. 2009(Suppl 1): p. 54-57.
126. Filozof C and Gonzalez C. Predictors of weight gain: the biological-behavioural debate. Obesity Reviews. 2000. 1(1): p. 21-26.
127. Boutin P and Froguel P. Genetics of human obesity. Best Practice & Research Clinical Endocrinology & Metabolism. 2001. 15(3): p. 391-404.
128. Duarte NL, et al. Obesity, Type II diabetes and the beta 2 adrenoceptor gene Gln27Glu polymorphism in the Tongan population. Clin Sci. 2003. 104(3): p. 211-215.
129. Dai F, et al. Genome-wide scan for adiposity-related phenotypes in adults from American Samoa. Int J Obes. 2007. 31(12): p. 1832-1842.
130. Åberg K, et al. Susceptibility Loci for Adiposity Phenotypes on 8p, 9p, and 16q in American Samoa and Samoa. Obesity. 2009. 17(3): p. 518-524.
131. Crawford D and Ball K. Behavioural determinants of the obesity epidemic. Asia Pacific Journal Clinical Nutrition. 2002. 11 Suppl 8: p. S718-21.
132. Propective Studies Collaboration. Body mass index and cause-specific mortality in 900 000 adults: collaborative analysis of 57 prospective studies. Lancet. 2009. 373: p. 1083-96.
133. Prosser L, et al. Obesity prevention in secondary schools. In Preventing Childhood Obesity, Waters E, et al. 2010, Blackwell Publishing: Oxford, London.
134. Coyne T. Lifestyle diseases in pacific communities. 2000, Noumea, New Caledonia:Secretariat of Pacific Comission.
135. Swinburn B, et al. The Pacific OPIC Project (Obesity Prevention In Coomunities):Objectives and design. Pacific Health Dialogue. 2007. 14: p. 14.
136. Brownell KD, et al. The need for bold action to prevent adolescent obesity. Journal of Adolescent Health. 2009. 45 ((3 Suppl)): p. S8-17.
137. Buijsse B, et al. Fruit and vegeatbles intakes and subsequent changes in body weight in European populations: results from the project on Diet, Obesity, and Genes (DIOGenes). American Journal of Clinical Nutrition. 2009. 90(1): p. 1-8.
282
138. Kumanyika SK. Environmental influences on childhood obesity: Ethnic and cultural influences in context. Physiology & Behavior. 2008. 94(1): p. 61-70.
139. Swinburn B, Egger G, and Raza F. Dissecting obesogenic environments:the development and application of a framework for identifying and prioritizing environmental interventions for obesity. Prev Med. 1999. 29(6 Pt 1): p. 7.
140. Egger G and Swinburn B. An" ecological" approach to the obesity pandemic. BMJ: British Medical Journal. 1997. 315(7106): p. 477.
141. Swinburn B. and Egger G. Preventive strategies against weight gain and obesity. Obesity Reviews. 2002. 3(4): p. 289-301.
142. Baker PT. The adaptive limits of human populations. Man, 1984: p. 1-14.
143. Ulijaszek SJ. Human energetics in biological anthropology. Vol. 16. 1995: Cambridge University Press.
144. Zimmet P. Globalization, coca colonization and the chronic disease epidemic: can the Doomsday scenario be averted? Journal of Internal medicine. 2000. 247(3): p. 301-310.
145. Prior IA, et al. Cholesterol, coconuts, and diet on Polynesian atolls: a natural experiment: the Pukapuka and Tokelau island studies. The American Journal of Clinical Nutrition. 1981. 34(8): p. 1552-1561.
146. Englberger L, et al. Pacific issues of biodiversity, health and nutrition. Pacific Health Dialog. 2007. 14(2): p. 111-114.
147. Englberger L, Marks GC, and Fitzgerald MH. Insights on food and nutrition in the Federated States of Micronesia: a review of the literature. Public Health Nutrition. 2003. 6(01): p. 5-17.
148. Hodges A, et al. Diet in an urban Papua New Guinea population with high levels of cardiovascular risk factors. Ecology of Food and Nutrition. 1996. 35(4).
149. Waqanivalu TK., Pacific islanders pay heavy price for abandoning traditional diet. Bull World Health Organization. 2010. 88: p. 484-485.
150. Harvey PW and Heywood PF. Twenty five years of dietary change in Simbu Province, Papua New Guinea. Ecology of food and nutrition. 1983. 13(1): p. 27-35.
151. Zimmet P. and Whitehouse S. Pacific islands of Nauru, Tuvalu and Western Samoa. Western Diabetes: their emergence and prevention. London: Edward Arnold, 1981: p. 204-224.
152. Roger H. Food Culture in the Pacific Islands. 2009, Greenwood Publishing Group: California, US. 233.
283
153. Popkin BM. Global nutrition dynamics: the world is shifting rapidly toward a diet linked with noncommunicable diseases. American Journal of Clinical Nutrition. 2006. 84(2): p. 289-298.
154. Akashiba T, et al. Determinants of chronic hypercapnia in Japanese men with obstructive sleep apnea syndrome. Chest. 2002. 121(2): p. 415-21.
155. Popkin BM. The nutrition transition and its health implications in lower-income countries. Public health nutrition, 1998. 1(01): p. 5-21.
156. Popkin BM Urbanization, lifestyle changes and the nutrition transition. World Development, 1999. 27(11): p. 1905-1916.
157. Popkin, B.M., S.H. Horton, and S. Kim. The nutrition transition and prevention of diet-related diseases in Asia and the Pacific. 2001: Asian Development Bank Manila.
158. Popkin BM. The shift in stages of the nutrition transition in the developing world differs from past experiences! Public health nutrition. 2002. 5(1A): p. 205-214.
159. Popkin BM. The nutrition transition: an overview of world patterns of change. Nutrition Reviews. 2004. 62(s2): p. S140-S143.
160. Drewnowski A and Popkin BM, The nutrition transition: new trends in the global diet. Nutrition Reviews. 1997. 55(2): p. 31-43.
161. Mavoa HM and McCabe M. Sociocultural factors relating to Tongans' and Indigenous Fijians' patterns of eating, physical activity and body size. Asia Pacific Journal of Clinical Nutrition. 2008. 17(3): p. 375-383.
162. Becker AE. Body, self, and society : The View from Fiji. 1995, University of Pennsylvania Press: Philadelphia. 260.
163. Evans M, et al. Diet, health and the nutrition transition: some impacts of economic and socio-economic factors on food consumption patterns in the Kingdom of Tonga. Pacific Health Dialog. 2002. 9(2): p. 309-315.
164. World Bank Report
165. Horne CLS. A year in Fiji. An Enquiry into the botanical and economical resources of the colony. 1881: London: Sottiswood.
166. Parkinson S. Food Intake. In Food and Nutrition in Fiji :Food production, composition, and intake. Jansen AAJ, Parkinson S, and Robertson AFS. 1990, Department of Nutrition and Dietetics of the Fiji School of Medicine and The Institute of Pacific Studies of the University of the South Pacific: Suva, Fiji.
167. O'Laughlin C and Holmes S. A survey of economics and nutritional conditions in Indian Households. 1954, South Pacific Health Service: Suva.
284
168. Nayacakalou RR. Traddition and change in the Fijian village. 1978, South Pacific Social Science Association: Suva.
169. Ravuvu AD. Development or dependence. 1988, University of the South Pacific: Suva.
170. Chandra S. Food production and consumption of Fijian and Indian farmers in the Sigatoka Valley. Fiji Agric J, 1981. 43(1).
171. Johnson JS and Lambert JN. The National Food and Nutrition Survey of Fiji. 1982, FAO Field Document FIJ/79/004.
172. Lako J., et al. Phytochemical intakes of the Fijian population. Asia Pacific Journal of Clinical Nutrition. 2006. 15(2): p. 275-285.
173. Pollock NJ. Establishing the Foundations of Poverty in the Pacific. in paper delivered to 2002 DevNet Conference ‘Contesting Development: Pathways to Better Practice’, Massey University, New Zealand. 2002.
174. Pollock NJ. Cultural elaborations of obesity - fattening of practices in Pacific societies. Asia Pacific Journal of Clinical Nutrition. 1995. 4(4): p. 357-360.
175. Bruss MB, et al. Food, culture, and family: Exploring the coordinated management of meaning regarding childhood obesity. Health Communication. 2005. 18(2): p. 155-175.
176. Farb P and Armelagos G. Consuming passions, the anthropology of eating. 1980, Houghton Mifflin.
177. Brewis A. Obesity: Cultural and biocultural perspective. ed. Marshall M. 2011, Rutgers University Press: New Brunswick.
178. Cacavas K, et al. Tongan adolescents' eating patterns: opportunities for intervention. Asia-Pacific Journal of Public Health. 2011. 23(1): p. 24-33.
179. Mavoa HM. The "C" factor: cultural underpinnings of food, eating and body size, in 10th International Congress on Obesity. 2006: Australasia Pty Ltd, Sydney, N.S.W. p. 1-8.
180. Ball K and Crawford D. The role of socio-cultural factors in the obesity epidemic. In Obesity Prevention and Public Health. Crawford D and Jeffery RW. 2005, Oxford University Press: London. p. 38-53.
181. Keesing RM and Tonkinson R. Reinventing traditional culture:The politics of Kastom in Island Melanesia (special issue). Mankind. 1982. 13(4): p. 297-399.
182. Lawson S. Culture/s: Conceptualizing and Theorization. New York: Palgrave Mcmillan; 2006:
285
183. Thompson M, Richard Ellis, and Wildavsky. Cultural Theory. 1990, Boulder (CO): West View Press.
184. Keesing RM. Theories of culture re-visited. Canberra Anthropology, 1990. 13(2): p. 46-60.
185. Lawson S. Culture and Context in World Politics. 2006, PAULGRAVE MACMILLAN: New York.
186. Helman CG. Culture, Health and Illness. 1994, Butter-worth-Heinemann: Oxford. 9.
187. O'Hagan K. Culture, cultural identity, and cultural sensitivity in child and family social network. Child and Family Social Work. 2001. 4(4): p. 269-281.
188. Hofstede G. Values survey module 1994 manual. Institute for Research on Intercultural Cooperation: Maastrict, The Netherlands. 1994.
189. Sewell WH. The Concept(s) of Culture. In Practicing history: a new direction in historial writing after the linguistic turn, Spiegel GM. 2005, Routlege: New York.
190. Tupoulahi, C. The socio-cultural antecedents of obesity in Tonga, in Social Sciences. 1997, Flinders: Adelaide.
191. Ravuvu A. A Fijian Cultural Perspective on Food.In Food and Nutrition in Fiji. Jansen AA, Robertson A. 1991, Department of Nutrition and Dietetics, Fiji School of Medicine and University of the South Pacific: Suva. p. 622-635.
192. Morton H. Becoming Tongan: An ethnography of childhood (1st ed). 1996, Honolulu: University of Hawaii Press.
193. Palispis ES. Introduction to Values Education. 1995, Rex Book Store: Phillipines.
194. Raths LE. Values, concepts and techniques. 1976, National Education Association: Washington DC. 9-17.
195. Andreas TD. Understanding values. 1980, New Day Publishers: Quezon City. 25.
196. Bulatao JS. Manilenos Mainspring. Four readings in Phillipines Value. 1966, Ateneo de Manila University: Quezon City.
197. O'Donnell CR. Right to a Family Environment in Pacific Island Cultures. Int'l J. Child. Rts. 1995. 3: p. 87.
198. Mokuau N. Pacific Islanders. Encyclopedia of Social Work. 1995. 3: p. 1795-1801.
286
199. Campell DT. Social attitudes and other acquired behavioral dispositions.In Psychology: A Study of a Science, Koch S. 1963, McGraw-Hill: New York. p. 94-172.
200. Greenwald AG. On defining attitude and attitude theory, in Psychological Foundations of Attitudes, Greenwald AG, Brock TC, and Ostrom TM, Editors. 1968, Academic Press: New York. p. 361-388.
201. McGuire WJ. The nature of attitudes and attitude change. 2 ed.In: The Handbook of Social Psychology. Lindzey G and Aronson E. 1969, Reading Mass. 136-314.
202. Fishbein M and Ajzen I. Belief, Attitude, Intention and Behavior: An Introduction to Theory and Research. 1975, Addison-Wesley Publishing Company: Philippines. 578.
203. Underwood C. Belief and attitude change in the context of human development. I. Communication for Participatory Development 2002 [cited 531; Available from: http://www.eolss.net/ebooklib/ebookcontents/E6-60-ThemeContents.pdf.
204. Taylor SE. The social being in social psychology. 4 ed. New Yolk and Oxford: Oxford University Press;1998.
205. Heider F. Attitudes and cognitive organization. The Journal of psychology. 1946. 21(1): p. 107-112.
206. Ajzen I and Fishbein M. Attitude-behavior relations: A theoretical analysis and review of empirical research. Psychological Bulletin. 1977. 84(5): p. 888-918.
207. Albarracín D, Johnson BT, and Zanna MP. The handbook of attitudes. 2005: Lawrence Erlbaum Associates Publishers.
208. Fishbein M. An Investigation of the Relationships between Beliefs about an Object and the Attitude toward that Object. Human Relations. 1963. 16(3): p. 233-239.
209. Rokeach M. Beliefs, attitudes, and values. 1972, Jossey-Bass.: SanFrancisco.
210. Fiji Islands Bureau of Statistics. Fiji National Census of population 2007. 2007 [cited 2010 30 February]; Available from: http://www.statsfiji.gov.fj/.
211. Fiji School of Medicine. Race, culture and research in Fiji. Available from: http://www.fsm.ac.fj/Medicine%20Website/HADIF%20website/1%20Race/1%20Race.htm.
212. Brennan L, McDonald J, and Shlomowitz R. The geographic and social origins of Indian indentured labourers in Mauritius, Natal, Fiji, Guyana and Jamaica. South Asia: Journal of South Asian Studies. 1998. 21(sup001): p. 39-71.
287
213. Prasad S. Girmit: The Saga of the Indenture System in Fiji. 2003: University of Western Sydney.
214. Fiji Islands Bureau of Statistics. 2007 Census of population and housing. 2007 [cited 2010 03 Feb]; Available from: http://www.statsfiji.gov.fj/Census2007/Release%201%20-%20Population%20Size.pdf.
215. Prasad BC. Fiji's economy: a view over 25 years. 2012; Available from: devpolicy.org/fijis-economy-a-view-over-25-years/.
216. Asia Development Bank. Fiji: Economy. 2013 [cited 2013 6 March]; Available from: http://www.adb.org/countries/fiji/economy.
217. Fiji Islands Bureau of Statistics. Key statistics-Household Income and Expenditure. 2012 [cited 2013 23 June]; Available from: http://www.statsfiji.gov.fj/index.php/search?searchword=average%20income&ordering=newest&searchphrase=all.
218. Lo FC. and Marcotullio PJ, Globalisation and urban transformations in the Asia-Pacific region: a review. Urban Studies. 2000. 37(1): p. 77-111.
219. Olds K. Globalisation and the Asia-Pacific: contested territories. 1999: Psychology Press.
220. Briguglio L. Small island developing states and their economic vulnerabilities. World development, 1995. 23(9): p. 1615-1632.
221. Hezel, FX, Pacific Island Nations: How viable are their economies? 2012: Honolulu, HI: East-West Center.
222. Thow AM andHawkes C, The implications of trade liberalization for diet and health: a case study from Central America. Global Health. 2009. 5: p. 5.
223. Hawkes C. Uneven dietary development: linking the policies and processes of globalization with the nutrition transition, obesity and diet-related chronic diseases. Globalization and health. 2006. 2(1): p. 4.
224. Mintz SW and Du Bois CM. The Anthropology of Food and Eating. Annual Rev Anthropol. 2002. 31: p. 99-119.
225. Pollock N. These Roots Remain. 1992, The Institute for Polynesian Studies: Laie, Hawaii. 298.
226. Lako JV. Dietary trend and diabetes: Its association among indigeniuos Fijians 1952 to 1994. Asia Pacific Journal Clinical Nutrition. 1994. 10(3): p. 183-187.
227. Chand A. The Fiji Indian Chutney Generation: The Cultural spread between Fiji and Australia. International Journal of Media and Cultural Politics. 2007. 3(2): p. 131-148.
288
228. Lakha S. and M. Stevenson Indian Identity in Multicultural Melbourne. Some preliminary observations. Journal of Intercultural Studies. 2001. 22(3): p. 245-262.
229. Neill DB. Indo-Fijian Children’s BMI. Human Nature. 2007. 18(3): p. 209-224.
230. Pollock NJ. Cultural elaborations of obesity-fattening practices.
231. Craig PL, et al. Do Polynesians still believe that big is beautiful? Comparision of body size perceptions and preferences of Cook Islands, Maori and Australians. N Z Medical Journal. 1996. 109(1023): p. 200-203.
232. Brewis A., et al. Perceptions of body size in Pacific Islanders. Journal of the International Association for the Study of Obesity.1998. 22(2): p. 185-189.
233. Becker AE, Body, Self and Society. The View from Fiji. 1995, Philadelphia: University of Pennsylvania Press.
234. Becker AE, Body Imagery, Ideals, and Cultivation: Discourses on alienation and Integration, in Body, Self, and Society: The view from Fiji. 1995, University of Pennsylvania Press: Philadelphia. p. 27-56.
235. Becker AE. Body image in Fiji: The self in the body in the community. 1990, Havard University Boston, MA.
236. Gregg E. The cultural ideology of body image among Fijian women. 2000, Union College: Lincoln, Nebraska.
237. Becker A. Television, Disordered Eating, and Young Women in Fiji: Negotiating Body Image and Identity during Rapid Social Change. Culture, Medicine and Psychiatry. 2004. 28(4): p. 533-559.
238. Becker AE, et al. Eating behaviours and attitudes following prolonged exposure to television among ethnic Fijian adolescent girls. The British Journal of Psychiatry. 2002. 180(6): p. 509-514.
239. Becker AE, et al., Facets of acculturation and their diverse relations to body shape concern in Fiji. International Journal of Eating Disorders. 2007. 40(1): p. 42-50.
240. McCabe M , et al. Report on Sociocultural Questionaires and Perceptual Distortion Measures with Indigeniuos Fijian and Indo-Fijian Youth. 2008, Deakin University, Australia/Fiji School of Medicine, Fiji. p. 22.
241. Ricciardelli L, et al. The pursuit of mascularity among adolescent boys in Fiji and Tonga. Body Image. 2007. 4(4): p. 10.
242. McCabe M, et al. Body image and body change strategies among adolescent males and females from Fiji, Tonga and Australia. Body Image. 2009.
289
243. Babbie ER. The Basics of Social Research. 4 ed. 2008, Thomson Wadsworth: California , USA.
244. Rubin A and Babbie E. Essential Research Methods for Social Work. 2 ed. 2009, Brooks/Cole: California, USA.
245. Germov J. Major theoretical perspective in health sociology, in Second opinion: An introduction to health sociology, Germov J, Editor. 2002, Oxford University Press: Oxford. p. 478.
246. Caprio S, et al. Influence of Race, Ethnicity, and Culture on Childhood Obesity: Implications for Prevention and Treatment: A consensus statement of Shaping America's Health and the Obesity Society. Diabetes Care. 2008. 31(11): p. 2211-2221.
247. RobinsonT. Applying the socio-ecological model to improving fruit and vegetable intake among low-income African Americans. Journal of Community Health. 2008. 33(6): p. 395-406.
248. Bronfenbrenner U. The Ecology of Human Development: Experiments by Nature and Design. 1979 Harvard University Press: Cambridge, MA: Harvard University Press. .
249. Green LW, Richard L, and Potvin L. Ecological Foundations of Health Promotion. American Journal of Health Promotion. 1996. 10(4): p. 270-281.
250. Blane D, Brunner E, and Wilkinson R. Health and social organization: Towards a health policy for the 21st century. 1996, Routledge: New York.
251. Becker MH. The Health Model and Personal Health Behaviour. 1974: Slack, Thorofare, NJ.
252. Rogers RW. A protection motvation theory of fear appeals and attitude change. Journal of Consumers Psychology. 1975. 91: p. 93-114.
253. Rogers RW. Cognitive and pysiological processes in fear appeals and attitude change.In Cacioppo JT and Petty. RE. Social Psychophysiology. 1983, Guilford: New York. p. 153-176.
254. Bandura A. Social Foundations of Thought and Action: A Social Cognitive Theory. 1986, Prentice-Hall: Englewood Cliffs, NJ.
255. Sutton S. Health Behavior: Psychosocial Theories, in International Encyclopedia of the Social & Behavioral Sciences, J.S. Editors-in-Chief: Neil and B.B. Paul, Editors. 2001, Pergamon: Oxford. p. 6499-6506.
256. Ajzen I and Fishbein M. Understanding Attitudes and Predicting Social Behaviour. 1980, Prentice-Hall: Englewood Cliffs, NJ.
290
257. Prochaska, JO, DiClemente CC, and Norcross JC. In search of how people change: Applications to addictive behaviors. American Psychologist. 1992. 47(9): p. 1102-1114.
258. Prochaska J, Norcross J, and C. DiClemente. Changing for good. A revolutionary six-stage program for overcoming bad habits and moving your life positively forward. 1994, Harper Collins: New York.
259. Weinstein ND and Sandman PM. A model of the precaution adoption process: evidence from home radon testing. Health Psychology and Health. 1992 11(3): p. 170–80.
260. Schwarzer R and Fuchs R, eds. Self-efficacy and health behaviours. Predicting Health Behaviour:Research and Practice with Social Cognition Models. , ed. Conner M and N. P. 1996 University Press: Buckingham, UK. 163–96.
261. Gebhardt WA. Health Behaviour Goal Model: Towards a Theoretical Framework for Health Behaviour Change. 1997, University of Leiden: Leiden, The Netherlands. 191.
262. Akey JE, Rintamaki LS, and Kane TL. Health Belief Model deterrents of social support seeking among people coping with eating disorders. Journal of Affective Disorders. 2013. 145(2): p. 246-252.
263. Burnet D, et al. A practical model for preventing type 2 diabetes in minority youth. Diabetes Educator. 2002. 28(5): p. 779-95.
264. Baranowski T, Cullen KW, and Baranowski J. Psychosocial correlates of dietary intake: Advancing dietary intervention. Annual Review of Nutrition. 1999. 19(1): p. 17.
265. Prochaska JO and DiClemente CC. The transtheoretical approach: Crossing traditional boundaries of theraphy. 1984, Dow Jones Irwin: Homeward, IL.
266. Prochaska JO and DiClemente CC. Towards a comprehansive model of change, in Treating addictive behaviours: Processes of change, Miller WR and Heather N, Editors. 1986, Plenum Press: New York. p. 3-27.
267. Prochaska JO and Velicer WF. The transtheoretical model of health behavior change. American Journal of Health Promotion. 1997. 12: p. 38-48.
268. DiClemente C, et al. The process of smoking cessation: an analysis of precontemplation, contemplation, and preparation stages of change. Journal of Consulting and Clinical Psychology. 1991. 59: p. 295–304.
269. Sutton SA. A critical review of the transtheoretical model applied to smoking cessation. Understanding and Changing Health Behaviour: From Health Beliefs to Self-Regulation., ed. Norman P, Abraham C, and Conner M. 2000, Harwood Academic Publishers: Amsterdam. 207–25.
291
270. Bandura A. Self-efficacy: The Exercise of Control. 1997, Freeman: New York.
271. Stead, M., G. Hastings, and L. McDermott. The meaning, effectiveness and future of social marketing. Obesity Reviews. 2007. 8: p. 189-193.
272. Alcalay R and Bell RA. Promoting nutrition and physical activity through social marketing: Current practices and recommendations. 2000, Center for Advanced Studies in Nutrition and Social Marketing: University of California, Davis, CA.
273. Kotler P and Levy SJ. Broadening the concept of marketing. Journal of Marketing. 1969. 33: p. 10-15.
274. Kotler P. The geneic concept of marketing. Journal of Marketing. 1972. 36: p. 46-54.
275. Kotler P and Zaltman G. Social marketing: An approach to planned social change. Journal of Marketing. 1971. 35 p. 3-12.
276. Andreason AR. Social marketing: Its definition and domain. Journal of Public Policy & Marketing. 1994. 13(1): p. 108-114.
277. Grier SA and Bryant CA. Social marketing in public health. Annual Review of Public Health. 2005. 26: p. 319-39.
278. Farrelly MC, et al. Getting to the truth: evaluating national tobacco countermarketing campaigns. American Journal of Public Health. 2002. 92: p. 901-7.
279. Wong F, et al. VERB TM - a social marketing campaign to increase physical activity among youth. Journal of Parenteral and Enteral Nutrition 2003 [cited 2012 17 March]; Available from: http://www.cdc.gov/pcd/.
280. Mong Y, et al. Impact of the safe water system on water quality in cyclone-affected communities in Madagascar. American Journal of Public Health. 2001. 91: p. 1577-79.
281. Jooste PL, Marks AS, and Van Erkom SC, Factors influencing the availability of iodised salt in South Africa. South Africa Journal of Food Science and Nutrition. 1995. 7: p. 49-52.
282. Fotu KF, et al. Outcome results for the Ma'alahi Youth Project, a Tongan community-based obesity prevention programme for adolescents. Obesity Reviews: An Official Journal For The Study Of Obesity. 2011. 12(Suppl 2): p. 41-50.
283. Englberger L, et al. Pohnpei, FSM case study in a global health project documents its local food resources and successfully promotes local food for health. Pacific Health Dialog. 2010. 16(1): p. 121-128.
292
284. Kaufer L, et al. Evaluation of a “traditional food for health” intervention in Pohnpei, Federated States of Micronesia. Pac Health Dialog. 2010. 16(1): p. 61-73.
285. Kotler P, Roberto N, and Lee N. Social marketing: Improving the quality of life. 2002, Sage: Thousand Oaks, CA.
286. Donovan RJ and Henley N. Social Marketing: Principles and Practices. 2003, IP Commun.: Melbourne, Australia.
287. Wood M. Applying Commercial Marketing Theory to Social Marketing: A Tale of 4Ps (and a B). Social Marketing Quarterly. 2008. 14(1): p. 76-85.
288. Bagozzi RP. Marketing as an exchange. Journal of Marketing, 1975. 39: p. 32-39.
289. Craig LR and Flora JA. Social marketing and public health intervention. Health Education & Behavior. 1988. 15(3): p. 299-315.
290. Kotler P. Marketing for nonprofit organisation. 1982, Prentice-Hall: Emglewood Cliffs, NJ.
291. Maibach E, Kreps G, and Bonaguro E. Developing strategic communication campaign for HIV/AIDS prevention. Effective health communication for the 90s. Ratzan SC. 1993. Taylor & Francis: Philadelphia.
292. Utter J, et al. Lifestyle and Obesity in South Pacific Youth: Baseline Results from the Pacific Obesity Prevention In Communities (OPIC) Project in New Zealand, Fiji, Tonga and Australia. 2008, Auckland: University of Auckland.: School of Population Health.
293. World Health Organization. Growth Reference 5-19 years. 2010 15/12/2010]; Available from: http://www.who.int/growthref/who2007_bmi_for_age/en/index.html.
294. Kremer P, et al. Reducing unhealthy weight gain in Fijian adolescents: results of the Healthy Youth Healthy Communities study. Obesity Reviews. 2011. 12: p. 29-40.
295. Swinburn BA., et al. The Pacific Obesity Prevention in Communities project: project overview and methods. Obesity Reviews: An Official Journal Of The International Association For The Study Of Obesity. 2011. 12 Suppl 2: p. 3-11.
296. Swinburn B, et al. The Pacific OPIC Project (Obesity Prevention in Communities)- objectives and designs. Pacific Health Dialogue. 2007. 14(2): p. 139-46.
297. Schultz J, et al. Report on interviews with Indigenous Fijian and IndoFijian Youth: Sociocultural studies in the Healthy Youth Healthy Community
293
Project. 2006, Deakin University, Australia & Fiji School of Medicine, Fiji. p. 1-22.
298. McCabe M, et al. Report on sociocultural questionaires and perceptual distortion measures with Indigeniuos Fijian and Indo-Fijian Youth. 2008, Deakin University, Australia & Fiji School of Medicine, Fiji. p. 22.
299. Lobstein T, Baur L, and Uauy R. Obesity in children and young people: a crisis in public health. Obesity Reviews. 2004. 5: p. 4-85.
300. World Health Organization. WHO Global infobase. 2010 [cited 2010 13 May]; Available from: http://www.who.int/infobase/compare.aspx?dm=5.
301. Dixion JB. The effect of obesity on health outcomes. Molecular and Cellular Endocrinology. 2010. 316: p. 104-108.
302. Must A and Anderson S E. Body mass index in children and adolescents: considerations for population-based applications. International Journal of Obesity. 2006. 30(4): p. 590-594.
303. Whitzman C, et al. Links between children's independent mobility, active transport, physical activity and obesity. Preventing Childhood Obesity: Evidence Policy and Practice, ed. E. Waters, et al. 2010, Wiley-Blackwell: Oxford, UK. 105-112.
304. Cohen DA. Evidence on the food environment and obesity.In Preventing Childhood Obesity: Evidence Policy and Practice.Waters E, et al. 2010. Wiley-Blackwell: Oxford, UK.
305. Steinbeck KS. The importance of physical activity in the prevention of overweight and obesity in childhood: a review and an opinion. Obesity Reviews. 2001. 2(2): p. 117-30.
306. World Health Organization. Global and regional food consumption patterns and trends. Diet, nutrition and the prevention of chronic diseases: Report of the joint WHO/FAO expert consultation-WHO Technical Report Series, No. 916 (TRS 916) 2012 [cited 2012 31 January]; Available from: http://www.who.int/dietphysicalactivity/publications/trs916/en/gsfao_global.pdf.
307. Wilkins R. Dietary Survey in a Fijian village, Naduri, Nadroga. 1963, South Pacific Health Service.
308. Saito S. 1993 National Nutrition Survey. Main Report. National Food and Nutrition Committee:Suva, Fiji , 1995.
309. Willmott JV, Food consumption trend. Fiji School Med J V, 1971. 5(10).
310. Yoon J and Lee N. Dietary patterns of obese high school girls: snack consumption and energy intake. Nutrition Research and Practice. 2010. 4(5): p. 433-437.
294
311. Würbach A, Zellner K, and Kromeyer-Hauschild K. Meal patterns among children and adolescents and their associations with weight status and parental characteristics. Public Health Nutrition. 2009. 12(8): p. 1115-1121.
312. Lehto R., et al. Meal pattern and BMI in 9–11-year-old children in Finland. Public Health Nutrition. 2011. 14(7): p. 1245-1250.
313. Popkin BM and Duffey KJ. Does hunger and satiety drive eating anymore? Increasing eating occasions and decreasing time between eating occasions in the United States. The American Journal of Clinical Nutrition. 2010. 91(5): p. 1342-1347.
314. Fiji Islands Bureau of Statistics.2007 Census of Population and Housing. Available from: http://www.statsfiji.gov.fj/Census2007/census07_index2.htm.
315. Australia Bureau of Statistics, National Nutrition Survey Users' Guide 1995. Canberra: ABS1998. Report No. 4801.0.
316. Ministry of Health. NZ food NZ children: Key results of the 2002 National Children's Nutrition Survey. 2003, Wellington: Ministry of Health.
317. Rutishauser I, et al. Evaluation of short dietary questions with weighted dietary records. 2001, Canberra: Australian Food and Nutrition Monitoring Unit, Commonwealth Department of Health and Aged Care.
318. Boutelle K, et al., Weight control behaviors among obese, overweight, and nonoverweight adolescents. J Pediatr Psychol. 2002. 27(6): p. 531 - 540.
319. Utter J, et al. What effect do attempts to lose weight have on the observed relationship between nutrition behaviors and body mass index among adolescents? International Journal of Behavioral Nutrition & Physical Activity. 2007. 4(1): p. 40-49.
320. Neumark-Sztainer, D, et al. Sociodemographic and personal characteristics of adolescents engaged in weight loss and weight/muscle gain behaviors: who is doing what? Preventive Medicine. 1999. 28(1): p. 40 - 50.
321. Pesa J. and Turner L. Fruit and vegetable intake and weight-control behaviors among US youth. American Journal of Health Behavior. 2001. 25(1): p. 3 - 9.
322. Lowry R., et al. Weight management goals and practices among U.S. high school students: associations with physical activity, diet, and smoking. J Adolesc Health. 2002. 31(2): p. 133 - 144.
323. Sierra-Johnson J., et al. Eating Meals Irregularly: A Novel Environmental Risk Factor for the Metabolic Syndrome. Obesity. 2008. 16(6): p. 1302-1307.
295
324. Ritchie LD. Less frequent eating predicts greater BMI and waist circumference in female adolescents. American Journal of Clinical Nutrition. 2012. 95(2): p. 290-6.
325. Nicklas TA., O’Neil C, and Myers L. The Importance of Breakfast Consumption to Nutrition of Children, Adolescents, and Young Adults. Nutrition Today. 2004. 39(1): p. 30-39.
326. MacFarlane A. What Do Teenagers Eat? Issues. 2007(81): p. 21-23.
327. Thompson-McCormick, et al. Breakfast skipping as a risk correlate of overweight and obesity in school-going ethnic Fijian adolescent girls. Asia Pacific Journal of Clinical Nutrition. 2010. 19(3): p. 372-382.
328. Waqa G and Mavoa HM. Sociocultural Factors Influencing the Food Choices of 16-18 year-old Indigenious Fijian Females at School. Pacific Health Dialogue. 2006. 13(2): p. 57-65.
329. Estherlydia D. and John S. Association of Soft Drink Consumption, Eating Behaviour and Dietary Factors on Body Composition among South Indian Adolescents. Journal of US-China Medical Science. 2010. 7(9): p. 54-62.
330. Rea-Jeng Y, et al. Irregular breakfast eating and health status among adolescents in Taiwan. BMC Public Health, 2006. 6: p. 295-7.
331. Munoz KA, et al. Food intakes of US children and adolescents compared with recommendations. Pediatrics. 1997. 100(3): p. 323-9.
332. Produce for Better Health Foundation and National Cancer Institute. 5 a-Day for Better Health Program Guidebook. 1999, National Cancer Institute: Bethesda, MD.
333. Savige G, et al. Food intake patterns among Australian adolescents. Asia Pacific Journal Clinical Nutrition, 2007. 16(4): p. 738-747.
334. Geller KS and Dzewaltowski DA, Longitudinal and cross-sectional influences on youth fruit and vegetable consumption. Nutrition Reviews, 2009. 67(2): p. 65-76.
335. Ludwig, DS, Peterson KE, and Gortmaker SL. Relationship between sugar-sweetened drinks and childhood obesity: a prospective, observational analysis. Lancet. 2001. 357 (9255): p. 505-508.
336. Schulze MB, et al. Sugar-sweetened beverages, weight gain, and incidence of type 2 diabetes in young and middle-aged women. Journal of American Medical Association. 2004. 292(8): p. 927-934.
337. Berkey, CS, et al. Sugar added beverages and adolescents weight change. Obes Res. 2004. 12(5): p. 778-788.
296
338. Chan T. Sugar-Sweetened Beverage Consumption Frequency vs. BMI: National Health and Nutrition Examination Survey 2003-2004. 2011; Available from: digitalarchive.gsu.edu.
339. Viner RM and Cole TJ. Who changes body mass between adolescence and adulthood? Factors predicting change in BMI between 16 year and 30 years in the 1970 British Birth Cohort. International Journal of Obesity. 2006. 30(9): p. 1368-1374.
340. Larson N, et al., Young adults and eating away from home: associations with dietary intake patterns and weight status differ by choice of restaurant. Journal of American Dietetics Association, 2011. 111(11): p. 1696-703.
341. Woods SC, et al. Consumption of a high-fat diet alters the homeostatic regulation of energy balance. Physiology Behavior. 2004. 83: p. 573-578.
342. Prentice AM, et al. Obesity as an adaptation to a high fat diet. American Journal of Clinical Nutrition. 1994. 60: p. 640-642.
343. Astrup A, et al. Obesity as an adaptation to a high fat diet: evidence from a cross-sectional study. American Journal of Clinical Nutrition. 1994. 59: p. 350-355.
344. Zellner DA, et al. Food Liking and Craving: A Cross-cultural Approach. Appetite. 1999. 33(4): p. 61–70.
345. Gibson S, Lambert J, and Neate D. Associations between weight status, physical activity, and consumption of biscuits, cakes and confectionery among young people in Britain. Nutrition Bulletin. 2004. 29(4): p. 301–309.
346. Sanigorski A, Bell C, and Swinburn B. Associationg of key foods and beverages with obesity in Australian school children. Public Health Nutrition. 2007. 10(2): p. 152-158.
347. Rennie KL, et al. Secular trends in under-reporting in young people. British Journal of Nutrition 2005. 93(2): p. 241-47.
348. Bandini LG, et al. Validity of reported energy intake in obese and nonobese adolescents. American Journal Clinical Nutrition 1990. 52(3): p. 421-25.
349. Vartanian, LR, Schwartz MB, and Brownell KD. Effects of soft drink consumption on nutrition and health: a systematic review and meta-analysis. Journal Information. 2007. 97(4).
350. Sjoberg A, et al. Meal pattern, food choice, nutrient intake, and lifestyle factors in The Goteborg Adolescents Study. European Journal of Clinical Nutrition. 2003. 57(12): p. 1569-1578.
351. Tin SPP, et al. Breakfast skipping and change in body mass index in young children. International Journal of Obesity. 2011. 35: p. 899–906.
297
352. Gillis LJ and Bar-Or O. Food Away from Home, Sugar-Sweetened Drink Consumption and Juvenile Obesity. Journal of the American College of Nutrition. 2003. 22(6): p. 539-545.
353. Bowman SA. Beverages choices of young females: changes and impact on nutrient intakes. Journal of American Dietetics Association. 2002. 102(1234-39).
354. Stookey JD, et al. Replacing sweetened caloric beverages with drinking water is associated with lower energy intake. Obesity. 2007. 15(12): p. 3013-3022.
355. Hall KD, et al. Quantification of the effect of energy imbalance on bodyweight. The Lancet. 2011. 378(9793): p. 826-837.
356. Curtin F and Schulz P. Multiple correlations and bonferroni’s correction. Biological Psychiatry. 1998. 44(8): p. 775-777.
357. Ayala GX, et al. Away-from-home food intake and risk for obesity: examining the influence of context. Obesity. 2008. 16(5): p. 1002-8.
358. Thompson O, et al. Food purchased away from home as a predictor of change in BMI z-score among girls. International Journal of Obesity & Related Metabolic Disorders: Journal of the International Association for the Study of Obesity. 2004. 28(2): p. 282 - 289.
359. Kant AK. Dietary patterns and health outcomes. Journal of the American Dietetic Association. 2004. 104(4): p. 615-635.
360. Downs SM, et al. Associations among the food environment, diet quality and weight status in Cree children in Québec. Public Health Nutrition. 2009. 12(09): p. 1504-1511.
361. Chan JC and Sobal J. Family meals and body weight. Analysis of multiple family members in family units. Appetite. 2011. 57(2): p. 517-524.
362. Patton MQ. Qualitative Research & Evaluation Methods. 3 ed. 2001.Thousand Oaks, California: SAGE Publications Inc.
363. Kruegar RA and Cassey MA, Focus Groups: A Practical Guide for Applied Research. 3 ed. 2000, Thousand Oaks, California: SAGE Publication Inc.
364. Veugelers PJ, Fitzgerald AL, and Johnston E. Dietary intake and risk factors for poor diet quality among children in Nova Scotia. Canadian Journal of Public Health. 2005. 96(3): p. 212-6.
365. Vereecken C, et al. The relationship between children's home food environment and dietary patterns in childhood and adolescence. Public Health Nutrition. 2010. 13(Supplement 10): p. 1729-1735.
298
366. Gruber KJ. Social support for exercise and dietary habits among college students. Adolescence (San Diego): An International Quarterly devoted to the Physiological, Psychological, Psychiatric, Sociological, and Educational Aspects of the Second Decade of Human life. 2008. 43(171): p. 557.
367. Thompson Reuters. Top 10 cities for street food. . [cited 2012 23 September]; Available from: http://www.reuters.com/article/2012/07/20/uk-travel-picks-food-idUSLNE86J02720120720.
368. Denzin, NK and Lincoln YS. The Sage Handbook of Qualitative Research. 3rd ed. 2005, Sage: Thousand Oaks, California.
369. Kruegar RA. Focus Groups: A Practical Guide for Applied Research. 2 ed. 1994. Thousand Oaks, California, US: SAGE Publications, Inc. 255.
370. Krueger RA. Focus Groups: A Practical Guide for Applied Research. 1994. Sage Thousand Oaks, CA, USA.
371. Dorey, E. and J. McCool. The role of the media in influencing children's nutritional perceptions. Qualitative Health Research. 2009. 19(5): p. 645-654.
372. Stewart DW and Shamdasani PN. Focus groups: Theory and practice. Applied Social Research Methods Series. 1990.
373. Krueger RA and Casey MA. Focus group: A practical guide for applied research. 3 ed. 2000. Sage: London.
374. Fiji Islands Bureau of Statistics. Population by Religion - 2007 Census of Population. 2006 [cited 2013 21 March]; Available from: http://www.statsfiji.gov.fj/Social/religion_stats.htm.
375. Green J, et al. Generating best evidence from qualitative research: the role of data analysis. Australian and New Zealand Journal of Public Health. 2007. 31(6): p. 545-550.
376. Hunter A, et al., Making Meaning: The Creative Component in Qualitative Research. Qualitative Health Research, 2002. 12(3): p. 388-398.
377. Ryan G and Russen BH, Data Management and Analysis Methods, in Handbook of Qualitative Reserach, Denzin NK and Lincoln YS. 2000,. Sage: Oaks, CA. p. 769-802.
378. Taylor-Powell E and Renner M. Analyzing Qualitative Data. 2002.
379. Willis JW. Foundations of qualitative research: Interpretive and critical approaches. 2007. Sage Publications, Incorporated. p 392.
380. Braun V and Clarke V, Using thematic analysis in psychology. Qualitative Research in Psychology.2006. 3(2): p. 77-101.
299
381. Daly J, et al. A hierarchy of evidence for assessing qualitative health research. Journal of Clinical Epidemiology. 2007. 60: p. 43-49.
382. Neumark-Sztainer, D, et al., Factors Influencing Food Choices of Adolescents: Findings from Focus-Group Discussions with Adolescents. Journal of the American Dietetic Association. 1999. 99(8): p. 929-937.
383. Gracey D, et al. Nutritional knowledge, beliefs and behaviours in teenage school students. Health Education Research. 1996. 11(2): p. 187-204.
384. Story M. D. Neumark-Sztainer, and S. French. Individual and environmental influences on adolescent eating behaviors. Journal of American Dietetics Association. 2002. 102(suppl 3): p. S40 - S51.
385. Croll JK, Neumark-Sztainer D, and Story M. Healthy Eating: What Does It Mean to Adolescents? Journal of Nutrition Education. 2001. 33(4): p. 193-198.
386. Monge-Rojas R., et al. Barriers to and Motivators for Healthful Eating as Perceived by Rural and Urban Costa Rican Adolescents. Journal of Nutrition Education and Behavior. 2005. 37(1): p. 33-40.
387. Ingersoll G. Psychosocial and social development, in Textbook of Adolescent Medicine, McAnaeney E, et al. 1992, WB Saunders: Philadelphia. p. 124-132.
388. Varman S, et al. Primary school compliance with school canteen guidelines in Fiji and its association with student obesity. Public Health Action. 2013. 3(1): p. 81-83.
389. National Food & Nutrition Centre (NFNC). School canteen guidelines, 2005, National Food & Nutrition Centre: Suva, Fiji.
390. Bole F. School Canteen Guidelines. 2008; Available from: http://www.nutrition.gov.fj/pdf/nfnc_newsletter/Fiji%20Food%20and%20Nutrition%20newsletter%20Issue%202%202008.pdf.
391. Utter J, Scragg R, and Scaaf D. Associations between television viewing and consumption of commonly advertised foods among New Zealand children and young adolescents. Public Health Nutrition. 2006. 9(5): p. 606-612.
392. Wiecha JL, et al. When children eat what they watch: Impact of television viewing on dietary intake in youth. Archives of Pediatrics & Adolescent Medicine. 2006. 160(4): p. 436-442.
393. Lipsky LM and Iannotti RJ. Associations of television viewing with eating behaviors in the 2009 health behaviour in school-aged children study. Archives of Pediatrics & Adolescent Medicine. 2012. 166(5): p. 465-472.
394. Scully M, et al. Association between food marketing exposure and adolescents’ food choices and eating behaviors. Appetite, 2012. 58(1): p. 1-5.
300
395. Kim S, et al. Restriction of television food advertising in South Korea: impact on advertising of food companies. Health Promotion International. 2013. 28(1): p. 17-25.
396. Hawkes C. Marketing Food to Children:The Regulatory Framework. 2004 [cited 2013 25 April]; Available from: http://www.who.int/dietphysicalactivity/regulatory_environment_CHawkes07.pdf.
397. World Health Organization. World Health Organization. (2010) Set of recommendations on the marketing of foods and non-alcoholic beverages to children. 2010 [cited 2012 Jan March]; Available from: http://www.who.int/dietphysicalactivity/publications/recsmarketing/en/index.html.
398. Rainea KD, et al. Restricting marketing to children: Consensus on policy interventions to address obesity. Journal of Public Health Policy, 2013. 2013: p. 1-15.
399. Bere E, et al. Determinants of adolescents' soft drink consumption. Public health nutrition. 2008. 11(1): p. 49.
400. Jago R, Baranowski T, and Baranowski JC. Fruit and vegetable availability: a micro environmental mediating variable? Public Health Nutrition. 2007. 10(07): p. 681-689.
401. Reddan J, Wahlstrom K, and Reicks M. Children's Perceived Benefits and Barriers in Relation to Eating Breakfast in Schools With or Without Universal School Breakfast. Journal of Nutrition Education and Behavior. 2002. 34(1): p. 47-52.
402. Deshmukh-Taskar, PR, et al. The relationship of breakfast skipping and type of breakfast consumption with nutrient intake and weight status in children and adolescents: the National Health and Nutrition Examination Survey 1999-2006. Journal of the American Dietetic Association. 2010. 110(6): p. 869.
403. Denney-Wilson E, et al. Influences on consumption of soft drinks and fast foods in adolescents. 2009.
404. Pearson N, Biddle SJH, and Gorely T. Family correlates of breakfast consumption among children and adolescents. A systematic review. Appetite, 2009. 52(1): p. 1-7.
405. Mathews L, et al. The process evaluation of It's Your Move!, an Australian adolescent community-based obesity prevention project. BMC Public Health. 2010. 10(1): p. 448.
301
406. Suba AF, et al. The comparative validationof the Block, Willet, National Cancer Institute food frequency questionnaires: the Eating at America's Table Study. Am J Epidemiol. 2001. 154(12): p. 1089-99.
407. Willett W and Lenart E. Food Frequency Methods, in Nutrition Epidemiology. 2013, Oxford University Press: New York. p. 70-96.
408. Berkey CS, et al. Activity, dietary intake, and weight changes in a longitudinal study of preadolescent and adolescent boys and girls. Pediatrics. 2000. 105(E56).
409. Frank GC, et al. A food frequency questionnaire for adolescents: defining eating patterns. J Am Diet Assoc.1992. 92(3): p. 313–318.
410. Rockett HR, et al. Validation of a youth/adolescent food frequency questionnaire. Prev Med. 1997. 26(6): p. 808-816.
411. Jyh Eiin W, et al. Reliability and relative validity of a food frequency questionnaire to assess food group intakes in New Zealand adolescents. Nutrition Journal. 2012. 11(1): p. 65-73.
412. Byers T. Food Frequency Dietary Assessment: How Bad Is Good Enough? American Journal of Epidemiology. 2001. 154(12): p. 1087-1088.
413. Smithson J. Using and analysing focus groups: limitations and possibilities. International Journal of Social Research Methodology. 2000. 3(2): p. 103-119.
414. Jayasekara RS, Focus groups in nursing research: Methodological perspectives. Nursing Outlook. 2012. 60(6): p. 411-416.
415. Fisher RJ and Katz JE. Social-desirability bias and the validity of self-reported values. Psychology and Marketing. 2000. 17(2): p. 105-120.
416. Thornton B and Gupta S. Comparative validation of a partial (versus full) randomised response teachnique: Attempting to control for social desirability respnse bias to sensitive questions. Individual Differences Research. 2004. 2: p. 214-224.
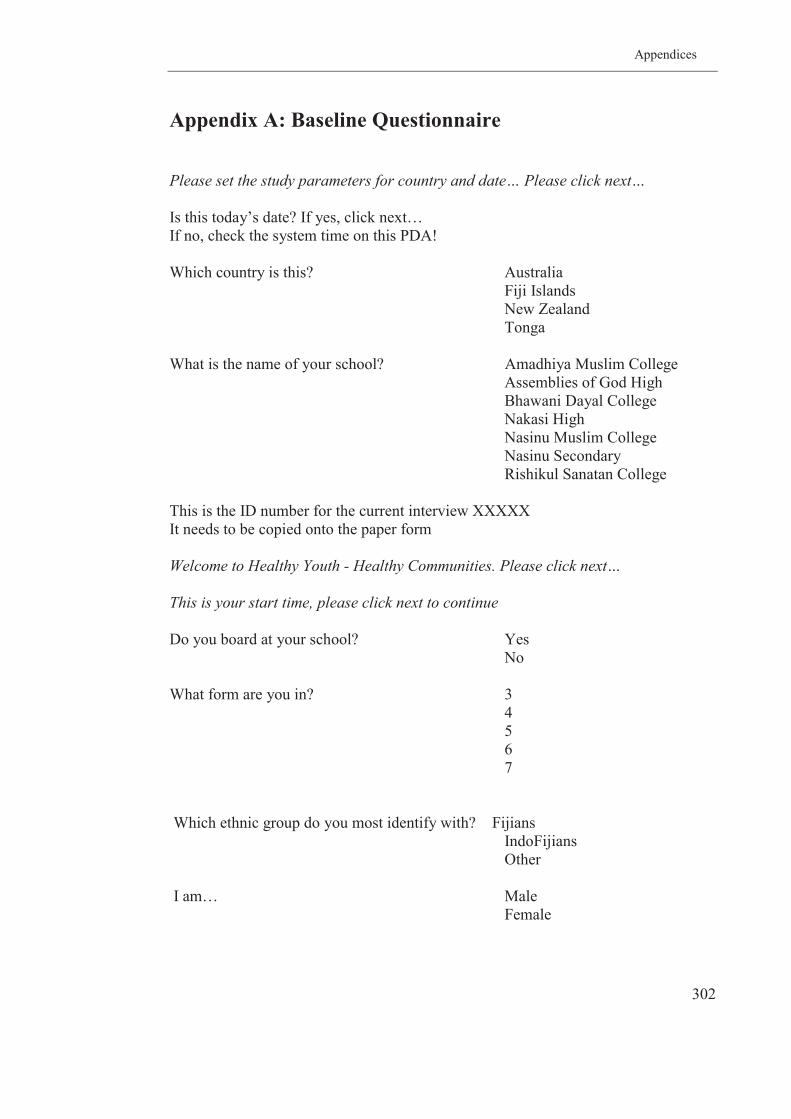
Appendices
302
Appendix A: Baseline Questionnaire
Please set the study parameters for country and date… Please click next… Is this today’s date? If yes, click next… If no, check the system time on this PDA! Which country is this? Australia Fiji Islands New Zealand Tonga What is the name of your school? Amadhiya Muslim College Assemblies of God High Bhawani Dayal College Nakasi High Nasinu Muslim College Nasinu Secondary Rishikul Sanatan College This is the ID number for the current interview XXXXX It needs to be copied onto the paper form Welcome to Healthy Youth - Healthy Communities. Please click next… This is your start time, please click next to continue Do you board at your school? Yes No What form are you in? 3 4 5 6 7 Which ethnic group do you most identify with? Fijians IndoFijians Other I am… Male Female
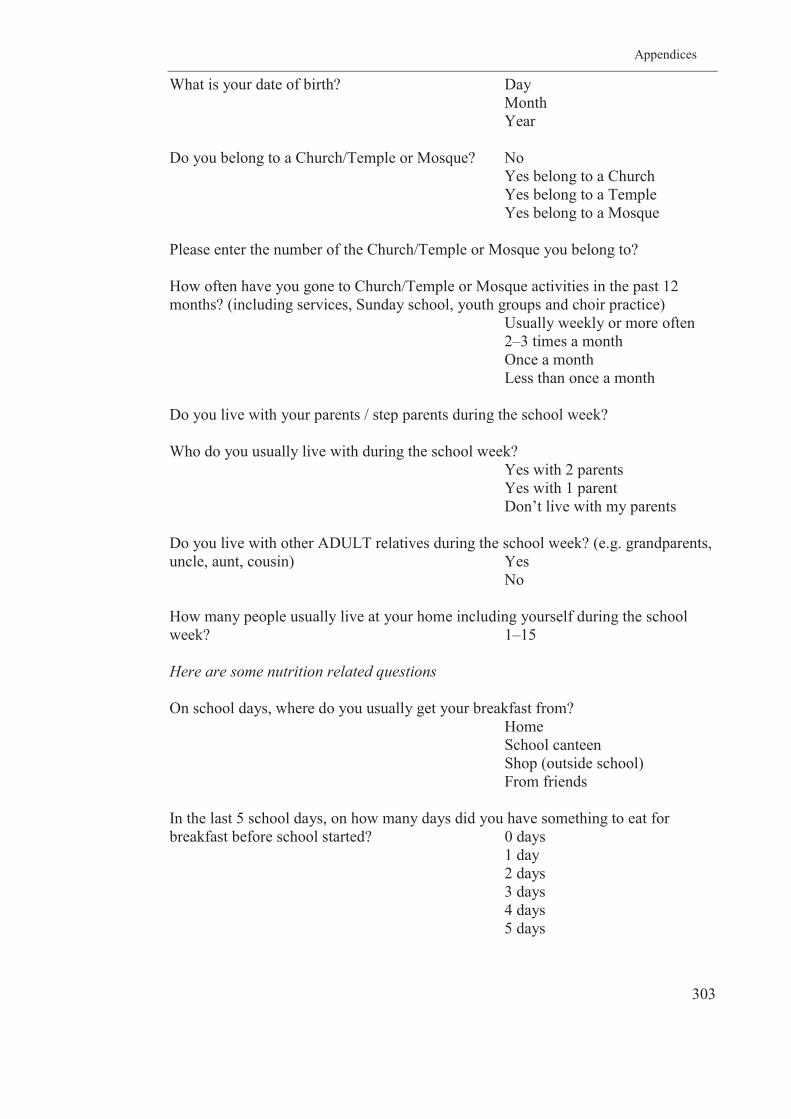
Appendices
303
What is your date of birth? Day Month Year Do you belong to a Church/Temple or Mosque? No Yes belong to a Church Yes belong to a Temple Yes belong to a Mosque Please enter the number of the Church/Temple or Mosque you belong to? How often have you gone to Church/Temple or Mosque activities in the past 12 months? (including services, Sunday school, youth groups and choir practice) Usually weekly or more often 2–3 times a month Once a month Less than once a month Do you live with your parents / step parents during the school week? Who do you usually live with during the school week? Yes with 2 parents Yes with 1 parent Don’t live with my parents Do you live with other ADULT relatives during the school week? (e.g. grandparents, uncle, aunt, cousin) Yes No How many people usually live at your home including yourself during the school week? 1–15 Here are some nutrition related questions On school days, where do you usually get your breakfast from? Home School canteen Shop (outside school) From friends In the last 5 school days, on how many days did you have something to eat for breakfast before school started? 0 days 1 day 2 days 3 days 4 days 5 days
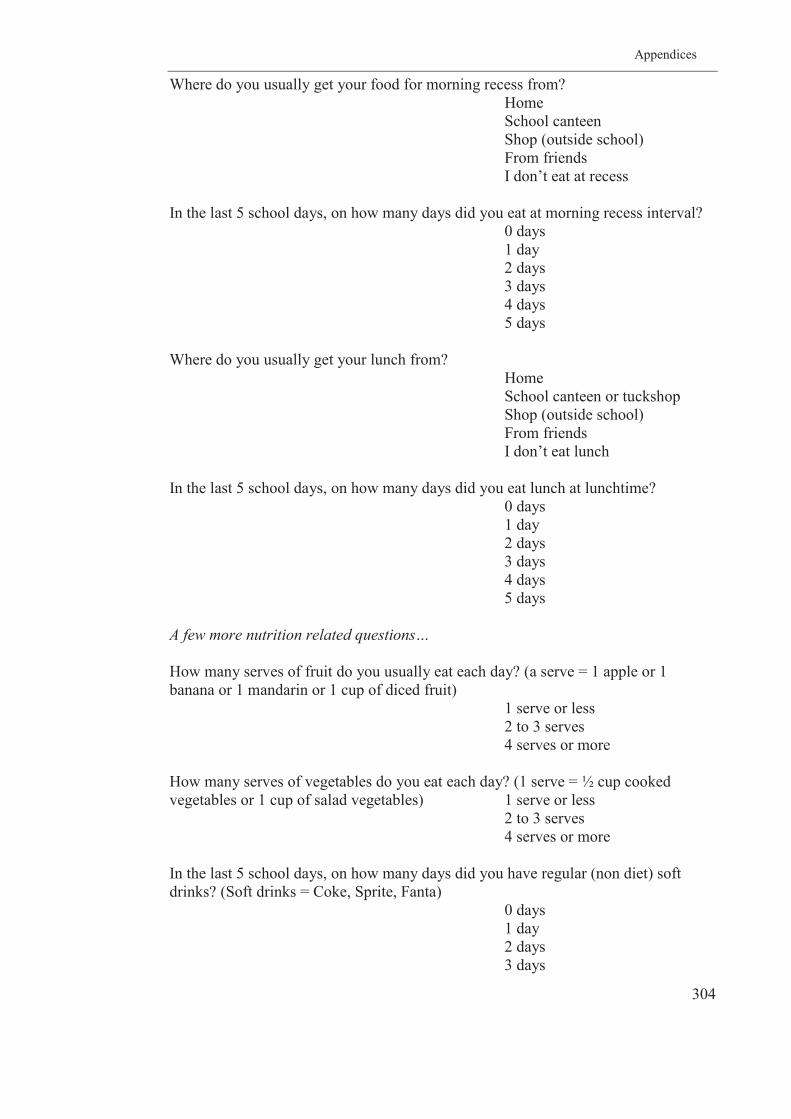
Appendices
304
Where do you usually get your food for morning recess from? Home
School canteen Shop (outside school) From friends I don’t eat at recess In the last 5 school days, on how many days did you eat at morning recess interval? 0 days 1 day 2 days 3 days 4 days 5 days Where do you usually get your lunch from?
Home School canteen or tuckshop Shop (outside school) From friends I don’t eat lunch In the last 5 school days, on how many days did you eat lunch at lunchtime? 0 days 1 day 2 days 3 days 4 days 5 days A few more nutrition related questions… How many serves of fruit do you usually eat each day? (a serve = 1 apple or 1 banana or 1 mandarin or 1 cup of diced fruit) 1 serve or less 2 to 3 serves 4 serves or more How many serves of vegetables do you eat each day? (1 serve = ½ cup cooked vegetables or 1 cup of salad vegetables) 1 serve or less 2 to 3 serves 4 serves or more In the last 5 school days, on how many days did you have regular (non diet) soft drinks? (Soft drinks = Coke, Sprite, Fanta) 0 days 1 day 2 days 3 days
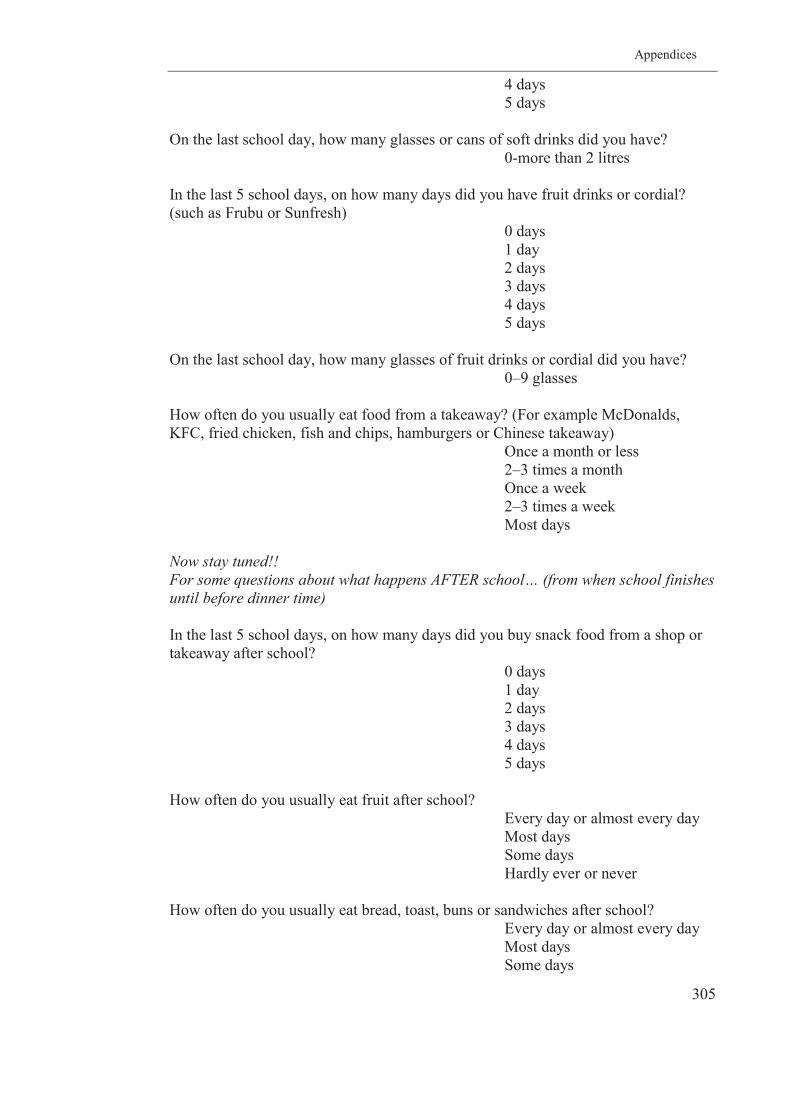
Appendices
305
4 days 5 days On the last school day, how many glasses or cans of soft drinks did you have? 0-more than 2 litres In the last 5 school days, on how many days did you have fruit drinks or cordial? (such as Frubu or Sunfresh) 0 days 1 day 2 days 3 days 4 days 5 days On the last school day, how many glasses of fruit drinks or cordial did you have? 0–9 glasses How often do you usually eat food from a takeaway? (For example McDonalds, KFC, fried chicken, fish and chips, hamburgers or Chinese takeaway) Once a month or less 2–3 times a month Once a week 2–3 times a week Most days Now stay tuned!! For some questions about what happens AFTER school… (from when school finishes until before dinner time) In the last 5 school days, on how many days did you buy snack food from a shop or takeaway after school? 0 days 1 day 2 days 3 days 4 days 5 days How often do you usually eat fruit after school? Every day or almost every day Most days Some days Hardly ever or never How often do you usually eat bread, toast, buns or sandwiches after school? Every day or almost every day Most days Some days
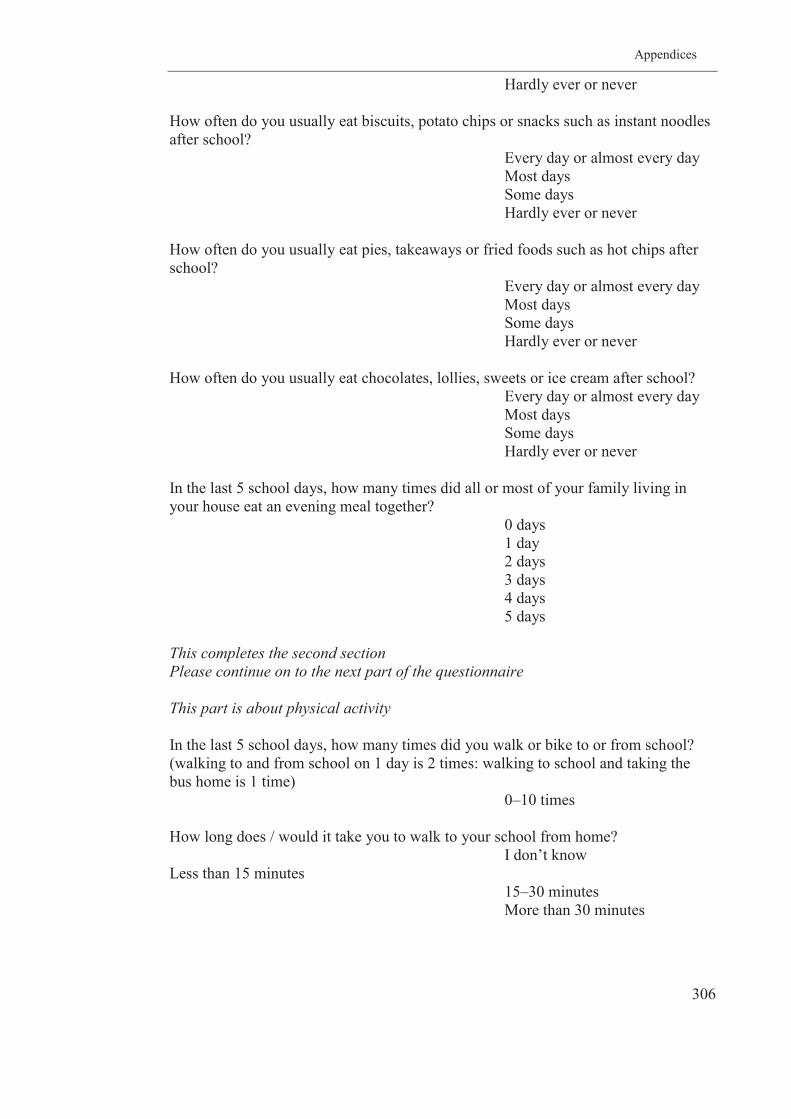
Appendices
306
Hardly ever or never How often do you usually eat biscuits, potato chips or snacks such as instant noodles after school? Every day or almost every day Most days Some days Hardly ever or never How often do you usually eat pies, takeaways or fried foods such as hot chips after school? Every day or almost every day Most days Some days Hardly ever or never How often do you usually eat chocolates, lollies, sweets or ice cream after school? Every day or almost every day Most days Some days Hardly ever or never In the last 5 school days, how many times did all or most of your family living in your house eat an evening meal together? 0 days 1 day 2 days 3 days 4 days 5 days This completes the second section Please continue on to the next part of the questionnaire This part is about physical activity In the last 5 school days, how many times did you walk or bike to or from school? (walking to and from school on 1 day is 2 times: walking to school and taking the bus home is 1 time) 0–10 times How long does / would it take you to walk to your school from home? I don’t know Less than 15 minutes 15–30 minutes More than 30 minutes
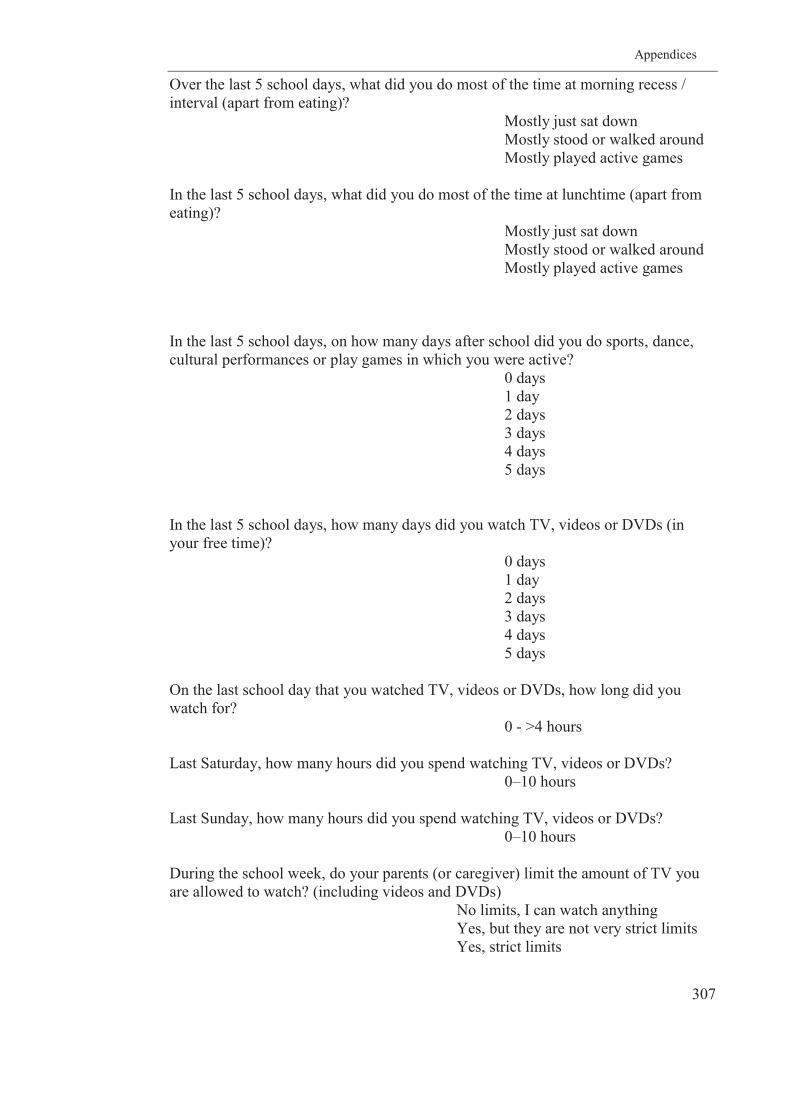
Appendices
307
Over the last 5 school days, what did you do most of the time at morning recess / interval (apart from eating)? Mostly just sat down Mostly stood or walked around Mostly played active games In the last 5 school days, what did you do most of the time at lunchtime (apart from eating)? Mostly just sat down Mostly stood or walked around Mostly played active games In the last 5 school days, on how many days after school did you do sports, dance, cultural performances or play games in which you were active? 0 days 1 day 2 days 3 days 4 days 5 days In the last 5 school days, how many days did you watch TV, videos or DVDs (in your free time)? 0 days 1 day 2 days 3 days 4 days 5 days On the last school day that you watched TV, videos or DVDs, how long did you watch for? 0 - >4 hours Last Saturday, how many hours did you spend watching TV, videos or DVDs? 0–10 hours Last Sunday, how many hours did you spend watching TV, videos or DVDs? 0–10 hours During the school week, do your parents (or caregiver) limit the amount of TV you are allowed to watch? (including videos and DVDs) No limits, I can watch anything Yes, but they are not very strict limits Yes, strict limits

Appendices
308
In the last 5 school days, how many times did you watch TV whilst eating your evening meal? 0 days 1 day 2 days 3 days 4 days 5 days Do you have a TV in your home? Yes No Do you have a TV in your bedroom? Yes No In the last 5 school days, how many days did you play video games, electronic games or use the computer (not for homework)? 0 days 1 day 2 days 3 days 4 days 5 days On the last school day that you spent time playing video games or using the computer (not for homework), how long did you play for? 0 - > 4 hours Last Saturday, how many hours did you spend playing video games or using the computer (not for homework)? 0 - >5 hours Last Sunday, how many hours did you spend playing video games or using the computer (not for homework)? 0 - >5 hours Do you have video games, electronic games or a computer in your home? Yes No This completes section 3 Please continue on to the rest of the questionnaire
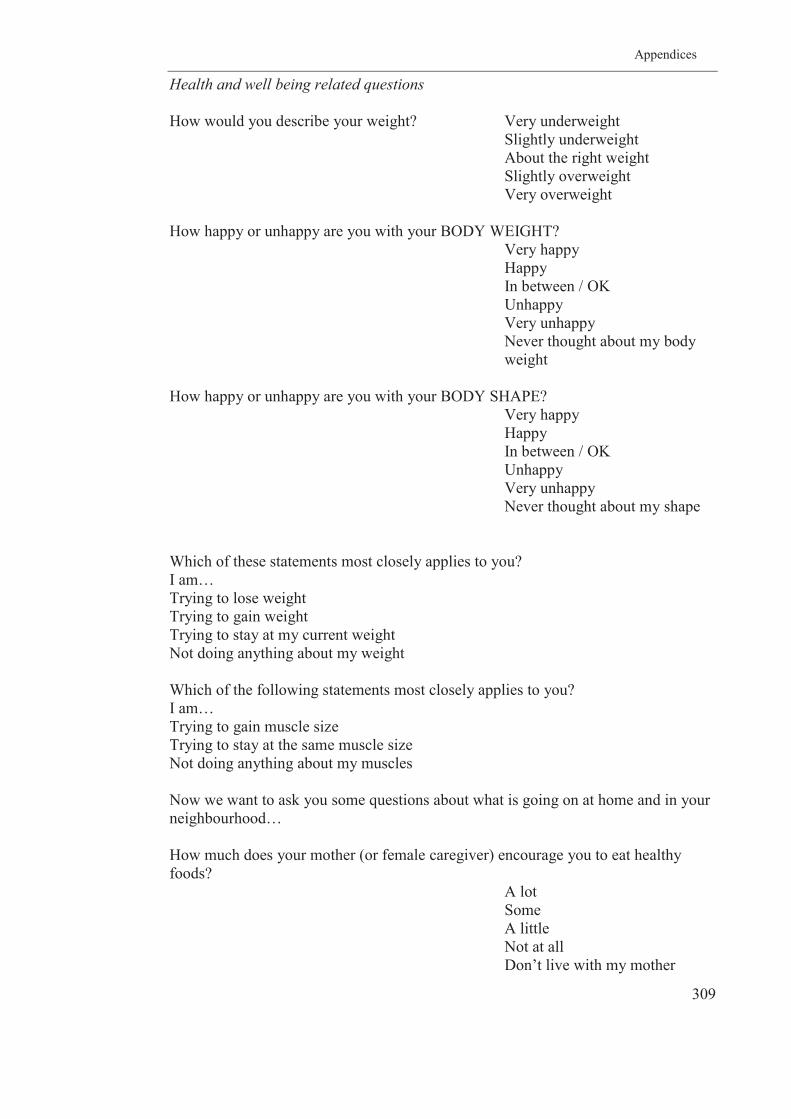
Appendices
309
Health and well being related questions How would you describe your weight? Very underweight Slightly underweight About the right weight Slightly overweight Very overweight How happy or unhappy are you with your BODY WEIGHT? Very happy Happy In between / OK Unhappy Very unhappy
Never thought about my body weight
How happy or unhappy are you with your BODY SHAPE?
Very happy Happy In between / OK Unhappy Very unhappy Never thought about my shape Which of these statements most closely applies to you? I am… Trying to lose weight Trying to gain weight Trying to stay at my current weight Not doing anything about my weight Which of the following statements most closely applies to you? I am… Trying to gain muscle size Trying to stay at the same muscle size Not doing anything about my muscles Now we want to ask you some questions about what is going on at home and in your neighbourhood… How much does your mother (or female caregiver) encourage you to eat healthy foods? A lot Some A little Not at all Don’t live with my mother

Appendices
310
How much does your father (or male caregiver) encourage you to eat healthy foods? A lot Some A little Not at all I don’t live with my father How often do you have food from a takeaway shop for dinner? More than once a week About once a week 2–3 times a month Once a month or less How often is fruit available at home for you to eat? Every day or almost every day Most days Some days Hardly ever or never How often are taro, breadfruit or banana chips or similar snacks available at home for you to eat? Every day or almost every day Most days Some days Hardly ever or never How often are chocolates or sweets available at home for you to eat? Every day or almost every day Most days Some days Hardly ever or never How often are non-diet soft drinks available at home for you to drink? (soft drinks = Coke, Sprite and Fanta) Every day or almost every day Most days Some days Hardly ever or never On the last school day, how much money did you spend on food or drinks for yourself at takeaway shops (not including school canteens)? $ 0 - 40.0 How much does your mother (or female caregiver) encourage you to be physically active or play sports? A lot Some A little
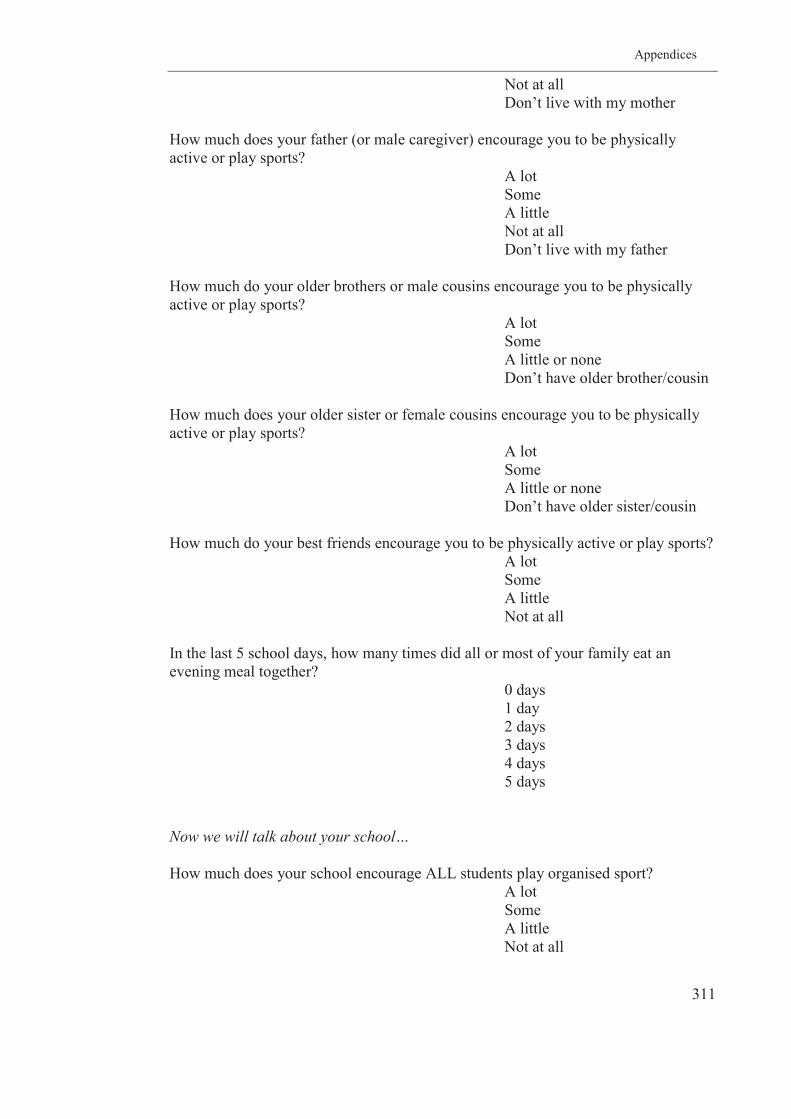
Appendices
311
Not at all Don’t live with my mother How much does your father (or male caregiver) encourage you to be physically active or play sports? A lot Some A little Not at all Don’t live with my father How much do your older brothers or male cousins encourage you to be physically active or play sports? A lot Some A little or none Don’t have older brother/cousin How much does your older sister or female cousins encourage you to be physically active or play sports? A lot Some A little or none Don’t have older sister/cousin How much do your best friends encourage you to be physically active or play sports? A lot Some A little Not at all In the last 5 school days, how many times did all or most of your family eat an evening meal together? 0 days 1 day 2 days 3 days 4 days 5 days Now we will talk about your school… How much does your school encourage ALL students play organised sport? A lot Some A little Not at all
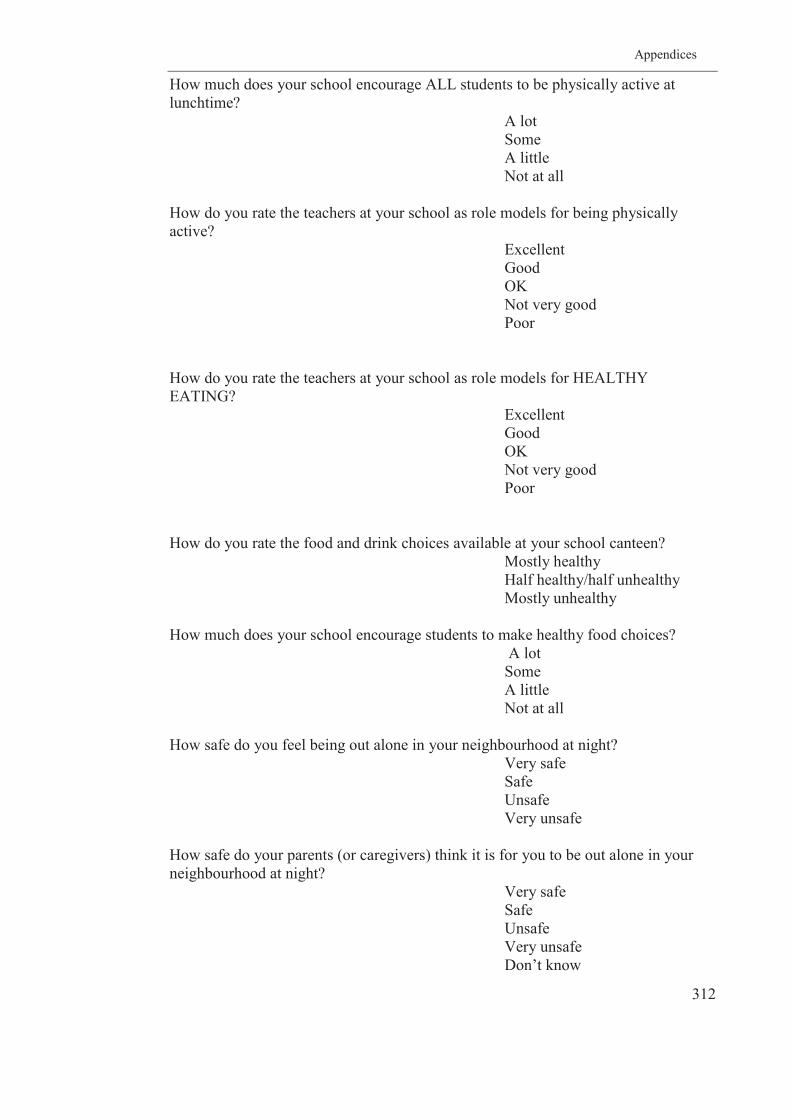
Appendices
312
How much does your school encourage ALL students to be physically active at lunchtime? A lot Some A little Not at all How do you rate the teachers at your school as role models for being physically active? Excellent Good OK Not very good Poor How do you rate the teachers at your school as role models for HEALTHY EATING? Excellent Good OK Not very good Poor How do you rate the food and drink choices available at your school canteen? Mostly healthy Half healthy/half unhealthy Mostly unhealthy How much does your school encourage students to make healthy food choices? A lot Some A little Not at all How safe do you feel being out alone in your neighbourhood at night? Very safe Safe Unsafe Very unsafe How safe do your parents (or caregivers) think it is for you to be out alone in your neighbourhood at night? Very safe Safe Unsafe Very unsafe Don’t know
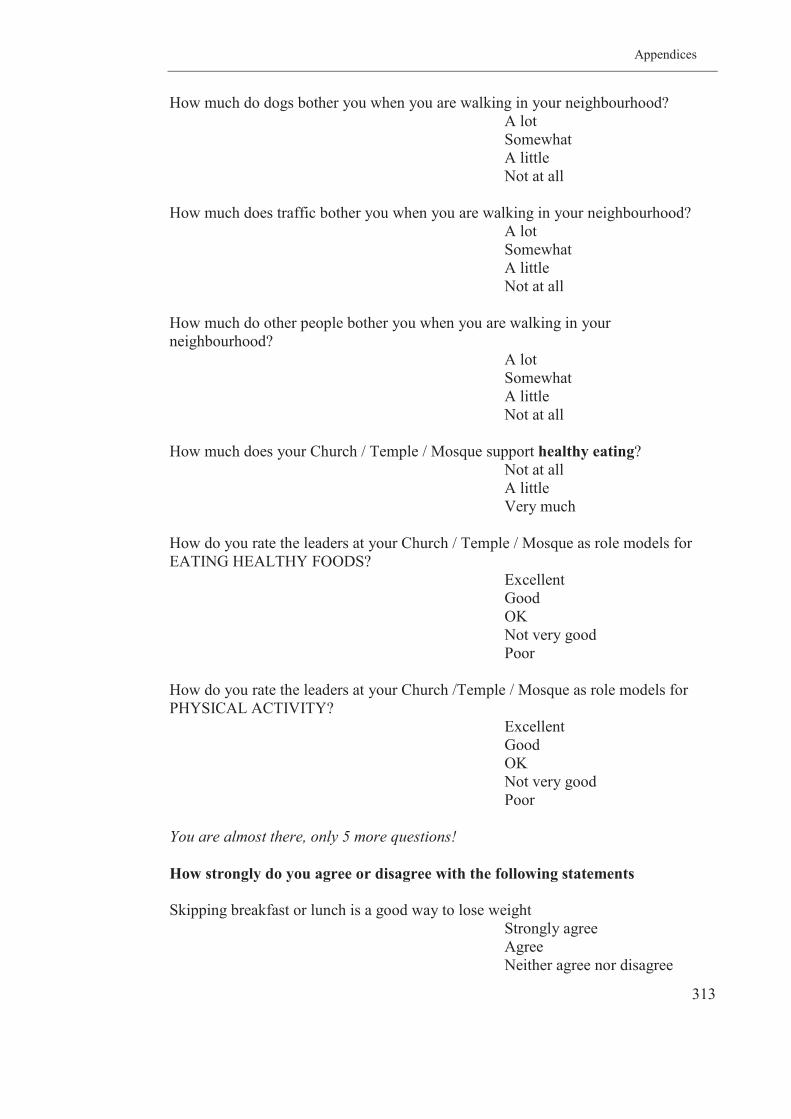
Appendices
313
How much do dogs bother you when you are walking in your neighbourhood? A lot Somewhat A little Not at all How much does traffic bother you when you are walking in your neighbourhood? A lot Somewhat A little Not at all How much do other people bother you when you are walking in your neighbourhood? A lot Somewhat A little Not at all How much does your Church / Temple / Mosque support healthy eating? Not at all A little Very much How do you rate the leaders at your Church / Temple / Mosque as role models for EATING HEALTHY FOODS? Excellent Good OK Not very good Poor How do you rate the leaders at your Church /Temple / Mosque as role models for PHYSICAL ACTIVITY? Excellent Good OK Not very good Poor You are almost there, only 5 more questions! How strongly do you agree or disagree with the following statements Skipping breakfast or lunch is a good way to lose weight Strongly agree Agree Neither agree nor disagree
Appendices
314
Disagree Strongly disagree Fruit drinks and cordials have less sugar than non-diet soft drinks like coke and sprite Strongly agree Agree Neither agree nor disagree Disagree Strongly disagree Watching a lot of TV does not lead to weight gain Strongly agree Agree Neither agree nor disagree Disagree Strongly disagree Eating a lot of fruit and vegetables is bad for your weight Strongly agree Agree Neither agree nor disagree Disagree Strongly disagree This is the end time… well done! Please click next to finish This completes the questionnaire!! Thank-you for your participation!! Please raise your hand to let us know that you’re done!
Appendices
315
Appendix B.1: Girls’ Focus Group Schedule
1. Decrease SSB and fizzy drinks intake
A. Knowledge
1. We know that girls your age drink the following things at and on the way home
from school (water, fruit juice, fruit drink, fizzy [carbonated]). Which one do you
think is best for girls your age? (Probe for influence: why do you think that’s best?
Cool? Healthy? Chosen most?)
2. Would it be hard to change to healthier drinks at school or on the way home?
Why?
B. Motivators
3. What would make girls your age change to healthier drinks at school? (Probe
for what would make it easy? and what would make it hard?)
4. What would make girls your age change to healthier drinks on the way home from
school? (Probe for what would make it easy? and what would make it hard?)
5. We know that girls your age sometimes get quite a lot of spending money and
often use this to buy sweet/fizzy drinks. What would make girls your age buy
healthier drinks with their spending?
C. Messages and messengers
6. If you were in charge of doing something to change what girls your age drank at
school, what would you tell them? (Probe for how would you tell them (media, text
message, Kaila, posters?)
7. Who or what would they listen to most? (Probe for how should they tell them
(media, text message, Kaila, posters etc.?)
2. Increase fruit and vegetables
A. Knowledge
Appendices
316
8. We know that girls your age are eating less fruit and vegetables. Why do you
think they are eating less fruit and vegetables? (Probe for influence)
9. Do you think fruit and vegetables are good for you? Why?
B. Motivators
10. What would make girls your age eat more fruit and vegetables? (Probe for
influences)
C. Messages and messengers
11. If you were in charge of doing something to change what girls your age eat in
this case, increase fruit and vegetables, what would you tell them? (Probe for how
would you tell them (media, text message, Kaila, posters etc.,? type of messages?)
12. Who or what would they listen to most? (Probe for how should they tell them
(media, text message, Kaila, posters etc.?)
3. Increase frequency of meals
Breakfast
A. Knowledge
13. We know that many girls your age skip breakfast before school. Why do you
think that girls your age do that, most days before school?
14. Do you think it is important to have breakfast every day? Why?
B. Motivators
15. What would encourage girls your age to have breakfast every day before school?
[Probe for other factors how; who would make it easy or hard)
C. Messages and messengers
Appendices
317
16. If you were in charge of doing something to change what girls your age eat in
this case, having breakfast before school, what would you tell them? (Probe for type
of messages and how would you tell them?)
17. Who or what would they listen to most? (Probe for how should you tell them
(media, text message, Kaila, posters etc.?))
Lunch
A. Knowledge
18. It has been found before that most of the girls who miss lunch do so because they
do not have time to prepare lunch from home. Do you think it is important to have
lunch every day? Why?
B. Motivators
19. What would encourage girls your age to prepare lunch from home? Why? (Probe
for influences: how, who)
20. What would encourage girls your age eat lunch when at school every day? Why?
(Probe for influences: how, who)
C. Messages and messengers
21. If you were in charge of doing something to change what girls your age eat for
lunch what would you tell them? (Probe how would you tell them? who would they
listen to?)
22. Who or what would they listen to most? (Probe for how should you tell them
(media, text message, Kaila, posters etc.?)

Appendices
318
4. Trying to lose weight
A. Knowledge
23. We know that a lot of girls your age are trying to lose weight. What kind of
changes are they making? (Probe for food they are cutting down on, how?)
B. Motivators
24. What would encourage girls your age to eat less fried foods, salty snacks, and
sweets? (Probe for other factors how; who)
25. What would make it hard for them to eat less fried foods, salty snacks, and
sweets? (Probe for other factors how; who)
C. Messages and messengers
26. If you were in charge of doing something to change what girls your age eat to
lose weight, what would you tell them? (Probe for what messages and how would
you tell them?)
27. Who or what would they listen to most? (Probe for how should you tell them
(media, text message, Kaila, posters etc.?)
Appendices
319
Appendix B.2: Boys Focus Group Schedule
1. Decrease soft drinks and fizzy drinks intake
A. Knowledge
1. We know that boys your age drink the following things at and on the way home
from school (water, fruit juice, fruit drink, fizzy [carbonated]). Which one do you
think is best for boys your age? (Probe for influence: why do you think that’s best?
cool? healthy? Chosen most?)
2. Would it be hard to change to healthier drinks at school or on the way home?
Why?
B. Motivators
3. What would make boys your age change to healthier drinks at school? (Probe
for influence: why do you think boys your age choose these?)
4. What would make boys your age change to healthier drinks on the way home from
school? (Probe for what would make it easy? and what would make it hard?)
5. We know that boys your age sometimes get quite a lot of spending money and
often use this to buy sweet/fizzy drinks. What would make boys your age buy
healthier drinks with their spending?
C. Messages and messengers
6. If you were in charge of doing something to change what boys your age drank at
school, what would you tell them? (Probe for what messages and how would you
tell them (media, text message, Kaila, posters?)
7. Who or what would they listen to most? (Probe for how should they tell them
(media, text message, Kaila, posters etc.?)
2. Increase fruit and vegetables
Appendices
320
A. Knowledge
8. We know that boys your age are eating less fruit and vegetables. Why do you
think they are eating less fruit and vegetables? (Probe for influence)
9. Do you think fruit and vegetables are good for you? Why?
B. Motivators
10. What would make boys your age eat more fruit and vegetables? (Probe for
influences)
C. Messages and messengers
11. If you were in charge of doing something to change what boys your age eat in
this case, increase fruit and vegetables, what would you tell them? (Probe for what
messages and how would you tell them (media, text message, Kaila, posters etc.?)
12. Who or what would they listen to most? (Probe for how should they tell them
(media, text message, Kaila, posters etc.?)
3. Increase frequency of meals
Breakfast
A. Knowledge
13. We know that many boys your age skip breakfast before school. Why do you
think that boys your age do that, most days before school?
14. Do you think it is important to have breakfast every day? Why?
B. Motivators
15. What would encourage boys your age to have breakfast every day before school?
[Probe for other factors how; who or what would make it easy or hard)
C. Messages and messengers
Appendices
321
16. If you were in charge of doing something to change what boys your age eat in
this case, having breakfast before school, what would you tell them? (Probe for type
of messages and how would you tell them?)
17. Who or what would they listen to most? (Probe for how should you tell them
(media, text message, Kaila, posters etc.?))
Lunch
A. Knowledge
18. It has been found before that most of the boys who miss lunch do so because they
do not have time to prepare lunch from home. Do you think it is important to have
lunch every day? Why?
B. Motivators
19. What would encourage boys your age to prepare lunch from home? Why? (Probe
for influences: how, who)
20. What would encourage boys your age to eat lunch at school every day? Why?
(Probe for influences: how, who)
C. Messages and messengers
21. If you were in charge of doing something to change what boys your age eat for
lunch what would you tell them? (Probe for type of messages and how would you
tell them?)
22. Who or what would they listen to most? (Probe for how should you tell them
(media, text message, Kaila, posters etc.?)
4. Trying to lose weight
A. Knowledge
23. We know that a lot of boys your age are trying to lose weight. What kind of
changes are they making? (Probe for food they are cutting down on, how?)
Appendices
322
B. Motivators
24. What would encourage boys your age to eat less fried foods, salty snacks, and
sweets? (Probe for other factors how; who)
25. What would make it hard for them to eat less fried foods, salty snacks, and
sweets? (Probe for other factors how; who)
C. Messages and messengers
26. If you were in charge of doing something to change what boys your age eat to
lose weight, what would you tell them? (Probe for type of message and how would
you tell them?)
27. Who or what would they listen to most? (Probe for how should you tell them
(media, text message, Kaila, posters etc.?)
Appendices
323
Appendix C: Plain Language Statement For Participants
Date:
Full Project Title: Motivational messages and messengers to improve adolescents’
diets
Principal Researcher: Dr Helen Mavoa (Research Fellow, Deakin University)
Student Researcher: Ms Jillian Wate (PhD Candidate, Deakin University)
Associate Researchers: Dr Wendy Snowdon (Coordinator, CPOND)
Professor Boyd Swinburn (Professor, Deakin University)
Dear Participants,
I am writing to invite you to take part in a study that is being carried out by
researchers from the Fiji School of Medicine (now the College of Medicine, Nursing
and Health Sciences (CMNHS) in the Fiji National University and Deakin University
(Australia). The research project is part of a PhD funded by the CMNHS and Deakin
University (Australia). Young people aged 13 to 18 years are being invited to take
part in this study which involves one focus group that will be held at a time and
venue (to be filled prior to distributing invitations e.g. church hall).
DEAKIN UNIVERSITY
Plain Language Statement for Participants
Appendices
324
Purpose of the project
The purpose of this study is to identify best messages and messengers to encourage
young people in Fiji to change to healthier dietary patterns.
Who is being surveyed?
Forty eight- sixty four young people aged 13–18 years, with equal numbers of boys
and girls.
What is involved?
You will be invited to take part in one focus group (discussion in a group of 5–7
people your sex and age) lasting 60–90 minutes at a place and time (to be filled prior
to distributing invitations e.g. church hall). You will need to provide written consent
from one of your parents and also sign a form yourself to say that you agree to take
part at the beginning of the focus group. Focus groups will be conducted by two
researchers and will be recorded with your permission. The kinds of questions that
we will ask include: 1) what are the best messages to encourage young people to
have healthier diets? and 2) who or what would be best to do this?
Timeframe
1st May 2012 to 1st December 2012
Do you have to take part in this survey?
You do not have to take part and you may decline without giving any reasons.
What about the privacy?
We will ask all people taking part in the focus groups to keep the discussions
confidential. The focus groups will be recorded and then transcribed. Your name will
be replaced by an ID number on all recordings and transcripts. All this information
will be securely stored for six years following publication of results and in a separate
place from your consent forms. Only the research team will have access to the data
base where the transcripts are stored and they will sign a confidentiality agreement.
Hard copies will be available to analysts during the analysis process and will
Appendices
325
subsequently be destroyed. Written reports or presentations will not include any
information that can identify you or other participants.
Once you have agreed to take part, you are free to answer questions to any extent and
withdraw from the project at any time. If you do withdraw, any information that we
have will not be used and will be destroyed. The focus groups will be very relaxed
and are seeking your ideas about the best messages about diets for people your age.
We do not expect that the focus groups will cause any personal discomfort or stress.
How can you help?
By agreeing to be take part in one focus group, your ideas will help us to work out
the best ways to encourage young people in Fiji to have healthier diets. Please
complete the enclosed consent form and return it to the person conducting the focus
group (Jillian Wate) as soon as possible.
Further information
If you require any further information about the survey, please contact the following
study researchers.
Ms. Jillian Wate (FSMed) + (679) 3233 255 or
Dr. Wendy Snowdon (FSMed) + (679) 3233 253 or
Dr Helen Mavoa (Deakin University) Email: [email protected]
Professor Boyd Swinburn (Deakin University + (61) 3 92517096
The ethical aspects of this research project have been approved by a human ethics
committee at Deakin. If you have any complaints about any aspect of the project, the
way it is being conducted or any questions about your rights as a research participant,
then you may contact:
The Manager, Deakin Research Integrity, Deakin University, 221 Burwood Highway, Burwood Victoria 3125, Telephone: 9251 7129, Facsimile: 9244 6581; [email protected].

Appendices
326
Appendix D: Plain Language Statement For Parents Or Guardians
Date:
Full Project Title: Motivational messages and messengers to improve adolescents’
diets in Fiji
Principal Researcher: Dr Helen Mavoa (Research Fellow, Deakin University)
Student Researcher: Ms Jillian Wate (PhD Candidate, Deakin University)
Associate Researchers: Dr Wendy Snowdon (Coordinator, CPOND)
Professor Boyd Swinburn (Professor, Deakin University)
Dear Parents or Guardians,
I am writing to invite your child to take part in a study that is being carried out by
researchers from the Fiji School of Medicine (now the College of Medicine, Nursing
and Health Sciences (CMNHS) in Fiji National University and Deakin University
(Australia). This research is part of a PhD funded by the CMNHS and Deakin
University. The research is being undertaken at a venue (to fill in prior to distributing
invitations e.g. church hall). Young people aged from 13 to 18 years are being
invited to take part in this study, which would involve your child taking part in a
discussion group with 5–7 other people.
Plain Language Statement for Parents or Guardians
DEAKIN UNIVERSITY
Appendices
327
Purpose of the project
The purpose of this study is to identify the best messages and messengers to
encourage young people in Fiji to change to healthier dietary patterns. The study will
provide recommendation(s) for social marketing and education programmes to
improve the health of adolescents’ diets in Fiji.
Who is being surveyed?
Forty eight to sixty four young people aged 13–18 years, with equal numbers of boys
and girls, will take part in a focus group (discussion group) with 5–7 people of the
same sex and age.
What is involved?
Your child is invited to take part in one focus group (discussion in a group of 5–7
people their sex and age) lasting 60–90 minutes at a place and time nominated by
focal points. You will need to provide written consent for your child, who will be
asked to sign an Assent Form prior to taking part in a focus group session. Focus
groups will be conducted by two researchers and will be recorded with the group’s
permission. The kinds of questions that we will ask include: 1) what are the best
messages to encourage young people to have healthier diets? and 2) who or what
would be best to do this?
Timeframe
1st May 2012 to 1st December 2012
Does your child have to take part in this survey?
Your child does not have to take part. You may decline this invitation without giving
any reasons.
What about the privacy?
We will ask all people taking part in the focus groups to keep the discussions
confidential. The focus groups will be recorded and then transcribed. Your child’s
name will be replaced by an ID number on all recordings and transcripts. All this
Appendices
328
information will be securely stored for six years following publication of results and
in a separate place from the consent forms. Only the research team will have access
to the data base where the transcripts are stored and they will sign a confidentiality
agreement. Hard copies will be available to analysts during the analysis process and
will subsequently be destroyed. Written reports or presentations will not include any
information that can identify you or other participants.
Once you have agreed that your child can take part, he or she is free to answer
questions to any extent and withdraw from the project at any time. If your child does
withdraw, any information that we have will not be used and will be destroyed. The
focus groups will be very relaxed and are seeking your child’s ideas about the best
messages and messengers about diets for young people. We do not expect that the
focus groups will cause any personal discomfort or stress. The results from the study
will be used to inform social marketing. Results will also be published in scientific
journals so that people can learn from this important information.
How can you help?
By giving written permission for your child to take part in one focus group, your
child’s ideas will help us to work out the best ways to encourage young people in Fiji
to have healthier diets. Please complete the enclosed consent form and return it to the
person conducting the focus group (Jillian Wate) or the focal point as soon as
possible.
Further information
If you require any further information about the survey, please contact the following
study researchers.
Ms. Jillian Wate (FSMed) + (679) 3233 255 or
Dr. Wendy Snowdon (FSMed) + (679) 3233 253 or
Dr Helen Mavoa (Deakin University) Email: [email protected]
Professor Boyd Swinburn (Deakin University + (61) 3 92517096

Appendices
329
The ethical aspects of this research project have been approved by a human ethics
committee at Deakin. If you have any complaints about any aspect of the project, the
way it is being conducted or any questions about your rights as a research participant,
then you may contact:
The Manager, Deakin Research Integrity, Deakin University, 221 Burwood Highway, Burwood Victoria 3125, Telephone: 9251 7129, Facsimile: 9244 6581; [email protected].

Appendices
330
Appendix E: Consent Form
Date:
Full Project Title: Motivational messages and messengers to improve adolescents’
diets in Fiji
Researchers: Dr Helen Mavoa (Research Fellow, Deakin University)
Ms Jillian Wate (PhD Candidate, Deakin University/C-POND)
Dr Wendy Snowdon (Coordinator, C-POND)
Professor Boyd Swinburn (Professor, Deakin University)
I have read and understood the Plain Language Statement.
I understand that my child may withdraw from the study, without giving a reason at
any time.
I agree to let my child take part in this research.
Signed by Parent: _________________________________________
Name: _____________________________________
(please print clearly)
Date: _________________
DEAKIN UNIVERSITY
Consent Form
331
DEAKIN UNIVERSITY
Appendix F: Assent Form For Participants
Date:
Full Project Title: Motivational messages and messengers to improve adolescents’
diets in Fiji
Researchers: Dr Helen Mavoa (Research Fellow, Deakin University)
Ms Jillian Wate (PhD Candidate, Deakin University/C-POND)
Dr Wendy Snowdon (Coordinator, C-POND)
Professor Boyd Swinburn (Professor, Deakin University)
I have been given, and have understood, an explanation of this research project. I
have had an opportunity to ask questions and have them answered.
I understand that I may withdraw myself or any information traceable to me, without
giving a reason at any time.
I agree to take part in this research.
Signed by Participant: _________________________________________
Name: _____________________________________
(please print clearly)
Date: _________________
Assent Form for Participants