DEMOGRAPHIC DIVIDEND DEMOGRAPHIC DIVIDEND DEMOGRAPHIC DIVIDEND

Obesity and Poverty in America: time and demographic trends
Roland Sturm, Ph.D.Senior Economist
RAND
Why the Recent Obesity Epidemic?
• Many competing hypotheses
� Transportation
� Television
� More work hours
� Not enough exercise
� Fast food
� Affluence
� Poverty
• Compatible with facts?
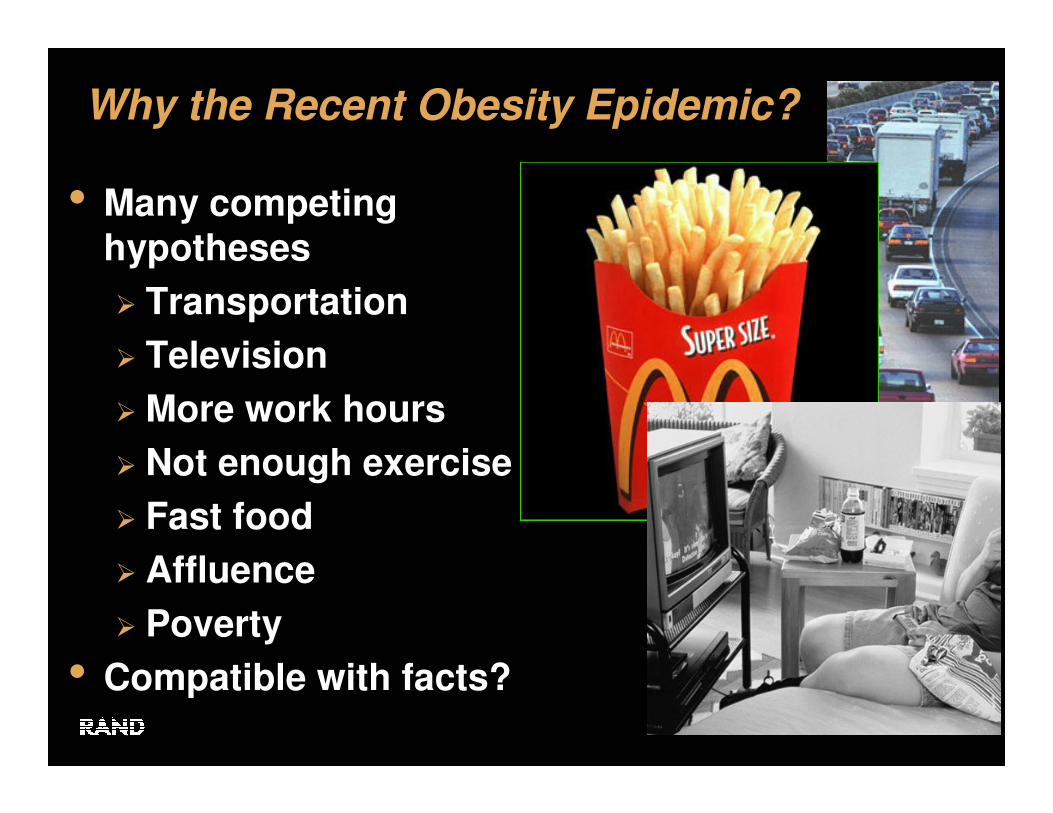
Different Theories Need Not Be Contradictory
• Scope of theories narrower than proponents assume
• Synthesis often better than “either … or”
• Misunderstandings because no common knowledge
– facts or assumptions?
• Conventional wisdom unreliable guide
• Let’s start with looking at the bigger picture and data about societal trends
Outline of Talk
• Poverty and Obesity
• What has changed in our lives? Trends in time and money
• Time use differences by income groups
Obesity and Poverty?
• Not new idea that obesity has adverse health effects
• But isn’t obesity really a disease of affluence?
• Traditionally the privilege of the wealthy
– Still is in many countries
– Shouldn’t that reduce socioeconomic
health disparities?

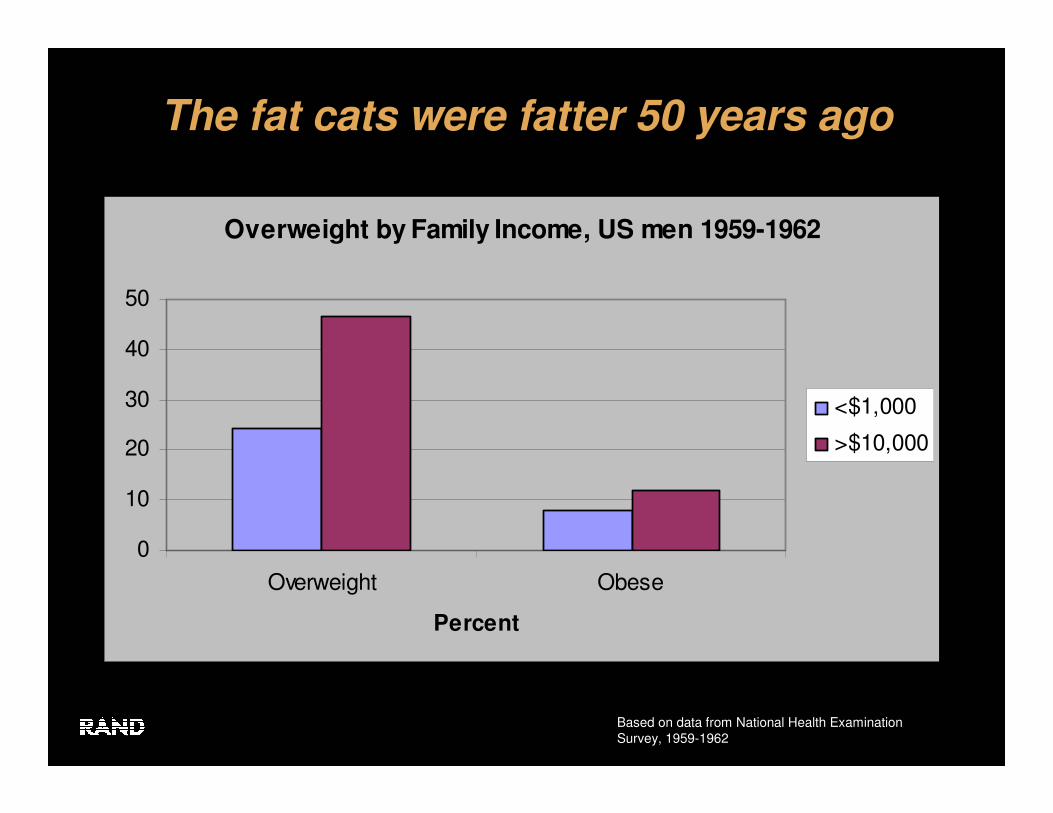
The fat cats were fatter 50 years ago
Overweight by Family Income, US men 1959-1962
0
10
20
30
40
50
Overweight Obese
Percent
<$1,000
>$10,000
Based on data from National Health Examination Survey, 1959-1962
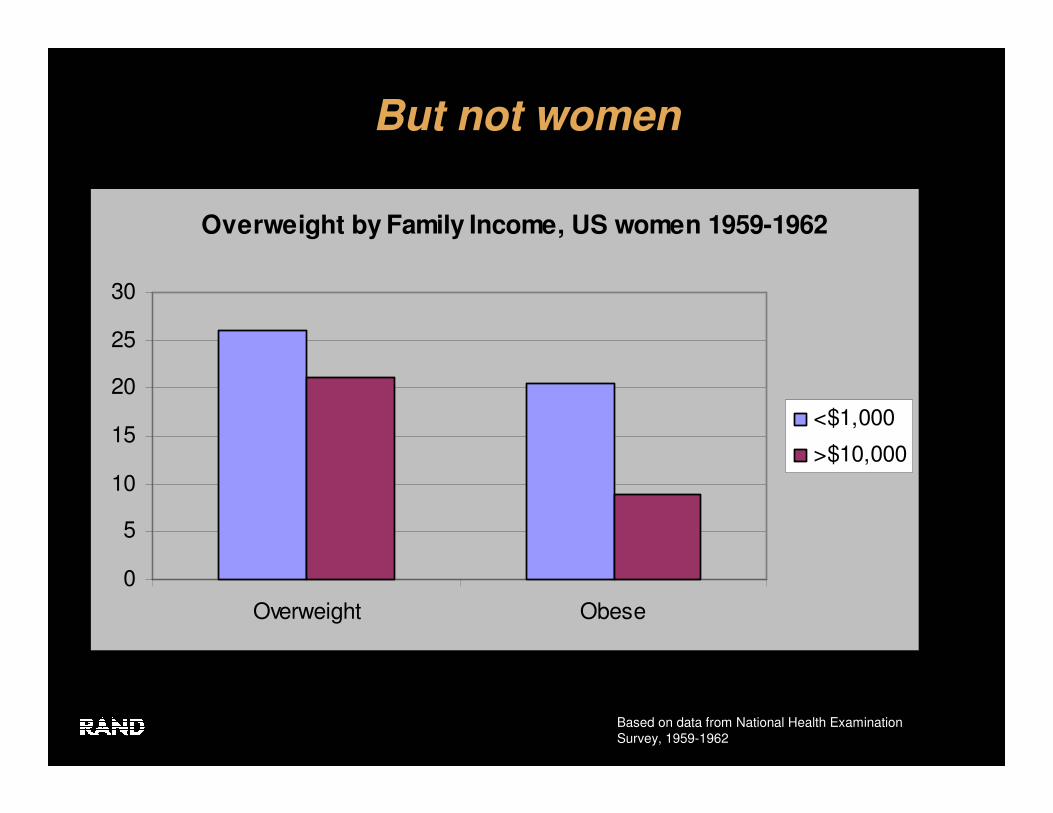
But not women
Overweight by Family Income, US women 1959-1962
0
5
10
15
20
25
30
Overweight Obese
<$1,000
>$10,000
Based on data from National Health Examination Survey, 1959-1962
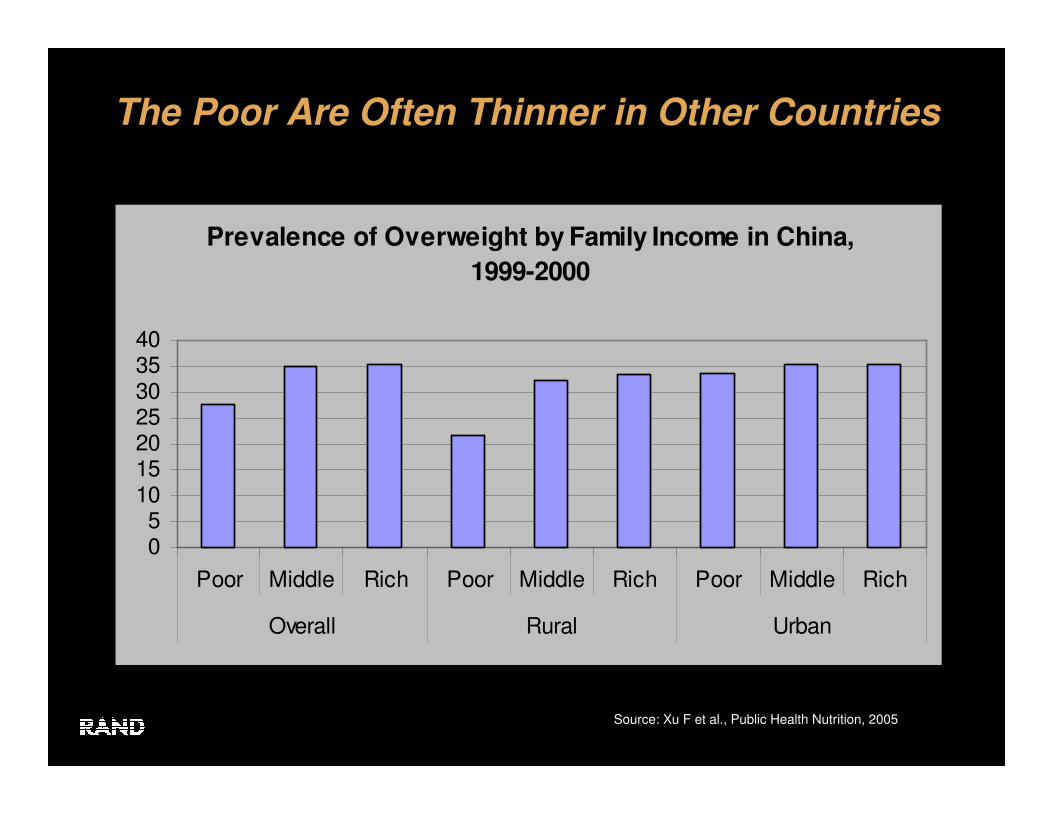
The Poor Are Often Thinner in Other Countries
Prevalence of Overweight by Family Income in China,
1999-2000
05
10152025303540
Poor Middle Rich Poor Middle Rich Poor Middle Rich
Overall Rural Urban
Source: Xu F et al., Public Health Nutrition, 2005
117 106186
9733
471
188
209
107
2445
5226
309
267
389
122
252
117
129
59
106
12
9
0
200
400
600
800
1000
1200
1990 2020 1990 2020
De
ath
ra
tes
pe
r 1
00
,00
0
All others Infections and parasitic diseases
Other noncommunicable diseases Malignant neoplasms
Diabetes CVD
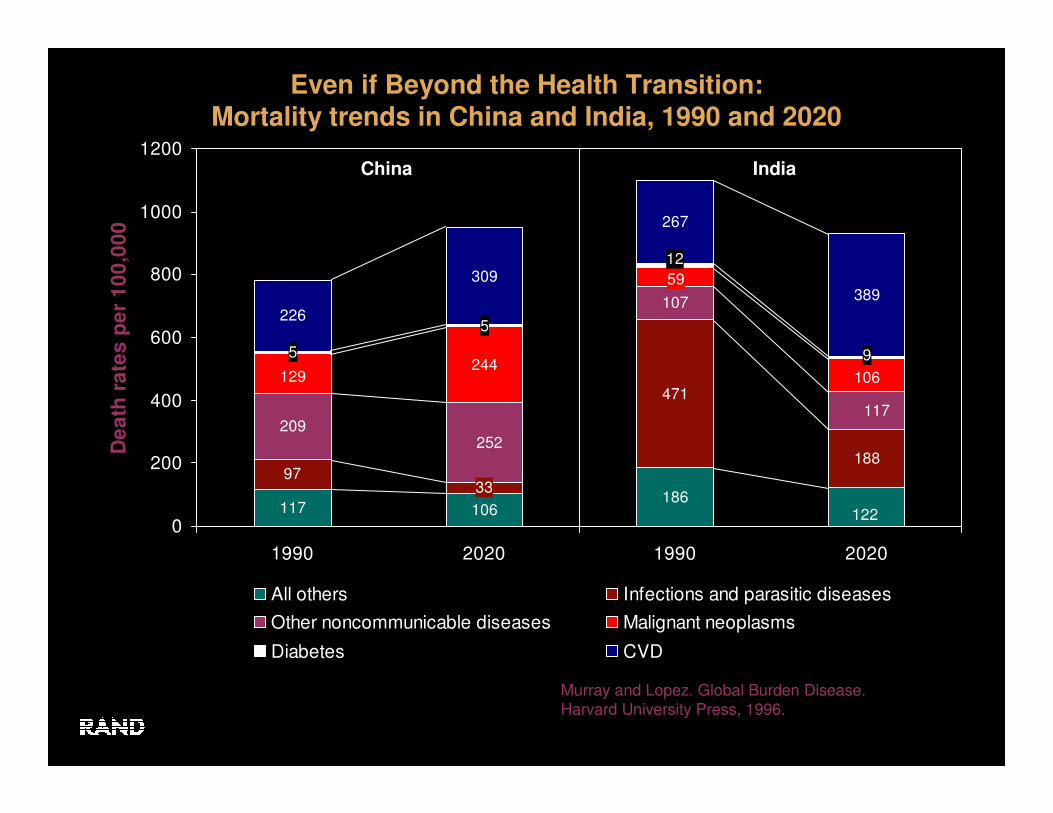
Even if Beyond the Health Transition:Mortality trends in China and India, 1990 and 2020
China India
Murray and Lopez. Global Burden Disease.Harvard University Press, 1996.
In the US, Obesity and Poverty now occur together
more often …
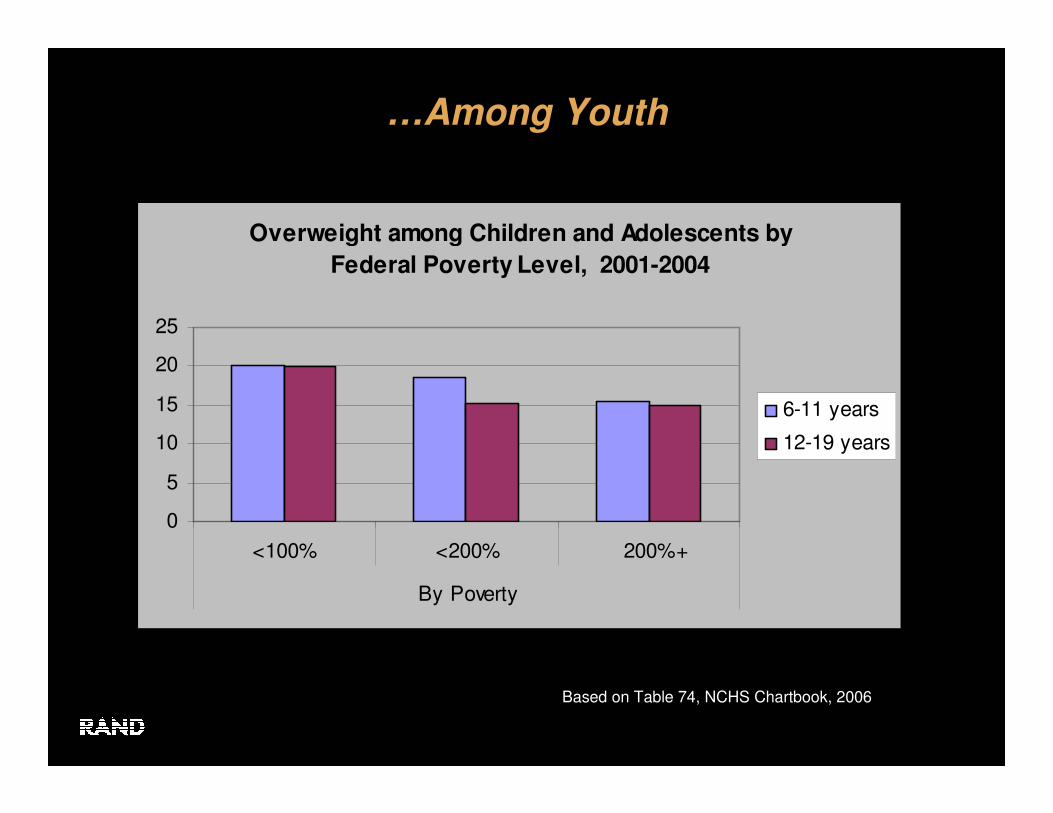
…Among Youth
Overweight among Children and Adolescents by
Federal Poverty Level, 2001-2004
0
5
10
15
20
25
<100% <200% 200%+
By Poverty
6-11 years
12-19 years
Based on Table 74, NCHS Chartbook, 2006
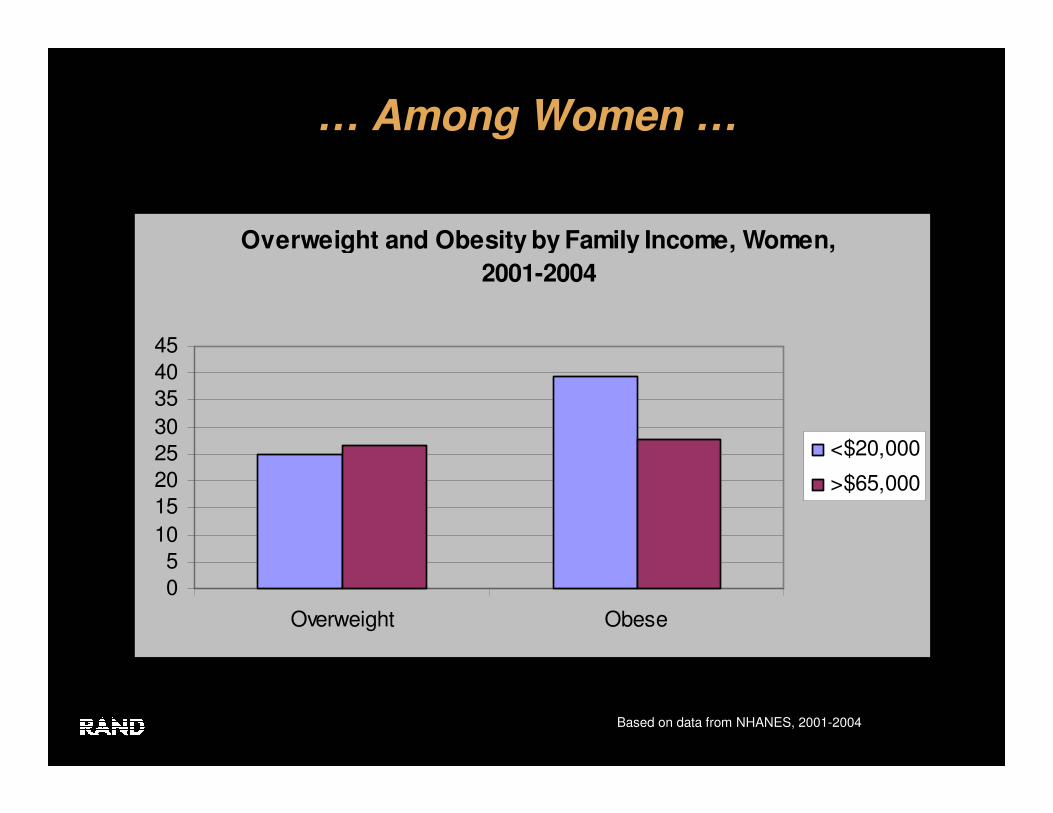
… Among Women …
Based on data from NHANES, 2001-2004
Overweight and Obesity by Family Income, Women,
2001-2004
05
10
15202530
354045
Overweight Obese
<$20,000
>$65,000
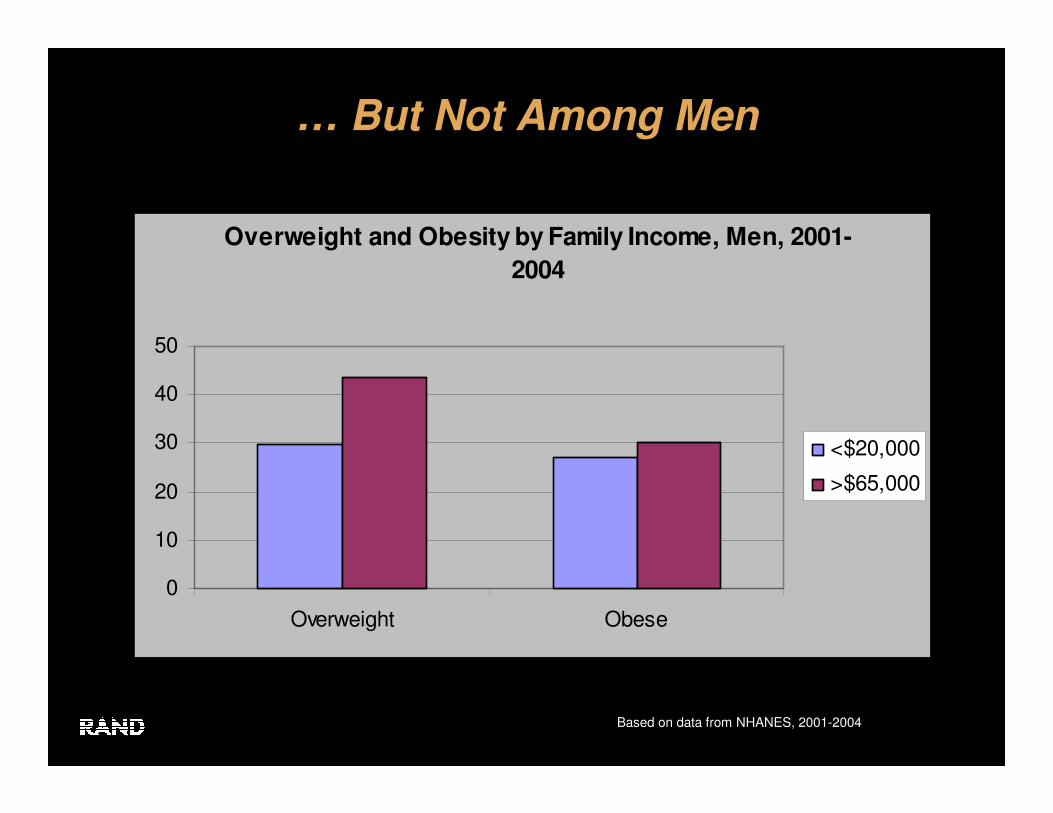
… But Not Among Men
Based on data from NHANES, 2001-2004
Overweight and Obesity by Family Income, Men, 2001-
2004
0
10
20
30
40
50
Overweight Obese
<$20,000
>$65,000
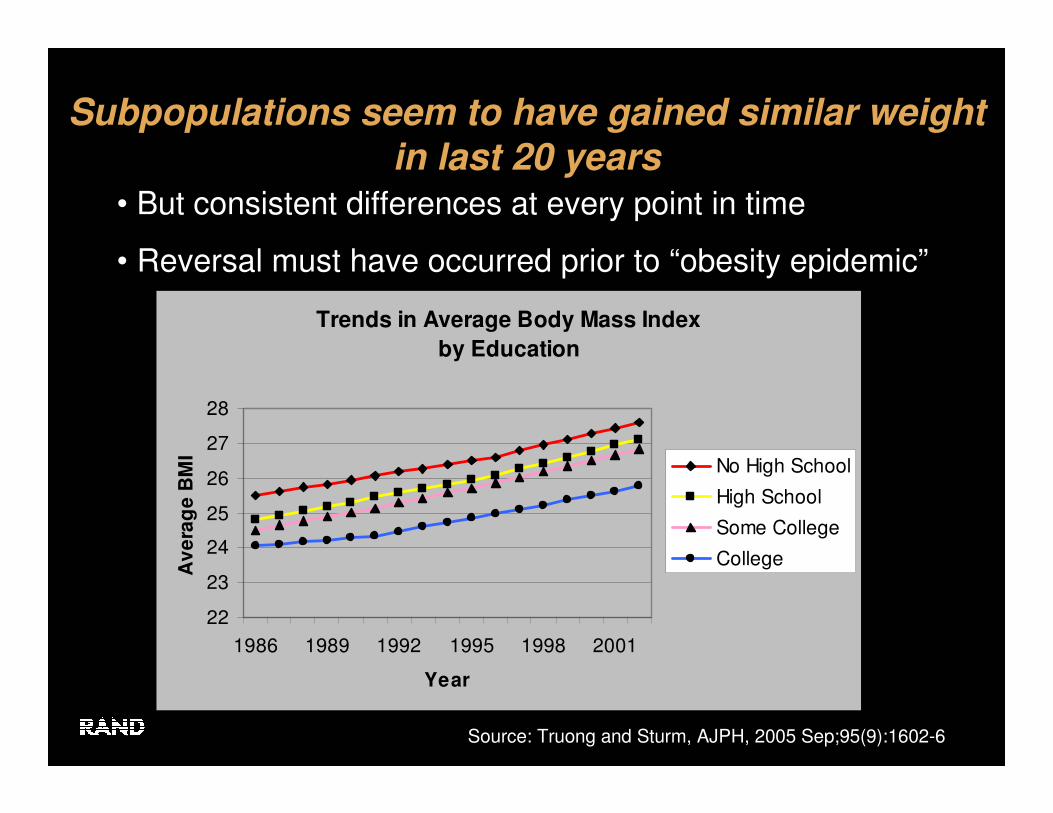
Subpopulations seem to have gained similar weight
in last 20 years
Trends in Average Body Mass Index
by Education
22
23
24
25
26
27
28
1986 1989 1992 1995 1998 2001
Year
Av
era
ge
BM
I
No High School
High School
Some College
College
Source: Truong and Sturm, AJPH, 2005 Sep;95(9):1602-6
• But consistent differences at every point in time
• Reversal must have occurred prior to “obesity epidemic”
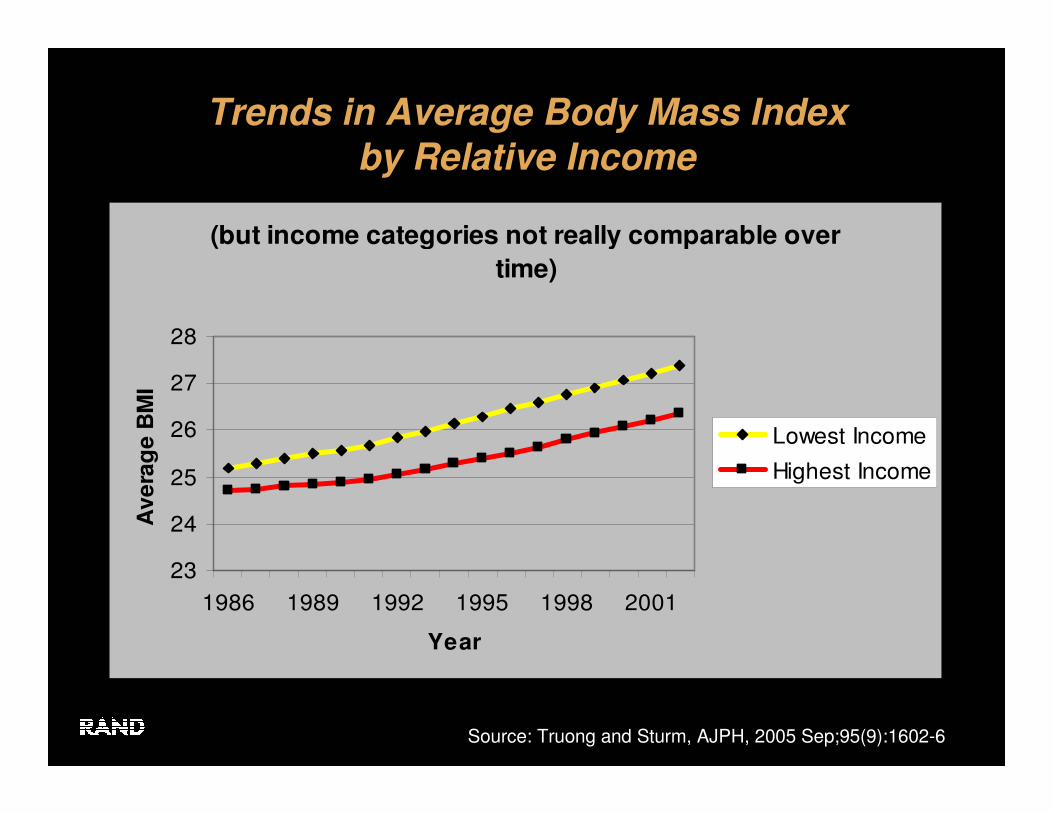
Trends in Average Body Mass Index
by Relative Income
(but income categories not really comparable over
time)
23
24
25
26
27
28
1986 1989 1992 1995 1998 2001
Year
Ave
rag
e B
MI
Lowest Income
Highest Income
Source: Truong and Sturm, AJPH, 2005 Sep;95(9):1602-6
Outline of Talk
• Poverty and Obesity
• What has changed in our lives? Trends in time and money
• The role of income
Time and Money
• What do people do?
�Time use data
• Why study time use?
�Scarcest resource
�Regardless of economic growth, a day has 24 hours
� In contrast to money, everybody has the same amount each day
• Where does the money go?
�Gross output by industry
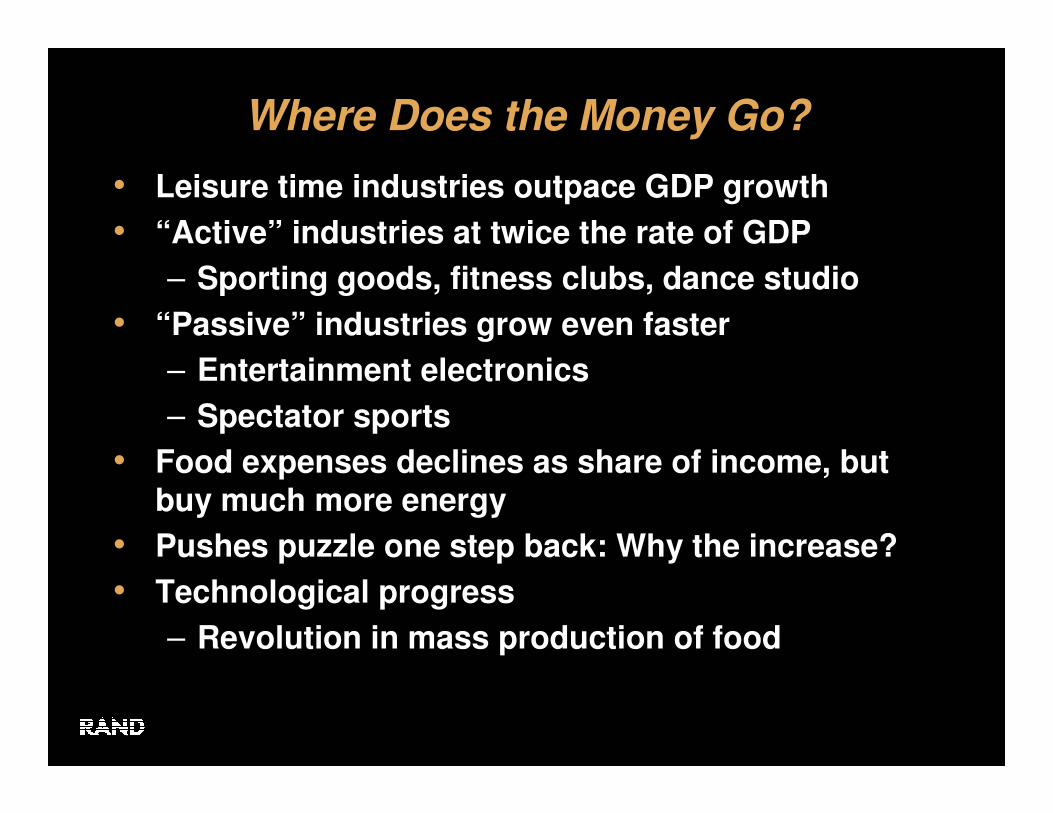
Where Does the Money Go?
• Leisure time industries outpace GDP growth
• “Active” industries at twice the rate of GDP
– Sporting goods, fitness clubs, dance studio
• “Passive” industries grow even faster
– Entertainment electronics
– Spectator sports
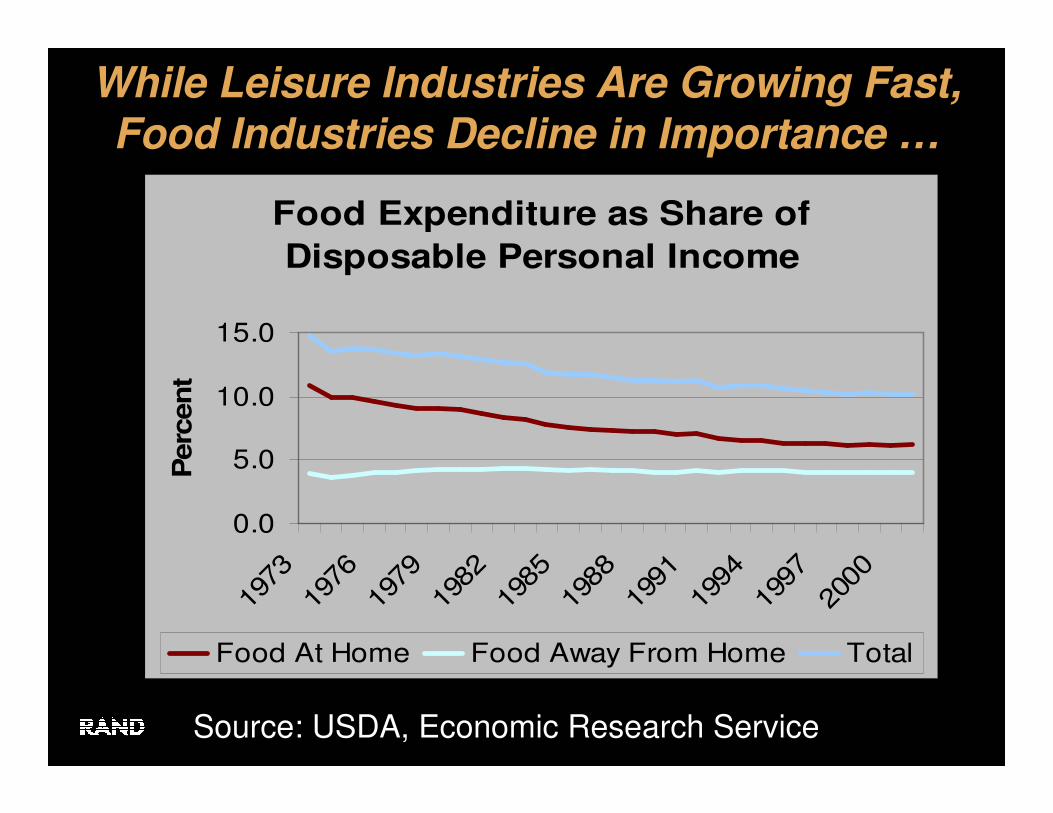
• Food expenses declines as share of income, but buy much more energy
• Pushes puzzle one step back: Why the increase?
• Technological progress
– Revolution in mass production of food

Retail: Sporting Goods Doubled, While Real GDP Increased 50%
0
2000
4000
6000
8000
10000
12000
1987
1988
1989
1990
1991
1992
1993
1994
1995
1996
1997
1998
1999
2000
2001
Millio
ns
19
96
do
lla
rs
Sporting goods and bicycle shops
Source: Bureau of Economic Activity, Gross Domestic Product By Industry.

But Dwarfed By Growth of Home Electronics (TV, DVD)
0
10000
20000
30000
40000
50000
1987
1988
1989
1990
1991
1992
1993
1994
1995
1996
1997
1998
1999
2000
2001
Mil
lio
ns
19
96
do
lla
rs
Radio and TV stores Sporting goods and bicycle shops
Source: Bureau of Economic Activity, Gross Domestic Product By Industry.
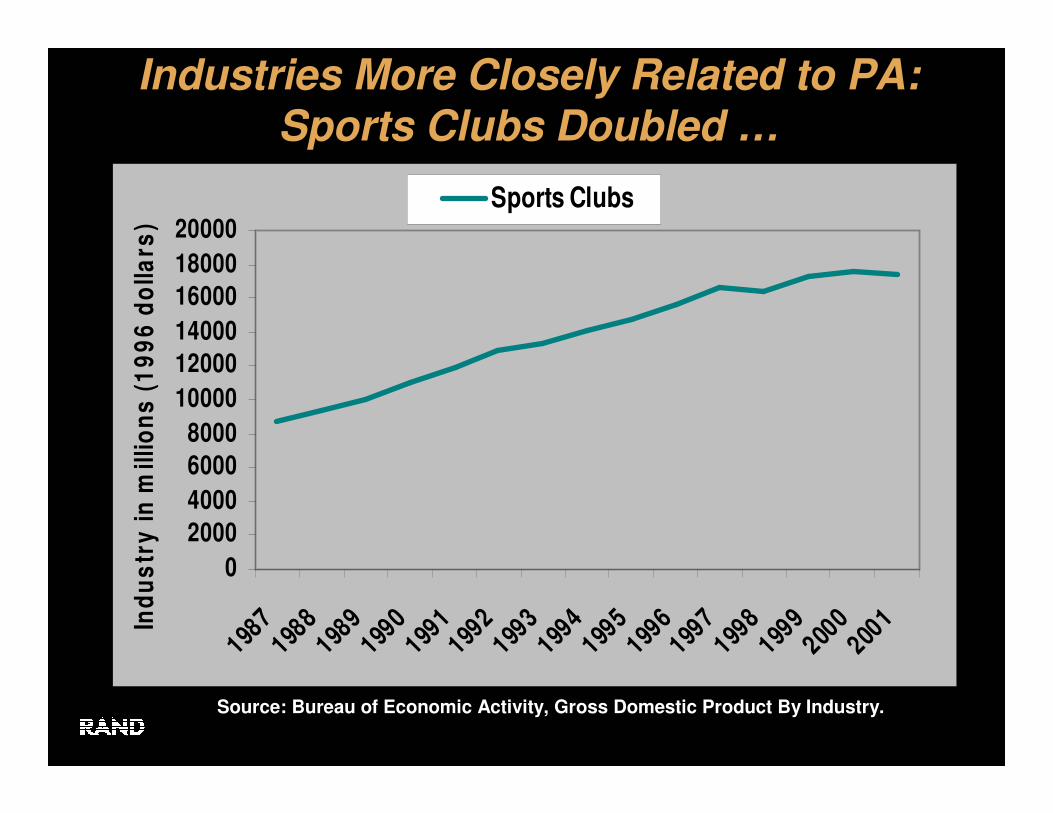
Industries More Closely Related to PA: Sports Clubs Doubled …
0
2000
4000
6000
8000
10000
12000
14000
16000
18000
20000
1987
1988
1989
1990
1991
1992
1993
1994
1995
1996
1997
1998
1999
2000
2001In
du
str
y i
n m
illi
on
s (
19
96
do
lla
rs)
Sports Clubs
Source: Bureau of Economic Activity, Gross Domestic Product By Industry.
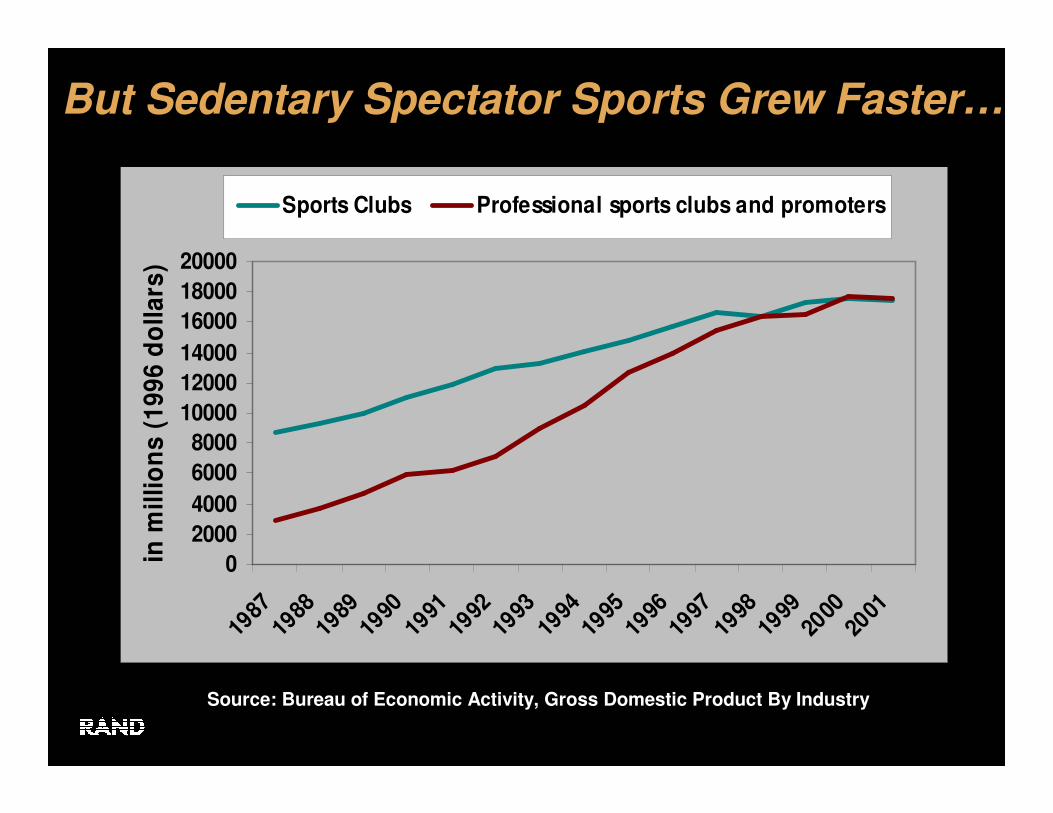
But Sedentary Spectator Sports Grew Faster…
0
2000
4000
6000
8000
10000
12000
14000
16000
18000
20000
1987
1988
1989
1990
1991
1992
1993
1994
1995
1996
1997
1998
1999
2000
2001
in m
illi
on
s (
19
96
do
lla
rs)
Sports Clubs Professional sports clubs and promoters
Source: Bureau of Economic Activity, Gross Domestic Product By Industry
Source: USDA, Economic Research Service
While Leisure Industries Are Growing Fast, Food Industries Decline in Importance …
Food Expenditure as Share of
Disposable Personal Income
0.0
5.0
10.0
15.0
1973
1976
1979
1982
1985
1988
1991
1994
1997
2000
Perc
en
t
Food At Home Food Away From Home Total
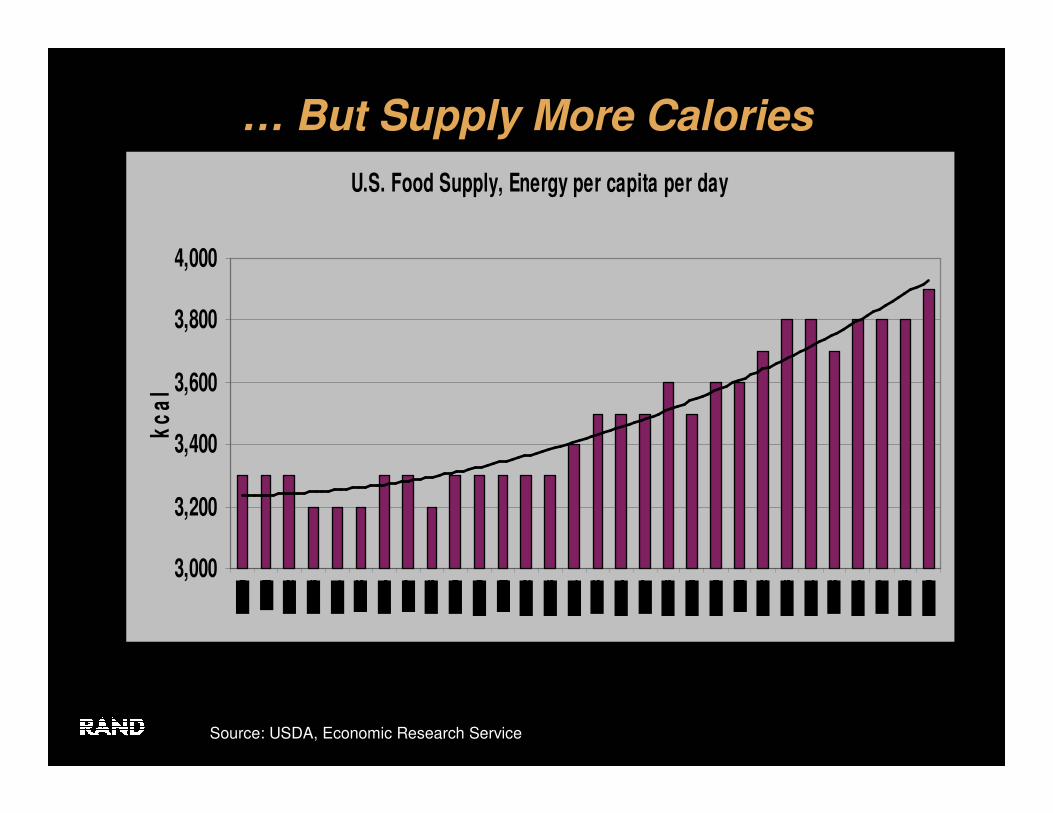
Source: USDA, Economic Research Service
… But Supply More Calories
U.S. Food Supply, Energy per capita per day
3,000
3,200
3,400
3,600
3,800
4,000
kc
al

Source: BLS
Price Indices
50.0
100.0
150.0
200.0
250.0
300.0
1978
1980
1982
1984
1986
1988
1990
1992
1994
1996
1998
2000
2002
1982-1
984=100
FreshFruits andVegetables
ConsumerPriceIndex
SugarsandSweets
Soft Drinks
Price trends in food types likely to
exacerbate income effects
• Technological progress and production efficiencies affect relative prices
– Less change for perishable/fresh goods means higher prices
• Double hit for lower income groups
– “prudent” diets become relatively more expensive everywhere
– Perishable, more expensive foods less available in small stores
– Even though generally more food stores in low income neighborhoods, smaller size and less efficient means higher prices
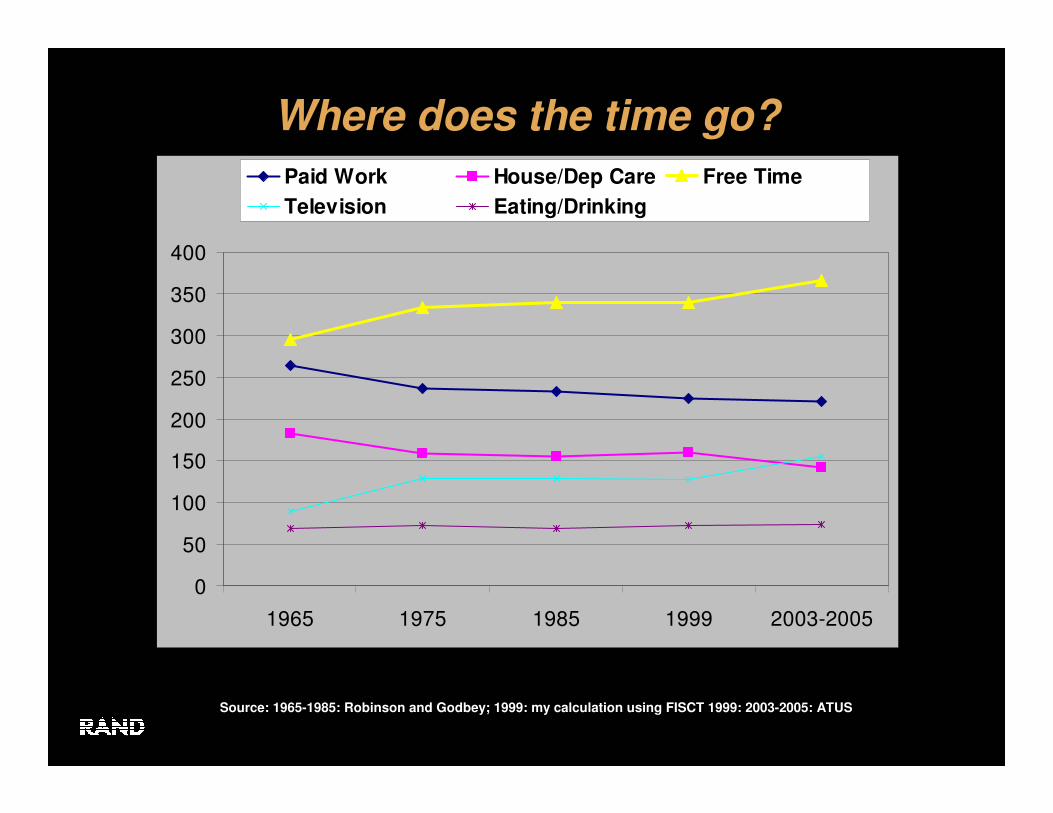
Where does the time go?
Source: 1965-1985: Robinson and Godbey; 1999: my calculation using FISCT 1999: 2003-2005: ATUS
0
50
100
150
200
250
300
350
400
1965 1975 1985 1999 2003-2005
Paid Work House/Dep Care Free Time
Television Eating/Drinking
Active Leisure Time Keeps Increasing
• In BRFSS, additional 20 mins/week in last decade in physical activity for the “typical” American
• Percent of inactive keeps falling
� From 30.7 in 1990 to 27.4 in 2000
� More than 3 percentage point
• But small relative to total increase in free time
Home Production
• Drop of 5 hours/week
• Biggest reduction in cleaning and meal preparation
• Meal preparation more important for diet than
physical activity
� Wider range and variety of prepared food available at lower TIME costs
� Variety of snacks always available, including while watching TV/DVD
Trends in Time Use Differ For Children
• For adults 18-64, free time increased by 8 hours per week from 1965 to 2003-2005
• increase for both men and women
• in or out of labor force
• For children 3-12, free time decreased by 7 hours per week from 1981 to 1997
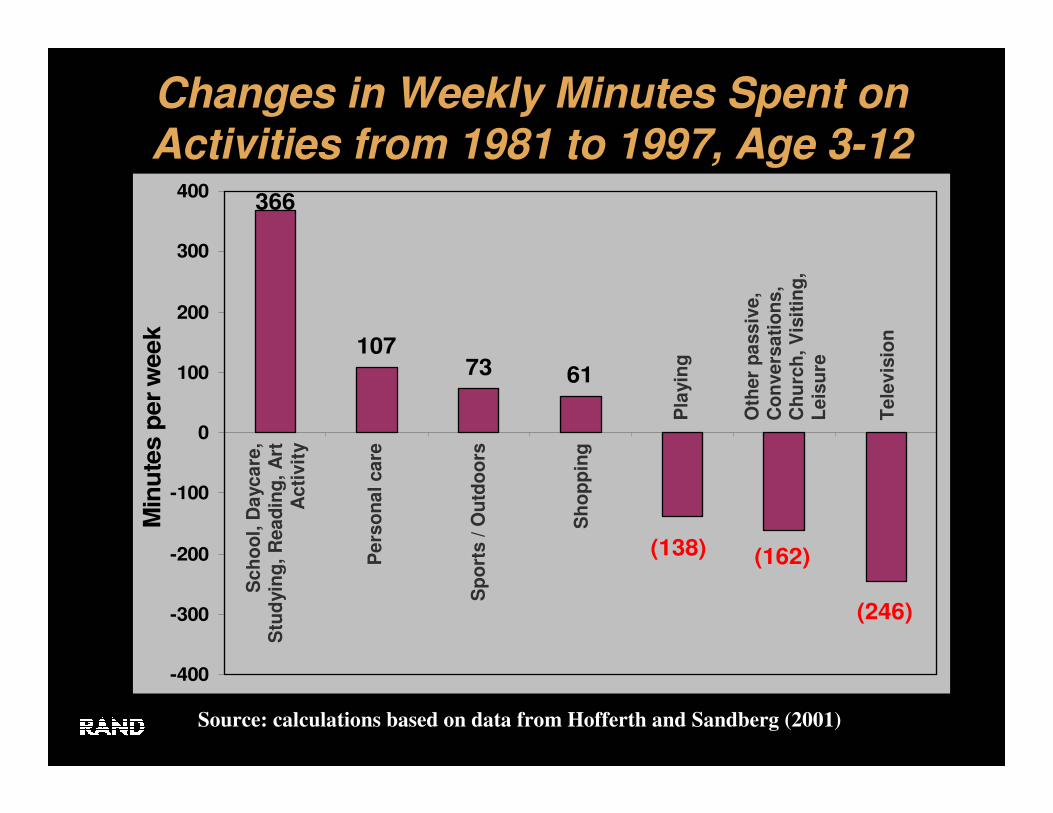
Changes in Weekly Minutes Spent on Activities from 1981 to 1997, Age 3-12
Figure 2: Changes in Weekly Minutes Spent on Activities from 1981 to 1997, Age
3-12
Source: calculation based on data from Hofferth and Sandberg (2001b)
(162)(138)
(246)
6173107
366
-400
-300
-200
-100
0
100
200
300
400
Min
ute
s p
er
week
Sch
oo
l, D
aycare
, S
tud
yin
g,
Read
ing
, A
rt
Acti
vit
y
Pers
on
al care
Sp
ort
s / O
utd
oo
rs
Sh
op
pin
g
Pla
yin
g
Oth
er
passiv
e,
Co
nvers
ati
on
s,
Ch
urc
h, V
isit
ing
, L
eis
ure
Tele
vis
ion
Source: calculations based on data from Hofferth and Sandberg (2001)
Outline of Talk
• Poverty and Obesity
• What has changed in our lives? Trends in time and money
• Time use differences by income groups
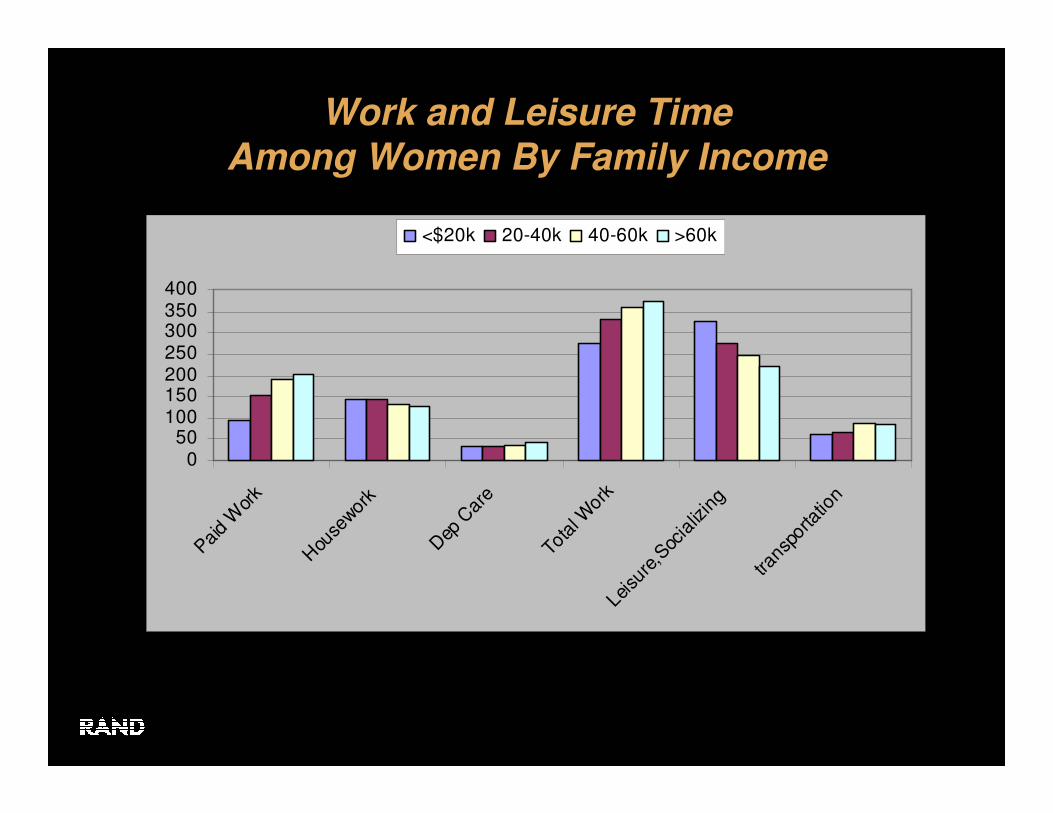
Work and Leisure Time
Among Women By Family Income
050
100150200250300350400
Paid
Wor
k
Hou
sewor
k
Dep
Car
e
Tota
l Wor
kLe
isur
e,Soc
ializ
ing
trans
porta
tion
<$20k 20-40k 40-60k >60k
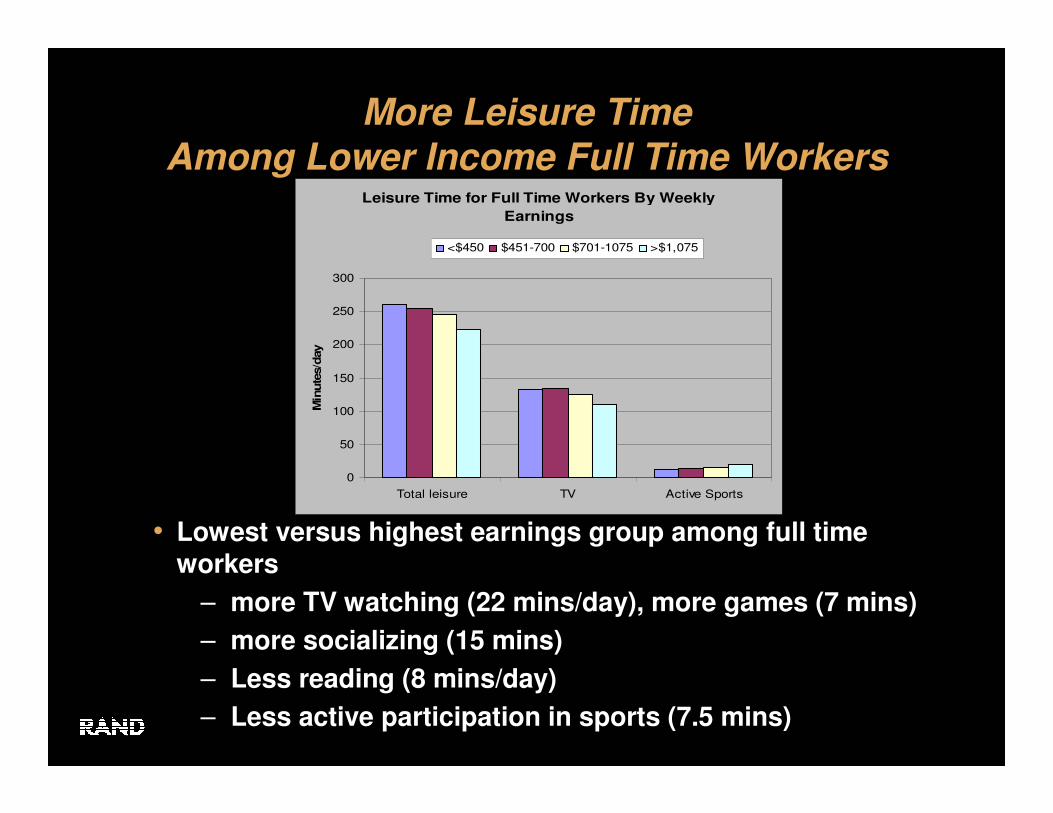
More Leisure Time
Among Lower Income Full Time Workers
• Lowest versus highest earnings group among full time workers
– more TV watching (22 mins/day), more games (7 mins)
– more socializing (15 mins)
– Less reading (8 mins/day)
– Less active participation in sports (7.5 mins)
Leisure Time for Full Time Workers By Weekly
Earnings
0
50
100
150
200
250
300
Total leisure TV Active Sports
Min
ute
s/d
ay
<$450 $451-700 $701-1075 >$1,075
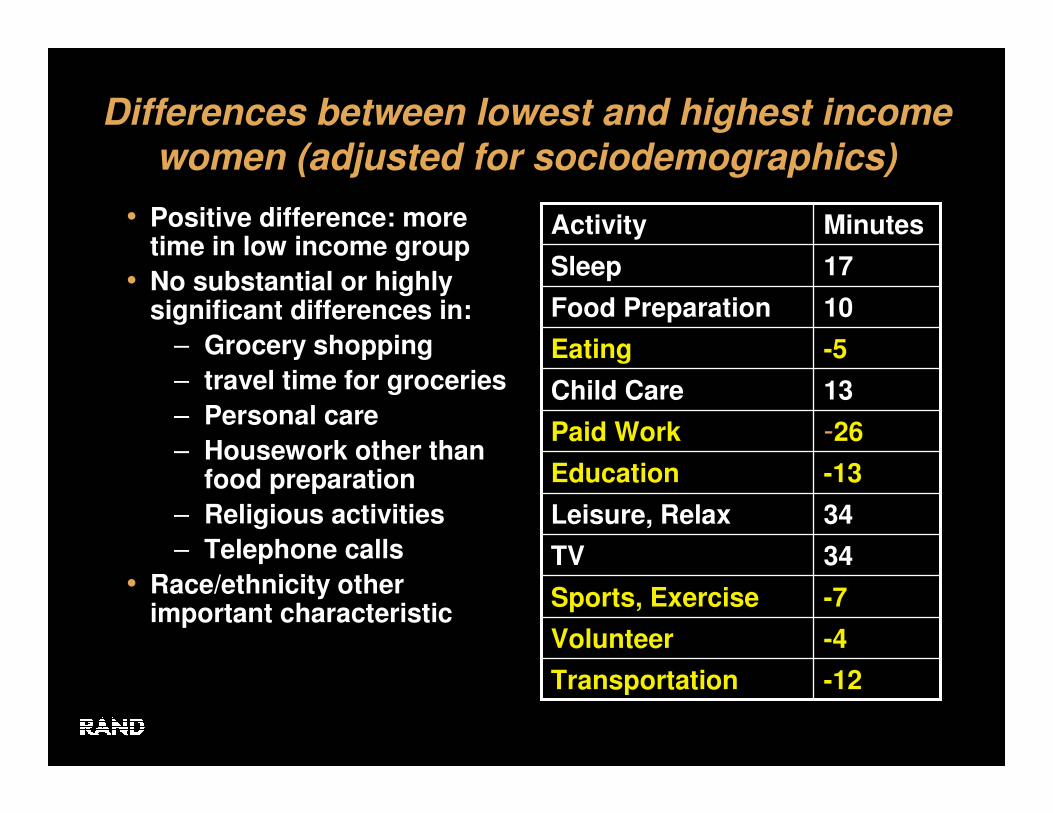
Differences between lowest and highest income
women (adjusted for sociodemographics)
• Positive difference: more time in low income group
• No substantial or highly significant differences in:
– Grocery shopping
– travel time for groceries
– Personal care
– Housework other than food preparation
– Religious activities
– Telephone calls
• Race/ethnicity other important characteristic
MinutesActivity
34TV
-5Eating
-12Transportation
-4Volunteer
-7Sports, Exercise
34Leisure, Relax
-13Education
-26Paid Work
13Child Care
10Food Preparation
17Sleep
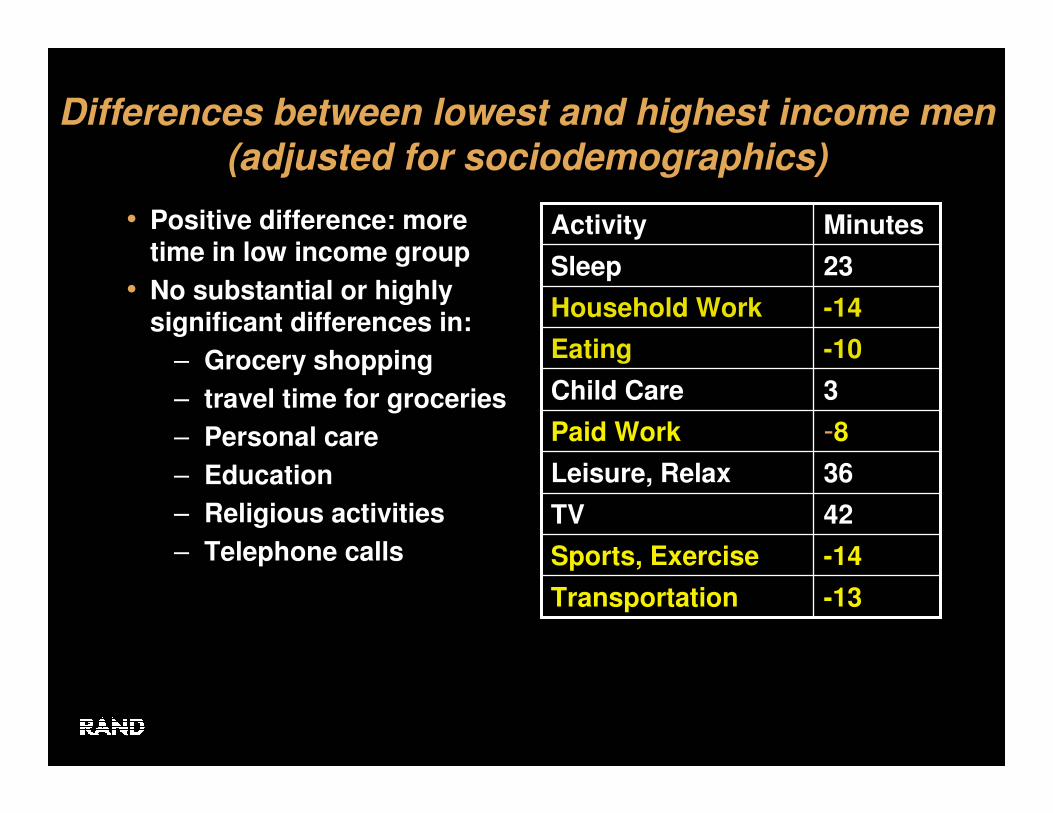
Differences between lowest and highest income men
(adjusted for sociodemographics)
• Positive difference: more time in low income group
• No substantial or highly significant differences in:
– Grocery shopping
– travel time for groceries
– Personal care
– Education
– Religious activities
– Telephone calls
MinutesActivity
42TV
-10Eating
-13Transportation
-14Sports, Exercise
36Leisure, Relax
-8Paid Work
3Child Care
-14Household Work
23Sleep
Summary
• Obesity and poverty currently correlated among women and youth in US
• Income marker for vulnerable groups even if causes and consequences are less clear
• Does obesity cause poverty?
– marriage market likely pathway for women
• Does poverty causes obesity?
– Some plausible pathways exist, empirical evidence less clear, one of the themes today
• Or unobserved other factors?
– Likely for some subgroups (psychotic disorders)

• “The German Women are generally so disagreableto an English Eye, that it wou’d require great Portions to induce Englishmen to marry them…..dick und starcke, that is, thick and strong, always enters into their Description…”
Benjamin Franklin, ca. 1753, about immigrants