ACUTE TOXICITY ESTIMATION AND OPERATIONAL RISK MANAGEMENT OF

2
O&M Cost Estimation & Feedback of Operational Data
Tom Obdam, Henk Braam, René van de Pieterman and Luc Rademakers Energy research Centre of the Netherlands (ECN)
The Netherlands
1. Introduction
Several European countries have defined targets to install and to operate offshore wind energy and according to these targets more than 40 GW offshore wind power is expected for the year 2020. With an average turbine size of about 5 - 10 MW, four to eight thousand wind turbines should be transported, installed, operated and maintained. When not only the European plans are considered, but all international developments as well, these numbers are much higher. So worldwide the required effort for operation and maintenance (O&M) of offshore wind farms will be enormous, and control and optimisation of O&M during the lifetime of these offshore wind turbines is essential for an economical exploitation. At the moment O&M costs of offshore wind farms contribute substantially (2 to 4 ct/kWh) to the life cycle costs, so it may be profitable to check periodically whether the O&M costs can be reduced so that the total life cycle costs can be reduced (Rademakers, 2008b; Manwell) During the planning phase of a wind farm an estimate of the expected O&M cost over the life time has to be made to support the financial decision making, and furthermore quite often an initial O&M strategy has to be set up. To support this process ECN has developed the O&M Tool (Rademakers 2009a). With this computer program developed in MS-Excel it is possible to calculate the average downtime and the average costs for O&M over the life time of the wind farm. Both preventive and corrective maintenance can be considered. To analyse corrective maintenance the failure behaviour of the wind turbine has to be modelled and a certain maintenance strategy has to be set up , i.e. for each failure or group of failures it has to be specified how many technicians are needed, how these technicians are transferred to the wind turbine (small boats, helicopter, etc.) and whether a crane ship is needed. By carrying out different scenario studies the most effective one can be considered for more detailed investigations and technical assessment. The long term yearly costs and downtime are calculated and for this purpose it is sufficient to assume a constant failure rate of the wind turbines over the life time, hence it is assumed that the number of failures of a certain type is constant over the years. With this assumption the annual cost and downtime for a certain failure equals the product of number of failures of this type per year, and the downtime or cost associated with this type of failure. The total cost is a simple summation over all failures assumed to occur. So the determination of the annual cost and downtime is a straightforward operation. Once the model has been set up, the effect of adjusting an input parameter is visible immediately, which makes the O&M Tool a powerful tool commonly used by the wind industry. However, the straightforward method based on long term
www.intechopen.com

Wind Farm – Technical Regulations, Potential Estimation and Siting Assessment
32
average values introduces some limitations as well. As the actual variation in failure rate from year to year is not considered, the tool is not really suitable to estimate the O&M effort for the coming period of e.g. 1, 2 or 5 years, which is required to control and optimise O&M of a wind farm in the operational phase. For this reason ECN initiated the idea of developing the “O&M Cost estimator” (OMCE), as a tool that could be used by operators of large offshore wind farms. W.r.t. O&M during operation of a wind farm it is important (1) to monitor the actual O&M effort and (2) to control and to optimise future O&M costs. For both aspects operational data available for the wind farm are required. To be able to control the future costs and when possible to optimise the O&M strategy a computer tool is desired to estimate and to analyse the expected cost for the coming period. To support the process of monitoring, control, and optimisation ECN has started the development of the O&M Cost Estimator (Rademakers 2009a, 2009b; Pieterman). To handle both aspects, processing of operational data and prediction of future O&M costs two major parts can be distinguished: 1. OMCE Building Blocks for processing of operational data, where each building block
covers a specific data set. Currently BB’s are being developed for the following data sets:
• Operation and Maintenance;
• Logistics;
• Loads and Lifetime;
• Health Monitoring; The main objective of these building blocks is to process all available data in such a way that useful information is obtained, which can be used on the one hand as input for the OMCE-Calculator and on the other hand to monitor certain aspects of the wind farm.
2. OMCE-Calculator for the assessment of the expected O&M effort and associated costs for the coming period, where amongst others all relevant information provided by the OMCE Building Blocks is taken into account.
In contrary to the ECN O&M Tool, the OMCE-Calculator is meant to be used during the operational phase of a wind farm, to estimate the required O&M effort for the coming period, taking into account the operational experiences of the wind farm acquired during the operation of the wind farm so far. This implies that for the OMCE model it is not sufficient to determine long term yearly average numbers, but that another approach has to be followed, viz. simulation in the time domain. Furthermore the feedback of operational experience is of great importance for the OMCE model. This approach enables the possibility to include features not straightforward possible in the O&M Tool, such as clustering of repairs at different wind turbines, spare control, optimisation of logistics of offshore equipment, and so on. In the following sections firstly some more general information if provided on modelling the O&M aspects of offshore wind farms. Secondly, the OMCE project is discussed in more detail. In sections 3 and 4 some examples are provided to illustrate the possibilities of, respectively, the OMCE-Calculator and the OMCE-Building Blocks. Finally, in section 5 the main conclusions are summarised.
2. Modelling O&M of offshore wind farms
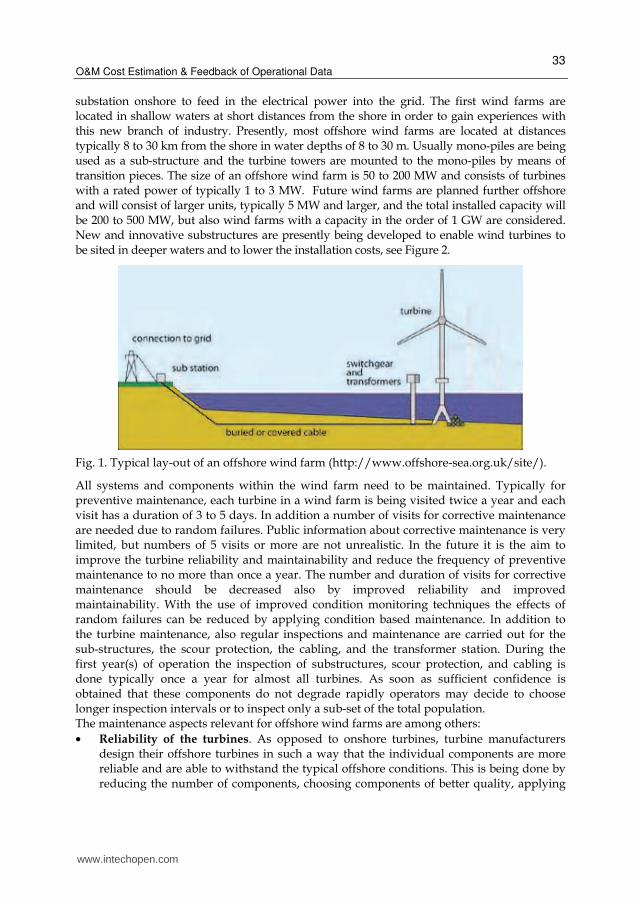
2.1 O&M aspects A typical lay-out of an offshore wind farm is sketched in Figure 1. The wind farms consist of a number of turbines, switch gear and transformers (mostly located within the wind farm) and a
www.intechopen.com
O&M Cost Estimation & Feedback of Operational Data
33
substation onshore to feed in the electrical power into the grid. The first wind farms are located in shallow waters at short distances from the shore in order to gain experiences with this new branch of industry. Presently, most offshore wind farms are located at distances typically 8 to 30 km from the shore in water depths of 8 to 30 m. Usually mono-piles are being used as a sub-structure and the turbine towers are mounted to the mono-piles by means of transition pieces. The size of an offshore wind farm is 50 to 200 MW and consists of turbines with a rated power of typically 1 to 3 MW. Future wind farms are planned further offshore and will consist of larger units, typically 5 MW and larger, and the total installed capacity will be 200 to 500 MW, but also wind farms with a capacity in the order of 1 GW are considered. New and innovative substructures are presently being developed to enable wind turbines to be sited in deeper waters and to lower the installation costs, see Figure 2.
Fig. 1. Typical lay-out of an offshore wind farm (http://www.offshore-sea.org.uk/site/).
All systems and components within the wind farm need to be maintained. Typically for preventive maintenance, each turbine in a wind farm is being visited twice a year and each visit has a duration of 3 to 5 days. In addition a number of visits for corrective maintenance are needed due to random failures. Public information about corrective maintenance is very limited, but numbers of 5 visits or more are not unrealistic. In the future it is the aim to improve the turbine reliability and maintainability and reduce the frequency of preventive maintenance to no more than once a year. The number and duration of visits for corrective maintenance should be decreased also by improved reliability and improved maintainability. With the use of improved condition monitoring techniques the effects of random failures can be reduced by applying condition based maintenance. In addition to the turbine maintenance, also regular inspections and maintenance are carried out for the sub-structures, the scour protection, the cabling, and the transformer station. During the first year(s) of operation the inspection of substructures, scour protection, and cabling is done typically once a year for almost all turbines. As soon as sufficient confidence is obtained that these components do not degrade rapidly operators may decide to choose longer inspection intervals or to inspect only a sub-set of the total population. The maintenance aspects relevant for offshore wind farms are among others:
• Reliability of the turbines. As opposed to onshore turbines, turbine manufacturers design their offshore turbines in such a way that the individual components are more reliable and are able to withstand the typical offshore conditions. This is being done by reducing the number of components, choosing components of better quality, applying
www.intechopen.com

Wind Farm – Technical Regulations, Potential Estimation and Siting Assessment
34
climate control, using automatic lubrication systems for gearboxes and bearings, etc. Often, the turbine control is modified in such a way that not all single failures lead to a stand still. Making better use of the diagnostics and using redundant sensors can assist in this.
Fig. 2. Sub-structures (Roddier).
• Maintainability of the turbines. If offshore turbines fail, maintenance technicians need to access the turbines and carry out maintenance. Especially in case of failures of large components, offshore turbines are being modified to make replacements of large components easy, e.g. by making modular designs, or by building in an internal crane to hoist large components, see for example Figure 3.
Fig. 3. Examples of internal cranes in the Siemens 3.6 (left) and Repower 5M (right) turbines
• Weather conditions. The offshore weather conditions, mainly wind speeds and wave heights, do have a large influence on the O&M procedures of offshore wind farms. However, also fog or tidal flows may influence the accessibility. The maintenance
www.intechopen.com

O&M Cost Estimation & Feedback of Operational Data
35
activities and replacement of large components can only be carried out if the wind speed and wave heights are sufficiently low. Preventive maintenance actions are therefore usually planned in the summer period. If failures occur in the winter season, it does happen that technicians cannot access the turbines for repair actions due to bad weather and this may result in long downtimes and thus revenue losses.
• Transportation and access vessels. For the nowadays offshore wind farms, small boats
like the Windcat, Fob Lady, or SWATH boats are being used to transfer personnel from
the harbour to the turbines. In case of bad weather, also helicopters are being used, see
Figure 4. RIB’s (Rigid Inflatable Boats) are only being used for short distances and
during very good weather situations. The access means as presented in Figure 4 can
also transport small spare parts. For intermediate sized components like a yaw drive,
main bearing, or pitch motor it is often necessary to use a larger vessel for
transportation, e.g. a supply vessel. New access systems are being developed to allow
personnel transfer even under harsh conditions. An example which has been developed
partly within the We@Sea program is the Ampelmann (www.ampelmann.nl).
Fig. 4. Examples of transportation and access equipment for maintenance technicians; clockwise: Windcat workboat, Fob Lady, helicopter, and SWATH boat
• Crane ships and Jack-up barges. For replacing large components like the rotor blades, the hub, and the nacelle and in some cases also for components like the gearbox and the generator, it is necessary to hire large crane ships, see Figure 5.
www.intechopen.com

Wind Farm – Technical Regulations, Potential Estimation and Siting Assessment
36
Fig. 5. Examples of external cranes for replacement of large components; Jack-up barge ODIN (left) and crane ship
• Vessel and personnel on site all the time. When going further offshore the time to
travel from the harbour to the wind farm will increase, so that the technicians will have
only limited production time, may be less than 5 hours. Advantage of having a vessel
and personnel on-site all the time is that technicians are able to work a full day. For
corrective maintenance this will imply that the total downtime can be reduced while for
preventive maintenance less technicians are required. Figure 6 shows an impression of
the Sea energy’s Ulstein X-bow, which can take 24-36 technicians.
2.2 Types of maintenance When looking at a general level, maintenance can be subdivided in preventive and
corrective maintenance. Corrective maintenance is necessary to repair or replace a
component or system that does not fulfil its designed purpose anymore. Preventive
maintenance is performed in order to prevent a component or system from not fulfilling its
designed purpose. Both preventive and corrective maintenance can be split up further and
depending on the type of application different levels of detail are used. In the CONMOW
project (Wiggelinkhuizen, 2007, 2008) it is shown that when considering wind turbine
technology the following categories seem appropriate, see also Figure 7.
• Preventive maintenance;
• Calendar based maintenance, based on fixed time intervals, or a fixed number of
operating hours;
• Condition based maintenance, based on the actual health of the system;
• Corrective maintenance;
• Planned maintenance, based on the observed degradation of a system or
component (a component is expected to fail in due time and should be maintained
before the actual failure does occur);
• Unplanned maintenance, necessary after an unexpected failure of a system or
component.
www.intechopen.com

O&M Cost Estimation & Feedback of Operational Data
37
Fig. 6. Impression of Sea energy’s Ulstein X-bow (http://social.windenergyupdate.com/qa/sea-energy-takes-offshore-wind-om-another-level).
Both condition based preventive maintenance and planned corrective maintenance are initiated based on the observed status or degradation of a system. The main difference between these two categories is that condition based preventive maintenance is foreseen in the design, but it is not known in advance when the maintenance has to be carried out, while the occurrence of planned corrective maintenance is not foreseen at all. This is illustrated by the examples below.
Example condition based preventive maintenance
The oil filter has to be replaced several times during the lifetime of the turbine. To avoid calendar based maintenance the oil filter is monitored and the replacement will be done depending on the pollution of the filter. So it is not the question if this maintenance has to be carried out, but when it has to be done.
Example planned corrective maintenance
During the lifetime of the turbine it appears that the pitch motors show unexpected wear out and have to be revised in due time to avoid complete failure. Until this revision, if carried out in due time, the pitch system is expected to function properly. On contrary to the example above this type maintenance was initially not foreseen, but as it is not necessary to shut down the turbine, the maintenance can be planned such that it can be carried out at suitable moment.
www.intechopen.com

Wind Farm – Technical Regulations, Potential Estimation and Siting Assessment
38
Fig. 7. Schematic overview of the different types of maintenance (Wiggelinkhuizen, 2008).
Considering the limited differences between condition based preventive maintenance and
planned corrective maintenance, the planning and execution of both categories will
probably be similar in practice. Hence, only three types of maintenance have to be
considered:
• Unplanned corrective maintenance
• Condition based maintenance
• Calendar based maintenance
For offshore wind energy, condition based maintenance is preferred above unplanned
corrective maintenance since it can be planned on time. Spare parts, crew and equipment
can be arranged on time and the turbine can continue running during bad weather
conditions. Consequently, revenue losses can be limited.
2.3 Cost estimation Generally, the costs for maintaining an offshore wind farm will be determined by both
corrective and preventive maintenance. In Figure 8, the different cost components are
schematically drawn. The O&M costs consist of preventive maintenance costs which are
usually determined by one or two visits per year. After 3 or 4 years the preventive
maintenance costs can be somewhat higher due to e.g. oil changes in gearboxes. On top of
that there are corrective maintenance costs which are more difficult to predict. At the
beginning of the wind farm operation the corrective maintenance costs can be somewhat
higher than expected due to teething troubles. Finally, it might be that major overhauls (e.g.
replacement of gearboxes or pitch drives) are foreseen once or twice per turbine lifetime.
For many technical systems three phases can be identified over the lifetime and this is also
schematically drawn in Figure 8.
www.intechopen.com

O&M Cost Estimation & Feedback of Operational Data
39
Fig. 8. Schematic overview of the maintenance effort over the lifetime of a turbine. In reality, none of the lines is constant; the actual maintenance effort will vary from year to year.
Phase 1: During the commissioning period, the burn-in problems usually require additional
maintenance effort (and thus cost). Time should be spent on finding the right
settings of software, changing minor production errors, etc. During this period the
maintenance effort usually decreases with time.
The turbine manufacturer usually provides a contract to the customer with a fixed
price for the first five years of operation. The contract includes commissioning,
preventive and corrective maintenance, warranties and machine damage.
Phase 2: During this phase random failures might be expected, and the failure rate is more
or less constant over this period. However in reality the actual maintenance effort
will vary from year to year and will fluctuate around the long-tem average value,
which is displayed in Figure 8 by the red line.
After say about 10 years of operation, it is very likely that some of the main systems
of the turbines should be revised, e.g. pitch motors, hydraulic pumps, lubrication
systems, etc. With the offshore turbines, no experience is available up to now on
how often a major overhaul should be carried out. The exact point in time at which
the overhaul(s) should take place is presently not known, perhaps after 7 years, 15
years, or not at all. The major overhaul in fact is to be considered as “condition
based maintenance”.
Phase 3: At the end of the lifetime it is likely that more corrective maintenance is required
than in the beginning of the lifetime. It is presently unclear how much more this
will be.
Figure 8 schematically shows the variation in O&M effort over the years that should be
considered to assess the expected costs and downtime. If one is interested in the average
O&M costs over the lifetime the yearly variation is not of importance and the annual costs
can be determined based on long term average values of failure rate costs, etc. This
Lifetime
Maintenance Effort
Major overhaul
Corrective maintenance
Preventive maintenance
Phase 1 Phase 2 Phase 3
Long term average (planning phase)
www.intechopen.com

Wind Farm – Technical Regulations, Potential Estimation and Siting Assessment
40
approach is used in the O&M Tool and is especially suitable in the planning phase of new
project.
It is clear from Figure 8 that the costs in a certain year may deviate significantly from the
long term average value. Due the randomness of the occurrences of failures it may occur
that in one year the number of failures is much higher than average and in another year
much less. In case the number of failures is higher than average it may occur that the
downtime per failure is higher than average due to the unavailability of ships or spares. On
the other hand if the number of failures is less than average the cost of equipment per failure
may be higher, because of overcapacity. In both situations it is assumed that the number of
ships is allocated based on the average failure rate. So if one is interested not only in the
average value of the cost but also in expected variation, the cost estimation should be based
on the actual occurrences of failures, which can be modelled by means of a Poisson process
(Vose) this implies that the cost estimation should be done based on time simulation taking
into account operational data, which has been applied in de OMCE-calculator.
3. OMCE project
In this section information is provided on the OMCE project, where the background and
objectives are listed, a description of the OMCE model is given and the position of the
OMCE within an integral wind farm monitoring system us discussed.
3.1 Background and objectives As part of the Bsik programme ‘Large-scale Wind Power Generation Offshore’ of the
consortium We@Sea (www.we-at-sea.org) ECN initiated the idea of developing the
Operation & Maintenance Cost Estimator as a tool that could be used by operators of large
offshore wind farms to monitor the O&M effort for wind farms in operation already and to
control the costs of these wind farms for the coming period of e.g. 1,2 or 5 years. To be able
to control and subsequently to optimise the future O&M costs of these wind farms, it is
necessary to accurately estimate the O&M costs for the next coming period, taking into
account the operational experiences available at that moment. Several reasons are present
for making accurate cost estimates of O&M of (offshore) wind farms. Examples are:
• to make reservations for future O&M costs (this is especially important for the party who is responsible for the financial management of the maintenance);
• operating experiences may give indications that changing the O&M strategy will be profitable, and then the costs need to be determined accurately in order to compare the adjusted strategy with the original one;
• before the expiration of the warrantee period, a wind farm owner needs to decide how to continue with servicing the wind turbines (new contract with turbine supplier or to take over the total responsibility) after the warranty period;
• if a wind farm is going to be sold to another investor, the new owner wants to have detailed information on what O&M costs he can expect in the future.
It may be clear that such a tool with these features is not of interest for operators only, but
also for other stakeholders (owners of wind farm, wind turbine manufacturers, etc.).
The above mentioned initiative of ECN resulted in the OMCE-project with the main
objective to develop methods and tools that can be used to estimate the future O&M effort
and associated costs for the coming period of f.i. 1, 2 or 5 years, taking into account the
www.intechopen.com

O&M Cost Estimation & Feedback of Operational Data
41
operational experiences of the wind farm acquired during the operation of the wind farm so
far. The objective is to determine not only the expected values for characteristic O&M
parameters, but also to quantify the effect of uncertainties due to the random occurrence of
failures, due to variability of the weather conditions, and the due to the uncertainty in the
operational data. The O&M Cost estimator is developed in such a way that cost estimates
can be made at any point in time during the operational phase. However, it is a prerequisite
that at least 2 to 3 years of operational data are available.
The development of the specifications for the OMCE was carried out within the Bsik
programme ‘Large-scale Wind Power Generation Offshore’ of the consortium We@Sea. At
the moment that the We@Sea project finished in 2009, the D OWES (Dutch Offshore Wind
Energy Services) project (DOWES, Leersum) was started, and within this project the
development of the event list and the programming of the OMCE-Calculator is carried out.
3.2 Description of the OMCE model 3.2.1 Overall structure The OMCE is designed to determine the O&M effort and associated costs for the coming period (say the next 1, 2 or 5 years) taking into account the operational experience available at that moment. That’s why two major modules can be distinguished in the overall structure of the OMCE as depicted in Figure 9. 1. The OMCE Building Blocks
To process operational data four so called OMCE Building Blocks (BB) have been specified, each covering a specific data set. - BB Operation and Maintenance; - BB Logistics; - BB Loads and Lifetime; - BB Health Monitoring; The main objective of these building blocks is to process all available data in such a way that useful information is obtained, which on the one hand can be used for monitoring purposes and which on the other hand can be used to specify the input for OMCE calculator. If convenient other types of building blocks can be included.
2. The OMCE-Calculator The main objective is to determine the expected O&M effort and associated costs for the coming period, where amongst others all relevant information provided by the OMCE Building Blocks is taken into account. Three types of maintenance are included, viz. calendar based maintenance, condition based maintenance and unplanned corrective maintenance.
3.2.2 Event list Originally it was assumed that the different data sources would provide enough
information to execute the different BB’s. However, from previous studies it was concluded
that especially the O&M data and the logistics data were not available in a format suitable
for straightforward further processing. The main reasons for this are:
• During the first few years of operation, operators are not in charge of the maintenance. Although they do receive copies of worksheets, SCADA data, and information on the use of equipment and spare parts, it is in most cases not traceable why certain activities are carried out and how some activities are linked to e.g. alarms or other activities.
www.intechopen.com

Wind Farm – Technical Regulations, Potential Estimation and Siting Assessment
42
Fig. 9. OMCE concept including the process of structuring the raw data into an event list
• Since the operators are not in charge of the maintenance, there is not really a need to analyse the O&M data in large detail and to determine the cost drivers. In most cases long term contracts are signed with a service provider (usually the turbine supplier). The operator is not forced to analyse the data and thus to set up a structured format for data collection.
• The data are stored in different sources and in different formats, sometimes even handwritten. This makes it difficult to automate the processing, especially because the different data sources are generally not well correlated.
It was concluded that the acquisition of raw data generated by an offshore wind farm
should be structured such that the data stored in various data sources are correlated
uniquely. Based on the workflow controlled by the maintenance manager of a wind farm, a
possible method is outlined for O&M related data. According to this method all O&M
related data stored in the different data sources are correlated be means of the “initiating
event” for a certain maintenance activity. In case data are collected in such a structured
manner it should be possible to extract the so called “event list” from these data sources. Per
turbine the event list contains an overview of the different maintenance events that have
occurred in chronological order. Per event, relevant issues like the failed component, the
trigger for a repair action, the equipment and labour used need to be stored. The event list is
meant to structure and classify the raw data in such a way that it can be processed by the
OMCE BB’s “Operation and Maintenance” and “Logistics”. For further development of the
OMCE it is assumed that raw data can be imported in a relational database and that the
event list can be extracted from this database.
3.2.3 Interface between building blocks and calculator As shown in Figure 9 the OMCE consists of 4 building blocks to process a specific data set each. The objective of processing the operational data is in fact twofold:
BB Operation & Maintenance
BB Loads&Lifetime
BB Health Monitoring
BB Logistics
BB
Operation & Maintenance
BB LogisticsRaw DATA
- SCADA - Vessel transfers - Maintenance sheets - Monthly reports - Weather reports - CM data - Production figures - Spare parts - Etc.
Structured DATA
- Event list
INFO
INFO-Failure rate
-Repair strategy
-Time to failure
(Repair strategy )
Annual
O&M Costs OMCE Calculator
Condition Based
Maintenance
Unplanned Corrective
Maintenance
Calendar Based
Maintenance
OMCE Calculator
Condition Based
Maintenance
Unplanned Corrective
Maintenance
Calendar Based
Maintenance
Area where specifications for the event list apply to
Area where specifications for the event list are applicable
www.intechopen.com

O&M Cost Estimation & Feedback of Operational Data
43
1. To provide information to determine or to update the input values needed for the calculation of the expected O&M effort.
2. To provide information that gives insight in the health of the wind turbines, for example by means of trend analyses.
In this report special attention will be given to the first objective in order to specify in more detail what kind of output is expected from the different building blocks in order to generate input for the OMCE-Calculator. It is not expected that the input needed for the calculations can be generated automatically in all cases. The opposite might be true, namely that experts are needed to make the correct interpretations. It is important to realise that there is a difference between the output of the different Building Blocks and the input needed for the OMCE-Calculator. The input needed for the OMCE-Calculator should represent the expected values for the coming period. The various BB’s describe the historical situation. If the future situation is similar to the historic situation, the information of the BB’s can be used to generate input data for the OMCE-Calculator. If the new situation has changed, the information of the BB’s should be used with care or maybe not used at all. Examples of changes are given below.
• The BB’s “Operation & Maintenance”, “Health Monitoring”, and “Loads & Lifetime” generate data (failure rates and expected times to failure) at the level of main systems, components or even (and most preferred) at the level of failure modes. If for instance certain components have been replaced (or will be replaced soon) in all turbines (e.g. by components from different suppliers), the data determined by the various BB’s do not necessarily represent the new situation. In the case of failure rates, new estimates need to be made for these components, e.g. by using data from generic databases, or by means of engineering judgement.
• Costs of personnel, equipment, spares, etc are very important input for the OMCE-Calculator to determine the (near) future O&M costs. Most of the cost items are very dependent on the type of contract between operator and e.g. component supplier or maintenance contractor. Such contracts, and thus the prices of spare parts or for renting equipment will change over time. The input for the OMCE should represent the contracts for the next coming period. Analysing the historical costs to generate input data only makes sense if the new situation with new contracts is similar to the historical situation.
So in general it can be said that it is not always necessary to extract all input data from historical data. It is important that the new cost estimates are based on values that represent the future developments best. This means that not all output of the BB’s can and will be used as input data for the OMCE-Calculator. The BB’s can be used later on to assess if the new situation indeed is an improvement as compared to the historical situation. E.g. the BB “Operation & Maintenance” can be used to verify if the failure rate of a new component indeed is less than the failure rate of the original component. Furthermore it is important to realise that the BB’s “Operation & Maintenance”, “Health Monitoring”, and “Loads & Lifetime” generate data at the level of components or even at the level of failure modes whereas the OMCE-Calculator requires input data at the level of Fault Type Classes (FTC’s).
3.3 Integral monitoring and control system Although the OMCE is being developed as a standalone system it is expected that in the future the OMCE will become part of integral information and decision support systems, f.i.
www.intechopen.com

Wind Farm – Technical Regulations, Potential Estimation and Siting Assessment
44
an IT-system as being developed by Dutch Offshore Wind Energy Services DOWES (Leersum). DOWES is a 4 year research project, which started in May 2009, and will stretch until the end of 2013 and does focus on the development of an integral monitoring and control system. The integration of the DOWES systems is twofold. On one hand the development focuses on the raw data. The envisioned system is a platform which supports and enables the monitoring and control functionalities of (offshore) wind turbines, regardless of the type, manufacturer or capacity of the turbine. On the other hand the development is focused on the integration of data and information obtained and provided by parties in the value chain. This requires current insights and inclusion of detailed processes and information down to the individual users whereas information and decision support on strategic level requires overviews and extensive prognoses on the mid- and long-term. The position of the OMCE BB’s and the OMCE-Calculator within the DOWES portal is schematically depicted in Figure 10. The BB’s will be integrated within the IT-system. However, the calculator is positioned as an add-in to the system. The input for the OMCE-Calculator is provided by the system and the results obtained with the OMCE-Calculator are stored in the integral system. In this way both the results of the BB’s and the results generated by the calculator can be made available for long-term decision support. For instance when optimization of the O&M strategy has to be considered, several scenarios can be analysed by means of the calculator using data originating from the BB’s and other data sources available. After the results of these analyses are stored in the system they can be approached by the user in connection with all kind of other data to decide upon possible improvements in the O&M strategy. In case the OMCE has to be integrated in a client specific information and decision support system a system similar to Figure 10 can be set up such that the client specific requirements are fulfilled.
Fig. 10. Structure of the D OWES system for optimising O&M of offshore wind farms in the long and short term making use of wind farm data. The green rectangle represents the portal from which all data sources and models can be approached. The orange oval represents the OMCE-Calculator, which uses the data processed by the OMCE BB’s as input.
www.intechopen.com

O&M Cost Estimation & Feedback of Operational Data
45
4. OMCE-Calculator
In this section the functionality and capabilities of the OMCE-Calculator will be discussed in some more detail. In the following sections firstly the starting points for the development of the OMCE-Calculator as presented after which a number of examples are discussed which indicate the functionality of the developed software demo of the OMCE-Calculator.
4.1 Starting points The main objective of the OMCE-Calculator is to assess the total O&M effort and the associated costs and downtime for the coming period of 1 to 5 years, where all aspects affecting O&M should be considered. Starting point for the OMCE-Calculator are all three types of maintenance described in section 2.2, where at least the following aspects should be included:
• Random occurrence of failures. • The number of failures in a certain year is a stochastic quantity. • Failures in different wind turbines may coincide or may happen close together. On the
one hand repairs can probably be clustered (f.i. crane ship is mobilised only once to visit a number of turbines) , or on the other hand some repairs need to be postponed due to unavailability of equipment or spares.
• Flexibility w.r.t. maintenance strategies, because different types of failures may require completely different approach.
• For some repairs a sequence of maintenance phases are required. F.i. after a failure of a main component first two inspections have to be made and next the component has to be replaced using a crane ship. After the replacement another inspection has to made before commissioning can be started. So in total 5 different phases have to be distinguished.
• Some phases have to be completed during one continuous operation, while other phases can be carried out during a number of non successive days. For both situations it should be optional to work in a number of shifts.
• Interaction between three types of maintenance. • Availability of equipment may vary with time (more equipment is allocated during
summer for preventive maintenance, of during certain period in which condition based maintenance is planned).
• Determination of waiting time due to bad weather and calculation of revenue losses should be based on representative weather data. In this way the effect of the inherent variability in weather data on waiting time can be quantified. Furthermore, a realistic estimate of the revenue losses can be made by taking into account the effect of relatively high wind speeds during the waiting period, and relatively low wind speeds during the actual repair.
• Logistic aspects of offshore equipment and spares should be treated such that results can be used for optimisation purposes. Stock control should be optional.
• Uncertainty in input parameters (cost, logistic etc.) may be time dependent, f.i. when considering a period of three years, the uncertainty in year three probably is higher than in year one).
• Reliability of wind turbines may be dependent on the location within the wind farm, f.i. the failure behaviour of a wind turbine always operating in the wake may differ from a wind turbine located at the edge of the wind farm, where this difference generally will not be the same for all components.
www.intechopen.com

Wind Farm – Technical Regulations, Potential Estimation and Siting Assessment
46
Considering these requirements it is clear that when analysing future O&M one has to deal amongst others with the random occurrence of failures, the stochastic nature of the weather conditions and furthermore a number of input variables are not known accurately but show some uncertainty. Because the OMCE-Calculator is meant to make estimations for a relatively short period (1 to 5 years) and because the random occurrence of failures in combination with the actual weather conditions has to be taken into account, it may be obvious to develop a time based simulation model and to quantify the uncertainties by carrying out a (large) number of simulations. To model the simulation process an integral maintenance plan will be elaborated as a function of time, taking into account the interaction between the different maintenance types, the simultaneous maintenance actions on different wind turbines, and the availability of resources.
4.2 Examples To illustrate the capabilities of the OMCE-Calculator software a number of examples are presented. These examples are not representative for an entire wind farm, but are specifically defined to show how the OMCE-Calculator output can be used to optimise O&M on an operational wind farm. This paragraph will focus on the following 3 examples: 1. Consider limitations in stock control of spare parts for unplanned corrective
maintenance and use this information to optimise the number of components on stock with respect to downtime of the turbines in the wind farm.
2. Consider limitations in vessels available for unplanned corrective maintenance and determine the optimal number of vessels to buy or hire with respect to total O&M costs of the wind farm.
3. Perform condition based maintenance in the wind farm with different amounts of dedicated equipment and show the advantage of having multiple vessels with respect to the maintenance planning period.
4.2.1 Stock size optimisation To illustrate how the limitations in the number of spare parts available influence the downtime of the turbines in the wind farm, a simplified example is analysed. The objective of this example is to investigate the relation between the number of spare parts in stock, the total downtime, and to determine the optimal stock size. This example has the following significant inputs: • 12 wind turbines • Failure rate per turbine = 2/year • Historical wind en wave data at the ‘Munitiestortplaats IJmuiden’ is used to determine
site accessibility and revenues • A work day has a length of 10 hours and starts at 6:00 am. • 1 system with 1 fault type class for unplanned corrective maintenance, 1 corresponding
repair class and 1 corresponding spare part • The repair class will contain a maintenance event with 1 mission phase (repair) which
can be split up in time. • The reordering time of the spare part is set at 720 h (approximately 1 month), which is
much higher than the logistic time to transport the spare part from the warehouse to the harbour at 2 h.
• The simulation will be run for a simulation period of 1 year with a start-up period of 1 year. The number of simulations performed is set at 100 to obtain statistically significant results with respect to the downtime.
www.intechopen.com

O&M Cost Estimation & Feedback of Operational Data
47
If the failure distribution were to be uniform in time, then logically the number of failures will require 2 spare parts per month. With a reordering time of 1 month, a stock size of 2 spares would be sufficient. However, the failure distribution is a Poisson distribution. Now by varying the stock size from 1 to 12 the relation between the stock size and the total downtime of turbines in the wind farm can be set-up. A stock size of 0 spare parts is simulated by disabling stock control and increasing the logistic time to 722 h, while similarly an infinite stock size is simulated by simply disabling stock control and setting only the logistic time at 2 h. The simulation results are depicted in Figure 11.
0
2000
4000
6000
8000
10000
12000
14000
16000
18000
20000
0 2 4 6 8 10 12
Do
wn
tim
e y
-1[h
]
Stock size [-]
Optimisation stock size wrt downtime
Avg. + St.Dev.
Avg. - St.Dev.
Average
No control Tlog = 722 h
No control Tlog = 2 h
Fig. 11. Results of stock size variation vs. total downtime of wind turbines
In the graph it can now be seen that for this example when 6 or more spares are kept in stock, both the average downtime and the standard deviation in the results seem to converge to the static value obtained without stock control (the data points for ‘no control Tlog = 2 h’). The remainder of the downtime at this point is a combination of remaining logistic downtime, waiting time for a suitable weather window and repair time (the applied vessel for maintenance does not have mobilisation time. Based on these observations the advantages of having spare parts (with high reordering time) in stock for components which fail frequently become very clear and can be quantified with the output of the OMCE-Calculator.
4.2.2 Equipment optimisation To illustrate how the limitations in the number of vessels available for unplanned corrective maintenance influence the downtime of the turbines in the wind farm, a second simplified example is programmed in the OMCE-Calculator. Now the objective of this second example is to investigate the relation between the number of vessels available and the total downtime. This example has the following significant inputs:
www.intechopen.com

Wind Farm – Technical Regulations, Potential Estimation and Siting Assessment
48
• 50 wind turbines
• Failure rate per turbine = 5/year
• Historical wind en wave data at the ‘Munitiestortplaats IJmuiden’ is used to determine
site accessibility and revenues
• A work day has a length of 10 hours and starts at 6:00 am.
• 1 system with 1 fault type class for unplanned corrective maintenance, 1 corresponding
repair class and 1 corresponding spare part
• The repair class will contain a maintenance event with 1 mission phase ‘Repair’, where
6 hours of work with 2 technicians are required.
• The vessel used for the repair will be of the ‘support vessel’ type, which can only apply
maintenance on a single wind turbine with a single crew when it travels to and from the
wind farm. The travelling time of this equipment is set at 1 hour. The mobilisation time
of this vessel will be set at 0 hours. In addition to hourly cost and fuel surcharges, fixed
yearly cost of 250 k€ are assigned to each vessel.
• The simulation will be run for a simulation period of 1 year with a start-up period of 1
year. The number of simulations performed is set at 100 to obtain statistically significant
results with respect to downtime and energy production.
The input details for the equipment defined are also shown in Table 1. Project: Equipment 1
Equipment no. Type Name
1 Support vessel Support 1 Unplanned corrective Condition based Calendar based
Logistics & availability Unit Input Weather limits Unit Input Cost Unit Input Input Input
Mobilisation time h 0 Wave height Travel m 2 Work Euro/h 300 300 0
Demobilisation time h 0 Transfer m 2 Euro/day 0 0 0
Travel time h 1 Positioning m 2 Euro/mission 0 0 0
Max. technicians - 6 Hoisting m 2 Wait Euro/h 0 0 0
Transfer category - single crew Wind speed Travel m/s 12 Euro/day 0 0 0
Travel category - daily Transfer m/s 12 Euro/mission 0 0 0
Vessels available corrective - 1 Positioning m/s 12 Fuel surcharge per trip Euro/trip 300 300 0
Vessels reserved condition - 0 Hoisting m/s 12 Mob/Demob Euro/mission 0 30000 0
Vessels reserved calendar - 0 Fixed yearly Euro/day 250000 0 0
Table 1. Reflection of equipment input optimisation project (1 equipment available)
Although the example objective is similar to the example as discussed in section 0, the
results are assumed to be different. The example inputs are set such that the average amount
of failures will approximate to 250 per simulation. If these 250 failures were to occur
independently on days where the defined support vessels’ weather limits are sufficient to
carry out all of the work, it would theoretically be possible to service the entire wind farm
with 1 vessel. However, the failures follow the Poisson distribution and the weather limits
set for this vessel are relatively strict with respect to the measured wave heights and wind
velocities. This is expected to lead to a large increase in resource-related downtime if only 1
vessel were to be available to perform maintenance.
Now, by varying the number of available support vessels from 1 to 6, the relation between
the number of vessels available and the total downtime of wind turbines can be set-up. The
simulation results are depicted in Figure 12. We see that if only one vessel is available, than
the average total downtime is more than doubled compared to the case when there are 2
vessels available. From 4 vessels onward, the decrease in downtime due to a lack of
resources becomes smaller.
www.intechopen.com

O&M Cost Estimation & Feedback of Operational Data
49
0
5000
10000
15000
20000
25000
30000
35000
40000
45000
0 1 2 3 4 5 6 7
Do
wn
tim
e y
-1[h
]
No. of vessels [-]
Optimisation no. of vessels wrt downtime
Avg. + St.Dev.
Avg. - St.Dev.
Average
Fig. 12. Results of variation of no. of available vessels vs. total downtime of wind turbines
Although the number of available vessels with respect to downtime should be as high as possible to prevent revenue losses due to a lack of resources, additional vessels will require additional O&M investments. The optimum number of vessels available for a wind farm should be related to the increase in repair costs and the decrease in revenue losses. The number of available vessels with respect to repair costs and revenue losses is now plotted in Figure 13.
0
1000
2000
3000
4000
5000
6000
7000
0 1 2 3 4 5 6 7
Co
sts
(av
era
ge
) [
€]
Th
ou
san
ds
No. of vessels [-]
Optimisation no. of vessels wrt O&M costs
Sum repair cost & revenue losses
Total repair costs
Revenue losses
Fig. 13. Sum of total O&M cost and revenue losses as a function of no. of available vessels
www.intechopen.com

Wind Farm – Technical Regulations, Potential Estimation and Siting Assessment
50
In Figure 13 the trend of the revenue losses versus the number of available vessels is decreasing, which naturally resembles the trend in downtime of wind turbines in the wind farm. At the same time, the total repair cost is increasing almost linearly with respect to the number of vessels. To plot the total O&M cost, both the repair cost and the revenue losses are super-positioned leading to the blue line in the graph. Based on the sum of these repair cost and revenue losses, the optimum number of vessels for the proposed example is seen to be 3 support vessels, since the effect of having more than 3 vessels on the overall downtime (and thus revenue losses) is negligible and the cost of having those vessels available increases. Based on the above observations we can conclude that with the output of the OMCE-Calculator demo it is possible to quantify the effect on downtime & costs and to optimise the number of vessels available to perform corrective maintenance.
4.2.3 Implementing condition based maintenance One of the additional features of the OMCE-Calculator is the ability to model condition based maintenance. One of the main modelling assumptions is that the maintenance events can be planned in advance and the turbines will only be shut down during the actual repairs made. A period can be specified during which equipment is available for condition based maintenance. In case the work cannot be completed within this period, e.g. due to bad weather conditions or shortage of equipment a message will be given by the program (N.B. the number of repairs will be constant for each simulation, the random year chosen in the weather data will not). It can then be considered to allocate more equipment or to lengthen the period. The current example will demonstrate the modelling of condition based maintenance in relation to the defined maintenance period and the number of equipment available. The objective is to model the same maintenance with 1 vessel available per equipment type and 2 vessels available per equipment type, after which the results can be compared with respect to the planned maintenance period and equipment cost. This example has the following significant inputs: • 50 wind turbines • Number of repairs to be made (no. of turbines) = 10 • Historical wind en wave data at the ‘Munitiestortplaats IJmuiden’ is used to determine
site accessibility and revenues • A work day has a length of 10 hours and starts at 6:00 am. • 1 system with 1 fault type class for condition based maintenance and 1 corresponding
spare control strategy • The repair class will contain a maintenance event with the phase ‘Replacement’, where
in total 16 hours of work with 4 technicians are required.
• The type of vessels used for the replacement are: ‘Access vessel’ and ‘Vessel for replacement’. The travelling time of the access vessel is set at 1 hour, while the travelling time of the vessel for replacement is set at 4 hours. The vessel for replacement is assumed to have an overnight stay in the wind farm. Apart from the hourly cost and fuel surcharges, a mob/demob cost is added to both vessels.
• The maintenance period window is set from 1st of July up to and including the 31st of July.
• The simulation will be run for a simulation period of 1 year with a start-up period of 1 year. The number of simulations performed is set at 100 to obtain statistically significant results with respect to downtime and energy production.
www.intechopen.com
O&M Cost Estimation & Feedback of Operational Data
51
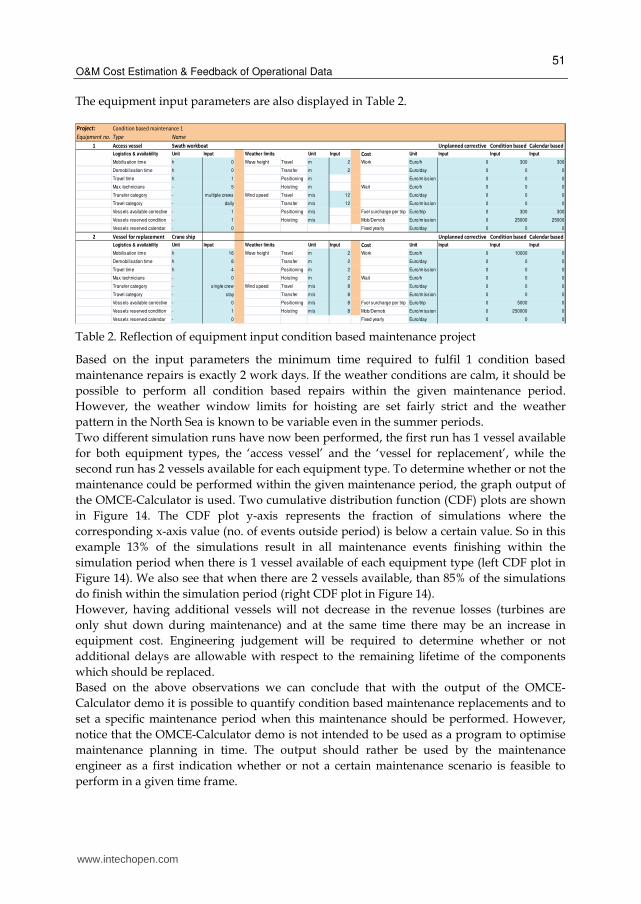
The equipment input parameters are also displayed in Table 2. Project: Condition based maintenance 1
Equipment no. Type Name
1 Access vessel Swath workboat Unplanned corrective Condition based Calendar based
Logistics & availability Unit Input Weather limits Unit Input Cost Unit Input Input Input
Mobilisation time h 0 Wave height Travel m 2 Work Euro/h 0 300 300
Demobilisation time h 0 Transfer m 2 Euro/day 0 0 0
Travel time h 1 Positioning m Euro/mission 0 0 0
Max. technicians - 5 Hoisting m Wait Euro/h 0 0 0
Transfer category - multiple crews Wind speed Travel m/s 12 Euro/day 0 0 0
Travel category - daily Transfer m/s 12 Euro/mission 0 0 0
Vessels available corrective - 1 Positioning m/s Fuel surcharge per trip Euro/trip 0 300 300
Vessels reserved condition - 1 Hoisting m/s Mob/Demob Euro/mission 0 25000 25000
Vessels reserved calendar - 0 Fixed yearly Euro/day 0 0 0
2 Vessel for replacement Crane ship Unplanned corrective Condition based Calendar based
Logistics & availability Unit Input Weather limits Unit Input Cost Unit Input Input Input
Mobilisation time h 16 Wave height Travel m 2 Work Euro/h 0 10000 0
Demobilisation time h 8 Transfer m 2 Euro/day 0 0 0
Travel time h 4 Positioning m 2 Euro/mission 0 0 0
Max. technicians - 0 Hoisting m 2 Wait Euro/h 0 0 0
Transfer category - single crew Wind speed Travel m/s 8 Euro/day 0 0 0
Travel category - stay Transfer m/s 8 Euro/mission 0 0 0
Vessels available corrective - 0 Positioning m/s 8 Fuel surcharge per trip Euro/trip 0 5000 0
Vessels reserved condition - 1 Hoisting m/s 8 Mob/Demob Euro/mission 0 250000 0
Vessels reserved calendar - 0 Fixed yearly Euro/day 0 0 0
Table 2. Reflection of equipment input condition based maintenance project
Based on the input parameters the minimum time required to fulfil 1 condition based
maintenance repairs is exactly 2 work days. If the weather conditions are calm, it should be
possible to perform all condition based repairs within the given maintenance period.
However, the weather window limits for hoisting are set fairly strict and the weather
pattern in the North Sea is known to be variable even in the summer periods.
Two different simulation runs have now been performed, the first run has 1 vessel available
for both equipment types, the ‘access vessel’ and the ‘vessel for replacement’, while the
second run has 2 vessels available for each equipment type. To determine whether or not the
maintenance could be performed within the given maintenance period, the graph output of
the OMCE-Calculator is used. Two cumulative distribution function (CDF) plots are shown
in Figure 14. The CDF plot y-axis represents the fraction of simulations where the
corresponding x-axis value (no. of events outside period) is below a certain value. So in this
example 13% of the simulations result in all maintenance events finishing within the
simulation period when there is 1 vessel available of each equipment type (left CDF plot in
Figure 14). We also see that when there are 2 vessels available, than 85% of the simulations
do finish within the simulation period (right CDF plot in Figure 14).
However, having additional vessels will not decrease in the revenue losses (turbines are
only shut down during maintenance) and at the same time there may be an increase in
equipment cost. Engineering judgement will be required to determine whether or not
additional delays are allowable with respect to the remaining lifetime of the components
which should be replaced.
Based on the above observations we can conclude that with the output of the OMCE-
Calculator demo it is possible to quantify condition based maintenance replacements and to
set a specific maintenance period when this maintenance should be performed. However,
notice that the OMCE-Calculator demo is not intended to be used as a program to optimise
maintenance planning in time. The output should rather be used by the maintenance
engineer as a first indication whether or not a certain maintenance scenario is feasible to
perform in a given time frame.
www.intechopen.com

Wind Farm – Technical Regulations, Potential Estimation and Siting Assessment
52
Fig. 14. CDF plot of number of maintenance events performed outside required maintenance period; Simulations with 1 vessel available (left) and simulations with 2 vessels available (right)
5. OMCE-Building blocks
As was shown in Figure 9 the OMCE consist of four Building Blocks (BB) to process each a specific data set. Furthermore, it was also mentioned that the Building Blocks in fact have a two-fold purpose: 1. To provide information to determine or to update the input values needed for the
calculation of the expected O&M effort with the OMCE-Calculator. 2. To provide more general information on the wind farm performance and ‘health’ of the
wind turbines. The Building Blocks ‘Operation & Maintenance and ‘Logistics’ have the main goal of characterisation and providing general insight in the corrective maintenance effort that can be expected for the coming years. With respect to corrective maintenance important aspects are the failure frequencies of the wind turbine main systems, components and failure
www.intechopen.com

O&M Cost Estimation & Feedback of Operational Data
53
modes. Furthermore, other parameters that are needed to describe the corrective maintenance effort are for instance the length of repair missions, delivery times of spare parts and mobilisation times of equipment. As mentioned already in section 3.1.2 the format used by most wind farm operators for
storage of data is not suitable for automated data processing by these Building Blocks.
Usually, operators collect the data as different sources. In order to enable meaningful
analyses with both Building Blocks ‘Operation & Maintenance’ and ‘Logistics’ these
different sources need to be combined into a structured format. For this purpose an Event
List format has been developed, in which the various ‘raw’ data sources are combined and
structured (see also Figure 9).
For estimating the expected future condition based maintenance work load the Building
Blocks ‘Loads & Lifetime’ and ‘Health Monitoring’ have been developed. The main goal of
these Building Blocks is to obtain insight in the condition or, even better, remaining lifetime
of the main wind turbine systems or components.
The expected preventive (or calendar based) maintenance work load is not something that
will be estimated using the OMCE Building Blocks since this effort is generally well-known
and specified by the wind turbine manufacturer.
In this report special attention will be given to the first objective in order to specify in more
detail what kind of output is expected from the different Building Blocks in order to
generate input for the OMCE-Calculator. It is not expected that the input needed for the
calculations can be generated automatically in all cases. The opposite might be true, namely
that experts are needed to make the correct interpretations. Furthermore it is also essential
to keep in mind that the output of the Building Blocks (based on the analysis of ‘historic’
operational data) is not always equal to the input for the OMCE-Calculator (which aims at
estimating the future O&M costs).
In the following subsections some examples for the Building Blocks “Operation &
Maintenance”, “Logistics” and “Loads & Lifetime” are presented.
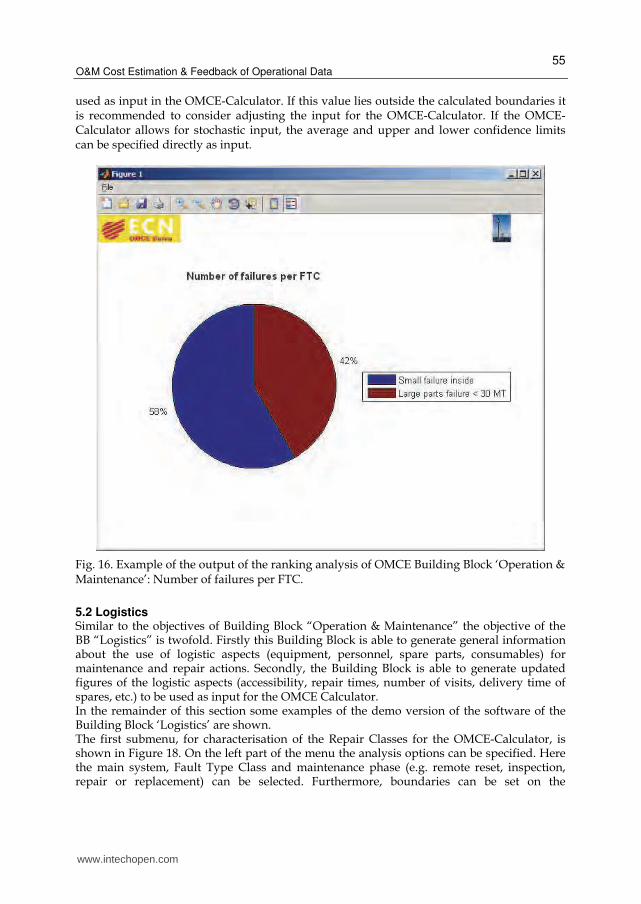
5.1 Operation & maintenance As has been mentioned in the first part of this section the OMCE-Building Blocks serve a twofold purpose. When looking at BB “Operation & Maintenance” it can be stated that on the one hand it should be suitable for general analyses, which can provide the user of the program with a general overview of the performance and health of the offshore wind farm with respect to failure behaviour. On the other hand the program should provide the possibility of analysing the Event List data in such a way that it can be determined if the failure frequencies used for making O&M cost estimates with the OMCE-Calculator are in accordance with the observed failure behaviour. Using this Building Block basically two types of analyses can be performed; ranking and trend analysis. In Figure 15 a typical output of the ranking analysis is shown, where the number of failures are shown per main system. This type of output makes it easy to identify possible bottleneck systems. Similar pie charts can be plotted of the failures per (cluster of) turbines. This information could be used to identify whether f.i. the heavier loaded turbines (as could be determined with Building Block ‘Loads & Lifetime’) also show more failures. In Figure 16 another example is given of the output of the ranking analysis of the Building Block ‘Operation& Maintenance’. Here, for one of the main systems, the distribution of the failures over the defined Fault Type Classes (which indicate the severity of a failure) is
www.intechopen.com

Wind Farm – Technical Regulations, Potential Estimation and Siting Assessment
54
shown. This information can be directly compared with the input data for the OMCE-Calculator and serve as input for the decision whether the original assumptions in the OMCE-Calculator input should be updated or not.
Fig. 15. Example of the output of the ranking analysis of OMCE Building Block ‘Operation & Maintenance’: Number of failures per main system.
In Figure 17 a typical output of the trend analysis of building block O&M is displayed. The graphs shows, for a selected main system, the cumulative number of failures as function of the cumulative operational time. The slope of the graph is a measure for the failure frequency. The software allows the user to specify the confidence interval and the period over which the failure frequency should be calculated. This is important when considering that the historical failure behavior does not always have to be representative for the future, which is modeled with the OMCE-Calculator. For instance, when after two years a retro-fit campaign is performed for a certain component, the failures which occurred during the first two years should not be included in the analysis with the goal of estimating the failure rate for the coming years. In this example the failure frequency is calculated over the period starting at 250 and ending at 350 operational years. The resulting average failure frequency is indicated by the blue line, whereas the 90% confidence intervals are shown by the red dotted lines. The calculated upper and lower limits (Davidson) can be compared with the failure frequency which is
www.intechopen.com
O&M Cost Estimation & Feedback of Operational Data
55
used as input in the OMCE-Calculator. If this value lies outside the calculated boundaries it is recommended to consider adjusting the input for the OMCE-Calculator. If the OMCE-Calculator allows for stochastic input, the average and upper and lower confidence limits can be specified directly as input.
Fig. 16. Example of the output of the ranking analysis of OMCE Building Block ‘Operation & Maintenance’: Number of failures per FTC.
5.2 Logistics Similar to the objectives of Building Block “Operation & Maintenance” the objective of the BB “Logistics” is twofold. Firstly this Building Block is able to generate general information about the use of logistic aspects (equipment, personnel, spare parts, consumables) for maintenance and repair actions. Secondly, the Building Block is able to generate updated figures of the logistic aspects (accessibility, repair times, number of visits, delivery time of spares, etc.) to be used as input for the OMCE Calculator. In the remainder of this section some examples of the demo version of the software of the Building Block ‘Logistics’ are shown. The first submenu, for characterisation of the Repair Classes for the OMCE-Calculator, is shown in Figure 18. On the left part of the menu the analysis options can be specified. Here the main system, Fault Type Class and maintenance phase (e.g. remote reset, inspection, repair or replacement) can be selected. Furthermore, boundaries can be set on the
www.intechopen.com

Wind Farm – Technical Regulations, Potential Estimation and Siting Assessment
56
Fig. 17. Example of the output of the trend analysis of OMCE Building Block ‘Operation & Maintenance’.
occurrence dates of the failures. This is useful if for instance at a certain date a change in the repair strategy has been implemented. In order to assess whether the ‘new’ repair strategy is in line with the input data for the OMCE-Calculator, the recorded failures where the ‘old’ repair strategy was still applied should not be included in the analysis with this Building Block. On the right part of the menu the results are displayed in two tables. The upper tables shows the average, standard deviation, minimum and maximum for time to organise, duration and crew size for the selected analysis options. The bottom table shows the usage of equipment. Furthermore also the number of records/failures that correspond to the selected analysis options are listed. In Figure 19 an example of the graphical output of the Building Block is presented. In this figure a cumulative density function (CDF) is shown of the duration of a small repair on the generator. This type of information gives additional insight in the scatter surrounding the average value. Furthermore, the information in the graph can also be used to determine whether, in this example, the duration of the repair should be modelled as a stochastic quantity in the OMCE Calculator and, if so, what distribution function (e.g. normal, etc.) is most appropriate.
www.intechopen.com

O&M Cost Estimation & Feedback of Operational Data
57
Fig. 18. Submenu for RPC characterisation of the Building Block ‘Logistics’.
Fig. 19. Example of the output of the RPC characterisation of the Building Block ‘Logistics’. Here the CDF of the duration of a small repair on the generator is shown.
www.intechopen.com

Wind Farm – Technical Regulations, Potential Estimation and Siting Assessment
58
In Figure 20 another example is shown. Here the usage of equipment is visualised for a selected Repair Class. The graph illustrates that in total five failures have been recorded which represent a large replacement of a drive train component. It can be seen that for access three different vessels have been used; once a RIB, twice a large access vessel and twice a helicopter. Furthermore, twice a crane ship and three times a jack-up barge has been used for hoisting the components.
Fig. 20. Example of the output of the Repair Class (RPC) characterisation of the Building Block ‘Logistics’. Here the usage of equipment is shown for a large replacement of the drive train.
5.3 Loads & lifetime As mentioned before the Building Blocks ‘Loads & Lifetime’ and ‘Health Monitoring’ are used to make estimates of the degradation, or even better, the remaining lifetime of the main wind turbine components. The main goal of the Building Block ‘Loads & Lifetime’ is to keep track of the load accumulation of the main wind turbine components and to combine this information with other sources (e.g. condition monitoring systems, SCADA information, results from inspections, etc.) in order to assess whether (and on which turbines) condition based maintenance can be performed. Previous research has shown that the power output of a turbine, and more importantly, the load fluctuations in a wind turbine blade, strongly depend on whether a wind turbine located in a farm is operating in the wake of other turbines or not. These observations imply
www.intechopen.com

O&M Cost Estimation & Feedback of Operational Data
59
that the loading of the turbines located in a large (offshore) wind farm is location specific; the turbines located in the middle of the farm operate more often in the wake of other turbines compared to the turbines located at the edge of the wind farm. Therefore, it is expected, that during the course of the lifetime of the wind farm certain components will degrade faster on the turbines experiencing higher loading, compared to the turbines subject to lower loading. This kind of information could be a reason to adjust maintenance and inspection schemes according to the loading of turbines, instead of assuming similar degradation behaviour for all turbines in the farm. When a major overhaul of a certain component is planned the turbines on which the specific component has experienced higher load can be replaced first, whereas the replacement of the component on the turbines which have experienced lower loading can be postponed for a certain time. This approach could result in important O&M cost savings. In order to monitor the load accumulation in a wind farm in a cost-efficient manner the so-called ‘Flight Leader’ concept has been developed in order to make estimates of the accumulated loading on the critical components of all turbines in an offshore wind farm. The basic idea behind the Flight Leader concept is that only a few turbines in an offshore wind farm are equipped with mechanical load measurements. These are labelled the ‘Flight Leaders’. Using the measurements on these Flight Leader turbines relations should be established between load indicators and standard SCADA parameters (e.g. wind speed, yaw direction, pitch angle, etc.), which are measured at all turbines. Once such relationships are determined for the reference turbines in a wind farm (the Flight Leaders) these can be combined with SCADA data from the other turbines in the wind farm. This enables the determination of the accumulated loading on all turbines in the farm. This is illustrated in Figure 21.
Fig. 21. Illustration of the Flight Leader concept; the load measurements performed on the Flight Leader turbines (indicated by the red circles) are used to establish relations between load indicators and standard SCADA parameters; these relations are combined with the SCADA data from all other turbines in the wind farm in order to estimate the accumulated loading of all turbines in the farm.
www.intechopen.com
Wind Farm – Technical Regulations, Potential Estimation and Siting Assessment
60
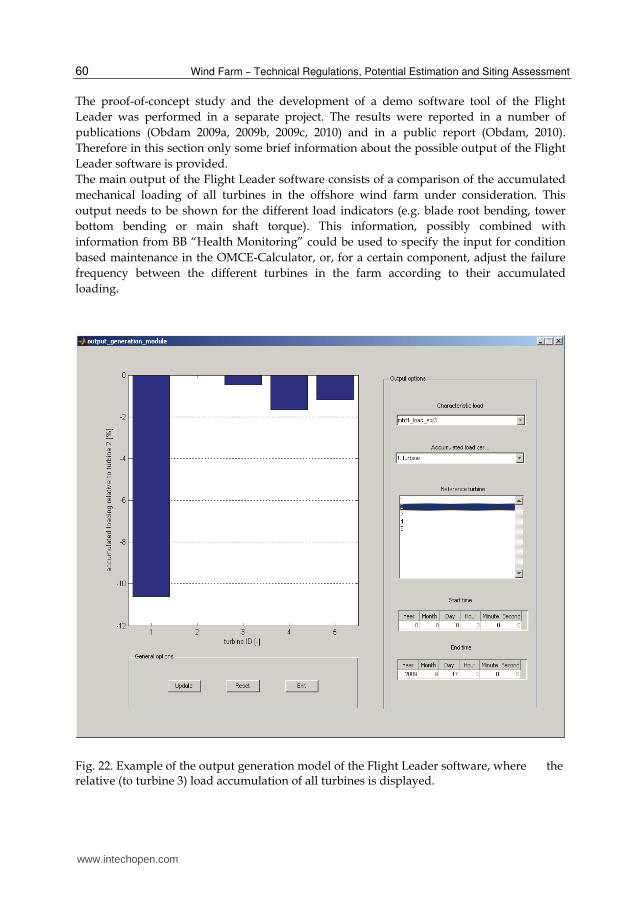
The proof-of-concept study and the development of a demo software tool of the Flight
Leader was performed in a separate project. The results were reported in a number of
publications (Obdam 2009a, 2009b, 2009c, 2010) and in a public report (Obdam, 2010).
Therefore in this section only some brief information about the possible output of the Flight
Leader software is provided.
The main output of the Flight Leader software consists of a comparison of the accumulated
mechanical loading of all turbines in the offshore wind farm under consideration. This
output needs to be shown for the different load indicators (e.g. blade root bending, tower
bottom bending or main shaft torque). This information, possibly combined with
information from BB “Health Monitoring” could be used to specify the input for condition
based maintenance in the OMCE-Calculator, or, for a certain component, adjust the failure
frequency between the different turbines in the farm according to their accumulated
loading.
Fig. 22. Example of the output generation model of the Flight Leader software, where the relative (to turbine 3) load accumulation of all turbines is displayed.
www.intechopen.com
O&M Cost Estimation & Feedback of Operational Data
61
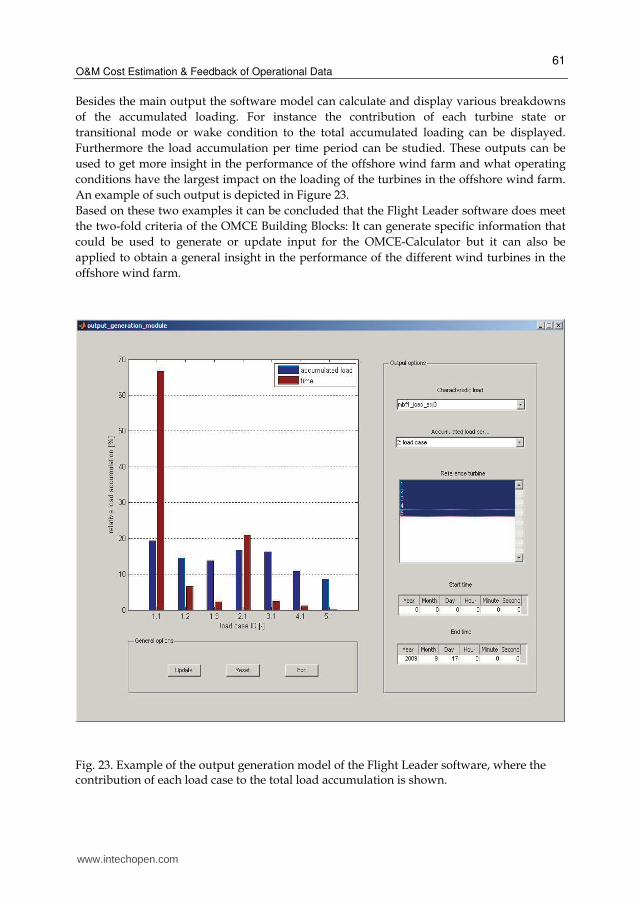
Besides the main output the software model can calculate and display various breakdowns
of the accumulated loading. For instance the contribution of each turbine state or
transitional mode or wake condition to the total accumulated loading can be displayed.
Furthermore the load accumulation per time period can be studied. These outputs can be
used to get more insight in the performance of the offshore wind farm and what operating
conditions have the largest impact on the loading of the turbines in the offshore wind farm.
An example of such output is depicted in Figure 23.
Based on these two examples it can be concluded that the Flight Leader software does meet
the two-fold criteria of the OMCE Building Blocks: It can generate specific information that
could be used to generate or update input for the OMCE-Calculator but it can also be
applied to obtain a general insight in the performance of the different wind turbines in the
offshore wind farm.
Fig. 23. Example of the output generation model of the Flight Leader software, where the contribution of each load case to the total load accumulation is shown.
www.intechopen.com

Wind Farm – Technical Regulations, Potential Estimation and Siting Assessment
62
6. Conclusion
Operation & Maintenance costs for offshore wind farms are high and contribute significantly to the cost-of-energy of offshore wind energy. In order to make offshore wind energy economically feasible in the long-term, the control and optimisation of O&M is essential. For this purpose ECN developed the ECN O&M Tool and is currently developing the Operation & Maintenance Cost Estimator (OMCE). ECN’s O&M Tool is useful to set-up an initial maintenance strategy, make estimates of the lifetime average O&M costs and support the financial decision making process in the planning phase of an offshore wind farm. This tool is now commonly used in the wind industry. However, the O&M Tool is less suited for usage during the operational phase of the wind farm, where it is more important to monitor the actual O&M effort and to control and optimised the future O&M costs. In order to assist in this process ECN started the development of the O&M Cost Estimator. The total OMCE-approach consists of two main parts: (1) The OMCE-Building Blocks, which are used to analyse operational data from the wind farm under consideration in order to get insight in the performance and health of the wind farm and to derive input data for (2) the OMCE-Calculator, which is a time-domain simulation program with which the expected future O&M costs can be estimated. In this chapter information was given of the modelling aspects of Operation & Maintenance, the OMCE project and the functionality and capabilities of the OMCE-Calculator and OMCE-Building Blocks.
7. Acknowledgment
This contribution is written as part of the research project D OWES in the context of the development of the “Operation and Maintenance Cost Estimator (OMCE)” by ECN. Within this OMCE project a methodology has been set up and subsequently software tools are being developed to estimate and to control future O&M costs of offshore wind farms taking into account operational experience. In this way it can support optimisation of O&M strategies. The OMCE project was funded partly by We@Sea, partly by EFRO, and partly by ECN (EZS). The development of the specifications for the OMCE was carried out and co-financed by the Bsik programme ‘Large-scale Wind Power Generation Offshore’ of the consortium We@Sea (www.we-at-sea.org). The development of the event list and the programming of the OMCE-Calculator is carried out within the D OWES (Dutch Offshore Wind Energy Services) project which is financially supported by the European Fund for Regional Developments (EFRO) of the EU (www.dowes.nl). Nordex AG is thanked for supplying information of the Nordex N80 wind turbines located at the ECN Wind turbine Test site Wieringermeer (EWTW). EWTW supplied maintenance sheets, SCADA data, and PLC data for further processing. Noordzeewind and SenterNovem are thanked for providing the O&M data and logistic data of the Offshore Wind farm Egmond aan Zee (OWEZ).
8. References
Davidson, J.; The Reliability of Mechanical Systems, The Institution of Mechanical Engineers, 1988.
www.intechopen.com

O&M Cost Estimation & Feedback of Operational Data
63
DOWES; Dutch Offshore Wind Energy Systems (DOWES), http://www.dowes.nl/ Leersum, B. van; et al; Integrated Offshore Monitoring System; Presented at the DEWEK
Conference 2010, Bremen. Manwell, J.F.; McGowan, J.G.; Rogers, A.L.; Wind Energy Explained; Theory, Design and
Application; University of Massachusetts, Amherst, USA, published by: John Wiley & Sons Ltd, West Sussex, England, 2003
Obdam, T.S.; Rademakers, L.W.M.M.; Braam, H.; Flight Leader Concept for Wind Farm Loading Counting and Performance Assessment; ECN-M--09-054; Presented at the European Wind Energy Conference 2009, Marseille, France, 16-19 March 2009.
Obdam, T.S.; Rademakers, L.W.M.M.; Braam, H.; Flight Leader Concept for Wind Farm Load Counting: First offshore implementation; ECN-M--09-114 Augustus 2009; Presented at the OWEMES 2009 Conference, Brindisi, Italy, 21-23 May 2009.
Obdam, T.S.; Rademakers, L.W.M.M.; Braam, H.; Flight Leader Concept for Wind Farm Load Counting: Offshore evaluation; ECN-M--09-122; Presented at the European Offshore Wind 2009 Conference, Stockholm, Sweden, 14-16 September 2009.
Obdam, T.S.; Rademakers, L.W.M.M.; Braam, H.; Flight Leader Concept for Wind Farm Load Counting - Final Report; ECN-E--09-068; October 2009.
Obdam, T.S.; Rademakers, L.W.M.M.; Braam, H.; Flight Leader Concept for Wind Farm Load Counting: Offshore Evaluation; ECN-W--10-008; Published in Wind Engineering (Multi Science Publishing), 2010, Ed.Vol. 34, number 1 / January, p.109-122.
Pieterman, R.P. van de; Braam, H.; Obdam, T.S.;: “Operation and Maintenance Cost Estimator (OMCE) – Estimate future O&M cost for offshore wind farms”; ECN-M--10-089; Presented at the DEWEK Conference 2010, Bremen
Roddier, D.; Weinstein, J.; Floating Wind Turbines, http://memagazine.asme.org/ Articles/2010/April/Floating_Wind_Turbines.cfm Rademakers, L.W.M.M.; Braam, H , .; Obdam, T.S.; Frohböse, P.; Kruse, N., TOOLS
FOR ESTIMATING OPERATION AND MAINTENANCE COSTS OF OFFSHORE WIND FARMS: State of the Art, ECN-M--08-026; Presented at the European Wind Energy Conference 2008, Brussels, Belgium, 31 March 2008-3 April 2008.
Rademakers, L.W.M.M.; Braam, H.; Obdam, T.S.; Estimating costs of operation & maintenance for offshore wind farms”; ECN-M--08-027; Presented at the European Wind Energy Conference 2008; Brussels
Rademakers, L.W.M.M.; Braam, H.; Obdam, T.S.; Pieterman, R.P. van de; Operation and maintenance cost estimator (OMCE) to estimate the future O&M costs of offshore wind farms, ECN-M--09-126; Presented at the European Offshore Wind 2009 Conference, Stockholm, Sweden, 14-16 September 2009.
Rademakers, L.W.M.M.; Braam, H , .; Obdam, T.S.; Pieterman, R.P. van de; Operation and Maintenance Cost Estimator”; ECN-E-09-037, October 2009
Vose, D.; Risk Analysis - A Quantitative Guide, John Wiley & Sons, Ltd. Wiggelinkhuizen, E.J. et al: "CONMOW Final Report"; ECN-E-07-044, July 2007
www.intechopen.com

Wind Farm – Technical Regulations, Potential Estimation and Siting Assessment
64
Wiggelinkhuizen, E.J.; Verbruggen, T.W.; Braam, H.; Rademakers, L.W.M.M.; Xiang, Jianping; Watson, S., Assessment of Condition Monitoring Techniques for Offshore Wind Farms, ECN-W--08-034 juli 2008; Published in Journal of Solar Energy Engineering (ASME), 2008, Ed.Vol. 130 / 03, p.1004-1-1004-9.
www.intechopen.com

Wind Farm - Technical Regulations, Potential Estimation and SitingAssessmentEdited by Dr. Gastón Orlando Suvire
ISBN 978-953-307-483-2Hard cover, 234 pagesPublisher InTechPublished online 14, June, 2011Published in print edition June, 2011
InTech EuropeUniversity Campus STeP Ri Slavka Krautzeka 83/A 51000 Rijeka, Croatia Phone: +385 (51) 770 447 Fax: +385 (51) 686 166www.intechopen.com
InTech ChinaUnit 405, Office Block, Hotel Equatorial Shanghai No.65, Yan An Road (West), Shanghai, 200040, China Phone: +86-21-62489820 Fax: +86-21-62489821
The evolution of wind power generation is being produced with a very high growth rate at world level (around30%). This growth, together with the foreseeable installation of many wind farms in a near future, forces theutilities to evaluate diverse aspects of the integration of wind power generation in the power systems. Thisbook addresses a wide variety of issues regarding the integration of wind farms in power systems. It contains10 chapters divided into three parts. The first part outlines aspects related to technical regulations and costs ofwind farms. In the second part, the potential estimation and the impact on the environment of wind energyproject are presented. Finally, the third part covers issues of the siting assessment of wind farms.
How to referenceIn order to correctly reference this scholarly work, feel free to copy and paste the following:
Tom Obdam, Henk Braam, René Van De Pieterman and Luc Rademakers (2011). O&M Cost Estimation &Feedback of Operational Data, Wind Farm - Technical Regulations, Potential Estimation and SitingAssessment, Dr. Gastón Orlando Suvire (Ed.), ISBN: 978-953-307-483-2, InTech, Available from:http://www.intechopen.com/books/wind-farm-technical-regulations-potential-estimation-and-siting-assessment/o-m-cost-estimation-feedback-of-operational-data

© 2011 The Author(s). Licensee IntechOpen. This chapter is distributedunder the terms of the Creative Commons Attribution-NonCommercial-ShareAlike-3.0 License, which permits use, distribution and reproduction fornon-commercial purposes, provided the original is properly cited andderivative works building on this content are distributed under the samelicense.