Oakajee Industrial Estate Structure Plan · (DWMS) for the Oakajee Industrial Estate. District...
59
Oakajee Industrial Estate Structure Plan District Water Management Strategy Prepared by: Matt Stovold - GHD Version No: 1.0 Version Date: 09 March 2012 Status: Final
Transcript of Oakajee Industrial Estate Structure Plan · (DWMS) for the Oakajee Industrial Estate. District...

61/24611/02/94089 Oakajee Industrial EstateDistrict Water Management Strategy
Oakajee Industrial EstateStructure Plan
District Water Management Strategy
Prepared by: Matt Stovold - GHDVersion No: 1.0Version Date: 09 March 2012Status: Final

61/24611/02/94089 Oakajee Industrial EstateDistrict Water Management Strategy
Contents
Oakajee Industrial Estate 1
Structure Plan 1
District Water Management Strategy 1
1. Executive Summary 1
2. Introduction 3
2.1 Site location and description 3
2.2 Total water cycle management – principles and objectives 4
2.3 Planning background 5
2.4 Previous studies and recommendations 6
3. Design and Management Objectives 8
3.1 Water conservation and efficiency 8
3.2 Water quantity management 8
3.3 Water quality management 8
3.4 Stormwater modelling criteria 9
3.5 Disease vector and nuisance insect management 9
4. Pre-Development Environment 10
4.1 Climate 10
4.2 Topography 11
4.3 Geology and soils 13
4.4 Flora 16
4.5 Fauna 16
4.6 Land use 18
4.7 Aboriginal and European heritage 18
4.8 Surface water 18
4.9 Groundwater 21
5. Proposed Development 24
5.1 Key elements of the structure plan 24
5.2 Transport Corridors 24
61/24611/02/94089 Oakajee Industrial EstateDistrict Water Management Strategy
5.3 Potential Development Impacts 25
6. Fit-For-Purpose Water Source Planning 27
6.1 Water allocation 27
6.2 Alternative Water Source Options 28
6.3 Infrastructure 33
6.4 Responsibilities 34
6.5 Site Water Balance 34
7. Water Management 40
7.1 Flood management 40
7.2 Surface Water Hydrology 40
7.3 Surface Water Management 43
7.4 Groundwater Management 44
7.5 Drinking water conservation and efficiency of use 45
7.6 Responsibilities 46
8. Implementation Framework 48
8.1 Local planning 48
8.2 Monitoring 48
8.3 Requirements for following stages 49
8.4 Funding and responsibilities 50
8.5 DWMS Technical review 52
9. References 53
Table IndexTable 1 Climate statistics near the Oakajee Industrial Estate
(Department of Water 2009, Bureau of Meteorology2009) 10
Table 2 Priority Flora found within the Strategic andGeneral Industrial Areas 16
Table 3 Relative ease of implementation of non-potablewater use under current regulatory framework 28
Table 4 Identified deep groundwater sources for theOakajee Industrial Estate* 29
Table 5 Summary of Desk Top Groundwater Assessment 30

61/24611/02/94089 Oakajee Industrial EstateDistrict Water Management Strategy
Table 6 Responsibility of utilities supply to development 34Table 7 Projected high quality feedwater demands 35Table 8 Projected low quality feedwater demands 35Table 9 Oakajee Industrial Area water balance for 2020
scenario (ML/yr) 37Table 10 Pre- and post-development flows for Oakajee
Industrial Estate 42Table 11 Total storage required to maintain pre-development
flows 42Table 12 Specifications for fixtures and fittings 45Table 13 Responsibility of water management 46Table 14 Monitoring programme summary 49Table 15 DWMS Implementation and Funding 51
Figure IndexFigure 1 Site location 4Figure 2 Planning framework for integrating the drainage
planning with land planning 6Figure 3 Climate statistics from Geraldton Airport (Bureau of
Meteorology 2009) 11Figure 4 3D images of Oakajee Site (5x vertical
exaggeration) 13Figure 5 Topography 14Figure 6 Surface Geology and Environmental Constraints 15Figure 7 Monthly rainfall and streamflow statistics of Buller
River (Department of Water 2009) 19Figure 8 Annual and monthly streamflow statistics at Buller
River (Department of Water 2009) 20Figure 9 Water Features 23Figure 10 Preliminary (draft) Oakajee Industrial Estate
structure plan (prepared by RPS 2010) 26Figure 11 Surface Water Catchments 41

161/24611/02/94089 Oakajee Industrial EstateDistrict Water Management Strategy
1. Executive Summary
GHD Pty Ltd were contracted by LandCorp to prepare a District Water Management Strategy(DWMS) for the Oakajee Industrial Estate. District water management is a component ofintegrated water cycle management that recognises ‘water supply, stormwater and sewageservices are interrelated components of catchment systems’ (DoW 2004).
This DWMS investigation is based on the latest Structure Plan being prepared for the site byRPS Environment and Planning Pty Ltd and focuses on the Strategic Industrial Area and thetwo smaller General Industrial Areas.
The Oakajee Industrial Estate (OIE) development is considered a district scale scheme underState Government Planning. This DWMS will inform LandCorp and the Shire of ChapmanValley of the proposed water and drainage implications of the development so responsibilitiescan be fulfilled under Section 6 of State Planning Policy 2.9 Water Resources (2006).
The relevant water related planning documents that relate to the development include the Shireof Chapman Valley Town Planning Policies (Shire of Chapman Valley), Town Planning SchemeNo. 1, Amendment 18 (Shire of Chapman Valley 2000), Town Planning & Development Act1928 (Shire of Chapman Valley), Shire of Chapman Valley Local Rural Strategy 2002 (Shire ofChapman Valley) and the Subdivision and Planning Development Guidelines (2009).
The site is currently used for farming and its topography is slightly undulating, with 3 north-south ridges running through it. Twenty-one monitoring bores were installed by Rockwater in1996 and water levels in these ranged from 6 – 65 mBGL. Groundwater quality was generallybrackish and elevated levels of nitrate and arsenic were encountered in some bores. Thesource of the nitrates is likely to be farming activities, whilst the arsenic is thought to benaturally occurring.
Up to 37 GL/yr has been forecasted as the total water demand for the OIE when fullydeveloped. To ensure reliable and water efficient supply to the development, alternative watersources not considered conventional potable sources (scheme), were investigated.
Substituting scheme water with an alternative source for non-potable uses can result insignificant savings in scheme water and in the associated chemicals and energy required totreat and deliver water to drinking water standard. It is therefore preferred that scheme waternot be provided for non-potable demands within the (OIE).
Consequently, water source options for the site were investigated with the objective of reducingtotal potable water demand. These options currently include:
Remote deep groundwater from Casuarina, Tumblagooda, Allanooka and local artesianaquifers;
Desalination (reverse osmosis);
Recycled industrial wastewater from a proposed Water Recycling Factory;

261/24611/02/94089 Oakajee Industrial EstateDistrict Water Management Strategy
Recycled treated organic wastewater from a future Waste Water Treatment Plant (WWTP).
Surface and groundwater management strategies are recommended to ensure the bestmanagement of water within the development and protection of downstream ecologicalcommunities. Water management (quality and quantity) will be the responsibility of eachproponent for areas located within their lot boundaries, whilst LandCorp will be responsible forwater management in public areas (road drainage). Specific surface water managementstrategies are presented below:
1 yr ARI
To retain and treat the 1 year ARI event, rooves will be connected to soak wells and wherethey are adopted, to rainwater tanks.
All stormwater will be contained within each lot and any which is contaminated will betreated prior to discharge / infiltration.
Road runoff will be infiltrated as close to source as practicable using water sensitive urbandesign (WSUD) measures including roadside swales / table drains.
10 yr ARI
Road runoff will be infiltrated as close to source as practicable using water sensitive urbandesign (WSUD) measures including roadside swales / table drains / bioretention structures.
Bioretention structures within individual lots will treat and infiltrate stormwater runoff.
100 yr ARI
Provision via overland flow paths will enable discharge of stormwater from each lot suchthat it will not exceed 100 yr ARI pre-development (existing environment) peak flows.
In order to ensure ongoing protection of groundwater, groundwater monitoring by individualdevelopment proponents will check against contamination.

361/24611/02/94089 Oakajee Industrial EstateDistrict Water Management Strategy
2. Introduction
GHD were commissioned by LandCorp to deliver a District Water Management Strategy(DWMS) for the development of the Oakajee Industrial Estate (OIE). The site occupies landacross the entire Oakajee area, in addition to parts of the Buller, Howatharra and White Peaklocalities.
This document focuses on the areas of land contained within the Strategic Industrial Area (SIA)and General Industrial Areas (GIA).
2.1 Site location and descriptionThe OIE is approximately 6,400 hectares in area, located 23 km north of Geraldton in WesternAustralia. The site is on the coast within the Shire of Chapman Valley. The northern boundaryis Coronation Beach Road, Buller River is the southern boundary and the foothills of theMoresby Range are the eastern boundary (Figure 1).
The OIE comprises the following four areas:
Strategic Industry Area (SIA): covers an area of 1,100 ha on a plateau adjoining the coastaldunes and escarpment;
General Industry Area (GIA): occupies 80 ha east of the (SIA) and another 110 ha land toits south;
Buffer: serves as a buffer zone for the Strategic Industry Area, with its 4,000 ha located tothe north, east and south of the industrial precincts; and
Coastal Area: a 950 ha coastal strip bounded by the Strategic Industry Area in the east andthe Buffer Area in the north and south.
The site is currently being developed to accommodate a range of processing industries for theMid West of Western Australia. As part of the development, a deep water port is proposed nearthe centre of the Coastal Area to cater initially for iron ore exports, with other resources andproducts from the OIE likely to follow in the future.

461/24611/02/94089 Oakajee Industrial EstateDistrict Water Management Strategy
Figure 1 Site location
2.2 Total water cycle management – principles and objectivesTotal water cycle management, also referred to as integrated water cycle management,‘recognises that water supply, stormwater and sewage services are interrelated components ofcatchment systems and therefore must be dealt with using a holistic water managementapproach that reflects the principles of ecological sustainability’ (DoW 2004-07, StormwaterManagement Manual for Western Australia).
The State Planning Policy 2.9: Water Resources (WAPC 2004) outlines the key principles ofintegrated water cycle management as:
Consideration of all water resources, including wastewater in water planning;
Integration of water and land use planning;
The sustainable and equitable use of all water sources, giving consideration to the needs ofall water users, including the community, industry and the environment;
Integration of human water use and natural water processes; and
A whole of catchment integration of natural resource use and management.
The principles and objectives for managing urban water as stated in the Stormwater

561/24611/02/94089 Oakajee Industrial EstateDistrict Water Management Strategy
Management Manual for Western Australia (DoW 2004-07) are as follows:
Water Quality: to maintain or improve the surface and groundwater quality within theDevelopment Areas relative to pre-development conditions;
Water Quantity: to maintain the total water cycle balance within the Development Areasrelative to the pre-development conditions;
Water Conservation: to maximise the reuse of stormwater;
Ecosystem Health: to retain natural drainage systems and protect ecosystem health;
Economic Viability: to implement stormwater management systems that are economicallyviable in the long term;
Public Health: to minimise the public risk including risk from injury or loss of life to thecommunity;
Protection of Property: to protect the built environment from flooding and water logging;
Social Values: to ensure that social, aesthetic and cultural values are recognised andmaintained when managing stormwater; and
Development: to ensure the delivery of best practice stormwater management throughplanning and development of high quality developed areas in accordance with sustainabilityand precautionary principles.
2.3 Planning backgroundThe planning framework for land and water planning is illustrated in Figure 2 (WAPC 2008).The DWMS demonstrates how water resources can be considered in the land use planningsystem and ensures consistency with State Planning Policy 2.9: Water Resources (WAPC2004).

661/24611/02/94089 Oakajee Industrial EstateDistrict Water Management Strategy
Figure 2 Planning framework for integrating the drainage planning with land planning
2.4 Previous studies and recommendationsRelevant documentation pertaining to the OIE and this DWMS is listed below:
Site Investigations
Oakajee Hydrology Report (Jim Davies & Associates 1993)
Oakajee Site Hydrogeology: Site Investigation (Jim Davies & Associates 1993)
Flora & Fauna Assessment: Oakajee Proposed Industrial Site (Dames & Moore 1993)
Oakajee Hydrogeological Investigation (Rockwater 1996)
Re-Evaluation of Flora and Fauna: Oakajee Proposed Industrial Estate and Quarries (MuirEnvironmental 1997)
Vegetation Monitoring: Oakajee Industrial Estate (Mattiske Consulting 2000)
Oakajee Industrial Park Groundwater and Surface Water Monitoring Results (Rockwater2000)
Oakajee Industrial Park Background Groundwater and Surface Water Monitoring Results(Rockwater 2001)
Oakajee Industrial Park Groundwater Monitoring Results (Rockwater 2003)
August 1997 Re-Evaluation of Flora & Fauna: Proposed Narngulu to Oakajee Railway (MuirEnvironmental 1997)
Oakajee Industrial EstateDWMS

761/24611/02/94089 Oakajee Industrial EstateDistrict Water Management Strategy
Oakajee Pipeline Route Flora and Fauna Study: Desktop Review & Field Survey (LandcareServices 1998)
Planning DocumentsBetter Urban Water Management (Western Australian Planning Commission 2008)
Town Planning Scheme No. 1, Amendment 18 (Shire of Chapman Valley 2000)
Town Planning & Development Act 1928 (Shire of Chapman Valley)
Shire of Chapman Valley Town Planning Scheme No. 1 (Shire of Chapman Valley)
Shire of Chapman Valley Local Rural Strategy 2002 (Shire of Chapman Valley)
Residential Design Codes 2002 (Shire of Chapman Valley)
Shire of Chapman Valley Town Planning Policies (Shire of Chapman Valley)
861/24611/02/94089 Oakajee Industrial EstateDistrict Water Management Strategy
3. Design and Management Objectives
The following design criteria have been adapted from the Generic Design Objectives presentedin Better Urban Water Management (WAPC 2008). These design criteria are methods forimproving water management, and should, where possible, be implemented wherever possibleby the developer. It is the Shire’s intent that these design criteria be incorporated into the LocalWater Management Strategy.
3.1 Water conservation and efficiencyNo potable water should be used outside buildings, with use of water to be as efficient as
possible;
Water supply to be fit for purpose, with reuse and recycling of wastewater to be adoptedwhere suitable;
All new fittings to meet 5 Star Plus provisions;
The use of native plants is to be promoted, with native species constituting a minimum of95% of total Public Open Space (POS) areas. It is noted that POS areas will be minimal,with 95% of the total open spaces to be dryland vegetation.
3.2 Water quantity managementPost-development annual discharge volume and peak flow rates to be maintained relative
to pre-development (existing environment) conditions, unless otherwise established throughdetermination of ecological water requirements for sensitive environments;
For the critical one year Average Recurrence Interval (ARI) event, the post-developmentdischarge volume and peak flow rates shall be maintained relative to pre-development(existing environment) conditions in all parts of the catchment;
Maintain runoff for up to the 1 in 100 year ARI event in the development area at pre-development (existing environment) peak flow rates; and
Protect the built environment from flooding and waterlogging.
3.3 Water quality managementMaintain surface and groundwater quality at pre-development (existing environment) levels
(winter concentrations) and, if possible, improve the quality of water leaving the developmentarea to maintain and restore ecological systems in the sub-catchment in which thedevelopment is located;
If pollutant outputs from the development (measured or modelled concentrations) exceedcatchment ambient conditions, the proponent shall achieve water quality improvements inthe development area or, alternatively, arrange equivalent water quality improvement offsets
961/24611/02/94089 Oakajee Industrial EstateDistrict Water Management Strategy
inside the catchment. If these conditions have not been determined, the development shouldmeet relevant water quality guidelines stipulated in the National Water Quality ManagementStrategy (ANZECC and ARMCANZ, 2000);
Ensure that all runoff contained in the drainage network receives treatment prior todischarge and infiltration to a receiving environment consistent with the StormwaterManagement Manual for Western Australia (DoW 2007).
3.4 Stormwater modelling criteriaIf it is proposed to use a stormwater modelling tool to demonstrate compliance with designobjectives, the modelling parameters recommended are those stated in Better Urban WaterManagement (WAPC 2008) (comparison is with a development that does not actively managestormwater quality):
At least 80 per cent reduction of total suspended solids;
At least 60 per cent reduction of total phosphorus;
At least 45 per cent reduction of total nitrogen; and
At least 70 per cent reduction of gross pollutants.
3.5 Disease vector and nuisance insect managementTo reduce health risks from mosquitoes, retention and detention treatments should be designedto ensure that detained immobile stormwater is fully infiltrated in a time period not exceeding 96hours.
Permanent water bodies are discouraged but, where accepted by the Department of Water,must be designed to maximise predation of mosquito larvae by native fauna to the satisfactionof the local government on advice of the Department of Water and the Department of Health.

1061/24611/02/94089 Oakajee Industrial EstateDistrict Water Management Strategy
4. Pre-Development Environment
4.1 ClimateThe OIE experiences a Mediterranean climate characterised by mild, wet winters and hot, drysummers. Mean daily temperatures fluctuate seasonally, ranging from 30°C in the summer to8°C in winter.
Table 1 and Figure 3 summarise climate statistics for Oakajee obtained from the Bureau ofMeteorology (BoM). The nearest BoM climate station is Geraldton Airport (008051), which isabout 23 km south-west of the site. For comparison purposes, rainfall data from the Howatharrastation (008168) has also been included in Table 1. The Howatharra station is locatedapproximately 5 km north-east of the site and measures rainfall only.
Rainfall data dating back to 1975 has also been collected by the Department of Water at theBuller River gauging station (508025). Owing to its proximity to the site, rainfall data from thisstation is considered representative of rainfall over the entire site. Rainfall recording ceased in2003, but the records nevertheless display a similar rainfall pattern to records from theHowatharra station. Monthly rainfall statistics from the Buller River gauging station are alsoshown in Table 1.
Table 1 Climate statistics near the Oakajee Industrial Estate (Department of Water2009, Bureau of Meteorology 2009)
Jan Feb Mar Apr May Jun Jul Aug Sep Oct Nov Dec Annual
Mean maximumtemperature (°C) 31.6 32.5 30.9 27.6 24.0 20.9 19.5 20.0 22.0 24.4 27.1 29.4 25.8
Mean minimumtemperature (°C) 18.3 19.1 17.9 15.4 12.9 11.0 9.5 8.9 9.2 10.9 13.8 16.3 13.6
Mean rainfall(mm)
Buller River
(1974-2003)5.4 8.6 19.9 27.4 66.0 83.4 73.9 53.4 30.9 15.7 9.4 3.5 388.9
Geraldton
Airport (1941-
2009)5.7 11.0 15.9 24.1 69.9 100.4 92.7 64.5 32.5 19.0 9.2 5.4 448.9
Howatharra
(1911-2009)5.6 8.5 14.7 25.0 71.4 107.1 95.9 63.8 30.5 18.1 8.4 3.2 455.2
Mean dailyevaporation (mm) 10.8 10.7 9.3 6.5 4.6 3.4 3.0 3.2 4.3 6.4 8.5 10.1 6.7
Mean monthlyevaporation (mm) 335 300 288 195 143 102 93 99 129 198 255 313 2450
1161/24611/02/94089 Oakajee Industrial EstateDistrict Water Management Strategy
0
20
40
60
80
100
120
Jan Feb Mar Apr May Jun Jul Aug Sep Oct Nov DecMonth
Mea
n ra
infa
ll (m
m)
5
10
15
20
25
30
35
Mea
n m
ax te
mpe
ratu
re (d
egre
es C
elsi
us)
Buller River Geraldton Aiport Howatharra Mean Maximum Temperature
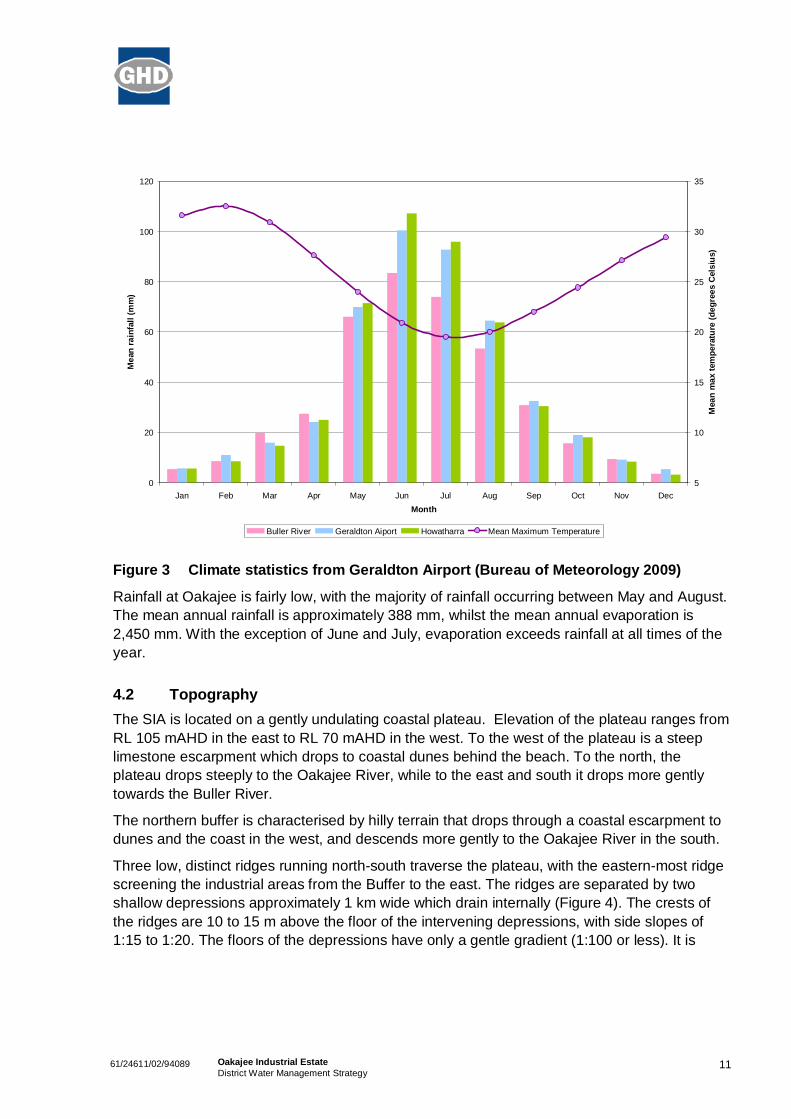
Figure 3 Climate statistics from Geraldton Airport (Bureau of Meteorology 2009)
Rainfall at Oakajee is fairly low, with the majority of rainfall occurring between May and August.The mean annual rainfall is approximately 388 mm, whilst the mean annual evaporation is2,450 mm. With the exception of June and July, evaporation exceeds rainfall at all times of theyear.
4.2 TopographyThe SIA is located on a gently undulating coastal plateau. Elevation of the plateau ranges fromRL 105 mAHD in the east to RL 70 mAHD in the west. To the west of the plateau is a steeplimestone escarpment which drops to coastal dunes behind the beach. To the north, theplateau drops steeply to the Oakajee River, while to the east and south it drops more gentlytowards the Buller River.
The northern buffer is characterised by hilly terrain that drops through a coastal escarpment todunes and the coast in the west, and descends more gently to the Oakajee River in the south.
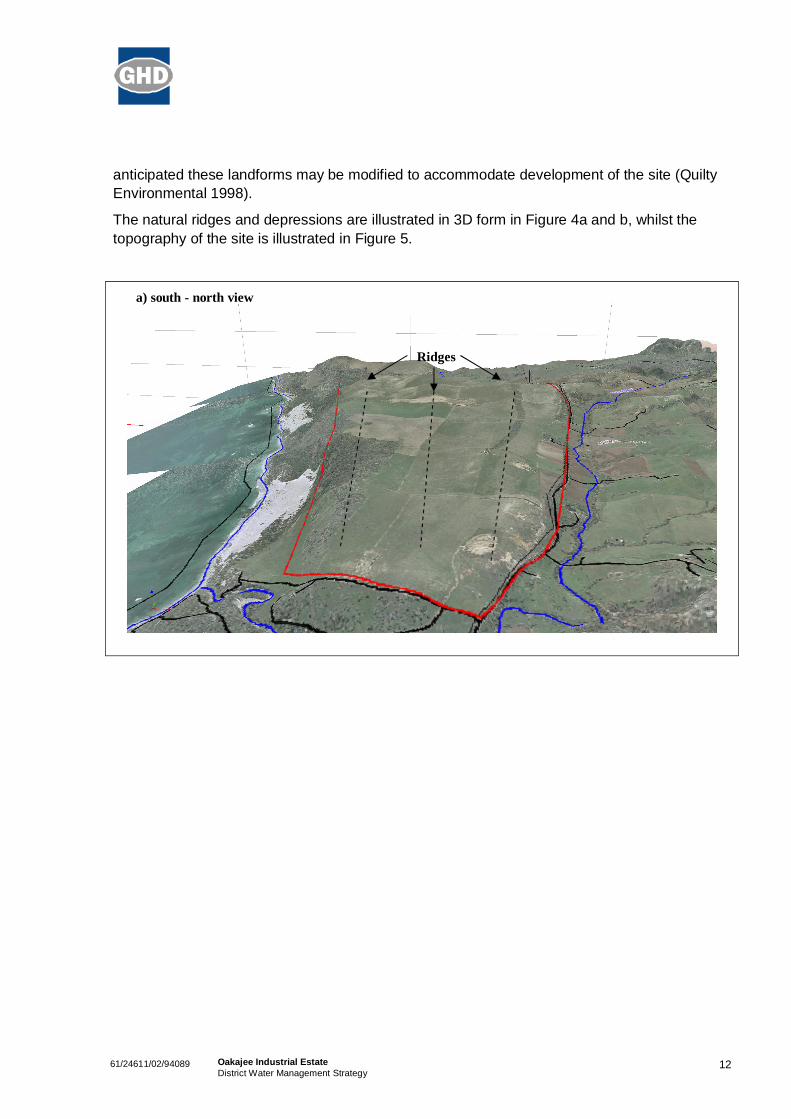
Three low, distinct ridges running north-south traverse the plateau, with the eastern-most ridgescreening the industrial areas from the Buffer to the east. The ridges are separated by twoshallow depressions approximately 1 km wide which drain internally (Figure 4). The crests ofthe ridges are 10 to 15 m above the floor of the intervening depressions, with side slopes of1:15 to 1:20. The floors of the depressions have only a gentle gradient (1:100 or less). It is
1261/24611/02/94089 Oakajee Industrial EstateDistrict Water Management Strategy
anticipated these landforms may be modified to accommodate development of the site (QuiltyEnvironmental 1998).
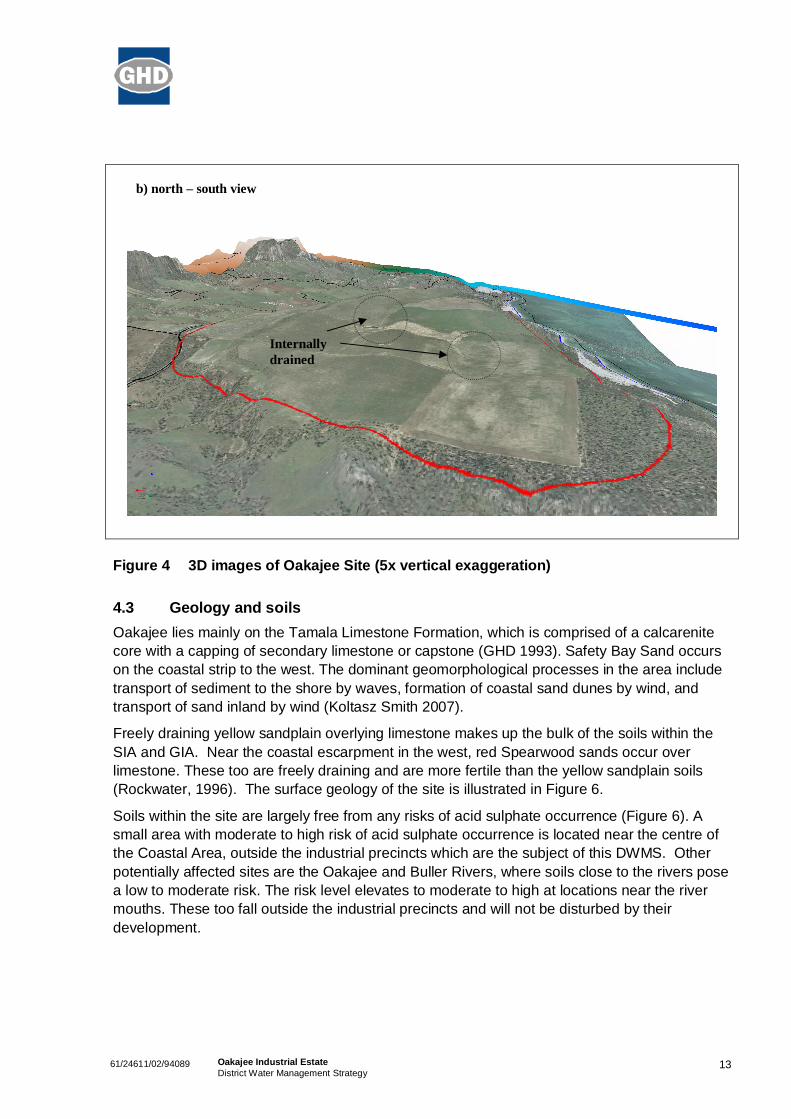
The natural ridges and depressions are illustrated in 3D form in Figure 4a and b, whilst thetopography of the site is illustrated in Figure 5.
a) south - north view
Ridges
1361/24611/02/94089 Oakajee Industrial EstateDistrict Water Management Strategy
Figure 4 3D images of Oakajee Site (5x vertical exaggeration)
4.3 Geology and soilsOakajee lies mainly on the Tamala Limestone Formation, which is comprised of a calcarenitecore with a capping of secondary limestone or capstone (GHD 1993). Safety Bay Sand occurson the coastal strip to the west. The dominant geomorphological processes in the area includetransport of sediment to the shore by waves, formation of coastal sand dunes by wind, andtransport of sand inland by wind (Koltasz Smith 2007).
Freely draining yellow sandplain overlying limestone makes up the bulk of the soils within theSIA and GIA. Near the coastal escarpment in the west, red Spearwood sands occur overlimestone. These too are freely draining and are more fertile than the yellow sandplain soils(Rockwater, 1996). The surface geology of the site is illustrated in Figure 6.
Soils within the site are largely free from any risks of acid sulphate occurrence (Figure 6). Asmall area with moderate to high risk of acid sulphate occurrence is located near the centre ofthe Coastal Area, outside the industrial precincts which are the subject of this DWMS. Otherpotentially affected sites are the Oakajee and Buller Rivers, where soils close to the rivers posea low to moderate risk. The risk level elevates to moderate to high at locations near the rivermouths. These too fall outside the industrial precincts and will not be disturbed by theirdevelopment.
Internallydrained
b) north – south view

1461/24611/02/94089 Oakajee Industrial EstateDistrict Water Management Strategy
Figure 5 Topography
General Industrial Area 1
General Industrial Area 2
Strategic Industrial Area

1561/24611/02/94089 Oakajee Industrial EstateDistrict Water Management Strategy
Figure 6 Surface Geology and Environmental Constraints

1661/24611/02/94089 Oakajee Industrial EstateDistrict Water Management Strategy
4.4 FloraSeveral flora assessments have been undertaken within the OIE. The two of most recentrelevance are:
Geraldton Regional Flora and Vegetation Study (Department of Planning 2010); and
OPR PER Vegetation and Flora Survey (Ecologia 2010a)
According to these recent investigations, there are 82 ha of remnant vegetation on the westernside of the SIA and within the southern GIA. These comprise Geraldton Regional Flora andVegetation Survey (GRFVS) communities 10 (Near Coastal Acacia rostellifera), 12 (RidgeMelaleuca cardiophylla), and 13 (Sandplain Banksia prionotes), comprising areas of 39 ha, 25ha and 18 ha respectively.
The investigations indicate no Declared Rare Flora (DRF) within these precincts, although thereare three priority species towards the western boundary of the SIA and GIA and a further 30within the Buffer. Within the SIA these species are located in areas that are likely to be clearedfor the Oakajee Port and Rail’s (OPR) rail alignment.
Table 2 summarises Priority Flora encountered within the SIA and GIA.
Table 2 Priority Flora found within the Strategic and General Industrial Areas
Species name Status
Malaleuca huttensis Priority 1
Grevillea triloba Priority 3
Lasiopetalum oppositifolium Priority 3
No Threatened Ecological Communities (TECs) were identified within the SIA or the GIA.Five Priority 1 areas were identified to the east of Oakajee listed as ‘plant assemblages of theMoresby Range system.’ These areas are illustrated in Figure 6.
4.5 FaunaThe most recent fauna assessment was undertaken by Ecologia Environmental (2010a) for theOakajee Port and Rail (OPE) Public Environmental Review (PER).
A total of 22 mammals, 161 birds, 105 reptiles and 15 frog species were found in the widerarea, none of which were located within the SIA or GIA. Of these, 32 are species of recognisedconservation significance, including:
Four EPBC Act listed migratory bird species – Fork-tailed Swift, Eastern Osprey, White-bellied Sea-eagle and Rainbow Bee-eater;
Two Priority 4 bird species listed by DEC – White-browed Babbler and Australian Bustard;
One Priority 4 species listed by the DEC – Western Carpet Python;
1761/24611/02/94089 Oakajee Industrial EstateDistrict Water Management Strategy
Northern and southern forms of the Fossorial skink, an undescribed worm lizard currentlyawaiting classification, and several fauna species at or near the northern limit of their range.
Within the SIA and GIA, some species of short range endemic invertebrates were identified.These include:
Two millipede species (antichiropus ‘Geraldton’ and Podykipus sp.1) on the north westernand south western boundary of the SIA and in the vegetated portion of the southern GIA;
Trapdoor spider (Aname sp. 1) in remnant vegetation in the north west of the SIA and in thenorth west section of the southern GIA;
Land snail (Bothriembryon sp.) in the north west of the southern GIA.
Subterranean FaunaTroglobites are fauna that inhabit caves or other subterranean habitats. While troglobite is aterm which can be applied to obligate subterranean species of both terrestrial and aquatichabitats, the term stygobite is used in preference for subterranean aquatic fauna species(Finalyson & Hamilton-Smith 2003). In the context of this DWMS, the presence of stygobites ingroundwater is of relevance.
The occurrence of stygobites within the OIE has been assessed through a baseline stygofaunasurvey of groundwater bores at the site. A total of three species, representing two Classes andthree Orders, were recorded in the survey. According to Ecologia Environment (2009), it islikely all three species are new to science. In addition, the elevated nature of the plateausuggests the underlying aquifers are unlikely to be connected to the surrounding aquifers, thusrestricting the stygofauna species to the site (Ecologia 2009).
From physio-chemical data gathered during groundwater sampling, the subterraneanenvironment at the site was found to be suitable stygofauna habitat (Ecologia 2009).
The site has been radically altered over the past 60 years, with wholesale clearing of theOakajee plateau beneath which the stygofauna have been located and subsequent grazing,cropping and groundwater extraction from this area for stock supplies. This land use has seenno containment of nutrients or other pollutants infiltrating to groundwater from farming andgrazing activities, and no management of groundwater levels which would have risen followingclearing and have varied since according to seasonal conditions. Against this background,allowing for depth to groundwater (15 – 65 mBGL) beneath the plateau, and assuming BestManagement Practices (BMP) are adopted with respect to management of water within theindustrial site, future developments are unlikely to negatively impact stygofauna or troglofaunaand may see improved management of site groundwater compared with what has obtainedover the past 60 years of farming and grazing.
This is supported by a Stygofauna Risk Assessment report (PB 2010) which assessed likelyimpacts of the proposed development on subterranean fauna. The study concluded the impacton stygofauna from likely industrial activities within the SIA and the GIA will be ‘very low’ ifmitigation measures proposed in this DWMS are implemented.

1861/24611/02/94089 Oakajee Industrial EstateDistrict Water Management Strategy
4.6 Land useLand use within the general Oakajee area is predominantly rural, with wheat production andgrazing of livestock. Soils are generally average to good quality and the preferred land use isbroad-acre agriculture (Welker Environmental Consultancy 1997).
The OIE is zoned ‘Industrial Investigation’ under the Shire of Chapman Valley Town PlanningScheme No. 1 District Zoning Scheme. The SIA and GIA have been extensively cleared foragricultural purposes, with vegetation retained around the perimeter only. In the past, winderosion degraded some areas of the cleared ground.
Land surrounding the industrial areas is largely zoned ‘General Farming’ with lot sizes rangingfrom 5 ha upwards. In areas to the south-east, ‘Special Rural’ allotments have been createdthrough subdivision.
Recreational opportunities and/or existing recreational use have been identified at the BullerRiver mouth and the adjoining coast to the south and at Coronation Beach to the north
4.7 Aboriginal and European heritageThe Department of Indigenous Affairs’ register indicates that there are a number of Aboriginalheritage sites within the OIE (Figure 6). These include the Buller River and Oakajee River,which are both considered mythological sites. The Oakajee River is also populated withapproximately twenty artefact sites along its fringes and there are a further eight sites to thenorth.
Nine Aboriginal heritage sites are registered within the Oakajee Coastal Area, four of which areburial sites. The proposed port coincides with three heritage sites, whilst the ‘Buller River NorthReburial’ site overlaps with the western portion of the SIA.
The register also indicates 25 other artefact sites through the industrial precincts and two sitesnear North West Coastal Highway.
To address development impacts on these and any further sites which may be identified,LandCorp is currently preparing an Aboriginal Heritage Management Plan for Oakajee inconsultation with the three Aboriginal claimant groups.
The Heritage Council of Western Australia’s State Register of Heritage Sites lists fourEuropean heritage sites within the boundaries of the Oakajee buffer. All are in the northernbuffer, in areas that will remain undisturbed.
4.8 Surface waterThe Buller and Oakajee Rivers are the only significant surface drainage features near the OIE.The site has been subdivided into sub-catchments, which are further described in Section 7.
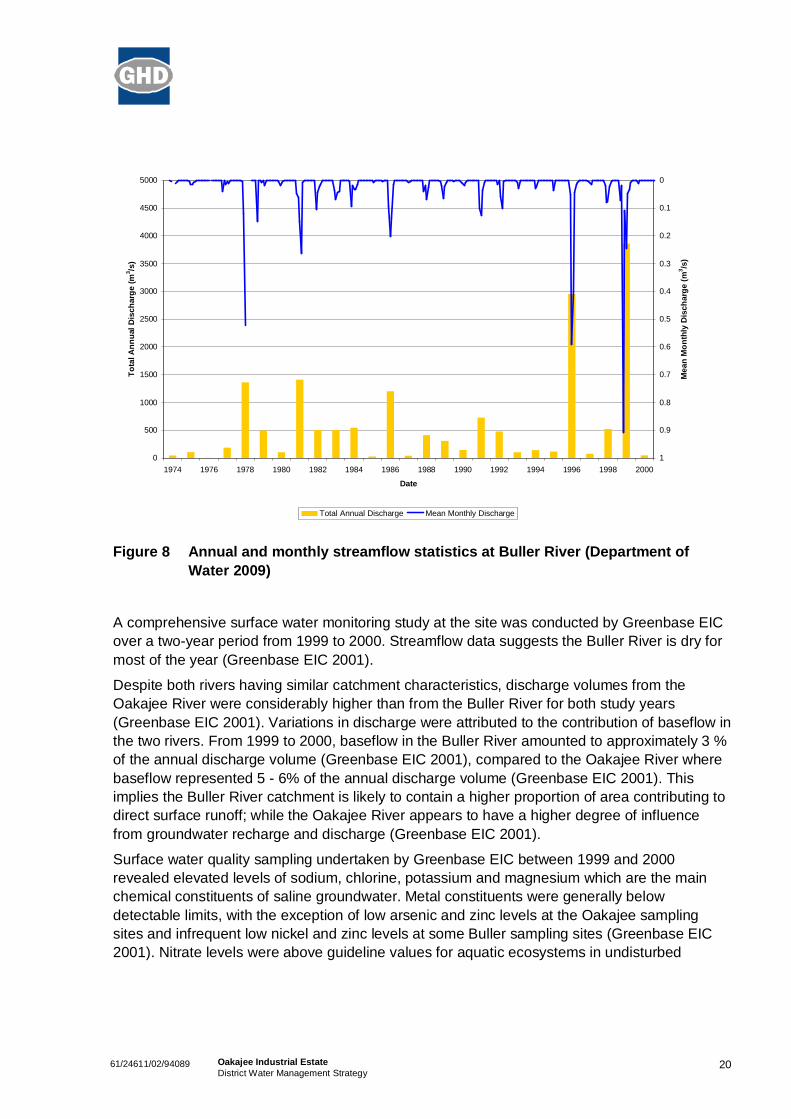
The only location where long term surface water monitoring has occurred is the Buller Riverstream gauging site (701006) near the mouth of the Buller River. Daily streamflow informationwas collected from 1974 to 2001. Findings are summarised in Figure 7 and Figure 8.

1961/24611/02/94089 Oakajee Industrial EstateDistrict Water Management Strategy
0
10
20
30
40
50
60
70
80
90
100
Jan Feb Mar Apr May Jun Jul Aug Sep Oct Nov Dec
Month
Mea
n m
onth
ly ra
infa
ll (m
m)
0.00
0.01
0.02
0.03
0.04
0.05
0.06
0.07
0.08
0.09
0.10
Mea
n m
onth
ly d
isch
arge
(m3 /s
)
Rainfall Streamflow
Figure 7 Monthly rainfall and streamflow statistics of Buller River (Department ofWater 2009)
2061/24611/02/94089 Oakajee Industrial EstateDistrict Water Management Strategy
0
500
1000
1500
2000
2500
3000
3500
4000
4500
5000
1974 1976 1978 1980 1982 1984 1986 1988 1990 1992 1994 1996 1998 2000
Date
Tota
l Ann
ual D
isch
arge
(m3 /s
)
0
0.1
0.2
0.3
0.4
0.5
0.6
0.7
0.8
0.9
1
Mea
n M
onth
ly D
isch
arge
(m3 /s
)
Total Annual Discharge Mean Monthly Discharge
Figure 8 Annual and monthly streamflow statistics at Buller River (Department ofWater 2009)
A comprehensive surface water monitoring study at the site was conducted by Greenbase EICover a two-year period from 1999 to 2000. Streamflow data suggests the Buller River is dry formost of the year (Greenbase EIC 2001).
Despite both rivers having similar catchment characteristics, discharge volumes from theOakajee River were considerably higher than from the Buller River for both study years(Greenbase EIC 2001). Variations in discharge were attributed to the contribution of baseflow inthe two rivers. From 1999 to 2000, baseflow in the Buller River amounted to approximately 3 %of the annual discharge volume (Greenbase EIC 2001), compared to the Oakajee River wherebaseflow represented 5 - 6% of the annual discharge volume (Greenbase EIC 2001). Thisimplies the Buller River catchment is likely to contain a higher proportion of area contributing todirect surface runoff; while the Oakajee River appears to have a higher degree of influencefrom groundwater recharge and discharge (Greenbase EIC 2001).
Surface water quality sampling undertaken by Greenbase EIC between 1999 and 2000revealed elevated levels of sodium, chlorine, potassium and magnesium which are the mainchemical constituents of saline groundwater. Metal constituents were generally belowdetectable limits, with the exception of low arsenic and zinc levels at the Oakajee samplingsites and infrequent low nickel and zinc levels at some Buller sampling sites (Greenbase EIC2001). Nitrate levels were above guideline values for aquatic ecosystems in undisturbed

2161/24611/02/94089 Oakajee Industrial EstateDistrict Water Management Strategy
lowland rivers, but were within the guideline limit for livestock drinking water (Greenbase EIC2001).
Sediment analysis for both rivers revealed concentrations of zinc, lead and chromium that arenormally found in environments with a history of agricultural land use (Greenbase EIC 2001).The total phosphorus concentration in sediments was high at both rivers, probably due toagricultural activities (Greenbase EIC 2001). No pesticides were detected in any of thesediment samples, but most constituents, with the exception of mercury and cadmium, werepresent in detectable quantities (Greenbase EIC 2001). As a result of the infrequent samplingprogram, Greenbase EIC advised that the sediment analysis results should not be consideredas definitive.
4.9 GroundwaterGroundwater at the Oakajee Industrial Estate occurs in unconfined aquifers 15 to 65 m belowground level (Rockwater 2003; Figure 9). The aquifers are recharged by rainfall and compriselocally weathered bedrock and overlying siltstone (Chapman Group), Tamala sand andsuperficial sand (Rockwater 1996). There is no saturated aquifer at the north-western edge ofthe plateau due to impermeable granite bedrock rising above the groundwater table here(Rockwater 1996).
Groundwater level contours indicate groundwater levels ranging from about 80m AHD at thenorth-east of the plateau to less than 1 m AHD at the coast (Rockwater 2003). Groundwaterfrom the site flows predominantly in a westerly or south-westerly direction towards the coast,passing though the Tamala sand and Chapman Group sediments (Rockwater 2003).
The granite bedrock in the plateau’s north-west inhibits groundwater flow towards the coast inthis particular sector. Consequently, higher groundwater levels are observed along the easternside of this granite and slight depressions occur on its western side (Rockwater 1996).
Groundwater sampling at the site was carried out by Rockwater from May 1999 to December2000 and from September 2001 to April 2003. Results indicated that the groundwater isessentially free of contamination, with the exception of high nitrate concentrations and lowarsenic levels (Rockwater 2003).The elevated nitrate levels were probably the result ofagricultural activities, with the highest concentrations occurring at the western side of theplateau (Rockwater 2003).
Arsenic levels above guideline limits were detected at two bores installed into the Tamala sandaquifer (Rockwater 2003). Parsons Brinckerhoff (2010) advise that the arsenic in the localgroundwater may be a natural occurrence as a result of mobilisation from sediments duringrainfall infiltration (O’Shea et al. 2007). Rockwater (2003) also noted that it is possible minorgroundwater contamination by arsenic could have come from agricultural compounds such assheep dip, feed additives or pesticides.
The groundwater beneath the site is brackish, with salinities ranging from 1,000 – 3,500 mg/L,but typically ranging from 700 – 1300 mg/L. Nitrate levels ranged from 19 – 150 mg/L in six

2261/24611/02/94089 Oakajee Industrial EstateDistrict Water Management Strategy
bores selected for water quality monitoring. Total phosphorous levels were below reportinglimits (<0.05 mg/L).

2361/24611/02/94089 Oakajee Industrial EstateDistrict Water Management Strategy
Figure 9 Water Features
2461/24611/02/94089 Oakajee Industrial EstateDistrict Water Management Strategy
5. Proposed Development
The proposed development will be based on the Structure Plan prepared by RPS.
5.1 Key elements of the structure planThe Structure Plan can be broadly divided into the following zones, as illustrated in Figure 10.
Strategic Industry Area and General Industrial AreasThe structure plan contains three industrial areas that are relevant to this DWMS. They includethe Strategic Industry Area (SIS) (1,144 ha) and two General Industry Areas (GIA) locatedimmediately to the east and south of the SIA and comprising 80 and 107 ha respectively. TheSIA is planned for heavy industrial purposes such as ferrous mineral processing, whilst the GIAare intended for general industrial activity supporting the industries within the SIA.
Coastal Area
The Coastal Area covers 947 ha and is proposed for a port and port-related industry. Possibleindustries include iron-ore stockpiling, grain storage and handling, marine construction, fuelstorage and an intermodal facility.
BufferThe buffer has been defined to contain impacts of industry and to exclude land uses such asresidential development which could constrain future industrial development.
5.2 Transport CorridorsThe Structure Plan allows for integrated transport and service corridors entering the estatethrough Wokatherra Gap to the east.
RoadThree separate access roads are proposed to allow access to the OIE and Port from the NorthWest Coastal Highway; the Southern, Central, and Northern Access Roads.
The Central Access Road will provide the primary entrance to the Strategic Industrial Area fromthe North West Coastal Highway, which runs past the estate, and will also provide access tothe Port. The Southern Access Road will provide access to both the SIA and the Port, whilethe proposed Northern Access Road will provide access to the Port only.
RailSince industries which will locate in the OIE and their needs for rail transport are unknown,multiple rail options have been proposed to facilitate the best access opportunities to the site.
A multi-product railway is proposed that enters the estate through Wokatherra Gap and loopsaround the boundary of the SIA. Another rail link is proposed from Wokatherra Gap running up

2561/24611/02/94089 Oakajee Industrial EstateDistrict Water Management Strategy
to the northern buffer before swinging back to the Port.
5.3 Potential Development ImpactsThe Oakajee development will modify the current environment which has in turn beensubstantially modified compared to the pre-European environment. Development modificationsto the current setting will require management to ensure there are no unacceptable impacts tothe environment.
Stormwater runoff will increase due to increases in impervious areas. The combination ofreduced vegetation cover and increased stormwater runoff will result in more groundwaterinfiltration. This may result in local groundwater mounding beneath local areas of pointinfiltration.
The land use change from dryland agriculture to industrial has potential to lead tocontamination of stormwater and groundwater. Stormwater will need to be managed carefullythrough appropriate treatment measures. A treatment train approach, which incorporatesmultiple treatments in series, is considered most appropriate.

2661/24611/02/94089 Oakajee Industrial EstateDistrict Water Management Strategy
Figure 10 Preliminary (draft) Oakajee Industrial Estate structure plan (prepared by RPS2010)

2761/24611/02/94089 Oakajee Industrial EstateDistrict Water Management Strategy
6. Fit-For-Purpose Water Source Planning
This section outlines a combination of generic and site specific water source planningstrategies relevant to the OIE. These strategies provide options for utilising alternative sourcesof water within the site and identify the infrastructure required.
A preliminary site water balance based on water demand projections has been prepared toquantify water supply and demand for the site and to assist in identifying ways to improve waterefficiency within the site.
A surface water hydrological assessment detailing pre and post-development flows andrequired storages to maintain pre-development flows has also been undertaken and ispresented in Section 7, which also addresses management principles.
6.1 Water allocationSubstituting scheme water with an alternative source for non-potable uses can result insignificant savings in scheme water and in associated chemicals and energy required to treatand deliver water to drinking water standard. It is preferred that scheme water not be providedfor non-potable demands within the OIE.
Potential supply options for non-potable uses include roof runoff, groundwater, stormwater(runoff from impervious surfaces) and wastewater re-use. A non-potable system cannot beestablished without a detailed investigation into associated risks. Possible risks associated withsuch systems largely relate to public health and the environment, particularly as the water isgenerally of poorer quality than potable water.
Use of roof runoff and/or groundwater is currently adopted widely across Perth and in regionalWestern Australia, and is not difficult to implement. Indirect reuse of stormwater also occurs onthe Swan Coastal Plain by infiltrating stormwater through sands and subsequently abstracting itas groundwater. The direct reuse of stormwater and reuse of treated wastewater (either directlyor indirectly) have not yet been approved for any projects in Western Australia, although theyare occurring in some developments in the eastern states and overseas.
It is necessary to evaluate potential public health risks, environmental impacts, financial costs,technical practicability, source viability and attitude of the local community against probablebenefits of implementing a non-potable water supply system. Alternative water supply systemsshould be established only in areas where potential benefits outweigh potential risks.
Typically, the use of rainwater tanks is encouraged in urban developments to capture rainwateras a substitute for scheme water for in house non-potable use and garden irrigation. Rainwatertanks could also be used for these purposes in the Oakajee Industrial Estate, but considerationshould be given to efficiency of water capture and reuse.
In the OIE case, industrial water demands far outweigh domestic potable demands.Consequently, stormwater runoff from industrial roofs and hardstand areas is likely to represent

2861/24611/02/94089 Oakajee Industrial EstateDistrict Water Management Strategy
a small component of the total water demands. Dust suppression in particular is likely torequire large water volumes. This water will initially be sourced from desalination of sea water.
The relative difficulty of implementing non-potable water use in Perth, as related to level oftreatment required, availability and costs is summarised in Table 3. The implementationprocess for Oakajee may be more difficult than indicated below due to its remote location, butstill warrants consideration due to the environmental benefits.
Table 3 Relative ease of implementation of non-potable water use under currentregulatory framework
WaterSource
In House DomesticIrrigation
PublicOpenSpaceIrrigation
AquiferRecharge
Hot Water ToiletFlushing
WashingMachineCold WaterInlet
Roof runoff Difficult toimplement. Notcurrentlyapproved byhealth departmentas hot water isclassified as adrinking water use
Easy toimplement
Easy toImplement
More efforttoimplement
More efforttoimplement
Easy toImplement
Stormwater(urbanrunoff)
Difficult toimplement
Difficult toimplement
Difficult toimplement
Difficult toimplement
Easy toImplement
DomesticGrey water
Difficult toimplement
Difficult toimplement
Significanteffort toimplement
Significanteffort toimplement
More efforttoimplement
TreatedWastewater
Difficult toimplement
Difficult toimplement
Significanteffort toimplement
More efforttoimplement
Significanteffort toimplement
The technical feasibility and health implications of these alternatives have been considered indeveloping the proposals which follow.
6.2 Alternative Water Source OptionsForecast total water demand for the entire OIE is 37 GL/yr when fully developed. To meet thisdemand, alternative water sources will need to be accessed. Alternative sources are discussedbelow but will require further investigation to identify the most viable and cost effective options.
Roof Runoff (Rainwater)Rainwater tanks have the potential to supply a reasonable proportion of domestic requirementswithin administration buildings.
2961/24611/02/94089 Oakajee Industrial EstateDistrict Water Management Strategy
Unconfined GroundwaterUnconfined groundwater typically occurs at shallow depths, can be abstracted by bores and isextensively used in some areas of Perth for irrigating parks and gardens. Groundwater isconsidered to be the easiest and usually the most cost effective alternative to scheme water forirrigation. Local groundwater in particular can represent a viable water source, particularly inindustrial sites, where recharge to groundwater is increased as a result of increases inimpervious areas.
There are, however, no proposals to extract groundwater from beneath the industrialprecincts of the OIE where earlier work by Rockwater indicates a limited resource with TDSvalues ranging as high as 3000 mg/L. Extraction may, however, occur from bores within thebuffer if suitable resources are identified there.
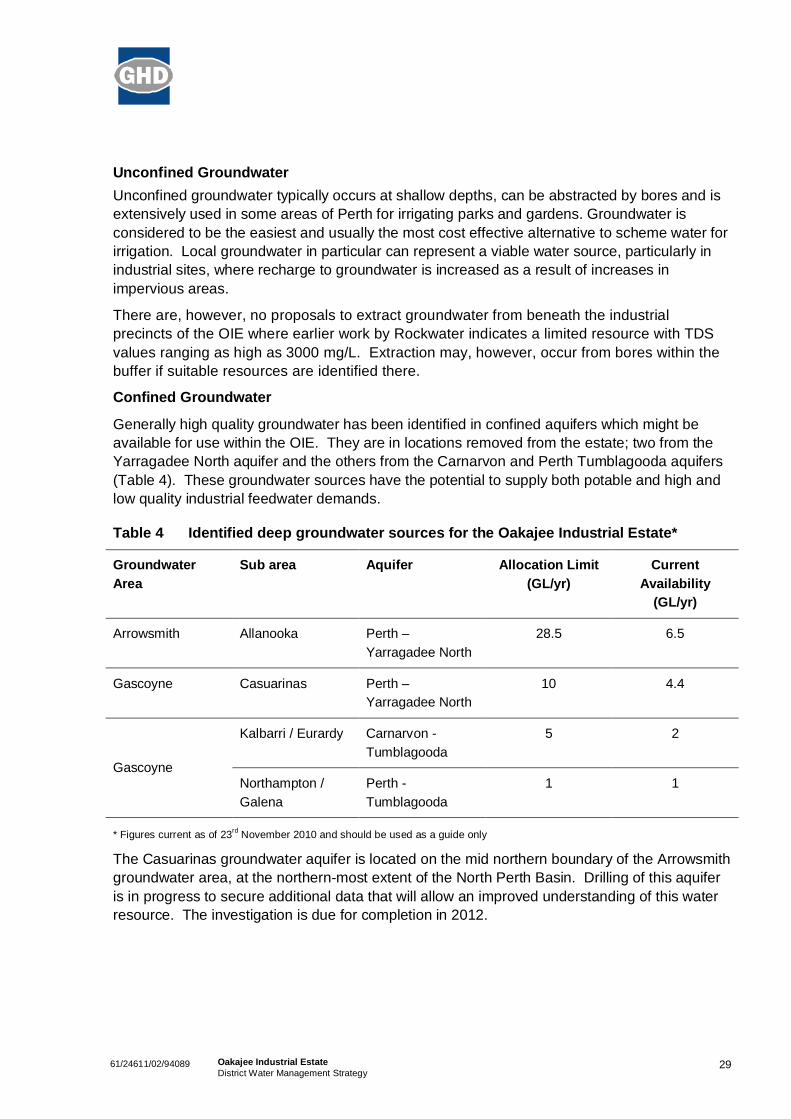
Confined Groundwater
Generally high quality groundwater has been identified in confined aquifers which might beavailable for use within the OIE. They are in locations removed from the estate; two from theYarragadee North aquifer and the others from the Carnarvon and Perth Tumblagooda aquifers(Table 4). These groundwater sources have the potential to supply both potable and high andlow quality industrial feedwater demands.
Table 4 Identified deep groundwater sources for the Oakajee Industrial Estate*
GroundwaterArea
Sub area Aquifer Allocation Limit(GL/yr)
CurrentAvailability
(GL/yr)
Arrowsmith Allanooka Perth –Yarragadee North
28.5 6.5
Gascoyne Casuarinas Perth –Yarragadee North
10 4.4
Gascoyne
Kalbarri / Eurardy Carnarvon -Tumblagooda
5 2
Northampton /Galena
Perth -Tumblagooda
1 1
* Figures current as of 23rd November 2010 and should be used as a guide only
The Casuarinas groundwater aquifer is located on the mid northern boundary of the Arrowsmithgroundwater area, at the northern-most extent of the North Perth Basin. Drilling of this aquiferis in progress to secure additional data that will allow an improved understanding of this waterresource. The investigation is due for completion in 2012.

3061/24611/02/94089 Oakajee Industrial EstateDistrict Water Management Strategy
Additional Groundwater Assessment
A desktop assessment has been completed aimed at improving the understanding ofgroundwater sources in the area, assessing publically available information and liaising withrelevant parties from local and state government organisations. A summary of results of thedesktop assessment is presented in Table 5.
Table 5 shows that for water demands up to 37 GL/year there is probably limited groundwaterclose to the OIE. Anecdotal information regarding high groundwater yields from the deep PerthAquifer 20 km east of Oakajee is unsubstantiated and discussions with relevant stakeholderssuggest the resource is likely too limited to support development within OIE. However, thissource may be able to support short term water supply, for example for construction purposes.
Significant groundwater resources are inferred in areas removed from the Oakajeedevelopment (40 to 50 km to the north and east) where major sedimentary basins exist,including the Carnarvon and North Perth Basins. These may be prospects for futuredevelopment and allocation for water supply purposes, but further investigation would berequired to determine their potential and resource allocation limits.
Closer appraisal of groundwater resources is alsom warranted to better quantify waterresources close to Oakajee (coastal aquifer, granite aquifer and sedimentary aquifer -overlyinggranite). These aquifers may be suitable for short term water supply (e.g. construction), orinvestigations may indicate the presence of deeper aquifers which may support increasedgroundwater demands.
Table 5 Summary of Desk Top Groundwater Assessment
Aquifer Location Salinity
(mg/L)
Interpreted ResourcePotential
Surficial - Coastal
(Sands/limestone10 to 30m thickoverlyinggranites)
Underlying SIA/GIAand extendingnorth and south incoastal areas
1200 - 3000 Limited water supply ofbrackish quality, unlikely to besufficient for use within theestate
Coastal supply north andsouth of Oakajee likely similarbut unconfirmed.

3161/24611/02/94089 Oakajee Industrial EstateDistrict Water Management Strategy
Granite/Gneissic
(Fracture flow inweatheredgranites)
Areas immediatelyeast of SIA/GIA,extending 40 kmeastwards
Variable
(500 – 10,000)
Traditionally understood as alimited resource, but in somelocations increasedgroundwater resources maybe found in weathered andfractured zones.
Sedimentary
(Jurassicsedimentsoverlying granites
Areas immediatelyeast of SIA/GIA,extending 40 kmeastwards
1,000 – 5,000 Understood as a limitedresource (locally important)sediments overlying granites,possible presence of deeperaquifers (e.g. paleo-channelsincised in granites)
Sedimentary
(Multi layeredNorthern PerthBasin.
30 to 50 km east ofOakajee
Unknown Major groundwater resourcedeep sedimentary aquifers
Sedimentary
(Multi-layeredSouth CarnarvonBasin)
30 to 50 km north ofOakajee
Unknown Major groundwater resourcedeep sedimentary aquifers
Domestic Grey WaterDomestic grey water is potentially available for reuse at the individual lot scale and collectivelyat the subdivision scale. If grey water is to be considered for in-house commercial property use,it must meet Class A (DoH 2005) standards for toilet flushing and washing machine use, andpotable standards for hot water systems. Grey water for in-house uses would probably be toocostly to consider as a mandatory requirement, and regulatory approvals would be difficult toobtain due to requirements for management to ensure adequate maintenance and operation ofsystems.
The volume of grey water generated from the OIE is likely to be small. Due to its generalinability to meet irrigation requirements, together with costs associated with installing greywater systems, it is not considered appropriate to recommend grey water systems for OIE.
StormwaterStormwater is mainly generated from roads and other impervious surfaces. It is generallyconsidered as wastewater and can contain relatively high concentrations of contaminants,including nutrients, hydrocarbons, metals and pathogens. The lack of barriers to exposure andthe inability to control raw water quality make stormwater a difficult option for direct reuse, as itrequires a high level of treatment. Furthermore, given the length of the dry season at Oakajee,

3261/24611/02/94089 Oakajee Industrial EstateDistrict Water Management Strategy
stormwater is unlikely to be available to meet summer irrigation demands without installation ofa costly storage, treatment and distribution network.
The most appropriate option for stormwater is considered to be indirect reuse via infiltration toshallow water tables. Stormwater from hardstand areas within development sites will receivetreatment via a treatment train approach using multiple treatments in series to removecontaminants prior to infiltration. This treatment train may include use of gross pollutants traps,prior to stormwater discharge to vegetated swales which may be treated with soil amendments.
Desalination
Desalination has been identified as a possible future alternative water source for the OIE,capable of treating seawater and brackish groundwater. A Seawater Reverse OsmosisDesalination Plant (SWRO) can produce large volumes of potable and non-potable water.MWH (2009) indicated the following capacity (GL/yr) and capital costs for three SWRO Plants:
10 GL/yr capacity - $325 million;
25 GL/yr capacity - $560 million; and
50 GL/yr capacity - $925 million.
A desalination plant is currently proposed to supply Oakajee Port and Rail (OPR). The plant isinitially planned to supply 3.7 GL/yr for dust suppression. There may be potential for upgradeof the plant to increase capacity to meet both high quality and low quality industrial waterdemands.
Treated Wastewater / EffluentThere are significant challenges in managing health risks posed by recycling treatedwastewater. The cost of managing these risks generally increases the cost of recycledwastewater above that of other water sources.
A waste water treatment plant (WWTP) is proposed within OIE to process domestic effluentpumped from the northern suburbs of Geraldton. Treatment and reuse of this effluent has thepotential to supply large annual volumes of water for industrial requirements. The WWTP willinitially provide only basic technology in the form of settling ponds. It will be located close to aservices corridor for easy incorporation of a pipeline to the industrial precincts.
A Water Recycling Factory is also proposed either inside the SIA or adjacent to the WWTP toreceive and process wastewater from industrial processes. The Water Recycling Factory willhave capacity to receive various non-potable waters, low quality groundwater and treatedorganic wastewater (from the WWTP). The configuration of both the Water Recycling Factoryand the WWTP is unknown, but they may feed into each other to operate as a primary and asecondary water treatment train.
Investigation and development of these options should be given priority and has the potential tosignificantly reduce total potable and non-potable water demand from other sources. Thecapacity of both treatment systems is likely to be small initially, but will increase as staged

3361/24611/02/94089 Oakajee Industrial EstateDistrict Water Management Strategy
development increases non-potable water demand within the estate.
In the event of delays in the development of a Water Recycling Factory and a WWTP, it will bethe responsibility of each proponent to provide onsite treatment and recycling of organiceffluent and process wastewater.
6.3 Infrastructure
6.3.1 Water
The current fresh water supply to Oakajee will not meet the total water demands of theproposed development. The closest developed water resource is the borefields at Allanooka,located approximately 40 km south-east of Geraldton. The Water Corporation’s DraftGroundwater Management Plan for Allanooka indicates a sustainable yield of 28.8 GL/yr ofwhich 22.1 GL/yr is listed as allocated, committed or requested (including an increase from thecurrent 12 GL/yr to 18 GL/yr for public water supply), implying a maximum of only 6.5 GL/yr isavailable to meet any new demand.
If groundwater from Allanooka were to be supplied to Oakajee, it would require construction ofa new 500 mm supply main from the Allanooka borefields to the site. The responsibility for itsconstruction and management would reside with the Water Corporation.
6.3.2 Wastewater
As previously indicated, a WWTP is proposed in the south eastern Buffer. This will be capableof treating sewage from Oakajee and also from the northern residential precincts of Geraldton.Timing of this development is, however, uncertain, and if industrial development occurs prior todevelopment of the WWTP, each large industry will be required to provide on-site treatment ofits own wastewater. Development and management of the WWTP will be the responsibility ofthe Water Corporation or private investors.
Treated wastewater from on-site package treatment plants could be disposed by irrigation orthrough on-site evaporation ponds. Private contractors would be required for sludge removal,or the sludge might be used for certain industrial operations.
For industries on smaller lots, wastewater disposal could be incorporated into initialdevelopment via septic tanks and leach drains provided by individual lot owners.
6.3.3 Electricity
Electric power at the OIE will be supplied either by power lines from the Western Power inter-connected grid or from a private gas fired power station at the site. Power will be reticulatedthrough the site on a needs and “as required” basis.
Power reticulation throughout the site will utilise service corridors and road reserves, withprovision of distributed substations.
3461/24611/02/94089 Oakajee Industrial EstateDistrict Water Management Strategy
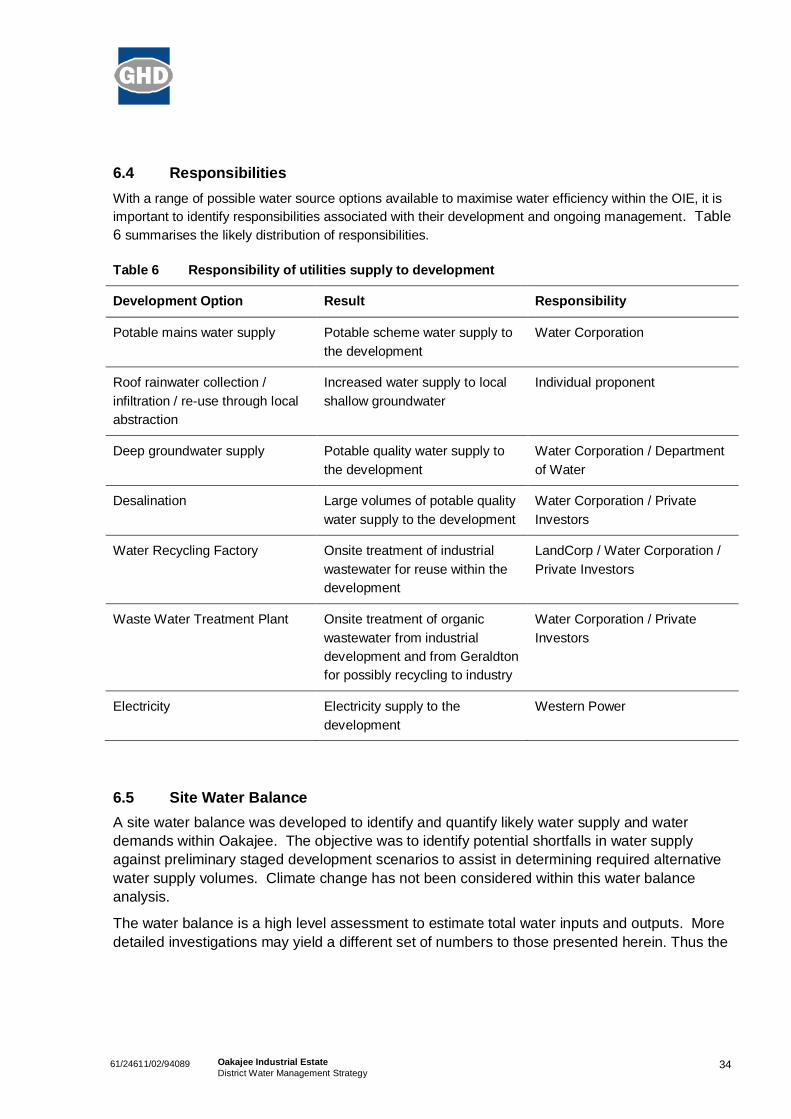
6.4 ResponsibilitiesWith a range of possible water source options available to maximise water efficiency within the OIE, it isimportant to identify responsibilities associated with their development and ongoing management. Table6 summarises the likely distribution of responsibilities.
Table 6 Responsibility of utilities supply to development
Development Option Result Responsibility
Potable mains water supply Potable scheme water supply tothe development
Water Corporation
Roof rainwater collection /infiltration / re-use through localabstraction
Increased water supply to localshallow groundwater
Individual proponent
Deep groundwater supply Potable quality water supply tothe development
Water Corporation / Departmentof Water
Desalination Large volumes of potable qualitywater supply to the development
Water Corporation / PrivateInvestors
Water Recycling Factory Onsite treatment of industrialwastewater for reuse within thedevelopment
LandCorp / Water Corporation /Private Investors
Waste Water Treatment Plant Onsite treatment of organicwastewater from industrialdevelopment and from Geraldtonfor possibly recycling to industry
Water Corporation / PrivateInvestors
Electricity Electricity supply to thedevelopment
Western Power
6.5 Site Water BalanceA site water balance was developed to identify and quantify likely water supply and waterdemands within Oakajee. The objective was to identify potential shortfalls in water supplyagainst preliminary staged development scenarios to assist in determining required alternativewater supply volumes. Climate change has not been considered within this water balanceanalysis.
The water balance is a high level assessment to estimate total water inputs and outputs. Moredetailed investigations may yield a different set of numbers to those presented herein. Thus the

3561/24611/02/94089 Oakajee Industrial EstateDistrict Water Management Strategy
figures presented should be used as a guide only.
The OIE is to be developed with a mix of heavy, general and light industrial uses.Consequently, water supply is expected to be split into two types based on water quality withprojected water demands for these two types presented in Table 8:
1. High quality feedwater (100 – 200 mg/L TDS) will be required for certain areas ofindustrial processing
2. Low quality feedwater (800 – 1000 mg/L TDS) will be required for such uses asindustrial cooling and dust suppression
Table 7 Projected high quality feedwater demandsOIE precincts Indicative forecasted high quality industry feedwater use (ML/a)
2015 2020 2025 2030 2035 2040 2045 2050 2055 2060Strategic Industrial Area 798 2,395 3,992 5,589 7,186 8,783 10,380 11,977 12,775 12,775
General Industrial Area 1 1 3 6 9 12 16 16 16 16 16
General Industrial Area 2 6 28 56 84 113 141 169 197 209 209
Coastal Zone 5 26 53 79 105 132 158 184 211 211
Buffer Zone 0 0 0 0 0 0 0 0 0 0
Total Oakajee Industrial Estate 810 2,453 4,107 5,762 7,416 9,071 10,723 12,374 13,210 13,211
Table 8 Projected low quality feedwater demandsOIE precincts Indicative forecasted low quality industry feedwater use (ML/a)
2015 2020 2025 2030 2035 2040 2045 2050 2055 2060Strategic Industrial Area 1,427 4,280 7,133 9,986 12,839 15,692 18,545 21,398 22,825 22,825
General Industrial Area 1 1 7 15 22 29 37 38 38 38 38
General Industrial Area 2 6 29 58 87 116 145 174 203 215 215
Coastal Zone 11 53 107 160 214 267 321 374 428 429
Buffer Zone 30 149 298 447 596 745 893 1,011 1,011 1,011Total Oakajee Industrial Estate 1,474 4,518 7,610 10,702 13,794 16,886 19,971 23,024 24,516 24,517
At this stage it is difficult to accurately predict the industries likely to establish at Oakajee and toestimate the timing of their development. Consequently the forecasts in the above tables werebased on water demands in similar industrial developments elsewhere, including Kwinana,adopting the following assumptions:
Volumes are indicative high level estimates and are subject to change;
There is no certainty about development rates;
Estimates are subject to industry mix;
Estimates do not take account of ongoing industry expansions, or of increasing efficienciesand technology developments over time;
Estimates cover operation of industries but do not allow for possible higher demands during

3661/24611/02/94089 Oakajee Industrial EstateDistrict Water Management Strategy
construction.
Water balance modelling considered the forecast demands listed above. Due to uncertainty inthe level and timing of development, water balance scenarios were undertaken for thedeveloped years 2020 and 2060 to represent an early stage of development scenario (2020)and the fully developed estate (2060):
Current State – this assumes the site is undeveloped;
Future State 2020 – This assumes a partly developed site with desalinated water suppliesof 3.7 GL/yr for both low and high quality feedwater uses as indicated by the EngineeringServices Report (GHD 2010) and with remaining water demand is supplied from alternativewater sources (probably remote groundwater).
Future State 2060 – This assumes the desalination plant has been upgraded to a capacityof 15 GL/yr for both low and high quality feedwater uses, and identifies the water volumesrequired to meet the remaining demands for the estate. Assuming a water factory isoperational, only water from the SIA is available for recycling back to the water factory.
The following lists the basic assumptions used to define inputs to the water balance model:
The land coverage areas were assumed to be 75% open space (dryland), 5% irrigated land(POS), 10% hardstand and 10% roof area for the Future State 2020 scenario (assumes 20%development progress using the ratio of 2020 total water demand : 2060 total waterdemand);
The land coverage areas were assumed to be 15% open space (dryland), 5% irrigated area(POS), 40% hardstand and 40% roof area for the Future State 2060 scenario.
The water balance considered water transition by runoff coefficients through the followingmeans - 1) direct evaporation; 2) surface runoff; and 3) direct infiltration;
Monthly average rainfall (annual mean 389 mm/yr) and evapotranspiration were used asinput data and taken from Bureau of Meteorology Geraldton Airport (site 008051) and theBuller River rainfall station;
Pervious Recharge = infiltration to groundwater from open pervious areas only;
Roof Recharge = direct infiltration to groundwater through soak wells from roof surfacesonly;
Hardstand Recharge = runoff from hardstand (paved) areas directed to treatment traininfiltration devices;
Surface Water Runoff = runoff generated from pervious areas, irrigation areas andhardstand areas;
Net Groundwater Addition = Surface Water Runoff + Pervious Recharge + Roof Recharge+ Hardstand Recharge.
A further component of the water balance was estimation of evapotranspiration. This wascalculated using the following equation to assist in determining total groundwater recharge

3761/24611/02/94089 Oakajee Industrial EstateDistrict Water Management Strategy
volumes (Zhang et al 1999).
ET – Evapotranspiration (mm)
P = Precipitation (mm)
Eo = Potential evapotranspiration (mm)
w = Plant available water coefficient (ranges from 0.5 for crops to 2.0 for forest)
Potential evaporation (Eo) was calculated using the Priestley and Taylor (1972) method:
Rn – Net radiation (MJ m-2 day-1)
G – Soil heat flux (assumed to be 0)
- Slope of the vapour pressure – temperature curve (kPa K-1)
Y – Latent heat of evaporation (~2.5x10⁶ J mm-1)
a - Empirical factor of 1.26
Table 9 Oakajee Industrial Area water balance for 2020 scenario (ML/yr)
Inputs Current State Future State 2020 Future State 2060
Rainfall (389 mm/year) 5,254 5,254 5,254
Domestic Potable (scheme) 0 19 108
Industrial Irrigation 0 422 846
High Quality Feedwater 0 2,468 13,313
Low Quality Feedwater 0 4,367 23,383
Total Inputs 5,254 12,530 42,904
Alternative Water Supply groundwater, waterrecycling plant, WWTP)
0 3,557 22,542
Minimum Potable Scheme Water Supply 0 19 108
Desalination (SWRO) Supply 0 3,700 15,000
Outputs Current State Future State 2020 Future State 2060

3861/24611/02/94089 Oakajee Industrial EstateDistrict Water Management Strategy
Evaporation and Evapotranspiration 4,152 3,588 1,759
Surface Water Runoff 53 256 860
Pervious Recharge 1,049 1,201 959
Roof Recharge 0 420 1,681
Hardstand Recharge 0 210 841
Total Industrial WastewaterStrategic Industrial Wastewater (to sewer/waterrecycle factory)
General Industrial Wastewater (to sewer)
0 5,371 34,391
0 2,871 18,394
0 2,500 16,007
Industrial Process Losses 0 1,484 2,413
Total outputs 5,254 12,530 42,904
Available wastewater for recycling 0 2,871 18,394
Net Groundwater Addition 1, 102 2,087 4,341
6.5.1 Water Balance Outcomes
Results from the water balance assessment provide a high level overview of total waterdemands and are useful in quantifying water volumes required from non-potable sources toreduce demands from scheme water supply. The key outcomes of the water balanceassessment have identified the following:
An additional 3.5 GL/yr of water will need to be sourced to meet industrial water demand by2020;
An additional 22.5 GL/yr of water will need to be sourced to meet industrial water demandby 2060;
Desalinated water (3.7 GL/yr) will be able to meet 85% of the low quality feedwater demandin 2020 and will form a critical component of total water supply;
Additional water might be sourced from Allanooka bore field, which has a current availabilityof 6.5 GL/yr;
Further water sources will need to be secured to meet total water demands for the site after2020, as the site is fully developed;
If a water recycling factory is developed, there should be sufficient industrial wastewateravailable in 2020 and 2060 to meet total water demands when combined with water from adesalination plant; and
An additional 3.3 GL/yr of water will be infiltrated to groundwater by 2060 compared to the

3961/24611/02/94089 Oakajee Industrial EstateDistrict Water Management Strategy
current state as a result of increases in impervious areas and increased direct infiltration.

4061/24611/02/94089 Oakajee Industrial EstateDistrict Water Management Strategy
7. Water Management
7.1 Flood managementA key objective of surface water management for the OIE is protection of property andinfrastructure through safe conveyance of excessive runoff from minor and major storm events.This includes management of surface water from the development and mitigating impacts ondownstream waterways.
Key focus areas for flood management of the proposed development are:
Maintaining the natural peak discharge to receiving waterways resulting from 10 year and100 year average recurrence interval (ARI) events;
Conveyance of major 100 year ARI events via natural overland flow paths away fromdevelopment;
Ensuring all proposed development is at least 0.3 m above the 100 year ARI flood level.
These requirements will be addressed in detail within the Local Water Management Strategy.
7.2 Surface Water HydrologyA surface hydrological assessment was undertaken for the OIE to calculate pre and postdevelopment surface water flows. These calculations were undertaken to provide a guide forsizing of surface water detention structures such as swales and infiltration basins.
Runoff control within the OIE will be through a combination of the following structural measuresto carry runoff from low frequency storms (10 yr ARI), with provision for overland flow paths(100 yr ARI):
Open swales;
Open drains;
Infiltration / bioretention basins;
Culverts,
Roof soak wells;
Rainwater tanks.
Calculation of flows requires catchment delineation within the site. Based on site topography,seven catchments were delineated (Figure 11).
Catchments 1 and 2 are internally drained and all post development surface water will bedetained within them. Pre and post development peak water flows were calculated for the 1, 5,10 and 100 yr ARI event. Required storages were determined so that throttled flows fromstorage structures was equal to the pre development peak flows for each corresponding designrainfall event.

4161/24611/02/94089 Oakajee Industrial EstateDistrict Water Management Strategy
Figure 11 Surface Water Catchments
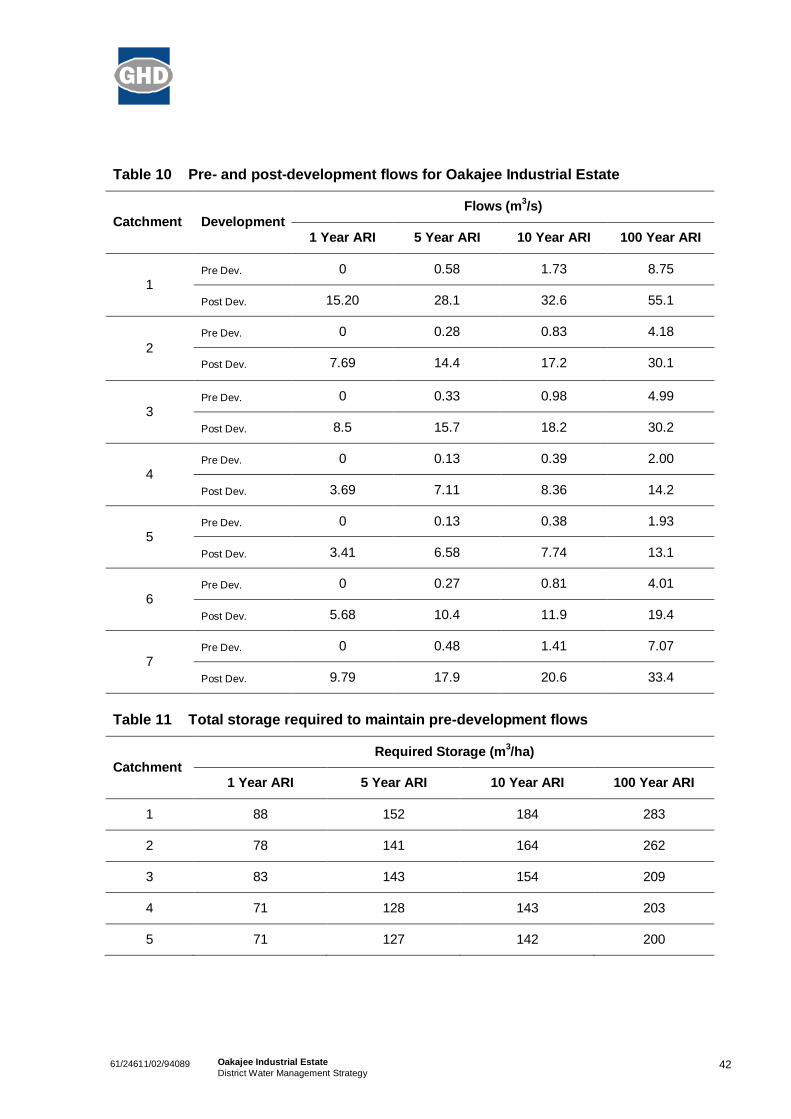
4261/24611/02/94089 Oakajee Industrial EstateDistrict Water Management Strategy
Table 10 Pre- and post-development flows for Oakajee Industrial Estate
Catchment DevelopmentFlows (m3/s)
1 Year ARI 5 Year ARI 10 Year ARI 100 Year ARI
1Pre Dev. 0 0.58 1.73 8.75
Post Dev. 15.20 28.1 32.6 55.1
2Pre Dev. 0 0.28 0.83 4.18
Post Dev. 7.69 14.4 17.2 30.1
3Pre Dev. 0 0.33 0.98 4.99
Post Dev. 8.5 15.7 18.2 30.2
4Pre Dev. 0 0.13 0.39 2.00
Post Dev. 3.69 7.11 8.36 14.2
5Pre Dev. 0 0.13 0.38 1.93
Post Dev. 3.41 6.58 7.74 13.1
6Pre Dev. 0 0.27 0.81 4.01
Post Dev. 5.68 10.4 11.9 19.4
7Pre Dev. 0 0.48 1.41 7.07
Post Dev. 9.79 17.9 20.6 33.4
Table 11 Total storage required to maintain pre-development flows
CatchmentRequired Storage (m3/ha)
1 Year ARI 5 Year ARI 10 Year ARI 100 Year ARI
1 88 152 184 283
2 78 141 164 262
3 83 143 154 209
4 71 128 143 203
5 71 127 142 200

4361/24611/02/94089 Oakajee Industrial EstateDistrict Water Management Strategy
6 84 139 149 179
7 88 144 155 187
7.3 Surface Water ManagementStormwater within Oakajee should be managed readily. Groundwater at depth and permeablesands across the site favour infiltration. Further, the site is not constrained by land availability,so traditional pit and pipe drainage networks commonly employed on urban roads will not berequired.
Specific surface water management strategies for Oakajee are detailed below:
1 yr ARI
To retain and treat the 1 year ARI event, rooves will be connected to soak wells and, whereappropriate, to rainwater tanks.
All stormwater will be contained within each lot and any which is contaminated will betreated prior to discharge / infiltration.
Road runoff will be infiltrated as close to source as practical using water sensitive urbandesign (WSUD) measures including roadside swales / table drains.
10 yr ARI
Road runoff will be infiltrated as close to source as practical using water sensitive urbandesign (WSUD) measures including roadside swales / table drains / bioretention structures.
Bioretention structure within individual lots will treat and infiltrate contaminated stormwaterusing soil amendments to improve quality;
100 yr ARI
Provision via overland flow paths will enable discharge of stormwater from each lot suchthat it will not exceed 100 yr ARI pre development (current environment) peak flows.
7.3.1 Stormwater Management at Lot Scale
Due to the uncertainty of future development at Oakajee, lot sizes and their configuration areunknown. It is therefore appropriate that stormwater management responsibility rests witheach proponent. The following management actions are applicable to each proponent:
Separation of uncontaminated stormwater from potentially contaminated stormwater;
Chemical storage and handling areas should be located within secondary containmentareas that allow maximum recovery of any spilt chemicals;
Paved areas exposed to rainfall where dust, litter or spilt substances accumulate should beregularly cleaned, avoiding drainage or leaching into the surrounding environment. Litter, oiland sand traps (as appropriate to the site) are recommended at drain entry points. First flush

4461/24611/02/94089 Oakajee Industrial EstateDistrict Water Management Strategy
water diversion should be considered for dusty outdoor areas to capture initial stormwaterrunoff after extended dry periods;
Turbidity should be controlled and, where necessary, stormwater should be treated and, inorder of preference, be used as a process water source, be disposed onto vegetated areas,or be infiltrated via onsite soak pits or infiltration basins;
Chemical solvents and non-degradable detergents used to clean equipment or pavementsshould not be released into stormwater systems;
Stormwater should not be released from chemical storage compounds, unless first testedand found to be uncontaminated; and
Stormwater from some industries may require containment in settling ponds and testingprior to discharge / infiltration.
7.4 Groundwater ManagementGroundwater investigations and monitoring have been undertaken for the OIE by Rockwaterand are reported as follows:
Oakajee Hydrogeological Investigation (Rockwater 1996);
Oakajee Industrial Park Background and Surface Water Monitoring Results (Rockwater2000);
Oakajee Industrial Park Background and Surface Water Monitoring Results (Rockwater2001); and
Oakajee Industrial Park Groundwater Monitoring Results (Rockwater 2003).
The initial investigation by Rockwater drilled 21 bores that recorded static water levels in Feb1996 ranging from 6 – 64 mBGL.
Groundwater monitoring is currently being undertaken by Parsons Brinckerhoff who recentlyinstalled three additional bores and are now monitoring all site bores for a two-year period.
Due to the depth of groundwater below the natural ground surface, direct infiltration ofstormwater is recommended. Assuming BMPs (treatment train approach) are adopted withWSUD measures, there is unlikely to be any negative impacts on groundwater levels andquality.
Overlying sedimentary deposits include Tamala limestone, Tamala sand and Chapman groupsandstone and siltstone. Permeability of these sediments ranges from 0.03 to 240 m/daccording to Rockwater (1996). Consequently the potential for stormwater contamination,particularly within each industrial lot, should be carefully managed and any contaminatedstormwater treated to avoid groundwater contamination prior to its recycling for use orinfiltrartion to groundwater
Due to the potential for high rates of infiltration and low rates of nutrient retention, it isrecommended Phosphorous Retention Index (PRI) testing is undertaken at all point infiltration
4561/24611/02/94089 Oakajee Industrial EstateDistrict Water Management Strategy
structures. Soils with low PRI are generally poor for retaining nutrients such as phosphorousand nitrogen, resulting in direct transfer of these to groundwater. In the event PRI is measuredat < 10, addition of soils with a high PRI such as red clays is recommended at points ofinfiltration.
The above practices together with use of vegetated roadside swales to capture road runoff willensure groundwater levels and groundwater quality are not adversely affected bydevelopments within the OIE. They will be explored in greater detail within Local WaterManagement Strategies and future groundwater investigations.
7.5 Drinking water conservation and efficiency of useAdditional water saving strategies relating to in-house water use and irrigation are discussedbelow:
Potable useUse of potable water should be minimised where water of drinking water quality is not essential,particularly outside buildings.
The State Government has identified demand reduction and efficient use of potable water as apriority. The State Water Plan (Government of Western Australia 2007) sets householdconsumption targets of less than 100 kilolitres per person per year (kL/person/year) forconsumers within Perth of which not more than 40 to 60 kL/person/yr is to be scheme water.
Regional household consumption targets are yet to be reviewed, so application of targets toOakajee is not determined at this stage. Nonetheless, measures to reduce water consumptionshould be encouraged.
It is recommended that only highly rated water efficient appliances and fittings be used withinthe estate. Applying the Water Use in House Code Stage 1 while not specifically targeted atindustrial developments, will assist in reducing consumption of scheme water.
This Code requires all tap fittings other than bath outlets and gardens taps to be a minimum 4stars Water Efficiency Labelling and Standards (WELS), showerhead to be a minimum 3 starsWELS rated and all sanitary flushing systems to be a minimum 4 stars WELS rated dual flush(DoHW 2007).
Water-using products covered by the WELS Scheme and their proposed ratings are set out inTable 12.
Table 12 Specifications for fixtures and fittings
Product Minimum WELS rating
Clothes washing machines 4
Dishwashers 4
4661/24611/02/94089 Oakajee Industrial EstateDistrict Water Management Strategy
Product Minimum WELS rating
Toilet (lavatory) equipment 4
Showers 3
Tap equipment 6
Urinal equipment 3
Landscaping and irrigation efficiency measuresGardens (private and public) and public open space areas should be waterwise in design tominimise irrigation requirements. Low water requirement plants should be predominantly usedand turf areas should be kept to a minimum.
Any POS irrigation should be restricted to the times where wind conditions are low andevaporation is at a minimum.
Landscaping within Oakajee will be largely dryland, but where irrigated landscaping isproposed, water requirements can be reduced by using rain and soil moisture sensors, soilconditioners, wetting agents and mulches
7.6 ResponsibilitiesWith a range of surface water and groundwater management strategies recommended acrossthe OIE, it is important to identify responsibility for implementation of each strategy. Table 13below summarises responsibilities associated with water management within Oakajee.
Table 13 Responsibility of water management
Water Management Implementation Responsibility
Water management outside lot boundaries (road tabledrains)
LandCorp, Shire of ChapmanValley or Main Roads
Water wise landscaping outside lot boundaries LandCorp
Roof and hardstand runoff capture and re-use at the lotscale
Individual Proponent
Construction and management of infiltration structures atthe lot scale
Individual Proponent
Onsite treatment of wastewater Individual Proponent
Offsite wastewater treatment Water Corporation / PrivateInvestors

4761/24611/02/94089 Oakajee Industrial EstateDistrict Water Management Strategy
Supply of offsite potable / non-potable water Water Corporation / Department ofWater

4861/24611/02/94089 Oakajee Industrial EstateDistrict Water Management Strategy
8. Implementation Framework
8.1 Local planningDevelopments commonly progress after the District Planning phase to a Local Structure Plan(LSP), but this is unlikely at Oakajee due to the uncertain nature and timing of development.Consequently, each proponent will be required to prepare cell based Local Water ManagementStrategy (LWMS), incorporating strategies proposed in this DWMS to address various aspectsof water management.
The cell based LWMS documents will define best-practice solutions for water quantity/qualitymanagement, information relating to water use (potable and non-potable), water initiativesincluding the use of recycled water where appropriate, surface water and groundwatermanagement, including best-practice solutions for stormwater quality treatment, and regard forpractices including a secondary sedimentation basin network. Site specific environmentalinformation and any available water monitoring data will be used to select the most appropriateWSUD BMP for local conditions.
The LWMS will need to include, but not be limited to, the following:
Stormwater concept design;
Site water balance;
Land improvement conditioning if and where warranted; and
A contingency action plan and appropriate trigger levels.
8.2 MonitoringTo date there is a good record of both surface and groundwater monitoring at and surroundingthe Oakajee site. Groundwater is at depth and there are no prominent surface water featureswithin the industrial estate. Monitoring undertaken to date is considered sufficient to satisfy therequirements for a minimum 18 months pre-development monitoring. Further monitoring isnonetheless currently occurring.
Continued monitoring is recommended for the site both during construction and postdevelopment to maintain a check on contaminants and on surface water and groundwaterregimes.
A sample pre and post-development monitoring program is presented in Table 14.

4961/24611/02/94089 Oakajee Industrial EstateDistrict Water Management Strategy
Table 14 Monitoring programme summary
Monitoring Sites Frequency Parameters
Surface water Development inflow andoutflow locations
Detention storages inflow andoutflow
Water bodies
Site specific flows and water levels
Monthly grab ofsamples while flowing,to be reviewed after thefirst year of monitoring
In-situ: pH, EC andtemperature.
Unfiltered sample:pH, EC, TN, FRP,TKN, ammonia, TP,heavy metals
Filtered sample:nitrate/nitrite and PO4,
Groundwater Network of monitoring boresproviding a suitable spatialrepresentation of the studyarea inclusive of areas outsidethe site.
Monthly water levels
Quarterly(typically Jan, Apr, July,Oct)
In-situ: pH, EC andtemperature.
Unfiltered sample:pH, EC, TN, FRP,TKN, ammonia, TP,heavy metals
Filtered sample:nitrate/nitrite and PO4
8.3 Requirements for following stagesState planning policy 2.9: water resources (Government of WA, 2006) requires that planningshould contribute to the protection and wise management of water resources through local andregional planning strategies, structure plans, schemes, subdivisions, strata subdivisions anddevelopment applications. Better Urban Water Management (Department of Planning andInfrastructure, Department of Water, Western Australian Local Government Authority andDepartment of Environment, Water, Heritage and the Arts by Essential Environmental Services,2008) provides guidance on implementation of State planning policy 2.9. It identifies therequirements for water management strategies and plans that must be developed toaccompany the land use planning and approvals process in the OIE at each stage of theplanning process.

5061/24611/02/94089 Oakajee Industrial EstateDistrict Water Management Strategy
In summary, all local structure planning should incorporate a LWMS consistent with thestrategies and objectives of this OIE DWMS. Subsequent subdivision applications should beaccompanied by an urban water management plan (UWMP) where required by DoW and theShire of Chapman Valley, and/or should be consistent with any approved local watermanagement strategy and with the strategies and objectives of this DWMS.
Guidelines for LWMS and UWMP documents are available from the DoW website or bycontacting the DoW regional office. Developers are encouraged to contact the DoW and theShire of Chapman Valley early in the planning process to discuss specific water managementrequirements for proposals
8.4 Funding and responsibilities
8.4.1 Funding
Funding for the design and construction of both flood management measures and water qualitymeasures can be sourced from a variety of stakeholders depending on the type of work beingundertaken and the point in time at which the funding is required. For example, swales andbioretention swales form part of the road reserve and are a substitute for structural engineeringpits and pipe networks. They may therefore be funded by the developer of the roadinfrastructure as they are simply an alternative drainage solution and not an addition to what isnormally required.
Maintenance and renewal of bioretention swales and biofiltration pockets will be required afterthe developer’s involvement has concluded, so funding and responsibility for this work will needto be decided in advance.
8.4.2 Responsibilities
The key stakeholders responsible for implementing this DWMS are:
LandCorp;
Department of Water;
Western Australian Planning Commission (WAPC);
Shire of Chapman Valley (SoC);
Main Roads WA; and
Developers.

5161/24611/02/94089 Oakajee Industrial EstateDistrict Water Management Strategy
Table 15 DWMS Implementation and Funding
Stakeholder Responsibilities Funding
LandCorp
(Developer)
Implement environmentalmonitoring program;
Implement DWMS
Coordinate and confirmpreferred water sourceoptions with Department ofWater and Water Corporation
LandCorp
LandCorp
LandCorp
Department of
Water
Finalise DWMP to guidewater source planning andLWMS
Recommend approval ofDWMS by WAPC
Recommend approval ofsubsequent LWMS by WAPC
DoW
N/A
N/A
Western Australian PlanningCommission
Approve DWMS
Approve LWMS
N/A
Shire of Chapman Valley Approve DWMS andsubsequent LWMS’s
N/A
Developers Prepare LWMS/UWMPthrough consultant that willidentify detailed drainagemanagement for eachdevelopment proponent
Continue environmentalmonitoring if recommended
Implement DWMS
Landowners
Landowners
LandCorp / Landowners

5261/24611/02/94089 Oakajee Industrial EstateDistrict Water Management Strategy
8.5 DWMS Technical reviewIt is preferred that this DWMS be reviewed within ten years (or earlier if deemed necessary).
The review should be undertaken by the DoW, with endorsement from the EnvironmentalProtection Agency, Western Australian Planning Commission, Shire of Chapman Valley andthe Water Corporation. The review should cover, but not be limited to the following:
Assessment of impacts of development; and
Design objectives.

5361/24611/02/94089 Oakajee Industrial EstateDistrict Water Management Strategy
9. References
ANZECC & ARMCANZ, 2000. Australian and New Zealand guidelines for fresh and marinewater quality, Australian and New Zealand Environment and Conservation Council &Agriculture and Resource Management Council of Australia and New Zealand, Canberra.
Dames & Moore 1993. Flora & Fauna Assessment: Oakajee Proposed Industrial Site
Department of Health, 2005. Domestic grey water treatment systems accreditation guidelines.Department of Health.
Department of Housing and Works, 2007. 5 Star Plus, Energy Use in House Code, Water Usein House Code. Perth, Western Australia.
Department of Planning 2010. Geraldton Regional Flora and Vegetation Study.
Department of Water, 2004-07. Stormwater management manual for Western Australia, Perth.
Department of Water 2009. Website.
Ecologia 2009. Oakajee Port and Port Terrestrial Stygofauna Assessment. July 2009.
Ecologia 2010a. OPR PER Vegetation and Flora Survey.
Finlayson and Hamilton-Smith 2003. Beneath the Surface: A Natural History of AustralianCaves. UNSW Press, Sydney.
GHD 1993. Oakajee Industrial Park Engineering and Planning Study; prepared for LandCorp.June 1993.
GHD 1998. Oakajee Structure Plan 1997.
GHD 2010. Oakajee Industrial Estate Structure Plan – Draft Engineering Services Report.October 2010.
Government of Western Australia, 2007. State Water Plan [online], available from:<http://portal.water.wa.gov.au/portal/page/portal/PlanningWaterFuture/StateWaterPlan> .
Greenbase EIC 2001. Oakajee Industrial Estate Final Report 2000. Surface Water Study.February 2001.
Jim Davies & Associates 1993. Oakajee Hydrology Report
Jim Davies & Associates 1993. Oakajee Site Hydrogeology: Site Investigation
Koltasz Smith 2007. Shire of Chapman Valley. Coastal Management Strategy. July 2007.
Landcare Services 1998. Oakajee Pipeline Route Flora and Fauna Study: Desktop Review &Field Survey Planning
Mattiske Consulting 2000. Vegetation Monitoring: Oakajee Industrial Estate.

5461/24611/02/94089 Oakajee Industrial EstateDistrict Water Management Strategy
Muir Environmental 1997. Re-Evaluation of Flora and Fauna: Oakajee Proposed IndustrialEstate and Quarries
Muir Environmental 1997. August 1997 Re-Evaluation of Flora & Fauna: Proposed Narngulu toOakajee Railway
MWH 2009. Pilbara Integrated Water Supply – Pre-feasibility Study. Prepared for Departmentof Water.
O’Shea, Jankowski and Sammut 2007. The source of naturally occurring arsenic in a coastalsandy aquifer of eastern Australia. Science of the Total Environment. Vol. 379, no. 2-3 (p 151-166).
Pasons Brinckerhoff 2010. Oakajee Industrial Estate – Stygofauna Qualitative RiskAssessment. September 2010.
Priestley, C.H.B & Taylor, R.J. 1972. On the assessment of surface heat flux and evaporationusing large scale parameters. Monthly Weather Review 100, 81-92.
Quilty Environmental 1998. Oakajee Landscaping and Revegetation Plan.
Rockwater 1996. Oakajee Hydrogeological Investigation. LandCorp 1996.
Rockwater 2000. Oakajee Industrial Park Groundwater and Surface Water Monitoring Results
Rockwater 2001. Oakajee Industrial Park Background Groundwater and Surface WaterMonitoring Results
Rockwater 2003. Oakajee Industrial Park Groundwater Monitoring Results
Shire of Chapman Valley 2000. Town Planning Scheme No. 1, Amendment 18
Shire of Chapman Valley. Town Planning & Development Act 1928
Shire of Chapman Valley. Shire of Chapman Valley Town Planning Scheme No.
Shire of Chapman Valley. Shire of Chapman Valley Local Rural Strategy 2002
Shire of Chapman Valley. Residential Design Codes 2002
Shire of Chapman Valley. Shire of Chapman Valley Town Planning Policies
Welker Environmental Consultancy 1997. Oakajee Limestone Quarry Environmental Review.
Western Australian Planning Commission, 2004. Statement of planning policy No 2.9: waterresources policy, Perth.
Western Australian Planning Commission, 2008. Better Urban Water Management, Perth.
Zhang, L, Dawes, W.R. & Walker, G.R. 1999. Predicting the Effect of Vegetation Changes on aCatchment Average Water Balance. Technical Report 99/12. Cooperative Research Centre forCatchment Hydrology.