OAHHS LEAN WEBINAR OCTOBER 14TH,2014 yoke . Preventing ... t e t 1000 800 600 400 200 0 100 80 60 40...
41
Purdue Research Foundation © 1 OAHHS LEAN WEBINAR OCTOBER 14 TH ,2014
Transcript of OAHHS LEAN WEBINAR OCTOBER 14TH,2014 yoke . Preventing ... t e t 1000 800 600 400 200 0 100 80 60 40...

Purdue Research Foundation© 1
OAHHS LEAN WEBINAR OCTOBER 14TH,2014

Purdue Research Foundation© 2
• A3 Analyze Key Components • Analyze Visual Presentation of TIPs • Multi-Level Pareto Analysis • Questions ?
Overview

Purdue Research Foundation© 3
A3 Analyze Key Components

Purdue Research Foundation© 4
Date: Project Title and Area: Organization:
Authors:
Defin
e M
easu
re
Impr
ove
Cont
rol
Project Y Project charter SIPOCS VOCS (SWOT; Affinity; CTS; Kano) Communication Plan
Pre-
Hoshin Kanri VOCS VSM
Data collection plan Gemba MSA Process flow charts Spaghetti diagrams Scatter plots
Set Goal – “SMART”
Quantifying the waste & variation Visual display of current process
Define the problem
Future State Map Hypothesis Testing Correlation Regression Gap analysis (current/future) Root cause – why gaps exist
Understanding the waste & variation Y = f(x)
Control Plan Visual controls Kan ban 2 bin systems Poke yoke
Preventing recurrence of the waste and variation
Select Project
Removing the waste & variation
Target state Prioritize solutions Impact/Effort Affinity Multi-voting List Reduction
Anal
yze
Pie charts; Bar graphs Control Charts Pareto Process capability (DPMO; Sigma score) Takt time; cycle time
Fishbone; 5 Why Opportunity prioritization Risk/Frequency Affinity diagram Multi-voting/List Reduction families of variation
Team Selection Exec sponsor Process owner
Gantt chart Kaizen newspaper Small tests of change PDCA Quick change-over Cellular layout 5-S
Gantt Chart
Standard Work
Analyze Tools
Purdue Research Foundation© 5
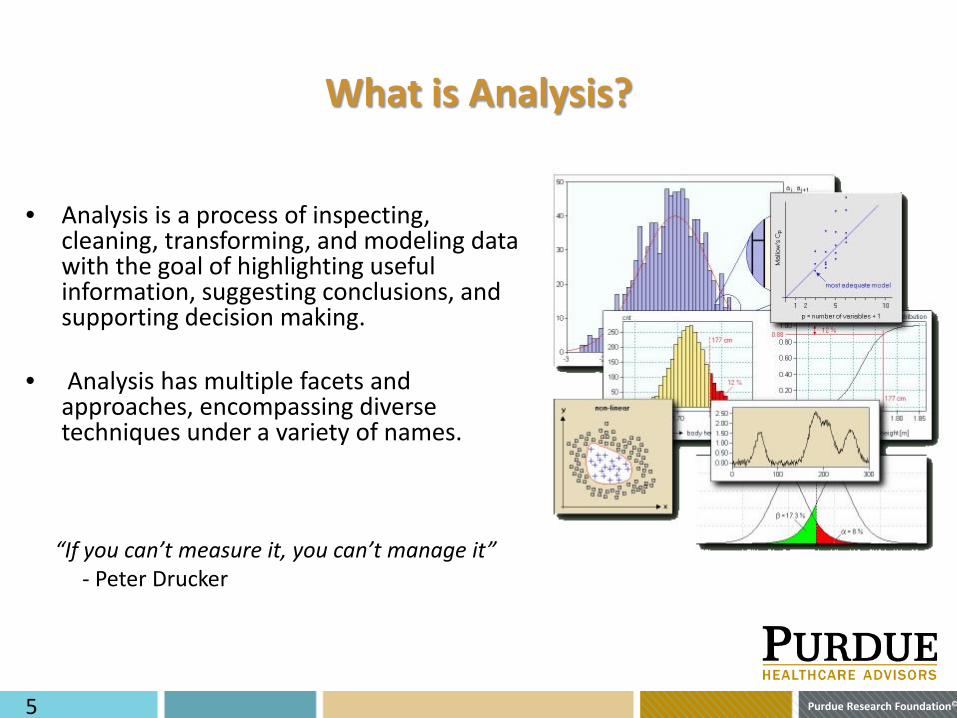
What is Analysis?
• Analysis is a process of inspecting, cleaning, transforming, and modeling data with the goal of highlighting useful information, suggesting conclusions, and supporting decision making.
• Analysis has multiple facets and approaches, encompassing diverse techniques under a variety of names.
“If you can’t measure it, you can’t manage it” - Peter Drucker
Purdue Research Foundation© 6
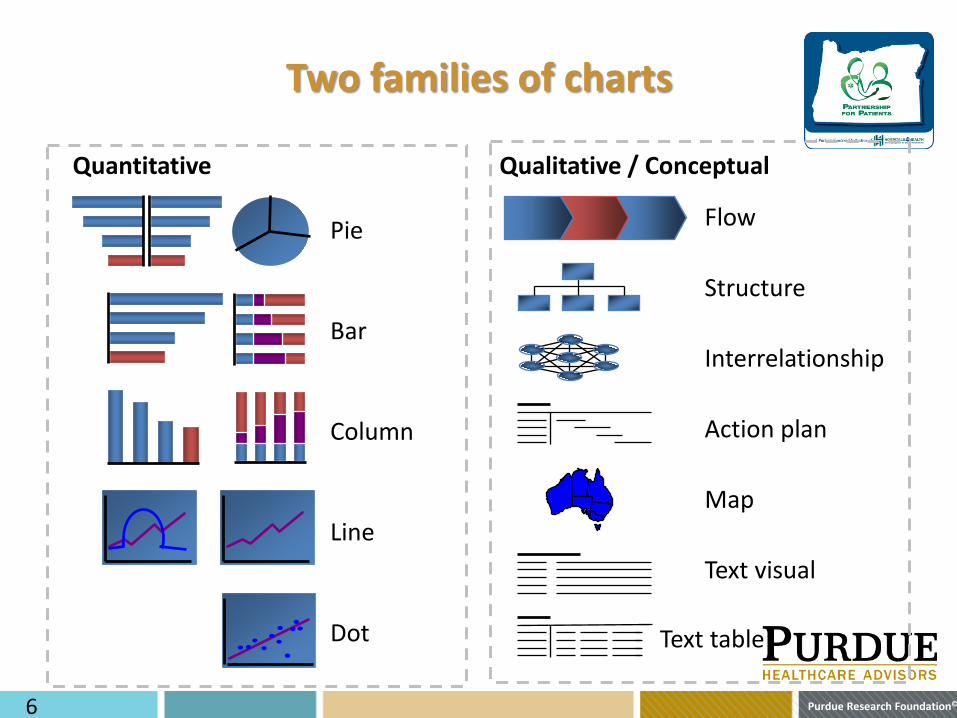
Two families of charts
Quantitative
Pie
Bar
Column
Line
Dot
Qualitative / Conceptual
Flow
Structure
Interrelationship
Action plan
Map
Text visual
Text table

Purdue Research Foundation© 7
Analyze Visual Tips Highlight The “So What”
Purdue Research Foundation© 8
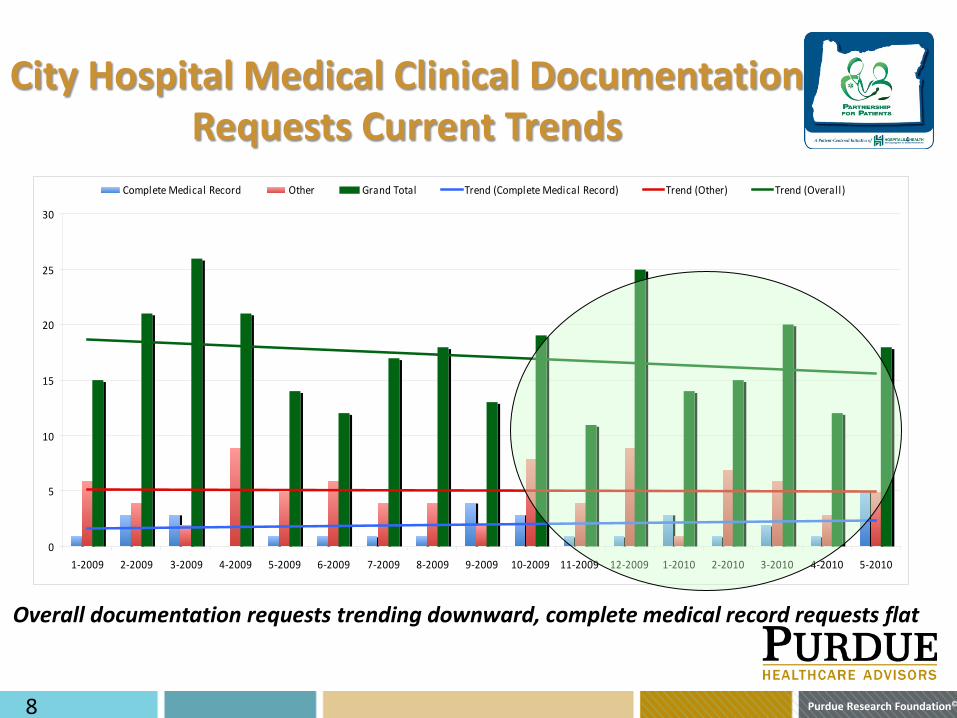
City Hospital Medical Clinical Documentation Requests Current Trends
0
5
10
15
20
25
30
1-2009 2-2009 3-2009 4-2009 5-2009 6-2009 7-2009 8-2009 9-2009 10-2009 11-2009 12-2009 1-2010 2-2010 3-2010 4-2010 5-2010
Complete Medical Record Other Grand Total Trend (Complete Medical Record) Trend (Other) Trend (Overall)
Overall documentation requests trending downward, complete medical record requests flat
0.00%
10.00%
20.00%
30.00%
40.00%
50.00%
60.00%
70.00%
80.00%
90.00%
100.00%
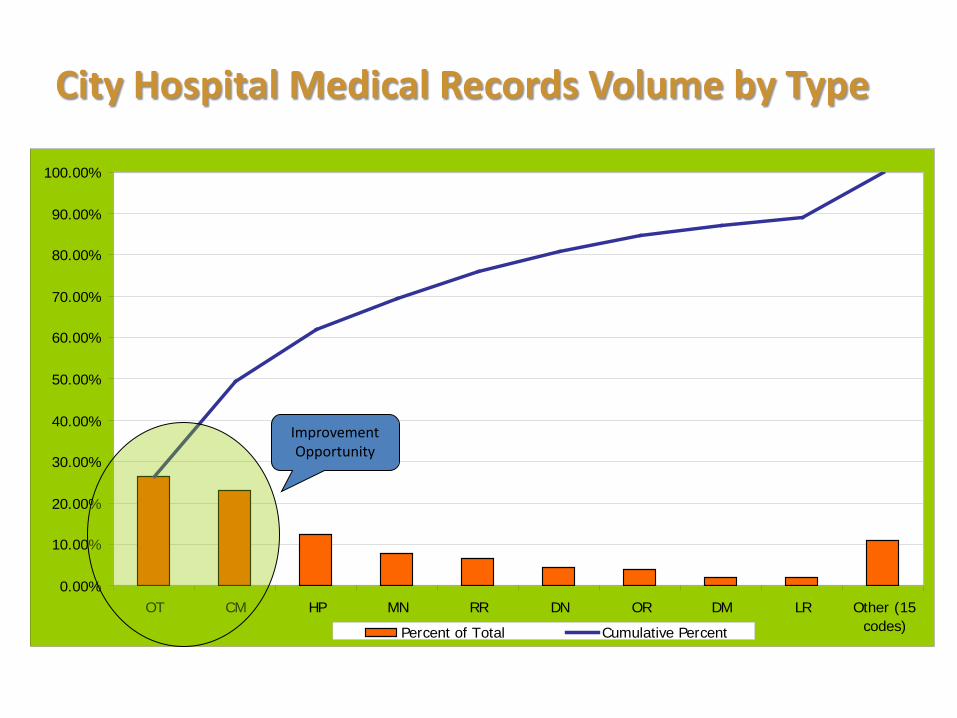
OT CM HP MN RR DN OR DM LR Other (15codes)Percent of Total Cumulative Percent
Improvement Opportunity
City Hospital Medical Records Volume by Type
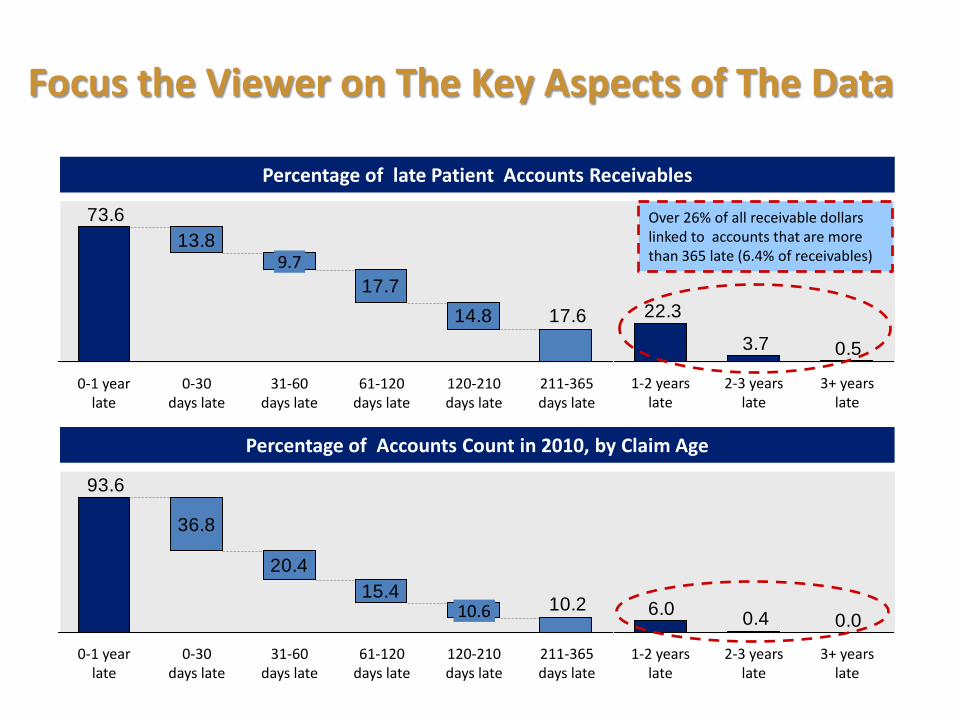
13.8
17.714.8 17.6
73.6
211-365 days late
120-210 days late
61-120 days late
31-60 days late
9.7
0-30 days late
0-1 year late
0.53.7
22.3
3+ years late
2-3 years late
1-2 years late
Percentage of late Patient Accounts Receivables
36.8
20.415.4
10.2
93.6
211-365 days late
120-210 days late
10.6
61-120 days late
31-60 days late
0-30 days late
0-1 year late
Percentage of Accounts Count in 2010, by Claim Age
0.00.46.0
3+ years late
2-3 years late
1-2 years late
Over 26% of all receivable dollars linked to accounts that are more than 365 late (6.4% of receivables)
Focus the Viewer on The Key Aspects of The Data
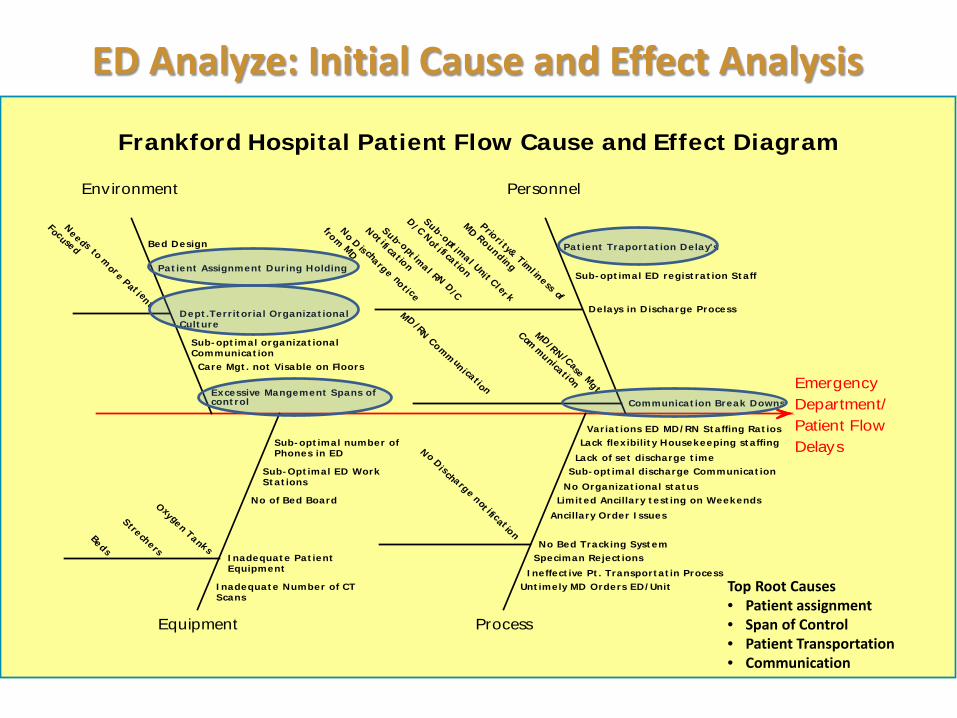
EmergencyDepartment/Patient FlowDelays
Equipment
Environment
Process
Personnel
Communication Break Downs
Delays in Discharge Process
Sub-optimal ED registration Staff
Patient Traportation Delay's
Variations ED MD/RN Staffing RatiosLack flexibility Housekeeping staffing
Lack of set discharge timeSub-optimal discharge Communication
No Organizational statusLimited Ancillary testing on Weekends
Ancillary Order Issues
No Bed Tracking SystemSpeciman Rejections
Ineffective Pt. Transportatin ProcessUntimely MD Orders ED/Unit
Excessive Mangement Spans ofcontrol
Care Mgt. not Visable on Floors
Sub-optimal organizationalCommunication
Dept.Territorial OrganizationalCulture
Patient Assignment During Holding
Bed Design
Sub-optimal number ofPhones in ED
Sub-Optimal ED WorkStations
No of Bed Board
Inadequate PatientEquipment
Inadequate Number of CTScans
Priori ty& Timl iness of
MD Rounding
Sub-optimal Uni t Cl er k
D/C Noti fi cation
Sub-opt imal RN D/C
Not ifi cation
No D is charge noti ce
from MD
MD/RN/Case Mgt
Communicati on
MD/RN Comm uni cation
No Di scharge not ifi cation
Needs to more Pati ent
Focused
Oxygen Tanks
StrechersBeds
Frankford Hospital Patient Flow Cause and Effect Diagram
Top Root Causes • Patient assignment • Span of Control • Patient Transportation • Communication
ED Analyze: Initial Cause and Effect Analysis

Purdue Research Foundation© 12
Pareto Analysis “Key Considerations”
Purdue Research Foundation© 13
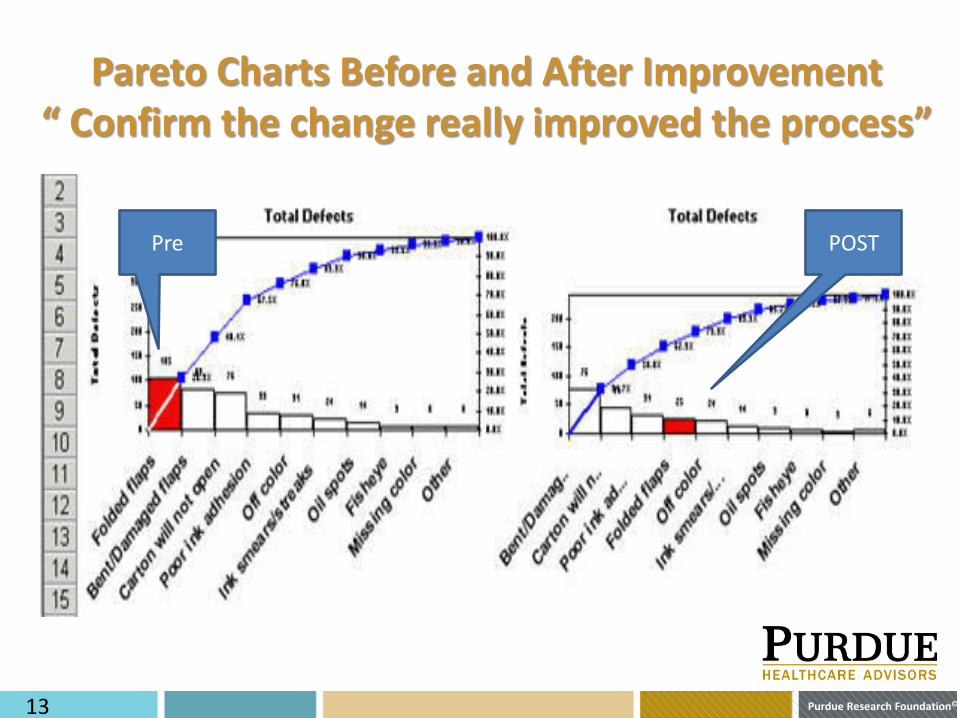
Pre POST
Pareto Charts Before and After Improvement “ Confirm the change really improved the process”

Purdue Research Foundation© 14
“It May take two or more pareto charts to narrow the focus to an actionable level”

Purdue Research Foundation© 15
Count 300 250 200 150 100Percent 30.0 25.0 20.0 15.0 10.0Cum % 30.0 55.0 75.0 90.0 100.0
Num
ber
of P
atie
nts
Perc
ent
Reason for Re-admission
Missed
follow
-up
appo
intmen
t s
Weig
ht Lo
ss
No D
/C In
st ruc
tions
MED n
on-co
mplian
ce
No IP
T Prot
ocol
as In
pat ie
nt
1000
800
600
400
200
0
100
80
60
40
20
0
St.Stanton HF Patients Re-admitted W/N 30 days Reason
Level 1 Pareto

Purdue Research Foundation© 16
Count 100 80 50 40 30Percent 33.3 26.7 16.7 13.3 10.0Cum % 33.3 60.0 76.7 90.0 100.0
Num
ber
of P
atie
nts
Perc
ent
Inpatient Unit 4 South4 North2 SouthICU3 East
300
250
200
150
100
50
0
100
80
60
40
20
0
St. Stanton Heart Failure Patients with No Inpatient Protocol
Level 2 Pareto
Purdue Research Foundation© 17
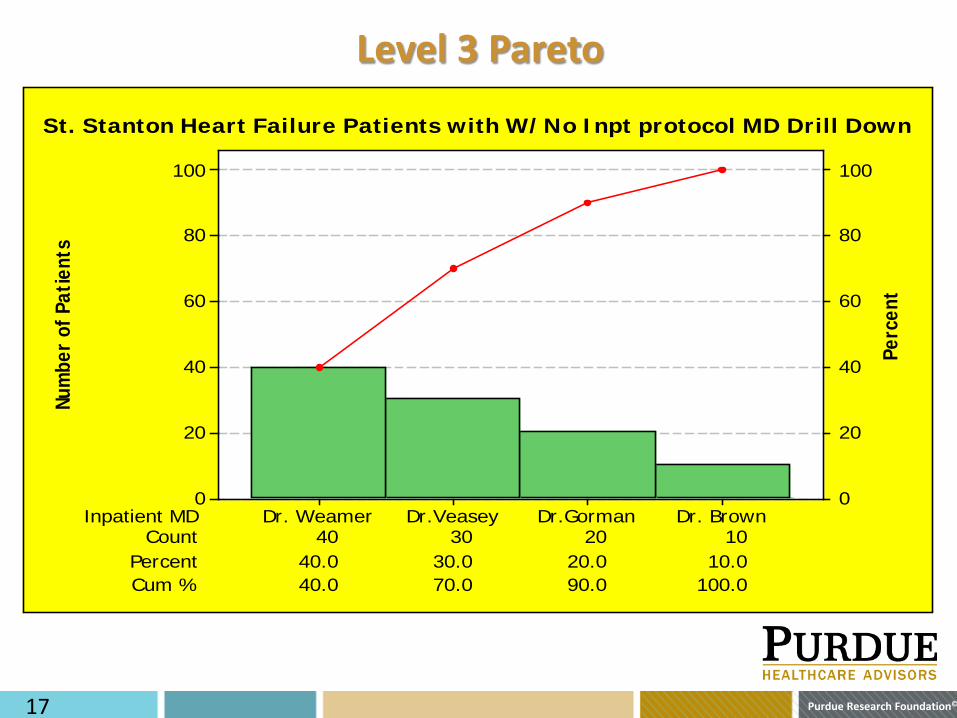
Count 40 30 20 10Percent 40.0 30.0 20.0 10.0Cum % 40.0 70.0 90.0 100.0
Num
ber
of P
atie
nts
Perc
ent
Inpatient MD Dr. BrownDr.GormanDr.VeaseyDr. Weamer
100
80
60
40
20
0
100
80
60
40
20
0
St. Stanton Heart Failure Patients with W/No Inpt protocol MD Drill Down
Level 3 Pareto
Purdue Research Foundation© 18
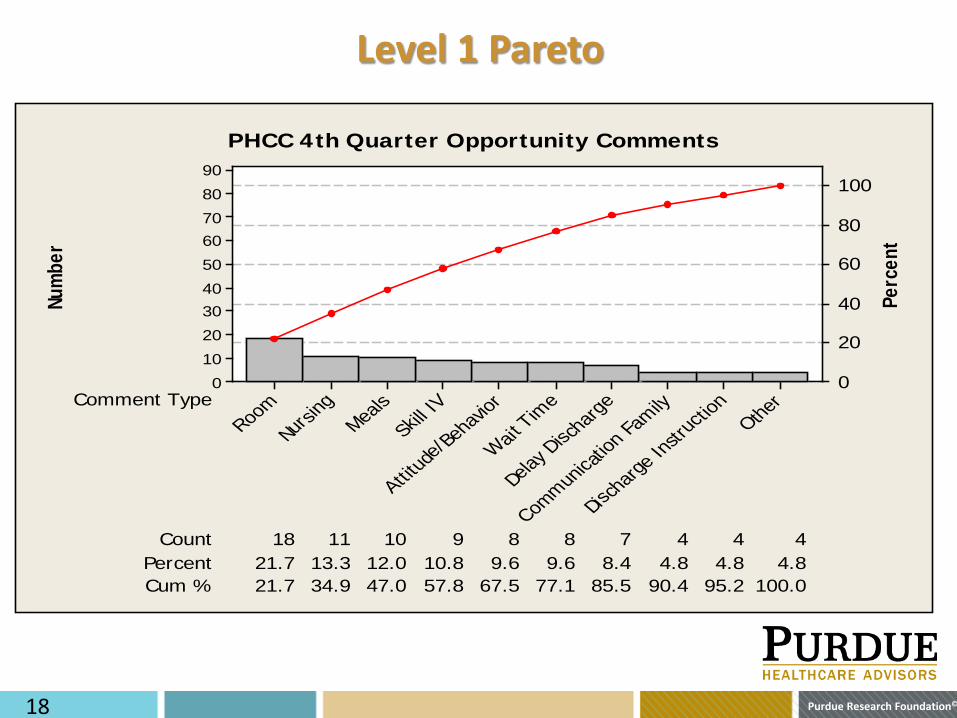
Num
ber
Perc
ent
Comment Type
Count 4 4Percent 21.7 13.3 12.0 10.8 9.6 9.6 8.4
184.8 4.8 4.8
Cum % 21.7 34.9 47.0 57.8 67.5 77.1
11
85.5 90.4 95.2 100.0
10 9 8 8 7 4
Other
Disch
arge
Instr
uctio
n
Commun
icatio
n Fam
ily
Delay
Disc
harg
e
Wait T
ime
Attitud
e/Beh
avior
Skill
IVMea
ls
Nursi
ngRoo
m
90
80
7060
50
4030
20
10
0
100
80
60
40
20
0
PHCC 4th Quarter Opportunity Comments
Level 1 Pareto

Purdue Research Foundation© 19
Num
ber
Perc
ent
Comment TypeCount
16.7Cum % 50.0 66.7 83.3 100.0
9 3 3 3Percent 50.0 16.7 16.7
TempCleanlinessCall LightTV Malfunction
20
15
10
5
0
100
80
60
40
20
0
PHCC 4th QTR Opportunity Comments RM Drill Down
Level 2 Pareto

Purdue Research Foundation© 20
Date: Project Title and Area: Organization:
Authors:
Defin
e M
easu
re
Impr
ove
Cont
rol
Pre-
Set Goal – “SMART”
Define the problem
Understanding the waste & variation
Preventing recurrence of the waste and variation
Select Project
Removing the waste & variation
Anal
yze
What x’s and processes were measured to understand the stated problem?
Why this problem?
How does this project move the organization to its goals?
Quantifying the waste & variation
1. Business case has been explained 2. Problem statement in measureable terms 3. Data provided to describe the problem 4. Performance gap is described 5. Metrics are specified
1. Current state performance is described 2. Visual representation of process is shown 3. Data describing problem/process is provided 4. Project objectives/goals are specified
1. Proposed changes are specified 2. Visual representation of Target State is shown 3. Implementation plan is detailed 4. Results of Implementation are specified 5. Spread is in Implementation Plan if applicable
1. Primary obstacles and barriers are specified 2. Root causes are specified 3. Method of identifying root causes is shown 4. Goals regarding root causes are shown
1. Process owner is specified 2. Plans for follow up monitoring is detailed
Purdue Research Foundation© 21
Anthony Veasey, MA,CPHQ , LSSBB | Senior Advisor – Lean Six Sigma
708-790-5541 (office) | 708-790-5541 (mobile) | [email protected]
Purdue Healthcare Advisors | Purdue University
Purdue Research Foundation© 22
LEAN HEALTHCARE: “HAC” Project
Sky Lakes Medical Center
Purdue Research Foundation© 23
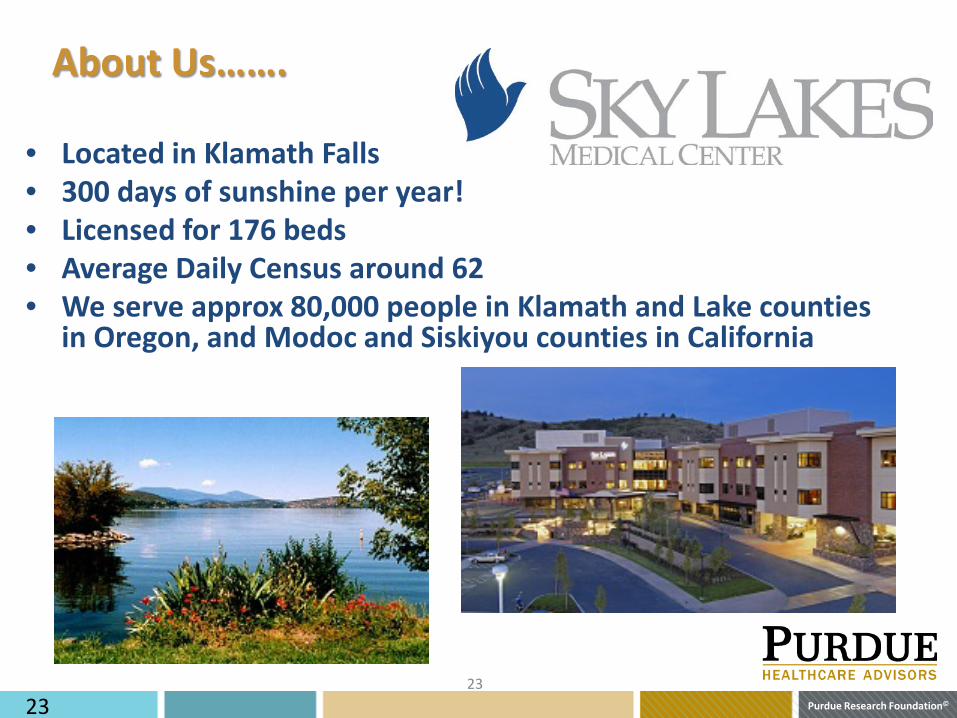
About Us…….
• Located in Klamath Falls • 300 days of sunshine per year! • Licensed for 176 beds • Average Daily Census around 62 • We serve approx 80,000 people in Klamath and Lake counties
in Oregon, and Modoc and Siskiyou counties in California
23

Purdue Research Foundation© 24
Our Lean Project
Bedside Report…..
Is the time when responsibility and accountability for the care of a patient is transferred from one nurse to another.
Journal of Perinatal and Neonatal Nursing December 2010

Purdue Research Foundation© 25
Bedside Report Project Team • Jeremy Westover RN Quality • Claire Jambalos RN front-line Post-Surgical • Sarah Freitas RN front-line Post-Surgical • Tiffani Boehnen RN front-line Post-Surgical • Shannon Mason RN front-line PCU • Karen Wright Doty RN front-line PCU • Chantry Forney RN front line Post-Surgical • Sabrina De Vall RN front-line Medical • Stacey Mathis RN front-line Emergency Department • Christie Wiles RN Unit manager PCU/Medical • Justin Jannicelli RN Unit manager Post-Surgical • Katie Singleton RN Nursing Education • Cindy Neubauer RN Director Nursing education
8 front-line nurses! (even a few naysayers)
Purdue Research Foundation© 26
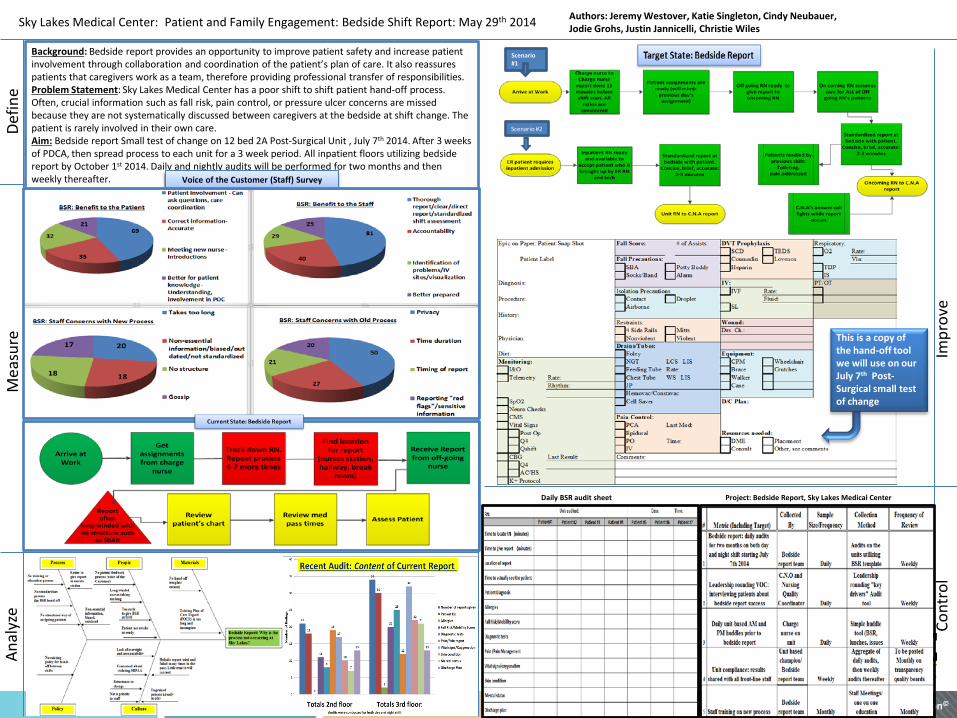
Sky Lakes Medical Center: Patient and Family Engagement: Bedside Shift Report: May 29th 2014 Authors: Jeremy Westover, Katie Singleton, Cindy Neubauer, Jodie Grohs, Justin Jannicelli, Christie Wiles
Defin
e M
easu
re
Anal
yze
Impr
ove
Cont
rol
Background: Bedside report provides an opportunity to improve patient safety and increase patient involvement through collaboration and coordination of the patient’s plan of care. It also reassures patients that caregivers work as a team, therefore providing professional transfer of responsibilities. Problem Statement: Sky Lakes Medical Center has a poor shift to shift patient hand-off process. Often, crucial information such as fall risk, pain control, or pressure ulcer concerns are missed because they are not systematically discussed between caregivers at the bedside at shift change. The patient is rarely involved in their own care. Aim: Bedside report Small test of change on 12 bed 2A Post-Surgical Unit , July 7th 2014. After 3 weeks of PDCA, then spread process to each unit for a 3 week period. All inpatient floors utilizing bedside report by October 1st 2014. Daily and nightly audits will be performed for two months and then weekly thereafter. Voice of the Customer (Staff) Survey
This is a copy of the hand-off tool we will use on our July 7th Post-Surgical small test of change
Project: Bedside Report, Sky Lakes Medical Center
Daily BSR audit sheet
Scenario #1
Scenario #2

Purdue Research Foundation© 27
Define
• No early interaction with patient
• No formal introduction of oncoming staff
• No confirmation of details or concerns from the patient
• No discussion of goals, discharge plan, tests or procedures with patient
• No standardization in quality or consistency of report
• Propagation of bias at the nurses station outside of earshot of the patient (“crazy, drug seeker”, etc).
Why we chose bedside report…The problem:

Purdue Research Foundation© 28
Define
• Improving patient safety and quality • Improving the hand-off communication process • Improving time management (reducing OT) • Improving accountability between nurses • Increasing staff satisfaction with hand-offs • 100% compliance with the new process
Our Aim….
We began with a small test of change on a 12 bed Post-Surgical Unit on July 7th 2014 with the goal of:

Purdue Research Foundation© 29
Measure
Prior to bedside report…

Purdue Research Foundation© 30
Measure
• Sub-point one – content. • Sub-point two – content.
Voice of the Customer (staff)
Top Responses
BSR: Staff concerns with old process BSR: Staff concerns with new process
BSR: Benefit to the patient BSR: Benefit to the staff
Purdue Research Foundation© 31
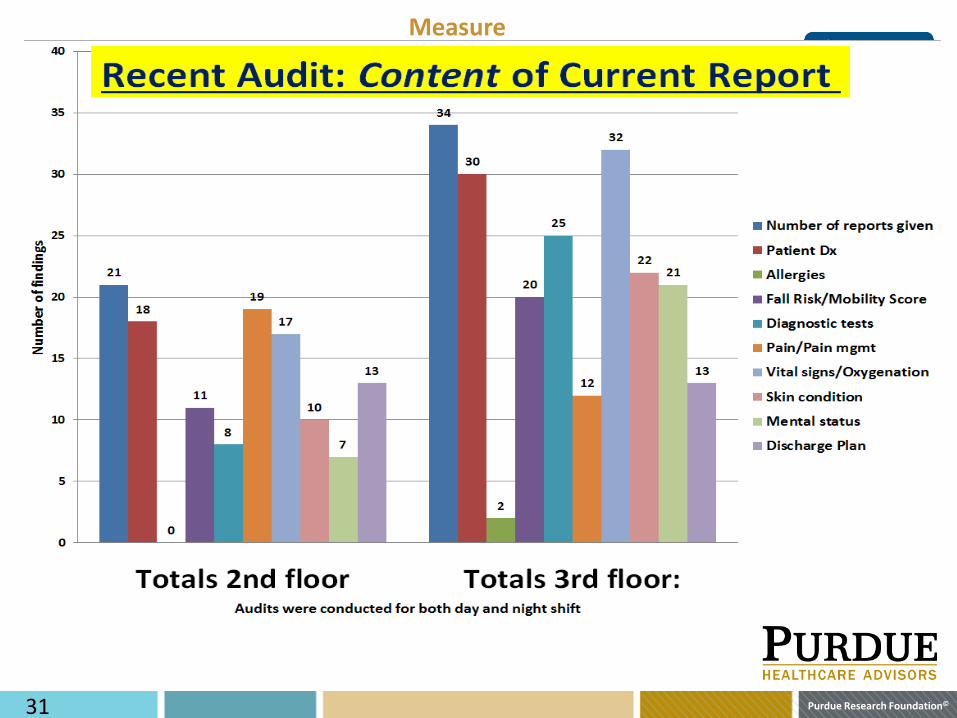
Analyze
Measure

Purdue Research Foundation© 32
Analyze
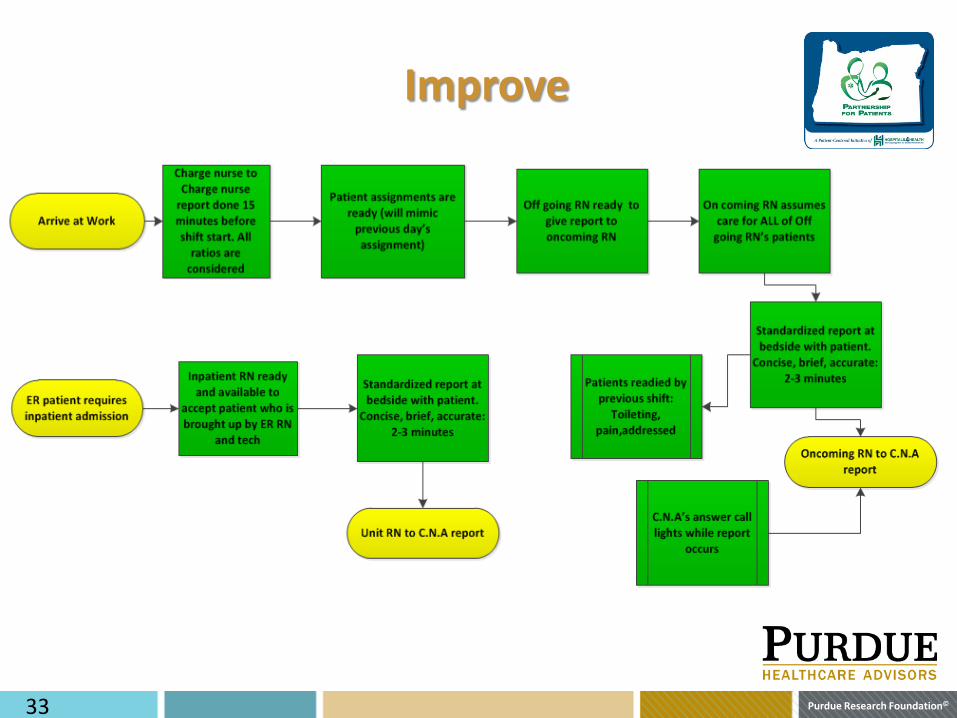
Purdue Research Foundation© 33
Improve
• Sub-point one – content. • Sub-point two – content.
Main point

Purdue Research Foundation© 34
Going to the Gemba
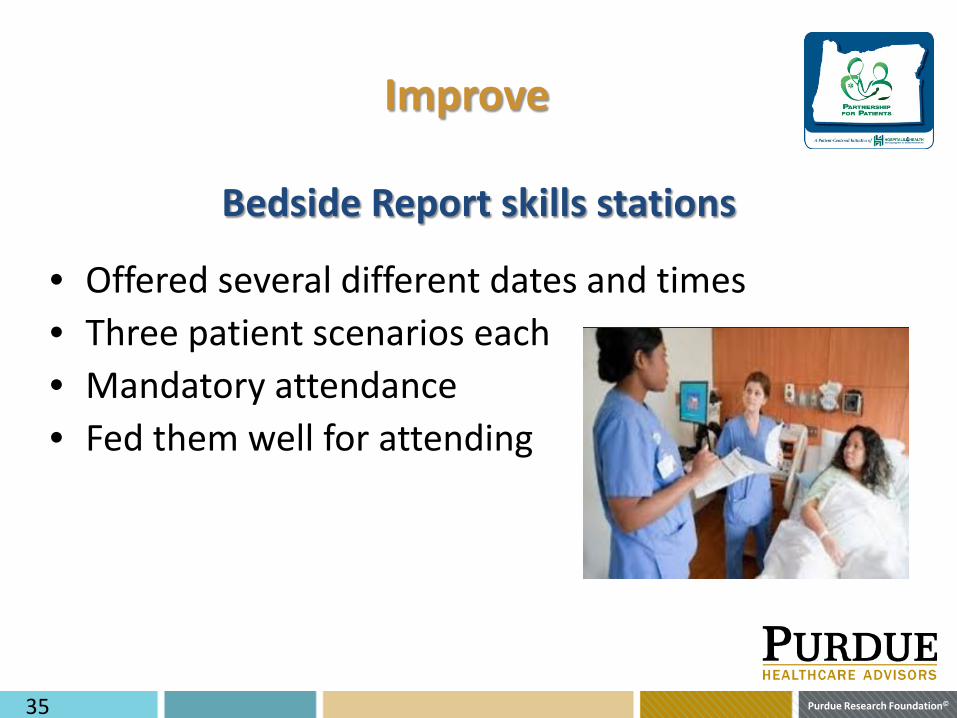
Purdue Research Foundation© 35
Bedside Report skills stations • Offered several different dates and times
• Three patient scenarios each • Mandatory attendance • Fed them well for attending
Improve

Purdue Research Foundation© 36
Two weeks of auditing per department,
random thereafter

Purdue Research Foundation© 37

Purdue Research Foundation© 38
Control (Sustainability/Spread)
• AM and PM weekly random shift audits • Bedside Report Team meets weekly

Purdue Research Foundation© 39
Advice to Others & Lessons Learned
• Front-line involvement every step! • Go visit a hospital that does it really well • Regular updates to staff on successes and opportunities • Don’t discount your naysayers for the BSR team (they
can change and others will follow) • Meet regularly (monthly is not enough) • Give out lots of food tied to BSR efforts • Incorporate a unit huddle just before BSR • Random Audits for the rest of your life
Purdue Research Foundation© 40
Contact Information
Jeremy Westover RN Nursing Quality Coordinator Sky Lakes Medical Center Klamath Falls, Oregon 541-274-2961 [email protected]

Purdue Research Foundation© 41
QUESTIONS?