O, CH - ipmet.unesp.br · Abstract The micro-SDLA balloonborne diode laser spectrometer was own...
17
Atmos. Chem. Phys. Discuss., 6, 12469–12501, 2006 www.atmos-chem-phys-discuss.net/6/12469/2006/ © Author(s) 2006. This work is licensed under a Creative Commons License. Atmospheric Chemistry and Physics Discussions Isentropic advection and convective lifting of water vapor in the UT – LS as observed over Brazil (22 ◦ S) in February 2004 by in situ high-resolution measurements of H 2 O, CH 4 ,O 3 and temperature G. Durry 1,2 , N. Huret 3 , A. Hauchecorne 1 , V. Marecal 3 , J.-P. Pommereau 1 , R. L. Jones 4 , G. Held 5 , N. Larsen 6 , and J.-B. Renard 3 1 Service d’A ´ eronomie, CNRS and Institut Pierre Simon Laplace, Route des Gatines, Verri` ere le Buisson cedex, 91371, France 2 Groupe de Spectroscopie Mol ´ eculaire et Atmosph ´ erique, CNRS and Universit´ e de Reims, Moulin de la Housse, B.P. 1039, 51687 Reims Cedex, France 3 Laboratoire de Physique et Chimie de l’Environnement, CNRS and Universit´ e d’Orl ´ eans, 3A Avenue de la Recherche Scientifique, 45071 Orl´ eans cedex 2, France 4 Center for Atmospheric Science, University Chemical Laboratory, University of Cambridge, Lensfield Road, Cambridge, CB2 1EW, UK 12469 5 Instituto de Pesquisas Meteorologicas, Universidade Estadual Paulista, CX Postal, 281 17015 – 970 BAURU, S.P., Brasil 6 Danish Meteorological Institute, Lyngbyvej 100, 2100Kbh, Denmark Received: 9 November 2006 – Accepted: 28 November 2006 – Published: 4 December 2006 Correspondence to: G. Durry ([email protected]) 12470
Transcript of O, CH - ipmet.unesp.br · Abstract The micro-SDLA balloonborne diode laser spectrometer was own...

Atmos. Chem. Phys. Discuss., 6, 12469–12501, 2006www.atmos-chem-phys-discuss.net/6/12469/2006/© Author(s) 2006. This work is licensedunder a Creative Commons License.
AtmosphericChemistry
and PhysicsDiscussions
Isentropic advection and convectivelifting of water vapor in the UT – LS asobserved over Brazil (22◦ S) in February2004 by in situ high-resolutionmeasurements of H2O, CH4, O3 andtemperatureG. Durry1,2, N. Huret3, A. Hauchecorne1, V. Marecal3, J.-P. Pommereau1,R. L. Jones4, G. Held5, N. Larsen6, and J.-B. Renard3
1Service d’Aeronomie, CNRS and Institut Pierre Simon Laplace, Route des Gatines, Verrierele Buisson cedex, 91371, France2Groupe de Spectroscopie Moleculaire et Atmospherique, CNRS and Universite de Reims,Moulin de la Housse, B.P. 1039, 51687 Reims Cedex, France3Laboratoire de Physique et Chimie de l’Environnement, CNRS and Universite d’Orleans, 3AAvenue de la Recherche Scientifique, 45071 Orleans cedex 2, France4Center for Atmospheric Science, University Chemical Laboratory, University of Cambridge,Lensfield Road, Cambridge, CB2 1EW, UK
12469
5Instituto de Pesquisas Meteorologicas, Universidade Estadual Paulista, CX Postal, 281 17015– 970 BAURU, S.P., Brasil6Danish Meteorological Institute, Lyngbyvej 100, 2100Kbh, Denmark
Received: 9 November 2006 – Accepted: 28 November 2006 – Published: 4 December 2006
Correspondence to: G. Durry ([email protected])
12470

Abstract
The micro-SDLA balloonborne diode laser spectrometer was flown twice from Bauru(22◦ S, Brazil) in February 2004 during HIBISCUS to yield in situ H2O measurementsin the Upper Troposphere (UT) and Lower Stratosphere (LS) and in particular in theTropical Tropopause Layer (TTL). The overall TTL was found warmer (with a subsat-5
urated cold point near –79◦C) and the LS moister compared to former measurementsobtained in tropical oceanic conditions. The use of specific balloons with a slow de-scent, combined with the high-resolution of the laser sensor, allowed us to observein situ in the UT, the TTL and the LS several thin layers correlated on H2O, CH4, O3,temperature and PV. A component of these layers is associated with the isentropic10
transport into the UT- LS of extratropical stratospheric air masses. Moreover, the ex-amination of temperature and tracer (CH4, O3) profiles gives insights on the potentialcontribution of convective transport of H2O in the TTL.
1 Introduction
It is widely accepted that there is a subtropical dynamical barrier, which prevents trans-15
port into the tropical tropopause, identified by strong gradients of potential vorticity(PV) and chemical species (Polvani et al., 1995; Holton et al., 1995; Hall and Waugh,1997; Haynes and Shuckburgh, 2000). Nevertheless, the subtropical Rossby wave-breaking processes can cause the transport of tongues of extratropical air through thisdynamical barrier deep into the tropics (Plumb, 1996 ; Horinouchi, 2000). The obser-20
vation in the tropical upper troposphere of such intrusion events has previously beendiscussed in the literature. For instance, Scott et al. (2001) have investigated, over thesouthern tropical Atlantic, subtropical intrusions in the tropical upper troposphere andtheir impact on H2O and O3, by examining ozone from the Measurements of Ozoneby Airbus In-Service Aircraft (MOZAIC) program in conjunction with PV-advection and25
meso-scale models. They have suggested that these intrusions due to Rossby wave
12471
breakings may have an impact on the distribution of tracers in the tropical upper tro-posphere and a significant contribution to the exchange of air between tropical andextratropical regions. The investigation of the vertical extension of such subtropical in-trusions was made by Waugh and Funatsu (2003) by using ozone from TOMS and 20-years of NCEP-NCAR PV-data over the northern tropical Pacific. They have suggested5
that intrusions events could potentially affect the tropical tropopause layer (TTL) andthe lower stratosphere, as well as the upper troposphere. In particular, they indicatedthat the impact on H2O in the TTL and the tropical lower stratosphere (LS) needed tobe further investigated. Note that in the present study, UT will refer to the part of theupper troposphere located below the TTL. An other open issue is the effect of such sub-10
tropical intrusions on deep convection (Kiladis and Weickmannn, 1992; Kiladis, 1998;Matthews and Kiladis, 1999). Indeed, the anomalous PV in the intruding tongue of ex-tratropical air could produce a region of ascent and of reduced static stability, initiatingthereby convection. Kiladis (1998) suggested that the diabatic heating associated withconvection may play a role in the weakening of the PV-anomaly. Hence the intrusion15
would generate convection which could conversely cause its erosion and the mixing oftropical and extra-tropical air. Therefore, Waugh and Funatsu (2003) recommended intheir study that further investigations on transport and on convection associated withintrusion events be combined.
The micro-SDLA balloonborne diode laser spectrometer was flown twice during the20
HIBISCUS field campaign (Pommereau et al., 20061) to provide in situ high-resolutionH2O measurements in the UT-LS. The data were recorded near Bauru (22.4◦ S, 49◦ W)in Brazil during the wet season, in February 2004. In contrast to most previous studieson tropical H2O in the UT and TTL (Jensen et al., 2005; Tuck et al., 2004; Vomel etal., 2002; Weinstock et al., 1995; Richard et al., 2006), the HIBISCUS measurements25
were performed over a continental region instead of a maritime one. Continental re-gions and in particular South America are favorable to the development of very deep
1Pommereau, J.-P., Garnier, A., Held, G., and the Hibiscus team: An overview of the HIBIS-CUS campaign, Atmos. Chem. Phys. Discuss., in preparation, 2006.
12472

convective events as shown by Liu and Zipser (2005) from TRMM (Tropical RainfallMeasuring Mission) observations. The micro-SDLA was flown over a continental con-vective region located within or in the vicinity of the South Atlantic Convergence Zone(SACZ) in the summer. In the present paper, we examine these high-resolution H2Omeasurements using temperature profiles and tracer data (CH4 and O3), as well as PV5
from a high-resolution PV-advection model. This is done with the purpose of identifyingthe respective signatures of isentropic and convective processes affecting H2O in theUT-LS. In Huret et al. (2006)2 we use a meso-scale modeling approach with a sufficientvertical resolution and based on local meteorology to further investigate the impact ofconvection on H2O in the TTL.10
In Sect. 2, we describe the micro-SDLA instrument. In Sect. 3, we define the TTLextension for both flights and report the H2O, CH4and O3 data in the UT, TTL andLS. Finally, we will discuss in Sect. 4 the data in the UT-LS by examining the tracermeasurements and the PV-maps from the PV-advection model.
2 Instrumental15
The micro-SDLA sensor is a balloon borne diode laser spectrometer devoted to thein situ monitoring of H2O, CH4 and CO2 in the UT-LS by infrared absorption spec-troscopy (Durry et al., 2004). Figure 1 is a picture of the sensor during the HIBIS-CUS campaign in Brazil in February 2004. With the micro-SDLA, three near-infraredtelecommunication-type InGaAs laser diodes are connected by means of optical fibers20
to a two-mirrors multipass optical cell operated open to the atmosphere that provides a28 m absorption path length (Durry et al., 2002a). The laser beams are absorbed in situby the ambient CH4, CO2 and H2O molecules as it is reflected back and forth between
2Huret, N., Durry G., Freitas S., et al.: In situ laser diode measurements of H2O duringHIBISCUS: investigation of convective event impact on H2O distribution in the TTL by a meso-scale model, Atmos. Chem. Phys. Discuss., in preparation, 2006b.
12473
the mirrors of the optical cell. In situ absorption spectra of CH4 in the 1.65-micron re-gion, CO2 in the 1.60-micron and H2O in the 1.39-micron region are recorded at thecell output using a differential detection technique (Durry et al., 2000). By combiningthe direct-differential detection with an adequate selection of the H2O rotation-vibrationtransitions scanned over by the laser, the achieved dynamical range of the measure-5
ments is of four orders of magnitude, which permits a continuous probing of H2O in boththe troposphere and the LS (Durry and Megie, 2000). The H2O used transitions andtheir associated spectroscopy are described in Durry et al. (2005). The Beer Lambertlaw is then applied to relate the absorption of laser energy to the molecular concen-tration. In practice, the molecular mixing ratio is retrieved from the absorption spectra10
using a non-linear least-squares fit to the full molecular line shape in conjunction withonboard in situ atmospheric pressure and temperature measurements and by use of amolecular model (Durry and Megie, 1999). The achieved inaccuracy in the H2O andCH4 concentration measurements is of 5% in the UT-LS, altitude region, which is stud-ied in this paper, for an average measurement time of 160 ms (co-addition of twenty15
8-ms laser scans). More details on the used balloon borne laser probing techniqueused for H2O and CH4, the concentration retrieval and the various sources of errorsare given in Durry and Megie (1999) and Durry et al. (2002b).
The micro-SDLA sensor was flown twice from Bauru (22◦ S, 49◦ W). The objectivewas to probe in situ the UT-LS and in particular the TTL at high-resolution. Small open20
stratospheric balloons inflated with 3000 m3 of helium were used, which provided a floataltitude near 21 km. The H2O data in the stratosphere and the tropopause were takenduring the descent of the instrument to prevent the contamination of the measurementsby water vapor outgassing from the balloon envelope (Durry and Megie, 2000). As novalve was available with the small balloons, the slow descent in the TTL was achieved25
using a transition from day to night (i.e., the balloon temperature decreases at sunsetand the balloons starts a slow descent). The UT-LS was hence probed at a mean de-scent speed near 1.5 m s−1 during nighttime. The measurements in the tropospherewere taken during the final descent after cut-down under parachutes. For the first flight,
12474

additional H2O measurements were also taken during the ascent in the troposphere.The micro-SDLA was flown without telemetry the data being recorded on-board andprocessed after the recovery of the gondola. For this study focused on the TTL tran-sition layer and the UT, we will make use of the micro-SDLA data in the altitude rangefrom 9 km to 18.5 km. A further discussion of the H2O data in the LS, near the flight5
ceiling, is made in the paper by Nielsen et al. (2006).
3 Observations
The micro-SDLA was flown twice during the 2004 HIBISCUS field campaign. Anoverview of the overall HIBISCUS campaign can be found in the paper by Pommereauet al. (2006)1. The first flight, called “SF2”, which stands for “Short duration Flight 2”,10
took place on 13 February 2004 with a launch at 20:18 UT. The second flight, called“SF4” took place on 24 February 2004, with a launch time at 20:03 UT. At the balloonlaunch site, a meteorological S-band Doppler radar, operated by the IPMet (Instituto dePesquisas Meteorologicas), was providing real-time observations of precipitation withina 450 km range.15
3.1 Brief overview of the meteorological situations
During the flight period, in February 2004, the rainfall anomaly was positive in most partof Brazil. The eastward propagation of intra-seasonal atmospheric oscillations, ema-nating from the Indian and Pacific Oceans, continued to induce convective activity overBrazil. The frontal systems rapidly advanced over southern Brazil and became station-20
ary over the Southeast Brazil region, establishing two episodes of convection in theBauru region associated to the South Atlantic Convergence Zone (SACZ). The SACZproduces an elongated band of high convective activity emanating from the Amazonbasin and running southeastwards into the South Atlantic Ocean, typical in summerover the South American continent.25
12475
The two flights took place in different meteorological conditions. On the synopticscale, the flight of SF2 took place under diminishing influence of a high pressure sys-tem at the surface and the 200 hPa divergence slowly advancing southwards fromNortheast Brazil, resulting in unstable conditions over most of the State of Sao Paulo.During the afternoon of 13 February 2004, the Bauru radar observed moderate con-5
vective activity within the 240 km radar range. At the time of the launch of SF2, thenearest storm was about 60–70 km south-east of the Bauru radar, but remained moreor less stationary and at no stage did it impact on the flight trajectory (Fig. 2b, left).However, at the same time, the radar in Presidente Prudente, 240 km west-north-westof Bauru, showed a large area of instability (echo tops up to 16 km–17 km) moving10
in from north-west and west, but it never came closer than 300 km from the balloontrack, as illustrated in Fig. 2a (left), showing the TRMM surface rainfall accumulatedapproximately during the duration of the flight for the region of interest.
From 20 to 24 February, the Bauru area was under the SACZ influence leading toconvective conditions during the SF4 flight. This is illustrated by the TRMM accumu-15
lated rainfall depicted in Fig. 2a (right). A large area of instability within the SAZC,with more or less randomly developing intense cells was first observed by IPMet’sradars in the far north-west of the State of Sao Paulo, between 07:00 and 08:00 LT(10:00–11:00 UT), expanding eastwards while moving towards south-east as a whole.Significant intensification occurred from noon onwards, resulting in a extensive multi-20
cellular complex, with echo tops of up to 13–15 km (Pommereau et al., 20061), headingtowards Bauru during the late afternoon. At the time of the launch, the storm com-plex was about 120 km to the north-west, moving at 40 km h−1 south-eastwards andreaching Bauru shortly after 23:00 UT. The radar accumulated rainfall for a 6-h period,commencing one hour before the launch, is shown in Fig. 2b (right). The convective25
activity during SF4 flight was significantly higher than for the SF2 case, but both flightswere performed in the vicinity of cloudy areas (Huret et al., 20062). The wind intensityis similar on both days, with a maximum of 25–30 m s−1 between 11 km and 15 km al-titude, but from south-west for SF2 and from the north-west for SF4, and light winds
12476
(5–10 m s−1) in the 15 km to 18 km altitude range, turning to the east-south-east in thestratosphere (Pommereau et al., 20061).
3.2 Location of the TTL for both flights
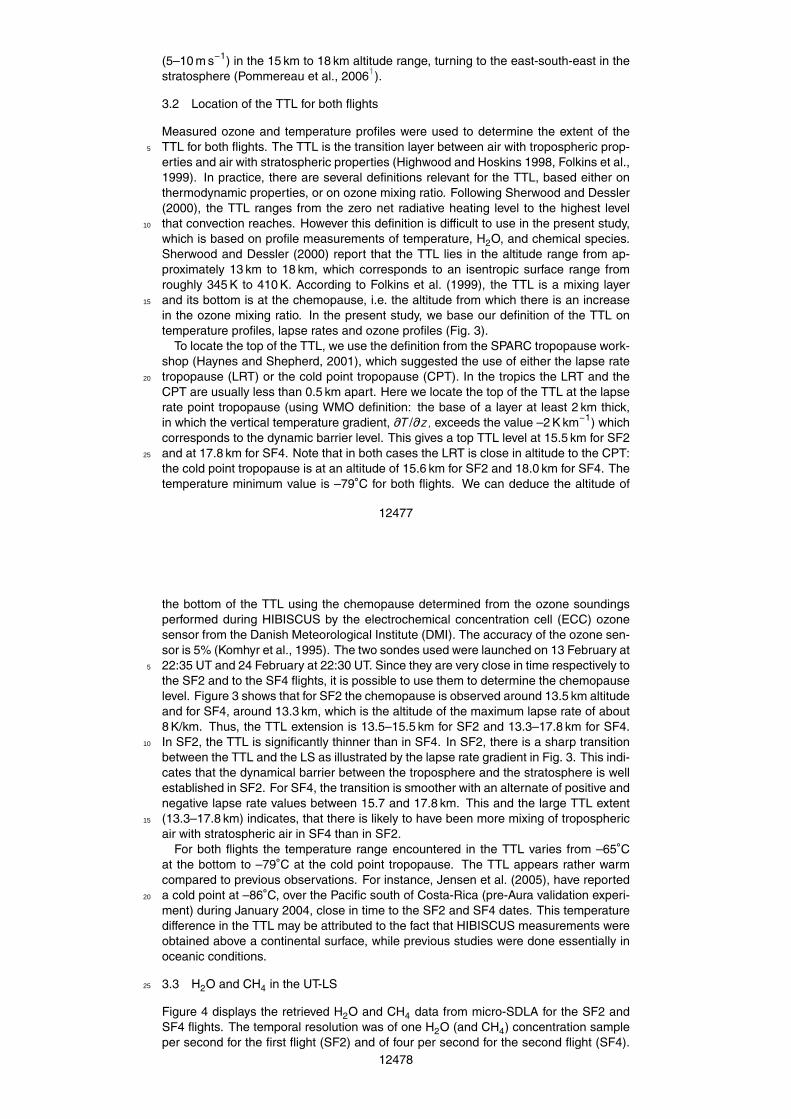
Measured ozone and temperature profiles were used to determine the extent of theTTL for both flights. The TTL is the transition layer between air with tropospheric prop-5
erties and air with stratospheric properties (Highwood and Hoskins 1998, Folkins et al.,1999). In practice, there are several definitions relevant for the TTL, based either onthermodynamic properties, or on ozone mixing ratio. Following Sherwood and Dessler(2000), the TTL ranges from the zero net radiative heating level to the highest levelthat convection reaches. However this definition is difficult to use in the present study,10
which is based on profile measurements of temperature, H2O, and chemical species.Sherwood and Dessler (2000) report that the TTL lies in the altitude range from ap-proximately 13 km to 18 km, which corresponds to an isentropic surface range fromroughly 345 K to 410 K. According to Folkins et al. (1999), the TTL is a mixing layerand its bottom is at the chemopause, i.e. the altitude from which there is an increase15
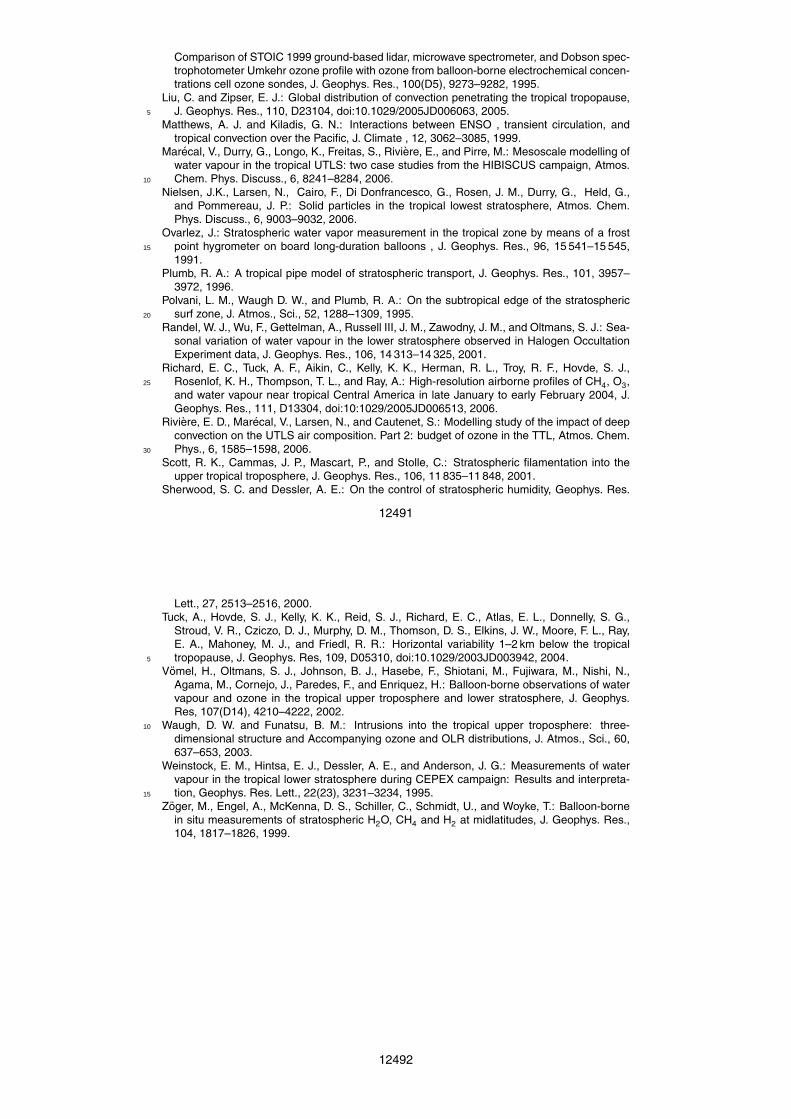
in the ozone mixing ratio. In the present study, we base our definition of the TTL ontemperature profiles, lapse rates and ozone profiles (Fig. 3).
To locate the top of the TTL, we use the definition from the SPARC tropopause work-shop (Haynes and Shepherd, 2001), which suggested the use of either the lapse ratetropopause (LRT) or the cold point tropopause (CPT). In the tropics the LRT and the20
CPT are usually less than 0.5 km apart. Here we locate the top of the TTL at the lapserate point tropopause (using WMO definition: the base of a layer at least 2 km thick,in which the vertical temperature gradient, ∂T /∂z, exceeds the value –2 K km−1) whichcorresponds to the dynamic barrier level. This gives a top TTL level at 15.5 km for SF2and at 17.8 km for SF4. Note that in both cases the LRT is close in altitude to the CPT:25
the cold point tropopause is at an altitude of 15.6 km for SF2 and 18.0 km for SF4. Thetemperature minimum value is –79◦C for both flights. We can deduce the altitude of
12477
the bottom of the TTL using the chemopause determined from the ozone soundingsperformed during HIBISCUS by the electrochemical concentration cell (ECC) ozonesensor from the Danish Meteorological Institute (DMI). The accuracy of the ozone sen-sor is 5% (Komhyr et al., 1995). The two sondes used were launched on 13 February at22:35 UT and 24 February at 22:30 UT. Since they are very close in time respectively to5
the SF2 and to the SF4 flights, it is possible to use them to determine the chemopauselevel. Figure 3 shows that for SF2 the chemopause is observed around 13.5 km altitudeand for SF4, around 13.3 km, which is the altitude of the maximum lapse rate of about8 K/km. Thus, the TTL extension is 13.5–15.5 km for SF2 and 13.3–17.8 km for SF4.In SF2, the TTL is significantly thinner than in SF4. In SF2, there is a sharp transition10
between the TTL and the LS as illustrated by the lapse rate gradient in Fig. 3. This indi-cates that the dynamical barrier between the troposphere and the stratosphere is wellestablished in SF2. For SF4, the transition is smoother with an alternate of positive andnegative lapse rate values between 15.7 and 17.8 km. This and the large TTL extent(13.3–17.8 km) indicates, that there is likely to have been more mixing of tropospheric15
air with stratospheric air in SF4 than in SF2.For both flights the temperature range encountered in the TTL varies from –65◦C
at the bottom to –79◦C at the cold point tropopause. The TTL appears rather warmcompared to previous observations. For instance, Jensen et al. (2005), have reporteda cold point at –86◦C, over the Pacific south of Costa-Rica (pre-Aura validation experi-20
ment) during January 2004, close in time to the SF2 and SF4 dates. This temperaturedifference in the TTL may be attributed to the fact that HIBISCUS measurements wereobtained above a continental surface, while previous studies were done essentially inoceanic conditions.
3.3 H2O and CH4 in the UT-LS25
Figure 4 displays the retrieved H2O and CH4 data from micro-SDLA for the SF2 andSF4 flights. The temporal resolution was of one H2O (and CH4) concentration sampleper second for the first flight (SF2) and of four per second for the second flight (SF4).
12478

The vertical concentration profiles are therefore composed of a few thousands of in-dividual measurements. Additional meteorological balloonborne soundings obtainedclose in time to the flights (13 February 2004 at 22:30 UT and 24 February 2004 at20:15 UT) with Vaisala RS-90 and RS-80 sondes by IPMET/UNESP (Institute for Me-teorological Research of the Sao Paulo State University) and by DMI (Danish Meteoro-5
logical Institute) are added to the figure for comparison with the measurements madeby the micro-SDLA in the troposphere. Another sounding performed on 23 February at22:30 UT (green line in Figs. 4a and b) is also displayed. This sounding will be usedlater in the discussion as a reference for H2O and O3 since this sounding took place intropical air masses far from any extratropical intrusions.10
For the SF2 flight in the UT (Fig. 4a), a water vapor minimum of 100 ppmv is observedin the troposphere around 6.5 km altitude. At 8–10 km, the instrument measures ap-proximately 800 ppmv. The sounding close to SF2 gives the same water vapor profileshape, and the achieved water vapor contents are in between the micro-SDLA ascentand descent data. CH4 measurements in the UT for SF2 flight remain close to the15
expected surface value (1.8 ppmv) with no special features. For the SF4 flight in theUT (Fig. 4), a very dry layer is observed around 9.5 km (340 K potential temperaturesurface) in a ∼2 km thick layer with a water vapor mixing ratio lower than 100 ppmv.One can even see a very thin substructure (less than 100 m) at 9 km altitude with anincrease of water vapor amount up to 900 ppmv. The corresponding CH4 data provided20
by micro-SDLA in this altitude range are also displayed in Fig. 4 and show a good cor-relation with H2O dry layer with CH4 values 0.2 ppmv lower than the expected surfacevalue and than the CH4 observed in the whole troposphere. The water vapour sound-ing launched two hours before the SF4-flight also shows this type of shape with analternation of very dry thin layers. The vertical extent and the intensity of this dry layer25
is larger but in the same altitude range. The sounding launched one day before theSF4 flight (in green) does not show this dry layer with a water vapor content more thanten times greater than SF4 at 9.5 km, i.e. 1500 ppmv. A specific process has happenedbetween, 23 and 24 February in the UT leading to the drying of the layer around 9.5 km.
12479
For both flights, a CH4 decrease of roughly 0.2 ppmv is detected around 15 km for SF2and 14.5 km for SF4. Nearly at the same altitude levels as these methane structures,a sharp decrease in the water vapor profiles can be observed: within roughly five hun-dred meters, the H2O mixing ratio changes from 20 ppmv down to 6 ppmv for SF4 andfrom 10 ppmv down to 6 ppmv for SF2 (descent data).5
In the TTL and LS, the measured H2O mixing ratios for both flights range roughlyfrom 20 ppmv at 14 km down to 5 ppmv at 18 km with values between 3.5 and 6 ppmvin the 16–18 km range. Also displayed in Fig. 4 is the saturation mixing ratio over iceabove 14 km altitude. For flight SF2, the air is largely supersaturated (over 150% inrelative humidity with respect to ice saturation) up to 15.5 km and largely undersatu-10
rated above (down to ∼20% in relative humidity). Dehydration by ice nucleation andsubsequent sedimentation is likely to take place in the upper troposphere and the TTLon this occasion. Additionally, for this flight, above the top of the TTL, the undersatu-rated conditions indicate that the vertical dynamical barrier is strong enough to preventtroposphere to stratosphere exchange at the lapse rate tropopause level. For SF4, the15
air is also supersaturated (in the order of 120%) up to 15 km and undersaturated above(down to ∼30%). In this case, the upper part of the TTL is dry, leading to no possibledehydration by ice condensation and sedimentation. In the LS, the air is significantlyundersaturated for both flights. A detailed calculation of the saturation ratio for SF2and SF4 can be found in Marecal et al. (2006). Nevertheless, compared to the mea-20
surements presented by Vomel et al. (2002) and Jensen et al. (2005), both SF2 andSF4 H2O mixing ratios are significantly larger above 17–17.5 km with values generallygreater than 4 ppmv. They are also larger than those reported by Richard et al. (2006)during ER-2 flights near Costa-Rica above the 380 K isentropic level. Air in the LS overBrazil is thus moister than in tropical oceanic conditions. This is consistent with the25
warmer conditions recorded in the LS over Brazil leading to less dehydration than incolder conditions recorded in the LS over the tropical ocean.
12480

3.4 Ozone in the UT-LS
The examination of ozone measurements in the UT-LS provides complementary in-formation on the dynamical processes affecting the probed air masses. During HI-BISCUS, ozone soundings were performed by the DMI ECC ozone sensors but alsoby the O3-SSS sensor, a solid-state semiconductor sensor developed at UCAM Cam-5
bridge (Hansford at al., 2005) that was operated as a piggy-back on the flight chainof the micro-SDLA flights. Figure 5 shows the ozone measurements achieved in theUT-LS at the time of the flights above the 330 K isentropic level. Two soundings per-formed on the 10 and 23 February have been added to the figure. The measurementson 23 February were used in Fig. 4 (green line) as a reference for water vapour. The10
corresponding ozone data will be used here as a reference for ozone in the UT, sincethe sonde probed tropical air masses free from extratropical intrusions. The measure-ments on 10 February will be used as a reference profile for O3 in the TTL and LS.Figure 5 shows that the ECC and O3-SSS measurements generally agree well. Thedifferences found below 10 km on 24 February can be attributed to the difference in15
time between the two soundings.In the UT, near 340 K (∼9.5 km), the SF4 flight appears rather rich in ozone com-
pared to the reference sonde on 23 February. This ozone-rich layer is at the sameisentropic level where a very dry and CH4-poor layer was observed (335–340 K). Ananalysis of the O3 profiles shows that for both flights, there is a local ozone maxi-20
mum just below the chemopause (∼350K). In their study over the equatorial Pacificand equatorial Eastern Brazil, Vomel et al. (2002) have classified O3 and H2O pro-files in the upper troposphere. Profiles associated with deep convection have a strongdecrease in ozone concentration in the UT from 10 ppbv at 10 km to 1 ppbv at thechemopause. In non-convective cases or when convection did not reach a sufficient25
altitude in the UT, the O3 mixing ratios are higher (40 ppb) and the profiles are constantup to the chemopause as observed on 23 February 2004 (green line in Fig. 5b). Ozoneand water vapor profiles from both micro-SDLA flights are similar to those reported by
12481
these authors over South America on February 1997, with a local maximum of ozonebelow the chemopause (around 350 K). Therefore, if referring to Vomel et al. (2002),none of our ozone measurements seem to be associated with cases affected locally byconvection in the UT.
In the TTL and LS, there is a clear increase in the ozone content for SF2 compared to5
SF4 in the 17 km to 18 km range, with a maximum difference of up to 80 ppbv at 18 km.We also observe that the O3 content for both flights is significantly greater (by up to100 ppbv) than the 10 February reference ECC sonde. A similar order of magnitudein the O3 excess was also reported by Waugh and Funatsu (2003) from the ozonesounding over Hilo, Hawaii, in a case of extratropical intrusion in January 1987.10
From the comparison with all the ozone soundings achieved during HIBISCUS (notshown), it appears that in both flights the micro-SDLA has probed air-masses enrichedin ozone.
4 Discussion of H2O in the UT, TTL and LS
To summarize the observations, for both flights, the overall TTL was found warmer15
(with a cold point near –79◦C) and the LS moister compared to former measurementsobtained in tropical oceanic conditions. The vertical extent of the TTL transition layer forSF4 is nearly twice as much as for SF2, and the lapse rate features a sharp transitionbetween TTL and LS for SF2 and smoother for SF4. The LS for SF2, and the upperpart of the TTL and the LS for SF4, which are discussed in next section, are found20
largely subsaturated. The ozone measurements give insights of potential occurrenceof extratroptical intrusions, particularly in the UT for SF4 and in the LS for SF2.
4.1 Intrusions of extratropical air into the UT-LS
In the UT, there is, for SF4, a very dry layer with low CH4 and high O3. To identify theoccurrence of an extratropical intrusion in the UT, we have run the MIMOSA contour ad-25
12482

vection model (Hauchecorne et al., 2002) of the potential vorticity (PV). The MIMOSAmodel was used previously in several studies, for instance, to follow the evolution ofpolar and tropical intrusions at mid-latitudes (Heese et al., 2001; Durry et al., 2002b;Durry and Hauchecorne, 2005; Huret et al., 2006). During HIBISCUS, PV maps havebeen calculated with MIMOSA every six hours on isentropic surfaces in the TTL with5
a 5 K resolution using the ECMWF fields. MIMOSA has to be used with caution inthe UT and the TTL because it is based on isentropic advection and does not takeinto account a possible vertical transport of air masses. The MIMOSA predictions arenonetheless for each case reinforced by the exmaination of the corresponding tracermeasurements. Figures 6 and 7 show the PV-maps in the 340 K to 415 K range with10
a 5 K-resolution for SF2 and SF4, respectively. The micro-SDLA instrument is locatedon the PV-maps using its onboard GPS.
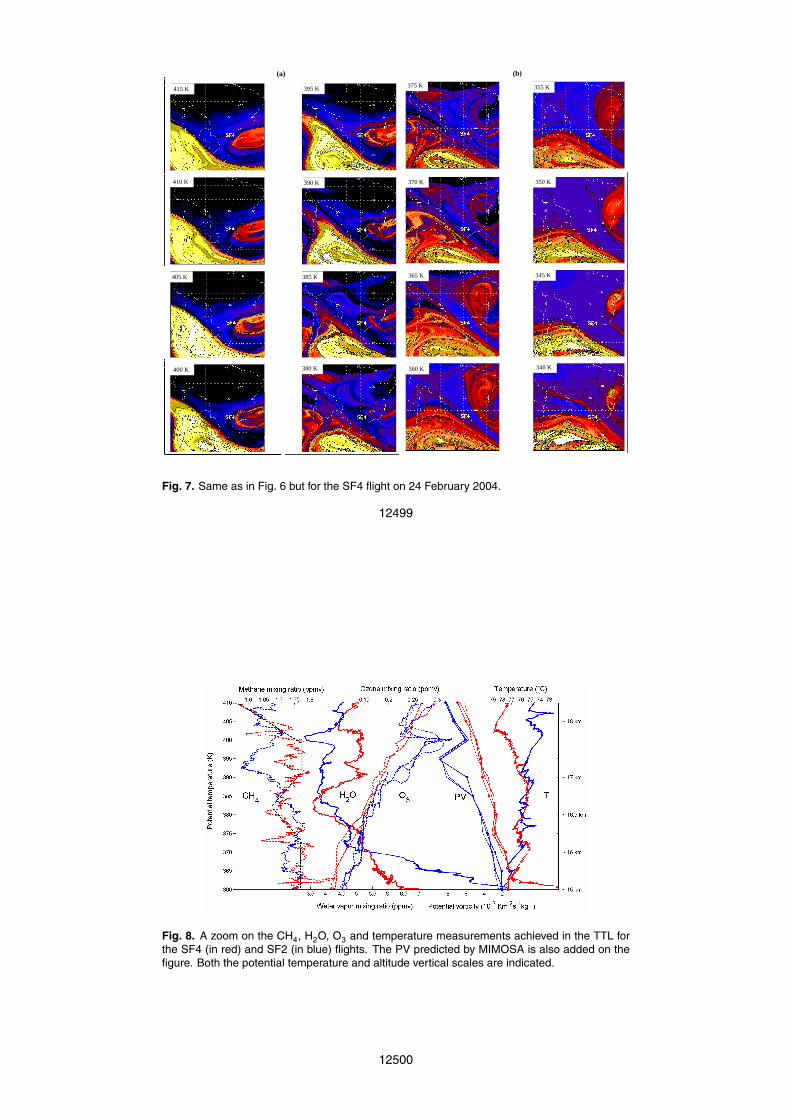
In the upper troposphere, MIMOSA confirms for SF4 the presence of a filament ofextratropical stratospheric air at 340 K (see Fig. 7, PV map at 340 K). This filamentexplains the presence of the very dry layer observed in SF4 at 9.5 km with low CH415
and high O3, typical of stratospheric air. The process is similar to that observed in theUT by Scott et al. (2001) over the southern tropical Atlantic when the aircraft in the UTcrossed a potential vorticity filament coming from mid-latitude showing a strong discon-tinuity in potential temperature, a low relative humidity and an ozone mixing ratio peakgreater than 70 ppbv at 10 660 m. It is remarkable that MIMOSA is able to simulate20
the filament, since in the tropical UT diabatic processes, and in particular convection,possibly degrade the prediction of PV advection. Nevertheless, according to the ex-amination of the ozone profile described in Sect. 3, the situation is non-convective inthe UT at the time and place of the flight. Within one day, the filament is formed andadvected in a convection-free atmosphere until it reaches the convection zone located25
near Bauru as illustrated by Fig. 2a (left) showing TRMM surface rain-rates during theflight period. The BRAMS meso-scale model, which is used in the companion paperassociated to this study (Huret et al., 20062), also predicts the presence of this filamentin the UT.
12483
We see in Figs. 6 and 7 that extratropical intrusions were also present in the TTL andLS for both flights. One remarkable feature provided by the PV maps is the tongue ofhigh PV (|PV|>2) stratospheric mid-latitude air in the 385 K to 405 K range for SF2 in theLS (Fig. 6). To better examine the impact of isentropic transport in this altitude range,vertical PV profiles were extracted from the MIMOSA simulations for both flights and5
plotted in Fig. 8, in conjunction with the H2O, CH4, O3 and temperature. For SF2 (inblue in Fig. 8), the signature of the intruding tongue can be clearly seen in the 385 K to405 K range. In this layer, there is a correlation between PV, CH4, O3 and temperature.Low CH4and high O3 are observed in air masses of high-PV suggesting an extratropicalstratospheric origin. Furthermore, from 370 K to 390 K the temperature is nearly con-10
stant but above 390 K, a positive gradient of temperature, typical of the stratosphere,is observed in the region of interest. The hydrogen budget [H2O]+2[CH4] yields valueswithin 7.2 to 7.5 ppmv, which is a further indication of mid-latitude stratospheric origin(Durry et al., 2002b, Zoger et al., 1999). Hence, there are several lines of evidence(low CH4, high O3, high PV, hydrogen budget, temperature measurements) showing15
that the micro-SDLA has probed air masses originating from the southern mid-latitudestratosphere during SF2. This also explains the ∼4 ppmv H2O content recorded by themicro-SDLA, which is typical of mid-latitude H2O values. Also in SF2, a thin layer oflow H2O (3.3 ppmv), anticorrelated with CH4 can be seen at 400 K. When taking intoaccount the systematic 300 m shift upwards of ozone resulting from the 50 s time con-20
stant of the ECC sensor, it would also correspond to an ozone dip. Indeed, the PVprofile and the maps of Fig. 6 show, that at this altitude, the balloon is located withina low |PV| tropical air parcel. For the isentropic levels lower than 385 K, it is difficult toconclude about potential impact of isentropic transport, as the instrument is found atthe edge of the intrusion (Fig. 6).25
4.2 Vertical transport by convection into the TTL for SF4
For the SF4 data (in red in Fig. 8), the isentropic transport is a less convincing expla-nation for the large amount of 5.5 ppmv of H2O observed between 390 K and 405 K.
12484

The MIMOSA predictions, as well as the CH4 or O3profiles, do not show any particularstructures. At 385 K (∼16.5 km), the micro-SDLA measures 3.5 ppmv of H2O while at395K (∼17.5 km), it gives 5.5 ppmv. The examination of the corresponding PV-maps inFig. 7 shows that the micro-SDLA was probing tropical air masses with the same lowPV at both isentropic levels. From MIMOSA results, the isentropic transport can not5
explain for the difference of 2 ppmv observed between both isentropic levels. The cal-culation of the hydrogen budget [H2O]+2[CH4] between 390 K and 405 K gives a valuenear 8.5–9 ppmv, which is too high to be of mid-latitude stratospheric origin. For SF4,the O3 profile is unstructured in the whole TTL. While an increase in H2O with altitudeis observed in SF4, the methane mixing ratio remains fairly close to the surface value10
at 1.75 ppmv. This could be due to a convective transport of tropospheric moist air inthis region which is far from the saturation with respect to ice over 370 K. For instance,at 395 K, the water vapor saturation mixing ratio over ice is 11 ppmv. The vertical trans-port by convection could also explain why, for SF4, methane concentration remainsclose to the surface values in the TTL. A more precise examination of the CH4 pro-15
file (see dashed black line in Fig. 8 which gives average values for CH4 in SF4), showsthat methane decreases between 370 K–380 K. Above 380 K, it increases again to con-verge towards surface values near 1.75 ppmv in the region of interest. Above 400 K,the methane starts to decrease again to 1.6 ppmv as the instrument enters the lowertropical stratosphere. From 370 K to 390 K, the temperature is nearly constant like for20
SF2; nevertheless, above 390 K, we observe a cooling up to the cold point tropopause.This cooling could be associated with the nearly adiabatic vertical transport by convec-tion. But with the assumption of a convective transport close in time and location ofthe SF4 flight, the ozone mixing ratio would be expected to decrease because the airmasses originating from the lower troposphere have lower ozone mixing ratios. The25
absence of a clear feature in ozone could suggest that the transport by convection ofmoist tropospheric air had occurred significantly before the flight, leading to a partialmixing of this air with its environment. Another potential explanation for this insignificantsignature is a local photochemical production of ozone related to the transport of ozone
12485
precursors by convection and the production of NOx by lightning (Riviere et al., 2006).Whatever the explanation is, mixing or photochemical production, it is likely that therewas some delay between the time of the in situ measurements and the occurrence ofthe convective event causing the vertical elevation of the moist tropospheric air mass.This delay must be long enough for these processes, mixing or ozone photochemical5
production, to be effective. Hence, to support this hypothesis, it is required to calculatebackwards trajectories in the TTL over a few days corresponding to the period when theSACZ was over the Bauru region. For this purpose, a meso-scale model with sufficientvertical resolution and based on local meteorology is used in Huret et al. (2006)2.
4.3 Comparison with mid-latitude H2O data10
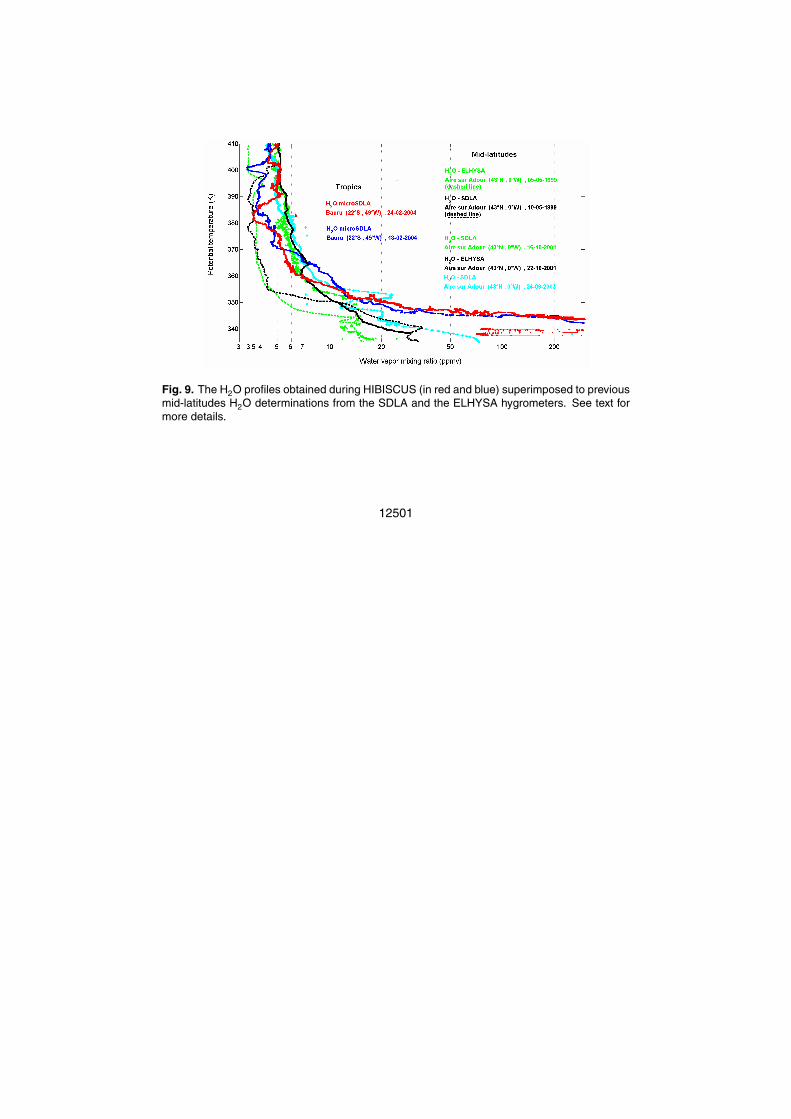
A further insight for the occurrence of a convective transport of H2O into the TTL forSF4 can be found in the comparison between HIBISCUS data and previous observa-tions at mid-latitudes H2O measurements. Indeed, the H2O mixing ratios reported bymicro SDLA in the TTL in this flight are comparable to that observed at mid-latitudes atidentical potential temperature levels. To illustrate this point, Fig. 9 displays the mea-15
sured H2O data in the UT-LS, superimposed to previous northern mid-latitudes H2Omeasurements from the balloonborne SDLA laser hygrometer (Durry et Megie, 1999)and from the ELHYSA frost-point hygrometer (Ovarlez, 1991) at Aire sur l’Adour (44◦ N,France). Above the tropopause, at about 360 K, the mid-latitude observations displaythe seasonal cycle of water vapor (Randel et al., 2001), the lower stratosphere being20
more moist in autumn compared to spring. Although the HIBISCUS measurementswere performed in the Southern Hemisphere, the small difference between both hemi-spheres makes the comparison valid. Up to 380 K, the two tropical profiles, recordedin summer, are close to the mid-latitude autumn data. Above this level, they shift be-tween spring and autumn mid-latitude concentrations. The SF2 layers and the driest25
layer in SF4 (3.5–4 ppmv) are close to spring mid-latitude values while the humidityof the moist layers in SF4 (∼5 ppmv, between 390 K to 400 K) is close to that of theautumn mid-latitude profiles. If the moist layers in SF4, between 390 K and 400 K,
12486
were due to convection as discussed above, this comparison would suggest that theincreased humidity in the autumn could be the result of re-hydration of the lower strato-sphere in the tropics during the convective summer, followed by isentropic exchangewith the mid-latitudes.
5 Conclusions5
High resolution H2O measurements have been performed by the microSDLA balloon-borne laser hygrometer in the UT, the TTL and the LS over Brazil (22◦ S) during the HI-BISCUS field campaign in February 2004. The combination of balloon flights descend-ing slowly in the TTL and the high resolution of microSDLA has allowed observing thinlayering in the H2O profiles in the UT, TTL and LS. Simultaneous or quasi-simultaneous10
CH4, O3 and temperature measurements and PV-profiles provides insight on the originof the strong layering.
In the UT for SF4, the unambiguous signature of a filament of extratropical strato-spheric air, crossed by the sensor was identified near 10 km (340 K), corresponding to avery dry layer, with low CH4 and high O3. In the LS, for SF2, in the 17 km to 18 km range15
(385 K to 405 K) the instrument crossed a tongue of high-PV stratospheric mid-latitudeair intruding the tropical LS. A very good agreement was found between the predictionsof the MIMOSA PV-advection model in the TTL and LS and the in situ tracer measure-ments: the MIMOSA model predicts a strong increase in the PV when low CH4 and highO3 are detected. The corresponding H2O data are typical of mid-latitude stratospheric20
values and range from 3.5 ppmv to 5 ppmv. No significant dehydration by ice nucleationand subsequent sedimentation was detected in the TTL and LS, likely because signifi-cant undersaturated conditions occur. For the second flight (SF4), in the same altituderange, a high H2O mixing ratio of 5.5 ppmv is observed, as well as a cooling and anenrichment of methane. It could be related to a convective transport of tropospheric25
air moistening the subsaturated TTL in the 385 K–405 K range. Compared to previousmeasurements of water vapour in the UTLS in oceanic conditions (Vomel et al, 2002;
12487
Jensen et al., 2005; Richard et al., 2006), the micro-SDLA observations exhibit largerH2O mixing ratios in the LS. This is consistent with the warmer temperatures measuredat and around the cold point tropopause by micro-SDLA, leading to less dehydration.This seems to indicate that the tropical LS is moister over continent than over ocean.This suggests further that the land convective systems could be a source of strato-5
spheric moisture in the summer season. Nevertheless, more measurements in the LSin continental conditions are needed to confirm this result.
The examination of the TTL based on the two flights of the HIBISCUS campaignunderlines the complexity of the processes controlling H2O in the UT-LS. Within the 10days separating both flights of the micro-SDLA, at the same isentropic levels, between10
385 K and 405 K, tongues of stratospheric mid-latitude air, followed by convective trans-port, have largely modified the H2O profiles. The relatively warm TTL, over the landconvective region of the South Atlantic Convergence Zone, appears as a highly struc-tured layer of mixing between air parcels advected isentropically from the mid-latitudeslower stratosphere, the overworld of Holton et al. (1995), and convectively lifted tropo-15
spheric air.
Acknowledgements. This study is supported by funds from the 5th PCRD (HIBISCUS project)and the French Centre National de la Recherche Scientifique (Programme National de ChimieAtmospherique). The Technical Department of the Institut National des Sciences de l’Univers(N. Amarouche, F. Blouzon, J. Deleglise) is thanked for its assistance in the balloon operations20
of the micro-SDLA sensor. The authors would like further to thank the CNES (Centre Nationald’Etude Spatiale) launching balloon team. We also thank the coordinators of the TroCCiBrasProject and IPMet staff for providing the infrastructure support during the campaign. Finally, weacknowledge S. Freitas and K. Longo for providing us with the TRMM rainfall files used in thepaper.25
References
Durry, G. and Megie, G.: Atmospheric CH4 and H2O monitoring with near-infrared InGaAs laserdiodes by the SDLA, a balloonborne spectrometer for tropospheric and stratospheric in situ
12488
measurements, Appl. Opt., 38, 7342–7354, 1999.Durry, G., Pouchet, I., Amarouche, N., Danguy, T., and Megie, G.: Shot-noise-limited dual-
beam detector for atmospheric trace-gas monitoring with near-infrared diode lasers, Appl.Opt., 39, 5609–5619, 2000a.
Durry, G. and Megie, G.: In situ measurements of H2O from a stratospheric balloon by diode5
laser direct-differential absorption spectroscopy at 1.39µm, Appl. Opt., 39, 5601–5608,2000b.
Durry, G., Danguy, T., and Pouchet, I.: Open two-mirror multipass absorption cell for in situmonitoring of stratospheric trace-gas with telecommunication laser diodes, Appl. Opt., 41,424–433, 2002a.10
Durry, G., Hauchecorne, A., Ovarlez, J., Ovarlez, H., Pouchet, I., Zeninari, V., and Parvitte,B.: In situ measurement of H2O and CH4 with telecommunication laser diodes in the lowerstratosphere: dehydration and indication of a tropical air intrusion at mid-latitudes, J. Atmos.Chem., 43, 175–194, 2002b.
Durry, G., Amarouche, N., Zeninari, V., Parvitte, B., Lebarbu, T., and Ovarlez, J.: In situ sensing15
of the middle atmosphere with balloonborne near-infrared laser diodes, Spectrochim. ActaA, 60(14), 3371–3379, 2004.
Durry, G., Zeninari, V., Parvitte, B., Le barbu, T., Lefevre, F., Ovarlez, J., and Gamache, R.R.: Pressure-broadening coefficients and line strengths of H2O near 1.39µm: applicationto the in situ sensing of the middle atmosphere with balloonborne diode lasers, J. Quant.20
Spectrosc. Radiat. Transfer, 94(3–4), 387–403, 2005.Durry, G. and Hauchecorne, A.: Evidence for long-lived polar vortex air in the mid-latitude
summer stratosphere from in situ laser diode CH4 and H2O measurements, Atm. Chem.Phys. , 5, 1467–1472, 2005.
Folkins, I., Loewenstein, M., Podolske, J., Oltmans, S. J., and Proffitt, M.: A barrier to vertical25
mixing at 14 km in the tropics: Evidence from ozonesondes and aircraft measurements, J.Geophys. Res., 104(D18), 22 095–22 102, 1999.
Hall, T. M. and Waugh, D. W.: Tracer transport in the tropical stratosphere due to verticaldiffusion and horizontal mixing, Geophys. Res. Lett., 24, 1383–1387, 1997.
Hansford, G. M., Freshwater, R. A., Bosch, R. A., Cox, R. A., Jones, R. L., Pratt, K. F. E., and30
Williams, D. E.: A Low Cost Instrument based on a Solid State Sensor for Balloon-borneAtmospheric O3 Profile Sounding, J. Environ. Monit.,7, 158–162, doi:10.1039/b412184h,2005.
12489
Hauchecorne, A., Godin, S., Marchand, M., Heese, B., and Souprayen, C.: Quantificationof the transport of chemical constituents from the polar vortex to midlatitudes in the lowerstratosphere using the high-resolution advection model MIMOSA and effective diffusivity, J.Geophys. Res., 107(D20), 8289, doi:10.1029/2001JD000491,2002.
Haynes, P. H. and Shuckburgh, E. F.: Effective diffusivity as a diagnostic of atmospheric trans-5
port, II, Troposphere and lower stratosphere, J. Geophys. Res., 105, 22 795–22 810, 2000.Haynes, P. H. and Shepherd T.: Report on the SPARC Tropopause workshop, SPARC Newslet-
ter n◦17, 3-10, 2001.Heese, B., Godin, S., and Hauchecorne, A.: Forecast and simulation of stratospheric ozone
filaments: A validation of a high-resolution potential vorticity advection model by airborne10
ozone lidar measurements in winter 1998/1999, J. Geophys. Res., 106(D17), 20 011–20 024,2001.
Highwood, E. J. and Hoskins, B. J.: The tropical tropopause, Q. J. R. Meteorol. Soc., 124,1579–1604, 1998.
Holton, J. R., Haynes, P. H., McIntyre, M. E., Douglass, A. R., Rood, R. B., and Pfister, L.:15
Stratosphere-troposphere exchange, Rev. Geophys., 33, 403–439, 1995.Horinouchi, T. F., Sassi, F., and Boville, B.: Synoptic-scale Rossby waves and geographic dis-
tribution of lateral transport routre between the tropics and extratropics in the mower strato-sphere, J. Geophys. Res., 105, 26 579–26 592, 2000.
Huret, N., Pirre, M., Hauchecorne, A., Robert, C., and Catoire, V.: On the vertical structure20
of the stratosphere at mid-latitude during the first stage of the polar vortex formation and inpolar region in presence of a large mesospheric descent, J. Geophys. Res., 111, D06111,doi:10.1029/2005JD006102,2006a.
Jensen, E., Smith, J. B., Pfister, L., Pitman, J. V., Weinstock, E. M. , Sayres, D. S. , Herman,R. L., Troy, R. F. , Rosenlof, K., Thompson, T. L., Fridlind, A., Hudson, P., Cziczo, D. J.,25
Heymsfield, A. J., Schmitt, C., and Wilson, J. C.: Ice supersaturations exceeding 100%at the cold tropical tropopause : implications for cirrus formation and dehydration, Atmos.Chem. Phys., 5, 851–862, 2005.
Kiladis G. N. and Weickmann, K. M.: Extratropical forcing of tropical Pacific convection duringnorthern winter, Mon. Wea. Rev., 120, 1924–1938, 1992.30
Kiladis, G. N.: Observations of Rossby waves linked to convection over the eastern tropicalPacific, J. Atmos., Sci., 55, 321–339, 1998.
Komhyr, W. D., Connor, B. J., McDermid, I. S., McGee, T. J., Parrish, A. D., and Magitan, J. J.:
12490
Comparison of STOIC 1999 ground-based lidar, microwave spectrometer, and Dobson spec-trophotometer Umkehr ozone profile with ozone from balloon-borne electrochemical concen-trations cell ozone sondes, J. Geophys. Res., 100(D5), 9273–9282, 1995.
Liu, C. and Zipser, E. J.: Global distribution of convection penetrating the tropical tropopause,J. Geophys. Res., 110, D23104, doi:10.1029/2005JD006063, 2005.5
Matthews, A. J. and Kiladis, G. N.: Interactions between ENSO , transient circulation, andtropical convection over the Pacific, J. Climate , 12, 3062–3085, 1999.
Marecal, V., Durry, G., Longo, K., Freitas, S., Riviere, E., and Pirre, M.: Mesoscale modelling ofwater vapour in the tropical UTLS: two case studies from the HIBISCUS campaign, Atmos.Chem. Phys. Discuss., 6, 8241–8284, 2006.10
Nielsen, J.K., Larsen, N., Cairo, F., Di Donfrancesco, G., Rosen, J. M., Durry, G., Held, G.,and Pommereau, J. P.: Solid particles in the tropical lowest stratosphere, Atmos. Chem.Phys. Discuss., 6, 9003–9032, 2006.
Ovarlez, J.: Stratospheric water vapor measurement in the tropical zone by means of a frostpoint hygrometer on board long-duration balloons , J. Geophys. Res., 96, 15 541–15 545,15
1991.Plumb, R. A.: A tropical pipe model of stratospheric transport, J. Geophys. Res., 101, 3957–
3972, 1996.Polvani, L. M., Waugh D. W., and Plumb, R. A.: On the subtropical edge of the stratospheric
surf zone, J. Atmos., Sci., 52, 1288–1309, 1995.20
Randel, W. J., Wu, F., Gettelman, A., Russell III, J. M., Zawodny, J. M., and Oltmans, S. J.: Sea-sonal variation of water vapour in the lower stratosphere observed in Halogen OccultationExperiment data, J. Geophys. Res., 106, 14 313–14 325, 2001.
Richard, E. C., Tuck, A. F., Aikin, C., Kelly, K. K., Herman, R. L., Troy, R. F., Hovde, S. J.,Rosenlof, K. H., Thompson, T. L., and Ray, A.: High-resolution airborne profiles of CH4, O3,25
and water vapour near tropical Central America in late January to early February 2004, J.Geophys. Res., 111, D13304, doi:10:1029/2005JD006513, 2006.
Riviere, E. D., Marecal, V., Larsen, N., and Cautenet, S.: Modelling study of the impact of deepconvection on the UTLS air composition. Part 2: budget of ozone in the TTL, Atmos. Chem.Phys., 6, 1585–1598, 2006.30
Scott, R. K., Cammas, J. P., Mascart, P., and Stolle, C.: Stratospheric filamentation into theupper tropical troposphere, J. Geophys. Res., 106, 11 835–11 848, 2001.
Sherwood, S. C. and Dessler, A. E.: On the control of stratospheric humidity, Geophys. Res.
12491
Lett., 27, 2513–2516, 2000.Tuck, A., Hovde, S. J., Kelly, K. K., Reid, S. J., Richard, E. C., Atlas, E. L., Donnelly, S. G.,
Stroud, V. R., Cziczo, D. J., Murphy, D. M., Thomson, D. S., Elkins, J. W., Moore, F. L., Ray,E. A., Mahoney, M. J., and Friedl, R. R.: Horizontal variability 1–2 km below the tropicaltropopause, J. Geophys. Res, 109, D05310, doi:10.1029/2003JD003942, 2004.5
Vomel, H., Oltmans, S. J., Johnson, B. J., Hasebe, F., Shiotani, M., Fujiwara, M., Nishi, N.,Agama, M., Cornejo, J., Paredes, F., and Enriquez, H.: Balloon-borne observations of watervapour and ozone in the tropical upper troposphere and lower stratosphere, J. Geophys.Res, 107(D14), 4210–4222, 2002.
Waugh, D. W. and Funatsu, B. M.: Intrusions into the tropical upper troposphere: three-10
dimensional structure and Accompanying ozone and OLR distributions, J. Atmos., Sci., 60,637–653, 2003.
Weinstock, E. M., Hintsa, E. J., Dessler, A. E., and Anderson, J. G.: Measurements of watervapour in the tropical lower stratosphere during CEPEX campaign: Results and interpreta-tion, Geophys. Res. Lett., 22(23), 3231–3234, 1995.15
Zoger, M., Engel, A., McKenna, D. S., Schiller, C., Schmidt, U., and Woyke, T.: Balloon-bornein situ measurements of stratospheric H2O, CH4 and H2 at midlatitudes, J. Geophys. Res.,104, 1817–1826, 1999.
12492

50 cm
Command Acquisition
Lasers GPS
Open cell (L = 28m)
Optical fibers
3-SF ballon
Fig. 1. The micro-SDLA diode laser spectrometer during HIBISCUS in Bauru, Brazil in Febru-ary 2004. With an overall weight of less than 40 kg, the micro-SDLA sensor is flown fromsmall-size 3000 m3 balloons to reach a float altitude near 22 km.
12493
(a)
(b)
Fig. 2. (a) TRMM surface rainfall in mm accumulated from 19:30 UT on 13 February 2004 to01:30 UT on 14 February 2004 (left panel, SF2 flight) and from 22:30 UT on 24 February 2004to 01:30 UT on 25 February 2004 (right panel, SF4 flight). The green cross corresponds to thelocation of the Bauru launch site. The blue circle indicates approximately the 200 km range ofthe Bauru Radar (BRU). (b) 6-h accumulated radar rainfall within a 240 km range from Baurufrom 19:00 UT (about one hour before launch) until the end of the balloon flights at 01:00 UTon the following day. Left: SF2 on 13 February 2004. Right: SF4 on 24 February 2004.
12494
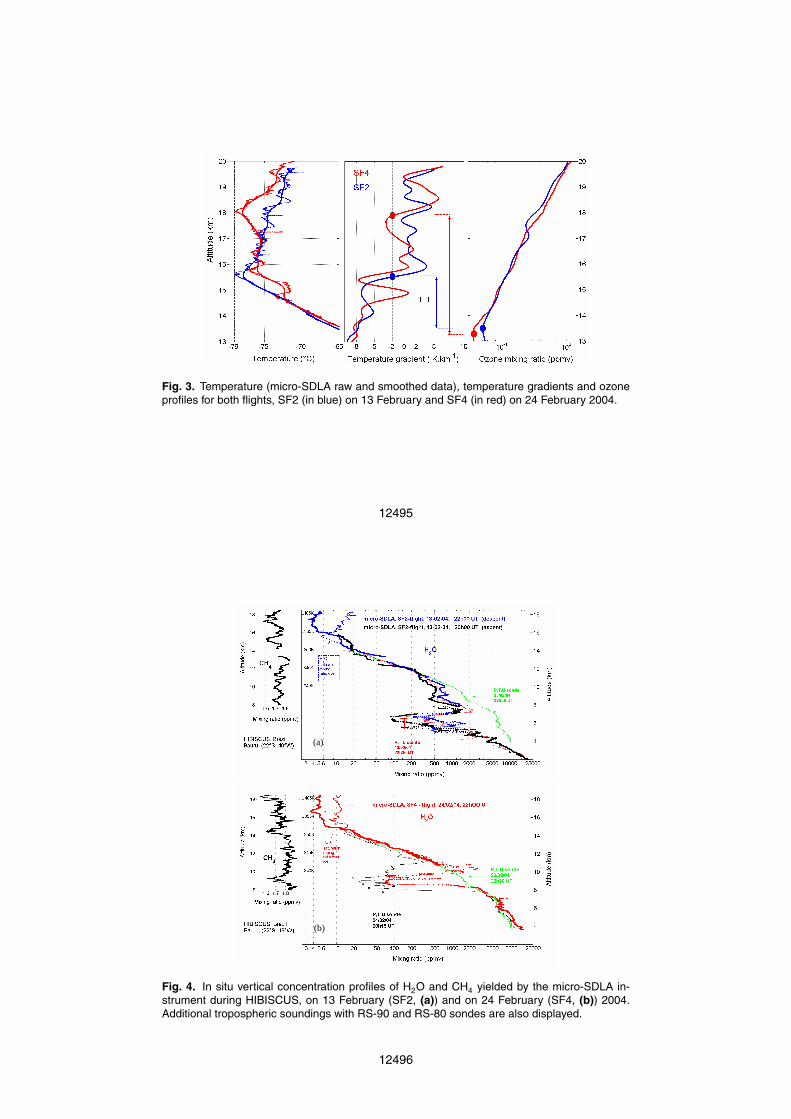
Fig. 3. Temperature (micro-SDLA raw and smoothed data), temperature gradients and ozoneprofiles for both flights, SF2 (in blue) on 13 February and SF4 (in red) on 24 February 2004.
12495
(b)
(a)
Fig. 4. In situ vertical concentration profiles of H2O and CH4 yielded by the micro-SDLA in-strument during HIBISCUS, on 13 February (SF2, (a)) and on 24 February (SF4, (b)) 2004.Additional tropospheric soundings with RS-90 and RS-80 sondes are also displayed.
12496

Fig. 5. Ozone measurements in the TTL and LS (a) and the UT (b) obtained with ECC bal-loonborne sondes and with the OSSS-sensor (piggy-back in the micro-SDLA flight chain) at thetime and place of the micro-SF2 and SF4 flights. Two soundings, on 10 and 23 February 2004are displayed and used as references for O3 in the LS, the TTL and the UT.
12497
400 K
390 K
385 K
395 K
405 K
415 K
410 K
380 K
(a)
370 K
360 K 340 K
350 K
345 K
355 K 375 K
365 K
(b)
Fig. 6. Distribution of the Potential Vorticity predicted by the MIMOSA with a 5 K resolution inthe UT, the TTL and the LS for the SF2 flight on 13 February 2004. The micro-SDLA locationin each isentropic level is indicated with the mark SF2. Contours are of potential vorticity(10−8 K m2 s−1 kg−1).
12498
400 K
390 K
385 K
395 K
405 K
415 K
410 K
380 K
(a)
370 K
360 K 340 K
350 K
345 K
355 K 375 K
365 K
(b)
Fig. 7. Same as in Fig. 6 but for the SF4 flight on 24 February 2004.
12499
Fig. 8. A zoom on the CH4, H2O, O3 and temperature measurements achieved in the TTL forthe SF4 (in red) and SF2 (in blue) flights. The PV predicted by MIMOSA is also added on thefigure. Both the potential temperature and altitude vertical scales are indicated.
12500
50 cm
Open cell (L = 28m)
Fig. 9. The H2O profiles obtained during HIBISCUS (in red and blue) superimposed to previousmid-latitudes H2O determinations from the SDLA and the ELHYSA hygrometers. See text formore details.
12501