NYU Stern lunch talk, 11/01/11 Stijn Van...
29
NYU Stern lunch talk, 11/01/11 Stijn Van Nieuwerburgh http://www.stern.nyu.edu/Newsroom/FacultyResearch/CON_024693
Transcript of NYU Stern lunch talk, 11/01/11 Stijn Van...

NYU Stern lunch talk, 11/01/11Stijn Van Nieuwerburgh
http://www.stern.nyu.edu/Newsroom/FacultyResearch/CON_024693

“The shapers of the American mortgage finance system hoped to achieve the security of government ownership, the integrity of local banking and the ingenuity of Wall Street. Instead they got the ingenuity of government, the security of local banking and the integrity of Wall Street.”
- David Frum (columnist, and former speechwriter for President George W. Bush), National Post, July 11, 2008

Agenda
1) A short history of the GSEs and securitization
2) Feeding the beast: growth of GSEs
3) Race to the bottom and ticking time bomb
4) Red ink as far as the eye can see
5) GSE Reform: Administration’s proposal versus ours

A short history
� Great depression: FHLB (1932), FHA (1934), FNMA (1938, “Fannie Mae”)
� Fannie Mae insured FHA and later VA mortgages and was government agency with federal charter
� Exempt from state and local income taxes
� Federal Reserve was its fiscal agent (line of credit)
� Provide special assistance for certain kinds of mortgages (precursor of mission targets)
� Issued agency debt to finance
� Relatively minor presence until mid-1960s
� 1968: privatized by Johnson to get it off the books

A short history
� Fannie Mae becomes publicly traded company on NYSE but keeps federal charter
� GNMA (“Ginnie Mae”) founded in 1968 to insure FHA and VA loans
� Freddie Mac founded in 1970, owned by FHLB, to compete with Fannie Mae
� F&F can purchase loans below conforming loan limit ($55,000 in 1975, now $417,000)

What Freddie and Fannie do
1. residential mortgage securitization (guarantee function)� Buy conforming mortgage loans form banks
� Issue mortgage-backed securities (MBS) with mortgage pools as collateral
� Assume all default risk, for a “g-fee” of about 0.2%
� Currently about $3.5 trillion
� 0.45% capital requirement
2. Residential mortgage investment (investment function)� Provide liquidity to MBS markets
� Currently about $1.7 trillion
� 2.5% capital requirement
Rationale of securitization
� Deregulation in wake of S&L crisis (early 1980s)
� Traditional model of banking: short-maturity deposits to fund long-term assets
� New model of banking: originate to distribute� Securitization transfers interest rate risk away from banking
sector
� And makes underlying mortgages more liquid – broader investor base
� Of course, transfers credit risk to GSEs

GSE Growth (1980+)
0
5
10
15
20
25
30
35
40
45
50
0
500
1000
1500
2000
2500
3000
3500
4000
4500
1980 1985 1990 1995 2000 2005 2010
% share ofmortgage mkt
$ billions
Year
Mtg Portfolio MBS guarantees F&F %share
Regulatory arbitrage
� Option 1: hold mortgage loans on bank’s balance sheet: 4% regulatory capital charge
� Option 2: sell mortgages to GSEs, and repurchase MBS pools with same mortgages in it
� GSEs hold 0.45% capital against guarantees
� Banks hold 1.6% capital against agency MBS
� Total regulatory capital: 2.05%, or 50% less

Portfolios funded with debt
� Massive portfolio growth funded by issuing “agency debt”
� Perceived by market as government-backed
� Funding advantage of 40bps annually
� $14bn subsidy in 2000
� 2/3 to homeowners as lower mortgage rates
� 1/3 to shareholders and employees of GSEs
� GSEs had huge leverage: 25-to-1 balance sheet and 70-to-1 if guarantees are added

Race to the bottom
� GSEs start lowering lending standards starting mid 1990s
0
100
200
300
400
500
600
700
800
0
5
10
15
20
25
30
35
40
1992 1993 1994 1995 1996 1997 1998 1999 2000 2001 2002
%loans with LTV>90
% loans with 80<LTV<90
$ billions

Mission targets & PLS
� Why this buildup of risk?
� First, 1992 FHEFFSA’s “mission targets”
� Second: private label market gains ground
� Market share of private non-prime market (subprime, Alt-A, HELOC) grew from 14% in 2001 to 48% in 2006
� Deterioration of lending standards, especially in 2004-06
� Private label securitization to finance growth in risky/exotic mortgages
MISSION TARGETS (FEFSSA) 1993-
1995
1996
1997-
2000
2001-
2004
2005
2006
2007
2008
Low- and Moderate-Income Goal 30% 40% 42% 50% 52% 53% 55% 56%
Underserved Areas Goal 30% 21% 24% 31% 37% 38% 38% 39%
Special Affordable Goal NA* 12% 14% 20% 22% 23% 25% 27%

Subprime takes off
0
500
1000
1500
2000
2500
3000
3500
4000
4500
0
0.1
0.2
0.3
0.4
0.5
0.6
0.7
1990 1992 1994 1996 1998 2000 2002 2004 2006 2008
$
b
i
l
l
i
o
n
s
%
s
h
a
r
e
Year
Non-GSE F & F GNMA Non-Seczd Originations

Race to the bottom
� GSEs lose market share (45% to 25% from 2002-06); share of risky lending (43% to 15% from 2003-06)
� Respond by further lowering lending standards, increasing credit risk
� Risky lending grew from 25% in 2003 to 36% in 2007 as share of their own business
� King Kong LCFI against GSE Godzillas: not the perfect competition the deregulation of 1980s had envisioned

Ticking time bomb
Billions of $ 1997 2007
Mortgage guarantees
1,060 3,500
Portfolio holdings 481 1,430
Equity 21 70
Derivatives 256 2,260
Agency debt held by financial sector and foreigners
But now $313bn PLS, $351bn with LTV>90%, $208 bn with FICO<620, $354 bn interest-only, $478 bn Alt-A
… Not your mother’s GSE

Guaranteed to fail
� House price up an unprecedented 135 months in a row between 1995 and 2006
� GSEs started to rack up huge losses in 2008
� By summer 2008, Bush Administration obtained emergency powers to take GSEs into conservatorship; on September 7, 2008
� Transitory conservatorship celebrated its 3rd
birthday with no end in sight
Nothing but red ink
� Since then: $247bn in losses, $169bn born by the taxpayer (but $28bn in dividends to gvmt.)
� Guarantee business: $201bn of losses
� Projected additional draws from Treasury July 2011-December 2014: $51-$142bn (depending on future house prices)
� CBO: additional deficit of $187 bn (“fair value” PV of future commitments), so that the overall subsidy to GSEs is $327bn
� Total net cost of financial crisis mostly GSEs
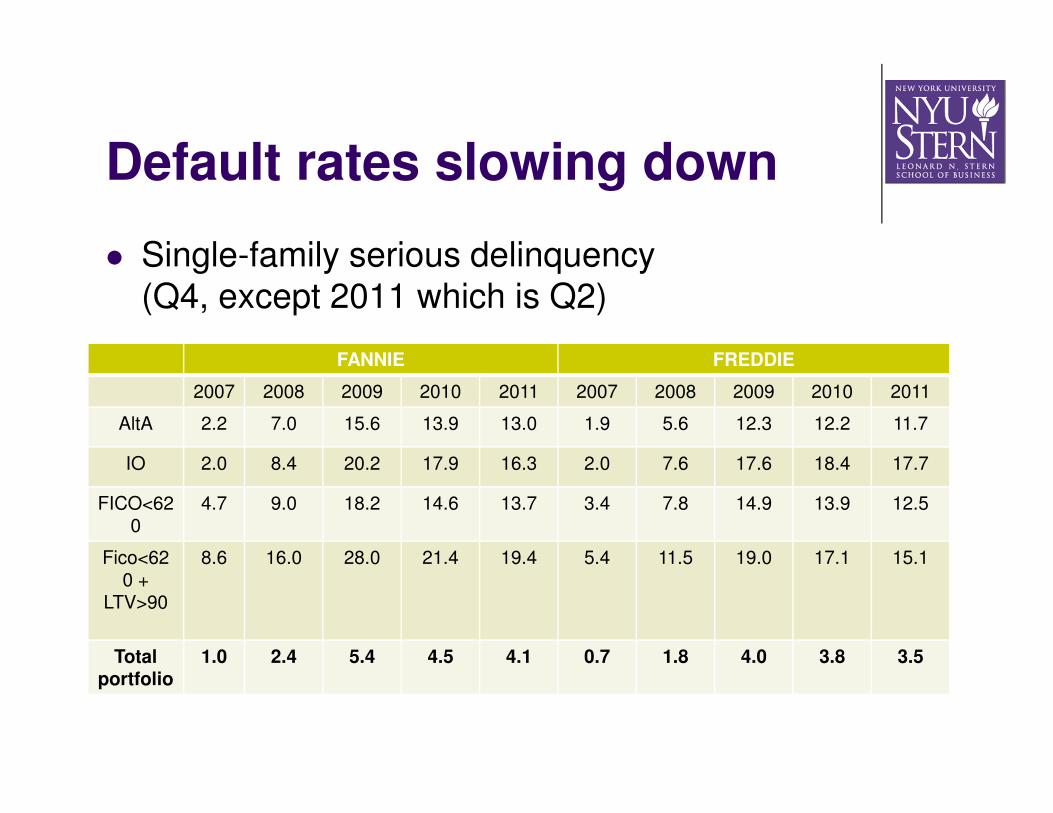
Default rates slowing down
� Single-family serious delinquency (Q4, except 2011 which is Q2)
FANNIE FREDDIE
2007 2008 2009 2010 2011 2007 2008 2009 2010 2011
AltA 2.2 7.0 15.6 13.9 13.0 1.9 5.6 12.3 12.2 11.7
IO 2.0 8.4 20.2 17.9 16.3 2.0 7.6 17.6 18.4 17.7
FICO<620
4.7 9.0 18.2 14.6 13.7 3.4 7.8 14.9 13.9 12.5
Fico<620 +
LTV>90
8.6 16.0 28.0 21.4 19.4 5.4 11.5 19.0 17.1 15.1
Total portfolio
1.0 2.4 5.4 4.5 4.1 0.7 1.8 4.0 3.8 3.5

Where to go from here?
� Freddie, Fannie, and Ginnie are the mortgage/MBS market: 88/96% market share
� Broad consensus to get the government back out of the mortgage market and to wind down Freddie and Fannie
� Economics of regulation: only need government intervention to remedy clearly identifiable market failure
� Negative externality from systemic risk in SIFIs
� Securitization helps redistribute that risk

Part I: investment function
� Dismantle portfolio investment function of GSEs completely
� Move assets in a GSE Resolution Trust Corporation
� Modeled after S&L RTC structure
� Unwind could go faster than 10% per year, probably 25% per year
� 50% could be wound down after 3 years
� Pass legislation to prevent reneging on this plan

Part II: guarantee function
� Short-run: gradually decrease conforming loan limits and increase g-fees, reduce conforming mortgages’ LTV ratios below 90%
� Long-run: menu of 3 options
� A) No guarantees
� B) Government as backstop in crisis: high g-fees
� C) Catastrophic risk insurance, kicks in after private mortgage guarantors are wiped out

Our take on gvmt. guarantees
� No government guarantees necessary in long-run� Private market will develop around MBS with credit
risk and/or around private mortgage guarantees
� Requires tighter underwriting standards, more transparency in securitization transactions, improved credit ratings
� Systemic risk regulation and credible resolution mechanism lest new “private sector GSEs” emerge
� Federal Reserve is lender of last resort
� Catastrophic risk will be underpriced

Transition: public-private partnership
� Private mortgage guarantors determine price of guarantees – crucial!
� Government is silent partner, co-insures 75% of the amount, and receives market price
� Transition to long-run by reducing conforming loan limit and/or reducing 75% share

Summary: Conforming mortgages
� Hold on balance sheet (K% capital requirement)
� Securitize without guarantee� Retain 5% interest (5%*K% capital)
� SIFIs should hold more capital, QRMs exempt
� When tranched, weighted sum of reg. cap. should remain same K% as when untranched
� Securitize with guarantee
� Private guarantors offer insurance on 25% of pool, and set the price of insurance, subject to strict prudential regulation
� Govmt silent partner on other 75% through GMIC, backed by full faith and credit of U.S. government
� Elegible loan limit falls from $625,000 to 0 in 10 years

Summary: Non-conforming mortgages
� Hold on balance sheet (K*%>K% capital requirement)
� Securitize without guarantee� Retain 5% interest (5%*K*% capital)
� SIFIs should hold more capital, QRMs exempt
� When tranched, weighted sum of reg. cap. should remain same K*% as when untranched
� Securitize with guarantee
� Private guarantors offer insurance on 100% of pool, and set the price of insurance
� Automatically considered SIFIs
� subject to enhanced prudential regulation
� Credible resolution authority
� K**>K*% capital requirements

Part III: Subsidizing home ownership
� Home ownership stimulated through tax code, GSEs, myriad of other programs – cost $300bn annually
� Only mediocre outcomes compared to other countries (e.g. home ownership rates)
� Stimulus has led to over-consumption and over-investment in housing
� Home ownership policies are very regressive
� FHA should focus on low-income families, shrink its market share, and emphasize rental assistance programs
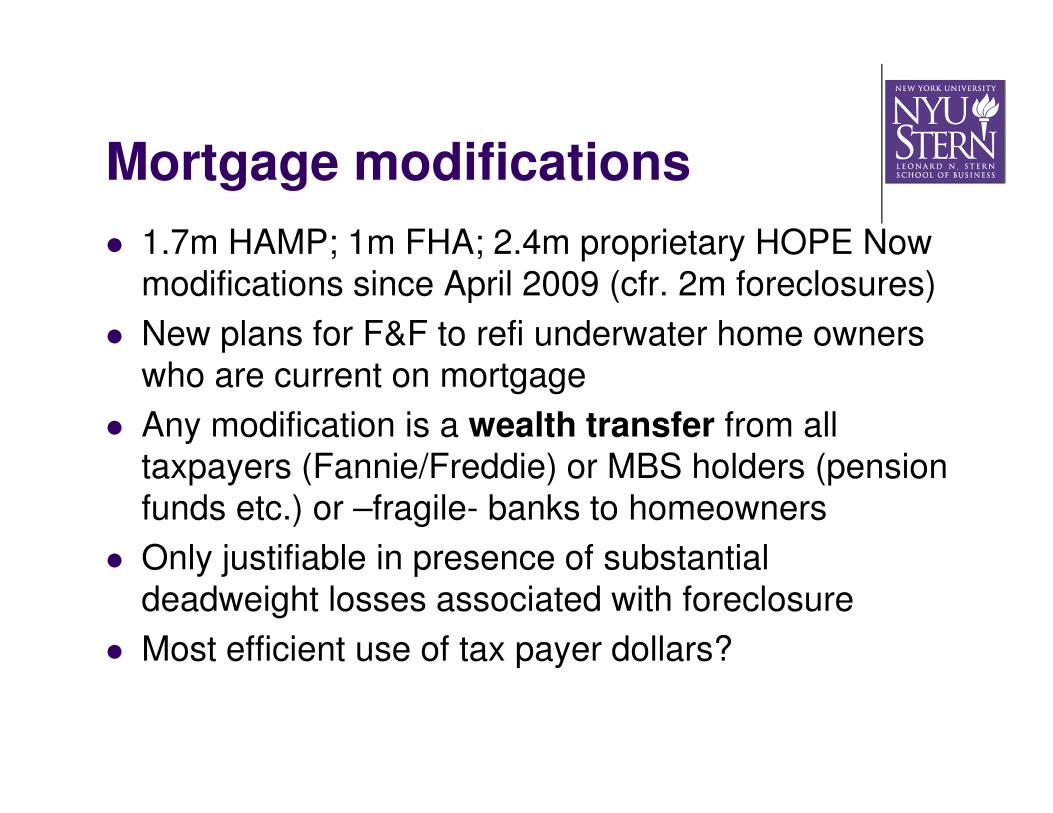
Mortgage modifications
� 1.7m HAMP; 1m FHA; 2.4m proprietary HOPE Now modifications since April 2009 (cfr. 2m foreclosures)
� New plans for F&F to refi underwater home owners who are current on mortgage
� Any modification is a wealth transfer from all taxpayers (Fannie/Freddie) or MBS holders (pension funds etc.) or –fragile- banks to homeowners
� Only justifiable in presence of substantial deadweight losses associated with foreclosure
� Most efficient use of tax payer dollars?

Rank Country Ownership Rate Date Source
1 Singapore 89% 2009 Statistics
2 Spain 85% 2008 European Mortgage Federation
3 Iceland 83% 2005 Statistics (HES survey)
4 Belgium 78% 2007 European Mortgage Federation
5 Norway 77% 2001 UN Economic Commission for
6 Portugal 76% 2007 European Mortgage Federation
7 Luxembourg 75% 2008 European Mortgage Federation
8 Ireland 75% 2009 European Mortgage Federation
9 Chile 73% 2002 UN Housing Policy
10 Italy 72% 2007 INSEE and Eurostat
11 Israel 71% 2004 UN Economic Commission for
12 Australia 70% 2006 Australian Bureau of Statistics
13 England 68% 2010 Building Societies Association
14 Canada 68% 2006 Statistics
15 Sweden 68% 2008 European Mortgage Federation
16 New Zealand 68% 2001 Statistics
17 United States 67% 2009 US Census Bureau
18 Japan 61% 2003 Statistical Yearbook 2005
19 Finland 59% 2008 Statistics
20 Czech Republic 59% 2007 European Mortgage Federation
21 France 57% 2007 European Mortgage Federation
22 Netherlands 57% 2008 European Mortgage Federation
23 Austria 56% 2009 Statistics
24 Denmark 54% 2009 European Mortgage Federation
25 Germany 46% 2007 INSEE and Eurostat
26 Switzerland 35% 2000 Statistics
Source: Alex J. Pollock, Testimony before the Subcommittee on Security and International Trade and Finance, Committee on Banking, Housing and Urban Affairs, U.S. Senate, September 29, 2010
What about home ownership?
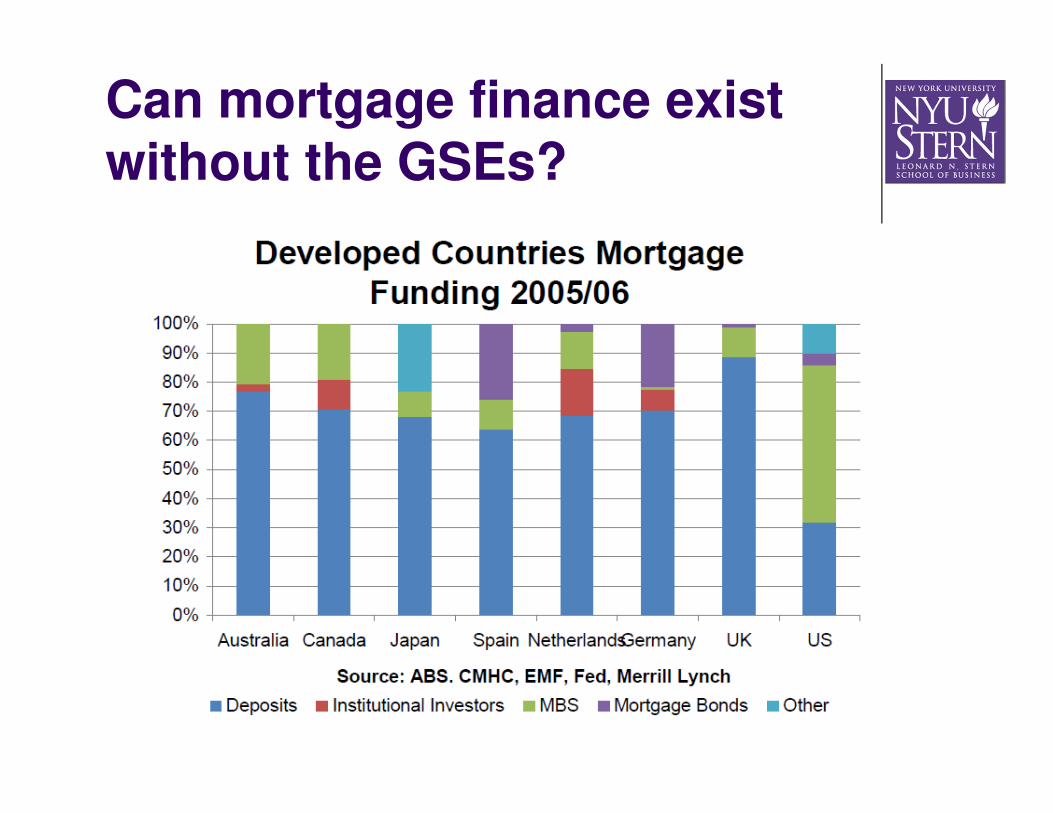
Can mortgage finance exist without the GSEs?


![1A FNMA ADDENDUMS 123010[1]](https://static.fdocuments.in/doc/165x107/577d26fe1a28ab4e1ea2c09f/1a-fnma-addendums-1230101.jpg)