NYSERDA Record of Revision - New York State Energy ...
277
NYSERDA Record of Revision Document Title New York Products Program Market Characterization, Assessment, Process, and Market-Based Impact Evaluation April 2014 Revised August 2015 Revision Date Description of Changes Revision on Page(s) April 2014 Original Issue Original Issue August 2015 Revised Issue August 2015 Update energy savings estimates to correct errors in deemed savings values. Throughout Executive Summary, Section 6, Section 8 August 2015 Added footnote regarding retirement of measures and reduction in cumulative program savings Throughout Executive Summary, Section 6, Section 8 i
Transcript of NYSERDA Record of Revision - New York State Energy ...

NYSERDA Record of Revision
Document Title
New York Products Program Market Characterization, Assessment, Process, and Market-Based Impact Evaluation
April 2014 Revised August 2015
Revision Date Description of Changes Revision on Page(s)
April 2014 Original Issue Original Issue
August 2015 Revised Issue
August 2015 Update energy savings estimates to correct errors in deemed savings values.
Throughout Executive Summary, Section 6,
Section 8
August 2015 Added footnote regarding retirement of measures and reduction in cumulative program savings
Throughout Executive Summary, Section 6,
Section 8
i

New York Products Program
Market Characterization, Assessment, Process, and Market-Based Impact Evaluation
Final Report
Prepared for:
New York State Energy Research and Development Authority
Albany, NY
Victoria Engel-Fowles Project Manager
Prepared by:
Apex Analytics LLC
Boulder, Colorado
Project Staff: Scott Dimetrosky
Noah Lieb Jacob Rowberry
Apex Analytics, LLC
and
Research Into Action, Inc.
Jane S. Peters Robert Scholl
NYSERDA Contract 26276 April 2014

Notice This report was prepared by Research Into Action, Inc., and Apex Analytics LLC., in the course of
performing work contracted for and sponsored by the New York State Energy Research and Development
Authority (hereinafter the “Sponsor”). The opinions expressed in this report do not necessarily reflect
those of the Sponsors or the State of New York, and reference to any specific product, service, process, or
method does not constitute an implied or expressed recommendation or endorsement of it. Further, the
Sponsors and the State of New York make no warranties or representations, expressed or implied, as to
the fitness for particular purpose or merchantability of any product, apparatus, or service, or the
usefulness, completeness, or accuracy of any processes, methods, or other information contained,
described, disclosed, or referred to in this report. The Sponsors, the State of New York, and the contractor
make no representation that the use of any product, apparatus, process, method, or other information will
not infringe privately owned rights and will assume no liability for any loss, injury, or damage resulting
from, or occurring in connection with, the use of information contained, described, disclosed, or referred
to in this report.
NYSERDA makes every effort to provide accurate information about copyright owners and related
matters in the reports we publish. Contractors are responsible for determining and satisfying copyright or
other use restrictions regarding the content of reports that they write, in compliance with NYSERDA’s
policies and federal law. If you are the copyright owner and believe a NYSERDA report has not properly
attributed your work to you or has used it without permission, please email [email protected].
iii

Abstract This report presents the results of the 2010-2012 program cycle evaluation of the New York Products
Program (NYPP). The evaluation assesses the program strengths and areas for improvement through a
process evaluation; the market size and key market actors through a market characterization analysis;
market actor awareness and knowledge, perceived value, accessibility, and incremental cost for targeted
energy efficient products through a market assessment; and total estimated energy and demand savings
through an attribution analysis. Data collection included interviews with program staff, surveys with end-
use residential customers in New York and selected comparison areas, and surveys and interviews with
participating and non-participating retailers and manufacturers.
Key Words Energy efficiency, ENERGY STAR®, market characterization, market assessment, process, attribution,
evaluation research.
Acknowledgements Many people contributed to this evaluation effort, but the Evaluation Team would in particular like to
thank NYSERDA and Lockheed Martin staff that made themselves available for data requests, questions,
and interviews.
iv

Table of Contents NYSERDA Record of Revision ................................................................................................. i
Notice ........................................................................................................................................iii
Abstract ....................................................................................................................................iv
Key Words ................................................................................................................................iv
Acknowledgements .................................................................................................................iv
List of Figures .........................................................................................................................vii
List of Tables ............................................................................................................................ix
Summary ............................................................................................................................... S-1
1 Introduction .................................................................................................................... 1-1
2 Program Description...................................................................................................... 2-1
2.1 Target Population ....................................................................................................................... 2-4 2.2 Program Participation to Date .................................................................................................... 2-4 2.3 Evaluation Goals ...................................................................................................................... 2-10 2.4 Research Approach ................................................................................................................. 2-11 2.5 Program Logic and Researchable Issues ................................................................................ 2-13
3 Data Sources .................................................................................................................. 3-1
3.1 Secondary Data Sources ........................................................................................................... 3-1 3.1.1 NYSERDA Data Collected by Lockheed Martin ................................................................. 3-1 3.1.2 Consortium for Energy Efficiency Bi-Annual Energy Star Household Survey ................... 3-2 3.1.3 D&R International Sales Data ............................................................................................ 3-3 3.1.4 Association of Home Appliance Manufacturers (AHAM) Sales Data ................................. 3-3 3.1.5 US Energy Information Agency (EIA) Residential Energy Consumption Survey (RECS) 2009 ...................................................................................................................................... 3-4
3.2 Primary Data Sources ................................................................................................................ 3-4 3.2.6 NYSERDA End-Use Consumer Survey ............................................................................. 3-6 3.2.7 Comparison Area End-Use Consumer Survey .................................................................. 3-9 3.2.8 Partner Retailer Storefront Survey ................................................................................... 3-12 3.2.9 Participating and Non-Participating Corporate Interviews ............................................... 3-12 3.2.10 Manufacturer Interviews ................................................................................................... 3-13 3.2.11 Pool Pump Market Actor Interviews ................................................................................. 3-14 3.2.12 EPA/DOE/ASAP Interviews ............................................................................................. 3-15 3.2.13 Staff interviews ................................................................................................................. 3-15
4 Market Characterization ................................................................................................ 4-1
v

4.1 Methodology ............................................................................................................................... 4-1 4.2 Market Characteristics ............................................................................................................... 4-2
4.2.1 Market Size ........................................................................................................................ 4-2 4.2.2 Product Distribution Channels ............................................................................................ 4-4 4.2.3 Purchasing Decisions ......................................................................................................... 4-7
4.3 ENERGY STAR Market Share ................................................................................................. 4-11 4.3.4 Methodology ..................................................................................................................... 4-11 4.3.5 ENERGY STAR Appliances Market Share of Appliances ............................................... 4-13
5 Market Assessment ....................................................................................................... 5-1
5.1 Awareness and Knowledge ........................................................................................................ 5-1 5.2 Perceived Value ......................................................................................................................... 5-8 5.3 ENERGY STAR Promotion and Stocking Practices ................................................................ 5-17 5.4 Accessibility / Availability of Efficient Products ........................................................................ 5-18 5.5 Pricing and Incremental Cost ................................................................................................... 5-20 5.6 Advanced power strips ............................................................................................................. 5-27 5.7 Pool Pumps .............................................................................................................................. 5-30
6 Attribution and Program Savings ................................................................................. 6-1
6.1 Methodology ............................................................................................................................... 6-1
7 Process Analysis ........................................................................................................... 7-1
8 Findings and Recommendations .................................................................................. 8-1
8.1 Summary of Findings Related to Key Researchable Issues ...................................................... 8-1 8.2 Market Characterization Findings .............................................................................................. 8-5 8.3 Market Assessment Findings ..................................................................................................... 8-6 8.4 Attribution and Program Savings ............................................................................................... 8-7 8.5 Program Issues and Recommendations .................................................................................... 8-8
Appendix A. Survey Instruments ......................................................................................... A-1
Appendix B SRBI Weighting Methodology ..................................................................... B-1
Appendix C Comparison Area Memo .............................................................................. C-1
vi

List of Figures Figure 2-1: Number of Active Retail Partners by Year .......................................................... 2-5 Figure 2-2: Active Retail Partners by Designated Market Area (DMA) Fourth Quarter 2012 . 2-6 Figure 2-3: Shift in Active Retail Partners from Q12010 to Q42012 by Designated Market Area (DMA) ................................................................................................................. 2-6 Figure 2-4: Number of Manufacturer Partners by Year ......................................................... 2-7 Figure 2-5: Total Cumulative NYSERDA NYPP Incentives Paid .......................................... 2-9 Figure 2-6: New York Products Program Logic Model Diagram ......................................... 2-16 Figure 4-1: 2008-2012 New York Appliance Distributor Shipments ...................................... 4-3 Figure 4-2: 2009-2012 Shift from Previous Year in New York Appliance Distributor Shipments 4-4 Figure 4-3: Distribution Channels for Major Appliances ........................................................ 4-5 Figure 4-4: Internet Usage for Appliance Research and Purchase – All Appliances ........... 4-11 Figure 4-5: NYSERDA Region Market Penetration of ENERGY STAR Refrigerators by Year and Partnership Status ................................................................................................. 4-18 Figure 4-6: NYSERDA Region Market Penetration of ENERGY STAR Clothes Washers by Year and Partnership Status .............................................................................. 4-19 Figure 4-7: NYSERDA Region Market Penetration of ENERGY STAR Dishwashers by Year and Partnership Status ............................................................................................ 4-20 Figure 4-8: NYSERDA Region Market Penetration of ENERGY STAR Room ACs by Year and Partnership Status ................................................................................................. 4-21 Figure 5-1: Consumer Awareness of ENERGY STAR Label ................................................ 5-2 Figure 5-2: Consumer Awareness of ENERGY STAR Label ................................................ 5-3 Figure 5-3: Consumer Awareness of ENERGY STAR Most Efficient ................................... 5-4 Figure 5-4: Consumer Understanding of the ENERGY STAR Label .................................... 5-5 Figure 5-5: Awareness of ENERGY STAR or Energy Efficiency Advertisement, 2010-2012 5-6 Figure 5-6: Where Consumers Saw Information or Ads about the ENERGY STAR Label, 2010-2012 ................................................................................................................... 5-7 Figure 5-7: Media Used by Retailers to Advertise ENERGY STAR Products, 2010-2012 .... 5-8 Figure 5-8: Customers Reporting that a Previous ENERGY STAR Purchase Influenced Recent ENERGY STAR Purchase .......................................................................................... 5-9 Figure 5-9: Likelihood of Future ENERGY STAR Purchase ............................................... 5-10 Figure 5-10: Consumers Likelihood of Recommending ENERGY STAR Products ........... 5-11 Figure 5-11: Influence of the ENERGY STAR Label on Purchase Decision: Percentage of Respondents Stating “Extremely Influential” or “Very Influential” ....................................... 5-12 Figure 5-12: Influence of ARRA on Purchase Decision: Percentage of Respondents Stating “Extremely Influential” or “Very Influential” ................................................................. 5-14 Figure 5-13: Retailers’ Perceived Change in Consumer Demand for ENERGY STAR Products ..................................................................................................... 5-15 Figure 5-14: Reasons for Increased Consumer Demand for ENERGY STAR Products ... 5-16 Figure 5-15: Reasons for Decreased Consumer Demand for ENERGY STAR Products .. 5-16 Figure 5-16: Percent of Retailers that would continue Promotion or Stocking of ENERGY STAR Appliances without the NYPP ..................................................................... 5-17
vii

Figure 5-17: Self-reported Percent of Displayed Models in Stores That Are ENERGY STAR Certified ...................................................................................................... 5-19 Figure 5-18: Price Difference between ENERGY STAR and Non-ENERGY STAR Refrigerators (2004-2011) ..................................................................................................... 5-24 Figure 5-19: Price Difference between ENERGY STAR and Non-ENERGY STAR Dishwashers (2004-2011) ..................................................................................................... 5-24 Figure 5-20: Price Difference between ENERGY STAR and Non-ENERGY STAR Clothes Washers (2004-2011) .............................................................................................. 5-25 Figure 5-21: Percent of Retailers that Price ENERGY STAR Products Higher, Lower, or the Same as Non-ENERGY STAR Products ..................................................................... 5-26 Figure 5-22: Reason for Advanced Power Strip Purchase ................................................ 5-29 Figure 5-23: Availability of Advanced Power Strips in Partner Retailer Storefronts ........... 5-30 Figure 5-24: Survey Respondent by Business Type ......................................................... 5-31 Figure 5-25: Knowledge of NYSERDA NYPP ................................................................... 5-31 Figure 5-26: Retailer and Manufacturer Reported Consumer Knowledge of High-efficiency and ENERGY STAR Pool Pumps ......................................................................................... 5-33 Figure 5-27: Retailer and Manufacturer Reported Primary Market Barriers to Consumer the Purchases of High-efficiency Pool Pumps ....................................................................... 5-34 Figure 5-28: Retailer and Manufacturer Reported Key Reasons Consumers Purchase High-efficiency Pool Pumps .................................................................................................. 5-35 Figure 5-29: Promotion of High-efficiency and ENERGY STAR Pool Pumps.................... 5-35 Figure 5-30: Expected High-efficiency Pool Pump Sales and Market Changes ................ 5-37 Figure 6-1: ENERGY STAR Market Penetration of High Impact Measure Appliances in NYSERDA vs. Comparison Area ......................................................................................... 6-4 Figure 6-2: Results of the Consumer Survey Logit Model .................................................... 6-6 Figure 6-3: ENERGY STAR Market Penetration of Appliances in NYSERDA vs. Comparison Area based on D&R All Retailer Sales ................................................................ 6-7 Figure 6-4: ENERGY STAR Market Penetration of Appliances in NYSERDA vs. Comparison Area based on D&R Same Group of Retailer Sales ............................................ 6-7 Figure 6-5: ENERGY STAR Market Penetration of Appliances in NYSERDA versus. Comparison Area based on Consumer Survey ....................................................................... 6-8 Figure 7-1: NYSERDA Partner Retailer Storefront Overall Level of Satisfaction with NYPP . 7-4 Figure 7-2: NYSERDA Partner Retailer Storefront Respondents Awareness of 2013 NYPP Changes ....................................................................................................................... 7-4 Figure 7-3: NYSERDA Partner Retailer Storefront Respondents (those that were aware of program changes) Attitudes of Program Changes .................................................... 7-5 Figure 7-4: Total Cumulative NYSERDA NYPP Incentives Paid .......................................... 7-6 Figure 7-5: NYSERDA NYPP Co-Funding Ratio from 2009-2012 ........................................ 7-7
viii

List of Tables Table 2-1: ARRA Rebates Paid in NYSERDA Region from 2010-2012 ............................... 2-4 Table 2-2: Total Incentive Dollars Awarded and Estimated Co-Funding from NYPP Inception through 2012 ................................................................................................. 2-8 Table 2-3: Annual Incentive Dollars Awarded from NYPP 2010 through 2012 .................... 2-9 Table 2-4: Annual Point-of-Purchase (POP) Material Placement in NYSERDA retailers 2010-2012 ............................................................................................................... 2-10 Table 2-5: Data Collection Activities for NYPP Evaluation ................................................ 2-12 Table 3-1: Overview of NYPP Market Actor Survey Efforts ................................................. 3-5 Table 3-2: Data Collection Efforts by Topic Area ................................................................ 3-6 Table 3-3: MCAP Residential End-Use Customer Telephone Survey Sample Size by Product 3-7 Table 3-4: MCAP Residential End-Use Customer Telephone Survey Disposition ............... 3-8 Table 3-5: Comparison Area Residential End-Use Customer Telephone Survey Sample Size by Product ........................................................................................................ 3-10 Table 3-6: Comparison Area Residential End-Use Customer Telephone Survey Completes by Product and Region .......................................................................................................... 3-10 Table 3-7: Comparison Area Residential End-Use Customer Telephone Survey Disposition ................................................................................................................ 3-10 Table 3-8: MCAP Partner Retailer Storefront Survey Disposition ...................................... 3-12 Table 4-1: Market Share for Top Five Retailers .................................................................. 4-6 Table 4-2: Primary Appliance Purchaser ............................................................................. 4-7 Table 4-3: Important Features in Selecting a Model ............................................................ 4-8 Table 4-4: Information Source Used for Products ............................................................... 4-9 Table 4-5: Internet Sites Visited ........................................................................................ 4-10 Table 4-6: Purchase Location ........................................................................................... 4-10 Table 4-7: Summary of 2010-2012 ENERGY STAR Appliance Market Share: NYSERDA 4-15 Table 4-8: Summary of 2010-2012 ENERGY STAR Appliance Market Share: Comparison Area .................................................................................................................. 4-17 Table 4-9: NYSERDA Partner Store ENERGY STAR Market Penetration for Other Measures .................................................................................................................... 4-22 Table 5-1: Internet Sites Visited that Displayed the ENERGY STAR Logo on Products, 2010-2012 ............................................................................................................... 5-7 Table 5-2: Influence of the FTC Label on Purchase Decision ........................................... 5-13 Table 5-3: Partner Retailer Self-Reported Sales Boost from NYPP .................................. 5-18 Table 5-4: Salesperson Discussion Regarding Energy Efficiency and ENERGY STAR .... 5-20 Table 5-5: Incremental Cost Comparison between ENERGY STAR and Non-ENERGY STAR Products – Nominal 2011 Dollars ........................................................ 5-23 Table 5-6: Retailer Self-reported Method of Determining Product Price ............................ 5-25 Table 5-7: Originally in Market to Purchase Advanced Power Strip or Traditional Power Strip .......................................................................................................... 5-27 Table 5-8: Electronics Purchased in Conjunction with the Advanced Power Strip ............. 5-28 Table 5-9: Sales and Market Share, by Pool Pump Type .................................................. 5-36
ix

Table 6-1: Review of 2010-2011 ARRA SEEARP Rebates per Household in NYSERDA and Comparison Areas ......................................................................................... 6-3 Table 6-2: NYSERDA Partners Retail Channel Market Share (% of sales by partner status for NYSERDA partners only) ...................................................................................... 6-10 Table 6-3: Partner Retailer Self-Reported Sales Boost from NYPP .................................. 6-11 Table 6-4: 2010 Net Units Credited to the NYPP for High Impact Measures ..................... 6-13 Table 6-5: 2011 Net Units Credited to the NYPP for High Impact Measures ..................... 6-13 Table 6-6: 2012 Net Units Credited to the NYPP for High Impact Measures ..................... 6-13 Table 6-7: 2010 Net Sales and Measure Savings Estimates for NYPP ............................. 6-14 Table 6-8: 2011 Net Sales and Measure Savings Estimates for NYPP ............................. 6-15 Table 6-9: 2012 Net Sales and Measure Savings Estimates for NYPP ............................. 6-16 Table 6-10: Overall Annual and Cumulative Net Savings Estimates for the NYPP .............. 6-17 Table B-1: New York Sample Weights ................................................................................... 3 Table B-2: Comparison Area Sample Weights ....................................................................... 6
x

Summary
S.1 Evaluation Objectives
This report presents the findings of the Market Characterization, Market Assessment, Process, and
Market-Based Impact Evaluation (MCAP) evaluation of the New York State Energy Research and
Development Authority (NYSERDA) New York Products Program (NYPP). The evaluation was led by
Apex Analytics, LLC (Apex), as part of the Research Into Action Process/Market MCAP evaluation
team, represented by Research Into Action, Inc., Navigant Consulting, Inc., Apex, and Abt SRBI. This
study focused on activities from program years 2010 through 2012. The primary objectives of this study
were to examine the program design and delivery to understand the current program’s successes and
challenges, provide data and information to inform Program decision-making, and assess the NYPP’s
progress based on changes in markets over time with a specific focus on key progress metrics.
S.2 Participation to Date
As of December 31, 2012, the NYPP had 188 participating partners, representing 823 active retail store
fronts by the end of 2012. Independent retailers comprised a minority of the storefronts (19%), while the
majority (81%) were part of a chain. During the 2010-2012 timeframe the Program also offered 423 full
retailer training sessions with a total of 3,185 participants. During this same time period, the NYPP paid
6,237 incentives worth $13.7 million to participating retailers and manufacturers, with a large shift in
these incentives focused towards manufacturer buydowns. Cumulatively, from the time of its inception in
1999 to the end of 2012, the Program paid 28,897 incentives worth over $29.5 million.
S.3 Market Characterization – Findings
Market characterization provides background information useful in defining programs, delivery concepts,
target markets, and the program potential (see Section 4). “Big box” retailers continue to dominate the
market based on the results of the distribution channel analysis: Over 60% of the consumer survey
respondent purchases came from the top five “big box” retailers, with the highest concentration for
refrigerators (70%) and lowest for room air conditioning units (49%). Market share was estimated for all
products through the residential end-use customer survey, sales data from the National ENERGY STAR®
Partners, and NYSERDA ENERGY STAR Partners. NYSERDA area ENERGY STAR market shares
were high for all products studied, with the highest market share being obtained by dishwashers (75%),
followed by clothes washers (61%), refrigerators (54%), and room air-conditioners (48%).
S-1

S.4 Market Assessment – Findings
Market assessment tracks changes in markets over time with a specific focus on market indicators that
might be influenced by the NYPP (see Section 5). Consumer awareness and understanding of the
ENERGY STAR label has effectively plateaued: aided awareness was 89% in 2010 and is slightly lower
at 86% in the current (2013) telephone survey of residential end-use customers.
Market share analysis indicates that the ENERGY STAR market share of most appliances has increased
only slightly since 2009. A portion of this increase can be traced to the American Recovery and
Reinvestment Act (ARRA) rebates (both within New York State and nationally), available through most
of the evaluation timeframe of 2010-2012 (though most of the rebates occurred in 2010). Market shares in
NYSERDA territory are no longer any higher than shares in non-Program areas. The incremental cost
analysis showed that ENERGY STAR features are typically bundled with high end features, the reason
that simple prices are higher than modeled analyses (this is particularly true for refrigerators) and the
incremental cost has actually gone down or stayed flat when modeled and controlled for covariates and
inflation.
S.5 Estimated Net Savings - Findings
The Evaluation team examined data from a multitude of resources related to ENERGY STAR products in
order to estimate net savings attributable to NYPP activities. The 2010-2012 Program resulted in the
installation of almost 155,000 ENERGY STAR appliances, resulting in estimated savings of 20,423
MWh of energy, 5.5 MW of peak demand savings, and 36,747 MMBtu of fuel savings. From the Program
inception (1999) through year end 2012 the Program has saved 790,439 MWh, 151 MW, and 464,541
MMBtus.1 Over the three year evaluation period, the NYPP contributed 2.6 % of cumulative electricity
savings while accounting for almost half of the incentives.2
1 Cumulative program savings do not take into account the retirement of installed measures reaching the end of their useful life, resulting in reduced program savings. This measure retirement analysis was conducted separately by NYSERDA.
2 It should be noted that up through 2007 the NYPP included CFL lighting savings, which represented approximately 50% of program savings.
2

The 2010-2012 program savings translates into slightly over 10% net attribution (10.5% of ENERGY
STAR appliance sales being reported by the program retailers are attributed to the program). Though the
savings and attribution appears to be very low, this is not necessarily a result of poor program
implementation or design. Rather, based on the historical performance and indicators of the program, the
evaluation team believes the NYPP has helped transform the ENERGY STAR market.
S.5 Program Issues and Recommendations
The following recommendations are based on the Evaluation Team’s review of the extensive evaluation
data and results. A number of the most important recommendations are included below, with additional
recommendations included in Section 8.
Issue: The NYSERDA partner ENERGY STAR market share is very high (in 2012 market share was
75% for clothes washer, 88% for dishwasher, 72% for refrigerators, and 67% for Room AC). ENERGY
STAR awareness has not changed significantly since 2010 because the ENERGY STAR market is
considered a mature market.
• Recommendation: Considering the current program design (shifting focus from all ENERGY STAR products to Most Efficient products) and the findings contained in this report, NYSERDA should carefully consider the viability and continued support of consumer appliances. It is critical to track market share very closely and monitor potential program impacts, but the current form of the program is not able to track Most Efficient products. There are significant risks and constraints associated with the future cost effectiveness and evaluability of the program, including: the uncertainty surrounding estimating baseline sales, the availability and sharing of partner sales data, potentially higher incremental costs, lower savings due to new standards, and a limited range of Most Efficient models. If early indicators show lackluster market lift, NYSERDA should seriously reconsider continuation of this program.
Issue: Market lift of ENERGY STAR products was somewhat evident in NYSERDA-only partners, of
limited impact for retailers that team with both NYSERDA and also work with national ENERGY STAR
program (big box), and not evident at all for retailers outside of the program but within the NYSERDA
area.
• Recommendation: Focus of recruitment efforts should be to engage with retailers that are not receiving support through the national ENERGY STAR program to help them sell more efficient products. Furthermore, reconsider the extensive use of manufacturer buydown incentives since they drastically increased while the program showed minimal evidence of market lift.
3

Issue: Partners reported varying levels of satisfaction with the program, with manufacturers being both
the most unwilling to participate in interviews and showing the lowest satisfaction. The majority of
comments related to dissatisfaction included frustration with the changes made during the 2010-2012
evaluation period, and the more recent changes made to the program design for 2013.
• Recommendation: Change can be unsettling, especially when the focus of a program shifts from what people know and expect to the “unknown.” The challenge is convincing the partners that the change is forward looking and based on findings from credible evaluations. The program needs to continue to make an effort to communicate the necessity of changes to the various partners so that it is clear why the changes are happening, the issues being addressed, and the expected benefits.
Issue: Awareness of the NYPP is low among pool pump market actors, in turn leading to a small number
of program participants in the pool pump program. Compounding the issue is a perceived lack of demand
for high-efficiency pool pumps by consumers.
• Recommendation: Take steps to educate both the public and pool pump manufacturers/retailers about the NYPP. Specifically, NYSERDA can reach out to company headquarters, industry associations, pool pump distributors, hold educational classes/informational sessions about high-efficiency pool pumps, and engage in general awareness campaigns to increase product demand.
Issue: Consumer demand for advanced power strips is relatively low with only half of purchasers initially
seeking an advanced power strip. Also, among partner retailer storefronts, only 10% stated their store
carried advanced power strips, with almost another 10% unsure if their store carried advanced power
strips.
• Recommendation: An opportunity exists for NYSERDA to educate both the public and storefront retailers about the benefits of advanced power strips. As only half of purchasers go to the store specifically for an advanced power strip, in-store materials and salesperson knowledge are likely to heavily impact consumer purchases.
4

1 Introduction The State of New York Public Service Commission established the Energy Efficiency Portfolio Standard
(EEPS) to fund energy efficiency assistance in New York State. Customers of Central Hudson Gas and
Electric Corporation, Consolidated Edison Company of New York, Inc., New York State Electric and Gas
Corporation, Niagara Mohawk Power Corporation d/b/a National Grid, Orange and Rockland Utilities,
Rochester Gas and Electric Corporation, Corning Natural Gas Corporation, KeySpan Gas East
Corporation d/b/a National Grid, Brooklyn Union Gas Company d/b/a National Grid NY, and National
Fuel Gas Distribution Corporation fund EEPS through payment of the System Benefits Charge (SBC) on
utility bills.
The New York Products Program (NYPP) was funded through Systems Benefit Charge (SBC) phase III
for program years 2006 through 2011, by Technology and Market Development (T&MD) funding
beginning in 2012, and the 2012 program year is funded through SBC4 funding.
The New York Products Program (NYPP; previously called the New York Energy $martSM Products
Initiative), established in 1999, seeks to increase sales of residential energy-efficient appliances, lighting,
and home electronics products. NYPP works on the supply side with retailers and manufacturers and on
the demand side by marketing to consumers. NYPP’s overall goal is market transformation: to increase
awareness of and demand for energy-efficient products, including ENERGY STAR® certified appliances,
lighting, and home electronics. Program activities include incentives for cooperative advertising and
special promotions, as well as marketing campaigns3 on both the supply and demand sides of the
appliance and lighting markets. Other activities include the development and distribution of special point-
of-purchase (POP) materials; development of educational materials, inclusion on the www.nyserda.ny.gov
website, coordination with retailers to obtain donations of ENERGY STAR appliances and lighting in
support of the Program's outreach at trade shows, home shows, and county and State fairs, as well as
training sessions for retail sales staff and managers.
3 On the demand side, the Products Program is supported by a statewide consumer awareness campaign that promotes the benefits of ENERGY STAR certified and “Most Efficient” products, and higher efficiency tier CEE rated products. On the supply side, the Products Program financially supports manufacturers’ and retailers’ efforts to advertise the benefits of those products.
1-1

NYPP has been evaluated a number of times, with the most recent evaluation (completed in 2012)
covering program years 2007-2009. This evaluation updates many of the market progress metrics
developed in the prior evaluations, for program years 2010-2012. This evaluation is also more
comprehensive than some of the prior evaluations, covering process, market and market-based impact
evaluation.
1-2

2 Program Description NYPP, established in 1999, seeks to increase sales of residential energy-efficient appliances, lighting and
home electronics products. This initiative works on both the supply and demand sides of the market. To
support its primary goal of market transformation, the NYPP seeks: 1) to increase the supply of products
through partnerships with retailers, manufacturers and distributors, and 2) to create demand for high-
efficiency and ENERGY STAR® products through consumer awareness and understanding of the
ENERGY STAR label, and 3) support other New York State Energy Research and Development
Authority (NYSERDA) residential-sector programs through increased coordination and leveraging
opportunities. Beginning in 2010, the program began supporting added additional measures, including
advanced power strips (APS) and pool pumps.4
To support these activities, the Program drew on a 13-year budget of $148.9 million for the Market and
Community Support Program, which also included funding for marketing of the Home Performance
Program, the Multifamily Building Performance Program, the summer and winter tips campaigns, and
leveraged campaigns such as “Change a Light, Change the World,” as well as marketing assistance to
mid-stream partners; the GetEnergySmart.org website and Workforce Development. The 2010 and 2011
program years are bundled under the SBC3 funding umbrella, while 2012 is officially part of the SBC4
T&MD funding phase. The NYPP budget for January 1, 2009, through June 30, 2011, comprised
approximately $10.0 million in SBC funding. Though the 2012 program year falls into the SBC4 T&MD
funding, the program design and implementation remained consistent with 2010-2011 program design
(focused on ENERGY STAR products) and is therefore included in this evaluation.
NYPP works on the supply side with retailers and manufacturers and on the demand side by supporting a
statewide consumer awareness campaign to promote the benefits of ENERGY STAR products to end-use
consumers. Program activities include incentives for cooperative advertising and special promotions, as
well as marketing campaigns on both the supply and demand sides of the appliance and lighting markets.
4 Note this evaluation addresses ENERGY STAR appliances, advanced power strips, and pool pumps. The evaluation of NYSERDA’s lighting program is being conducted under a separate research effort, though lighting fixtures are included in this reports summary tables since fixtures are reported as part of the NYPP program during the 2010-2012 timeframe. HVAC equipment was added to the upstream component of the Program in 2010, and added to this Program in 2012, and will be evaluated in the future under the Technology & Market Development (T&MD) evaluation effort.
2-1

Other activities include the development and distribution of special point-of-purchase (POP) materials,
inclusion on the www.nyserda.ny.gov website, development of educational materials, coordination with
retailers to obtain donations of ENERGY STAR appliances and lighting in support of the Program's
outreach at trade shows, home shows, and county and State fairs, as well as training sessions for retail
sales staff and managers.
Any manufacturer that makes an ENERGY STAR certified product for sale in the NYPP area may
participate in the program. Retailers who wish to participate must stock, prominently display, and sell at
least four ENERGY STAR models of a qualifying product. Manufacturers and retailers must sign a
partnership agreement to participate and receive incentives. They must also promote their products within
the NYPP area and agree to provide accurate sales (of both ENERGY STAR and non-ENERGY STAR
appliance) data during each month of the partnership agreement.
Lockheed Martin (LM) is the implementation contractor for this program. LM collects, manages, and
reports much of the data used to assess Program progress– including data covering retailers’ monthly
sales, on-site surveys of retail managers, mystery shopping, and stocking, display, and pricing practices.
NYPP has the potential to achieve substantial energy savings for customers while also lowering energy
costs and reducing the negative environmental impacts of energy use.
Key progress metrics developed by NYSERDA include:
• Number of participating retailers and manufacturers • Market share and sales of ENERGY STAR products • Electricity and fuel savings resulting from the Program • Peak demand reduction resulting from the Program
The primary changes made to the program during the 2010-2012 timeframe include the following:
• Adding Advanced Power Strips and Pool Pump measures • Bundling in residential HVAC measures • Adjusted partnership agreement
o added in addendum to make it easier to renew membership
2-2

o combined the partner agreements so regular/gold/platinum5 partners all “shared” one agreement with the incentive budgets detailed by partner type
• Prorating the advertising incentives, only paying for the portion attributable to ENERGY STAR products
• In 2012, the Program reduced, reorganized, and streamlined the team of Account Representatives with larger individual program territories and reassignment of duties. Representatives focused on servicing partners remotely, and only made store visits when necessary. Implementation staff was reduced from eight full time representatives to five.
• The program drastically shifted incentives towards manufacturers, with the manufacturer buydown incentives representing only one-third of all incentives paid to partners in 2009 to three-quarters of all incentives paid in 2012
Though not a direct change in program design, the most significant event that affected the NYPP was the
introduction of American Recovery and Reinvestment Act (ARRA) funds. The significance of the
availability of millions of dollars in ARRA funding during the 2010-2012 timeframe (though most of the
appliance rebate funds were concentrated in the program year 2010) cannot be overstated.6 Table 2-1
below is an overview of the NYSERDA area ARRA rebates paid during the 2010-2012 timeframe.
ARRA funding provided the availability of the following appliance programs:
• In 2010 NYSERDA implemented “New York’s Great Appliance Swap-Out,” an energy-efficient appliance rebate program that offered rebates for the purchase of ENERGY STAR refrigerators, freezers, and clothes washers, and larger rebates were included when bundled with recycling of older inefficient refrigerators and clothes washers, dishwashers. This program began on February 12, 2010 and ended in early March 2011.
• In September 2011 and March 2012, NYSERDA initiated the statewide “Buy Green, Save Green” (BGSG) appliance rebate initiative. This initiative offered rebates for high-efficiency refrigerators and clothes washers, defined as models that qualified for the Consortium for Energy Efficiency’s Tiers two and three efficiency levels. Retail partners promoted it heavily, and funding was exhausted in less than a week during both efforts.
• In September 2011, NYSERDA initiated a New York Storm Relief rebate initiative to help New Yorkers whose homes had been damaged by Hurricane Irene and Tropical Storm Lee recover with efficient appliances and space and hot water heating systems
• In September 2012, NYSERDA initiated a Buy Green, Save Green Program for New York State Local Government, allowing New York State municipalities to apply for rebates on a variety of energy-efficient products, including ENERGY STAR certified appliances, office equipment, and lighting products.
5 Partner types are defined as follows: Regular Partners are 1-14 storefronts, Gold Partners are 15-64 storefronts, and Platinum Partners are 65 or more storefronts.
6 It should be noted here that these parallel programs also affected many of the results observed during the appliance in-store survey administered by Lockheed Martin and as noted in their results within the annual Participant Practices Reports (PPR).
2-3

Table 2-1: ARRA Rebates Paid in NYSERDA Region from 2010-2012
Source: NYSERDA and D&R provided rebate totals. Note that the swap-out totals are exclusive of Long Island rebates using known residence location zip codes that existed in the rebate database, while the storm relief, BGSG, and local government program totals relied on the same Long Island percent reduction (by appliance) as the swap-out.
Appliance Rebate Source 2010 2011 2012
Clothes Washers Swap Out 66,130 3,232
BGSG & Loc Gov
5,639 5,456 Storm Relief
2,947
Dishwashers Swap Out 2,110 69
BGSG & Loc Gov Storm Relief
Refrigerators Swap Out 69,268 2,427
BGSG & Loc Gov 5,898 5,381 Storm Relief 1,818
Room ACs Swap Out BGSG & Loc Gov 200 Storm Relief
2.1 Target Population
The primary target population for the NYPP is the 6.3 million households in the NYSERDA region (all of
New York State excluding Long Island’s Nassau and Suffolk counties). The Program partners with
qualified appliance and lighting fixtures retailers and manufacturers in order to reach this target
population. By connecting with this population, the NYPP seeks to help foster long-term consumer
awareness of the benefits of ENERGY STAR products and to increase market penetration of ENERGY
STAR appliances, lighting, electronics, and other home products.
2.2 Program Participation to Date
At the end of 2012, the NYPP had 823 participating partners, representing 99 appliance-only retail store
fronts, 177 appliance and consumer electronics retail storefronts, and 547 active lighting storefront
partners. The majority of the storefronts (81%) were part of a chain, while 19% were independent
retailers. The Program also offered 743 full retailer training sessions, with a total of 3,185 participants.
During the 2010-2012 period, the NYPP paid 6,237 incentives worth $13,711,560 to participating
retailers and manufacturers.
As shown in Figure 2-1, levels of retail partner participation have changed over time based on products
supported, incentives offered, and Program needs. The count of retail owners includes retail chain owners
2-4

rather than each individual store. The dramatic loss in the total number of storefronts in 2011 is
attributable to the withdrawal of DUANE Reade, Best Buy, and PC Richards from the program.
Figure 2-1: Number of Active Retail Partners by Year
Source: Quarterly Reports for the NYPP
The overall reduction in storefronts was most prominent in the New York City metropolitan region
(Figure 2-3) – during the 2010-2012 period, there was a noticeable shift in retailers away from the New
York City Metro Area (dropped to 27% from 35% in 2009) to other designated metropolitan areas
(Buffalo, Syracuse, and Rochester all increased). The number of active retail partners at the end of 2012
was still highest in the New York City metropolitan area (representing 27% of all NYSERDA retailers),
followed by Syracuse (20%) and Buffalo (17%). The geographic distribution of retailers is now even
better represented across a variety of metropolitan areas throughout New York State (Figure 2-2).
0
200
400
600
800
1000
1200
1400
2001 2002 2003 2004 2005 2006 2007 2008 2009 2010 2011 2012
Activ
e Re
tail
Part
ners
Year
Retailers (Owners) Retailers (Retail Store Fronts)
2-5

Figure 2-2: Active Retail Partners by Designated Market Area (DMA) Fourth Quarter 2012
Source: Quarterly Reports for the NYPP
Figure 2-3: Shift in Active Retail Partners from Q12010 to Q42012 by Designated Market Area (DMA)
Metro New York 27%
Syracuse 20%
Buffalo 17%
Albany 12%
Rochester 12%
Binghampton 7%
Central Hudson 5%
0 100 200 300 400 500 600 700
Metro New York
Syracuse
Buffalo
Albany
Rochester
Binghampton
Central Hudson
Q1 2010 Q4 2012
2-6

In addition to the retail partners, the Program also works directly with manufacturer partners. The
Program enrolled 14 manufacturer partners in the first year (2001). Manufacturer enrollment dropped to
nine in 2002, then steadily increased beginning in 2003, with 52 enrolled as of the end of 2012 (Figure
2-4). The actual number of appliance manufacturers out of the 52 partner’s remains only five (the overall
numbers are mostly lighting manufacturers).
Figure 2-4: Number of Manufacturer Partners by Year
Source: Quarterly Reports for the NYPP
14 9
19 23 23 22
28
34 39
43 47
52
0
10
20
30
40
50
60
2001 2002 2003 2004 2005 2006 2007 2008 2009 2010 2011 2012
Man
ufac
ture
r Par
tner
s
Year
The Program has aggressively pursued partner incentives and co-funding as a means of achieving energy
savings, though the large amount spent over the three-year evaluation timeframe does not appear to have
had the expected impact. From the NYPP inception in 1999 through the end of 2012, the NYPP had paid
out 27,897 incentives worth more than $29.5 million (Table 2-2 and Figure 2-1). The dollars spent in the
three year period from 2010 through 2012 were almost equal to the total cumulative dollars spent from
the 10 year period of program inception (1999) through 2009. The various partner incentives are defined
as follows:
• Retailers Co-Op Advertising: Retailers are allowed a portion of their incentive budget to be used for various types of advertising and the program would share in the cost at 50/50 split. The advertising has to be pre-approved and the invoice must be submitted for reimbursement. There are specific requirements such as number of models, education taglines, logos, etc. that must be followed.
2-7

• Retailer Special Promotions: Promotion types vary in program years – includes price reduction (markdown), special print, in-store demos, home shows and in early years billboards, truck decals, etc. Special Promotions also include radio and television advertising. (Prior to 2014 they were a 50/50 split).
• Retailer Market Share: Market Share incentives are special incentive programs offered to retailers for a specified period of time to help increase the program’s overall ENERGY STAR sales for a specific product category. NYSERDA has implemented market share programs for Air Conditioners and Clothes Washers. To be successful a retailer must increase their ENERGY STAR market share during the designated time period. The incentive payment schedule is established based on the retailer’s performance in the product category during the same time frame the previous year.
• Manufacturer Special Promotions: Typically Price Reduction / Buy down promotions. Also includes in-store events, industry shows, and regional marketing campaigns. All promotions must be preapproved.
• Manufacturer Co-Op Advertising: Manufacturers can submit for pre-approval on print, radio and television advertising for a portion of their annual budget. Manufacturers typically not interested in co-op advertising and use program funding for price reduction promotions.
These incentives were matched more than two-fold by the retailers and manufacturers, who spent an
estimated $65.7 million in co-funding (since program inception). In other words, for every dollar the
Program spent on incentives, the participating retailers and manufacturers spent approximately $2.20 on
marketing.
Table 2-2: Total Incentive Dollars Awarded and Estimated Co-Funding from NYPP Inception through 2012
Source: Quarterly Reports for the NYPP
Funding Source
Retailers Co-Op
Advertising
Retailer Special
Promotions
Retailer Market Share
Manufacturer Incentives
Manufacturer Co-Op
Advertising Total
NYSERDA Incentive
$10,403,782 $4,736,344 $2,390,616 $11,820,904 $159,914 $29,511,560
Estimated Co-Funding
$30,663,774 $11,144,366 NA $23,239,688 $682,011 $65,729,839
Total $41,067,556 $15,880,710 $2,390,616 $35,060,592 $841,925 $95,241,399
2-8

Figure 2-5: Total Cumulative NYSERDA NYPP Incentives Paid
Source: Quarterly Reports for the NYPP
Retailer cooperative advertising no longer makes up the highest proportion of incentives (was 71% in
2009), now representing only 35% of all incentive dollars spent. The largest shift in incentives occurred
by the introduction of manufacturer incentives: manufacturer incentives represented 40% of cumulative
program incentives paid through 2012, up from 0% in 2009. To examine this shift in greater detail, the
Team compiled the actual annual dollars spent from 2010 through 2012 (Table 2-3).
Table 2-3: Annual Incentive Dollars Awarded from NYPP 2010 through 2012
Source: Quarterly Reports for the NYPP
Incentives 2010 2011 2012 % of Total
Manufacturer Incentives $2,829,305 $4,284,053 $2,411,672 70% Retailers Co-op Ad Incentives $587,599 $484,747 $393,112 11% Retailer Special Promo Incentives $1,027,915 $1,155,394 $466,371 19% Retailer Market Share Incentives $22,825 $0 $0 0% Manufacturer Incentives - Co-op Ads $0 $0 $0 0%
$0
$5,000,000
$10,000,000
$15,000,000
$20,000,000
$25,000,000
$30,000,000
$35,000,000
Ince
ntiv
es ($
)
Time Period
2-9

The introduction of manufacturer incentives in 2010 was a major shift in spending for the program, and
accounted for 70% of all incentives spent during the 2010-2012 timeframe. During the 2010-2012
timeframe, all other incentives were reduced or did not receive any budget – including retailer co-op
advertising, retailer special promotion, retailer market share, and manufacturer co-op advertising
incentives. Furthermore, according to interviews with NYSERDA staff, the general awareness campaign
funds were depleted before the 2010-2012 timeframe, leaving considerably smaller funds available for the
marketing campaigns. Finally, the point-of-purchase material available during the evaluation timeframe
drastically declined in 2012 (Table 2-4).
Table 2-4: Annual Point-of-Purchase (POP) Material Placement in NYSERDA retailers 2010-2012
Source: Quarterly Reports for the NYPP
POP material placement 2010 2011 2012
Poster 2,603 883 0 Brochure 10,339 13,828 471 Label 16,827 27,572 2,693 Signage 2,306 4,932 362 Video 0 0 0
2.3 Evaluation Goals
The Market Characterization, Market Assessment, Process, and Market-Based Impact Evaluation
(MCAP) team’s primary goal is to provide data and information to inform Program decision-making. The
NYPP constitutes an investment of SBC funds, and the MCAP work effort is designed to ascertain the
return from these investments and how these returns can be enhanced.
Process evaluations are conducted to understand the effectiveness of program design, implementation,
and program processes and explore opportunities for improvement. Market Characterization (MC)
describes energy markets and provides background information to help define programs, delivery
concepts, target markets, and potential for different types of programs. Market Assessment (MA) tracks
changes in markets with a specific focus on market indicators that might be affected by the Program in
2-10

question; as such, this effort can be used to track Program progress. In addition to MC and MA, the
Evaluation Team also estimated net impacts attributable to the Program, which may be useful in assessing
Program accomplishments and as input into Program decisions regarding further investment, program
revisions and enhancements, exit strategies, and other policy and funding decisions.
This report examines each of the above items in the context of the NYPP: a process report to help guide
opportunities for improvement, a characterization of the market eligible to participate in the NYPP, an
assessment of the NYPP’s progress based on a number of metrics, and finally an assignment of attribution
of the energy savings and peak demand reduction attributable to the NYPP.
2.4 Research Approach
The research approach used by the Evaluation Team to conduct the evaluation of the NYPP consisted of
the following activities:
• Telephone meetings with NYPP and Lockheed Martin implementation staff • Review of the NYPP tracking database and quarterly reports • Review of numerous secondary data sources, including reports prepared for NYSERDA and for
other programs similar to the NYPP • Development of a comparison region, which establishes a baseline market to compare sales
between NYSERDA region and a control group region • Primary data collection via surveys and interviews with the following market-actor groups:
o Residential end-use customers (in NYSERDA and comparison regions) o Participating appliance retail storefronts o Participating and non-participating appliance retail corporations o Participating appliance manufacturers o Participating and non-participating Pool Pump manufacturers, contractors, retailers, and
distributors o Members of the Department of Energy (DOE), Environmental Protection Agency (EPA),
and the Appliance Standards Awareness Project (ASAP)
• Analyze pricing and incremental cost of ENERGY STAR products in relation to standard efficiency products using simple averages and multivariate regression models (controls for product features)
• Data analysis, including:
o Program Tracking database review – to assess whether there were key measures that accounted for the majority of program savings (known as high impact measures, or HIM)
o Process analysis – how the program is working and how it can be improved o Market characterization analysis – understanding market qualities of the key targeted
products (size, distribution channels, purchasing decisions, ENERGY STAR market penetration, market share)
2-11

o Market Assessment Analysis – overall program effectiveness (awareness, perceived value, availability, cost, behavior changes)
o Attribution and program savings – understand impacts due to market transformation programs
This comprehensive approach examined a variety of primary and secondary data sources to generate
information on a number of topics, including the size of the residential market for qualifying appliances;
identifying the high impact appliances that would serve as the focus of the evaluation – ultimately
identified as clothes washers, refrigerators, dishwashers, and room air conditions; the type and quantity of
efficiency measures installed as a result of the Program; changes in awareness and understanding of
energy efficiency; and the estimated influence and attribution of energy savings to the NYPP. Table 2-5
summarizes the evaluation data collection activities, methodology and key objectives.
Table 2-5: Data Collection Activities for NYPP Evaluation
Evaluation activity Methodology Research Topics
Tracking Database Review
Summarize program data
Establish high impact measures to focus evaluation efforts
NYSERDA and Lockheed Martin Staff Interviews
Telephone In-Depth Interview
Understand the experiences and lessons learned in working with retailers and manufacturers Review previous and current internal research Document planned program revisions
End-Use Customer Surveys New York State
Telephone Survey
Equipment saturations Purchase patterns by distribution channel Awareness/influence of ARRA rebates Efficient product market share
End-Use Customer Surveys Comparison Area
Telephone Survey
Equipment saturations Purchase patterns by distribution channel Awareness/influence of ARRA rebates Efficient product market share Establish baseline sales for attribution analysis
Participating Appliance Retailer Surveys (Storefront)
Telephone Survey
Influence of NYPP Trends in consumer purchasing behavior Storefront stocking behavior NYPP satisfaction Impacts of ARRA Sales of APS units
Participating Appliance Manufacturer Interviews
Telephone Interview
Influence of the program on business practices Changes in the market Perceived sustainability of program impacts NYPP Satisfaction
2-12

Table 2–5 continued
Evaluation activity Methodology Research Topics
Participating Appliance Retailer Interviews (Corporate)
Telephone Interview
Influence of NYSERDA program efforts on sales of ENERGY STAR and other high-efficiency products in NY and other areas of the United States Changes in awareness, availability, pricing, and marketing efforts that may have resulted from the NYPP Perceived sustainability of program impacts NYPP Satisfaction
Non-participating Appliance Retailer Interviews (Corporate)
Telephone Interview
Perceptions regarding the program Perceived market effects due to the program
Nonparticipating and participating pool pump manufacturers, retailers and contractors
Telephone Interview
Market share for high-efficiency pool pumps Market barriers/drivers for high-efficiency pool pumps How the program might better team with manufacturers and retailers to more closely to promote high-efficiency pool pumps
DOE/EPA/ASAP Interviews
Telephone Interview
Influence of NYSERDA program efforts on sales of ENERGY STAR and other high-efficiency products in NY and other areas of the United States (focus on comparison areas)
2.5 Program Logic and Researchable Issues
According to the most recent logic model report,7 the ultimate goal of the NYPP is market
transformation: to increase awareness of and demand for energy-efficient products, including ENERGY
STAR certified appliances, lighting, and home electronics. The Program has three primary approaches to
achieve that fundamental goal:
1. Increase the supply of products through partnerships with retailers, manufacturers, and distributors,
2. Create demand for ENERGY STAR certified and “Most Efficient” products, and higher efficiency tier CEE rated products through increased consumer awareness and understanding of the ENERGY STAR certification, and
3. Support other NYSERDA residential-sector programs through increased coordination and leveraging opportunities
7 http://www.nyserda.ny.gov/-/media/Files/Publications/PPSER/Program-Evaluation/2013ContractorReports/2013-PLM-NY-Products-Program.pdf
2-13

For a more in-depth review of the program logic please see the Research Into Action, Inc. Logic Model
Report for NYPP, filed in November 2013.8
Based on an assessment of the previous (developed in 2012) Program logic model, (a slightly updated and
more current logic model, developed in 2013, is shown in Figure 2-6), a number of researchable issues
were identified and examined as part of the current evaluation, including:
• Are the advertising campaigns, outreach efforts, and promotional materials effective? How effective? How well do they work together to increase consumer awareness, knowledge, intent and ability to act on those intentions? What is their impact on sales of ENERGY STAR and high-efficiency products?
• Why did the number of participating retail store fronts decline from 2010 to 2012? What can be done to increase the number of participating retailers?
• Is the Program contributing to increased availability and product selection of ENERGY STAR and high-efficiency products?
• Are participating retailers, manufacturers, distributors and contractors pleased with the Program, as well as the functioning of and growth in the market for ENERGY STAR and high-efficiency products?
• Are promotional activities leading to an increase in demand for ENERGY STAR and higher efficiency products (e.g., CEE top tiers and ENERGY STAR Most Efficient products) by end-use customers?
• Are NYSERDA-sponsored efforts contributing to increased ENERGY STAR and higher efficiency product (e.g., CEE top tiers and ENERGY STAR Most Efficient products) sales?
• What is the estimated market share of ENERGY STAR and high-efficiency products? • What is the energy savings and demand reduction that can be attributed to the program efforts? • Are the ENERGY STAR and high-efficiency products meeting consumer expectations? Does
this support their continued and growing interest in the ENERGY STAR label and high-efficiency as product criteria?
• What are the future implications for ENERGY STAR and high-efficiency products? How much continued consumer advertising is needed to maintain a sustainable market for ENERGY STAR and high-efficiency products?
• Are mechanisms in place to determine when market-share sales goals for these products have been met so a product no longer needs to be covered under the program?
• How can the program engage pool pump manufacturers/retailers to work more closely to promote high-efficiency pool pumps?
8 http://www.nyserda.ny.gov/-/media/Files/Publications/PPSER/Program-Evaluation/2013ContractorReports/2013-PLM-NY-Products-Program.pdf
2-14

Evaluation research addressing these questions will help to validate the program theory and will inform
NYSERDA Program staff of Program progress and potential areas for Program refinement. This
evaluation will show qualitative and quantitative results throughout the report answering applicable
questions.
2-15

Figure 2-6: New York Products Program Logic Model Diagram
Source: Logic Model Report submitted by Research Into Action to NYSERDA November, 2013
STO2 Increased demand for Program participation
OP4 Product buy-downs
OP3 Co-funded partner advertising
OP6 Trainings and promotional materials
OP7 Sales data collected
OP2 Retailers, distributors, and manufacturers recruited as partners
A3 Financial Support
A2 Recruit Partners
A4 Collaboration & Coordination
A1 Marketing & Outreach
OP1 Promotional campaigns; marketing & educational collateral; GetEnergySmart website
OP5 Agencies & utilities contacted
STO1 Increased awareness of ENERGY STAR & high-efficiency products & of those products’ benefits
A5 Training & Technical Assistance
A6 Quality Assurance
OP8 Field assessments
OP9 Mystery shopping
STO4 Increased purchases of high-efficiency products
STO3 Increased availability and greater product range of high-efficiency products
STO5 More knowledgeable sales staffs
ITO2 Energy savings, reduced peak demand, and lower bills, environmental and health benefits
ITO1 Increased demand for ENERGY STAR and high-efficiency products without NYSERDA support
STO6 Increased quality of partner network
ITO3 Retailers, manufacturers, and distributors recognize profitability of promoting high-efficiency products without NYSERDA support
LTO2 Energy savings, reduced peak demand, and lower bills; environmental and health benefits
LTO3 Program contributes to achievement of overall SBC Residential portfolio goals
LTO4 Increased availability and product range of high-efficiency products without NYSERDA support
LTO1 Increased proportion of equipment purchased is ENERGY STAR/high-efficiency equipment
External Influences: Changes in political priorities; weather & its impact on customer actions & energy bills; macro-economic conditions affecting investment & energy costs; cost, performance, & availability of efficient technologies; non-NYSERDA EE programs & funding
New York Products Program Logic Model
Activities
Outputs
Short-Term Outcomes (<2 years)
Intermediate-Term Outcomes
(2-5 years)
Long-Term Outcomes (>5 years)
Inputs: Program funding; staff market knowledge & expertise; cross promotion & coordination; implementer’s and partners’ expertise; NYSERDA’s credibility & relationships with key stakeholders
2-16

3 Data Sources This evaluation effort relies on a tremendous amount of information from both primary and secondary
data sources. The team relied on the most accurate and applicable data for each metric and finding
contained in this report. Though there are inherent limitations to data collection, consistency, and
applicability of the data to assess overall market lift associated with an upstream program such as the
NYPP, the team does believe the data collected and compiled for this report are the most representative
and informative available. The following section details the type of data collected, the source of the data,
and how it is used in this report.
3.1 Secondary Data Sources
The evaluation effort leveraged data compiled by various entities, including NYSERDA partners and
national research firms. Secondary data sources used in this report include the following:
• NYSERDA data collected by Lockheed Martin, including:
o Quarterly and annual reports o Participant Practices Reports (PPR) o Biannual pricing reporting o Partner sales database
• Consortium for Energy Efficiency (CEE) datasets • D&R International compiled sales data9
o National ENERGY STAR® partner sales data o Federal ARRA sales data
• State Energy-Efficient Appliance Rebate Program (SEEARP) and other ARRA sales data • Association of Home Appliance Manufacturers (AHAM) sales data • Energy Information Agency (EIA) Residential Energy Consumption Survey (RECS 2009) • US Environmental Protection Agency (EPA) Energy Star database
3.1.1 NYSERDA Data Collected by Lockheed Martin
As the Program Implementer for NYSERDA, Lockheed Martin conducts surveys and collects data on
many program metrics. The Evaluation Team examined Lockheed Martin in-store retailer data and
participant practices reports to assess a number of tracked progress metrics, including shelf space
dedicated to ENERGY STAR products, incremental prices, and retailer staff awareness/knowledge of
9 Please note that while the National ENERGY STAR partner sales data and ARRA sales data were both provided by D&R International, D&R is retained by the EPA and DOE to collect and compile this data
3-1

energy-efficient products and services. Additionally, Lockheed Martin compiles all retailer and
manufacturer partner monthly ENERGY STAR (and non-ENERGY STAR) sales data per the partnership
agreement in the program database.
The NYSERDA program tracking database was used to identify the four high impact measures that were
the focus of the evaluation efforts – these four measures represent almost 90% of all 2010-2012 program
savings.10 The four measures selected were refrigerators, clothes washers, dishwashers, and room air
conditioners. The same four measures were also the focus of the previous two evaluations, so longitudinal
analysis was possible.
3.1.2 Consortium for Energy Efficiency Bi-Annual Energy Star Household Survey
In the fall of 2012, members of the Consortium for Energy Efficiency (CEE) sponsored the 12th national
household survey of consumer awareness of ENERGY STAR. Each year, the survey objectives have
largely been the same: to collect national data on consumer recognition, understanding, and purchasing
influence of the ENERGY STAR label, as well as data on messaging and product purchases. CEE
members may choose to supplement the national sample by adding additional data points in order to
assess label awareness in their local service territories. In 2012, additional surveys were conducted in the
NYSERDA area, and the metropolitan areas of Denver and Minneapolis/St. Paul.
This report focuses on results from the NYSERDA area over-sample as compared to the national sample.
This report discusses the results of the CEE 2012 ENERGY STAR Household Survey, building on prior
years’ survey results and focusing on the extent to which consumers recognize the ENERGY STAR label,
understand its intended messages, and use (or are influenced by) the label in their energy-related purchase
decisions.
10 Note that dehumidifiers represented almost 10 percent of program savings, but were not included as high impact measure since they have very high ENERGY STAR penetration.
3-2

3.1.3 D&R International Sales Data
National ENERGY STAR partner data are collected by D&R International, Ltd. (D&R) from ENERGY
STAR national retail partners and includes data on sales of ENERGY STAR qualifying units by state for
2010 and 2011.11 Reported appliances include clothes washers, dishwashers, freezers, refrigerators, and
room air conditioners. The data represent approximately 40% of the AHAM shipment data for appliances
in the State of New York, and for the selected comparison areas almost 100% of the AHAM shipment
data in Virginia and 30% of the AHAM shipment data in Houston and Washington, D.C. In accordance
with agreements with retailer partners, ENERGY STAR does not disclose details about the specific
sources of the data. The retail partners that submitted sales data to the ENERGY STAR program for a
certain year may differ from those that submitted sales data for previous years; therefore, caution should
be taken when making direct comparisons from year to year and between different appliances. D&R
national partner sales data and state-level NYSERDA partner sales data were primarily used for
ENERGY STAR market penetration calculations.
D&R was also the source for providing the Team with State Energy Efficient Appliance Rebate Program
(SEEARP) data. D&R, on behalf of the U.S. Department of Energy, compiled the SEEARP data. This
data included individual rebate-level data for New York State and all comparison regions (Virginia,
Houston, TX, and Washington, D.C.).
3.1.4 Association of Home Appliance Manufacturers (AHAM) Sales Data
The overall state-level (for New York and comparison areas) market size for each appliance is based on
shipment data procured from the Association of Home Appliance Manufacturers (AHAM). It should be
noted that the AHAM shipment data are not sales, but shipment of appliances to New York State.
Shipment data serves as a proxy value for sales (since we do not have total sales data available) though
we do have to note that they may not completely align (due to out of state sales).
11 EPA stopped supporting this research effort in 2009 (but continued to collect and report national manufacturer annual shipment data), but D&R International was able to continue collecting data for 2010 and 2011; 2012 data were not available at the time of this report.
3-3

3.1.5 US Energy Information Agency (EIA) Residential Energy Consumption Survey (RECS) 2009
The EIA administers the Residential Energy Consumption Survey (RECS) to a nationally representative
sample of housing units. According to the EIA, “specially trained interviewers collect energy
characteristics on the housing unit, usage patterns, and household demographics. This information is
combined with data from energy suppliers to these homes to estimate energy costs and usage for heating,
cooling, appliances and other end uses – information critical to meeting future energy demand and
improving efficiency and building design.
First conducted in 1978, the thirteenth RECS was conducted in 2009. The 2009 survey collected data
from 12,083 households in housing units statistically selected to represent the 113.6 million housing units
that are occupied as a primary residence. Data from the 2009 RECS are tabulated for the four Census
regions, the nine Census divisions, and 16 States.12 These 16 States vary in their geography, climate, and
population size. The results of each RECS include data tables, a microdata file, and a series of reports.
3.2 Primary Data Sources
Primary data collection efforts consisted of telephone interviews and surveys of various market actors.
These survey efforts were used to help gauge consumer, retailer, and manufacturer awareness and
knowledge of the ENERGY STAR label, availability of energy efficiency measures, satisfaction with
program (for retailer and manufacturer partners), perceived value of ENERGY STAR products, shifts in
marketing efforts, market share, pricing and incremental cost of ENERGY STAR products, and the
estimated influence of the ENERGY STAR label on purchase behavior. Furthermore, these surveys were
used to inform the NYSERDA program attribution and net savings analysis, with the comparison area
survey serving as the primary source for establishing baseline sales.
12 Census regions are groupings of states and the District of Columbia that subdivide the United States for the presentation of census data. There are four census regions – Northeast, Midwest, South, and West. Census divisions are groupings of states and the District of Columbia that are subdivisions of the four census regions. There are nine census divisions – New England, Middle Atlantic, East North Central, West North Central, South Atlantic, East South Central, West South Central, Mountain, and Pacific.
3-4

The MCAP surveys contained questions that helped to define the market and measure Program progress
metrics. These indicators, discussed in greater detail in Section 4, are based on the Program logic and are
designed to measure and assess Program progress across specified periods. The surveys were focused
towards the four high impact measures as determined by a tracking database review, which accounted for
almost 90% of overall program savings. The final survey instruments, which were reviewed by
NYSERDA staff throughout the development process to ensure that the questions targeted the concepts
most relevant to the NYPP, are presented in Appendix A of this report.
Market actor surveys included telephone questionnaires to (1) participating and non-participating regional
and national appliance retailers,13 (2) participating appliance manufacturers, and (3) participating and
nonparticipating pool pump manufacturers and contractors/installers.
The Evaluation Team drafted questionnaires whereby both NYSERDA and consultants reviewed and
provided feedback and suggestions for improvement. The Evaluation Team conducted the interviews in
mid-to-late 2013. The Evaluation Team relied upon these survey efforts to enable triangulation of results
based upon responses received from all relevant actors, as summarized in Table 3-1.
Table 3-1: Overview of NYPP Market Actor Survey Efforts
Market Actor Population Survey
Number of Targeted
Completes
Number of Actual
Completes
Percent of
Target Confidence/
Precision
Residential end-use customersa
~6.3 million households Phone
200 per product
~200 per product 100%+ 90/6
Participating retailer storefronts 173 Phone 70 71 100% 90/10 Participating manufacturers 5 Phone 2 2 100% NA Participating & Non-Participating corporate retailers 5 Phone 5 5 100% NA Comparison area end-use customersb NA Phone
200 per product
~200 per product 100% 90/6
Pool Pump Market Actors NA Phone 20 20 100% NA DOE/EPA /ASAP Interviews NA Phone 4 4 100% NA
a Number of actual completes for dishwashers was 187 (94%). b Number of actual completes for room air conditioners was 119 (60%).
13 This was based on participation in 2010-2012. Retailers that participated during this period but dropped out prior to the study initiation period were also included in the sample.
3-5

Table 3-2 summarizes the types of information collected as part of the MCAP evaluation of the NYPP.
Each survey effort is discussed in greater detail below.
Table 3-2: Data Collection Efforts by Topic Area
Topic Area
Residential End-Use
Customers (NY & Comparison) Phone Survey
Participating Retailer Phone
Survey
Participating Manufacturer Phone Survey
Corporate Retailer Phone Survey
Pool pump Phone
Surveys
DOE/ EPA/ ASAP/
Interviews
D&R/ Lockheed
Martin Market Share
Consumer awareness
Retailer awareness
Perceived value
Accessibility of EE measures
Pricing/ Incremental cost
Market share
Program impacts
Program satisfaction
3.2.6 NYSERDA End-Use Consumer Survey
The Evaluation Team developed a telephone questionnaire administered by Abt SRBI through random-
digit dialing (RDD), which targeted at least 200 respondents per product who have purchased a new
refrigerator, clothes washer, dishwasher, or room air conditioner during 2010-2012 and included 100 non-
purchasers for a more representative sample of the population and to correct for non-response bias.14 The
end-use consumer survey was administered by Abt SRBI in September through October, 2013.
Respondents were asked to provide detailed information about where purchases were made, and the
energy efficiency of the product. In order to validate the self-reported purchases of ENERGY STAR
products and assess actual efficiency (e.g., ENERGY STAR), respondents were asked to provide the
make and model of the identified appliances. Respondents were also asked about awareness and
purchases of advanced power strips.
14 100 non-purchasers were randomly chosen from the 1,323 failed screeners to be included in the ENERGY STAR awareness results
3-6

The RDD survey of households in the State of New York (less Nassau County and Suffolk County)
achieved a sampling error (with a 90% confidence level) close to +/- 6% for each product category. The
total completed sample size representing about 6.3 million households was 781 (681 participant
purchasers – some may have purchased two products and therefore counted once overall, plus 100 (of a
total of 1,323) non-purchasers of new equipment for weighting purposes).
The survey results are used to estimate product saturations, purchase patterns by channel,
awareness/influence of ARRA rebates, and efficient product market share estimates. The residential end-
use customer survey was also administered for appliance purchasers in the comparison areas to
understand differences in awareness, perceptions, and purchase patterns of ENERGY STAR certified
appliances.
Table 3-3: MCAP Residential End-Use Customer Telephone Survey Sample Size by Product
Quota Group Proposed Completes
Actual Completesa
Percent of Goal Achieved
Confidence/ Precisionb
Appliance Purchasers 800 681 respondents 840 appliances
105% 90/6
Refrigerators 200 200 100% 90/6
Clothes Washers 200 202 100% 90/6
Dishwashers 200 187 94% 90/6
Room Air Conditioners 200 251 125% 90/5
Non-purchasers 100 100 100% 90/8 a 100 non-purchasers were randomly chosen from the 1,323 failed screeners to be included in the ENERGY STAR
awareness results b Assumes dichotomous response with a 50% proportion. Confidence/precision around individual questions vary based
on the number of responses and response categories.
3-7

Table 3-4: MCAP Residential End-Use Customer Telephone Survey Disposition
Indicator Disposition
Total Sample Frame 27,545
Refusals - Not Screened 2,829
Screen-Outs 2,141
Quota-Outs 0
Qualified Refusals 0
Total Completes 681
Cooperation Rate 49.9%
Totals Refusals 10.3%
Response Rate 10.2%
The survey data weights were constructed using all purchaser completes (~200 per appliance) and non-
purchaser failed screeners (n=1,323) to ensure the sample design and patterns of non-response did not
bias the results. The weighting process involved a two-stage weighting scheme. The first stage weight
applied to both the New York End-Use Consumer and the Comparison Area End-Use Consumer Survey
sample (the state of Virginia, Washington D.C., and the metropolitan area of Houston, Texas) accounts
for the probability of selection between a cellular and landline telephone number. These weights were
constructed from the model-based estimates for each region that were released by the National Center for
Health Statistics.15
The second stage weight applied aligns the sample demographics and population distribution to the
estimated population benchmarks of New York State, on an Upstate/Downstate basis. For the comparison
areas survey, the state of Virginia sample demographics were weighted to align with the Upstate New
York population benchmarks on the following characteristics from the 2012 American Community
Survey: home ownership, type of residence, head of household age, and head of household education
(these same demographic characteristics were used in the previous evaluation report, though this report
includes type of residence). The type of residence (single family, all others) was included in the weighting
scheme for this evaluation report since this demographic exists at a household-only resolution and the
potential for significant differences in ENERGY STAR penetration. The same methodology was followed
for the combined sample demographics of Washington, D.C. and Houston, Texas to align with the
Downstate New York (excluding Nassau and Suffolk counties) population benchmarks.
15 Blumberg SJ, Ganesh N, Luke JV, Gonzales G. Wireless substitution: State-level estimates from the National Health Interview Survey, 2012. National health statistics reports; no 70. Hyattsville, MD: National Center for Health Statistics. 2013.
3-8

Finally, an adjustment was made to the sample weights to account for New York State’s population
distribution of Upstate (46%) and Downstate (54%) households. For a more complete description of the
weighting logic used for the consumer survey please see Appendix B.
3.2.7 Comparison Area End-Use Consumer Survey
A similar end-use customer survey was conducted in all three regions of the comparison area,16 also
targeting 200 purchasers of each product (combined across the regions). The Evaluation Team customized
the telephone questionnaire for the comparison area to be administered through random-digit dialing
(RDD), targeting a least 200 respondents per product who have purchased a new refrigerator, clothes
washer, dishwasher, or room air conditioner during 2010-2012. Respondents were asked to provide
detailed information about where purchases were made, and the energy efficiency of the product. In order
to validate the self-reported purchases of ENERGY STAR products and assess actual efficiency (e.g.,
CEE Tier level), respondents were asked to provide the make and model of the identified appliances.
Respondents were also asked about awareness and purchases of advanced power strips.
The RDD survey of comparison region households achieved a maximum sampling error (with a 90%
confidence level) close to +/- 6% precision for each product category. The total sample size was 651 (200
purchasers for each of the four products – accounting for multiple appliance purchases by the same
respondent - plus 2,331 non-purchasers of new equipment).
Saturations, purchase patterns by channel, awareness/influence of ARRA rebates, and efficient product
market share estimates were computed from the survey results. Comparison area surveys were compared
to New York State results to understand differences in awareness, perceptions, and purchase patterns of
ENERGY STAR appliances.
16 The phrase “comparison area,” here and throughout the report, refers to all three of the comparison regions (the State of Virginia, Washington, D.C., and Houston, TX).
3-9

Table 3-5: Comparison Area Residential End-Use Customer Telephone Survey Sample Size by Product
Quota Group Proposed Completes
Actual Completes
Percent of Goal Achieved
Confidence/ Precisiona
Appliance Purchasers 800 651 respondents 804 appliances
100% 90/6
Refrigerators 200 283 142% 90/5
Clothes Washers 200 206 103% 90/6
Dishwashers 200 198 99% 90/6
Room Air Conditioners 200 117 59% 90/8 a Assumes dichotomous response with a 50% proportion. Confidence/precision around individual questions vary based
on the number of responses and response categories.
Table 3-6: Comparison Area Residential End-Use Customer Telephone Survey Completes by Product and Region
Quota Group Houston, TX Washington, D.C. Virginia
Refrigerators 75 64 144
Clothes Washers 61 44 101
Dishwashers 51 47 100
Room Air Conditioners 9 72 36
Table 3-7: Comparison Area Residential End-Use Customer Telephone Survey Disposition
Indicator Disposition
Total Sample Frame 42,894
Refusals - Not Screened 1,877
Screen-Outs 2,331
Quota-Outs 1
Qualified Refusals 0
Total Completes 651
Cooperation Rate 61.4%
Totals Refusals 4.4%
Response Rate 7.0%
3-10

The survey data weights were constructed using all purchaser completes (~200 per appliance) and non-
purchaser failed screeners (n=1,323) to ensure the sample design and patterns of non-response did not
bias the results. The weighting process involved a two-stage weighting scheme. The first stage weight
applied to both the State of New York End-Use Consumer and the Comparison Area End-Use Consumer
Survey sample (the state of Virginia, Washington D.C., and the metropolitan area of Houston, Texas)
accounts for the probability of selection between a cellular and landline telephone number. These weights
were constructed from the model-based estimates for each region that were released by the National
Center for Health Statistics.17
The second stage weight applied aligns the sample demographics and population distribution to the
estimated population benchmarks of New York State, on an Upstate/Downstate basis. For the comparison
areas survey, the state of Virginia sample demographics were weighted to align with the Upstate New
York population benchmarks on the following characteristics from the 2012 American Community
Survey: homeownership, type of residence, head of household age, and head of household education
(these same demographic characteristics were used in the previous evaluation report, though this report
includes type of residence). The type of residence (single family, all others) was included in the weighting
scheme for this evaluation report since this demographic exists at a household-only resolution and the
potential for significant differences in ENERGY STAR penetration. The same methodology was followed
for the combined sample demographics of Washington, D.C. and Houston, Texas to align with the
Downstate New York (excluding Nassau and Suffolk counties) population benchmarks.
Finally, an adjustment was made to the sample weights to account for New York State’s population
distribution of Upstate (46%) and Downstate (54%) households. For a more complete description of the
weighting logic used for the comparison area consumer survey please see Appendix B.
The most significant issue encountered while administering this survey proved to be attaining the planned
200 completes for room air conditioners. The Team had anticipated the lower available population for
room air conditioners due to the survey being fielded in the early winter. Abt SRBI had an extremely
difficult time trying to find participants with room air conditioners, especially those who were still able to
provide make and model information since the survey began in the winter.
17 Blumberg SJ, Ganesh N, Luke JV, Gonzales G. Wireless substitution: State-level estimates from the National Health Interview Survey, 2012. National health statistics reports; no 70. Hyattsville, MD: National Center for Health Statistics. 2013.
3-11

3.2.8 Partner Retailer Storefront Survey
The Evaluation Team conducted interviews with 71 participating appliance retailers to assess self-
reported changes in awareness, availability, and pricing of ENERGY STAR products. The respondents,
who were either store managers or appliance specialists, were selected through a random sampling
approach. During administration of the corporate interviews we received, from a particularly large
corporate retailer, permission to contact their various NYSERDA-based storefronts, and the team had Abt
SRBI conduct several storefront surveys targeting this larger national retailer. All retailers were asked
their opinion regarding ARRA impacts to sales since 2010. In addition, stores that carry APS units were
asked about perceived customer awareness and interest in APS, sales of APS units, and NYSERDA
impact on APS sales.
Table 3-8: MCAP Partner Retailer Storefront Survey Disposition
Indicator Disposition
Total Sample Frame 171
Refusals - Not Screened 11
Screen-Outs 9
Quota-Outs 0
Qualified Refusals 0
Total Completes 71
Cooperation Rate 87.9%
Totals Refusals 6.4%
Response Rate 46.8%
There were no significant issues encountered while administering the storefront survey, and there is no
weighting required to produce summary statistics from this survey effort.
3.2.9 Participating and Non-Participating Corporate Interviews
Five interviews with corporate contacts from regional/national appliance retailers were conducted to
assess the influence of NYSERDA program efforts – as well as the cumulative effect of other ENERGY
STAR program efforts – on sales of ENERGY STAR products in both the State of New York and other
areas of the United States. The Evaluation Team worked with NYSERDA to develop the most appropriate
sample of retailers that are both active in the program, have been active in the past but dropped out, or
3-12

have never participated. The interviews explored retailer and manufacturer changes in awareness,
availability, pricing, and marketing efforts that have resulted from the NYPP, overall satisfaction with the
program (for participants), and potential impact on sales of high-efficiency equipment (part of the
attribution analysis for the participants, and a market effects analysis for the non-participants).
There were several issues encountered while administering the corporate retailer surveys. The first issue
centered on the ability to contact various corporate entities. Contacts proved to be out-of-date and difficult
to get a hold of. If one of the sample was successfully contacted, then the second issue was encountered –
was their willingness to participate in the survey. Of those few entities that were successfully contacted
and were willing to discuss their experiences with the program (or for non-participating retailers their
experience with ENERGY STAR appliances in general), even fewer were willing to take the time to share
their feedback and provide answers to all of the questions that were associated with the survey instrument.
There was really only one entity that was able and willing to answer all of the questions in the interview
guide, and even this entity was still unwilling to respond to a supplemental data request that asked the
partner to provide more detailed ENERGY STAR market share and Most Efficient market share for the
NYSERDA and comparison areas.
There is no weighting required to produce summary statistics from this survey effort, nor were any
summary statistics generated from the corporate interviews – these interviews allowed the Team to
leverage anecdotal insights from the conversations to help frame the findings associated with other more
quantitative results. The only quantitative finding used from the corporate surveys was the overall market
lift attributable to the National and NYSERDA partner retailers.
3.2.10 Manufacturer Interviews
The Evaluation Team conducted interviews with two participating appliance manufacturers to assess the
influence of the program on business practices, changes in the market and perceived sustainability of
program impacts. Program tracking data were used to select the manufacturers.
There were the same issues encountered for the manufacturer survey as those of the corporate retailer
survey. Manufacturers were extremely difficult to contact, and once contacted, very reluctant to share any
insights or information with the evaluation team. Only eight contacts were initially provided, three of
which did not actually manufacturer any of the appliances available in the program and one had not yet
participated. Of the remaining four, only two ultimately participated in survey despite multiple attempts to
contact (four attempts for the two non-respondents), and voicemails left.
3-13

There is no weighting required to produce summary statistics from this survey effort, nor were any
summary statistics generated from the manufacturer interviews – these interviews allowed the Team to
leverage anecdotal insights from the conversations to help frame the findings associated with other more
quantitative results.
3.2.11 Pool Pump Market Actor Interviews
Originally, based on the work plan, there were twenty interviews planned with nonparticipating pool
pump manufacturers, retailers, and contractors. The goal was to explore current market share for high-
efficiency pool pumps, learn about market barriers/drivers for high-efficiency pool pumps, as well as how
the program might better team with them to more closely to promote high-efficiency pool pumps.18 After
receiving approval for the survey instrument and an initial sample provided by Lockheed Martin, the
Evaluation Team made attempts to contact the various market actors. The team was ultimately able to
complete all 20 interviews, which by the time the interviews were completed included two newly
participating entities, although due to joining in the fall, outside of the typical “pool season,” neither had
regularly engaged with the NYPP at the time the survey was conducted. The Evaluation Team utilized
existing contacts from NYSERDA to develop the sample (eight contacts were provided), but soon had to
supplement the list based on Internet searches (contact information for an additional 111 pool pump
retailers was compiled). Necessitating this large sample size was the fact that many of the pool pump
retailers had modified fall/winter hours, as well as the difficulty in speaking with someone knowledgeable
about pool pump trends and sales; frequently, only the store owner was able to provide answers. The
evaluation team will make this new sample list available to the program implementer (Lockheed Martin)
for use in future recruitment efforts.
There were no serious issues encountered in administering the survey, and no weighting was required to
produce summary statistics from this survey effort.
18 As of March 2013 there were no participating pool pump manufacturers or retailers.
3-14

3.2.12 EPA/DOE/ASAP Interviews
As part of the comparison area research the evaluation team elected to hold interviews with members of
the DOE, EPA, and ASAP to assess how the NYPP (and other energy-efficiency programs) have
impacted product codes as well as the ENERGY STAR specifications for the appliances. The interview
guide included questions relating to familiarity with the NYPP, collaboration with NYSERDA
administrators, influence of the program on sales of ENERGY STAR appliances within and outside of
New York State, and influence of the NYPP on ENERGY STAR specifications.
3.2.13 Staff interviews
The Evaluation Team conducted interviews with both NYSERDA and Lockheed Martin staff. These
interviews were conducted prior to the development of the customer, retailer, and manufacturer data
collection instruments. The Evaluation Team wanted to carefully understand the key researchable issues
and target key trade allies. In addition, these interviews were important for the process evaluation,
providing information from the staff perspective regarding what aspects of the program are working well
and what aspects could be improved. Finally, these interviews helped to refine and finalize the program
logic model.
The remainder of this report is focused on the analysis of all this data and the resulting findings, and is
divided into four broad areas: process, market characterization, market assessment, and attribution. Each
of these analytical areas is discussed below.
3-15

4 Market Characterization The market characterization analysis is important for understanding market qualities of the key targeted
products, including:
• Market size - The total size of the markets • The Key distribution channels • Consumer purchasing decisions • The market penetration of program retailers/manufacturers • The Market share for energy efficient (ENERGY STAR®) products
Where available, the Evaluation Team included longitudinal analysis of these parameters, examining how
they have changed over time since they were first examined in 2005 and again in 2012.19 The historical
trends will help NYSERDA select which products to target, forecast future program impacts, and overall
improve overall program design.
This section presents the basic characteristics of the market eligible to participate in the NYPP and
discusses Program accomplishments to date. First, the market characterization approach used by the
evaluation team is discussed, followed by the market size (NYPP regional annual sales) and product
distribution channels. The final section estimates ENERGY STAR market share.
4.1 Methodology
The market characterization component of the MCAP evaluation describes energy markets and provides
background information to help define programs, delivery concepts, target markets, and the potential for
different types of programs. In terms of the NYPP, the market characterization component provides
information on key progress metrics by:
• Collecting and compiling descriptive data on the market eligible to participate in the NYPP in terms of the size of the market
• Estimating market penetration for a number of key products • Providing information needed to identify current market practices, behaviors, and perceptions of
market barriers and opportunities • Developing the underpinnings required to identify additional Program intervention
opportunities
19 The Cadmus Group and Navigant Consulting: New York Energy $martSM Products Program Market Characterization and Assessment Evaluation; February, 2012; Quantec, LLC and Summit Blue Consulting, LLC: New York ENERGY STAR Products and Marketing Program, Market Characterization, Market Assessment and Causality Evaluation; May 2006
4-1

The evaluation team worked with NYSERDA staff to develop the market characterization parameters
used in the evaluation of the NYPP. These parameters follow the same approach used by the evaluation
team in the prior evaluations, including the same phrasing and sequence of questions where applicable to
maintain consistency across evaluations. In particular, the evaluation team:
• Reviewed previous NYPP evaluation reports and survey efforts to identify characterization parameters that have previously been tracked by NYSERDA
• Reviewed Program evaluation reports and survey efforts conducted by other entities to identify additional innovative characterization parameters currently being used within the industry
• Investigated proprietary and publicly available data sets to determine the types of characterization data available for analysis
The findings from the market characterization analysis are discussed below.
4.2 Market Characteristics
The evaluation team used both primary and secondary data to assess the size and specific attributes of the
statewide market for energy-efficient appliances.
4.2.1 Market Size
One critical component for estimating market share is an understanding of the total market size: how
many ENERGY STAR and non-ENERGY STAR units are sold annually in the NYSERDA region for
each of the product categories? One technique used in this evaluation is to estimate market size is to rely
on shipment data from the Association of Home Appliance Manufacturers (AHAM), which publishes data
on annual product shipments by state for major appliances (refrigerators, clothes washers, and
dishwashers and room air conditioners). Though shipments to the State of New York does not equate with
final sales, and assuming sales into and outside of New York State cancel each other out, then the AHAM
data serves as a reasonable proxy for New York State appliance sales.
As concluded in the previous MCAP evaluations, shipment data can serve as a proxy for sales, with the
assumption that the number of products shipped in state but sold in neighboring states equals the number
of products that are shipped to neighboring states but sold in the state of interest. Based on the data and
comparisons of shipments in neighboring states, the evaluation team determined that AHAM shipments
could be used to estimate the total number of units sold in the State of New York for this evaluation as
well, by adjusting for the percentage of New York residents who are also in NYSERDA territory.
4-2

As shown in Figure 4-1, AHAM shipments spiked in 2010 for all products (except for room ACs, which
tend to fluctuate year-to-year due to weather). This clearly demonstrates the market lift mostly primarily
attributable to ARRA funding. This also supports the argument made in the ARRA evaluation report20
that there was considerable early replacement due to the ARRA funding as well. As stated in the report,
“A significant share of participants (19% to 30%) within each appliance type stated that they were not
planning to purchase a new appliance before hearing of the Appliance Rebate Program Area.”
Given the 23 (clothes washer) to 48% (refrigerator) jump in appliance sales in 2010, the findings from the
ARRA evaluation report are aligned with findings related here. Figure 4-2 below clearly demonstrates the
magnitude of change in shipments in 2010. From 2010 through 2012, clothes washers and dishwashers
saw an approximately 5% decline in shipments for both appliances. For refrigerators, the AHAM
shipment data shows a reduction of about 50,000 units each year, resulting in a 17.1% decrease from 2010
to 2012. Room air conditioner shipments show a slight uptick from 2010 to 2011 (30,000 units) before
experiencing a noticeable decrease of over 100,000 units from 2011 to 2012.
Figure 4-1: 2008-2012 New York Appliance Distributor Shipments
Source: AHAM shipment data
Clothes Washer, 375,600
Dishwasher, 276,200
Refrigerator, 598,400
Room AC, 757,500
0
200,000
400,000
600,000
800,000
1,000,000
1,200,000
Clothes Washer Dishwasher Refrigerator Room AC
AHAM
NY
Uni
t Shi
pmen
ts
2008 2009 2010 2011 2012
20 The Cadmus Group and others: NYSERDA American Reinvestment and Recovery Act 2012 Impact Evaluation Report : State Energy Programs; April 30th, 2012
4-3

Figure 4-2: 2009-2012 Shift from Previous Year in New York Appliance Distributor Shipments
Source: AHAM shipment data. Percent shift in 2009 based upon 2008 data.
-60%
-40%
-20%
0%
20%
40%
60%
Clothes Washer Dishwasher Refrigerator Room AC
Perc
ent S
hift
in A
HAM
NY
Ship
men
ts
% shift in 2009 % shift in 2010 % shift in 2011 % shift in 2012
4.2.2 Product Distribution Channels
The NYPP targets products that are sold at a variety of retail store types. Understanding the volume of
products sold through each of the distribution channels is critical for directing Program resources to the
right retailers and for ensuring that the proper mix and type of retailers are participating in the Program.
In order to investigate distribution channels, the evaluation team asked each end-use customer respondent
who had purchased a product where the product had been purchased and the type of store. The store types
in the survey are as follows (with examples of typical stores):
• Appliance/electronics store (e.g., PC Richard, Best Buy, Orville’s Appliances) • Home improvement store (e.g., Lowe’s, Home Depot) • Mass merchandiser (e.g., Wal-Mart, Sears, Target, Costco) • Furniture or home furnishings store (e.g., Bed Bath & Beyond, IKEA, Gracious Homes) • Other type of store (e.g., Rent-a-Center, online retailers)
4-4

As seen in Figure 4-3, home improvement stores and appliance/electronics stores comprise the majority
of appliances sold, ranging in total appliance percentage from 53% to 89% depending on the product. The
one notable deviation from this trend lies with room air conditioners, where mass merchandisers play a
larger role in sales at 39%, and is in fact the top sales channel for room air conditioners.
Appliance/electronic stores are the number one distribution channel for refrigerators (45%percent) and
dishwashers (61%). For clothes washers, home improvement stores narrowly edge out
appliance/electronic stores as the top distribution channel at 40%.
Figure 4-3: Distribution Channels for Major Appliances
Source: MCAP 2013 Residential End-Use Customer Telephone Survey
For refrigerators, the top sales channel remained unchanged from the previous evaluation with
appliance/electronic accounting for 45% of sales from 2010-2012, compared to 43% from 2008-2009.
Home improvement stores are the second largest channel, representing a third of sales, followed by mass
merchandiser at 20%. The remaining 2% is made up of furniture stores and other unclassified stores.
The vast majority of clothes washers are sold through home improvement stores (40%) and
appliance/electronic stores (39%). The next largest distribution channel is furniture stores (12%),
followed by mass merchandisers (9%). This represents a shift from the 2008-2009 data where mass
merchandisers were the third largest distribution channel and accounted for almost a quarter of all sales.
0%
10%
20%
30%
40%
50%
60%
Refrigerator (n=137)
Clothes Washer (n=154)
Dishwasher (n=132)
Room AC (n=147)
% o
f Pur
chas
ers
Home improvement Appliance/electronics Mass merchandiser
Furniture Other
4-5

As with clothes washers, the distribution channel percentages associated with dishwashers have
noticeably changed since the prior evaluation. In 2008-2009, home improvement stores,
appliance/electronic stores, and mass merchandisers each represented close to a third of all sales, but for
2010-2012, appliance/electronic stores have dramatically increased to 61%, home improvement stores
have slightly decreased to 28%, and mass merchandisers have precipitously declined to 8%. The
remaining 3% is evenly split between furniture stores and other unclassified stores.
Room air conditioners are unique in that department/discount stores are the top distribution channel at
39%, a 15 percentage point increase from 2008-2009. Appliance/electronic stores are the second largest
sales channel at 36% (same percentage as previous evaluation) and home improvement stores represent
17%. The unclassified store category comprises a sizeable 7%, primarily arising from online retailers. The
results presented in Table 4-1 emphasize the importance of the large chain retailers in the NYSERDA
area. As with the prior evaluation, Sears is the top seller of refrigerators (20% of all respondents), clothes
washers (19%), and dishwashers (26%). PC Richard accounts for 23% of all room air conditioners sold,
up from 20% in 2008-2009.While Best Buy is not seen to comprise greater than 4% of sales for any
single appliance, the retailer does account for 18% of advanced power strip sales. More generally, looking
at all five retailers in aggregate reveals the dominance and critical importance these retailers play in the
overall market. The top five retailers represent 70% of refrigerator sales, 63% of clothes washer sales,
59% of dishwasher sales, 49% of room air conditioner sales, and 50% of advanced power strip sales.
Table 4-1: Market Share for Top Five Retailers
Source: MCAP 2013 Residential End-Use Customer Telephone Survey
Store Partner Status
Refrigerators (n=138)
Clothes Washers (n=158)
Dishwashers (n=134)
Room AC (n=164)
Total All Appliances
(n=594) APS
(n=62)
Sears National + NYSERDA
20% 19% 26% 10% 18% 0%
Home Depot National 11% 18% 7% 7% 11% 7% Lowe's National 20% 18% 18% 4% 15% 11% PC Richard a National +
NYSERDA 17% 6% 8% 23% 14% 14%
Best Buy b National + NYSERDA
2% 3% 1% 4% 2% 18%
Total 70% 63% 59% 49% 60% 50% a Initially a “National + NYSERDA” partner before dropping out of the program, effectively changing partner status to
“National.” b Initially a “National + NYSERDA” partner before dropping out of the program, effectively changing partner status to
“National.”
4-6

4.2.3 Purchasing Decisions
The MCAP Residential End-Use Customer Telephone Survey also examined the decision-making process
for the selection of new appliances: exploring who purchased the products, what product features
informed the purchase decision, what type of research the customer conducted, and the method of
purchase. In terms of the purchaser, the survey respondents (i.e. not landlords or contractors) purchase the
vast majority (94%) of all products (Table 4-2). Landlords are the second most active purchasers, but
account for just a fraction compared to the respondents, purchasing only 4% of all products.
Table 4-2: Primary Appliance Purchaser
Source: MCAP 2013 Residential End-Use Customer Telephone Survey
Purchaser Refrigerator
(n=145) Clothes (n=161)
Dishwasher (n=137)
Room AC (n=167)
Total All Appliances (n=610)
Household member 88% 98% 96% 95% 94% Landlord 8% 2% 3% 2% 4% Contractor 2% 1% 1% 1% 1% Other 3% 0% 1% 2% 2% Total 100% 100% 100% 100% 100%
Across all products, energy efficiency was reported as the most important feature in selecting a model,
with 35% of respondents mentioning energy efficiency. This reported percentage is essentially unchanged
from the prior evaluation where 36% of respondents identified energy efficiency as an important feature.
The size of the appliance at 28% was the second most common response, followed by special features at
25%, again across all products.
For refrigerators specifically, 47% of respondents indicated the size of the appliance played an influential
role in their purchasing decision. Clothes washer purchasers noted energy efficiency more frequently than
other appliance purchasers at 40%. Special features were mentioned by 42% of dishwasher purchasers,
with the specific special features including a quieter appliance while running and multiple cycles/settings.
The size (cooling capacity, Btu rating) was reported as an important feature for over half of all room air
conditioner purchasers (53%).
4-7

Table 4-3: Important Features in Selecting a Model
Source: MCAP 2013 Residential End-Use Customer Telephone Survey. Percentages may add to over 100%, as multiple responses were allowed.
Features from Survey Refrigerator
(n=138)
Clothes Washer (n=158)
Dishwasher (n=134)
Room AC (n=165)
Total All Appliances
(n=595)
Size, needed something to fit space 47% 21% 15% - 28% Water efficiency - 15% - - 15% Style or appearance 5% 11% 18% - 11% Size, cooling capacity - - 53% 53% Energy efficiency 28% 40% 37% 36% 35% Price 16% 24% 16% 23% 20% Special features 30% 17% 42% 16% 25% Quality, good brand name 12% 16% 23% 9% 15% Other 3% 3% 7% 8% 5% Cost to operate 3% 5% 2% 4% 3% Only item in stock - 1% - 0% 0% Ease of use 1% 6% 5% 0% 3% Don't know 7% 5% 4% 5% 5%
As seen in Table 4-4, almost half of all respondents (48%) reported having visited the store to gather
information on the product that they ultimately purchased. This percentage is markedly similar to the 50%
that was reported in the prior evaluation, suggesting that despite other sources being readily available,
consumers find value in physically visiting the store. The Internet was the second most common response
for viewing product information at 27%, followed by Consumer Reports at 11%. While refrigerator,
clothes washer, and dishwasher all had similar patterns in responses, room air conditioners differed with a
higher percentage of consumers obtaining information from newspaper circulars/retailer catalogs, seeking
information from family and friends, and conducting no research. Additionally, room air conditioner
purchasers used the Internet for gathering product information at a noticeably lower percentage (15%).
The advanced power strip percentages by and large followed a similar pattern to that of the other
appliances, with a higher percentage of no research and other non-classified sources being reported.
4-8

Table 4-4: Information Source Used for Products
Source: MCAP 2013 Residential End-Use Customer Telephone Survey. Percentages may add to over 100%, as multiple responses were allowed.
Source Refrigerator
(n=138)
Clothes Washer (n=158)
Dishwasher (n=134)
Room AC (n=165)
Total All Appliances (n=595)
APS (n=62)
Newspaper circulars/ retailer catalogs
2% 6% 3% 9% 5% 4%
Internet 25% 36% 36% 15% 27% 17% Called retailers 2% 2% 0% 3% 2% 0% Visited stores 55% 46% 46% 47% 48% 48% Consumer Reports 10% 13% 17% 4% 11% 4% Spoke to Family and Friends
2% 5% 2% 9% 5% 0%
Other 6% 6% 7% 6% 6% 11% No research 4% 1% 2% 7% 4% 9% Don't Know 6% 3% 4% 8% 6% 7%
For respondents reporting Internet use, Table 4-5 summarizes the Internet sites visited. Retail store sites
were the most commonly visited across all appliances (36%), followed by consumer sites (22%), and then
manufacturer sites (20%). This was the same ordering of Internet sites reported from 2008-2009, with
modest changes in the percentages themselves. Although there were only 11 advanced power strip
respondents that reported using the Internet to gather information, it appears that advanced power strip
purchasers had difficulty in locating useful product information, as only 11% were able to recall and
provide a specific site type.
4-9

Table 4-5: Internet Sites Visited
Source: MCAP 2013 Residential End-Use Customer Telephone Survey. Percentages may add to over 100%, as multiple responses were allowed.
Internet Site Refrigerator
(n=34)
Clothes Washer (n=56)
Dishwasher (n=49)
Room AC
(n=29)
Total All Appliances
(n=168) APS
(n=11)
Retail store sites 48% 40% 32% 22% 36% 0% Consumer sites (e.g., Consumer Reports)
17% 28% 29% 7% 22% 0%
EnergyStar.gov 7% 1% 0% 5% 3% 0% getenergysmart.org or nyserda.org
0% 0% 0% 0% 0% 0%
Other government sites 0% 6% 0% 0% 2% 0% Manufacturer sites 9% 18% 22% 36% 20% 11% Utility/electric company sites
0% 0% 2% 0% 1% 0%
Search engines 7% 11% 6% 20% 10% 13% Other 10% 7% 1% 20% 8% 13% Don't know 15% 13% 22% 26% 18% 42%
Regarding purchase location, 87% of all purchases were made in person at the retail store, with an
additional 9% occurring over the Internet. These values are slightly different from those reported in the
2008-2009 evaluation where 89% took place at the retail store and 7% online. Figure 4-4 highlights the
change in Internet usage for appliance research and appliance purchase across all appliances, with a
notable increase in both categories from the initial 2007 residential survey. Advanced power strip
purchases differ from the other appliances with a lower percentage of in person purchases (76%) and a
higher percentage of online purchases (17%).
Table 4-6: Purchase Location
Source: MCAP 2013 Residential End-Use Customer Telephone Survey. Percentages may add to over 100%, as multiple responses were allowed.
Purchase Location
Refrigerator (n=138)
Clothes Washer (n=158)
Dishwasher (n=134)
Room AC (n=165)
Total All Products (n=595)
APS (n=62)
Retail store 87% 85% 93% 85% 87% 76% Telephone 2% 5% 0% 3% 3% 5% Internet 11% 11% 6% 8% 9% 17% Catalog 1% 4% 0% 3% 2% 3% Other 2% 1% 2% 5% 4% 1% Don’t know 0% 0% 0% 1% 1% 0%
4-10

Figure 4-4: Internet Usage for Appliance Research and Purchase – All Appliances
Source: MCAP 2013 Residential End-Use Customer Telephone Survey
4.3 ENERGY STAR Market Share
One of the most critical metrics of NYPP success is increasing the market share for ENERGY STAR
products. As in previous years, the evaluation team relied on a combination of both primary and
secondary data sources to estimate market share. The methodology for determining the 2010 through
2012 ENERGY STAR market share, for both the NYSERDA and comparison areas, as well as the
findings, are presented in the following text.
4.3.4 Methodology
The evaluation team relied primarily on three data sources to estimate market share for ENERGY STAR
products in the NYSERDA region:
0%
5%
10%
15%
20%
25%
30%
2007 (n=611) 2010 (n=707) 2013 (n=595)
% o
f Res
pond
ents
Research Using Internet Purchase Using Internet
4-11

• National Partner Sales Data Collected by D&R International. D&R collects sales data from national ENERGY STAR partners, combining all partner data (removing retailer names). This data is extremely valuable in detail, providing ENERGY STAR market share for four appliance types (refrigerators, clothes washers, dishwashers, and room ACs) by state, region, and year. The primary caveat to using these data, however, is that the compliance rate for retailers providing sales data fluctuates, as the delivery of sales data is requested but not required to remain in the national Program.21, 22 For use in this MCAP study, D&R International provided total market share data (rather than individual store data) for 2010 and 2011 in two categories: 1) national ENERGY STAR partners that are also NYSERDA partners and 2) national ENERGY STAR partners excluding NYSERDA partners. For more information regarding reporting compliance rates please see the more detailed description of this data in the Data Sources section of this report (Section 3.1.3).
• NYSERDA Partner Sales Data Collected by Lockheed Martin. Lockheed Martin collects monthly sales data from NYPP retail partners. The reporting of sales data, including the number of ENERGY STAR and non-ENERGY STAR units sold, by month, is a requirement for partners in the Program, and compliance is typically above 90% for active retailers. Data are collected for all relevant program-supported products. In order to compare to allow the analysis of NYSERDA-only partners and NYSERDA partners that are also national partners (also called NYSERDA & national partners, or dual partners), the evaluation team split the retailers by partnership status.
• The MCAP Residential End-Use Customer Telephone Survey. As part of the residential end-use customer random digit dial survey, the evaluation team targeted 200 respondents per product who had purchased a new refrigerator, clothes washer, dishwasher, or room ACs over the 2010-2012 time span. Respondents were asked to provide detailed information about where purchases were made, as well as about the energy efficiency of the product. In order to validate the self-reported purchases of ENERGY STAR products, the evaluation team asked respondents to provide the make and model number of the appliance.
All available data from these three sources were utilized in assessing market share for each product, with
specific adjustments and weighting techniques varying by product, as described in the following text.
21 The D&R retailer sales data collection on behalf of the EPA (ENERGY STAR) stopped after 2009. In 2010 ENERGY STAR switched to collecting national manufacturer shipments.
22 This is partially attributable to the EPA no longer requiring this data and it being on a voluntary basis. Therefore, the data provide useful comparisons for market share based on a sample of national partners within a given year, but multiyear comparisons can be misleading if the number and mix of retailers changes dramatically.
4-12

4.3.5 ENERGY STAR Appliances Market Share of Appliances
For the first step in determining ENERGY STAR market share, the evaluation team broke out each
appliance’s sales by type of store based on partner status. All appliances were bought at one type of store:
a NYPP partner store, a national ENERGY STAR partner store, a store that is both an NYPP and national
partner, or a store that is not a partner with either national ENERGY STAR or NYPP. The market share
associated with each store type was determined through the MCAP residential end-use customer
telephone survey, specifically based on the store name provided by respondents. This assignment of store
type was based on an active retailer list provided to the Team by Lockheed Martin and downloaded from
the EPA National Partner List website.23, 24 These are shown in the “Product Market Share” column in
Table 4-7 (NYSERDA) and Table 4-8 (for the comparison area survey).
The ENERGY STAR market penetration for each product market share can then be applied to each of
these store types based on the best available data for that store type. The market penetration comes from
one of the following sources (again, depending on store partner status):
• Non-partner store allocations rely on end-use consumer self-reported and model number verified ENERGY STAR market penetration from the MCAP residential end-user telephone survey.25
• NYSERDA Partner and dual partner store allocations rely on NYPP partner sales data provided from Lockheed Martin.
• National partner store allocations rely on ENERGY STAR Program partner sales data from D&R International.
23 https://www.energystar.gov/index.cfm?fuseaction=estar_partner_list.showPartnerSearch 24 The team allocated store type proportionally for any entity that “switched” status part way through the evaluation period. The store
type categorization was allowed to vary by year for those entities that “switched.” Additionally, if the store type “switched” mid-year, allocation was determined by looking at the proportion of the year spent in each store type category. For example, if a “NYSERDA and National Partner” dropped from the program in July 2012, effectively becoming a “National Partner Only,” the retailer was considered a “NYSERDA and National Partner” for program years 2010 and 2011, and then for 2012, half of sales (based upon months of participation) from the retail were considered “NYSERDA and National Partner” with the other half considered “National Partner Only.”
25 Respondents were asked to read their model numbers from their appliance. The evaluation team later verified if the model was ENERGY STAR or not.
4-13

The market share of ENERGY STAR for each store type is shown in the “ES Market Penetration”
column in Table 4-7 (NYSERDA) and Table 4-8 (comparison area). The 2010-2012 market penetration
was based on the weighted sales data from 2010-2012,26 with the exception of non-partner stores, which
relied on the MCAP residential end-user telephone survey. For the NYSERDA region, the majority of
sales came from “National Partner Only” stores, comprising 39% to 70% of total sales depending on
appliance. “NYSERDA and National Partner” stores accounted for the second largest share of sales,
followed by “NYSERDA Only” stores, and lastly “Non-Partner” stores.
Also included in Table 4-7 are the overall U.S.-based National manufacturer partner ENERGY STAR
penetration values to serve as a benchmark against the other estimates. A single value for each appliance
is shown and is weighted by that appliance AHAM shipments for 2010-2012. The U.S. National
manufacturer partner ENERGY STAR penetrations are higher than the NYSERDA weighted composite
(across all partnership status) penetration estimates for every appliance, except dishwashers. Differences
may be due to a number of reasons, including the fact that the manufacturer data is national data (rather
than just New York), is limited to only partner manufacturers (and thus is missing data from non-
partners), plus the veracity/completeness of the data is unknown.
The two columns for each appliance in the following tables answer these questions:
• Product Market Share by partnership status: What percent of all units sold, according to the end-use customer survey data and assigned partner status from the EPA National Partner list and Lockheed Martin NYPP partner list come from national partners, NYSERDA partners, and non-partners?
• ENERGY STAR Market Penetration share within the partnership groups: What percent of the units sold by national partners, NYSERDA partners, and non-partners are ENERGY STAR certified?
26 ES Market Penetration values for National Partner Only are based off of data from 2010 and 2011. 2012 data was not available at the time of this report.
4-14

Table 4-7: Summary of 2010-2012 ENERGY STAR Appliance Market Share: NYSERDA
Sources:
Product market shares: MCAP Residential End-Use Customer Telephone Survey (percent of all sales by store partner status) and Lockheed Martin and EPA National partnership status files
ES market penetration for non-partners: MCAP Residential End-Use Customer Telephone Survey
ES market penetration for NYSERDA partners and NYSERDA & national partners: Lockheed Martin (percent of partner sales ENERGY STAR certified)
ES market penetration for national partners: D&R International (percent of national partner sales ENERGY STAR certified)
ES market penetration for US National partners: ENERGY STAR website, 2010-2012 shipments (https://www.energystar.gov/index.cfm?c=partners.unit_shipment_data_archives)
Retailer Partner Status Refrigerators Clothes Washers Dishwashers Room ACs
Product Market Share
ES Market Penetration
Product Market Share
ES Market Penetration
Product Market Share
ES Market Penetration
Product Market Share
ES Market Penetration
Non-Partner 10% 56% 11% 35% 15% 52% 8% 16% NYSERDA Partner Only
18% 67% 17% 69% 21% 89% 5% 82%
National Partner Only
54% 44% 46% 58% 39% 71% 70% 44%
NYSERDA & National Partner
18% 71% 26% 71% 24% 82% 17% 72%
Sum of Share & Weighted Penetration
100% 54% 100% 61% 100% 75% 100% 48%
All US National Partners
N/A 60% N/A 64% N/A 95% N/A 51%
* ES Market Penetration values for NYSERDA Partner Only, National Partner Only, and NYSERDA & National Partner are based off of data from 2010 and 2011. 2012 data was not available at the time of this report.
* Product market share refers to the percentage of units sold through the retailer based on partnership status (e.g., 10% of all refrigerators are sold through non-partners)
* ES market penetration refers to the percentage of units within the partnership stratum that are ENERGY STAR certified (e.g., 44% of the refrigerators sold by national partners in New York State are ENERGY STAR certified).
* Partner status was determined by matching the store name in the NYSERDA partner list and national partner list. Non-partners are found in neither. NYSERDA & national partners are found in both.
4-15

The comparison area market share analysis relied on the same methodology as described above (for the
NYSERDA area), but with a few exceptions. The analysis relied on only two data sources (there was no
equivalent comparison area Program Administrator (NYSERDA) sales data):
• National partner store allocations rely on ENERGY STAR Program partner sales data from D&R but compiled for the comparison areas, and
• Non-partner store allocations rely on end-use consumer self-reported and model number verified ENERGY STAR market penetration from the comparison area residential end-user telephone survey.27.
Thus, there were only two retailer partner status options (instead of four) for the comparison area:
• Non-partners retailers and • National ENERGY STAR-only partners.
The “Non-Partner” store product market share for the comparison area is consistent with the NYSERDA
region findings, within 2-3% points for each appliance. The ENERGY STAR market penetration
associated with “National Partner Only” stores is higher for all appliances in the comparison area. For
overall ENERGY STAR market penetration (including NYSERDA partner stores in NYSERDA region),
the comparison area has higher percentages for all appliances except dishwashers, where the NYSERDA
region is 1% point higher than the comparison area.
27 Respondents were asked to read their model numbers from their appliance. The evaluation team later verified if the model was ENERGY STAR or not.
4-16

Table 4-8: Summary of 2010-2012 ENERGY STAR Appliance Market Share: Comparison Area
Sources:
Product market shares: MCAP Residential End-Use Customer Telephone Survey (percent of all sales by store partner status) and Lockheed Martin and EPA National partnership status files
ES market penetration for non-partners: MCAP Residential End-Use Customer Telephone Survey
ES market penetration for national partners: D&R International (percent of national partner sales ENERGY STAR certified)
Retailer Partner Status Refrigerators Clothes Washers Dishwashers Room ACs
Product Market Share
ES Market Penetration
Product Market Share
ES Market Penetration
Product Market Share
ES Market Penetration
Product Market Share
ES Market Penetration
Non-Partner 12% 47% 14% 49% 13% 43% 6% 0% National Partner Only
88% 63% 86% 69% 87% 79% 94% 56%
Sum of Share & Weighted Penetration
100% 61% 100% 66% 100% 74% 100% 53%
* Product market share refers to the percentage of units sold through the retailer based on partnership status (e.g., 12% of all refrigerators are sold through non-partners)
* ES market penetration refers to the percentage of units within the partnership stratum that are ENERGY STAR certified (e.g., 63% of the refrigerators sold by national partners in the comparison area are ENERGY STAR certified).
* Partner status was determined by matching the store name with the national partner list. Non-partners are not found in the national partner list.
The following graphs (Figure 4-5 through Figure 4-8) discuss and show ENERGY STAR market share
trends from 2001 to 2012.28 Included in each figure are call-out boxes that show when ENERGY STAR
specifications changed (along with the version number of the standard change).
NYSERDA partner retailers and NY national partners for refrigerators are seen to follow remarkably
similar ENERGY STAR market penetration trends from 2001 to 2010, with NYSERDA-only partner
stores having an ENERGY STAR market penetration percentage at least five percentage points higher
than NY national partners. In 2011, however, the NY national partners are seen to pull even with the
NYSERDA partners’ ENERGY STAR market penetration, after a sharp increase beginning in 2009 that
is attributed to ARRA funding.
28 Please note that 2012 National partner data was not available from D&R at the time of the development of this report
4-17

Figure 4-5: NYSERDA Region Market Penetration of ENERGY STAR Refrigerators by Year and Partnership Status
Source: NYSERDA partner sales database and D&R International
Like refrigerators, NYSERDA partners and NY national partners for clothes washers follow a common
trend from 2001 to 2010, with the exception of 2008 where NY national partners experience a dramatic
and peculiar decline in ENERGY STAR market penetration. In 2011, the NY national partner ENERGY
STAR market penetration actually surpasses that of the NYSERDA partners, 76% to 73%. The increase
observed for NY national partners beginning in 2009 is primarily attributed to the emergence of ARRA
funding.
0%
10%
20%
30%
40%
50%
60%
70%
80%
2001 2002 2003 2004 2005 2006 2007 2008 2009 2010 2011 2012
ES M
arke
t Pen
etra
tion
NY National Partner NYSERDA Partner
ES v4
4-18

Figure 4-6: NYSERDA Region Market Penetration of ENERGY STAR Clothes Washers by Year and Partnership Status
Source: NYSERDA partner sales database and D&R International
NY national partners and NYSERDA partners for dishwashers loosely follow a similar ENERGY STAR
market penetration pattern from 2001 to 2010, but without one being consistently higher than the other.
This is likely the result of very high levels of ENERGY STAR market penetration for dishwashers among
both groups, coupled with a number of ENERGY STAR specification changes over a short period of
time. Additionally, the yearly differences between the two groups are within the calculated error bounds
for most years, suggesting that the trends are largely the same.
0%
10%
20%
30%
40%
50%
60%
70%
80%
2001 2002 2003 2004 2005 2006 2007 2008 2009 2010 2011 2012
ES M
arke
t Pen
etra
tion
NY National Partner NYSERDA Partner
ES v2/3
ES v4
ES v5
4-19

Figure 4-7: NYSERDA Region Market Penetration of ENERGY STAR Dishwashers by Year and Partnership Status
Source: NYSERDA partner sales database and D&R International
As with the other appliances, a common trend is observed between NY national partner and NYSERDA
partner room air conditioner retailers from 2001 to 2010. The year to year fluctuations in ENERGY
STAR market penetration are a result of room air conditioners’ volatility connected to seasonal weather
patterns. The NY national partner retailers pull even with the NYSERDA partner retailers in terms of
ENERGY STAR market penetration percentages by the end of 2011, again attributed to ARRA funding
0% 10% 20% 30% 40% 50% 60% 70% 80% 90%
100%
2001 2002 2003 2004 2005 2006 2007 2008 2009 2010 2011 2012
ES M
arke
t Pen
etra
tion
NY National Partner NYSERDA Partner
ES v2
ES v3 ES v5
ES v4
4-20

Figure 4-8: NYSERDA Region Market Penetration of ENERGY STAR Room ACs by Year and Partnership Status
Source: NYSERDA partner sales database and D&R International
Other Measures
In addition to the high impact measures discussed above, the NYPP works to increase market share of the
following ENERGY STAR products:
• Air cleaners • Dehumidifiers • Freezers • Through-the-wall room air conditioners • Ceiling fans
While the market share for these measures is collected from the NYSERDA partners, no additional data
were available from either the national partners or the residential end-user survey for comparison and
analysis. Since the focus of this report is on the four major ENERGY STAR products: refrigerators,
clothes washers, dishwashers, and room ACs, the other measures are not discussed in detail in this report.
The percent of these measures sold at NYSERDA partner stores that are ENERGY STAR are shown in
Table 4-9 and were generated from the NYSERDA program tracking database provided by Lockheed
Martin. Attribution for these measures was based on interpolated data from the four major products where
appropriate and the NYSERDA partner sales data for each of the other measures. Attribution analysis can
be found in the Attribution and Program Savings section of this report.
0%
10%
20%
30%
40%
50%
60%
70%
80%
90%
2001 2002 2003 2004 2005 2006 2007 2008 2009 2010 2011 2012
ES M
arke
t Pen
etra
tion
NY National Partner NYSERDA Partner
ES v2
4-21

Table 4-9: NYSERDA Partner Store ENERGY STAR Market Penetration for Other Measures
Source: NYSERDA Program Tracking Data provided by Lockheed Martin
Product
2010 Market
Penetration
2011 Market
Penetration
2012 Market
Penetration
Air cleaners 32% 75% 31%
Dehumidifiers 87% 96% 87%
Freezers 39% 27% 48%
Through-the-Wall AC 80% 79% 80%
Ceiling Fans without Lights 34% 51% 47%
Ceiling Fans with Lights 30% 52% 61%
4-22

5 Market Assessment This section examines key Program and market assessment metrics developed for the NYPP and
discusses how these metrics have changed over time.
In the discussion that follows, the metrics are organized into four broad groupings drawn from previous
NYSERDA and evaluation team work efforts:
• Market actor awareness and knowledge • Perceived value of energy efficiency measures • Accessibility of energy efficiency measures • Pricing and incremental cost
5.1 Awareness and Knowledge
One of the most important goals of the NYPP is to raise awareness and understanding of the
ENERGY STAR® label among both “downstream” (residential end-use customers) and “upstream”
(retailers) market actors. As discussed earlier, the Program has invested significant resources in
advertising, point-of-purchase (POP) displays, and retailer training. To determine how well the program
raised awareness, the evaluation team used information gathered in the MCAP Residential End-Use
Customer Telephone Survey, the CEE Survey, the Corporate Retailer interviews, and the Participating
Retailer Storefront Survey.
In the MCAP Residential End-Use Customer Telephone Survey, customers were asked if they had either
seen or heard of the ENERGY STAR label. The question was first asked unaided, without a description of
the label. If the respondent was unaware of the label, he or she was then aided with a detailed description
of the label. In the 2007 Residential End-Use Survey, 75% of respondents were aware of the label
unaided, and 80% were aware when aided with a description. In the 2013 survey, 79% of respondents
were aware of the label unaided, and 86% were aware with aided description, slightly lower from the
2010 survey results (Figure 5-1).
5-1

Figure 5-1: Consumer Awareness of ENERGY STAR Label
Source: MCAP 2013 Residential End-Use Customer Telephone Survey (n=619), 2012 MCA Evaluation Report (Cadmus)
80%
89%
86%
75%
80% 79%
65%
70%
75%
80%
85%
90%
95%
2007 2010 2013
% o
f Con
sum
ers
Aw
are
of L
abel
Year Survey Conducted
Aided Unaided
Comparing consumer awareness of the ENERGY STAR label between the NYSERDA area versus the
comparison area,29 the MCAP Residential End-Use Customer Telephone Survey results (Figure 5-2)
demonstrates a higher level of consumer awareness for both the aided and unaided responses in the
NYSERDA region. Specifically, unaided awareness of the ENERGY STAR label is two percentage
points higher among NYSERDA respondents and four percentage points higher for aided awareness, both
statistically significant differences at the 10% level. In 2012, from the CEE survey, unaided recognition of
the ENERGY STAR label remained significantly higher in NYSERDA’s area than nationally (71% and
65%, respectively). Aided recognition, both nationally and in the NYSERDA area, has increased slightly
since 2010, and both are currently at 82% recognition (compared to 76% and 80%, respectively, in 2010).
29 The phrase “comparison area,” here and throughout the report, refers to all three of the comparison regions (the State of Virginia, Washington, D.C., and Houston, TX).
5-2

Figure 5-2: Consumer Awareness of ENERGY STAR Label
Source: MCAP 2013 Residential End-Use Customer Telephone Survey. NYSERDA (n=519), Comparison Area (n=636)
86%
82%
79%
77%
72%
74%
76%
78%
80%
82%
84%
86%
88%
2013 - NYSERDA 2013 - Comparison
% o
f Con
sum
ers
Aw
are
of L
abel
Aided Unaided
The MCAP Residential End-Use Customer Telephone Survey asked a similar question regarding the
ENERGY STAR Most Efficient designation. Again, the question was first asked unaided, without a
description of the designation. If the respondent was unaware of the designation, he or she was then aided
with a detailed description of the designation. Surprisingly, given the results of the ENERGY STAR label
awareness, respondents within the comparison area had a higher awareness of the ENERGY STAR Most
Efficient designation,30 both unaided (13 percentage points higher) and aided (11 percentage points
higher), depicted in Figure 5-3. While it is not entirely clear why comparison area respondents would
show a lower awareness of the ENERGY STAR label in relation to the NYSERDA area, and yet have a
greater awareness of the ENERGY STAR Most Efficient designation, one possible explanation is that the
Evaluation Team was unable to verify the legitimacy of the responses. Consumer awareness, based on
CEE survey results, of the ENERGY STAR Most Efficient program is low within both the NYSERDA
area (only 12%) and nationally (14%). Increasing consumer awareness of ENERGY STAR Most Efficient
should be a focus in order to maximize per unit savings as the market share of ENERGY STAR products
increases.
30 Statistically significant at the 10% level.
5-3

Figure 5-3: Consumer Awareness of ENERGY STAR Most Efficient
Source: MCAP 2013 Residential End-Use Customer Telephone Survey. NYSERDA (n=309), Comparison Area (n=378)
Figure 5-4 presents consumer understanding of the ENERGY STAR label from survey respondents in the
NYSERDA area and the comparison area, as well as NYSERDA partner retailers’ perspective on
customer understanding. Both NYSERDA and comparison area respondents reported that the ENERGY
STAR label conveys energy efficiency at a percentage (68% and 66%, respectively) which far exceeds the
next closest response. Across all responses, very little variation is seen between NYSERDA respondents
and comparison area respondents, with no response common to both groups being statistically different
(partly due to the low number of observations for a single given response). 45% of retailers, the most
commonly cited response, felt that consumers associate the ENERGY STAR label with saving money by
operating the appliance, a finding that is reaffirmed by the consumers themselves, as this was the second
most common response provided. In general, the range of responses for retailers was limited compared to
those of the consumers, possibly highlighting a disconnect in the perception of ENERGY STAR between
the two groups. Across the full spectrum of responses, little change is witnessed when comparing to the
prior evaluation’s findings. The 2008-2009 data also shows “energy efficient” as the most frequent
response, followed by “energy conservation” and “save money on operation.” It does appear that the
negative ties to the ENERGY STAR label have continued to lessen since the previous evaluation
(between 2% and 3%), now representing less than 1% of all NYSERDA respondents.
25%
36%
16%
29%
0%
5%
10%
15%
20%
25%
30%
35%
40%
2013 - NYSERDA 2013 - Comparison Area
% o
f Con
sum
ers
Aw
are
of L
abel
Aided Unaided
5-4

Figure 5-4: Consumer Understanding of the ENERGY STAR Label
Source: MCAP 2013 Residential End-Use Customer Telephone Survey and Partner Retailer Storefront Survey. NYSERDA (n=476), Comparison Area (n=551), Retailer (n=71). Percentages may add to over 100%, as multiple responses were allowed.
The aggressive cooperative advertising campaign, supported by NYPP funding, appears to have had
limited impact on consumers, as seen in Figure 5-5. For example, 50% of respondents reported that they
had seen or heard an advertisement or information about ENERGY STAR in the last year, a decrease
from the 63% reported in the prior evaluation. An additional 24% had seen or heard an advertisement or
info about energy efficiency in the last year, up from 13% in 2008-2009, perhaps suggesting that a greater
emphasis has been placed on energy efficiency, and not merely ENERGY STAR.
0% 10% 20% 30% 40% 50% 60% 70% 80%
Energy Efficient Save money on operation
Energy Conservation Electricity
Energy (no link to efficiency) Savings (not linked to operation)
Nothing/Not Much Environmental benefits
Quality Government backing
Product standards (no environmental link) Confuses with Energy Guide
Higher Cost Energy/Environmental product standards
Environment (not linked to benefits) Negative perception
NYSERDA Comparison Area Retailer
5-5

Figure 5-5: Awareness of ENERGY STAR or Energy Efficiency Advertisement, 2010-2012
Source: MCAP 2013 Residential End-Use Customer Telephone Survey (n=476)
The most common medium by far for advertising awareness are television ads (58% of respondents,
Figure 5-6). The top advertising media after television ads are retail signs and materials, newspaper and
magazine ads, and Internet sites. These findings are similar to the 2008-2009 evaluation findings, with the
top three categories remaining the same. Internet sites, while their percentage only increased by two
percentage points, rose to the fourth most common response (previously sixth). Another noticeable
change is the decreased prevalence of radio ads, decreasing from around 12% to just 4%.
50%
24%
26% Saw/heard ENERGY STAR ads or info
Saw/heard energy efficiency ads or info
Saw/heard no ads or info
5-6

Figure 5-6: Where Consumers Saw Information or Ads about the ENERGY STAR Label, 2010-2012
Source: MCAP 2013 Residential End-Use Customer Telephone Survey (n=309). Percentages may add to over 100%, as multiple responses were allowed.
Respondents who had searched for product information on the Internet between 2010 and 2012 were also
asked if the sites they searched displayed the ENERGY STAR logo for products. This aided recall
indicated that the ENERGY STAR logo is highly present; 50% of respondents reported that all (20%) or
some (30%) of the sites they visited displayed the ENERGY STAR logo (Table 5-1).
Table 5-1: Internet Sites Visited that Displayed the ENERGY STAR Logo on Products, 2010-2012
Source: MCAP 2013 Residential End-Use Customer Telephone Survey
Displayed ES Logo?
Refrigerator (n=33)
Clothes Washer (n=52)
Dishwasher (n=49)
Room AC (n=28)
Overall (n=162)
Yes, all sites visited 20% 18% 22% 22% 20% Yes, some of the sites 33% 31% 27% 30% 30% No, none of the sites 8% 11% 9% 1% 8% Don't know 39% 40% 43% 46% 42%
0% 10% 20% 30% 40% 50% 60% 70%
TV ad Retail space sign and info materials
Newspaper/magazine ad Internet site
Newspaper insert Don't Know
Radio ad Other
Utility mailing or billing insert TV news feature story
Retail mailing materials Radio public service announcement
Yellow Energy Guide label NYSERDA promotional campaign
Billboard
5-7

Surveyed retailers were asked where they advertise their ENERGY STAR products. The results from
NYSERDA partner retailers are shown in Figure 5-7. While consumers overwhelmingly reported
television advertisements as the number one source of information about ENERGY STAR, it was the
fourth most frequently used form of media for NYSERDA partners, identical to the prior evaluation. Less
than 20% of customers reported hearing about ENERGY STAR in newspaper or magazine ads, while
75% of NYSERDA retailers reported using them for advertising. The percentage of NYSERDA retailers
utilizing social media to advertise ENERGY STAR products has increased dramatically over recent years,
up from around 15% in 2008-2009 to 45% in 2010-2012. Despite the relatively high usage of social
media by retailers, consumers did not specifically identify social media as an outlet for where they viewed
information pertaining to ENERGY STAR certified appliances (Figure 5-6).
Figure 5-7: Media Used by Retailers to Advertise ENERGY STAR Products, 2010-2012
Source: MCAP 2013 Partner Retailer Storefront Survey. Percentages may add to over 100%, as multiple responses were allowed.
5.2 Perceived Value
Another important goal of the NYPP is to increase the perceived value of products that have the
ENERGY STAR label. Perceived value is assessed by a number of different metrics, including examining
repeat purchases of ENERGY STAR certified products, willingness to recommend ENERGY STAR
certified products, changes in consumer demand for ENERGY STAR certified products, and the
0% 10% 20% 30% 40% 50% 60% 70% 80%
Newspaper
Website
Social Media
TV
Radio
Yellow Pages
Other
Direct Mail
Flyers
None
5-8

commitment to the Program by participating retailers. The majority of questions pertaining to perceived
value were only asked of ENERGY STAR purchasers in the MCAP 2013 Residential End-Use Customer
Telephone Survey, corresponding to 295 ENERGY STAR purchasers in the NYSERDA region and 460
ENERGY STAR purchasers in the Comparison Area.
43% of customers that reported purchasing a product with the ENERGY STAR label during 2010 to 2012
stated that prior experience with ENERGY STAR products influenced their decision to purchase another
energy efficient product (Figure 5-8). This shows a stable trend in perceived value with 47% of
respondents in the prior evaluation having had a previous experience that influenced their ENERGY
STAR product purchase. For comparison area respondents, 39% noted that a previous ENERGY STAR
purchase influenced their purchase, not statistically different from NYSERDA respondents.
Figure 5-8: Customers Reporting that a Previous ENERGY STAR Purchase Influenced Recent ENERGY STAR Purchase
Source: MCAP Residential End-Use Customer Telephone Survey 2007 (n=487), 2010 (n=518), 2013 (n=295), and 2013 – Comparison Area (n=460)
Additionally, 86% of NYSERDA respondents said they would definitely (56%) or probably (30%)
purchase an ENERGY STAR certified product in the future. From a longitudinal perspective, this is a
noticeable increase from the prior evaluation where 74% of respondents stated they were likely to
purchase an ENERGY STAR certified product in the future. Looking at the comparison area, 82% of
respondents indicated that they would purchase an ENERGY STAR certified product in the future, a
statistically significant difference from the NYSERDA respondents at the 10% level (Figure 5-9).
0%
10%
20%
30%
40%
50%
60%
70%
Yes No Don't Recall
Did
prev
ious
ES
purc
hase
influ
ence
cu
rren
t pur
chas
e?
2007 2010 2013 2013 - Comparison Area
5-9

Figure 5-9: Likelihood of Future ENERGY STAR Purchase
Source: MCAP Residential End-Use Customer Telephone Survey 2007 (n=487), 2010 (n=519), 2013 (n=519), and 2013 – Comparison Area (n=540)
Consumer satisfaction can also be measured by willingness to recommend ENERGY STAR products.
Figure 5-10 shows that 78% of the respondents said they would definitely (50%) or probably (28%)
recommend ENERGY STAR certified products, essentially unchanged from the 2010 Residential End-
Use Customer Telephone Survey. The comparison area respondents are actually seen to report a higher
likelihood of ENERGY STAR certified product recommendation at 81%, although this difference is not
statistically significant at the 10% level.
0%
10%
20%
30%
40%
50%
60%
Definitely would
Probably would
Might Probably would not
Definitely would not
Like
lihoo
d of
futu
re E
S pu
rcha
se
2007 2010 2013 2013 - Comparison Area
5-10

Figure 5-10: Consumers Likelihood of Recommending ENERGY STAR Products
Source: MCAP Residential End-Use Customer Telephone Survey 2007 (n=487), 2010 (n=846), 2013 (n=295), and 2013 – Comparison Area (n=460)
The residential end-use customer telephone survey responses also indicated that seeing the ENERGY
STAR label was an influential factor in their purchase decisions. For example, 46% of NYSERDA
ENERGY STAR refrigerator purchasers said the ENERGY STAR label was either extremely or very
influential in their purchase decisions (Figure 5-11). Similarly, over half of the clothes washer and room
air conditioner purchasers said the label was extremely or very influential. Fewer than half (42%) of
dishwasher purchasers said the ENERGY STAR label was either extremely or very influential, implying
that other factors are driving the decision-making process for this product. When comparing the
NYSERDA and comparison area results across all appliance types, little variation is found with a similar
trend in influence percentages, with the exception of room air conditioners where the ENERGY STAR
label influence level is 18 % points higher in the NYSERDA region, although even room air conditioners,
along with the other appliances, do not statistically differ (at the 10% level) between the two areas.
0%
10%
20%
30%
40%
50%
60%
Definitely would
Probably would
Might Probably would not
Definitely would not
Like
lihoo
d of
reco
mm
endi
ng E
S Pr
oduc
ts
2007 2010 2013 2013 - Comparison Area
5-11

Figure 5-11: Influence of the ENERGY STAR Label on Purchase Decision: Percentage of Respondents Stating “Extremely Influential” or “Very Influential”
Source: MCAP 2013 Residential End-Use Customer Telephone Survey
46% 51%
42%
64%
45% 52%
39% 46%
0%
20%
40%
60%
80%
Refrigerator (NYSERD: n=100,
Comparison Area: n=189)
Clothes Washer (NYSERDA:
n=115, Comparison Area: n=154)
Dishwasher (NYSERDA:
n=101, Comparison Area: n=128)
Room AC (NYSERDA: n=96,
Comparison Area: n=87)
% o
f Pur
chas
ers R
espo
ndin
g "E
xtre
mel
y In
fluen
tial"
or "
Very
Influ
entia
l"
NYSERDA Comparison
Additionally, the residential end-use customer telephone survey respondents were asked about the
influence of the Federal Trade Commission (FTC) EnergyGuide label on their ENERGY STAR appliance
purchase decision.31 As seen in Table 5-2, a greater percentage of respondents indicated that the FTC
label played no role in their purchase decision compared to the ENERGY STAR label. No single
appliance stands out as having a unique pattern, but a higher percentage of respondents found the FTC
label to be influential for room air conditioners.
31 The Federal Trade Commission (FTC) EnergyGuide label is a yellow label placed on the appliance by the manufacturer stating an annual operating cost and an energy consumption rating, and a range for comparing the highest and lowest energy consumption for all similar models.
5-12

Table 5-2: Influence of the FTC Label on Purchase Decision
Source: MCAP 2013 Residential End-Use Customer Telephone Survey
Refrigerator
(n=100) Clothes Washer
(n=115) Dishwasher
(n=101) Room AC
(n=41 )
Extremely influential 7% 8% 6% 0% Very influential 18% 20% 19% 27% Somewhat influential 23% 24% 25% 15% Slightly influential 13% 14% 10% 20% Not at all influential 28% 25% 32% 39% Don't know 11% 10% 8% 0%
Figure 5-12 presents the findings related to the influence of the American Recovery and Reinvestment
Act (ARRA) funding on consumer purchases of ENERGY STAR appliances. Immediately noticeable is
the relatively low percentage of respondents across all appliances mentioning ARRA was either
“Extremely Influential” or “Very Influential.” This feature is common to both NYSERDA and the
comparison area, suggestive that the ARRA funding generally impacted NYSERDA and the comparison
area in a similar manner, although the percentage differences for dishwasher and room air conditioners
are statistically significant at the 10% level. Because the survey efforts asked about appliance purchases
from 2010 to 2012, the significance of the ARRA rebates is likely lower than it would be if the purchase
time period was restricted to a time period when the ARRA rebates were more active. Additionally,
purchasers may have been influenced by marketing and incentives that were ARRA funded, but may not
have realized that it was in fact associated with ARRA.
5-13

Figure 5-12: Influence of ARRA on Purchase Decision: Percentage of Respondents Stating “Extremely Influential” or “Very Influential”
Source: MCAP 2013 Residential End-Use Customer Telephone Survey
Another important measure of perceived value is consumer demand: increasing consumer demand is an
indication that end users see additional value in ENERGY STAR certified products. Retailers were asked
if they perceived consumer demand to be increasing or decreasing during 2010-2012. The majority of
these respondents – many of whom had been in the Program for a number of years – said that consumer
demand was increasing. For example, 83% of those selling refrigerators and 73% of those selling clothes
washers stated that consumer demand for ENERGY STAR certified products had increased significantly
or somewhat during the time period of interest (Figure 5-13). Although only six retailers answered
questions pertaining to advanced power strips, advanced power strip demand was stated to have increased
by 40% of the respondents, with the remainder stating no change in demand.
18%
9% 10%
19% 18%
8%
19%
29%
0% 5%
10% 15% 20% 25% 30% 35%
Refrigerator (NYSERD: n=83,
Comparison Area: n=85)
Clothes Washer (NYSERDA:
n=106, Comparison Area: n=62)
Dishwasher (NYSERDA: n=91,
Comparison Area: n=66)
Room AC (NYSERDA: n=85,
Comparison Area: n=49)
% o
f Pur
chas
ers R
espo
ndin
g "E
xtre
mel
y In
fluen
tial"
or "
Very
Influ
entia
l"
NYSERDA Comparison Area
5-14

Figure 5-13: Retailers’ Perceived Change in Consumer Demand for ENERGY STAR Products
Source: MCAP 2013 Partner Retailer Storefront Survey
0%
10%
20%
30%
40%
50%
60%
70%
Refrigerator (n=30)
Clothes Washer (n=38)
Dishwasher (n=35)
Room AC (n=32)
APS (n=6)
Increased Significantly Increased Somewhat Remained the Same
Decreased Somewhat Decreased Significantly
Figure 5-14 and Figure 5-15 show retailers’ perceptions of reasons for increasing and decreasing
consumer demand for ENERGY STAR certified products during 2010-2012. When asked to provide
reasons for the general increase in demand, the most common response was the NYPP (84%), followed
by state level promotional activities (75%), higher energy prices (73%), new or improved energy-efficient
technologies (70%), and environmental concerns (66%). The top reasons provided by retailers for
decreasing demand of ENERGY STAR among consumers were the economy, higher energy prices, and
state standards.32
32 While nine retailers listed state standards as a reason for decreased ENERGY STAR demand among consumers, no state standards impacted the related appliances in this evaluation. The retailer respondents may have answered generically about other ENERGY STAR products (televisions, consumer audio and video products, etc.).
5-15

Figure 5-14: Reasons for Increased Consumer Demand for ENERGY STAR Products
Source: MCAP 2013 Partner Retailer Storefront Survey (n=56). Percentages may add to over 100%, as multiple responses were allowed.
Figure 5-15: Reasons for Decreased Consumer Demand for ENERGY STAR Products
Source: MCAP 2013 Partner Retailer Storefront Survey (n=56). Percentages may add to over 100%, as multiple responses were allowed.
0 10 20 30 40 50 60 70 80 90
The Economy State Standards
Sales of Competing Retailers New Federal Standards
Environmental Concerns New or Improved Technology
Higher Energy Prices State-level promotional activities
NYSERDA's NYPP
Small Influence Moderate Influence Large Influence
0 5 10 15 20 25 30 35 40 45 50
New or Improved Technology
Environmental Concerns
New Federal Standards
Sales of Competing Retailers
State Standards
Higher Energy Prices
The Economy
Small Influence Moderate Influence Large Influence
5-16

5.3 ENERGY STAR Promotion and Stocking Practices
The promotional and stocking practices of ENERGY STAR appliances does not appear to be contingent
upon the NYPP. For example, 61% of participating appliance retailers said they would continue to
promote ENERGY STAR appliances without the NYPP (Figure 5-16), compared to 58% in the prior
evaluation. Also notable, no retailers reported that they would entirely stop carrying ENERGY STAR
products without the support of the NYPP, whereas 12% of storefronts stated they would discontinue
carrying ENERGY STAR in the 2008-2009 evaluation.
Figure 5-16: Percent of Retailers that would continue Promotion or Stocking of ENERGY STAR Appliances without the NYPP
Source: MCAP 2013 Partner Retailer Storefront Survey
The Participating Retailer Survey asked, for each appliance type, if sales had increased due to the NYPP
and by what percentage. On average, retailers estimated a 22% boost in sales due to the NYPP, almost a
10 percentage point decrease from the prior evaluation. Table 5-3 shows the results of the analysis for
each product.
56% 38%
6%
Stocking (n=71)
Carry same number
Carry fewer
Don't know
61% 26%
5% 8%
Promotions (n=49)
Would still advertise Would not advertise
Maybe advertise Don't know
5-17

Table 5-3: Partner Retailer Self-Reported Sales Boost from NYPP
Source: MCAP 2013 Partner Retailer Storefront Survey
Refrigerator Clothes Washer Dishwasher Room AC All Products
All Stores (n=66) 20.1% 20.1% 20.0% 26.4% 22%
5.4 Accessibility / Availability of Efficient Products
In addition to raising awareness and increasing the perceived value of ENERGY STAR products, the
NYPP also seeks to increase the accessibility of ENERGY STAR labeled products. In previous reports,
data collected from onsite retailer floor survey by Lockheed Martin regarding stocking and labeling
practices among participating retailers were used to present findings. For this evaluation, the MCAP team
is supplementing this information by reporting on telephone survey data collected from Program
participating retailers. In addition, consumer perceptions of the salesperson’s recommendations are
presented.
According to responses from the MCAP retailer phone survey, the average NYSERDA-partnered
appliance store display consisted of more than 60% ENERGY STAR products at the end of 2012 (Figure
5-17).33 Dishwashers had the highest ENERGY STAR share of display space in stores (87%), followed
by room air conditioners at 77%, refrigerators at 67%, and clothes washers at 66% ENERGY STAR. As
seen in the figure, these percentages all represent an increase from the retailer self-reported percentages
associated with the 2010 survey. Compared to Lockheed Martin’s 2012 Participant Practices Report,34
the 2012 self-report data is between 2% to 10% lower for all appliances except dishwashers (7%
higher).35 This is largely consistent with the 2010 differences between the two data sources.
33 According to Lockheed Martin Participant Practices Report (2012), 82 percent of the models on display were ENERGY STAR.
34 Lockheed Martin, 2013. “New York Products Program 2012 Participant Practices Report.” 35 2012 percentage of models in store that are ENERGY STAR qualified: refrigerator – 67% (self-report), 74% (LM);
clothes washer – 66% (self-report), 76% (LM); dishwasher – 87% (self-report), 80% (LM); room air conditioner – 77% (self-report), 79% (LM).
5-18

Figure 5-17: Self-reported Percent of Displayed Models in Stores That Are ENERGY STAR Certified
Source: MCAP 2013 Partner Retailer Storefront Survey (n=71)
Salesperson Promotion
Customers reported that salespersons continue to promote ENERGY STAR and its benefits: 38% of the
end-use customers that were aware of ENERGY STAR and purchased a refrigerator reported that the
salesperson brought up ENERGY STAR without being asked, and an additional 13% said it came up
during discussion with the salesperson (Table 5-4). Energy efficiency was also discussed, irrespective of
how the conversation started, about a third of the time: 31% of the refrigerator purchasers, 38% of the
clothes washer purchasers, 42% of the dishwasher purchasers, and 38% of room air conditioner
purchasers.
Compared to the 2008-2009 evaluation, the percentage of salespeople discussing ENERGY STAR,
irrespective of who initiated the conversation, is shown to have decreased for all appliances except room
air conditioners, where the percentage actually increased by 21 percentage points.
0% 10% 20% 30% 40% 50% 60% 70% 80% 90%
100%
Refrigerator Clothes Washer
Dishwasher Room AC APS
Percent ENERGY STAR 2010 Percent ENERGY STAR 2012
5-19

Table 5-4: Salesperson Discussion Regarding Energy Efficiency and ENERGY STAR
Source: MCAP 2013 Residential End-Use Customer Telephone Survey
Refrigerator Clothes Washer Dishwasher
Room AC APS
Discussion with Retailers Regarding Energy Use and Operating Cost
n= 68 n=60 n=58 n=76 n=28
Salesperson brought up energy use 21% 22% 20% 24% 18% Salesperson discussed energy use after respondent mentioned it
6% 13% 4% 14% 22%
Discussion on energy use came from both sales-person and respondent
0% 0% 4% 0% 4%
Don't know who brought up energy use 4% 3% 14% 1% 56% Not discussed 69% 62% 58% 62% 14% Discussion with retailers regarding the ENERGY STAR label
n= 58 n=56 n=52 n=70
Salesperson brought up ENERGY STAR 38% 32% 40% 19% Salesperson discussed ES after respondent mentioned it
12% 11% 0% 16%
Discussion of ENERGY STAR label came from both salesperson and respondent
1% 2% 5% 6%
Don't know who brought up ENERGY STAR 16% 5% 16% 6% Not discussed 33% 50% 39% 54%
5.5 Pricing and Incremental Cost
One goal of the NYPP is to reduce the incremental cost of ENERGY STAR certified products compared
to standard efficiency products. As ENERGY STAR models become more plentiful, or market share
increases, and as economies of scale in production improve, a reduction in the price premium associated
with ENERGY STAR may result.
The possible price premium for ENERGY STAR certified products has been explored through a statistical
review of the results from on-site surveys conducted by Lockheed Martin with participating retailers.
These on-site surveys have been collected since 2004, providing a rich longitudinal dataset to explore
incremental cost changes over time.36
36 Note that starting in 2010 the data necessary for the statistical models are only collected every other year therefore analysis was only available for the 2011 program year.
5-20

The analysis includes both a simple comparison of average prices for ENERGY STAR and non-
ENERGY STAR appliance models, as well as a more complex analysis that controls for product features
(e.g., unit size/capacity, brand, etc.) through multivariate regression models to help isolate the incremental
cost that is due to the ENERGY STAR label. The multivariate regression analysis was done in the 2006
evaluation report37 (for program years 2004 and 2005) and is repeated here in this report for program year
2011. A summary of the results are presented in Table 5-5.
Results of Pricing Analysis
Merely looking at the simple comparison of average prices for ENERGY STAR and non-ENERGY
STAR, the ENERGY STAR premium is found to be $672 for refrigerators, corresponding to an 85%
price differential. From a longitudinal perspective, as seen in Figure 5-18, this 85% price differential is a
dramatic increase from the 39% price differential observed in the 2010 evaluation report.38 The simple
comparison of average prices fails to account for the potentially confounding impact of ENERGY STAR
refrigerators being bundled with certain product features that are correlated with price, such as size, side-
by-side layout, ice maker, electronic temperature control, etc. Upon controlling for the set of covariates
available in the Lockheed Martin dataset, the multivariate regression model approach results in an
ENERGY STAR premium of $87, or an 11% price differential (statistically significant at the 10% level).
The dishwasher ENERGY STAR price premium percentage is found to be -18% using the simple
comparison of average prices and 5% when using the multivariate regression model (not statistically
significant at the 10% level). Given the lack of statistical significance in the model and knowing that zero
is contained within the confidence interval, it is plausible that there is not a price premium associated with
the ENERGY STAR label. Reaffirming this possibility is the result from the 2005 multivariate regression,
where the ENERGY STAR price premium percentage was found to be 0%, depicted in Figure 5-19.
37 Quantec, LLC and Summit Blue Consulting, LLC: New York ENERGY STAR Products and Marketing Program: Market Characterization, Market Assessment and Causality Evaluation; May, 2006
38 The Cadmus Group and Navigant Consulting: New York Energy $martSM Products Program Market Characterization and Assessment Evaluation; February, 2012
5-21

The clothes washer ENERGY STAR price premium is $335 using the simple comparison of average
prices and $134 when employing the multivariate regression model (statistically significant at the 10%
level), resulting in percentage price premiums of 63% and 25%, respectively. Looking at this data in
Figure 5-20 from 2004-2011, the model price percentage difference shows a drastic decrease with the
2004 and 2005 ENERGY STAR percentage price premium data of 83% now being reduced to 25% in
2011.
For televisions (TVs), the ENERGY STAR price premium percentage is 36% using the simple
comparison of averages approach and 21% when utilizing the multivariate regression method (statistically
significant at the 10% level).
Anecdotally, interviews with corporate retailers revealed that incremental cost has increased somewhat,
but mostly as a result of technology leapfrogging ahead, especially offering additional high-end features
accompanying the ENERGY STAR label. This is particularly evident for refrigerator models as shown
below in Figure 5-18.
The remaining appliances (room air conditioners, through-the-wall air conditioners, freezers) lack a
sufficient number of observations from the Lockheed Martin dataset to utilize the multivariate regression
approach and are therefore not included in the following group of figures that show historical incremental
price changes. Room air conditioners and through-the-wall air conditioners are combined so consistency
is maintained with the prior report’s categorization. Table 5-5 reveals a significant decrease in the simple
comparison of average price premium percentages with a 20 percentage point decrease (16% to -4%)
from 2009-2011. Freezers show a 21 percentage point increase (33% to 54%) from 2009-2011.
5-22

Table 5-5: Incremental Cost Comparison between ENERGY STAR and Non-ENERGY STAR Products – Nominal 2011 Dollars
Source: 2011 Lockheed Martin In-Store Survey of Participating Retailers and MCAP team calculations
Refrigerato
rs Freezers Clothes Washers Dishwashers
Room ACs
TTW ACs TVs
# of observations
428 124 410 279 62 12 151
Mean ES Price ($)
$1,459 $665 $871 $584 $378 $726 $847
Mean Non-ES Price ($)
$787 $433 $536 $712 $718 $699 $624
Simple Price Comparison Analysis
Mean Difference (ES - Non-ES, $)
$672 $232 $335 ($128) ($340) $27 $223
Mean % Difference ([ES - Non-ES]/Non-ES)
85% 54% 63% -18% -47% 4% 36%
Multivariate Regression Analysis
ES Coefficient ($)
$87* No set of covariates
provided in initial
data. Model not possible.
$134* $36 No set of covariates
provided in initial
data. Model not possible.
No set of covariate
s provided in initial
data. Model
not possible.
$131*
ES Coefficient (%)
11%* 25%* 5% 21%*
List of Covariates
size*, adjustable shelves*,
side-by-side*, ice maker,
electric temperature
control*, stainless
steel finish*, changeable
color panel*, warranty
size (capacity)*
, number of cycles*, top load*,
delayed start,
number of temp.
settings*, warranty*,
special finish*
number of wash levels,
number of cycles*,
number of racks*, energy
saving setting*, hot start, delay
start, tower-less, stainless
steel*, changeable
color panel*, dial
screen size*,
resolution, screen type*, DVD
player*, 3DTV*, HDTV
Adjusted R2 0.82 NA 0.69 0.29 NA NA 0.91
Note: * statistically significant at the 10% level
5-23

Figure 5-18: Price Difference between ENERGY STAR and Non-ENERGY STAR Refrigerators (2004-2011)
Source: 2011 Lockheed Martin In-Store Survey of Participating Retailers and MCAP team calculations
Figure 5-19: Price Difference between ENERGY STAR and Non-ENERGY STAR Dishwashers (2004-2011)
Source: 2011 Lockheed Martin In-Store Survey of Participating Retailers and MCAP team calculations
0% 10% 20% 30% 40% 50% 60% 70% 80% 90%
2004 2005 2006 2007 2008 2009 2010 2011
ES v
s. N
on-E
S %
Pric
e Pr
emiu
m
Year
Simple Average Price Difference Model Price Difference
-30% -20% -10%
0% 10% 20% 30% 40% 50% 60%
2004 2005 2006 2007 2008 2009 2010 2011
ES v
s. N
on-E
S %
Pric
e Pr
emiu
m
Year
Simple Average Price Difference Model Price Difference
Simple vs. Model average
5-24

Figure 5-20: Price Difference between ENERGY STAR and Non-ENERGY STAR Clothes Washers (2004-2011)
Source: 2011 Lockheed Martin In-Store Survey of Participating Retailers and MCAP team calculations
As seen in Table 5-6, most retailers (44%) mark up their products by a pre-determined percentage,
followed by pricing decided by the corporate office (19%), and priced to compete with other retailers
(18%). Specific responses to “Other” were that pricing is based on customer needs, and that pricing was
based on whether the customer was residential or commercial.
Table 5-6: Retailer Self-reported Method of Determining Product Price
Source: MCAP 2013 Partner Retailer Storefront Survey
Method of Determining Price NYSERDA n=65
Marked up by a percentage 44% Manufacturer pricing 6% Priced to compete with other retailers 18% Corporate office decides 19% Keystone pricing (double the wholesale price) 0% Other 10% Don't know 2% Refused 2%
0%
20%
40%
60%
80%
100%
120%
2004 2005 2006 2007 2008 2009 2010 2011
ES v
s. N
on-E
S %
Pric
e Pr
emiu
m
Year
Simple Average Price Difference Model Price Difference
5-25

NYSERDA partner retailers were asked if the ENERGY STAR certified products in their stores were
priced higher, lower, or about the same as similar, non-ENERGY STAR products. The results are shown
in Figure 5-21, and corroborate the analysis of the simple average price differences (which do not control
for “bundling” of ENERGY STAR with premium features): in general, all ENERGY STAR certified
appliances are priced higher than their non-ENERGY STAR counterparts. Dishwashers had the highest
percentage reported for ENERGY STAR and non-ENERGY STAR being equally priced (40%), and even
had one record of a respondent reporting ENERGY STAR certified dishwashers as cheaper than non-
ENERGY STAR models. Longitudinally, these results are overall similar to the prior evaluation findings,
with the percentages assigned to equal pricing between ENERGY STAR and non-ENERGY STAR being
slightly higher here, in the five to 10 percentage point range.
Figure 5-21: Percent of Retailers that Price ENERGY STAR Products Higher, Lower, or the Same as Non-ENERGY STAR Products
Source: MCAP 2013 Partner Retailer Storefront Survey
0%
20%
40%
60%
80%
100%
Refrigerator (n=63)
Clothes Washer (n=65)
Dishwasher (n=63) Room AC (n=59)
Priced about the same ENERGY STAR priced lower
ENERGY STAR priced higher
5-26

5.6 Advanced power strips
Beginning in 2010, the NYPP began supporting Advanced Power Strips (APS) as an additional measure
in the program. To assess the adoption and success of APS in the NYPP, the Evaluation Team asked a
series of questions pertaining to APS in both the residential end-use customer telephone survey and the
participating retailer survey. The results of these survey efforts are presented below.39, 40
As seen in Table 5-7, just over half (51%) of advanced power strip purchasers in the NYSERDA area
were specifically seeking an advanced power strip, with 38% of advanced power strip purchasers initially
seeking a traditional power strip. The percentage of buyers originally in the advanced power strip market
was higher in the comparison area at 64% (statistically significant at the 10% level), which could imply a
greater understanding of the advanced power strip market in the in the comparison area population.
Table 5-7: Originally in Market to Purchase Advanced Power Strip or Traditional Power Strip
Source: MCAP 2013 Residential End-Use Customer Telephone Survey
Original Product Sought NYSERDA (n=62) Comparison Area (n=51)
Advanced Power Strip 51% 64% Traditional Power Strip 38% 22% Other 6% 10% Don't know 5% 4%
Advanced power strip purchasers in both the NYSERDA area and the comparison area identified
televisions, computers, and printers as the most frequently combined electronics purchased with advanced
power strips (Table 5-8). The percentages associated with each electronic are relatively consistent
between the NYSERDA area and the comparison area for all electronics, except for DVD players and
DVRs, but all products, likely due to a very small sample size for DVD players and DVRs, were not
statistically different between the two areas. NYSERDA area respondents reported DVD players at 35%,
while comparison area respondents reported 17%. For DVRs, the trend is reversed, with 26% of
comparison area respondents and 17% of NYSERDA area respondents noting the electronic.
39 The same weighting procedure discussed and used for appliances is applied to the advanced power strips. 40 Please note that Advanced Power Strip (APS) findings are also discussed throughout the report in conjunction with the appliance findings where
appropriate.
5-27

Table 5-8: Electronics Purchased in Conjunction with the Advanced Power Strip
Source: MCAP 2013 Residential End-Use Customer Telephone Survey. Percentages may add to over 100%, as multiple responses were allowed.
Electronic NYSERDA (n=52) Comparison Area
(n=51)
TV 52% 49% Computer 60% 59% Computer Monitor 31% 31% Printer 35% 37% Scanner 22% 26% DVD Player 32% 17% DVR 17% 26% Audio Devices 17% 16% Gaming Console 16% 12% Other 21% 15% Don't Know 2% 7%
Figure 5-22 summarizes the responses provided for why the advance power strip was purchased. Energy
efficiency was the most common response for NYSERDA area respondents at 23% and the second most
common for comparison area respondents at 30%. Protection of electronics was the most cited reason for
purchase among comparison area respondents at 35%, 12% in the NYSERDA area (the only statistically
significant difference at the 10% level). While the survey provided a definition of an advanced power
strip, the possibility remains that some respondents confused an advanced power strip with a surge
protector, giving rise to this high response rate for protection of electronics.41 Respondents in neither the
NYSERDA area nor the comparison area associated the advanced power strip with increased product
quality (2% and 1%, respectively).
41 Definition: Advanced Power Strips, also known as “smart” power strips, are different from regular power strips. Advanced Power Strips include energy-saving capabilities for the connected products. When a primary device that is plugged into the Advanced Power Strip is in the off mode, the Advanced Power Strip shuts power off to all of the associated devices.
5-28

Figure 5-22: Reason for Advanced Power Strip Purchase
Source: MCAP 2013 Residential End-Use Customer Telephone Survey. Percentages may add to over 100%, as multiple responses were allowed.
As seen in Figure 5-23, only 9% of partner retailer storefronts surveyed stated that their store currently
carried advanced power strips. A relatively high 8% of respondents were unsure whether their store
carried advanced power strips, suggesting an overall lack of knowledge about the advanced power strip
product. From the consumer survey in both the NYSERDA and comparison area, Best Buy was the most
common response (18%) for where consumers purchased advanced power strips, followed by PC Richard
for NYSERDA respondents (14%).
0% 5% 10% 15% 20% 25% 30% 35% 40%
Energy Efficiency Special Features
Protection of Electronics Better Overall Construction
Have Multiple Outlets Other Price
Recommended Don't Know
Style/Apperance Quality
NYSERDA (n=62) Comparison Area (n=51)
5-29

Figure 5-23: Availability of Advanced Power Strips in Partner Retailer Storefronts
Source: MCAP 2013 Partner Retailer Storefront Survey (n=71)
9%
83%
8%
Carries APS Doesn't Carry APS Don't Know
5.7 Pool Pumps
Beginning in 2010, the NYPP added high-efficiency pool pumps (two or multi-speed) as a program
measure.42 Despite the addition in 2010, the NYPP has struggled to gain traction and sign up participants,
with only two pool pump retailers joining the program in late 2013 (one of the two was reached in the
survey). The pool pump retailer and manufacturer survey asked details not only about the current state of
the high-efficiency pool pump market, but also questions pertaining to how NYSERDA could better
engage with pool pump market actors to increase NYPP awareness and utilization.
Program Awareness and Opportunity
The evaluation team interviewed 20 pool pump manufacturers, retailers and pool construction/renovation
companies between October and December 2013 to better understand the current pool pump market
within the NYSERDA region. As seen in Figure 5-24, the vast majority of survey respondents (17 of 20)
were pool pump retailers in the NYSERDA region.
42 The ENERGY STAR specification for pool pumps first became effective on February 15, 2013.
5-30
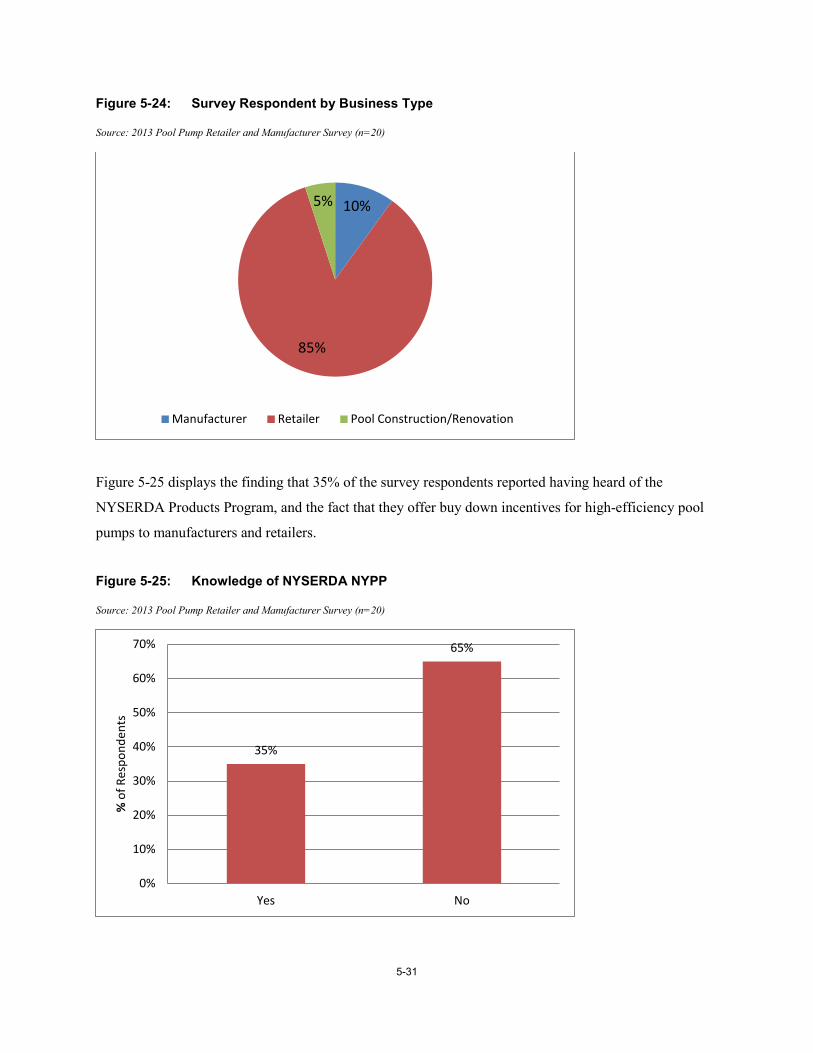
Figure 5-24: Survey Respondent by Business Type
Source: 2013 Pool Pump Retailer and Manufacturer Survey (n=20)
Figure 5-25 displays the finding that 35% of the survey respondents reported having heard of the
NYSERDA Products Program, and the fact that they offer buy down incentives for high-efficiency pool
pumps to manufacturers and retailers.
Figure 5-25: Knowledge of NYSERDA NYPP
Source: 2013 Pool Pump Retailer and Manufacturer Survey (n=20)
10%
85%
5%
Manufacturer Retailer Pool Construction/Renovation
35%
65%
0%
10%
20%
30%
40%
50%
60%
70%
Yes No
% o
f Res
pond
ents
5-31

Of the seven respondents that reported having knowledge of the program, only one indicated that they
were currently participating in the program. This retailer stated that they had been a program participant
for two months, during which time they sold one high-efficiency pool pump that they directly attributed
to the program. The retailer anticipates this number to increase as their participation to date has occurred
outside of the outdoor pool season.
The remaining six respondents that were aware of the NYPP were asked why they had not participated in
the program, and the reasons for lack of participation varied. One respondent stated that the program
requirements were unnecessarily difficult compared to similar programs in other states, one was uncertain
whether the NYSERDA NYPP was available in their area (Rochester), two felt that there was not
sufficient demand for high-efficiency pool pumps in their sales territory to justify participating in the
program and two indicated that they would look into the program more closely and consider participating.
Additional reasons stated for not participating in the program included the requirement to provide
quarterly sales data and the concern that an upstream discount approach would be ineffective at
incentivizing customers to purchase a high-efficiency pool pump.
Fifty percent of the survey respondents mentioned that NYSERDA could take steps to educate both the
public and pool pump manufacturers/retailers about the NYPP buydown program. These
recommendations included reaching out to company headquarters, industry associations, pool pump
distributors, holding educational classes and informational sessions about high-efficiency pool pumps,
and placing educational material in utility bills. Three survey respondents (15%) noted that having the
financial incentive exist as a direct customer rebate, as opposed to a buy down, would be beneficial in
increasing high-efficiency pool pump sales. Another 15% reported having no interest in the NYPP due to
a lack of consumer demand for high-efficiency pool pumps.
5-32

Market Barriers and Drivers
The general consensus among the survey respondents was that pool pump consumers are not well
informed about high-efficiency pool pump options, with 60% of survey respondents reporting consumers
were aware of high-efficiency pool pumps, and only 10% of respondent s feeling consumers had a high
level of understanding about high-efficiency pool pumps. A similar trend is observed when asking about
the knowledge of ENERGY STAR pool pumps, but with an additional 30% of respondents reporting that
the consumer had no knowledge of the product. ENERGY STAR certified pool pumps are a sub-category
of high-efficiency pool pumps, with the ENERGY STAR specification for pool pumps taking effect in
February 2013.43 These findings are summarized in Figure 5-26.
Figure 5-26: Retailer and Manufacturer Reported Consumer Knowledge of High-efficiency and ENERGY STAR Pool Pumps
Source: 2013 Pool Pump Retailer and Manufacturer Survey (n=20)
43 Many, if not most, energy efficiency programs consider the ENERGY STAR specification for pool pumps too lenient to serve as the eligibility criterion, instead requiring two or multi-speed pool pumps.
0%
10%
20%
30%
40%
50%
60%
70%
80%
Yes Limited Knowledge
No Don't Know
% o
f Res
pond
ents
High Efficiency Pool Pump ENERGY STAR Pool Pump
5-33

When asked about the primary market barriers to the purchase of high-efficiency pool pumps, 65% of
survey respondents mentioned the cost or price and 35% noted a lack of information surrounding high-
efficiency pool pumps.44 Additional reasons included unaware of current spending associated with the
pool pump (5%), the short pool season in New York (10%), satisfied with current pool pump (10%) and
concerns regarding installation and compatibility with the overall pool system (15%). These results are
displayed in Figure 5-27.
Figure 5-27: Retailer and Manufacturer Reported Primary Market Barriers to Consumer the Purchases of High-efficiency Pool Pumps
Source: 2013 Pool Pump Retailer and Manufacturer Survey (n=19). Percentages may add to over 100%, as multiple responses were allowed.
0% 10% 20% 30% 40% 50% 60% 70%
Cost/Price
Lack of information
Unaware of current spending
Short season length
Satisfied with current pool pump
Installation/Compatability concerns
% of Respondents
The majority of survey respondents (70%) identified cost savings as a key reason for consumers to
purchase high-efficiency pool pumps. Interestingly, this was the only answer provided by more than two
survey respondents, suggesting that the vast majority of respondents are not fully aware of the additional
benefits high-efficiency pool pumps can provide. Such benefits mentioned include longer life of the
pump, overall ease of operation, a quieter motor, reduced length of daily run time, improved pool system
(water quality, chemical distribution, water heat distribution), and having a positive impact on the
environment. Figure 5-28 summarizes these findings.
44 Multiple responses allowed.
5-34

Figure 5-28: Retailer and Manufacturer Reported Key Reasons Consumers Purchase High-efficiency Pool Pumps
Source: 2013 Pool Pump Retailer and Manufacturer Survey (n=17). Percentages may add to over 100%, as multiple responses were allowed.
With respect to the promotion of high-efficiency and ENERGY STAR pool pumps, 42% of survey
respondents reported actively promoting them, with an additional 21% noting a limited level of
promotion. Figure 5-29 displays these results.
Figure 5-29: Promotion of High-efficiency and ENERGY STAR Pool Pumps
Source: 2013 Pool Pump Retailer and Manufacturer Survey (n=19)
0% 10% 20% 30% 40% 50% 60% 70% 80%
Cost savings
Increased lifetime of pump
Overall ease of operation
Quieter motor
Reduced length of daily run time
Positive environmental impact
Improved pool system
No reason
% of Respondents
0%
5%
10%
15%
20%
25%
30%
35%
40%
45%
Yes Limited Promotion No
% o
f Res
pond
ents
5-35

Sales and Market Share
Table 5-9 shows the estimated breakdown of two-speed, variable speed, high-efficiency single speed and
standard pool pumps. The most pronounced finding is that standard pool pumps account for 74% of all
pool pump sales among the 20 survey respondents. Furthermore, 11 of the 20 survey respondents reported
that standard pool pump sales comprised 90% or greater of their total pool pump sales. Variable speed
pool pump sales were the next highest (11%), followed by two-speed (10%) and then high-efficiency
single speed (6%).
Table 5-9: Sales and Market Share, by Pool Pump Type
Source: 2013 Pool Pump Retailer and Manufacturer Survey (n=20)
Pool Pump Type Mean Min Max
Two Speed 10% 0% 50%
Variable Speed 11% 0% 100%
High-efficiency Single Speed 6% 0% 90%
Standard 74% 0% 100% *Note: Total for mean may be greater than 100% due to rounding.
Forty percent of the survey respondents felt that the percentage of high-efficiency pool pump sales would
increase for the remainder of 2013, with an additional 10% indicating that the percentage of high-
efficiency pool pump sales would increase in years beyond 2013. These respondents mentioned increased
awareness, decrease in prices, societal factors (i.e. “Going green”), increase in special orders and
expansion into above ground pools as reasons for the increase. The remaining 50% of respondents were
equally split between “No change” and “Don’t know”, as seen in Figure 5-30.
5-36

Figure 5-30: Expected High-efficiency Pool Pump Sales and Market Changes
Source: 2013 Pool Pump Retailer and Manufacturer Survey (n=20)
Conclusion and Recommendations:
While current participation in the NYPP for pool pumps remains low (two pool pump retailers enrolled),
the majority of responses provided through the survey indicate that there is a genuine interest to
participate in the program and work alongside NYSERDA to promote high-efficiency pool pumps. The
primary limitation to the pool pump measure in the NYPP to date has been a general lack of awareness by
both pool pump retailers and manufacturers, with only 35% of respondents aware of the NYPP.
Compounding this issue is the common perception of many pool pump market actors that consumer
demand for high-efficiency pool pumps is low and may not warrant promoting or stocking high-efficiency
pool pumps.
To overcome these barriers, NYSERDA should make a concerted effort to educate both the public and
pool pump manufacturers/retailers about the NYPP pool pump program. For the public, this could entail
general awareness campaigns and placing educational material in utility bills. For the pool pump market
actors, viable options include reaching out to pool pump company headquarters, engaging industry
associations, speaking with pool pump distributors, and holding educational classes and informational
0%
5%
10%
15%
20%
25%
30%
35%
40%
45%
Increase Increase in years beyond 2013
No change Don't know
% o
f Res
pond
ents
5-37

sessions about high-efficiency pool pumps. It is imperative to focus on both the consumers and the pool
pump market actors simultaneously, as supply and demand of high-efficiency pool pumps need to
increase for the NYPP to truly gain traction. Additionally, NYSERDA should consider incentives to buy
down the incremental cost associated with a high-efficiency pool pump compared to a regular pool pump,
as this was a common theme throughout the surveys.
5-38

6 Attribution and Program Savings As in prior years, estimating the impacts due to market transformation programs is an inherently difficult
task, particularly for the NYPP, which does not offer direct incentives to end-use customers. In fact, the
program may be invisible to end-use customers, in that many customers may not even be aware that the
program exists. In order to estimate impacts from the NYPP, the Evaluation Team first attempted to use a
market-based approach to estimating program energy and demand savings. At a high level, the market-lift
approach sought to estimate the overall penetration of sales of ENERGY STAR® appliances in the
NYSERDA region and compare the sales with a group of regions that serves as the control group. The
comparison regions are defined as those regions that lack the support of both utility-and program
administrator-sponsored programs.
6.1 Methodology
Step 1: Estimate NYSERDA region ENERGY STAR Market Share
This first step in the attribution analysis is to estimate the weighted average ENERGY STAR market
share for the NYSERDA region. Leveraging both primary and secondary data collection, the weighted
average ENERGY STAR market share analysis relies on the most accurately reported data for each of the
retail channels. This task is well documented in the ENERGY STAR market share discussion of the
market assessment section previously detailed in this report (see Sections 4.3.1 and 4.3.2 above).
Step 2: Estimate Baseline Sales of ENERGY STAR Units based on Comparison Area Data
For this step, the Evaluation Team relied on the consumer surveys and D&R sales data in the comparison
areas: the weighted average ENERGY STAR market share for the comparison areas is then assumed to be
the baseline market share of ENERGY STAR products that would have occurred in New York in absence
of the NYPP. For this approach, the existing market lift is assumed to be across all retail channels (both
partner and non-partner alike) and the comparison areas did not have any direct DSM program activity in
these areas nor suspected impact of nearby DSM activity. The Team was unable to do cross-sectional,
time-series analysis due to the introduction of new appliance programs in previous comparison regions
(though two of the three regions did remain the same for this analysis). The comparison areas selected
were Washington, D.C. and Houston, TX (to represent downstate NY) and Virginia (to represent upstate
NY). For a more detailed discussion regarding the comparison area development and selection please see
Appendices C and D. Finally, the Team verified that there were no direct DSM program activity in these
areas and no suspected impact of nearby DSM activity.
6-1

There are two known limitations to this comparison area approach. First, the approach does not account
for other factors that may influence market share, including energy prices, climate zone, population center
distribution (urban/suburban/rural), precipitation/drought, etc., all of which can be significant predictors
of ENERGY STAR market share. Second, the baseline comparison approach assumes a non-program area
that is the theoretical equivalent to New York in the absence of program activity, and does not account for
the possibility that the efforts in New York and other states with ENERGY STAR programs have
collectively influenced the sales in the comparison states.
While this impact cannot be accurately quantified (there is no way to “undo” the significant program
activity that has occurred in New York and elsewhere), it means estimated baseline sales for all states –
including the comparison states – may be overstated. In other words, sales outside New York – and
estimated baseline sales – may have been lower in absence of the NYPP (i.e., estimates of program
impacts inside New York may be conservative).
To assess the issue regarding the potential influence of the NYPP in the comparison states, the Evaluation
Team conducted interviews with national retailers, members of the Department of Energy (DOE),
Environmental Protection Agency (EPA, specifically ENERGY STAR department), and the Appliance
Standards Awareness Project (ASAP). In all of the interviews and discussions regarding influence of the
NYPP, not a single respondent indicated that the program would have had an effect on markets outside of
New York. Though they do believe that collectively, NYSERDA coupled with all other state and utility
sponsored programs, have had a national impact on the ENERGY STAR market.
While the Evaluation Team acknowledges that this finding would lead to conservative estimates of
savings using the comparison area approach, there is also no known alternative method – other than self-
reported counterfactual estimates of Program influence – to estimate the true market level impacts of the
NYPP.
Another confounding factor during this time period was the availability of ARRA rebates. Most State
Energy Efficient Appliance Rebate Program (SEEARP) rebates occurred in 2010, and thus influenced the
total sales in New York and any other regions that offered them (including all of the three regions
comprising the comparison area). The Evaluation Team reviewed these effects by examining ARRA
rebates within the NYSERDA and comparison areas. The Evaluation Team, in collaboration with D&R,
was able to access all SEEARP rebate data from 2009-2011. All appliance sales were normalized to the
6-2

region’s household populations (excluding Nassau and Suffolk counties for NY and including only metro
area counties for Houston). A summary of the household normalized SEEARP rebate data (number of
rebates appliances per household), including the average dollar rebates paid for each appliance, is
included in Table 6-1 below.
The NYSERDA region had a considerably higher number of SEEARP rebates per household at a
considerably lower dollar per rebate amount for refrigerators and clothes washers during the 2010-2011
period. Though difficult to draw concrete conclusions from this data alone, it does seem to support the
notion that the comparison regions did not experience greater ARRA exposure or influence relative to the
NYSERDA region (if any conclusion could be drawn it, would be that the NYSERDA region saw greater
ARRA appliance rebates).
Table 6-1: Review of 2010-2011 ARRA SEEARP Rebates per Household in NYSERDA and Comparison Areas
Source: EE0001581_SEEARP_NY_Final_Rebate_Report_2012-11-02.xlsx provided by D&R International
Appliance Refrigerator Clothes Washer Dishwasher Room AC Freezer
Region Per HH Avg $ Per HH Avg $ Per HH Avg $ Per HH Avg $ Per HH Avg $
NYSERDA 1.14% $79 1.10% $79 0.03% $100 N/A N/A 0.06% $50
DC 0.18% $192 0.22% $248 0.16% $137 N/A N/A N/A N/A
Houston MSA 0.22% $211 0.16% $132 0.20% $104 0.00% $44 0.03% $148
VA 0.39% $62 0.45% $78 0.12% $56 0.01% $40 N/A N/A
The Evaluation Team analyzed the results of the comparison area consumer survey coupled with the
comparison area National partner ENERGY STAR sales (from D&R International) and ran the same
market share analysis used for the NYSERDA region to serve as the baseline sales (results are included in
Table 4-8). The primary difference between the NYSERDA region and comparison area consumer survey
results was that the comparison area only had two retail channels – National ENERGY STAR Partner and
non-partners (see Table 4-8 for details). The retail channels were identified and assigned using the same
National partner database provided by the EPA ENERGY STAR website.
6-3

Though there were additional steps undertaken for the market-lift approach in prior studies (collecting and
compiling total shipments of appliances to New York using AHAM data, and netting out other
NYSERDA program tracking sales data of appliances), at this point of the analysis it became evident that
the market-lift signals were not appearing. In fact, the evidence collected to this point all showed a lack of
market lift in the NYSERDA region. An overview of the ENERGY STAR market penetration for the
analyzed appliances is shown below in Figure 6-1. As can be seen in this figure, the only appliance that
showed potential for market lift was Room ACs, otherwise all other appliances showed equal or greater
ENERGY STAR market penetration in the comparison area.
Figure 6-1: ENERGY STAR Market Penetration of High Impact Measure Appliances in NYSERDA vs. Comparison Area
Source: NYSERDA and comparison area end-use consumer surveys, D&R International, NYSERDA program tracking database
Step 3: Verify Lack of Overall Market Lift Using Alternative Sources
The Evaluation Team explored additional perspectives and data sources used to verify the lack of market
lift in the NYSERDA region, and in particular used the following approaches (a more detailed discussion
of each of these approaches is included below the bullet points):
• Logit model based on consumer survey data– estimates the probability of choosing ENERGY STAR models in NY versus comparison areas – controls for home ownership, head of household age, and head of household education
• Review of D&R data only (all National partner sales and National partner sales data from exact same group of retail partners)
• Review of NYSERDA and comparison area consumer survey results alone
55% 61%
74%
48%
61% 66%
74%
53%
0% 10% 20% 30% 40% 50% 60% 70% 80% 90%
100%
Refrigerator Clothes Washer Dishwasher Room Air Conditioner
ES M
arke
t Pen
etra
tion
NYSERDA Comparison
6-4

The Logit Model analysis showed:
• No results with statistical significance and • No greater likelihood of ENERGY STAR appliance purchase in NYSERDA Area versus
Comparison Area
The logit model (logistic regression model) is the preferred regression form for a binary dependent
variable, in this case whether the purchased appliance was ENERGY STAR (Yes/No). The NYSERDA
area and comparison area residential end-use consumer telephone survey results were combined for the
logit model analysis. A dummy variable for the NYSERDA area was created in the dataset to identify
NYSERDA area respondents. Using the data collected in the consumer survey, the logit model controls
for Upstate/Downstate, head of household age, head of household education, home ownership, and
common yearly trends (2010, 2011, and 2012) across all respondents. The logit model specification is as
follows:
𝐥𝐧( 𝑷𝒊𝟏−𝑷𝒊
)𝒕
= 𝜶𝒕 + 𝜷𝟎𝑵𝒀𝑺𝑬𝑹𝑫𝑨 + 𝜷𝑿𝒕 + 𝜺𝒕
where 𝐥𝐧( 𝑷𝒊𝟏−𝑷𝒊
)𝒕 is the natural log of the probability (pi) of a person purchasing an ENERGY
STAR appliance at time t
α represents the inclusion of dummy variables for each year (2010-2012) to control for common
time trends across all respondents
NYSERDA represents a dummy variable for NYSERDA area respondents
X t is a set of observable respondent characteristics: Upstate/Downstate, head of household age,
head of household education, homeownership
Figure 6-2 provides a graphical summary of the logit model findings. It is imperative to note that the
results obtained from the logit model were not statistically significant at the 10% level. That said,
refrigerator purchasers in the NYSERDA area are 4.9% less likely to purchase an ENERGY STAR model
compared to comparison area purchasers, holding constant Upstate/Downstate, head of household age,
head of household education, homeownership and year of purchase. A similar value is observed for
clothes washers, with NYSERDA area purchasers 9.3% less likely to purchase an ENERGY STAR
model. Conversely, NYSERDA area dishwasher purchasers are 14.7% more likely to purchase an
ENERGY STAR model than comparison area purchasers, holding constant the control variables.
6-5

Figure 6-2: Results of the Consumer Survey Logit Model
Source: NYSERDA and comparison area end-use consumer surveys
Review of D&R Data:
As the secondary verification method, the Team reviewed actual National partner sales data compiled by
D&R for the NYSERDA and comparison areas. The Team analyzed sales across all retailers and then
again for retailers that were common across the regions (only a select few retailers operate storefronts in
all regions). Figure 6-3 below shows the relative market penetration of ENERGY STAR products
between NYSERDA and comparison region for all retailers that report sales data to D&R, while Figure
6-4 shows a similar analysis between the same exact group of retailers that operate in both the
NYSERDA and comparison regions. Not one appliance shows higher ENERGY STAR penetration in
NYSERDA areas relative to the weighted composite value across the comparison areas for all retailers,
though when comparing the same exact group of retailers in the two regions we do see slightly higher
ENERGY STAR penetration of dishwashers and Room ACs in NYSERDA regions.
-4.9%
-9.3%
14.7%
-15.0%
-10.0%
-5.0%
0.0%
5.0%
10.0%
15.0%
20.0%
Prob
abili
ty o
f App
lianc
e Pu
rcha
se in
N
YSER
DA R
egio
n vs
. Com
paris
on A
rea
Refrigerator Clothes Washer Dishwasher
6-6

Figure 6-3: ENERGY STAR Market Penetration of Appliances in NYSERDA vs. Comparison Area based on D&R All Retailer Sales
Source: D&R International
60% 66%
76%
61% 63% 69%
79%
56%
0% 10% 20% 30% 40% 50% 60% 70% 80% 90%
100%
Refrigerator Clothes Washer Dishwasher Room Air Conditioner
ES M
arke
t Pen
etra
tion
%
NYSERDA Comparison
Figure 6-4: ENERGY STAR Market Penetration of Appliances in NYSERDA vs. Comparison Area based on D&R Same Group of Retailer Sales
Source: D&R International
71% 71%
82% 73%
63%
75%
88%
66%
0% 10% 20% 30% 40% 50% 60% 70% 80% 90%
100%
Refrigerator Clothes Washer Dishwasher Room Air Conditioner
ES M
arke
t Pen
etra
tion
%
NYSERDA Comparison
6-7

Review of Consumer Survey Data:
As a final check for verifying the lack of overall market lift in the NYSERDA region, the Team reviewed
the ENERGY STAR penetration based solely on the results of the NYSERD and comparison area
consumer surveys (administered for both NYSERDA and comparison areas). The consumer surveys did
not show consistent results with those of the other data sources. Figure 6-5 shows the ENERGY STAR
penetration between NYSERDA and the comparison region based solely on the consumer survey. It
should be noted here that the consumer survey results show a significantly lower ENERGY STAR
penetration relative to the D&R and NYSERDA tracking data. The underlying reasons for this lower
penetration are most likely due to incorrect model numbers (participants mistaking other product
information like serial number for model number), and a large share of the participants not being able to
provide a model number, which lowered the overall count of available models with which to lookup.
Once again, a clear picture of market lift does not appear, with clothes washers showing slight lift and
Room ACs showing significant lift (though caution should be made with these results especially since
Room ACs had the lowest survey success rate and in particular had very low successful make and model
procurement from participants).
Figure 6-5: ENERGY STAR Market Penetration of Appliances in NYSERDA versus. Comparison Area based on Consumer Survey
Source: NYSERDA and Comparison Area End-Use Consumer Surveys with NYSERDA tracking supplemental
48% 49% 42%
64% 54%
43% 50%
15%
0% 10% 20% 30% 40% 50% 60% 70% 80% 90%
100%
Refrigerators Clothes Washers Dishwashers Room ACs
ES M
arke
t Pen
etra
tion
%
NY Comparison
6-8

After the review of all of the above three perspectives and data sources and analysis, the Team reviewed
notes taken from some of the primary survey data collected to assess whether market actors agreed with
the sentiment that there was no market lift. The following are some additional supporting evidence from
the interviews with the various market actors.
• Both manufacturers interviewed stated that without support of the NYPP their sales would have been the same in NYSERDA region for all of their product offerings.
• Furthermore, interviews with corporate retailer (N=1) indicated that without NYPP support potential loss of ENERGY STAR sales would be at maximum of 5%.
• Interviews with the EPA, DOE, and ASAP all confirmed that historically the NYSERDA program has been at the forefront of program design, however, the overall market for ENERGY STAR is now very mature. As one member stated, the NYPP “has been an unwilling victim of its own success.”
• Finally, according to the results of the 2012 CEE survey, most respondents who received rebates for their purchases, both nationally and in NYSERDA territory, said they likely would have bought the ENERGY STAR product without a rebate. This indicates very high free-ridership for most product rebates.
Step 4: Research Attribution Using Participating Storefront Retailer Self-Report
As noted in the bullets above, a review of the corporate survey interviews showed that they indeed
believed an overall market lift attributable to the NYPP is approximately 5%. This finding is in line with
the previous evaluation report, which reported a composite market-lift value across all corporate entities
of slightly more than 4%. The only other resource to research market lift available to the Team was the
participating storefront surveys. The Participating storefront retailers were asked about the influence of
the NYPP on their own sales (i.e., a self-reported market-lift value), and the results of this assessment did
in fact show some attribution for program impacts. This same approach was recently used to help
determine the market lift associated with the lighting POS program in NYSERDA.45
Accounting for market lift across all channels, as was done in the baseline analysis included in this report,
potentially masks lift occurring in NYSERDA regional retailers. Therefore, the team chose to investigate
NYSERDA-only partners and NYSERDA and National partners lift (exclusive of non-partner and
National-only partners). To identify the retail partners associated with each group, the Team leveraged the
consumer survey results, which were used to assign retail partner status based on the store name
associated with each appliance purchase. The results of the consumer survey were then trued up to the
45 NMR Group, Inc. and Apex Analytics LLC: Draft Market Effects, Market Assessment, Process and Impact Evaluation of the NYSERDA Statewide Residential Point-of-Sale Lighting Program: 2010-2012; December, 2013.
6-9

Lockheed Martin sales data, since Lockheed was able to differentiate sales between NYSERDA-only
retailers and NYSERDA & National partner retailers. The NYSERDA partner market share attributable to
each partner status is shown below in Table 6-2. Please note that this table below represents the market
share between partner statuses within NYSERDA partners sales only and does not include non-partner
and National partner only sales.
Table 6-2: NYSERDA Partners Retail Channel Market Share (% of sales by partner status for NYSERDA partners only)
Source: NYSERDA program tracking database
Appliance
NY-Partner Only Market
Share
NY & National Partner Market
Share
Refrigerator 49% 51%
Clothes Washer 40% 60%
Dishwasher 47% 53%
Room AC 21% 79%
Use of this self-reported, counterfactual, is a bottom up rather than top down approach to estimating
market lift. The self-report approach is based on the partner storefront survey (N=71) and corporate
survey self-report shift (N=1, supported by N=5 from previous 2012 Cadmus evaluation report). The next
step in this process was to estimate the percentage of ENERGY STAR appliance sales that are attributable
to the NYPP by speaking with NYSERDA partner and NYSERDA + National partner storefronts. The
specific question from the storefront survey used for the analysis is shown below:
“By what percentage do you estimate your store’s sales of ENERGY STAR [Corresponding Product]
would be lower if the NYPP ENERGY STAR promotional incentives for [Corresponding Product] were
not available?”
Results of the partner storefront retailer’s self-reported sales lift from the NYPP are included below in
Table 6-3. The results shown below reflect the same results derived from the previous evaluation report,
which showed approximately 19% market lift from the retailer storefront survey self-reported question.
6-10

Table 6-3: Partner Retailer Self-Reported Sales Boost from NYPP
Source: NYSERDA partner storefront surveys
Appliance % Sales Increase
Refrigerator(n=17) 20%
Clothes Washer(n=20) 20%
Dishwasher(n=11) 20%
Room AC(n=18) 26%
Summarizing the various sales lift analysis shows the following results:
• Baseline sales analysis using comparison region data – no lift • D&R data – no/minimal sales lift • Consumer survey logit model - no/minimal sales lift • Corporate retailers (representing National and NYSERDA partners) – minimal (5%) sales lift • Storefront (representing NYSERDA partners only) – approximately 20% sales lift
While these findings appear contrasting, it is likely that the first three approaches are not able to pick up
the market lift from program participants, since they represent approximately half of the total market
sales. In other words, there is likely modest market lift among only a smaller percentage of the market,
and examining a total sales based market lift approach is not able to detect the small shift in sales. The
Team, therefore, believes that applying the storefront self-reported sales lift to NYSERDA-only retailers
and the corporate self-reported sales lift to National and NYSERDA-partner retailers is the most
appropriate course of action. The corporate surveys showed a 5% lift, which was consistent with the
previous evaluation self-reported lift from corporate entities. Furthermore, the approximately 20% market
lift reported by NYSERDA-only partner retailers is almost identical to the same self-reported values as
compiled in the previous 2012 MCA evaluation report.
Step 5: Estimate Program Impacts
The Team ultimately used a bottom up approach to estimate program impacts, leveraging the most
accurate and applicable data available. The NYSEDA tracking database total partner sales serve as the
starting point, since NYSERDA has claimed these appliance unit totals as having been rebated through
the program via all partner retailers. Next, other NYSERDA and Federal program appliance rebates that
6-11

were run in parallel with the NYPP during the 2010-2012 timeframe should be netted out, or removed,
from the NYPP totals to avoid double counting. The parallel programs includes both NYSERDA Homes
Program appliance rebates (New Homes and Home Performance with ENERGY STAR) and the Federal
ARRA appliance programs as well.
As previously mentioned, New York offered, as part of the Federal ARRA appliance rebate programs, an
appliance swap-out (SEEARP rebates), Buy Green Save Green, and Storm Relief rebates. The
NYSERDA-only region SEEARP rebates were summed across all New York counties excluding Long
Island. The NYSERDA-only SEEARP totals were then reduced to account for the proportion of
NYSERDA-region appliance sales attributable to NYSERDA partners (relative to all retailers, including
non-partners). The NYSERDA-partner market share was derived from the Market Characterization
section (4.3.2) of this report. The NYSERDA-region specific ARRA rebated appliance counts were then
netted out from each appliance total. Appliances rebated through the NYSERDA Homes Programs (New
Homes and Home Performance with ENERGY STAR) were removed from the total partner sales as well.
The self-reported market lift, as compiled from the corporate and storefront surveys, is the final piece of
the attribution puzzle and is applied to the appropriate group of partner retailer sales. The 5% market lift,
as identified by the corporate survey, is applied to sales attributable to partner retailers that are both
National and NYSERDA retailers. The 20% market lift, as identified by the storefront survey, is applied
to sales attributable to NYSERDA-only partner retailers. The total net sales attributable to the NYPP are
then considered the net units credited to the program across these two groups of partner retailers.
The following tables represent the net high impact measure units credited to the NYPP based on applying
storefront market lift (~20%) to NYSERDA-only retailers and corporate retailer lift (5%) to
NYSERDA/National retailers. As can be seen in the following group of three tables, the resulting net
attribution ratio is approximately 10% for all measures.
Sources for Table 6-4, Table 6-5, and Table 6-6 labeled by column heading:
A Based on NYSERDA tracking database of partner sales. B Quarterly reports for the NYSERDA Homes Programs and ARRA rebate data provided by NYSERDA and D&R
International. C Based on NYSERDA tracking database of partners sales. D Based on NYSERDA self-report partner storefront retailer survey. E Based on NYSERDA self-report corporate retailer survey F Columns [(A – B) * C * D] + [(A – B) * (1-C) * E]. G Columns (F) / (A).
6-12

Table 6-4: 2010 Net Units Credited to the NYPP for High Impact Measures
Appliance
2010 ES Partner Sales
ARRA and Home
Program Rebates
NYSERDA Partner
Only Market Share
Market Lift (Storefront)
Market Lift (Corporate)
Net Units Credited to NYPP
Net Attributio
n Ratio
A B C D E F G
Refrigerator 155,127 26,250 49% 20% 5% 15,969 10%
Clothes Washer
140,314 28,779 40% 20% 5% 12,276 9%
Dishwasher 110,331 3,084 47% 20% 5% 12,952 12%
Room AC 119,148 7 21% 26% 5% 11,352 10%
Table 6-5: 2011 Net Units Credited to the NYPP for High Impact Measures
Appliance
2011 ES Partner Sales
ARRA and Home
Program Rebates
NYSERDA Partner
Only Market Share
Market Lift (Storefront)
Market Lift (Corporate)
Net Units Credited to
NYPP
Net Attribution
Ratio
A B C D E F G
Refrigerator
124,167 5,217 49% 20% 5% 14,739 12%
Clothes Washer
103,186 5,562 40% 20% 5% 10,745 10%
Dishwasher
77,927 1,693 47% 20% 5% 9,207 12%
Room AC 138,242 4 21% 26% 5% 13,171 10%
Table 6-6: 2012 Net Units Credited to the NYPP for High Impact Measures
Appliance 2012 ES
Partner Sales
ARRA and
Home Program Rebates
NYSERDA Partner Only
Market Share
Market Lift (Storefront)
Market Lift (Corporate)
Net Units Credited to
NYPP
Net Attribution
Ratio
A B C D E F G
Refrigerator 84,170 3,606 49% 20% 5% 9,982 12%
Clothes Washer
88,012 3,108 40% 20% 5% 9,345 11%
Dishwasher 64,486 1,918 47% 20% 5% 7,556 12%
Room AC 84,137 49 21% 26% 5% 8,012 10%
6-13

The net sales are multiplied by measure-level deemed savings values for energy (kWh) and demand (kW)
and MMBtu. Deemed savings (kWh, kW, and MMBtu) estimates were derived from files provided to the
Team from NYSERDA Deemed Savings Database revision 13 and the NYS Technical Manual (NYS
TM)46. The Team applied net attribution ratios from comparable high-impact measures to the non-high-
impact measures that were not part of the focus of this evaluation effort (for example, freezers were based
on refrigerators, and ceiling fans/through-the-wall AC were based on room ACs).
Notes and Sources from Table 6-7, Table 6-8, and Table 6-9 labeled by column heading:
A Figures from NYSERDA Deemed Savings Database Revision 13 and NYS TM. B Coincidence/on peak figures from NYSERDA Deemed Savings Database Revision 13 and NYS TM. C Gas savings figures from NYSERDA Deemed Savings Database Revision 13 and NYS TM. D Measure installations attributable to the NYPP Program and NYS TM. A/B/C*D The total energy, demand, and MMBtu savings as products of the per unit savings times the net unit sales
attributable to the NYPP.
Table 6-7: 2010 Net Sales and Measure Savings Estimates for NYPP
Sales and Savings Figures (A) (B) (C) (D) (A*D) (B*D) (C*D)
Appliance
kWh per Unit
kW per Unit
MMBtu per Unit
2010 Net Unit
Sales
kWh Total
Savings
Coinc. Peak kW Savings
MMBtu Total
Savings
Refrigerator 122.0 0.0120 0 15,969 1,948,189 192 0 Clothes Washer 258.8 0.0177 0.9 12,276 3,176,928 218 11,048 Dishwasher 84.8 0.0225 0.26 12,952 1,098,369 291 3,368 Room AC 40.0 0.1060 0 11,352 454,070 1,203 0 Air Cleaner 164.0 0.0250 0 102 16,797 3 0
Dehumidifier 297.0 0.0098 0 3,884 1,153,677 38 0
Freezer 39.0 0.0050 0 2,606 101,631 13 0
Through-the-wall AC 50.0 0.0830 0 818 40,920 68 0
Ceiling Fan 6.8 0.0050 0 293 1,995 1 0
Appliance Total 60,253 7,992,577 2,027 14,416 Lighting Ceiling Fan w/ lights 73.5 0.013 0 199 14,608 3 0 LED Fixtures 48.0 0.045 -0.07 0 0 0 0 LED Lamps 58.0 0.042 -0.084 0 0 0 0 Lighting Total 199 14,608 3 0 Total NYPP 60,452 8,007,185 2,030 14,416
46 New York State Technical Manual.
6-14

Table 6-8: 2011 Net Sales and Measure Savings Estimates for NYPP
Sales and Savings Figures (A) (B) (C) (D) (A*D) (B*D) (C*D)
Appliance
kWh per Unit
kW per Unit
MMBtu per Unit
2011 Net Unit
Sales
kWh Total
Savings
Coinc. Peak kW Savings
MMBtu Total
Savings
Refrigerator 122.0 0.0120 0 14,739 1,798,126 177 0
Clothes Washer 258.8 0.0177 0.9 10,745 2,780,692 190 9,670
Dishwasher 84.8 0.0225 0.26 9,207 780,750 207 2,394
Room AC 40.0 0.1060 0 13,171 526,853 1,396 0
Air Cleaner 164.0 0.0250 0 40 6,563 1 0
Dehumidifier 297.0 0.0098 0 3,757 1,115,793 37 0
Freezer 39.0 0.0050 0 1,046 40,808 5 0
Through-the-wall AC 50.0 0.0830 0 560 28,002 46 0
Ceiling Fan 6.8 0.005 0 281 1,914 1 0
Appliance Total 53,546 7,079,500 2,062 12,064
Lighting
Ceiling Fan w/ lights 73.5 0.013 0 175 12,885 2 0
LED Fixtures 48.0 0.045 -0.07 0 0 0 0
LED Lamps 58.0 0.042 -0.084 0 0 0 0
Lighting Total 175 12,885 2 0
NYPP Total 53,722 7,092,385 2,064 12,064
6-15

Table 6-9: 2012 Net Sales and Measure Savings Estimates for NYPP
Sales and Savings Figures (A) (B) (C) (D) (A*D) (B*D) (C*D)
Appliance
kWh per Unit
kW per Unit
MMBtu per Unit
2012 Net Unit
Sales
kWh Total
Savings
Coinc. Peak kW Savings
MMBtu Total
Savings
Refrigerator 122.0 0.0120 0 9,982 1,217,858 120 0
Clothes Washer 258.8 0.0177 0.9 9,345 2,418,379 166 8,410
Dishwasher 84.8 0.0225 0.26 7,556 640,790 170 1,965
Room AC 40.0 0.1060 0 8,012 320,476 849 0
Air Cleaner 164.0 0.0250 0 0 62 0 0
Dehumidifier 297.0 0.0098 0 1,823 541,453 18 0
Freezer 39.0 0.0050 0 1,488 58,034 7 0
Through-the-wall AC 50.0 0.0830 0 602 30,081 50 0
Ceiling Fan 6.8 0.005 0 134 908 1 0
Appliance Total 38,942 5,228,043 1,381 10,375
Lighting
Ceiling Fan w/ lights 73.5 0.013 0 293 21,515 4 0
LED Fixtures 48 0.045 -0.07 330 15,820 15 -23
LED Lamps 58 0.042 -0.084 1,002 58,105 42 -84
Lighting Total 1,624 95,440 61 -107
NYPP Total 40,566 5,323,483 1,441 10,268
The overall annual and cumulative net savings attributable to the NYPP program can be found in Table
6-10 below. To put the net savings into perspective, the total evaluated net electricity savings attributable
to the NYPP program from 2010-2012 represents only 2.6% of the overall cumulative electricity savings
before the evaluation timeframe (from program inception – 1999 – though through 2009). It should be
noted here that up through 2007 the NYPP included CFL lighting savings, which represented
approximately 50% of program savings. A more recent perspective includes the two year savings from the
previous evaluation report (2012) for program years 2008-2009 which does not include CFL lighting
savings – the combined two year net electric savings was 118,581 MWh. Therefore the combined three
year total net electricity savings from 2010-2012 represents just 17% of the combined two year total net
electricity savings from 2008-2009.
6-16

While the net savings attributable to the program over the 2010-2012 timeframe is very low, the same
cannot be said about the spending. The total incentive dollars spent during the evaluation timeframe
represents 86% of the cumulative incentive dollars awarded before the current evaluation timeframe
(from program inception – 1999 – through 2009).
Table 6-10: Overall Annual and Cumulative Net Savings Estimates for the NYPP
Years MWh Savings
Coinc. Peak MW Savings
MMBtu Savings
Inception through 2009 770,016 145.9 427,794
2010 8,007 2.0 14,416
2011 7,092 2.1 12,064
2012 5,323 1.4 10,268
Cumulative1 790,439 151 464,541 1 Cumulative program savings do not take into account the retirement of installed
measures reaching the end of their useful life, resulting in reduced program savings. This measure retirement analysis was conducted separately by NYSERDA.
6-17

7 Process Analysis The Evaluation Team reviewed the findings from each of the data collection tasks to better understand
how the program is working and how it might be improved. Specifically, this process analysis section
sought to understand the effectiveness of program design, implementation, and program processes and
explore opportunities for improvement. To collect the data required for the process analysis, the Team
reviewed program-related documents, Lockheed Martin survey and data collection activities, and
leveraged the results of the interviews with NYSERDA and Lockheed Martin staff members, corporate
and storefront retailers and manufacturers. The Team researched these issues, many of which were
originally developed in part by Lockheed Martin, by targeting specific research questions, which are
listed below, accompanied by the evaluated findings for each question.
Question 1: Is the program effectively engaging retailers and manufacturers?
To a degree, yes, but going forward, the program should focus on smaller regional retailers and less on
National chain stores. The number of participating retailers/manufacturers has declined over time, mostly
due to larger National and regional partners that did not want to share sales data as part of the partnership
agreement. Though the program lost some major retailers, this may have actually worked to the
Program’s benefit since, as presented previously in Section 6, there was very little influence on ENERGY
STAR® sales for the national chain retailers that were also part of the national ENERGY STAR program.
Program implementation contractor staff who were committed to reaching out to partners were also
reduced during this time period as well: Lockheed Martin had eight staff members serving as field
representatives that have since been cut to five, which left the same amount of work dependent on a
smaller staff. Additionally, the reduced staff had to be cross trained to work with any type of
manufacturer, whereas the larger staff (of eight) was able to have been more specialized to work with
each manufacturer type (e.g., appliances vs. lighting). On-site visits or communication used to occur as
frequently as every week, but now occur once a month or quarterly (corporate and manufacturers
confirmed this decrease in communication). As discussed below, these changes appeared to have
impacted retailer and manufacturer satisfaction the Program.
7-1

Question 2: Is there an opportunity to engage additional retailers and manufacturers?
The opportunity to engage additional retailers exists, but the focus should be on targeting smaller retailers
that do not currently participate in the NYPP or the national ENERGY STAR retail partnership programs.
Furthermore, focus should be made on maintaining and strengthening existing relationships with smaller
NYSERDA-partner only retailers. Efforts should not be made to target the National partner or large,
national corporate chains. Staff interviews even acknowledged the difficulty (and budget requirements) of
going after the National chains/big box stores and felt incentives will make more of a difference/impact
with non-big-box stores. Findings per the corporate retailer surveys also corroborated this by indicating
that corporate offices tend to direct all sales efforts nationally and it is too difficult (and costly) to try and
attempt regional differentiation. According to consumer survey results (presented in Section 4) non-
partners (retailers that are neither NYSERDA nor National partners) represent approximately 10% of the
retail market sales (and would be best to target these retailers). The Team has identified the non-partner
stores using ARRA SEEARP rebate data and can share this data with NYSERDA and Lockheed staff to
help focus recruitment efforts on the stores that saw the largest rebate shares from this temporary
program.
Regarding engaging additional manufacturers, however, given the limited number of participating
manufacturer contacts provided for the survey, coupled with the overarching difficulty of non-response,
the NYPP may receive little benefit from forging new relationships with energy efficient appliance
manufacturers. This is particularly evident with the lack of satisfaction with the program with current and
past manufacturers and belief among the manufacturers that the program has had little if any impact on
ENERGY STAR penetration in the market. Furthermore, the unwillingness to participate in the interview
among the remaining manufacturers provided to the Evaluation Team coupled with the significant jump
in buydown incentives offered to the manufacturers during the 2010-2012 period with the accompanying
lack in market lift leads the Evaluation Team to question the effectiveness of continued engagement with
the manufacturer partners.
7-2

Question 3: Are retailers and manufacturers satisfied with the program?
All three “upstream” market actor groups surveyed (corporate retailers, storefront retailers, and
manufacturers) reported varying degrees of overall satisfaction with the program. On a corporate level,
the average response to this question was a three out of five (five being completely satisfied). When asked
to rate their overall level of satisfaction with the NYPP, one manufacturer provided a rating of two,
primarily related to this company’s lack of involvement in the program.47 The other manufacturer (not
currently participating) provided a rating of one, stemming from “too much program administration and
overall a difficult program to understand.”
The storefront survey respondents showed a higher level of overall satisfaction with the program,
although the decreased Lockheed Martin staffing, as well concern over the change in qualifying
appliances and confusion surrounding changes to the cooperative advertising associated with the program
appeared to negatively impact satisfaction. Figure 7-1 shows the storefront overall satisfaction with the
NYPP, where the mean and median satisfaction were an eight out of ten. Reasons provided for the lower
level of satisfaction were:
• Decreased interaction with program staff: “They [program staff] have not been coming like they used to. They don’t tell me about promotions…”
• Difficulty in understanding the program: “I am not educated enough about this [the program]”, “Currently too confusing”
• Program not working well: “I do not see it [the program] one way or another having much impact”
• “Have become bureaucratic and have lost focus on the consumer” • “Go back three years to how it was run”
To gauge the storefront partner’s outlook on the new (2013) changes made to the program, the
interviewers asked participants whether they were aware of the new changes to the program.48 Figure 7-2
below shows that only a slight majority of storefront participants were aware of the program changes.
Furthermore, a plurality (46%) of those that were aware of the changes felt that they negative changes
(see Figure 7-3 below).
47 Based on a scale of one to five, where one is not at all satisfied and five is extremely satisfied. 48 The new program in 2013 focused on CEE/Top 10 and required that retailers use buy down/markdown for products
(and not just marketing promotions like print ads).
7-3

Figure 7-1: NYSERDA Partner Retailer Storefront Overall Level of Satisfaction with NYPP
Source: MCAP 2013 Partner Retailer Storefront Survey (n=69)
0%
5%
10%
15%
20%
25%
30%
35%
1 - Very Dissatisfied
2 3 4 5 6 7 8 9 10 - Very satisfied
Perc
ent o
f Sto
refr
ont R
etai
lers
Satisfaction Score
Figure 7-2: NYSERDA Partner Retailer Storefront Respondents Awareness of 2013 NYPP Changes
Source: MCAP 2013 Partner Retailer Storefront Survey (n=71)
Yes 58%
No 42%
7-4

Figure 7-3: NYSERDA Partner Retailer Storefront Respondents (those that were aware of program changes) Attitudes of Program Changes
Source: MCAP 2013 Partner Retailer Storefront Survey. Only asked of those that were aware of program changes (n=39)
Are the program reporting requirements clear and easy to understand?
The manufacturer interviewed that was no longer a NYPP partner felt that there was “too much program
administration and overall a difficult program to understand.” This manufacturer also pointed out that the
NYPP is the only program structured in such a fashion, with other energy efficient appliance programs
that provide direct customer rebates being more successful and easier to understand. The corporate
retailer surveys indicated that the reporting requirements are clear and easy to understand. Corporate
entities have the staff and resources (advanced computer systems) that make reporting relatively easy.
The storefront surveys, coupled with in-depth interviews with Lockheed and NYSERDA staff, showed
that reporting requirements were more burdensome for the smaller (the “mom & pop”) retailers since they
did not have the resources (and staff) for meeting the requirements. Somewhat paradoxically, it is the
corporate retailers that have shown the most reluctance in sharing program data with staff relative to the
smaller retailers.
46%
23%
31%
Feel changes were negative Neutral on changes
Feel changes were positive
7-5

Are manufacturers and retailers using the program marketing materials effectively?
Regarding marketing support, retailers would prefer more specific targeted messaging (they believe the
current material is too generic) and would like to be able to also bolster direct relationships across both
NYSERDA and the utilities that operate programs and collaboratively create marketing plans –
effectively bundling together these resources for greater outreach. Retailers rated their satisfaction with
marketing materials a three out of five. A handful of storefront retailers interviewed found the marketing
materials (point-of-purchase) distributed through the NYPP to be extremely helpful, and in fact suggested
that more in-store marketing materials be distributed.
Where marketing materials effectiveness can be called into question is the fact that the program spent, in
the three years this evaluation reviewed (2010-2012), almost the same amount in marketing dollars as was
spent in the first 10 years of the program (see Figure 7-4 below), yet some of the key progress metrics did
not budge – including awareness, perception, and especially sales attribution (which was covered in the
attribution section). This likely reflects a mature ENERGY STAR market within the NYSERDA territory
and trying to capture the last incremental gaps in awareness and demand.
Figure 7-4: Total Cumulative NYSERDA NYPP Incentives Paid
Source: NYSERDA Participant Practices Reports (PPR) developed for NYSERDA by Lockheed Martin
$0
$5,000,000
$10,000,000
$15,000,000
$20,000,000
$25,000,000
$30,000,000
$35,000,000
Ince
ntiv
es ($
)
Time Period
7-6

Have program dollars been leveraged through retailer/manufacturer marketing/incentive expenditures?
Program dollars, particularly marketing incentives, continue to play an important role in the NYPP.
Though co-funding has slightly declined year after year, from a ratio of NYSERDA to partner co-funding
of 2.44 in 2009 down to 2.39 in 2010, 2.30 in 2011, and 2.23 in 2012, for every dollar spent by
NYSERDA the partners more than double their investment in marketing dollars. Figure 7-5 below shows
the slight annual decline in the NYSERDA NYPP co-funding ratio from 2009 through 2012. Most of this
drop in co-funding can be attributed to manufacturer incentives since there were no manufacturer co-op
advertising dollars spent during the 2010-2012 time period and the co-funding ratio declined for
manufacturer incentives while retailer co-funding remained relatively static.
Figure 7-5: NYSERDA NYPP Co-Funding Ratio from 2009-2012
Source: NYSERDA Participant Practices Reports (PPR) developed for NYSERDA by Lockheed Martin
What else can the program do to more closely work with retailers and manufacturers?
According to one corporate retailer, the Program could better collaborate with utilities that also offer
programs in the NYSERDA area. Along with collaboration with utilities, the retailer also believed these
joint efforts could be magnified by including more targeted messaging to researchable demographics –
segments of the market defined by particular traits – like elderly, young and mobile, professional, and
family as examples. With the shift of the program to Most Efficient, the retailer felt that the program
design would be most effective as one that was done collaboratively. Manufacturers believed that the
NYPP could do a better job of communicating and engaging with manufacturers, incorporating some
form of regular follow-up with manufacturers. As stated above, doubts have been raised as to whether
continued engagement with manufacturers will achieve the desired outcomes.
1.00 1.20 1.40 1.60 1.80 2.00 2.20 2.40 2.60
2009 2010 2011 2012
Co-F
undi
ng R
atio
Year
7-7

Are there other “upstream” trade ally groups that the program could work with to better promote
ENERGY STAR products?
The evaluation team did not receive any recommendation for other trade ally groups not already
represented by the program across the interviews of NYSERDA staff, corporate and storefront retailers,
and manufacturers. The evaluation team did enquire about buyers groups (during the staff and corporate
interviews) but learned that buyers groups represent existing groups of retailers that can be described as
the following:
• Are usually mom & pop shops usually work as buyer groups • the retailers get together and try and get discounts – effectively a lobby type of entity • Program does not work with them directly
The difficulty is in identifying the buyers groups, understanding whether they are already partners with
the program (as individual retailers) and then attempting to bring them into the program collectively. This
could be a very desirable approach if NYSERDA and Lockheed are able to identify and communicate
with them.
How can the program be improved?
The Evaluation Team believes the program can be most improved by continuing with the move to Most
Efficient program design, by focusing support to include mostly smaller NY-based retailers, and to
potentially stop engaging National Retailers and corporate big box chains. According to one corporate
retailer, collaboration between NYSERDA, retailers, and the utilities is of paramount importance.
Storefront retailers believe that the program could improve the educational materials to handout to
customers and that NYSERDA representatives should come out more frequently to educate stores on the
program and ENERGY STAR appliances.
Manufacturers felt that it is important to have more educational materials (including case studies, white
papers, etc.) to pass along to retailers and customers to better inform them about the ENERGY STAR
products and energy efficiency. Program staff believe there is a need to streamline the back and forth
between Lockheed Martin and the partners. There appears to be lots of back and forth between retailers
and Lockheed Martin – so NYSERDA asked Lockheed Martin to just use set messaging and marketing
templates; essentially a prepackaged marketing “packet” the retailers can leverage and just merge their
company specific information in and use. With a reduced budget, and loss of representatives (from eight
down to five), this task will become more difficult. Finally, completing the online training module for
partners would help with the streamlining and reduced staff.
7-8
8 Findings and Recommendations This section is divided into several components: first we review the1) summary of findings related to key
researchable issues, 2) then we review of the most significant market characterization, market assessment
and net savings and attribution findings 3) and then we conclude with recommendations.
8.1 Summary of Findings Related to Key Researchable Issues
As stated in Section 2.5, the MCAP team formulated a number of key researchable issues associated with
the NYPP as part of the Program’s logic modeling activities. Issues applicable to this MCAP evaluation
and relevant findings are summarized below.
Researchable Issue 1. Are the advertising campaigns, outreach efforts, and promotional materials
effective? How effective? How well do they work together to increase consumer awareness, knowledge,
intent and ability to act on those intentions? What is their impact on sales of ENERGY STAR® and high-
efficiency products?
• Findings. The consumer survey indicated that 50% of respondents reported that they had seen or heard an advertisement or information about ENERGY STAR in the last year, down from 63% of respondents from the previous survey in 2010. An additional 24% had seen or heard an advertisement or information about energy efficiency in the last year, but did not mention ENERGY STAR specifically, up from only 13% in 2010. Both unaided and aided recognition of the ENERGY STAR label remained unchanged from the 2010 survey, though the NYSERDA consumer survey did show statistically higher aided and unaided awareness of the ENERGY STAR label than consumers in the comparison region. It appears that the largest influence on sales of the evaluation timeframe were the introduction of ARRA rebates. Findings from the 2012 CEE ENERGY STAR Household Survey indicated that 56% of NYSERDA respondents rated the level of importance of ENERGY STAR promotions either seen or heard a “4” or “5”, on a 1-to-5 scale, with five as “very important.” Furthermore, of those respondents that reported seeing in-store ENERGY STAR promotions, 71% placed a high level of importance on these promotions in the purchasing of ENERGY STAR products. The higher awareness of the ENERGY STAR label in NYSERDA did not translate into higher sales of those products relative to the comparison areas. While the advertising, outreach, and promotional materials may have been effective in driving higher ENERGY STAR sales in prior years, they were of limited value during the 2010-2012 timeframe.
8-1

Researchable Issue 2. Why did the number of participating retail storefronts decline from 2010 to 2012?
What can be done to increase the number of participating retailers?
• Findings. The number of participating retail storefronts declined due to the loss of large big box National retailers (including Home Depot, Lowes, Best Buy) and even more regional large chains (including PC Richards) all due to the same reason – these retailers were not willing to abide by the reporting requirements. Since one of the key progress metrics of the program is to increase participating retailers, the Team recommends pursuing the non-participating smaller regional retailers (accounting for approximately 10% of NYSERDA region appliance sales).
Researchable Issue 3. Is the Program contributing to increased availability and product selection of
ENERGY STAR and high-efficiency products?
• Findings. From the 2012 Retailer Storefront Survey, there was a noticeable increase in the self-reported % of displayed models in stores that were ENERGY STAR-labeled when compared to the 2010 findings. For example, storefronts in the 2012 survey reported that 67% of refrigerators on display were ENERGY STAR-labeled, up from 53% in 2010. In general, this percentage point increase over 2010 to 2012, across all appliances, was around 15 percentage points. As product sales are in part a function of availability, it is worth noting that 27% to 63% (varies by appliance) of storefronts reported an increase in ENERGY STAR appliance sales from 2010 to 2012. According to corporate retailers, the move to ENERGY STAR Most Efficient limits market size – includes low sales volume, and the sales volume is so low, does not justify floor stocking. According to the Participant Practices Reports, this year, for the first time ever, over 80% of appliance partner stores and all lighting partner stores claimed they would probably continue their increased ENERGY STAR certified stocking practices without the Program. The consistently low percentages of those who claim their ENERGY STAR certified stocking practices depend entirely on the Program are encouraging signs for the Program’s market transformation goals, which subsequently raises the question whether there is a continued need for the program? Over 80% of appliance and consumer electronics partner stores claimed they would definitely continue promoting ENERGY STAR certified models inside their stores without NYSERDA involvement, indicating further progress toward market transformation.
8-2

Researchable Issue 4. Are participating retailers, manufacturers, distributors and contractors pleased
with the Program, as well as the functioning of and growth in the market for ENERGY STAR and high-
efficiency products?
• Findings. All three “upstream” market actors surveyed (corporate retailers, storefront retailers, and manufacturers) reported varying degrees of overall satisfaction with the program. On a corporate level, the average response to this question was a three out of five (five being completely satisfied). When asked to rate their overall level of satisfaction with the NYPP on a scale of one to five, where one is not at all satisfied and five is extremely satisfied, one manufacturer provided a rating of two, primarily related to his company’s lack of involvement in the program. The other manufacturer (not currently participating) provided a rating of one, stemming from “too much program administration and overall a difficult program to understand.” The storefront survey respondents showed a higher level of overall satisfaction with the program, although the decreased Lockheed Martin staffing, as well concern about the program changes, appeared to negatively impact satisfaction. Some of this negativity associated with the program appears to stem from certain retailers reluctance to embrace the program changes. Figure 7-1 shows the storefront overall satisfaction with the NYPP, where the mean and median satisfaction were an eight out of ten.
Researchable Issue 5. Is the NYSERDA NYPP contributing to increased ENERGY STAR and higher
efficiency product (e.g., CEE top tiers and ENERGY STAR Most Efficient products) sales?
• Findings. The team could not find evidence that there is overall market lift across all retail channels, but when examining regional NYSERDA-only partners alone, the Team did find that there is approximately a 20% market lift as a result of the program efforts, and a large partner that is both a National and NYSERDA partner reported a 5% market lift, which translates into an approximate 11% attributable sales lift.
Researchable Issue 6. What is the estimated market share of ENERGY STAR and high-efficiency
products?
• Findings. For most of the high impact measures evaluated in this study, the market share for ENERGY STAR products continues to increase. For Room AC's, ES market share rose steeply during first few years of the program but have since stagnated since 2003 at around 70%. Clothes washers have seen a steady increase in ES market share since the introduction of the program, with 2012 having the highest ES market share at 72%. Dishwashers have seen a smaller but steady increase in ES market share since the introduction of the program, with 2012 having the highest ES market share at 88%. Refrigerators have also seen a steady growth in ES market share since program inception, increasing to 69% in 2012.
8-3

Researchable Issue 7. What is the energy savings and demand that can be attributed to the program
efforts?
• Findings. The overall market lift attributable to the NYPP is approximately 10.5%, meaning the program is responsible for 10.5% of the ENERGY STAR sales in its partner stores. Therefore the 2010-2012 net savings associated with attributable sales to the NYPP program are energy savings of 20.4 GWH, demand savings of 5.5 MW, and MMBtu savings of 36,747. To put the net savings into perspective, the total evaluated net electricity savings attributable to the NYPP program from 2010-2012 represents only 2.6% of the overall cumulative electricity savings before the evaluation timeframe (from program inception – 1999 – though through 2009). While the net savings attributable to the program over the 2010-2012 timeframe is very low, the same cannot be said about the spending. The total incentive dollars spent during the evaluation timeframe represents 86% of the cumulative incentive dollars awarded before the current evaluation timeframe (from program inception – 1999 – through 2009).
Researchable Issue 8. Are the ENERGY STAR and higher efficiency products meeting consumer
expectations? Does this support their continued and growing interest in the ENERGY STAR label and
high-efficiency as product criteria?
• Findings. From the 2012 CEE ENERGY STAR Household Survey, 43% of NYSERDA respondents found ENERGY STAR products to be of better value than non-ENERGY STAR products. Additionally, 37% of NYSERDA respondents noted that ENERGY STAR products were of better quality than non-ENERGY STAR products. These sentiments appear to be helping future ENERGY STAR product sales, as 66% of NYSERDA respondents that had purchased an ENERGY STAR labeled appliance stated they had previously purchased an ENERGY STAR appliance. An additional metric that reinforces the notion that consumers are pleased with their ENERGY STAR product purchase and that the product is meeting consumer expectation is the likelihood of recommendation, with 67% of NYSERDA respondents stating they would be “very likely” to recommend an ENERGY STAR product and another 23% mentioning that they would be “somewhat likely.”
Researchable Issue 9. What are the future implications for ENERGY STAR and high-efficiency
products? How much continued consumer advertising is needed to maintain a sustainable market for
ENERGY STAR and high-efficiency products?
8-4

• Findings. Market penetration continues to increase, and will involve technological innovation coupled with evolving programs like the NYPP that focus on increased efficiencies (like currently offering ENERGY STAR Most Efficient program design) and finally Federal standards and ENERGY STAR specifications that help support the shifting market, though this does have potential to reduce deemed savings associated with the four high impact measures. The conventional ENERGY STAR products markets are now very mature, after having received over a decade’s worth of marketing and support, both nationally and regionally within the NYSERDA area.
Researchable Issue 10. How can the program engage pool pump manufacturers/retailers to work more
closely to promote high-efficiency pool pumps?
• Findings. Given that only seven of the 20 pool pump manufacturers and retailers surveyed had heard of the NYPP, NYSERDA could make a concerted effort to increase program awareness across New York for pool pump market actors. Specific actions provided by the respondents that NYSERDA could take include reaching out to company headquarters, industry associations, pool pump distributors, and holding educational classes/informational sessions about high-efficiency pool pumps.
Researchable Issue 11. Are mechanisms in place to determine when market-share sales goals for these
products have been met so a product no longer needs to be covered under the program?
• Findings. Yes, the key mechanism in place to determine when market-share goals have been met would be evaluation activities like this, but the Team believes there should be internal guidelines in place that would help identify or flag (early warning signs) for ineffective or measures that should be withdrawn from program support. In addition, tracking needs to be set up to monitor sales of ENERGY STAR Most Efficient products.
8.2 Market Characterization Findings
Market characterization provides background information useful in defining programs, delivery concepts,
target markets, and the potential for a program (see Section 4). The following are selected findings from
the market characterization effort:
• “Big box” retailers continue to dominate the market based on the results of the distribution channel analysis: Over 60% of the combined consumer survey respondent purchases for every product category came from the top five “big box” retailers, with the highest concentration for refrigerators (70%) and lowest for room air conditioning units (49%).
• Household members, based on consumer survey results, selected and purchased the vast majority (more than 94%) of all products studied, while landlords were the second most active purchasers but were far behind the owners or tenants, purchasing only 8% of the refrigerators, 2% of the clothes washers, 3% of the dishwashers, and 2% of all room air conditioners.
8-5

• Survey respondents said they usually collected product information in the stores (more than 50% for all products), but the Internet and Consumer Reports were also important sources of information. Although nearly all purchases were conducted in-person at the retail store, online purchases increased from 5% in 2010 to now represent almost 10% of all appliance purchases (and 17% of APS purchases).
• Market share was estimated for all products through the residential end-use customer survey, sales data from the National ENERGY STAR Partners, and NYSERDA ENERGY STAR Partners. ENERGY STAR market shares continued to increase (based on previous studies) for all products studied, with the highest market share being obtained by dishwashers (74%), followed by clothes washers (61%), refrigerators (55%), and room ACs (48%).
• The storefront surveys, coupled with in-depth interviews with Lockheed and NYSERDA staff, showed that reporting requirements were more burdensome for the smaller (the “mom & pop”) retailers since they did not have the resources (and staff) for meeting the requirements. Somewhat paradoxically, it is the corporate retailers that have shown the most reluctance in sharing program data with staff relative to the smaller retailers.
8.3 Market Assessment Findings
Market assessment tracks changes in markets over time with a specific focus on market metrics that might
be influenced by the NYPP (see Section 5). The following are selected findings from the market
assessment:
• Consumer awareness and understanding of the ENERGY STAR label has effectively plateaued based on the NY consumer survey results. Aided awareness was 89% in 2010 and is slightly lower at 86% in the current telephone survey of residential end-use customers, while unaided recognition decreased slightly as well (80% in 2010 to 79% in 2013).
• Promotional activities do not appear to be as effective, as only 50% of NY consumer based survey respondents reported that they had seen or heard an advertisement or information about ENERGY STAR in the last year (relative to the 2009 survey with 65%).
• The ENERGY STAR stocking trend among NYSERDA retailers continues to increase steadily over time, with 2012 ENERGY STAR appliance stocking levels of ENERGY STAR higher than the previous 2010 survey, ranging from 13 to 17% points depending on appliance.
• The most recent CEE survey shows that the following metrics have remained constant or declined since the previous survey: recommend ENERGY STAR products to a friend (declined), energy efficiency as an attribute for appliance selection (same), that the ENERGY STAR label influenced their purchasing decision (declined).
• Manufacturers report that NYSERDA-sponsored buydowns have not had an impact on sales. Partner retailers indicated NYSERDA-sponsored cooperative advertising results in average sales lift ranging from 20% for dishwashers, clothes washers, and refrigerators to 26% for room air conditioners (similar results were found in 2009 at approximately 19% lift). Corporate retailers believed the NYPP is responsible for 5% market lift.
8-6

• The likelihood of future ENERGY STAR purchases was nearly constant at 56% (previously was 54%), while ENERGY STAR recommendation also stayed the same (50% definitely would).
• All NYSERDA partner retailers now recognize the profitability of promoting ENERGY STAR, as 100% of store managers said they would continue to stock (56% would continue to advertise) ENERGY STAR products even without NYSERDA’s assistance. The majority agreed, however, that without NYSERDA’s Program, ENERGY STAR sales would likely decrease.
• The incremental cost analysis showed that ENERGY STAR features are typically bundled with high end features, the reason that simple prices are higher than modeled analyses (this is particularly true for refrigerators) and the incremental cost has actually gone down or stayed flat when modeled and controlled for covariates and inflation. The 2011 incremental costs associated with ENERGY STAR from the modeled analysis were: refrigerators – $87, clothes washers – $134, dishwashers – $36 (unable to perform on room air conditioner).
8.4 Attribution and Program Savings
The Evaluation team examined data from a multitude of resources related to ENERGY STAR products in
order to estimate net savings from NYPP activities.
Savings from product sales and installation were derived by first estimating the market share for
ENERGY STAR products through estimates of total market size and sales of ENERGY STAR products.
Next, portions of the market share were allocated to exogenous, non-NYPP effects, including the impact
of the national Environmental Protection Agency/Department of Energy ENERGY STAR program,
naturally occurring adoption (including the impact of higher energy prices and interest generated by
programs in neighboring states), and the impacts of other NYSERDA residential Programs. The
remaining market share, after netting out these other effects, was considered attributable to the NYPP.
The results from this study are combined with those from the previous MCAC analysis,49 which focused
on program impacts prior to 2010, to yield combined estimates of savings since program inception. The
following are selected findings from the attribution/causality component of the MCAP evaluation
(Section 6, Attribution and Program Savings):
• The 2010-2012 Program resulted in the installation of almost 155,000 ENERGY STAR appliances, resulting in estimated savings of 20,423 MWh of energy and 5.5 MW of peak demand savings, along with 36,747 in MMBtu savings.
49 It should be noted that CFL lighting savings was included in the reported cumulative program impacts through 2007
8-7

• From the Program inception in 1999 through year end 2012 the Program has saved 790,439 MWh, 151 MW and 464,541 MMBtu.50
• To put the net savings from this evaluation into perspective, the total evaluated net electricity savings attributable to the NYPP program from 2010-2012 represents only 2.6% of the overall cumulative electricity savings before the evaluation timeframe (from program inception – 1999 – though through 2009). It should be noted here that up through 2007 the NYPP included CFL lighting savings, which represented approximately 50% of program savings. A more recent perspective includes the two year savings from the previous evaluation report (2012) for program years 2008-2009 – the combined two year net electric savings was 118,581 MWh. Therefore the combined three year total net electricity savings from 2010-2012 represents just 17% of the combined two year total net savings from 2008-2009.
8.5 Program Issues and Recommendations
The following recommendations are based on the Evaluation Teams review of the extensive evaluation
data and results. The structure of the recommendations section includes the issue that the team
encountered followed by the recommended action to address the issue. Issues and recommendations are
included below:
Issue: The NYSERDA partner ENERGY STAR market share is very high (in 2012 market share was
75% for clothes washer, 88% for dishwasher, 72% for refrigerators, and 67% for Room AC). ENERGY
STAR awareness has not changed significantly since 2010 because the ENERGY STAR market is
considered a mature market.
• Recommendation: Considering the current program design (shifting focus from all ENERGY STAR products to Most Efficient products) and the findings contained in this report, NYSERDA should carefully consider the viability and continued support of consumer appliances. It is critical to track market share very closely and monitor potential program impacts, but the current form of the program is not able to track Most Efficient products. There are significant risks and constraints associated with the future cost effectiveness and evaluability of the program, including: the uncertainty surrounding estimating baseline sales, the ability, availability, and sharing of partner sales data, potentially higher incremental costs, lower savings due to new standards, and a limited range of Most Efficient models.. If early indicators show lackluster market lift, NYSERDA should seriously reconsider continuation of this program.
50 Cumulative program savings do not take into account the retirement of installed measures reaching the end of their useful life, resulting in reduced program savings. This measure retirement analysis was conducted separately by NYSERDA.
8-8

Issue: Market lift of ENERGY STAR products was somewhat evident in NYSERDA-only partners, of
limited impact for retailers that team with both NYSERDA and also work with national ENERGY STAR
program (big box), and not evident at all for retailers outside of the program but within the NYSERDA
area.
• Recommendation: Focus of recruitment efforts should be to engage with retailers that are not receiving support through the national ENERGY STAR program to help them sell more efficient products. Furthermore, reconsider the extensive use of manufacturer buydown incentives since they drastically increased while the program showed minimal evidence of market lift.
Issue: Partners reported varying levels of satisfaction with the program, with manufacturers being both
the most unwilling to participate in interviews and showing the lowest satisfaction. The majority of
comments related to dissatisfaction included frustration with the changes made during the 2010-2012
evaluation period, and the more recent changes made to the program design for 2013.
• Recommendation: Change can be unsettling, especially when the focus of a program shifts from what people know and expect to the “unknown.” The challenge is convincing the partners that the change is forward looking and based on findings from credible evaluations. The program needs to continue to make an effort to communicate the necessity of changes to the various partners so that it is clear why the changes are happening, the issues being addressed, and the expected benefits.
Issue: Awareness of the NYPP is low among pool pump market actors, in turn leading to a small number
of program participants in the pool pump program. Compounding the issue is a perceived lack of demand
for high-efficiency pool pumps by consumers.
• Recommendation: Take steps to educate both the public and pool pump manufacturers/retailers about the NYPP. Specifically, NYSERDA can reach out to company headquarters, industry associations, pool pump distributors, hold educational classes/informational sessions about high-efficiency pool pumps, and engage in general awareness campaigns to increase product demand.
8-9

Issue: Consumer demand for advanced power strips is relatively low with only half of purchasers initially
seeking an advanced power strip. Also, among partner retailer storefronts, only 10% stated their store
carried advanced power strips, with almost another 10% unsure if their store carried advanced power
strips.
• Recommendation: An opportunity exists for NYSERDA to educate both the public and storefront retailers about the benefits of advanced power strips. As only half of purchasers go to the store specifically for an advanced power strip, in-store materials and salesperson knowledge are likely to heavily impact consumer purchases.
8-10

Appendix A. Survey Instruments
A.1 ENERGY STAR® Products End Use Consumer Survey
Hello, my name is _____, and I’m calling on behalf of the New York State Energy Research and Development Authority (NYSERDA). NYSERDA is conducting a study about appliances and energy use in New York State. May I please speak to an adult head of household who is involved in decision-making about appliances?
On average, these questions take about 15 minutes or less to answer. Your participation will help state program administrators make decisions about future energy efficiency, programs for consumers.
We are not trying to sell you anything or sign you up for any program.
The information you provide will be used to improve NYSERDA’s programs and will be kept confidential to the extent permitted by law. We will report all responses in aggregate and will not attribute any comments to you.
[IF RESPONDENT HAS QUESTIONS, THEY CAN CALL: Victoria Engel-Fowles at NYSERDA: (518) 862-1090, ext. 3207.]
NO NEED FOR QUESTION VERIFYING ADULT
MOVED TO DEMOGRAPHIC/ADDITIONAL SCREENER SECTION (ASK IF CELL PHONE SAMPLE. ELSE GO TO S1.)
CP1. I first want to confirm that I am calling you on a cell phone. Is that correct?
(If asked why: I just want to offer to call you on a land-line phone, or at a time when you are not driving if this is a cell phone)
1. Yes (GO TO CP2) 2. No (SKIP TO S1) 8. REFUSAL - SOFT (SOFT REFUSAL - THANK & END) 9. REFUSAL - HARD (HARD REFUSAL - THANK & END)
CP2. Is there a land line where you would prefer me to call to conduct the interview?
1. Yes (UPDATE PHONE TO LAND LINE, SCHEDULE CALLBACK) 2. No, continue on cell phone (CONTINUE TO CP3) 8. REFUSAL – SOFT (SOFT REFUSAL - THANK & END) 9. REFUSAL - HARD (HARD REFUSAL - THANK & END)
CP3. Are you currently driving, or someplace else where it IS NOT safe to talk on your cell phone?
1. YES/CALL ME LATER (SCHEDULE CALLBACK) 2. No, respondent can talk now (CONTINUE TO CP4) 8. REFUSAL – SOFT (SOFT REFUSAL - THANK & END)
A-1

9. REFUSAL - HARD (HARD REFUSAL - THANK & END) CP4. Is now a good time to talk?
(INTERVIEWER: IF EVENINGS / WEEKENDS ARE BETTER BECAUSE RESPONDENT IS NOT CHARGED FOR CELL USAGE, SCHEDULE CALLBACK AND RECORD COMMENTS)
1. Yes, now is fine (CONTINUE TO S1) 2. No, another time is better (SCHEDULE CALLBACK & record comments about best call
times) 8. REFUSAL – SOFT (SOFT REFUSAL - THANK & END) 9. REFUSAL - HARD (HARD REFUSAL - THANK & END)
S1. Can you please tell me in what county you live?
1. Nassau or Suffolk [THANK AND TERMINATE] 2. Downstate (Westchester, New York, Kings, Queens, Bronx, Richmond) [CONTINUE] 3. Upstate (All other except choices in 1 and 2) [CONTINUE] 4. Not in New York State [THANK AND TERMINATE] 8. Don’t know [THANK AND TERMINATE] 9. Refused [THANK AND TERMINATE]
First, please tell me if, during the last 3 years, you SHOPPED for any of the following appliances for use in your current residence. [READ OPTIONS 1 TO 4. SELECT ALL THAT APPLY] 01 Refrigerator 02 Clothes washer 03 Dishwasher 04 Room air conditioner 05 NONE OF THESE 08 REFUSED 09 DON’T KNOW
During the last 3 years, did you PURCHASE any of these products, brand new in New York for use in your current residence? [READ OPTIONS 1 TO 4. SELECT ALL THAT APPLY] This purchase could also have been made by a contractor or landlord. 01 Refrigerator 02 Clothes washer 03 Dishwasher 04 Room air conditioner 05 NONE [IF SELECTED AS NON-PURCHASER ASK Q5-Q10b AND (ESH1-HP1 & ALL
ADDITIONAL DEMOS (Q133-Q136 & Q142)) 08 REFUSED [TERMINATE] 09 DON’T KNOW [IF SELECTED AS NON-PURCHASER ASK Q5-Q10b AND (ESH1-HP1 & ALL
ADDITIONAL DEMOS (Q133-136 & Q142)) [ASK FOR EACH PRODUCT MENTIONED IN Q4]
4a. What year did you purchase your [INSERT PRODUCT MENTIONED IN Q4]
01 = 2013
A-2

02 = 2012 03 = 2011 04 = 2010 08 REFUSED 09 DON’T KNOW
The Energy Guide is a large, yellow label that shows, in dollars, the average energy used by an appliance during one year. It shows how a particular model compares to models using the greatest and smallest amounts of energy in its category. Have you seen or heard of such a label before now? 01 YES 02 NO 08 REFUSED 09 DON’T KNOW
Have you ever seen or heard of the ENERGY STAR label? 01 YES [SKIP TO 8] 02 NO 08 REFUSED 09 DON’T KNOW
The ENERGY STAR label has the word “energy” followed by a five-pointed star under a dome or half-circle. Some labels also show the continents and the oceans of the earth in a half circle. ENERGY STAR labels are used by the Environmental Protection Agency (EPA) and the Department of Energy to identify and label energy-efficient appliances for consumers. They may appear on some appliances and other products; retail stores may also post them at entrances and other locations; they may also appear on the yellow Energy Guide label. Have you seen or heard of such a label before now? 01 YES 02 NO [SKIP TO FIRST APPLIANCE MODULE BASED ON Q4] 08 REFUSED [SKIP TO FIRST APPLIANCE MODULE BASED ON Q4] 09 DON’T KNOW [SKIP TO FIRST APPLIANCE MODULE BASED ON Q4]
(IF Q6=1 OR Q7=1, ASK Q8 & Q9.)
What does the ENERGY STAR label mean to you? [SELECT ALL THAT APPLY; DO NOT READ RESPONSES] 01 SAVE MONEY ON OPERATION 02 ENERGY EFFICIENT/SAVINGS 03 ENERGY CONSERVATION 04 SAVINGS (NOT LINKED TO OPERATION) 05 ENVIRONMENTAL BENEFITS 06 ENERGY/ENVIRONMENTAL PRODUCT STANDARDS 07 ENERGY [NO LINK TO EFFICIENCY] 08 ENVIRONMENT [NO LINK TO BENEFIT] 09 PRODUCT STANDARDS [NO ENVIRONMENTAL LINK] 10 ELECTRICITY 11 QUALITY
A-3

12 GOVERNMENT BACKING 13 CONFUSES WITH ENERGY GUIDE 14 MENTIONS SPECIFIC PRODUCTS 15 SAVE MONEY ON PURCHASE 16 NEGATIVE PERCEPTION [SPECIFY] _______ 17 HIGHER COST 18 ADDED FEATURES/FUNCTIONALITY 19 OTHER [SPECIFY] ______ 96 REFUSED 97 DON’T KNOW
Do you remember seeing or hearing any advertising or information about ENERGY STAR or energy saving products in general over the past 3 years? 01 YES, SAW/HEARD ENERGY STAR ADVERTISMENTS OR INFORMATION [INCLUDES ENERGY
EFFICIENCY] 02 YES, SAW OR HEARD ENERGY SAVING PRODUCT ADVERTISING OR INFORMATION ONLY
[SKIP TO 10] 03 NO [SKIP TO FIRST APPLIANCE MODULE BASED ON Q4] 08 REFUSED [SKIP TO FIRST APPLIANCE MODULE BASED ON Q4] 09 DON’T KNOW [SKIP TO FIRST APPLIANCE MODULE BASED ON Q4]
9a. What was the advertisement or information about? [DO NOT READ; SELECT ALL THAT APPLY]
01 NEGATIVE INFORMATION [SPECIFY] _____ 02 INFORMATION ON SPECIFIC PRODUCTS THAT ARE ENERGY STAR 03 HOW ENERGY STAR WILL SAVE MONEY 04 HOW ENERGY STAR HELPS THE ENVIRONMENT 05 HOW ENERGY STAR IS QUALITY PRODUCTS 06 OTHER [NO NEED TO SPECIFY] 08 REFUSED 09 DON’T KNOW
(IF Q9=1 OR 2, ASK Q10.)
Can you tell me where you saw or heard those advertising or informational materials? [DO NOT READ; PROBE; SELECT ALL THAT APPLY] 01 TV AD 02 TV NEWS FEATURE STORY 03 RADIO AD 04 RADIO PUBLIC SERVICE ANNOUNCEMENT 05 RETAIL STORE SIGN AND INFORMATIONAL MATERIALS 06 RETAIL MAILING MATERIALS 07 NEWSPAPER OR MAGAZINE AD 08 NEWSPAPER INSERT 09 BILLBOARD 10 A UTILITY MAILING OR BILL INSERT 11 AN INTERNET SITE 12 AD IN A MOVIE THEATRE
A-4

13 CHILD CAME HOME FROM SCHOOL WITH MATERIALS/CHILD CAME HOME FROM SCHOOL WANTING TO DO AN AUDIT OF THE HOUSE
14 YELLOW ENERGY GUIDE LABEL 15 AT THE NY STATE FAIR OR ANOTHER PUBLIC EVENT 16 NYSERDA PROMOTIONAL CAMPAIGN 17 ADVOCACY GROUPS/GRASSROOTS OUTREACH 18 OTHER [SPECIFY] 96 REFUSED 97 DON’T KNOW
10a. Are you familiar with the ENERGY STAR Most Efficient designation?
01 YES [SKIP TO FIRST APLIANCE MODULE BASED ON Q4] 02 NO 08 REFUSED [SKIP TO FIRST APLIANCE MODULE BASED ON Q4 09 DON’T KNOW
10b. ENERGY STAR Most Efficient is a relatively new program element to identify and advance highly efficient products in the marketplace. This effort identifies the most efficient products among those that qualify for the ENERGY STAR in particular product categories. Product categories were selected and recognition criteria were established to ensure that products that receive this recognition demonstrate efficiency performance that is truly exceptional, inspirational, or leading edge and consistent with the interests of environmentally-motivated consumers and early adopters. Have you heard of such a designation before now?
01 YES 02 NO 08 REFUSED 09 DON’T KNOW
[EACH RESPONDENT GETS NO MORE THAN TWO MODULES FROM AMONG THE APPLIANCES SELECTED IN Q4, MAINTAINING A QUOTA OF 200 PER MODULE.
THEY SHOULD BE RANDOMLY ASSIGNED BUT FOLLOW THE HIERARCHY OF IMPORTANCE (1 – REFRIG, 2 –CLOTHES WASHER, 3 – DISHWASHER, 4 – ROOM A/C). NOTE THIS HIERARCHY IS SUBJECT TO CHANGE DURING FIELD PERIOD AS INCIDENCE IS BETTER KNOWN.]
A.1.1 Refrigerator Purchaser Module
[ASK 11-38 IF Q4 = 01 AND SELECTED FOR REFRIGERATOR MODULE]
Now I would like to ask you a few questions about your new refrigerator. Was it purchased by you, a remodeling contractor, a new home builder, or the landlord? 01 RESPONDENT OR MEMBER OF HOUSEHOLD [SKIP TO 13] 02 REMODELING CONTRACTOR 03 HOMEBUILDER 04 LANDLORD 05 OTHER [SPECIFY] ______ [SKIP TO 13] 08 REFUSED
A-5

09 DON’T KNOW (IF Q11=2, 3, 4, 8 OR 9, ASK Q12.)
Was the specific refrigerator model selected by you or by the landlord, contractor, or builder? 01 RESPONDENT 02 LANDLORD, CONTRACTOR OR BUILDER [SKIP TO 36] 03 JOINT DECISION (FOR EXAMPLE, CONTRACTOR/BUILDER OFFERED CHOICES FROM
WHICH YOU SELECTED) 08 REFUSED [SKIP TO 36] 09 DON’T KNOW [SKIP TO 36]
(IF (Q11=1 OR 5) OR (Q12=1 OR 3), ASK Q13.)
What method did you use to buy your refrigerator? Was it . . . [READ 1 TO 4, ROTATING THE ORDER WITH EACH SURVEY, THEN READ 5; SELECT ALL THAT APPLY] 01 Through a catalog [SKIP TO 15] 02 Over the Internet [SKIP TO 15] 03 Over the telephone [SKIP TO 15] 04 At a retail store 05 Or some other way? [Specify]_______ [SKIP TO 15] 08 REFUSED [SKIP TO 18] 09 DON’T KNOW [SKIP TO 18]
In what city and state is the store located? CITY/TOWN: _____________________________________ STATE: _________
08 REFUSED 09 DON’T KNOW
(IF Q13=1 through 5, ASK Q15.)
What is the name of the retailer? 01 SEARS [SKIP TO 18] 02 HOME DEPOT [SKIP TO 18] 03 BEST BUY [SKIP TO 18] 04 LOWE’S [SKIP TO 18] 05 PC RICHARD /PC RICHARD & SON [SKIP TO 18] 06 OTHER (SPECIFY) 08 REFUSED 09 DON’T KNOW
THERE IS NO QUESTION 16 IF Q15 = SEARS, HOME DEPOT, BEST BUY, LOWE’S, PC RICHARDS, SKIP TO Q18]
Which of the following types of stores would you say it was? [READ LIST. ACCEPT ONE RESPONSE ONLY]
A-6

01 Appliance store 02 Furniture store 03 Department store or discount department store 04 Hardware store 05 Home improvement store [READ IF NECESSARY: THE DIFFERENCE BETWEEN A
HARDWARE STORE AND HOME IMPROVEMENT STORE IS THAT HARDWARE STORES ARE USUALLY SMALLER AND DO NOT SELL LARGER ITEMS LIKE LUMBER]
06 Drug store 07 Home furnishing store 08 Other type of store [Specify] 96 REFUSED 97 DON’T KNOW
(IF (Q11=1 OR 5) OR (Q12=1 OR 3), ASK Q18 & Q19.)
Please tell me what features were important to you in selecting your refrigerator. [DO NOT READ; PROBE; SELECT ALL THAT APPLY] 01 QUALITY; GOOD BRAND NAME 02 PRICE 03 COST TO OPERATE 04 ENERGY EFFICIENCY; SOMETHING THAT DOES NOT USE A LOT OF ELECTRICITY 05 SIZE; NEEDED SOMETHING TO FIT SPACE 06 ONLY ITEM IN STOCK 07 SPECIAL FEATURES [SPECIFY] 08 OTHER [SPECIFY] 96 REFUSED 97 DON’T KNOW
Where did you look for product information to decide which refrigerator to buy? [DO NOT READ; PROBE; SELECT ALL THAT APPLY] 01 LOOKED AT NEWSPAPER ADVERTISEMENTS OR INSERTS OR OTHER RETAILER CATALOGS
[ASK 20] 02 LOOKED ON THE INTERNET [ASK 21 TO 22] 03 CALLED RETAILERS ON THE PHONE [ASK 23 TO 26] 04 VISITED STORES [ASK 27 TO 30] 05 LOOKED AT CONSUMER REPORTS [SKIP TO 31] 06 SPOKE TO FAMILY AND FRIENDS, “WORD OF MOUTH” [SKIP TO 31] 07 OTHER [SPECIFY] [SKIP TO 31] 08 REFUSED [SKIP TO 31] 09 DON’T KNOW [SKIP TO 31]
[IF Q19=1 AND 6= 1 OR 7= 1] Did the newspaper advertisements, inserts, or catalogs display the ENERGY STAR label on any refrigerator models? 01 YES, ALL OF THEM 02 YES, SOME OF THEM 03 NO, NONE OF THEM 08 REFUSED
A-7

09 DON’T KNOW [IF Q19=2, ASK Q21 & Q22. ELSE GO TO INSTRUCTS BEFORE Q23.]
What kind of Internet sites did you look at? That is, who was the sponsor or what was the name of the site? [DO NOT READ; PROBE; CHECK ALL THAT APPLY] 01 RETAIL STORE SITES (E.G., SEARS.COM, HOMEDEPOT.COM, LOWES.COM) 02 CONSUMER SITES (E.G., CONSUMERREPORTS.ORG) 03 ENERGYSTAR.GOV 04 GETENERGYSMART.ORG 05 NYSERDA.ORG 06 NYSAPPLIANCESWAPOUT.COM 07 OTHER GOVERNMENT WEB SITES 08 MANUFACTURERS' SITES 09 UTILITY OR ELECTRIC COMPANY SITES 10 OTHER [SPECIFY] 96 REFUSED 97 DON’T KNOW
[IFQ19=2 AND 6= 1 OR 7= 1] Did the Internet sites display the ENERGY STAR logo on any refrigerator models? 01 YES, ALL OF THEM 02 YES, SOME OF THEM 03 NO, NONE OF THEM 08 REFUSED 09 DON’T KNOW
[IF Q19=3 AND 6= 1 OR 7= 1, ASK 23 OTHERWISE GO TO 25]
Did the retailers you called talk about specific refrigerator models being ENERGY STAR labeled? 01 YES, ALL OF THEM 02 YES, SOME OF THEM 03 NO, NONE OF THEM [SKIP TO 25] 08 REFUSED [SKIP TO 25] 09 DON’T KNOW [SKIP TO 25]
Did the retailers you called bring up the topic of ENERGY STAR, or did they talk about ENERGY STAR only after you specifically mentioned it? 01 RETAILERS BROUGHT IT UP 02 RETAILERS TALKED ABOUT IT ONLY AFTER I MENTIONED IT 03 SOME OF BOTH 08 REFUSED 09 DON’T KNOW
(IF Q19=3, ASK Q25.)
A-8

Did the retailers you called discuss the amount of energy different refrigerators use or the cost to operate them? 01 YES, ALL OF THEM 02 YES, SOME OF THEM 03 NO, NONE OF THEM [SKIP TO NEXT RESPONSE CHOICE IN 19, ELSE 31] 08 REFUSED [SKIP TO NEXT RESPONSE CHOICE IN 19, ELSE 31] 09 DON’T KNOW [SKIP TO NEXT RESPONSE CHOICE IN 19, ELSE 31]
Did the retailers bring up the topic of the amount of energy different refrigerators use or the cost to operate them, or did they talk about it only after you specifically mentioned it? 01 RETAILERS BROUGHT IT UP 02 RETAILERS TALKED ABOUT IT ONLY AFTER I MENTIONED IT 03 SOME OF BOTH 08 REFUSED 09 DON’T KNOW
[IF Q19=4 AND 6= 1 OR 7= 1, ASK 27 OTHERWISE GO TO 29]
Did the salesperson(s) at the retailers you visited talk about specific refrigerator models being ENERGY STAR labeled? 01 YES, ALL OF THEM 02 YES, SOME OF THEM 03 NO, NONE OF THEM [SKIP TO 29] 08 REFUSED [SKIP TO 29] 09 DON’T KNOW [SKIP TO 29]
Did the salesperson(s) bring up the topic of ENERGY STAR, or did they talk about ENERGY STAR only after you specifically mentioned it? 01 SALESPERSON(S) BROUGHT IT UP 02 SALESPERSON(S) TALKED ABOUT IT ONLY AFTER I MENTIONED IT 03 SOME OF BOTH 08REFUSED 09 DON’T KNOW
[IF Q19=4, ASK Q29 & Q30. ELSE GO TO INSTRUCTS BEFORE Q31.]
Did the salesperson(s) at the retailers you visited discuss the amount of energy different refrigerators use or the cost to operate them? 01 YES, ALL OF THEM 02 YES, SOME OF THEM 03 NO, NONE OF THEM [SKIP TO 31] 08 REFUSED [SKIP TO 31] 09 DON’T KNOW [SKIP TO 31]
Did the salesperson(s) bring up the topic of the amount of energy different refrigerators use or the cost to operate them, or did they talk about it only after you specifically mentioned it? 01 SALESPERSON(S) BROUGHT IT UP
A-9

02 SALESPERSON(S) TALKED ABOUT IT ONLY AFTER I MENTIONED IT 03 SOME OF BOTH 08 REFUSED 09 DON’T KNOW
[IF ((Q11=1 OR 5) OR (Q12=1 OR 3)) AND (6= 1 OR 7= 1), ASK 31 OTHERWISE GO TO 36]
Did the refrigerator you bought have an ENERGY STAR label on it or on the packaging or instructions? 01 YES 02 NO [SKIP TO 34] 08 REFUSED [SKIP TO 34] 09 DON’T KNOW [SKIP TO 34]
How influential was the ENERGY STAR label in your decision to purchase the refrigerator you chose? Would you say it was not at all influential, slightly influential, somewhat influential, very influential, or extremely influential? 01 NOT AT ALL INFLUENTIAL 02 SLIGHTLY INFLUENTIAL 03 SOMEWHAT INFLUENTIAL 04 VERY INFLUENTIAL 05 EXTREMELY INFLUENTIAL 08 REFUSED 09 DON’T KNOW
32a. How influential was the FTC Energy Guide label in your decision to purchase the refrigerator you did? Would you say it was not at all influential, slightly influential, somewhat influential, very influential, or extremely influential?
01 NOT AT ALL INFLUENTIAL 02 SLIGHTLY INFLUENTIAL 03 SOMEWHAT INFLUENTIAL 04 VERY INFLUENTIAL 05 EXTREMELY INFLUENTIAL 08 REFUSED 09 DON’T KNOW
Why did you buy a refrigerator with an ENERGY STAR label? [DO NOT READ. SELECT ALL THAT APPLY] 01 USES LESS ENERGY; ENERGY EFFICIENCY 02 BETTER FOR THE ENVIRONMENT 03 ENERGY STAR LABEL CONNOTES QUALITY/CHOSE ON QUALITY/BETTER OVERALL
QUALITY 04 CHOSE ON BRAND NAME 05 CHOSE ON PRICE 06 BETTER OVERALL CONSTRUCTION 07 HAD SPECIAL FEATURES I WANTED 08 HAD THE LOOK I WANTED 09 ONLY TYPE AVAILABLE
A-10

10 NO PARTICULAR REASON 11 LESS NOISE 17 TO QUALIFY FOR A REBATE 18 OTHER (SPECIFY) 96 REFUSED 97 DON’T KNOW
[ASK IF (Q31=1) AND (10a =1 OR 10b =1)]
33a. Did the ENERGY STAR refrigerator you bought earn the ENERGY STAR Most Efficient designation?
01 YES 02 NO 08 REFUSED 09 DON’T KNOW
[SKIP TO 36]
(IF Q31=2, 8 OR 9, ASK Q34.)
Did any of the refrigerators you considered buying have an ENERGY STAR label? 01 YES 02 NO [SKIP TO 36] 96 REFUSED [SKIP TO 36] 97 DON’T KNOW [SKIP TO 36]
[ASK IF 31 = 02 AND Q34=1] Why did you select a refrigerator without an ENERGY STAR label? [DO NOT READ. SELECT ALL THAT APPLY] 01 TOO EXPENSIVE 02 ENERGY STAR LABEL HAS NEGATIVE CONNOTATIONS FOR ME 03 WASN’T SURE WHAT THE LABEL MEANT 04 DIDN’T LIKE OVERALL QUALITY 05 DIDN’T LIKE OVERALL CONSTRUCTION 06 COULDN’T FIND THE SPECIAL FEATURES I LIKED 07 COULDN’T FIND THE STYLE/LOOK I LIKED 08 JUST WAS NOT A CONSIDERATION 12 OTHER (SPECIFY) 96 REFUSED 97 DON’T KNOW
The most important information we need for this study is the brand name, size in cubic feet, and model number of your new refrigerator. This information will enable us to look up the unit's efficiency information in industry directories. The model number can usually be found on the inside wall of the refrigerator. Most refrigerators show the model number above or to the left of the serial number. We do not need the serial number, only the model number. I would also like you to tell me if you see an ENERGY STAR label near the model number or on the inside door of the
A-11

refrigerator. May I ask you to please get this information for me? If you cannot walk over there with the phone, you may need to grab a pencil and paper to jot it down.
(IF Q4=1, ASK Q36a.)
36a. What is the brand name of your new refrigerator?
01 AMANA 02 FRIGIDAIRE 03 GENERAL ELECTRIC OR GE 04 KENMORE 05 KITCHEN AID 06 MAYTAG 07 SUB-ZERO 08 VIKING 09 WHIRLPOOL 10 LG 11 SAMSUNG 12 HAIER 13 OTHER [SPECIFY] 96 REFUSED 97 DON’T KNOW
(IF Q4=1, ASK Q36b.)
36b. How many cubic feet is your new refrigerator?
RECORD NUMBER __________ (RANGE = 5 to 25; 5=5 or Less; 25=25 or More; 96=REF; 97=DK)
(IF Q4=1, ASK Q36c.)
36c. What is the model number of your new refrigerator?
[READ IF NECESSARY: THE MODEL NUMBER CAN USUALLY BE FOUND ON THE INSIDE WALL OF THE REFRIGERATOR. MOST REFRIGERATORS SHOW THE MODEL NUMBER ABOVE OR TO THE LEFT OF THE SERIAL NUMBER. WE DO NOT NEED THE SERIAL NUMBER, ONLY THE MODEL NUMBER.]
RECORD VERBATIM __________ 08 REFUSED 09 DON’T KNOW
[NOTE TO INTERVIEWER: REPEAT THE MODEL NUMBER BACK TO THE RESPONDENT SLOWLY AND CHECK THAT IT IS CORRECT. IF THE RESPONDENT CANNOT TELL WHICH THE MODEL NUMBER IS, RECORD MORE THAN ONE NUMBER. MODEL NUMBER IS EXTREMELY IMPORTANT!]
A-12

(IF Q36c<>96 OR 97, ASK Q36d.)
36d. Are there any additional model number(s)?
01 YES 02 NO [SKIP TO Q36e] 08 REFUSED [SKIP TO Q36e] 09 DON’T KNOW [SKIP TO Q36e]
36d1. What are the other model numbers?
01 RECORD NUMBER __________ 08 REFUSED 09 DON’T KNOW
(IF Q4=1, ASK Q36a.)
36e. Is there an ENERGY STAR label near the model number or inside door of the refrigerator?
01 YES 02 NO 08 REFUSED 09 DON’T KNOW
[IF ANY OF 36a - 36e = DK OR REF, ASK 36f]
36f. [NOTE TO INTERVIEWER: DO NOT ASK. PLEASE CODE WHY RESPONDENT DID NOT FILL INFORMATION IN 36.]
01 REFUSED TO LOOK 02 LOOKED BUT COULD NOT FIND 03 OTHER [SPECIFY]
[IF ANY OF 36a - 36f = DK OR REF, ASK 37-38]
How is the configuration of your new refrigerator best described?? Is it … (READ)? 01 FREEZER ON TOP 02 SIDE-BY-SIDE 03 FREEZER ON BOTTOM, SINGLE DOOR ON TOP 04 FREEZER ON THE BOTTOM, DUAL OPENING FRENCH DOORS 05 OTHER [SPECIFY] 08 REFUSED 09 DON’T KNOW
Does your new refrigerator have through-the-door ice, through-the-door water, or both? 01 YES, THROUGH-THE-DOOR ICE ONLY 02 YES, THROUGH-THE-DOOR WATER ONLY 03 YES, BOTH ICE AND WATER
A-13

04 NONE 08 REFUSED 09 DON’T KNOW
A.1.2 Clothes Washer Purchaser Module
[ASK 39-68 IF Q4 = 02 AND SELECTED FOR CLOTHES WASHER MODULE]
Now I would like to ask a few questions about your new clothes washer. Was it purchased by you, a remodeling contractor, a new home builder, or the landlord? 01 RESPONDENT OR MEMBER OF HOUSEHOLD [GO TO 41] 02 REMODELING CONTRACTOR 03 HOMEBUILDER 04 LANDLORD 05 OTHER (SPECIFY:________________________) [GO TO 41] 08 REFUSED 09 DON’T KNOW
(IF Q39=2, 3, 4, 8 OR 9, ASK Q40.)
Was the specific clothes washer model selected by you or by the landlord, contractor, or builder? 01 RESPONDENT 02 LANDLORD, CONTRACTOR OR BUILDER [SKIP TO 64] 03 JOINT DECISION (E.G., CONTRACTOR/BUILDER OFFERED CHOICES FROM WHICH YOU
SELECTED) 08 REFUSED [SKIP TO 64] 09 DON’T KNOW [SKIP TO 64]
(IF (Q39=1 OR 5) OR (Q40=1 OR 3), ASK Q41.)
What method did you use to buy your clothes washer? Was it . . . [READ 1 TO 4, ROTATING THE ORDER WITH EACH SURVEY, THEN READ 5; SELECT ALL THAT APPLY] 01 Through a catalog [SKIP TO 43] 02 Over the internet [SKIP TO 43] 03 Over the telephone [SKIP TO 43] 04 At a retail store 05 Or some other way? [specify] [SKIP TO 43] 08 REFUSED [SKIP TO 46] 09 DON’T KNOW [SKIP TO 46]
In what city and state is the store located? City/Town: _____________________________________ State: _________ 08 REFUSED 09 DON’T KNOW
(IF Q41=1 through 5, ASK Q43.)
A-14

And what is the name of the retailer? 01 SEARS [SKIP TO 46] 02 HOME DEPOT [SKIP TO 46] 03 BEST BUY [SKIP TO 46] 04 LOWE’S [SKIP TO 46] 05 PC RICHARD/PC RICHARD & SON [SKIP TO 46] 06 OTHER (SPECIFY) 08 REFUSED 09 DON’T KNOW
IF Q43=SEARS, HOME DEPOT, BEST BUY, LOWES, PC RICHARDS, SKIP TO Q46.
Which of the following types of stores would you say it was? [READ LIST. ACCEPT ONE RESPONSE ONLY] 01 Appliance store 02 Furniture store 03 Department store or discount department store 04 Hardware store 05 Home improvement store [READ IF NECESSARY: THE DIFFERENCE BETWEEN A
HARDWARE STORE AND HOME IMPROVEMENT STORE IS THAT HARDWARE STORES ARE USUALLY SMALLER AND DO NOT SELL LARGER ITEMS LIKE LUMBER]
06 Drug store 07 Home furnishing store 08 Other type of store [specify] 96 REFUSED 97 DON’T KNOW
(IF (Q39=1 OR 5) OR (Q40=1 OR 3), ASK Q46 & Q47.)
THERE IS NO QUESTION 45
Please tell me what features were important to you in selecting your clothes washer. [DO NOT READ RESPONSE; PROBE; RECORD ALL THAT APPLY] 01 QUALITY; GOOD BRAND NAME 02 PRICE 03 COST TO OPERATE 04 ENERGY EFFICIENCY; SOMETHING THAT DOES NOT USE A LOT OF ELECTRICITY 05 SIZE; SOMETHING TO FIT THE SPACE 06 ONLY ITEM IN STOCK 07 SPECIAL FEATURES [SPECIFY] 08 OTHER [SPECIFY] 09 ENERGY EFFICIENCY; SOMETHING THAT DOES NOT USE A LOT OF WATER 96 REFUSED 97 DON’T KNOW
Where did you look for product information to decide which clothes washer to buy? [DO NOT READ RESPONSES; SELECT ALL THAT APPLY]
A-15

01 LOOKED AT NEWSPAPER ADVERTISEMENTS OR INSERTS OR OTHER RETAILER CATALOGS [ASK 48]
02 LOOKED ON THE INTERNET [ASK 49 TO 50] 03 CALLED RETAILERS ON THE PHONE [ASK 51 TO 54] 04 VISITED STORES [ASK 55 TO 58] 05 LOOKED AT CONSUMER REPORTS [SKIP TO 59] 06 SPOKE TO FAMILY AND FRIENDS, “WORD OF MOUTH” [SKIP TO 59] 07 OTHER [SPECIFY] _____ [SKIP TO 59] 08 REFUSED [SKIP TO 59] 09 DON’T KNOW [SKIP TO 59]
[IF Q47=1 AND 6 = 1 OR 7 = 1] Did the newspaper advertisements or inserts or catalogs display the ENERGY STAR label on any clothes washer models? 01 YES, ALL OF THEM 02 YES, SOME OF THEM 03 NO, NONE OF THEM 08 REFUSED 09 DON’T KNOW
[IF Q47=2, ASK Q49 & Q50. ELSE GO TO INSTRUCTS BEFORE Q51.]
What kind of Internet sites did you look at? That is, who was the sponsor or what was the name of the site? [DO NOT READ; MULTIPLE RESPONSE] 01 RETAIL STORE SITES (E.G., SEARS.COM, HOMEDEPOT.COM, LOWES.COM) 02 CONSUMER SITES (E.G., CONSUMERREPORTS.ORG) 03 ENERGYSTAR.GOV 04 GETENERGYSMART.ORG 05 NYSERDA.ORG 06 NYSAPPLIANCESWAPOUT.COM 07 OTHER GOVERNMENT SITES 08 MANUFACTURERS' SITES 09 UTILITY OR ELECTRIC COMPANY SITES 10 OTHER [SPECIFY] 96 REFUSED 97 DON’T KNOW
[IF Q47=2 AND 6 = 1 OR 7 = 1] Did the Internet site display the ENERGY STAR logo on any clothes washer models? 01 YES, ALL OF THEM 02 YES, SOME OF THEM 03 NO, NONE OF THEM 08 REFUSED 09 DON’T KNOW
[IF Q47=3 AND 6 = 1 OR 7 = 1, ASK 51 OTHERWISE GO TO 53]
Did the retailers you called talk about specific clothes washer models being ENERGY STAR labeled? 01 YES, ALL OF THEM
A-16

02 YES, SOME OF THEM 03 NO, NONE OF THEM [SKIP TO 53] 08 REFUSED [SKIP TO 53] 09 DON’T KNOW [SKIP TO 53]
Did the retailers you called bring up the topic of ENERGY STAR, or did they talk about ENERGY STAR only after you specifically mentioned it? 01 RETAILERS BROUGHT IT UP 02 RETAILERS TALKED ABOUT IT ONLY AFTER I MENTIONED IT 03 SOME OF BOTH 08 REFUSED 09 DON’T KNOW
(IF Q47=3, ASK Q53.)
Did the retailers you called discuss the amount of energy different clothes washers use or the costs to operate them? 01 YES, ALL OF THEM 02 YES, SOME OF THEM 03 NO, NONE OF THEM [SKIP TO NEXT RESPONSE CHOICE IN 47, ELSE 59] 08 REFUSED [SKIP TO NEXT RESPONSE CHOICE IN 47, ELSE 59] 09 DON’T KNOW [SKIP TO NEXT RESPONSE CHOICE IN 47, ELSE 59]
Did the retailers you called bring up the topic of the amount of energy different clothes washers use or the costs to operate them, or did they talk about it only after you specifically mentioned it? 01 RETAILERS BROUGHT IT UP 02 RETAILERS TALKED ABOUT IT ONLY AFTER I MENTIONED IT 03 SOME OF BOTH 08 REFUSED 09 DON’T KNOW
[IF Q47=4 AND 6 = 1 OR 7 = 1, ASK 55 OTHERWISE GO TO 57]
Did the salesperson(s) at the retailers you visited talk about specific clothes washer models being ENERGY STAR labeled? 01 YES, ALL OF THEM 02 YES, SOME OF THEM 03 NO, NONE OF THEM [SKIP TO 57] 08 REFUSED [SKIP TO 57] 09 DON’T KNOW [SKIP TO 57]
Did the salesperson(s) bring up the topic of ENERGY STAR, or did they talk about ENERGY STAR only after you specifically mentioned it? 01 SALESPERSON(S) BROUGHT IT UP 02 SALESPERSON(S) TALKED ABOUT IT ONLY AFTER I MENTIONED IT 03 SOME OF BOTH 08 REFUSED
A-17

09 DON’T KNOW [IF Q47=4, ASK Q57 & Q58. ELSE GO TO INSTRUCTS BEFORE Q59.]
Did the salespersons at the retailers you visited discuss the amount of energy different clothes washer’s use or the costs to operate them? 01 YES, ALL OF THEM 02 YES, SOME OF THEM 03 NO, NONE OF THEM [SKIP TO 59] 08 REFUSED [SKIP TO 59] 09 DON’T KNOW [SKIP TO 59]
Did the salesperson(s) bring up the topic of the amount of energy different clothes washers use or the costs to operate them, or did they talk about it only after you specifically mentioned it? 01 SALESPERSON(S) BROUGHT IT UP 02 SALESPERSON(S) TALKED ABOUT IT ONLY AFTER I MENTIONED IT 03 SOME OF BOTH 08 REFUSED 09 DON’T KNOW
[IF ((Q39=1 OR 5) OR (Q40=1 OR 3)) AND (6 = 1 OR 7 = 1), ASK 59 OTHERWISE GO TO 64]
Did the clothes washer you bought have an ENERGY STAR label on it or on the packaging or instructions? 01 YES 02 NO [SKIP TO 62] 08 REFUSED [SKIP TO 62] 09 DON’T KNOW [SKIP TO 62]
How influential was the ENERGY STAR label in your decision to purchase the clothes washer you did? Would you say it was not at all influential, slightly influential, somewhat influential, very influential, or extremely influential? 01 NOT AT ALL INFLUENTIAL 02 SLIGHTLY INFLUENTIAL 03 SOMEWHAT INFLUENTIAL 04 VERY INFLUENTIAL 05 EXTREMELY INFLUENTIAL 08 REFUSED 09 DON’T KNOW
60a. How influential was the FTC Energy Guide label in your decision to purchase the clothes washer you chose? Would you say it was not at all influential, slightly influential, somewhat influential, very influential, or extremely influential?
01 NOT AT ALL INFLUENTIAL 02 SLIGHTLY INFLUENTIAL 03 SOMEWHAT INFLUENTIAL 04 VERY INFLUENTIAL
A-18

05 EXTREMELY INFLUENTIAL 08 REFUSED 09 DON’T KNOW
Why did you buy a clothes washer with an ENERGY STAR label? [DO NOT READ. ALLOW MULTIPLE RESPONSE; PROBE] 01 USES LESS ENERGY; ENERGY EFFICIENCY 02 BETTER FOR THE ENVIRONMENT 03 ENERGY STAR LABEL CONNOTES QUALITY/CHOSE ON QUALITY/BETTER OVERALL
QUALITY 04 CHOSE ON BRAND NAME 05 CHOSE ON PRICE 06 BETTER OVERALL CONSTRUCTION 07 HAD SPECIAL FEATURES I WANTED 08 HAD THE LOOK I WANTED 09 ONLY TYPE AVAILABLE 10 NO PARTICULAR REASON 11 LESS NOISE 12 REDUCES THE AMOUNT OF WATER 13 USES LESS DETERGENT 14 SHORTENS TIME TO DRY CLOTHES/DISHES 15 REDUCES WEAR AND TEAR ON CLOTHES 17 TO QUALIFY FOR A REBATE 18 OTHER (SPECIFY) 96 REFUSED 97 DON’T KNOW
[ASK IF (Q59=1 AND (10a =1 OR 10b =1))] 61a. Did the ENERGY STAR clothes washer you bought earn the ENERGY STAR Most Efficient designation?
01 YES 02 NO 08 REFUSED 09 DON’T KNOW
[SKIP TO 64] (IF Q59=2, 8 OR 9, ASK Q62.)
Did any of the clothes washers you considered buying have an ENERGY STAR label?
01 YES 02 NO [SKIP TO 64] 08 REFUSED [SKIP TO 64] 09 DON’T KNOW [SKIP TO 64]
[ASK IF 59 = 02 AND 62=1] Why did you select a clothes washer without an ENERGY STAR label? [DO NOT READ. SELECT ALL THAT APPLY]
A-19

01 TOO EXPENSIVE 02 ENERGY STAR LABEL HAS NEGATIVE CONNOTATIONS FOR ME 03 WASN’T SURE WHAT THE LABEL MEANT 04 DIDN’T LIKE OVERALL QUALITY 05 DIDN’T LIKE OVERALL CONSTRUCTION 06 COULDN’T FIND THE SPECIAL FEATURES I LIKED 07 COULDN’T FIND THE STYLE/LOOK I LIKED 08 JUST WAS NOT A CONSIDERATION 12 OTHER (SPECIFY) 96 REFUSED 97 DON’T KNOW
(IF Q4=2, ASK Q64.)
Did you also buy a clothes dryer when you bought your clothes washer? 01 YES 02 NO [SKIP TO 66] 08 REFUSED [SKIP TO 66] 09 DON’T KNOW [SKIP TO 66]
Did your clothes dryer purchase influence your decision to purchase a particular clothes washer model? 01 YES 02 NO 08 REFUSED 09 DON’T KNOW
(IF Q4=2, ASK Q66.)
Where is the door opening on your new clothes washer; on top or on the front, similar to the door on a clothes dryer? 01 TOP 02 FRONT 08 REFUSED 09 DON’T KNOW
The most important information we need for this study is the brand name and model number of your new clothes washer. This information will enable us to look up the unit's efficiency information in industry directories. The model number can usually be found on the front of the machine or on the inside of the door. Most clothes washers show the model number above or to the left of the serial number. We do not need the serial number, only the model number. I would also like you to tell me if you see an ENERGY STAR label on the front of your new clothes washer or on the control panel. May I ask you to please get this information for me? If you cannot walk over there with the phone, you may need to grab a pencil and paper to jot it down.
(IF Q4=2, ASK Q67a.) 67a. What is the brand name of your new clothes washer?
A-20

[READ IF NECESSARY: THIS SHOULD BE ON THE FRONT OF THE MACHINE OR ON THE CONTROL PANEL.]
01 ADMIRAL 02 AMANA 03 ARISTON 04 ASKO 05 AVANTI 06 BOSCH (AXXIS / AXXIS+ /
ESSENCE / NEXXT / NEXXT PREMIUM / NEXXT PREMIUM PLATINUM / DLX)
07 DANBY DESIGNER 08 EQUATOR 09 EUROTECH 10 FISHER & PAYKEL (ECOSMART /
INTUITIVE) 11 FRIGIDAIRE 12 GENERAL ELECTRIC
(HARMONY) 13 GIBSON 14 IMPERIAL 15 KENMORE (ELITE CALYPSO /
HE3 / HE3T / HE4T) 16 KITCHEN AID (ENSEMBLE
SUPERBA) 17 LG ELECTRONICS (TROMM
(FRONT CONTROLS) / TROMM (REAR CONTROLS))
18 MALBER 19 MAYTAG (ATLANTIS /
NEPTUNE / NEPTUNE TL / NEPTUNE STACK)
20 MIELE (TOUCHTRONIC SERIES / NOVOTRONIC / SUPER NOVOTRONIC)
21 QUIETLINE 22 SAMSUNG 23 SIEMENS 24 SIMPLICITY 25 SPEED QUEEN 26 SPLENDIDE 27 STABER 28 SUMMIT 29 THOR (SOFTLINE) 30 WHIRLPOOL (CALYPSO / DUET
/ DUET HT / RESOURCE SAVER / ULITIMATE CARE)
31 OTHER (SPECIFY) 96 REFUSED 97 DON’T KNOW
[NOTE TO INTERVIEWER: THE NAMES IN PARENTHESES ARE BRAND NAMES THAT THE MANUFACTURERS HAVE ATTACHED TO SOME QUALIFIED MACHINES. THESE ARE PROVIDED BECAUSE YOU MAY HEAR THESE NAMES.]
(IF Q4=2, ASK Q67b.) 67b. What is the model number of your new clothes washer?
[READ IF NECESSARY: IT MAY BE ON THE FRONT OF THE MACHINE BUT MORE LIKELY ON THE INSIDE OF THE DOOR. MOST CLOTHES WASHERS SHOW THE MODEL NUMBER ABOVE OR TO THE LEFT OF THE SERIAL NUMBER. WE DO NOT NEED THE SERIAL NUMBER, ONLY THE MODEL NUMBER.]
RECORD VERBATIM ____________ 08 REFUSED 09 DON’T KNOW
[NOTE TO INTERVIEWER: REPEAT THE MODEL NUMBER BACK TO THE RESPONDENT SLOWLY AND CHECK THAT IT IS CORRECT. IF THE RESPONDENT CANNOT TELL WHICH
A-21

THE MODEL NUMBER IS, RECORD MORE THAN ONE NUMBER. MODEL NUMBER IS EXTREMELY IMPORTANT!]
(IF Q4=2, ASK Q67c.) 67c. Is there an ENERGY STAR label near on the front of your new clothes washer or on the control panel?
01 YES 02 NO 08 REFUSED 09 DON’T KNOW
[IF ANY OF 67a - 67c = DK OR REF, ASK 67d] 67d. [NOTE TO INTERVIEWER: DO NOT ASK. PLEASE CODE WHY RESPONDENT DID NOT FILL INFORMATION IN 67.]
01 REFUSED TO LOOK 02 LOOKED BUT COULD NOT FIND 03 OTHER [SPECIFY]
THERE IS NO QUESTION 68
A.1.3 Dishwasher Purchaser Module
[ASK 69-94 IF Q4 = 03 AND SELECTED FOR DISHWASHER MODULE]
Now I would like to ask you a few questions about your new dishwasher. Was it purchased by you, a remodeling contractor, a new home builder, or the landlord? 01 RESPONDENT OR MEMBER OF HOUSEHOLD [SKIP TO 71] 02 REMODELING CONTRACTOR 03 HOMEBUILDER 04 LANDLORD 05 OTHER [SPECIFY] ____ [SKIP TO 71] 08 REFUSED 09 DON’T KNOW
(IF Q69=2, 3, 4, 8 OR 9, ASK Q70.)
Was the specific dishwasher model selected by you or by the landlord, contractor, or builder? 01 RESPONDENT 02 LANDLORD, CONTRACTOR OR BUILDER [SKIP TO 94] 03 JOINT DECISION (FOR EXAMPLE, CONTRACTOR/BUILDER OFFERED CHOICES FROM
WHICH YOU SELECTED) 08 REFUSED [SKIP TO 94] 09 DON’T KNOW [SKIP TO 94]
A-22

(IF (Q69=1 OR 5) OR (Q70=1 OR 3), ASK Q71.)
What method did you use to buy your dishwasher? Was it . . . [READ 1 TO 4, ROTATING THE ORDER WITH EACH SURVEY, THEN READ 5; SELECT ALL THAT APPLY] 01 Through a catalog [SKIP TO 73] 02 Over the internet [SKIP TO 73] 03 Over the telephone [SKIP TO 73] 04 At a retail store 05 Or some other way? [Specify]____ [SKIP TO 73] 08 REFUSED [SKIP TO 76] 09 DON’T KNOW [SKIP TO 76]
In what city and state is the store located? City/Town: _____________________________________ State: _________ 08 REFUSED 09 DON’T KNOW
(IF Q71=1 through 5, ASK Q73.)
And what is the name of the retailer? 01 SEARS [SKIP TO 76] 02 HOME DEPOT [SKIP TO 76] 03 BEST BUY [SKIP TO 76] 04 LOWE’S [SKIP TO 76] 05 PC RICHARD/PC RICHARD & SON [SKIP TO 76] 06 OTHER (SPECIFY) 08 REFUSED 09 DON’T KNOW
IF Q73=SEARS, HOME DEPOT, BEST BUY, LOWES, OR PC RICHARD, SKIP TO Q76
THERE IS NO QUESTION 74
Which of the following types of stores would you say it was? [READ LIST. ACCEPT ONE RESPONSE ONLY] 01 Appliance store 02 Furniture store 03 Department store or discount department store 04 Hardware store 05 Home improvement store [READ IF NECESSARY: THE DIFFERENCE BETWEEN A
HARDWARE STORE AND HOME IMPROVEMENT STORE IS THAT HARDWARE STORES ARE USUALLY SMALLER AND DO NOT SELL LARGER ITEMS LIKE LUMBER]
06 Drug store 07 Home furnishing store 08 Other type of store [Specify] 96 REFUSED
A-23

97 DON’T KNOW (IF (Q69=1 OR 5) OR (Q70=1 OR 3), ASK Q76 & Q77.)
Please tell me what features were important to you in selecting your dishwasher. [DO NOT READ; PROBE; SELECT ALL THAT APPLY] 01 QUALITY; GOOD BRAND NAME 02 PRICE 03 COST TO OPERATE 04 ENERGY EFFICIENCY; SOMETHING THAT DOES NOT USE A LOT OF ELECTRICITY 05 SIZE; NEEDED SOMETHING TO FIT SPACE 06 ONLY ITEM IN STOCK 07 SPECIAL FEATURES [SPECIFY] 08 OTHER [SPECIFY] 96 REFUSED 97 DON’T KNOW
Where did you look for product information to decide which dishwasher to buy? [DO NOT READ; PROBE; SELECT ALL THAT APPLY] 01 LOOKED AT NEWSPAPER ADVERTISEMENTS OR INSERTS OR OTHER RETAILER CATALOGS
[ASK 78] 02 LOOKED ON THE INTERNET [ASK 79–80] 03 CALLED RETAILERS ON THE PHONE [ASK 81–84] 04 VISITED STORES [ASK 85–88] 05 LOOKED AT CONSUMER REPORTS [SKIP TO 89] 06 SPOKE TO FAMILY AND FRIENDS, “WORD OF MOUTH” [SKIP TO 89] 07 OTHER [SPECIFY] [SKIP TO 89] 08 REFUSED [SKIP TO 89] 09 DON’T KNOW [SKIP TO 89]
[IF Q77=1 AND 6= 1 OR 7= 1] Did the newspaper advertisements or inserts or catalogs display the ENERGY STAR label on any dishwasher models? 01 YES, ALL OF THEM 02 YES, SOME OF THEM 03 NO, NONE OF THEM 08 REFUSED 09 DON’T KNOW
[IF Q77=2, ASK Q79 & Q80. ELSE GO TO INSTRUCTS BEFORE Q81.]
What kind of Internet sites did you look at? That is, who was the sponsor or what was the name of the site? [DO NOT READ; PROBE; CHECK ALL THAT APPLY] 01 RETAIL STORE SITES (E.G., SEARS.COM, HOMEDEPOT.COM, LOWES.COM) 02 CONSUMER SITES (E.G., CONSUMERREPORTS.ORG) 03 ENERGYSTAR.GOV 04 GETENERGYSMART.ORG
A-24

05 NYSERDA.ORG 06 NYSAPPLIANCESWAPOUT.COM 07 OTHER GOVERNMENT WEBSITES 08 MANUFACTURERS' SITES 09 UTILITY OR ELECTRIC COMPANY SITES 10 OTHER [SPECIFY] 96 REFUSED 97 DON’T KNOW
[IF Q77=2 AND 6= 1 OR 7= 1] Did the Internet sites display the ENERGY STAR logo on any dishwasher models? 01 YES, ALL OF THEM 02 YES, SOME OF THEM 03 NO, NONE OF THEM 08 REFUSED 09 DON’T KNOW
[IF Q77=3 AND 6= 1 OR 7= 1, ASK 81 OTHERWISE GO TO 83]
Did the retailers you called talk about specific dishwasher models being ENERGY STAR labeled? 01 YES, ALL OF THEM 02 YES, SOME OF THEM 03 NO, NONE OF THEM [SKIP TO 83] 08 REFUSED [SKIP TO 83] 09 DON’T KNOW [SKIP TO 83]
Did the retailers you called bring up the topic of ENERGY STAR, or did they talk about ENERGY STAR only after you specifically mentioned it? 01 RETAILERS BROUGHT IT UP 02 RETAILERS TALKED ABOUT IT ONLY AFTER I MENTIONED IT 03 SOME OF BOTH 08 REFUSED 09 DON’T KNOW
(IF Q77=3, ASK Q83.)
Did the retailers you called discuss the amount of energy different dishwasher use or the costs to operate them? 01 YES, ALL OF THEM 02 YES, SOME OF THEM 03 NO, NONE OF THEM [SKIP TO NEXT RESPONSE CHOICE IN 77, ELSE 89] 08 REFUSED [SKIP TO NEXT RESPONSE CHOICE IN 77, ELSE 89] 09 DON’T KNOW [SKIP TO NEXT RESPONSE CHOICE IN 77, ELSE 89]
Did the retailers you called bring up the topic of the amount of energy different dishwashers use or the costs to operate them, or did they talk about it only after you specifically mentioned it? 01 RETAILERS BROUGHT IT UP
A-25

02 RETAILERS TALKED ABOUT IT ONLY AFTER I MENTIONED IT 03 SOME OF BOTH 08 REFUSED 09 DON’T KNOW
[IF Q77=4 AND 6= 1 OR 7= 1, ASK 85 OTHERWISE GO TO 87]
Did the salesperson(s) at the retailers you visited talk about specific dishwasher models being ENERGY STAR labeled? 01 YES, ALL OF THEM 02 YES, SOME OF THEM 03 NO, NONE OF THEM [SKIP TO 87] 08 REFUSED [SKIP TO 87] 09 DON’T KNOW [SKIP TO 87]
Did the salesperson(s) bring up the topic of ENERGY STAR, or did they talk about ENERGY STAR only after you specifically mentioned it? 01 SALESPERSON(S) BROUGHT IT UP 02 SALESPERSON(S) TALKED ABOUT IT ONLY AFTER I MENTIONED IT 03 SOME OF BOTH 08 REFUSED 09 DON’T KNOW
[IF Q77=4, ASK Q87 & Q88. ELSE GO TO INSTRUCTS BEFORE Q89.]
Did the salesperson(s) at the retailers you visited discuss the amount of energy different dishwashers use or the costs to operate them? 01 YES, ALL OF THEM 02 YES, SOME OF THEM 03 NO, NONE OF THEM [SKIP TO 89] 08 REFUSED [SKIP TO 89] 09 DON’T KNOW [SKIP TO 89]
Did the salesperson(s) bring up the topic of the amount of energy different dishwashers use or the cost to operate them, or did they talk about it only after you specifically mentioned it? 01 SALESPERSON(S) BROUGHT IT UP 02 SALESPERSON(S) TALKED ABOUT IT ONLY AFTER I MENTIONED IT 03 SOME OF BOTH 08 REFUSED 09 DON’T KNOW
[IF ((Q69=1 OR 5) OR (Q70=1 OR 3)) AND (6=1 OR 7=1), ASK 89 OTHERWISE GO TO 94]
Did the dishwasher you bought have an ENERGY STAR label on it or on the packaging or instructions? 01 YES 02 NO [SKIP TO 92] 08 REFUSED [SKIP TO 92]
A-26

09 DON’T KNOW [SKIP TO 92]
How influential was the ENERGY STAR label in your decision to purchase the dishwasher you did? Would you say it was not at all influential, slightly influential, somewhat influential, very influential, or extremely influential? 01 NOT AT ALL INFLUENTIAL 02 SLIGHTLY INFLUENTIAL 03 SOMEWHAT INFLUENTIAL 04 VERY INFLUENTIAL 05 EXTREMELY INFLUENTIAL 08 REFUSED 09 DON’T KNOW
90a. How influential was the FTC Energy Guide label in your decision to purchase the dishwasher you did? Would you say it was not at all influential, slightly influential, somewhat influential, very influential, or extremely influential?
01 NOT AT ALL INFLUENTIAL 02 SLIGHTLY INFLUENTIAL 03 SOMEWHAT INFLUENTIAL 04 VERY INFLUENTIAL 05 EXTREMELY INFLUENTIAL 08 REFUSED 09 DON’T KNOW
Why did you buy a dishwasher with an ENERGY STAR label? [DO NOT READ. SELECT ALL THAT APPLY] 01 USES LESS ENERGY; ENERGY EFFICIENCY 02 BETTER FOR THE ENVIRONMENT 03 ENERGY STAR LABEL CONNOTES QUALITY/CHOSE ON QUALITY/BETTER OVERALL
QUALITY 04 CHOSE ON BRAND NAME 05 CHOSE ON PRICE 06 BETTER OVERALL CONSTRUCTION 07 HAD SPECIAL FEATURES I WANTED 08 HAD THE LOOK I WANTED 09 ONLY TYPE AVAILABLE 10 NO PARTICULAR REASON 11 LESS NOISE 12 REDUCES THE AMOUNT OF WATER 13 USES LESS DETERGENT 14 SHORTENS TIME TO DRY CLOTHES/DISHES 17 TO QUALIFY FOR A REBATE 18 OTHER (SPECIFY) 96 REFUSED 97 DON’T KNOW
[SKIP TO 94]
A-27

(IF Q89=2, 8 OR 9, ASK Q92.)
92. Did any of the dishwashers you considered buying have an ENERGY STAR label?
01 YES 02 NO [SKIP TO 94] 08 REFUSED [SKIP TO 94] 09 DON’T KNOW [SKIP TO 94]
THERE IS NO QUESTION 92
[ASK IF 89 = 02 AND Q92=1] Why did you select a dishwasher without an ENERGY STAR label? [DO NOT READ. SELECT ALL THAT APPLY] 01 TOO EXPENSIVE 02 ENERGY STAR LABEL HAS NEGATIVE CONNOTATIONS FOR ME 03 WASN’T SURE WHAT THE LABEL MEANT 04 DIDN’T LIKE OVERALL QUALITY 05 DIDN’T LIKE OVERALL CONSTRUCTION 06 COULDN’T FIND THE SPECIAL FEATURES I LIKED 07 COULDN’T FIND THE STYLE/LOOK I LIKED 08 JUST WAS NOT A CONSIDERATION 12 OTHER (SPECIFY) 96 REFUSED 97 DON’T KNOW
The most important information we need for this study is the brand name and model number of your new dishwasher. This information will enable us to look up the unit's efficiency information in industry directories. The model number can usually be found on the inside wall of the dishwasher. Most dishwashers show the model number above or to the left of the serial number. We do not need the serial number, only the model number. I would also like you to tell me if you see an ENERGY STAR label near the model number or on the inside door of the dishwasher. May I ask you to please get this information for me? If you cannot walk over there with the phone, you may need to grab a pencil and paper to jot it down.
(IF Q4=3, ASK Q94a.)
94a. What is the brand name of your new dishwasher?
01 AMANA 02 BOSCH 03 FRIGIDAIRE 04 GENERAL ELECTRIC OR GE 05 HOTPOINT 06 JENN AIR 07 KENMORE 08 KITCHEN AID 09 LG 10 MAYTAG
A-28

11 MIELE 12 WHIRLPOOL 13 OTHER [SPECIFY] 96 REFUSED 97 DON’T KNOW
(IF Q4=3, ASK Q94b.)
94b. What is the model number of your new dishwasher?
[READ IF NECESSARY: THE MODEL NUMBER CAN USUALLY BE FOUND ON THE INSIDE WALL OF THE DISHWASHER. MOST DISHWASHERS SHOW THE MODEL NUMBER ABOVE OR TO THE LEFT OF THE SERIAL NUMBER. WE DO NOT NEED THE SERIAL NUMBER, ONLY THE MODEL NUMBER.]
RECORD VERBATIM _______________ 96 REFUSED 97 DON’T KNOW
[NOTE TO INTERVIEWER: REPEAT THE MODEL NUMBER BACK TO THE RESPONDENT SLOWLY AND CHECK THAT IT IS CORRECT. IF THE RESPONDENT CANNOT TELL WHICH THE MODEL NUMBER IS, RECORD MORE THAN ONE NUMBER. MODEL NUMBER IS EXTREMELY IMPORTANT!]
(IF Q4=3, ASK Q94c.)
94c. Is there an ENERGY STAR label near the model number or on the inside door of the dishwasher?
01 YES 02 NO 08 REFUSED 09 DON’T KNOW
[IF ANY OF 94a - 94c = DK OR REF, ASK 94d]
94d. [NOTE TO INTERVIEWER: DO NOT ASK. PLEASE CODE WHY RESPONDENT DID NOT FILL INFORMATION IN 94.]
01 REFUSED TO LOOK 02 LOOKED BUT COULD NOT FIND 03 OTHER [SPECIFY]
A.1.4 Room Air Conditioner Purchaser Module
ASK 95-125 if Q4 = 04 AND SELECTED FOR ROOM A/C MODULE]
Now I would like to ask a few questions about your room air conditioner purchase. How many new air conditioners were purchased for your home during the last 3 years?
A-29

RECORD NUMBER ____________ (RANGE=1 to 10; 10=10 or more) 96 REFUSED 97 DON’T KNOW
[IF Q95 = 96 OR 97, SKIP TO 98]
How many were window units, through-the-wall units, and portable units? [READ IF NECESSARY: THROUGH-THE-WALL AIR CONDITIONERS DIFFER FROM WINDOW UNITS IN THAT THEY NEED TO BE FITTED IN A HOLE CREATED IN THE WALL WHICH OFFERS BETTER INSULATION, AND THEY TYPICALLY REMAIN IN PLACE THROUGHOUT THE YEAR. PORTABLE UNITS ARE FREE-STANDING AND CAN BE MOVED THROUGHOUT THE HOME.]
96a. RECORD NUMBER OF WINDOW UNITS _______ (RANGE=0 to 10; 10=10 or more)
96 REFUSED 97 DON’T KNOW
96b. RECORD NUMBER OF THROUGH-THE-WALL UNITS _______ (RANGE=0 to 10; 10=10 or more)
96 REFUSED 97 DON’T KNOW
96c. RECORD NUMBER OF PORTABLE UNITS _______ (RANGE=0 to 10; 10=10 or more)
96 REFUSED 97 DON’T KNOW
[SUM OF “a” through “c” MUST EQUAL RESPONSE IN Q95.]
[ASK IF 95 > 1] Did you buy all these room air conditioners at the same time or at different times over the last 3 years? 01 ALL AT SAME TIME 02 DIFFERENT TIMES OVER THE LAST 3 YEARS 08 REFUSED 09 DON’T KNOW
[IF Q97=2, display: For the next few questions I would like you to think about the most recent room air conditioner you purchased during the last 3 years. I’d like you to think about the most recent purchase as a whole – this can include more than one room air conditioner but think of just the one purchase. (IF Q4=4, ASK Q98.)
Was it/were they purchased by you, a remodeling contractor, a new home builder, or the landlord? 01 AT LEAST ONE WAS PURCHASED BY RESPONDENT OR MEMBER OF HOUSEHOLD [SKIP
TO 100] 02 ALL PURCHASED BY REMODELING CONTRACTOR 03 ALL PURCHASED BY HOMEBUILDER 04 ALL PURCHASED BY LANDLORD 05 OTHER [SPECIFY] [SKIP TO 100] 08 REFUSED 09 DON’T KNOW
A-30

(IF Q98=2, 3, 4, 8 OR 9, ASK Q99.)
Was/were the specific room air conditioner model(s) selected by you or by the landlord, contractor or builder? 01 RESPONDENT 02 LANDLORD, CONTRACTOR OR BUILDER [SKIP TO 125] 03 JOINT DECISION (FOR EXAMPLE, CONTRACTOR/BUILDER OFFERED CHOICES FROM
WHICH YOU SELECTED ONE) 08 REFUSED [SKIP TO 125] 09 DON’T KNOW [SKIP TO 125]
(IF (Q98=1 OR 5) OR (Q99=1 OR 3), ASK Q100.)
What method did you use to buy your room air conditioner(s)? Was it . . . [READ 1 TO 4, ROTATING THE ORDER WITH EACH SURVEY, THEN READ 5; SELECT ALL THAT APPLY] 01 Through a catalog [SKIP TO 102] 02 Over the Internet [SKIP TO 102] 03 Over the telephone [SKIP TO 102] 04 At a retail store 05 OR SOME OTHER WAY? [SPECIFY] [SKIP TO 102] 08 REFUSED [SKIP TO 105] 09 DON’T KNOW [SKIP TO 105]
In what city and state is the store located? City/Town: _____________________________________ State: _________ 08 REFUSED 09 DON’T KNOW
(IF Q100=1 through 5, ASK Q102.)
And what is the name of the retailer? 01 SEARS [SKIP TO 105] 02 HOME DEPOT [SKIP TO 105] 03 BEST BUY [SKIP TO 105] 04 LOWE’S [SKIP TO 105] 05 PC RICHARD/PC RICHARD & SON [SKIP TO 105] 06 OTHER (SPECIFY) 08 REFUSED 09 DON’T KNOW
IF Q102=SEARS, HOME DEPOT, BEST BUY, LOWES OR PC RICHARD, SKIP TO 105
THERE IS NO QUESTION 103
Which of the following types of stores would you say it was? [READ LIST. ACCEPT ONE ANSWER ONLY] 01 Appliance store
A-31

02 Furniture store 03 Department store or discount department store 04 Hardware store 05 Home improvement store [READ IF NECESSARY: THE DIFFERENCE BETWEEN A
HARDWARE STORE AND HOME IMPROVEMENT STORE IS THAT HARDWARE STORES ARE USUALLY SMALLER AND DO NOT SELL LARGER ITEMS LIKE LUMBER]
06 Drug store 07 Home furnishing store 08 Other type of store [Specify] 96 REFUSED 97 DON’T KNOW
(IF Q99=1 OR 5) OR (Q100=1 OR 3), ASK Q105 & Q106.)
Please tell me what features were important to you in selecting your room air conditioner. [DO NOT READ RESPONSE; PROBE; RECORD ALL THAT APPLY] 01 QUALITY; GOOD BRAND NAME 02 PRICE 03 COST TO OPERATE 04 ENERGY EFFICIENCY; SOMETHING THAT DOES NOT USE A LOT OF ELECTRICITY 05 SIZE; COOLING CAPACITY; NEEDED SOMETHING THAT WOULD COULD COOL THE WHOLE
ROOM OR APARTMENT 06 ONLY ITEM IN STOCK 07 SPECIAL FEATURES [SPECIFY] 08 OTHER [SPECIFY] 96 REFUSED 97 DON’T KNOW
Where did you look for product information to decide which room air conditioner to buy? [DO NOT READ RESPONSES; SELECT ALL THAT APPLY] 01 LOOKED AT NEWSPAPER ADVERTISEMENTS OR INSERTS OR OTHER RETAILER CATALOGS
[ASK 107] 02 LOOKED ON THE INTERNET [ASK 108 – 109] 03 CALLED RETAILERS ON THE PHONE [ASK 110 – 113] 04 VISITED STORES [ASK 114 – 117] 05 LOOKED AT CONSUMER REPORTS [SKIP TO 118] 06 SPOKE TO FAMILY AND FRIENDS, “WORD OF MOUTH” [SKIP TO 118] 07 OTHER [SPECIFY]_____ [SKIP TO 118] 08 REFUSED [SKIP TO 118] 09 DON’T KNOW [SKIP TO 118]
[IF Q106=1 AND 6=1 OR 7=1] Did the newspaper advertisements or inserts or catalogs display the ENERGY STAR label on any room air conditioner models? 01 YES, ALL OF THEM 02 YES, SOME OF THEM 03 NO, NONE OF THEM 08 REFUSED 09 DON’T KNOW
A-32

[IF Q106=2, ASK Q108 & Q109. ELSE GO TO INSTRUCTS BEFORE Q110.]
What kind of Internet sites did you look at? That is, who was the sponsor or what was the name of the site? [DO NOT READ RESPONSES; MULTIPLE RESPONSE] 01 RETAIL STORE SITES (E.G., SEARS.COM, HOMEDEPOT.COM, LOWES.COM) 02 CONSUMER SITES (E.G., CONSUMERREPORTS.ORG) 03 ENERGYSTAR.GOV 04 GETENERGYSMART.ORG 05 NYSERDA.ORG 06 NYSAPPLIANCESWAPOUT.COM 07 OTHER GOVERNMENT WEB SITES 08 MANUFACTURERS' SITES 09 UTILITY OR ELECTRIC COMPANY SITES 10 OTHER [SPECIFY] 96 REFUSED 97 DON’T KNOW
[IF Q106=2 AND 6=1 OR 7=1] Did the Internet site or sites display the ENERGY STAR logo on any room air conditioner models? 01 YES, ALL OF THEM 02 YES, SOME OF THEM 03 NO, NONE OF THEM 08 REFUSED 09 DON’T KNOW
[IF Q106=3 AND 6=1 OR 7=1, ASK 110 OTHERWISE GO TO 112]
Did the retailers you called talk about specific room air conditioner models being ENERGY STAR labeled? 01 YES, ALL OF THEM 02 YES, SOME OF THEM 03 NO, NONE OF THEM [SKIP TO 112] 08 REFUSED [SKIP TO 112] 09 DON’T KNOW [SKIP TO 112]
Did the retailers you called bring up the topic of ENERGY STAR, or did they talk about ENERGY STAR only after you specifically mentioned it? 01 RETAILERS BROUGHT IT UP 02 RETAILERS TALKED ABOUT IT ONLY AFTER I MENTIONED IT 03 SOME OF BOTH 08 REFUSED 09 DON’T KNOW
(IF Q106=3, ASK Q112.)
Did the retailers you called discuss the amount of energy different room air conditioners use or the cost to operate them?
A-33

01 YES, ALL OF THEM 02 YES, SOME OF THEM 03 NO, NONE OF THEM [SKIP TO NEXT RESPONSE CHOICE IN 106, ELSE 118] 08 REFUSED [SKIP TO NEXT RESPONSE CHOICE IN 106, ELSE 118] 09 DON’T KNOW [SKIP TO NEXT RESPONSE CHOICE IN 106, ELSE 118]
Did the retailers you called bring up the topic of the amount of energy different room air conditioners use or the cost to operate them, or did they talk about it only after you specifically mentioned it? 01 RETAILERS BROUGHT IT UP 02 RETAILERS TALKED ABOUT IT ONLY AFTER I MENTIONED IT 03 SOME OF BOTH 08 REFUSED 09 DON’T KNOW
[IF Q106=4 AND 6=1 OR 7=1, ASK 114 OTHERWISE GO TO 116]
Did the salesperson(s) at the retailer you visited talk about specific room air conditioner models being ENERGY STAR labeled?
01 YES, ALL OF THEM 02 YES, SOME OF THEM 03 NO, NONE OF THEM [SKIP TO 116] 08 REFUSED [SKIP TO 116] 09 DON’T KNOW [SKIP TO 116]
Did the salesperson(s) bring up the topic of ENERGY STAR, or did they talk about ENERGY STAR only after you specifically mentioned it? 01 SALESPERSON(S) BROUGHT IT UP 02 SALESPERSON(S) TALKED ABOUT IT ONLY AFTER I MENTIONED IT 03 SOME OF BOTH 08 REFUSED 09 DON’T KNOW
[IF Q106=4, ASK Q116 & Q117. ELSE GO TO INSTRUCTS BEFORE Q118.]
Did the salesperson(s) at the retailer or retailers you visited discuss the amount of energy different room air conditioners use or the cost to operate them? 01 YES, ALL OF THEM 02 YES, SOME OF THEM 03 NO, NONE OF THEM [SKIP TO 118] 08 REFUSED [SKIP TO 118] 09 DON’T KNOW [SKIP TO 118]
Did the salesperson(s) bring up the topic of the amount of energy different room air conditioners use or the cost to operate them, or did they talk about it only after you specifically mentioned it? 01 SALESPERSON(S) BROUGHT IT UP 02 SALESPERSON(S) TALKED ABOUT IT ONLY AFTER I MENTIONED IT
A-34

03 SOME OF BOTH 08 REFUSED 09 DON’T KNOW
[IF ((Q99=1 OR 5) OR (Q100=1 OR 3)) AND (6=1 OR 7=1), ASK 118 OTHERWISE GO TO 125] Did [the/any of the] room air conditioner(s) you bought have an ENERGY STAR label on it, or on the packaging or instructions? 01 YES 02 NO [SKIP TO 123] 08 REFUSED [SKIP TO 123] 09 DON’T KNOW [SKIP TO 123]
[IF 118 = 01 AND Q95 > 1] How many of the room air conditioners you bought have an ENERGY STAR label on them or on the packaging or instructions? RECORD NUMBER _________ (RANGE=1 to 10; 10=10 or more) 96 REFUSED 97 DON’T KNOW
(Q118=1, ASK Q120.)
How influential was the ENERGY STAR label in your decision to purchase the room air conditioner you did? Would you say it was not at all influential, slightly influential, somewhat influential, very influential or extremely influential? 01 NOT AT ALL INFLUENTIAL 02 SLIGHTLY INFLUENTIAL 03 SOMEWHAT INFLUENTIAL 04 VERY INFLUENTIAL 05 EXTREMELY INFLUENTIAL 08 REFUSED 09 DON’T KNOW
120a. How influential was the FTC Energy Guide label in your decision to purchase the room air conditioner you did? Would you say it was not at all influential, slightly influential, somewhat influential, very influential, or extremely influential?
01 NOT AT ALL INFLUENTIAL 02 SLIGHTLY INFLUENTIAL 03 SOMEWHAT INFLUENTIAL 04 VERY INFLUENTIAL 05 EXTREMELY INFLUENTIAL 08 REFUSED 09 DON’T KNOW
THERE IS NO QUESTION 121
Why did you buy a room air conditioner with an ENERGY STAR label? [DO NOT READ; MULTIPLE RESPONSE; PROBE]
A-35

01 USES LESS ENERGY; ENERGY EFFICIENCY 02 BETTER FOR THE ENVIRONMENT 03 ENERGY STAR LABEL CONNOTES QUALITY/CHOSE ON QUALITY/BETTER OVERALL
QUALITY 04 CHOSE ON BRAND NAME 05 CHOSE ON PRICE 06 BETTER OVERALL CONSTRUCTION 07 HAD SPECIAL FEATURES I WANTED 08 HAD THE LOOK I WANTED 09 ONLY TYPE AVAILABLE 10 NO PARTICULAR REASON 11 LESS NOISE 17 TO QUALIFY FOR A REBATE 18 OTHER (SPECIFY) 96 REFUSED 97 DON’T KNOW
[SKIP TO 125] (IF Q118=2, 8 OR 9, ASK Q123.)
Did any of the room air conditioners you considered buying have an ENERGY STAR label? 01 YES 02 NO [SKIP TO 125] 08 REFUSED [SKIP TO 125] 09 DON’T KNOW [SKIP TO 125]
[ASK IF ASK 118 = 2 AND 123=1] Why did you select a room air conditioner without an ENERGY STAR label? [DO NOT READ; MULTIPLE RESPONSE; PROBE] 01 TOO EXPENSIVE 02 ENERGY STAR LABEL HAS NEGATIVE CONNOTATIONS FOR ME 03 WASN’T SURE WHAT THE LABEL MEANT 04 DIDN’T LIKE OVERALL QUALITY 05 DIDN’T LIKE OVERALL CONSTRUCTION 06 COULDN’T FIND THE SPECIAL FEATURES I LIKED 07 COULDN’T FIND THE STYLE/LOOK I LIKED 08 JUST WAS NOT A CONSIDERATION 12 OTHER (SPECIFY) 96 REFUSED 97 DON’T KNOW
The most important information we need for this study is the brand name, capacity in Btus per hour and model number of your air conditioner. This information will enable us to look up the unit's efficiency information in industry directories. The model number can usually be found on the back side of the air conditioner. Most air conditioners show the model number above or to the left of the serial number. We do not need the serial number, only the model number. I would also like you to tell me if you see an ENERGY STAR label near the model number or somewhere on the
A-36

air conditioner. May I ask you to please get this information for me? If you cannot walk over there with the phone, you may need to grab a pencil and paper to jot it down.
(IF Q4=4, ASK Q125a.)
125a. What is the brand name of your new air conditioner?
01 ADMIRAL 02 ARCTIC AIR 03 CARRIER 04 FRIGIDAIRE 05 GE 06 KENMORE 07 LG 08 MAYTAG 09 PANASONIC 10 SAMSUNG
11 SHARP 12 SUNBEAM 13 TRANE 14 WESTPOINT 15 WHIRLPOOL 16 WHITE-WESTINGHOUSE 17 FRIEDRICH 18 OTHER [SPECIFY] 96 REFUSED 97 DON’T KNOW
(IF Q4=4, ASK Q125b.)
125b. What is the capacity in Btus/hr ___?
RECORD NUMBER ________________ (RANGE=5500 to 14000; 5500=5500 or Less; 14000=14000 or More) 08 REFUSED 09 DON’T KNOW
(IF Q4=4, ASK Q125c.)
125c. What is the model number of your new air conditioner?
[READ IF NECESSARY: THE MODEL NUMBER CAN USUALLY BE FOUND ON THE BACK SIDE OF THE AIR CONDITIONER. MOST AIR CONDITIONERS SHOW THE MODEL NUMBER ABOVE OR TO THE LEFT OF THE SERIAL NUMBER. WE DO NOT NEED THE SERIAL NUMBER, ONLY THE MODEL NUMBER.]
RECORD VERBATIM _________________ 08 REFUSED 09 DON’T KNOW
[NOTE TO INTERVIEWER: REPEAT THE MODEL NUMBER BACK TO THE RESPONDENT SLOWLY AND CHECK THAT IT IS CORRECT. IF THE RESPONDENT CANNOT TELL WHICH THE MODEL NUMBER IS, RECORD MORE THAN ONE NUMBER. MODEL NUMBER IS EXTREMELY IMPORTANT!]
(IF Q4=4, ASK Q125d.)
A-37

125d. Is there an ENERGY STAR label near the model number or somewhere on the air conditioner?
01 YES 02 NO 08 REFUSED 09 DON’T KNOW
[IF ANY OF 125a - 125d = DK OR REF, ASK 125e]
125e. [NOTE TO INTERVIEWER: DO NOT ASK. PLEASE CODE WHY RESPONDENT DID NOT FILL INFORMATION IN 125.]
01 REFUSED TO LOOK 02 LOOKED BUT COULD NOT FIND 03 OTHER [SPECIFY]
A.1.5 General ENERGY STAR Summary Questions
[IF Q31=1 OR Q59=1 OR Q89=1 OR Q118=1, ASK 126-127; OTHERWISE SKIP TO INSTRUCTS BEFORE 128]
As you were shopping for the ENERGY STAR products that you purchased over the last 3 years, did you have any prior, personal experiences with ENERGY STAR products that influenced your decision to buy ENERGY STAR products again? 01 YES, I DID HAVE EXPERIENCE 02 NO, I DIDN’T HAVE EXPERIENCE 08 REFUSED 09 DON’T KNOW
Based on all your experiences with ENERGY STAR products, how likely are you to recommend ENERGY STAR-labeled products to a friend? Would you say you: 01 Definitely would not recommend 02 Probably would not recommend 03 Might or might not recommend 04 Probably would recommend 05 Definitely would recommend 08 REFUSED 09 DON’T KNOW
(IF Q4=1 through 4, ASK Q128 through Q131a.)
Have you heard of the State Energy Efficient Appliance Rebate Program that was funded through the American Recovery and Reinvestment Act, or ARRA? This program may also have been referred to as the “great appliance swap out” or “cash for appliances” program. 01 YES 02 NO [SKIP TO 131] 08 REFUSED [SKIP TO 131] 09 DON’T KNOW [SKIP TO 131]
[IF Q128 = 01, ASK Q129 AND Q130 FOR EACH APPLIANCE TYPE MENTIONED IN Q4, ELSE 131]
A-38

How influential was the State Energy Efficient Appliance Rebate Program in your decision to purchase the [INSERT PRODUCT MENTIONED IN Q4]? Would you say it was not at all influential, slightly influential, somewhat influential, very influential, or extremely influential? 01 NOT AT ALL INFLUENTIAL 02 SLIGHTLY INFLUENTIAL 03 SOMEWHAT INFLUENTIAL 04 VERY INFLUENTIAL 05 EXTREMELY INFLUENTIAL 08 REFUSED 09 DON’T KNOW
After purchasing your [INSERT PRODUCT MENTIONED IN Q4], did you file for a rebate through the State Energy Efficient Appliance Rebate Program? 01 YES 02 NO 08 REFUSED 09 DON’T KNOW
[REPEAT Q129 AND 130 FOR ADDITIONAL APPLIANCES MENTIONED IN Q4, ELSE Q131]
Based on all the information you now have about ENERGY STAR, how likely are you to buy an ENERGY STAR-labeled product in the future? Would you say you: 01 Definitely would not purchase 02 Probably would not purchase 03 Might or might not purchase 04 Probably would purchase 05 Definitely would purchase 08 REFUSED [SKIP TO ESH1] 09 DON’T KNOW [SKIP TO ESH1]
131a. Why do you feel this way? (MULTIPLE RECORD)
(IF Q131=01 or 02, SHOW ONLY CODES 01 to 04. IF Q131=04 or 05, SHOW ONLY CODES 06 to 08. ELSE SHOW ALL CODES. ALWAYS SHOW “OTHER,” “DK” AND “REF.”)
01 TOO EXPENSIVE 02 ENERGY STAR LABEL HAS NEGATIVE CONNOTATIONS FOR ME 03 STILL NOT SURE WHAT THE LABEL MEANS 04 POOR OVERALL QUALITY 05 USES LESS ENERGY; ENERGY EFFICIENCY 06 BETTER FOR THE ENVIRONMENT 07 ENERGY STAR LABEL CONNOTES BETTER OVERALL QUALITY09 TO QUALIFY FOR
A REBATE 08 OTHER [SPECIFY] 96 REFUSED 97 DON’T KNOW
A.1.6 Demographic Questions
A-39

(IF (Q4=1 through 4) OR (Q4=5 OR 9), ASK ESH1.) ESH1. In the past three years, that is since June of 2010, have you purchased a newly constructed home?
1 YES 2 NO [SKIP TO HP1] 08 REFUSED [SKIP TO HP1] 09 DON’T KNOW [SKIP TO HP1]
ESH2. Is your new home labeled as an ENERGY STAR home? This would mean that your home was tested for energy efficiency and received a score of 84 or higher, meaning that the home is at least 30% more efficient than a standard home.
1 YES 2 NO 08 REFUSED 09 DON’T KNOW
(IF (Q4=1 through 4) OR (Q4=5 OR 9), ASK HP1.) HP1. In the past three years, that is, since June of 2010, have you purchased any of the following items for your home?
a. Furnace b. Water heater c. Windows d. Attic or Wall insulation e. An addition or renovation to your home
01 YES 02 NO 08 REFUSED 09 DON’T KNOW
Now I have a few final questions for statistical purposes only. (IF (Q4=1 through 4), ASK Q132.)
Is this home a permanent or seasonal residence? 01 PERMANENT RESIDENCE 02 SEASONAL RESIDENCE 08 REFUSED 09 DON’T KNOW
(IF (Q4=1 through 4) OR (Q4=5 OR 9), ASK Q133.)
Do you own or rent your home? 01 OWN 02 RENT 03 OCCUPY WITHOUT RENT
A-40

08 REFUSED 09 DON’T KNOW
(IF (Q4=1 through 4) OR (Q4=5 OR 9), ASK Q134.)
What type of residence do you live in? Would you say…? [READ RESPONSES] 01 Single family (house on a separate lot) 02 Two to four-family building 03 Apartment in a building with five or more units 04 Town or row house (adjacent walls to another house) 05 Mobile home, house trailer 06 Other [Specify] 08 REFUSED 09 DON’T KNOW
(ASK IF LANDLINE SAMPLE AND (Q4=1 through 4).) L1. Now thinking about your telephone use…Does anyone in your household, including yourself, have a working cell phone?
01 Yes, respondent or someone in household has cell phone 02 No 08 (VOL) Refused 09 (VOL) Don’t Know
(ASK IF CELL PHONE SAMPLE AND (Q4=1 through 4).) C1. Now thinking about your telephone use, is there at least one telephone INSIDE your home that is currently working and is not a cell phone?
01 Yes, has a home telephone 02 No, no home telephone 08 (VOL) Refused 09 (VOL) Don’t Know
(IF DUAL USER HH (L1=1 OR 8 OR 9) OR (C1=1 OR 8 OR 9) ASK D1.) D1. Aside from cell phones, how many different telephone NUMBERS are there in your home? Please include only numbers that you use for phone calls, not ones you use for computers or fax machines.
_____ Record # (Range 1-97) 08 DK/No Opinion (VOL) 09 Refused (VOL)
(IF LANDLINE ONLY HH (L1=2), ASK L2.) L2. Altogether, how many different telephone NUMBERS are there in your home? Please include only numbers that you use for phone calls, not ones you use for computers or fax machines.
_____ Record # (Range 1-97)
A-41

08 DK/No Opinion (VOL) 09 Refused (VOL)
(IF (Q4=1 through 4) OR (Q4=5 OR 9), ASK Q135.)
What is the highest level of education you have completed? Would you say…? [READ CATEGORIES] 01 Less than high school 02 High school graduate 03 Technical or trade school graduate 04 Some college 05 Two-year college graduate 06 Four-year college graduate 07 Some graduate or professional school 08 Graduate or professional degree 96 REFUSED 97 DON’T KNOW
(IF (Q4=1 through 4) OR (Q4=5 OR 9), ASK Q136.)
Which of the following categories best describes your age? [READ CATEGORIES] 01 18 to 24 02 25 to 34 03 35 to 44 04 45 to 54 05 55 to 64 06 65 or over 08 REFUSED 09 DON’T KNOW
(IF (Q4=1 through 4), ASK Q138 through Q137.)
What category best describes your total household income in 2012, before taxes? [READ CATEGORIES] 01 Less than $15,000 02 $15,000 - $24,999 03 $25,000 - $34,999 04 $35,000 - $49,999 05 $50,000 - $74,999 06 $75,000 - $99,999 07 $100,000 or more 08 REFUSED 09 DON’T KNOW
What year was your home built? 01 Pre-1960 02 1960-1989 03 1990-1999 04 2000 or later 08 REFUSED
A-42

09 DON’T KNOW
How many bedrooms does your home have? 01 = 1 02 = 2 03 = 3 04 = 4 05 = 5 or more 08 REFUSED 09 DON’T KNOW
Would you describe your race as white, African American, Asian, Hispanic, or something else? 01 = White 02 = Black/African American 03 = Asian 04 = Hispanic/Latino 05 = Other (Specify) 08 REFUSED 09 DON’T KNOW
ZIP. What is your zip code?
RECORD NUMBER ______ 08 REFUSED 09 DON’T KNOW
(IF (Q4=1 through 4) OR (Q4=5 OR 9), ASK Q142.)
THERE IS NO QUESTION 141
Because it is sometimes difficult to determine on the phone, I am required to ask you your gender. 01 FEMALE 02 MALE 08 REFUSED
142a. (INTERVIEWER: IF REFUSED, RECORD BY OBSERVATION)
01 = FEMALE 02 = MALE
A.1.7 Closings
Those are all the questions I have. Thank you very much for your time and participation. Have a great day.
A-43

A.1.8 Storefront Survey
Introduction: Hello, this is [interviewer name], and I’m calling on behalf of the New York State Energy Research and Development Authority (“NYSERDA”). May I please speak with the store manager or the sales manager? (NOTE: IF STORE MANAGER IS NOT AVAILABLE ASK TO SPEAK TO ANYONE WHO is familiar with the stocking patterns or sales trends for the appliances and advanced power strips you sell, or DEALS WITH STOCKING PATTERNS AND SALES TRENDS.) [If there are two different representatives for appliances and APS, ask to speak to the appliance rep first, then try to follow-up with the APS rep.]
1 YES 2 NO [Attempt to get respondent; if respondent not available, ask if anyone else at the
establishment makes purchasing or stocking decisions. IF NOT a good time to talk, SET UP CALL BACK APPOINTMENT OR OFFER TO LET THEM CALL US BACK AT 1-800-XXX-XXXX.]
WHEN RESPONDENT IS ON THE PHONE CONTINUE WITH INTRODUCTION.
Hello, this is [interviewer name], and I’m calling on behalf of the New York State Energy Research and Development Authority (“NYSERDA”). NYSERDA is conducting a study about appliance and advanced power strip purchases in New York State as part of NYSERDA’s New York Products Program (NYPP), formerly known as the New York Energy $martSM Products Program. This program provides incentives to retailers to encourage sales of ENERGY STAR appliances and advanced power strips. Our records show that your store participated in the NYPP.
This survey should take approximately fifteen minutes to complete.
I’m not selling anything; I’d just like to ask your opinion about ENERGY STAR appliance and advanced power strip sales trends. The independent study team will keep the information confidential to the extent permitted by law. NYSERDA’s analysis will only use summary level data and will not identify individual respondents or firms.
[IF REFERRED TO CORPORATE: “Right now we are looking for input at the store level; corporate-level surveys are being conducted as another part of this study.]
[IF RESPONDENT HAS QUESTIONS FOR NYSERDA, THEY CAN CALL: Victoria Engel-Fowles at (518) 862-1090 ext. 3207]
A.1.9 Section 1. Respondent Information
RI1. Are you aware that your store participates in the NYSERDA New York Products Program (NYPP) as a retail partner?
[READ IF NECESSARY: This program provides markdown incentives to retailers to encourage sales of ENERGY STAR appliances.]
1 YES, AWARE
A-44

2 NO, [ASK TO SPEAK TO SOMEONE WHO KNOWS ABOUT THE PROGRAM, IF NO ONE AVAILABLE OR KNOWS ABOUT THE PROGRAM SET UP CALL BACK APPOINTMENT OR OFFER TO LET THEM CALL US BACK AT 1-800-XXX-XXXX.]
8 REFUSED [TERMINATE] 9 DON’T KNOW [TERMINATE]
RI2. Does your store sell any of the following types of products: [READ LIST. GET YES OR NO TO EACH].
a. Clothes washer b. Dishwashers c. Refrigerators d. Room air conditioners e. Power Strips f. None of these [THANK AND TERMINATE]
1 YES 2 NO 8 REFUSED 9 DON’T KNOW
A.1.10 Section 2. Awareness and Stocking
For these first questions, we’re going to review your stocking patterns for appliances and power strips.
ST1. First, are you familiar with the ENERGY STAR label that identifies energy-efficient models of some appliances?
1 YES [SKIP TO ST3] 2 NO 8 REFUSED 9 DON’T KNOW
ST2. The ENERGY STAR label has the word “energy” followed by a five-pointed star under a dome or half-circle. Some labels also show the continents and the oceans of the earth in a half circle. ENERGY STAR labels are used by the Environmental Protection Agency and the Department of Energy to identify and label highly energy-efficient appliances for consumers. They may appear on some appliances and other products; retail stores may also post them at entrances and other locations; they may also appear on the yellow Energy Guide label. Have you seen or heard of such a label before now?
1 YES 2 NO [THANK AND TERMINATE] 8 REFUSED [THANK AND TERMINATE] 9 DON’T KNOW [THANK AND TERMINATE]
ST3. Does your store carry products with the ENERGY STAR label?
1 YES 2 NO [THANK AND TERMINATE] 8 REFUSED [THANK AND TERMINATE] 9 DON’T KNOW [THANK AND TERMINATE]
A-45

ST4. Are you familiar with the ENERGY STAR Most Efficient designation?
1 YES [SKIP TO ST6] 2 NO 8 REFUSED 9 DON’T KNOW
ST5. ENERGY STAR Most Efficient is a new program element to identify and advance highly efficient products in the marketplace. This effort identifies the most efficient products among those that qualify for the ENERGY STAR in particular product categories. Product categories were selected and recognition criteria were established to ensure that products that receive this recognition demonstrate efficiency performance that is truly exceptional, inspirational, or leading edge and consistent with the interests of environmentally-motivated consumers and early adopters. Have you heard of such a designation before now?
1 YES 2 NO [SKIP TO ST7] 8 REFUSED [SKIP TO ST7] 9 DON’T KNOW [SKIP TO ST7]
ST6. On a scale of 0 to 10, where 0 is “not aware at all” and 10 is “extremely aware”, how aware, in general, do you think your consumers are of ENERGY STAR Most Efficient product offerings?
[Record: ___________] 11 Refused 12 Don’t know
ST7. Which of the following appliance types does your store carry that have the ENERGY STAR label? [READ LIST. ALLOW MULTIPLE ANSWERS]
1 Clothes washers 2 Dishwashers 3 Refrigerators 4 Room air conditioners 8 REFUSED [THANK AND TERMINATE] 9 DON’T KNOW [THANK AND TERMINATE]
ST7a. Does your store carry power strips that are designated as Advanced Power Strips, also known as “smart strips?” Advanced Power Strips include energy-saving capabilities for the connected products. When a primary device that is plugged into the Advanced Power Strip is in the off mode, the Advanced Power Strip shuts power off to all of the associated devices.
1 YES 2 NO 8 REFUSED 9 DON’T KNOW
ST7b. [IF ST4=1 OR ST5=1] Which of the following appliance types does your store carry that have the ENERGY STAR Most Efficient designation? [READ LIST. ALLOW MULTIPLE ANSWERS]
1 Clothes washers 2 Refrigerators 8 Other [SPECIFY: _______________]
A-46

8 REFUSED 9 DON’T KNOW
ST8. Did you carry ENERGY STAR appliances and advanced power strips before you became a NYSERDA NYPP retail partner?
1 YES 2 NO 8 REFUSED 9 DON’T KNOW
ST9. Which of the following types of NON-ENERGY STAR products do you carry on a regular basis? [READ LIST, ALLOW MULTIPLE RESPONSES]
1 Clothes washers 2 Dishwashers 3 Refrigerators 4 Room air conditioners 8 REFUSED 9 DON’T KNOW
For the next couple of questions, I’d like you to think just about the ENERGY STAR appliances and advanced power strips you sell (please note that there is no APS ES designation currently available).
ST10. First, what percentage of the [ENTER ITEM FROM ST7 (EXLUDING ROOM AIR CONDITIONERS)] on your sales floor as of January 1, 2013 were ENERGY STAR rated?
[IF ST7a =1, what percentage of power strips on your sales floor as of January 1, 2013 were Advanced Power Strips?] [ASK FOR EACH ITEM MENTIONED IN ST7 (EXCLUDING ROOM AIR CONDITIONERS)]
a. Clothes washers b. Dishwashers c. Refrigerators d. Advanced power strips Record percentage: ___________ Range = 0 to 100% 101 = Refused 102 = Don’t know
ST10aa. [IF ST10a = 102, READ LIST – STOP WHEN RESPONDENT SELECTS CATEGORY] Would you estimate that the percentage of [ENTER ITEM FROM ST7 (EXLUDING ROOM AIR CONDITIONERS)] on your sales floor as of January 1, 2013 that were ENERGY STAR rated was…
[IF ST7a =1, Would you estimate that the percentage of power strips on your sales floor as of January 1, 2013 that were Advanced Power Strips was….
a. Clothes washers b. Dishwashers c. Refrigerators d. Advanced power strips
A-47

1 Less than 10% 2 10% to less than 20% 3 20% to less than 30% 4 30% to less than 40% 5 40% to less than 50% 6 50% to less than 60% 7 60% to less than 70% 8 70% to less than 80% 9 80% to less than 90% 10 90% or more 101 REFUSED 102 DON’T KNOW
ST10a. Is the percentage of ENERGY STAR [INSERT PRODUCT FROM ST7 (EXCLUDING ROOM AIR CONDITIONERS)] currently on your sales floor any different than it was on January 1, 2013?
[IF ST7a =1, is the percentage of advanced power strips currently on your sales floor any different than it was on January 1, 2013?]
1 YES 2 NO [SKIP TO ST10c] 8 REFUSED [SKIP TO ST10c] 9 DON’T KNOW [SKIP TO ST10c]
ST10b. [ASK IF ST10a = 1] What percentage of the [INSERT PRODUCT FROM ST7 (EXCLUDING ROOM AIR CONDITIONERS)] currently on your sales floor are ENERGY STAR rated?
[IF ST7a =1, what percentage of power strips currently on your sales floor are advanced power strips?]
Record percentage: __________ Range = 0 to 100% 101 = Refused 102 = Don’t know
ST10bb. [IF ST10b = 102, READ LIST – STOP WHEN RESPONDENT SELECTS CATEGORY] Would you estimate that the percentage of the [INSERT PRODUCT FROM ST7 (EXCLUDING ROOM AIR CONDITIONERS)] currently on your sales floor are ENERGY STAR rated is…
[IF ST7a =1] Would you estimate that the percentage of power strips currently on your sales floor that are advanced power strips is…
1 Less than 10% 2 10% to less than 20% 3 20% to less than 30% 4 30% to less than 40% 5 40% to less than 50% 6 50% to less than 60% 7 60% to less than 70% 8 70% to less than 80% 9 80% to less than 90%
A-48

10 90% or more 101 REFUSED 102 DON’T KNOW
[IF ST7=4, ASK ST10c OTHERWISE GO TO ST11]
ST10c. I’d like you to think back to the summer of 2012. What percentage of the room air conditioners on your sales floor were ENERGY STAR room ACs?
Record percentage: ___________ Range 0 to 100% 101 = Refused 102 = Don’t know
ST10cc. [IF ST10bb = 102, READ LIST – STOP WHEN RESPONDENT SELECTS CATEGORY] Thinking back to the summer of 2012, would you estimate that the percentage of the room air conditioners on your sales floor was….
1 Less than 10% 2 10% to less than 20% 3 20% to less than 30% 4 30% to less than 40% 5 40% to less than 50% 6 50% to less than 60% 7 60% to less than 70% 8 70% to less than 80% 9 80% to less than 90% 10 90% or more 101 REFUSED 102 DON’T KNOW
ST11. Now please think back to January 2010. What percentage of each of these products on your sales floor as of January 1, 2010 were ENERGY STAR rated? [ONLY LIST PRODUCTS FROM ST7 (EXCLUDING ROOM AIR CONDITIONERS)]? [IF ST7a =1, Please think back to January, 2010. What percentage of power strips on your sales floor as of January, 2010 were advanced power strips?]
a. Clothes washers b. Dishwashers c. Refrigerators d. Advanced power strips
Record percentage: ___________ Range 0 to 100% 101 = Refused 102 = Don’t know 103= Not open in 2010/was not here
ST11aa. [IF RESPONDENT CANNOT PROVIDE AN EXACT PERCENTAGE, READ LIST – STOP WHEN RESPONDENT SELECTS CATEGORY] Thinking back to January 2010, would you estimate that the percentage of [ONLY LIST PRODUCTS FROM ST7 (EXCLUDING ROOM AIR CONDITIONERS)] on your sales floor that were ENERGY STAR rated was… [IF ST7a =1, Thinking back to January, 2010, would you estimate that the percentage of power strips on your sales floor that were advanced power strips was …]
A-49

1 Less than 10% 2 10% to less than 20% 3 20% to less than 30% 4 30% to less than 40% 5 40% to less than 50% 6 50% to less than 60% 7 60% to less than 70% 8 70% to less than 80% 9 80% to less than 90% 10 90% or more 101 REFUSED 102 DON’T KNOW
[IF ST7=4, ASK ST11a, OTHERWISE GO TO ST12]
ST11a. Now, I’d like you to think back to the summer of 2010. What percentage of the room air conditioners on your sales floor during the summer of 2010 were ENERGY STAR room ACs?
Record percentage: ___________ Range 0 to 100% 101 = Refused 102 = Don’t know
ST11aaa. [IF ST11a = 102] Would you estimate that the percentage of ENERGY STAR room air conditioners on your sales floor during summer 2010 was…
1 Less than 10% 2 10% to less than 20% 3 20% to less than 30% 4 30% to less than 40% 5 40% to less than 50% 6 50% to less than 60% 7 60% to less than 70% 8 70% to less than 80% 9 80% to less than 90% 10 90% or more 101 REFUSED 102 DON’T KNOW
For the next couple of questions, I’d like you to think about ALL of the appliances and power strips you sell, not just the ENERGY STAR appliances and Advanced Power Strips.
ASK ST12, ST12a, ST12b IN SEQUENCE FOR UP TO TWO PRODUCTS MENTIONED IN ST7
ST12. Between January 2010 and December 2012, did the TOTAL NUMBER OF [INSERT PRODUCT FROM RI2] MODELS you carried increase, decrease, or stay about the same? [READ IF NECESSARY: We’re asking here about all [INSERT PRODUCT TYPE FROM RI2] not just ENERGY STAR or Advanced Power Strip products.]
1 INCREASE
A-50

2 DECREASE 3 STAYED ABOUT THE SAME 8 REFUSED 9 DON’T KNOW
IF ST12 = STAYED THE SAME, DK, REF, SKIP TO ST12c.
ST12a By what percentage did the total number of [INSERT PRODUCT FROM RI2] models you carried [increase/decrease from ST12] between January 2010 and December 2012?
Record percentage: ___________ Range 0 to 100% 101 = Refused 102 = Don’t know
ST12aaa. [IF ST12a = 102) Would you estimate that the percentage of [INSERT PRODUCT FROM RI2] models you carried [increased/decreased from ST12 ] between January 2010 and December 2012?
1 Less than 10% 2 10% to less than 20% 3 20% to less than 30% 4 30% to less than 40% 5 40% to less than 50% 6 50% to less than 60% 7 60% to less than 70% 8 70% to less than 80% 9 80% to less than 90% 10 90% or more 101 REFUSED 102 DON’T KNOW
ST12b. Why did the total number of [INSERT PRODUCT FROM RI2] models you carried [increase/decrease] between January 2010 and December 2012? [DO NOT READ. MULTIPLE RESPONSE]
1 CUSTOMER DEMAND HAS INCREASED/DECREASED 2 WE ARE PROMOTING THESE MORE/LESS 3 WE ARE TRYING TO OFFER MORE ENVIRONMENTALLY FRIENDLY PRODUCTS 4 WE ARE GROWING/REDUCING [INSERT PRODUCTION FROM ST4] BUSINESS 5 OTHER [SPECIFY] ___________________ 8 REFUSED 9 DON’T KNOW
ST13. On a scale of 1 to 5, with 1 being not very helpful and 5 being extremely helpful, how well do you think the ENERGY STAR label helps consumers identify products that use less energy than other comparable products?
1 NOT VERY HELPFUL 2 3 4 5 EXTREMELY HELPFUL 8 REFUSED
A-51

9 DON’T KNOW IF ST13 < 3, ASK ST13a, OTHERWISE SKIP TO ST14
ST13a. Why do you say that?
____________________________ 1 = Gave response 8 = Refused 9 = Don’t know
ST14. On a scale of 1 to 5, with 1 being not very helpful and 5 being extremely helpful, how well do you think the Federal Trade Commission, or “FTC,” label helps consumers identify products that use less energy than other comparable products?
1 NOT VERY HELPFUL 2 3 4 5 EXTREMELY HELPFUL 8 REFUSED 9 DON’T KNOW
IF ST14 < 3, ASK ST14a, OTHERWISE SKIP TO ST15
ST14a. Why do you say that?
____________________________ 1= Gave response 8 = Refused 9 = Don’t know ST15. In your opinion, what do consumers think of when they see the ENERGY STAR label?
[DO NOT READ. MULTIPLE REPONSE]
01 SAVE MONEY ON OPERATION 02 ENERGY EFFICIENT/SAVINGS 03 ENERGY CONSERVATION 04 SAVINGS 05 ENVIRONMENTAL BENEFITS 06 ENERGY/ENVIRONMENTAL PRODUCT STANDARDS 07 ENERGY [NO LINK TO EFFICIENCY] 08 ENVIRONMENT 09 PRODUCT STANDARDS [NO ENVIRONMENTAL LINK] 10 ELECTRICITY 11 QUALITY 12 GOVERNMENT BACKING 13 CONFUSES WITH ENERGY GUIDE 14 MENTIONS SPECIFIC PRODUCTS 15 SAVE MONEY ON PURCHASE 16 NEGATIVE PERCEPTION [SPECIFY] _______ 17 HIGHER COST 18 ADDED FEATURES/FUNCTIONALITY 19 OTHER [SPECIFY] ______
A-52

98 REFUSED 99 DON’T KNOW
ST16. THERE IS NO QUESTION ST16.
Now I’d like to ask some questions about your participation as a NYSERDA retail partner.
Question Order (Note – please limit looping through the following section to a max of two appliances and one smart strip)
• IF ONE PRODUCT MENTIONED IN ST7 AND ST7a = 0, ASK ST17, TR1 – TR14 IN SEQUENCE THEN GO TO PA1
• IF TWO PRODUCTS MENTIONED IN ST7 [ASK ST17, TR1 – TR14 IN SEQUENCE THEN GO BACK TO ST17, TR1-TR14 FOR THE SECOND PRODUCT FROM ST7 THEN MOVE ON TO PA1
• NOTE: WHEN ASKING QUESTIONS PERTAINING TO ADVANCED POWER STRIPS (ST7a=1), ASK ST17a, TR1i-TR7b-i, TR10i-TR14i IN SEQUENCE THEN GO TO PA1
ST17. Would you say that because of being a NYSERDA NYPP retail partner in the past three years, your store has ….[READ LIST]
1 Carried more ENERGY STAR models 2 Carried fewer ENERGY STAR models 3 Carried the same number of different ENERGY STAR models (e.g., it hasn’t affected the
stock) 8 REFUSED 9 DON’T KNOW
[ONLY ASK IF ST7a=1]
ST17a. Would you say that because of being a NYSERDA retail partner in the past three years, your store has ….[READ LIST]
1 Carried more Advanced Power Strips 2 Carried fewer Advanced Power Strips 3 Carried the same number of different Advanced Power Strips (e.g., it hasn’t
affected the stock) 8 REFUSED 9 DON’T KNOW
A.1.11 Section 3. Sales Trends
TR1. Would your store carry as many ENERGY STAR models [INSERT PRODUCT MENTIONED FROM ST7] without the support of NYSERDA’s NYPP or not?
A-53

1 YES 2 NO [SKIP TO TR4] 8 REFUSED 9 DON’T KNOW
[ONLY ASK IF ST7a =1]
TR1i. Would your store carry Advanced Power Strips without the support of NYSERDA’s NYPP or not?
1 YES 2 NO [SKIP TO TR4i] 8 REFUSED 9 DON’T KNOW
IF TR1=1, 8, 9, ASK TR2
TR2. Would your store still advertise ENERGY STAR [INSERT PRODUCT MENTIONED FROM ST7] without the support of NYSERDA’s NYPP or not?
1 YES 2 NO 3 (VOL) MAYBE 8 REFUSED 9 DON’T KNOW
[IF ST7a =1 AND TR1i=1, 8, 9, AKS TR2i]
TR2i. Would your store still advertise Advanced Power Strips without the support of NYSERDA’s NYPP or not?
1 YES 2 NO 3 (VOL) MAYBE 8 REFUSED 9 DON’T KNOW
TR3. In your opinion, between January 2010 and December 2012, did sales of your ENERGY STAR [INSERT PRODUCT MENTIONED FROM ST7], [READ LIST]:
1 Increase 2 Decrease, 3 or stay about the same 8 REFUSED 9 DON’T KNOW
TR3a. Between January, 2010 and December, 2012, what percentage of [INSERT PRODUCT FROM ST7] sold were ENERGY STAR?
Record percentage: ___________ Range = 0 to 100% 101 = Refused 102 = Don’t know 102 = Store not open in 2010/wasn’t here then
A-54

TR3aa. [IF TR3a = 102) Would you estimate that the percentage of [INSERT PRODUCT FROM ST7] sold between January 2010 and December 2012 that were ENERGY STAR was
1 Less than 10% 2 10% to less than 20% 3 20% to less than 30% 4 30% to less than 40% 5 40% to less than 50% 6 50% to less than 60% 7 60% to less than 70% 8 70% to less than 80% 9 80% to less than 90% 10 90% or more 101 REFUSED 102 DON’T KNOW
TR3b. Between January 1, 2013 and now, did sales of your ENERGY STAR [INSERT PRODUCT FROM ST7], [READ LIST]:
1 Increase 2 Decrease 3 or stay about the same 8 REFUSED 9 DON’T KNOW
[SKIP IF TR3b = 3 OR 8 OR 9]
TR3d. In your opinion, why did sales of your ENERGY STAR [INSERT PRODUCT FROM ST7] [increase/decrease] between Jan 2013 and now? [DO NOT READ. MUTIPLE RECORD]
1 CUSTOMER DEMAND HAS INCREASED/DECREASED FROM GOVERNMENT INCENTIVES SUCH AS TAX INCENTIVES
2 WE ARE PROMOTING THESE MORE/LESS 3 GROWING/SHRINKING AWARENESS AND DEMAND FOR MORE
ENVIRONMENTALLY FRIENDLY PRODUCTS 4 WE ARE GROWING/REDUCING [INSERT PRODUCTION FROM ST4] BUSINESS 5 THE ECONOMY 6 MANUFACTURERS INCREASED PROPORTION OF ES MODELS 7 OTHER [SPECIFY] __________________________ 8 REFUSED 9 DON’T KNOW
[ONLY ASK IF ST7a =1]
TR3i. In your opinion, between January 2010 and December 2012, did sales of your Advanced Power Strips, [READ LIST]:
1 Increase
A-55

2 Decrease, 3 or stay about the same 8 REFUSED 9 DON’T KNOW
[ONLY ASK IF ST7a =1]
TR3a-i. Between January, 2010 and December, 2012, what percentage of power strips sold were Advanced Power Strips?
Record percentage: ________ Range = 0 to 100% 101 = Refused 102 = Don’t know
TR3a-ii. [IF TR3ai =102] Would you estimate that the percentage of power strips that were advanced power strips sold between January 2010 and December 2012 was…
1 Less than 10% 2 10% to less than 20% 3 20% to less than 30% 4 30% to less than 40% 5 40% to less than 50% 6 50% to less than 60% 7 60% to less than 70% 8 70% to less than 80% 9 80% to less than 90% 10 90% or more 101 REFUSED 102 DON’T KNOW
[ONLY ASK IF ST7a =1]
TR3b-i. Between January 1, 2013 and now, did sales of your Advanced Power Strips, [READ LIST]:
1 Increase 2 Decrease 3 or stay about the same 8 REFUSED 9 DON’T KNOW
[ONLY ASK IF ST7a =1]
TR3d-i. In your opinion, why did sales of your Advanced Power Strips [increase/decrease from TR3b-i] between January 2013 and now? [DO NOT READ. MULTIPLE RECORD]
1 CUSTOMER DEMAND HAS INCREASED/DECREASED FROM GOVERNMENT INCENTIVES SUCH AS ARRA OR TAX INCENTIVES
2 WE ARE PROMOTING THESE MORE/LESS 3 GROWING/SHRINKING AWARENESS AND DEMAND FOR MORE
ENVIRONMENTALLY FRIENDLY PRODUCTS
A-56

4 WE ARE GROWING/REDUCING ADVANCED POWER STRIP BUSINESS 5 THE ECONOMY 6 PURCHASED NEW ELECTRONICS 7 INCREASED PRODUCT AVAILABILITY FROM THE MANUFACTURERS 8 OTHER [SPECIFY] __________________________ 98 REFUSED 99 DON’T KNOW
TR4. Now please think about NYSERDA’s ENERGY STAR markdown promotional incentives for [INSERT PRODUCT MENTIONED FROM ST7]. If these promotional incentives were not available, do you think your sales of these appliances would be about the same, lower, or higher?
1 SAME 2 LOWER 3 HIGHER 8 REFUSED [SKIP TO TR7] 9 DON’T KNOW [SKIP TO TR7]
TR5. Why do you think this is? [DO NOT READ. CODE ALL THAT APPLY]
1 WE ADVERTISE MORE AND ATTRACT MORE BUSINESS 2 CONSUMERS WANT THESE AND FIND OUT WE HAVE THEM 3 WE HAVEN’T NOTICED ANY INCREASE FROM ADVERTISING 4 THE ADVERTISEMENTS WERE INEFFECTIVE 5 CUSTOMERS WOULD BUY WITHOUT ADVERTISING 6 ES PRODUCTS ARE EXPENSIVE SO WOULD NOT PUSH IF NO INCENTIVES TO OFFER 7 OTHER [SPECIFY] 8 REFUSED [SKIP TO TR3] 9 DON’T KNOW [SKIP TO TR3]
[ONLY ASK IF ST7a =1]
TR4i. Now please think about NYSERDA’s markdown promotional incentives for Advanced Power Strips. If these promotional incentives were not available, do you think your sales of these power strips would be about the same, lower, or higher?
1 SAME 2 LOWER 3 HIGHER 8 REFUSED [SKIP TO TR7i] 9 DON’T KNOW [SKIP TO TR7i]
[ONLY ASK IF ST7a =1]
TR5i. Why do you think this is? [DO NOT READ. CODE ALL THAT APPLY]
1 WE ADVERTISE MORE AND ATTRACT MORE BUSINESS 2 CONSUMERS WANT THESE AND FIND OUT WE HAVE THEM 3 WE HAVEN’T NOTICED ANY INCREASE FROM ADVERTISING
A-57

4 THE ADVERTISEMENTS WERE INEFFECTIVE 5 CUSTOMERS WOULD BUY WITHOUT ADVERTISING 6 ES PRODUCTS ARE EXPENSIVE SO WOULD NOT PUSH IF NO INCENTIVES TO
OFFER 7 OTHER [SPECIFY] 8 REFUSED [SKIP TO TR7i] 9 DON’T KNOW [SKIP TO TR3i]
TR6. [ASK IF TR4=2 OR 3] By what percentage do you estimate your store’s sales of ENERGY STAR [INSERT PRODUCT MENTIONED FROM ST7] would be [TR4 higher/lower] if the NYPP ENERGY STAR promotional incentives were not available?
Record percentage: ___________ Range = 0 to 100% 101 = Refused 102 = Don’t know
TR6a. [IF TR6 = 102] Using the following categories, By what percentage do you estimate your store’s sales of ENERGY STAR [INSERT PRODUCT MENTIONED FROM ST7] would be [TR4 higher/lower] if the NYPP ENERGY STAR promotional incentives were not available? Would you say…
1 Less than 10% 2 10% to less than 20% 3 20% to less than 30% 4 30% to less than 40% 5 40% to less than 50% 6 50% to less than 60% 7 60% to less than 70% 8 70% to less than 80% 9 80% to less than 90% 10 90% or more 8 REFUSED 9 DON’T KNOW
[READ: I want to make sure I understand you correctly. You are saying that [TR3a Answer] of your company’s [INSERT PRODUCT MENTIONED FROM ST7] sales were ENERGY STAR between January 2010 and December 2012 and that without the NYPP your [INSERT PRODUCT MENTIONED FROM ST7] ENERGY STAR sales would have been [TR3a Answer – TR6 answer]]. Is this correct? [IF NOT CLARIFY ANSWERS]
TR6b. [IF TR4=1 OR TR4=3 ASK] Why do you think sales would have been [SAME/HIGHER] in absence of the NYPP?
[RECORD ANSWER; PROBE FOR LACK OF ANY INFLUENCE OF THE PROGRAM]: ___________________________________________________________ 1 = Gave response 8 = Refused 9 = Don’t know
[SKIP TO TR7]
A-58

[ONLY ASK IF ST7a =1]
TR6i. [ASK IF TR4i=2 OR 3] By what percentage do you estimate your store’s sales of Advanced Power Strips would be [TR4i higher/lower] if the ENERGY STAR promotional incentives for Advanced Power Strips were not available?
Record percentage: ___________ Range = 0 to 100% 101 = Refused 102 = Don’t know
TR6ii. [IF TR6i = 102 Using the following categories, by what percentage do you estimate your store’s sales of Advanced Power Strips would be [TR4i higher/lower] if the ENERGY STAR promotional incentives for Advanced Power Strips were not available?
1 Less than 10% 2 10% to less than 20% 3 20% to less than 30% 4 30% to less than 40% 5 40% to less than 50% 6 50% to less than 60% 7 60% to less than 70% 8 70% to less than 80% 9 80% to less than 90% 10 90% or more 101 REFUSED 102 DON’T KNOW
[READ: I want to make sure I understand you correctly. You are saying that [TR3a Answer] of your company’s power strip sales were Advanced Power Strips between January 2010 and December 2012 and that without the NYPP your Advanced Power Strips sales would have been [TR3a Answer – TR6 answer]].
Is this correct? [IF NOT CLARIFY ANSWERS]
TR6ii. [IF TR4i=1 OR TR4i=3 ASK] Why do you think sales would have been [SAME/HIGHER] in absence of the NYPP?
[RECORD ANSWER; PROBE FOR LACK OF ANY INFLUENCE OF THE PROGRAM]: ___________________________________________________________ 1 = Gave response 8 = Refused 9 = Don’t know
[ONLY ASK IF (ST7b=1 OR ST7b=2)]
TR7. In your opinion, since the emergence of the ENERGY STAR Most Efficient designation, have sales of your ENERGY STAR Most Efficient [INSERT PRODUCT MENTIONED FROM ST7b], [READ LIST]:
1 Increased
A-59
2 Decreased 3 or stayed about the same 8 REFUSED 9 DON’T KNOW
TR7i. THERE IS NO QUESTION TR7i
TR7a. How about between January 1, 2013 and now, did sales of your ENERGY STAR Most Efficient [INSERT PRODUCT FROM ST7], [READ LIST]:
1 Increase 2 Decrease 3 or stay about the same [SKIP TO TR7d] 8 REFUSED [SKIP TO TR7d] 9 DON’T KNOW [SKIP TO TR7d]
TR7b. Between January 1, 2013 and now, what percentage of [INSERT PRODUCT FROM ST7] sold were ENERGY STAR Most Efficient?
Record percentage: ___________ Range = 0 to 100% 101 = Refused 102 = Don’t know
TR7bb. [IF TR7b = 102)] RESPONDENT CANNOT PROVIDE AN EXACT PERCENTAGE, READ LIST – STOP WHEN RESPONDENT SELECTS CATEGORY]
1 Less than 10% 2 10% to less than 20% 3 20% to less than 30% 4 30% to less than 40% 5 40% to less than 50% 6 50% to less than 60% 7 60% to less than 70% 8 70% to less than 80% 9 80% to less than 90% 10 90% or more 8 REFUSED 9 DON’T KNOW
TR7c. In your opinion, why did sales of your ENERGY STAR Most Efficient[INSERT PRODUCT FROM ST7] [increase/decrease] between Jan 2013 and now? [DO NOT READ. MULTIPLE RESPONSE]
1 CUSTOMER DEMAND HAS INCREASED/DECREASED FROM GOVERNMENT INCENTIVES SUCH AS TAX INCENTIVES
2 WE ARE PROMOTING THESE MORE/LESS 3 GROWING/SHRINKING AWARENESS AND DEMAND FOR MORE
ENVIRONMENTALLY FRIENDLY PRODUCTS 4 WE ARE GROWING/REDUCING [INSERT PRODUCTION FROM ST4] BUSINESS 5 THE ECONOMY 6 OTHER [SPECIFY] __________________________ 8 REFUSED 9 DON’T KNOW
[ONLY ASK IF (ST7b=1 OR ST7b=2)]
A-60

TR7d. How do your sales of the Most Efficient qualified [INSERT PRODUCT FROM ST7] compare to your sales of your other ENERGY STAR [INSERT PRODUCT FROM ST7]? Would you say they are less than, the same, or greater than sales of your other ENERGY STAR [INSERT FROM PRODUCT ST7?]
1 Less than 2 The same 3 Greater than 8 REFUSED 9 DON’T KNOW
[IF TR7d = 1 OR TR7d = 3]
TR7dd. By what percentage do you think this is?
[Record: ___________] Range = 0 to 100% 101 = Refused 102 = Don’t know
[SKIP TO TR8]
[ONLY ASK TR8-TR9a ONCE FOR THE FIRST PRODUCT]
TR8. During the existence of the State Energy Efficient Appliance Rebate Program or other ARRA funded programs , did your store provide information to consumers either through advertising or direct salesperson communication on the benefits of the rebate program for ENERGY STAR appliances or not?
1 YES 2 NO 8 REFUSED 9 DON’T KNOW
TR9. In your opinion, what impact, if any, did consumer awareness of the State Energy Efficient Appliance Rebate Program or other ARRA rebates on Energy Star appliances have on your 2010 sales of ENERGY STAR appliances?
1 INCREASED SALES 2 DECREASED SALES 3 HAD NO IMPACT [GO TO TR10] 8 REFUSED [GO TO TR10] 9 DON’T KNOW [GO TO TR10]
TR9a By what percentage do you think 2010 sales [increased/decreased] as a result of consumer awareness of the ARRA rebates on Energy Star appliances?
Record percentage: ___________ Range = 0 to 100% 101 = Refused 102 = Don’t know
TR9aa. [IF TR9a = 102] Could you please estimate by what percentage you think 2010 sales [increased/decreased[TR9] as a result of consumer awareness of the ARRA rebates on Energy Star appliances?
A-61

1 Less than 10% 2 10% to less than 20% 3 20% to less than 30% 4 30% to less than 40% 5 40% to less than 50% 6 50% to less than 60% 7 60% to less than 70% 8 70% to less than 80% 9 80% to less than 90% 10 90% or more 101 REFUSED 102 DON’T KNOW
Now I’d like to ask about consumer demand for ENERGY STAR products and Advanced Power Strips.
TR10. Thinking about shoppers in your store over the past few years, would you say consumer demand for ENERGY STAR [INSERT PRODUCT FROM ST7] has [READ LIST]:
1 INCREASED SIGNIFICANTLY 2 INCREASED SOMEWHAT 3 REMAINED THE SAME [GO TO TR12] 4 DECREASED SOMEWHAT [GO TO TR11] 5 DECREASED SIGNIFICANTLY [GO TO TR11] 8 REFUSED [GO TO TR12] 9 DON’T KNOW [GO TO TR12]
TR10a. On a scale of 1 to 5, where 1 is not at all important and 5 is very important, how important was the NYPP in helping to bring about this increase in consumer demand for ENERGY STAR products?
1 NOT AT ALL IMPORTANT 2 3 4 5 VERY IMPORTANT 8 REFUSED 9 DON’T KNOW
[SKIP TO TR11]
TR10i. Thinking about shoppers in your store over the past few years, would you say consumer demand for Advanced Power Strips has [READ LIST]:
1 INCREASED SIGNIFICANTLY 2 INCREASED SOMEWHAT 3 REMAINED THE SAME [GO TO TR12i] 4 DECREASED SOMEWHAT [GO TO TR11i] 5 DECREASED SIGNIFICANTLY [GO TO TR11i] 8 REFUSED [GO TO TR12i] 9 DON’T KNOW [GO TO TR12i]
A-62

TR10a-i. On a scale of 1 to 5, where 1 is not at all important and 5 is very important, how important was the NYPP in helping to bring about this increase in consumer demand for Advanced Power Strip products?
1 NOT AT ALL IMPORTANT 2 3 4 5 VERY IMPORTANT 8 REFUSED 9 DON’T KNOW
[SKIP TO TR12i]
TR11. I’m going to read you a list of factors that may or may not have had an effect on consumer demand for ENERGY STAR [INSERT PRODUCT TYPE FROM ST7]. For each one, please tell me if the factor had a positive effect, a negative effect or no effect on consumer demand for this type of ENERGY STAR product. [INTERVIEWER NOTE: IF ‘BOTH POSITIVE AND NEGATIVE’ PROBE ONCE TO GET AT THE NET EFFECT AS POSITIVE OR NEGATIVE]
a. The economy b. Higher energy prices c. New Federal standards to improve the energy efficiency of appliances d. State standards for appliances e. State-level promotional activities f. Environmental concerns g. New or improved energy-efficient appliance technologies h. The sales of competing retailers i. NYSERDA’s NYPP ALWAYS READ LAST: j. Were there any other factors that had an effect on consumer demand for this type of
Energy Star product? (SPECIFY_____________________) IF YES: Was it a positive effect, negative effect?
TR12. POSITIVE
(THEN CLARIFY 1. Small positive 2.Moderate positive 3 Large positive effect
NEGATIVE
(THEN CLARIFY 4. Small negative 5.Moderate negative 6. Large negative effect
7 NO EFFECT 8 REFUSED 9 DON’T KNOW
A-63

[SKIP TO TR12]
TR13. Did you have an expectation that ENERGY STAR [INSERT PRODUCT MENTIONED FROM ST7] sales would increase through your participation in NYSERDA’s NYPP or not?
1 YES 2 NO 8 REFUSED 9 DON’T KNOW
[SKIP TO TR13]
TR12i. Did you have an expectation that Advanced Power Strip sales would increase through your participation in NYSERDA’s NYPP or not?
1 YES 2 NO 8 REFUSED 9 DON’T KNOW [SKIP TO TR13i]
TR13 What would you estimate was the average monthly total of [INSERT PRODUCT MENTIONED FROM ST7 (EXCLUDING ROOM AIR CONDITIONERS)] units sold over the time period of January, 2010 to December, 2012?]
_____ RECORD NUMBER OF UNITS PER MONTH 8 REFUSED 9 DON’T KNOW
TR13a What would you estimate was the average annual total of Room Air Conditioner units sold over the time period of January, 2010 to December, 2012?]
_____ RECORD NUMBER OF UNITS PER YEAR 8 REFUSED 9 DON’T KNOW
[REPEAT TR1-TR13 FOR ADDITIONAL PRODUCT MENTIONED IN ST7, OR IF ST7a =1 DO TR1i-TR13i, ELSE SKIP TO PA1]
TR13i. What would you estimate was the average monthly total of power strips sold over the time period of January, 2010 to December, 2012?]
_____ RECORD NUMBER OF UNITS PER MONTH 8 REFUSED 9 DON’T KNOW
A-64

A.1.12 Section 4. Promotion/Advertising Practices
PA1. Which, if any, of the following media do you use to advertise ENERGY STAR products [IF ST7a=1 ASK: and advanced power strips? [READ LIST, MULTIPLE RESPONSE]
1 Newspaper 2 Radio 3 TV 4 Web site (specify: _______________________) 5 Social Media (specify: __________________) 6 Yellow Pages 7 Other (specify: _______________________) 8 None 8 REFUSED 9 DON’T KNOW
A.1.13 Section 5: Appliance Pricing
[FOR EACH PRODUCT MENTIONED IN ST7, ASK PR1 THROUGH PR3 (PR4i for APS) THEN RETURN TO PR1 AND BEGIN ASKING THE QUESTIONS FOR THE NEXT PRODUCT MENTIONED IN ST7 AND ST7a =1. ONCE COMPLETE, MOVE ONTO F1.]
PR1. Now I would like to ask you a few questions about your [INSERT PRODUCT MENTIONED FROM ST7] pricing. Some retailers use something called “keystone pricing,” where the retail price is set at twice the wholesale price. Is this how you determine the retail price for the ENERGY STAR [INSERT PRODUCT MENTIONED FROM ST7] you sell or do you use a different method?
1 YES, USE KEYSTONE PRICING [SKIP TO PR3] 2 NO, USE DIFFERENT METHOD 8 REFUSED [SKIP TO PR3] 9 DON’T KNOW [SKIP TO PR3]
[SKIP TO PR2]
PR1i. Now I would like to ask you a few questions about your Advanced Power Strip pricing. Some retailers use something called “keystone pricing,” where the retail price is set at twice the wholesale price. Is this how you determine the retail price for the Advanced Power Strips you sell or do you use a different method?
1 YES, USE KEYSTONE PRICING [SKIP TO PR3i] 2 NO, USE DIFFERENT METHOD 8 REFUSED [SKIP TO PR3i] 9 DON’T KNOW [SKIP TO PR3i]
[SKIP TO PR2i]
A-65

PR2. How do you determine the retail price for the ENERGY STAR [INSERT PRODUCT MENTIONED FROM ST7] you sell?
1 CORPORATE OFFICE DECIDES 2 PERCENTAGE PRICING -- EVERYTHING IS MARKED UP A PERCENTAGE OTHER THAN 100% 3 WE PRICE TO COMPETE WITH OTHER RETAILERS 4 OTHER [SPECIFY] 8 REFUSED 9 DON’T KNOW
[SKIP TO PR3]
PR2i. How do you determine the retail price for the Advanced Power Strips you sell?
1 CORPORATE OFFICE DECIDES 2 PERCENTAGE PRICING -- EVERYTHING IS MARKED UP A PERCENTAGE OTHER
THAN 100% 3 WE PRICE TO COMPETE WITH OTHER RETAILERS 4 OTHER [SPECIFY] 8 REFUSED 9 DON’T KNOW
[SKIP TO PR3i]
PR3. Are the ENERGY STAR [INSERT PRODUCT MENTIONED FROM ST7] priced higher, lower, or about the same as similar, non-ENERGY STAR [INSERT PRODUCT MENTIONED FROM ST7] in your store?
1 HIGHER 2 LOWER 3 ABOUT THE SAME [ASK PR1-PR4 FOR EACH ADDITIONAL PRODUCT MENTIONED
IN ST7, OR IF ST7a =1 ASK PR1i-PR4i, ELSE SKIP TO PS1] 8 REFUSED [ASK PR1-PR4 FOR EACH ADDITIONAL PRODUCT MENTIONED
IN ST7, OR IF ST7a =1 ASK PR1i-PR4i, ELSE SKIP TO PS1] 9 DON’T KNOW [ASK PR1-PR4 FOR EACH ADDITIONAL PRODUCT MENTIONED
IN ST7, OR IF ST7a =1 ASK PR1i-PR4i, ELSE SKIP TO PS1] [SKIP TO PS1]
PR3i. Are the Advanced Power Strips priced higher, lower, or about the same as similar, traditional power strips in your store?
1 HIGHER 2 LOWER 3 ABOUT THE SAME [SKIP TO PS1] 8 REFUSED [SKIP TO PS1] 9 DON’T KNOW [SKIP TO PS1]
A-66

[SKIP TO PR4i]
[ASK PR1-PR3 FOR EACH ADDITIONAL PRODUCT MENTIONED IN ST7, OR IF ST7a =1 ASK PR1i-PR4i, ELSE SKIP TO PS1]
PR4i. By what percentage are the Advanced Power Strips priced [PR3, higher/lower] than traditional power strips in your stores?
Record percentage: ___________ Range = 0 to 100% 101 = Refused 102 = Don’t know
PR4ii. [IF PR41 = 102] Could you please estimate by what percentage the Advanced Power Strips are priced [PR3, higher/lower] than traditional power strips in your stores?
1 Less than 10% 2 10% to less than 20% 3 20% to less than 30% 4 30% to less than 40% 5 40% to less than 50% 6 50% to less than 60% 7 60% to less than 70% 8 70% to less than 80% 9 80% to less than 90% 10 90% or more 101 REFUSED 9102 DON’T KNOW
A.1.14 Section 6: Program Satisfaction
I have some questions about your participation in and satisfaction with the NYSERDA NYPP.
PS1. Using a scale of 0 to 10 where 0 = very dissatisfied and 10 = very satisfied, how satisfied have you been with the program managers, contractor and other staff involved in delivering the NYSERDA NYPP?
a. [ASK ONLY IF PS1 = 0-5] Why do you say that? 1 Gave Response 8 = Refused 9 = Don’t know
PS2. Using the same scale, how would you rate your level of satisfaction with the NYPP in general?
a. [ASK ONLY IF PS2 = 0-5] Why do you say that? 1 Gave Response 8 = Refused 9 = Don’t know
PS3. In what way could the program process be improved? 1 Gave response 8 = Refused 9 = Don’t know
PS4. Using a scale of 0 to 10 where 0 = very dissatisfied and 10 = very satisfied, how satisfied have you been with the NYPP’s marketing support? 0 to 10 11 = Refused 12 = Don’t know
PS4a. Do you have any suggestions for improvement of the NYPP’s marketing support?
A-67

1 Gave Response 8 = Refused 9 = Don’t know
PS5. In 2013, NYPP began focusing on the highest tiers of energy efficient products for refrigerators and clothes washers and requiring retailers to use buy down/markdown for products, no longer just marketing promotions. Were you aware of this change?
1 Yes 2 No 8 Refused 9 Don’t know a. [IF PS5 =1] What effect did this change have on your involvement with the NYPP?
[PROBE FOR SPECIFICS, ESPECIALLY INCREASE OR DECREASE] 1 = Gave response 8 = Refused 9 = Don’t know
b. [IF PS5 = 1] How do you feel about these changes? Do you feel they are positive,
negative, or neutral? Why? [PROBE FOR REACTION TO CHANGES] _____________________________________________________________________ 1 = Gave response 8 = Refused 9 Don’t know
c. [IF PS5 = 2] How do you typically receive information pertaining to NYSERDA’s NYPP? 1 = Gave response 8 = Refused 9 = Don’t know
PS6. Are you planning to participate in the NYPP going forward?
1. Yes 2. No 8. Refused 9. Don’t know
a. (IF PS6 = 1 or 2) Why do you say that? 1 = Gave response 8 = Refused 9 = Don’t know
PS7. Is there anything else you would like to tell me about the NYPP? 1 = Gave response 8 = Refused 9 = Don’t know
A.1.15 Section 7: Firmographics
Finally, I have a few questions about your store characteristics. (ASK ALL F1 to F6).
F1. Would you consider this store independently-owned, a franchise, or part of a corporation?
1 INDEPENDENTLY-OWNED 2 FRANCHISE 3 CORPORATE OWNED 4 (VOL) OTHER (SPECIFY)______________________ 8 REFUSED 9 DON’T KNOW
F2. What is the square footage of the store’s sales area? Your best estimate is fine.
1 < 100
A-68

2 100 – 499 3 500 – 999 4 1,000 – 2,499 5 2,500 – 4,999 6 5,000 – 9,999 7 > 10,000 8 REFUSED 9 DON’T KOW
F3. How many employees work at this particular store location?
1 < 5 2 5-9 3 10-19 4 20-49 5 50-99 6 > 100 8 REFUSED 9 DON’T KNOW
F4. In which category would you place your store? Is it a … [READ RESPONSES, ALLOW ONE RESPONSE ONLY]
1 Mass merchandiser (such as Target, Walmart). 2 Club Store (such as Costco or BJs) 3 Discount store (such as Big Lots or a 99¢ store). 4 Large home improvement (such as Home Depot or Lowe’s). 5 Hardware (such as ACE Hardware). 6 Grocery (such as Safeway or Kroger). 7 Drug store (such as Rite Aid). Other (SPECIFY)______________________ 8 REFUSED 9 DON’T KNOW
F5. What is your FIRST name?
RECORD FIRST NAME _________ 1 Gave response 8 REFUSED
F6. What is your job title?
RECORD JOB TITLE ____________ 1 Gave response 8 REFUSED
CLOSING: Those are all the questions I have. Thank you so much for your time today. We really appreciate your participation in this important study. Have a nice day.
A-69

A.2 Participating Corporate Retailer Interview Guide
New York Products Program Interview Guide for Corporate Retailers, 2013
Interviewer:
Retailer Name: City and State:
Contact Name: Contact Title:
Phone: E-mail:
Respondent’s overall responsibility:
Date: Comments:
Introduction [FOR INTERVIEWERS]
Contact Protocol
• Call potential respondents to ascertain the most appropriate respondent. Obtain e-mail address(es) of appropriate respondents. If the company refuses an interview, determine the reasons for refusal, and, if it is logistical in nature, try to find a work-around.
• Send an e-mail interview invitation to the appropriate respondent. This invitation will include:
o Explanation of the purpose and scope of the interview.
o Explanation of the time frame within which the interview will need to be completed.
o Explanation of the expected duration of the interview and required flexibility to complete the interview over multiple sessions.
o Instructions to propose a convenient interview time.
o Contact information for interviewers.
o Confidentiality assurances.
o A letter attachment from NYSERDA explaining the importance of the interview.
If the target respondent does not respond to the e-mail invitation within a few days, a follow-up call will be made to try to schedule an interview time, find an alternate interview target, or determine reasons for refusal.
A-70

Once an interview time has been arranged, the respondent will be e-mailed a copy of the interview guide.
At the beginning of the interview, information will be collected on the respondent’s position and overall responsibilities.
Product Offerings 1. According to our records, your company has participated in the NYSERDA New York Products Program
(NYPP), formerly known as the New York Energy $martSM Products Program. In addition to buy downs, this
program shares the cost of advertising with retailers to promote ENERGY STAR appliances in New York. I’d
like to ask you some questions about how this program has impacted your company’s offering, pricing, and
sales trends of ENERGY STAR appliances and [Read where applicable: Advanced Power Strips] in New York
and elsewhere. First, can you tell me which of the following appliances and products, promoted by funding
through NYSERDA’s Products Program, you sell in New York? [Allow for multiple answers]
1. Clothes washers
2. Dishwashers
3. Refrigerators
4. Room air conditioners
5. Advanced Power Strips (APS), also known as “smart” strips
2. [For each product(s) mentioned in Q1, ask:] Do you offer these same ENERGY STAR or [READ IF Q1=5:
Advanced Power Strip] products to all of your stores outside of New York, some of your stores outside of New
York, or no other stores outside of New York?
a) Clothes Washers
a. Yes, everywhere
b. Yes, some stores
c. No other stores outside of New York
b) Dishwashers ____
a. Yes, everywhere
b. Yes, some stores
c. No other stores outside of New York
c) Refrigerators ____
A-71

a. Yes, everywhere
b. Yes, some stores
c. No other stores outside of New York
d) Room Air Conditioners ___
a. Yes, everywhere
b. Yes, some stores
c. No other stores outside of New York
e) Advanced Power Strips ___
a. Yes, everywhere
b. Yes, some stores
c. No other stores outside of New York
3. [For each product(s) where Q2=a or b, ask:] Do you offer these same ENERGY STAR [PRODUCT][ASK IF
Q1=5: or Advanced Power Strips] to retailers in [COMPARISON AREA]?
a) Clothes Washers
a. Yes
b. No
c. Don’t know
b) Dishwashers ____
a. Yes
b. No
c. Don’t know
c) Refrigerators ____
a. Yes
b. No
c. Don’t know
d) Room Air Conditioners ___
a. Yes
b. No
A-72

c. Don’t know
e) Advanced Power Strips ___
a. Yes
b. No
c. Don’t know
4. [If Q2 = a or b for any product] Do you recall factors that influenced your decision to start selling the same
[Insert product(s) mentioned from Q1] as promoted by New York Products Program to your stores outside of
New York? [DO NOT READ, BUT PROMPT IF NECESSARY]
a. Offer inventory comparable to competitors
b. Requests by retailer customers
c. We offer similar products to all our retailers
d. Economies of scale in manufacturing these products
e. Consumer demand
f. Utility or program administrator sponsored programs
g. Government sponsored programs
h. Other [Specify] _________________________________
5. If Q2 = b or c for any product] Why are there differences in product offerings in New York vs. what is offered
to retailers outside of New York? [PROBE FOR PROGRAM IMPACT]
___________________________________________________________________
6. On a scale of 1 to 5, where 1 is “no influence” and 5 is “significant influence,” how much influence has the
New York Products Program had on the mix of model types of [INSERT PRODUCT] you supplied to stores
outside of New York from 2010 to 2012?
a) Clothes Washers ___
b) Dishwashers ____
c) Refrigerators ____
d) Room Air Conditioners ___
e) Advanced Power Strips ____
A-73

7. On a scale of 1 to 5, where 1 is “no influence” and 5 is “significant influence,” how much influence have other
utility sponsored energy efficiency programs had on the mix of model types of [INSERT PRODUCT] you
supplied to stores outside of New York during 2010-2012?
a) Clothes Washers ___
b) Dishwashers ____
c) Refrigerators ____
d) Room Air Conditioners ___
e) Advanced Power Strips ____
8. If [6 >1 or 7>1], please describe how the New York Products Program [IF 7>1 READ: or other utility
sponsored energy efficiency programs] influenced the mix of model types you supply to stores outside of NY
[REQUEST FOR FIRST PRODUCT AND THEN ASK IF SIMILAR FOR REMAINDER, IF NOT SIMILAR
ASK HOW IT DIFFERS]_____________________
9. On a scale of 1 to 5, where 1 equals not at all for any customers and 5 means very well for all customers, how
well do you believe the current mix of ENERGY STAR [insert product(s) from Q1] ([ASK IF Q1=5] or
Advanced Power Strips) you sell meets the needs of all customers looking to purchase [insert product(s) from
Q1]?
a) Clothes Washers ___
b) Dishwashers ____
c) Refrigerators ____
d) Room Air Conditioners ___
e) Advanced Power Strips ____
10. If [Q6 <5], please describe what customer needs you believe are not being met through your current offerings?
_____________________ [OBTAIN FOR EACH TYPE OF APPLIANCE]
A-74

A.3 Product Sales
11. The New York Products Program is designed to promote ENERGY STAR products over other products that are
less energy efficient. For each product you mentioned earlier, can you tell me the percentage of models you sold
in New York from 2010-2012 that were ENERGY STAR rated vs. non-ENERGY STAR (IF Q5 CONTAINS
APS: percentage of Advanced Power Strips vs. Traditional Power Strips)?
Appliance Percentage of ENERGY STAR Percentage of non-ENERGY STAR
Clothes Washer
Dishwasher
Refrigerator
Air conditioner
Advanced Power Strips (APS) Advanced Power Strips Traditional Power Strips
12. Were there any changes in market share within the 2010-12 timeframe for products that had ES spec changes?
Dishwasher’s ES specs changed in January of 2012 – did this in any way impact the market share for this
appliance?
1 Yes 2 No
96 REFUSED 97 DON’T KNOW
13. Now think about NYSERDA’s New York Product Program. If this program was not available, do you think
your company’s sales of [PRODUCT] in New York would have been about the same, lower, or higher between
2010-2012? [FILL IN TABLE BELOW]
1 SAME 2 LOWER 3 HIGHER 96 REFUSED [SKIP TO 14]
97 DON’T KNOW [SKIP TO 14]
14. By what percentage do you estimate your company’s sales of [INSERT ENERGY STAR
APPLIANCE/ADVANCED POWER STRIP] would be [higher/lower] if the New York Products Program had
not been available? [FILL IN TABLE BELOW]
Record percentage: ___________
A-75

[READ: I want to make sure I understand you correctly. You are saying that [Q11] of your company’s [INSERT PRODUCT] sales were ENERGY STAR between January 2010 and December 2012 and that without the NYPP your [INSERT PRODUCT] ENERGY STAR sales would have been [IF Q12=2: Q11-Q14; IFQ12=3: Q14+Q11]. Is this correct? [IF NOT CLARIFY ANSWERS]
15. [IF Q12=1 OR Q12=3 ASK] Why do you think sales would have been [SAME/HIGHER] in absence of the
NYPP? [FILL IN TABLE BELOW]
[RECORD ANSWER; PROBE FOR LACK OF ANY INFLUENCE OF THE PROGRAM]: ___________________________________________________________
Appliance Q12. Sales Same/Higher/Lower?
Q14. Percentage Higher/Lower?
Q15. Why the Same/Higher if no program?
Clothes Washer
Dishwasher
Refrigerator
Air conditioner
Advanced Power Strips (APS)
16. We are specifically interested in comparing your ENERGY STAR and non-ENERGY STAR ([ASK IF Q1=5]
and Advanced Power Strips (APS) vs. Traditional Power Strips) sales in [COMPARISON AREA] which are
areas without significant utility efforts to promote ENERGY STAR (or APS) products. Can you tell me the
percentage of models you sold during 2010-2012 that were ENERGY STAR rated vs. non-ENERGY STAR
rated ([ASK IF Q1=5] APS vs. Traditional Power Strips) in each of these areas for each product mentioned
earlier (estimates are acceptable)?
1. Yes [complete table below, then skip to 0]
2. No
3. Don’t know
A-76

Appliance
REGION 1 IN COMPARISON AREA REGION 2 IN COMPARISON AREA
Percent of ENERGY STAR
Percent of Non-ENERGY STAR
Percent of ENERGY STAR
Percent of Non-ENERGY STAR
Clothes Washers Dishwashers Refrigerators Room Air Conditioners Advanced Power Strips Percent of APS:
______ Percent of Traditional Power Strips: ______
Percent of APS: ______
Percent of Traditional Power Strips: ______
17. Can you estimate the percentages of your sales of ENERGY STAR vs. non-ENERGY STAR rated products and
([ASK IF Q1=5] Advanced Power Strips (APS) vs. Traditional Power Strips) in general for outside the New
York area during 2010-2012?
a) Yes [please complete the table below]
Appliance Percent of ENERGY STAR Percent of non-ENERGY STAR
Clothes Washer Dishwasher Refrigerator Air conditioner Advanced Power Strips Percent of APS:
_______ Percent of Traditional Power Strips: ______
b) No
c) Don’t know
A.4 Product Offerings 18. For each product you mentioned earlier, can you tell me the percentage of units you OFFERED in New York
from 2010-2012 that were ENERGY STAR rated vs. non-ENERGY STAR (IF Q5 CONTAINS APS:
percentage of Advanced Power Strips vs. Traditional Power Strips)?
Appliance Percentage of ENERGY STAR Percentage of non-ENERGY STAR Clothes Washer Dishwasher Refrigerator Air conditioner Advanced Power Strips (APS) Advanced Power Strips Traditional Power Strips
A-77

19. Now think about NYSERDA’s New York Product Program. If this program was not available, do you think
your company’s offering of [PRODUCT] in New York would have been about the same, lower, or higher
between 2010-2012? [FILL IN TABLE BELOW]
1 SAME 2 LOWER 3 HIGHER 96 REFUSED
97 DON’T KNOW
20. By what percentage do you estimate the models of [INSERT ENERGY STAR APPLIANCE/ADVANCED
POWER STRIP] would be [higher/lower] if the New York Products Program had not been available? [FILL IN
TABLE BELOW]
Record percentage: ___________
21. [IF Q19=1 OR Q19=3 ASK] Why do you think offerings would have been [SAME/HIGHER] in absence of the
NYPP?
[RECORD ANSWER; PROBE FOR LACK OF ANY INFLUENCE OF THE PROGRAM]: ___________________________________________________________
A.5 Pricing
22. [Ask for each product mentioned in Q1] During the 2010-2012, did your company ever offer its own price discounts or rebates to consumers on ENERGY STAR [Insert product(s) mentioned from Q1] outside of the NYSERDA buy down incentives?
a) Yes
a. What were your reasons for providing these discounts?
b. What was the typical range of these discounts?
c. What was the typical timeframe associated with these discounts?
d. Were there particular models for which you were more likely to offer these
discounts?
e. If yes, which models? (Probe for ENERGY STAR vs. non ENERGY
STAR/Advanced Power Strips (APS) vs. Traditional Power Strips)
f. Were there particular stores or regions of the country where you were more likely to
offer these discounts?
g. If yes, which stores or regions and why?
A-78

h. Did you offer these discounts in [COMPARISON AREA]?
b) No
a. Why not?
23. For other regions that you serve that offer Program Administrator programs for ES products, do you offer the
same pricing structure as NY, or do you price ES Products differently?
24. On a scale of 1 to 5, where 1 equals “no influence” and 5 equals “significant influence,” how much influence
has the New York Products Program had on your pricing of ENERGY STAR [INSERT PRODUCT(S) FROM
Q1] [ASK IF Q1=5, or Advanced Power Strips] that you supply to retailers outside of New York?
a) Clothes Washers ___
b) Dishwashers ____
c) Refrigerators ____
d) Room Air Conditioners ___
e) Advanced Power Strips ___
25. If [Q23 >0], please describe how the New York Products Program has influenced your pricing for retailers
outside of New York _____________________[ASK FOR FIRST APPLIANCE THEN ASK IF SIMILAR OR
DIFFERENT FOR REMAINING, IF DIFFERENT, ASK HOW DIFFERENT]
26. How has the incremental cost of ENERGY STAR [insert product(s) from Q1] [ASK IF Q1=5 OR Advanced
Power Strips (APS)], compared to non-ENERGY STAR [ASK IF Q1=5 Traditional Power Strips], changed in
the last few years? Would you say it has…[make sure to ask for the incremental cost, not the absolute cost] [If
needed read: Incremental cost is defined as the price differential between the ES and non-ES products.]
a) Increased significantly
b) Increased somewhat
c) Stayed the same
d) Decreased somewhat
e) Decreased significantly
f) Don’t Know
g) Refused
A-79

27. [If Increase or Decrease] To what do you attribute this change?
28. [IF DECREASE] On a scale of 1 to 5, where 5 means very important and 1 means not at all important, how
important was the New York Products Program in helping to bring about this decrease in incremental cost?
___Please describe ___________________
A.6 Marketing
29. If your company sells both ENERGY STAR and non-ENERGY STAR appliances, do you promote the non-
ENERGY STAR appliances differently than you do the ENERGY STAR appliances? [ASK IF Q1=5] If your
company sells both Advanced Power Strips and Traditional Power Strips, do you promote the Traditional Power
Strips differently than you do the New York Products Program-promoted Advanced Power Strips?
a) I do not supply non-ENERGY STAR appliances (Traditional Power Strips).
b) Yes.
b. How are your promotional efforts different?
c) No.
30. [Ask if Q2= a or b for each product mentioned in Q1.] Earlier, you mentioned your company sells ENERGY
STAR appliances (Advanced Power Strips [IF Q1=5]) outside of New York. Please tell me which of the
following statements best answers the question of how your promotion of these products varies between New
York and outside of New York?
a) We only promote these ENERGY STAR products (Advanced Power Strips) in New York.
b) We only promote these ENERGY STAR products (Advanced Power Strips) in New York
and other areas where utility incentives are offered.
c) We apply the same promotional practices in New York as in all areas where we sell.
d) We apply the same promotional practices in New York in some other areas we sell.
c. How do you decide where to use the promotional efforts?
e) We apply some promotional ENERGY STAR activities outside of New York, but not as
actively
f) Other (specify).
31. [IF ANY ENERGY STAR/APS PROMOTED OUTSIDE OF NEW YORK ASK] On a scale of 1 to 5, where 1
is “no influence” and 5 is “significant influence,” how much influence has the New York Products Program had
A-80

on your promotion of the following ENERGY STAR products ([ASK IF Q1=5] Advanced Power Strips
)outside of New York?
a) Clothes Washers ___
b) Dishwashers ____
c) Refrigerators ____
d) Room Air Conditioners ___
e) Advanced Power Strips ____
32. If Q31 > 0 FOR ANY PRODUCT, READ] Please describe how the New York Products Program influenced
your promotion efforts outside of New York.[START WITH FIRST PRODUCT AND ASK IF SIMILAR OR
DIFFERENT FOR REMAINING, IF DIFFERENT ASK HOW]
a) Clothes Washers _________________________________
b) Dishwashers ___________________________________
c) Refrigerators ___________________________________
d) Room Air Conditioners ___________________________
e) Advanced Power Strips _______________________________
33. [Ask for each product carried from Q1] During 2010-2012, did your company ever use the same or similar promotions of ENERGY STAR [insert product(s) mentioned from Q1] ([ASK IF Q1=5]or Advanced Power Strips) in [COMPARISON AREA], as you used in New York through the New York Products Program?
a) Yes – please explain
d. Clothes Washers _____________________________
e. Dishwashers ________________________________
f. Refrigerators _________________________________
g. Room Air Conditioners ____________
h. Advanced Power Strips _____________________________
b) No
A-81

A.7 Sales Trends
34. [Ask for each product mentioned in Q1] Did your total sales of [insert product(s) mentioned from Q1] to retailers in New York during the entire 2010-2012 timeframe, increase, decrease, or stay the same for your company?
a) Clothes Washers
a. Increased
b. Decreased
c. Stayed the same
b) Dishwashers ____
a. Increased
b. Decreased
c. Stayed the same
c) Refrigerators ____
a. Increased
b. Decreased
c. Stayed the same
d) Room Air Conditioners ___
a. Increased
b. Decreased
c. Stayed the same
e) Advanced Power Strips ___
a. Increased
b. Decreased
c. Stayed the same
A-82

35. I’m going to read you a list of factors that may or may not have had an effect on the proportion of
ENERGY STAR sales of [INSERT PRODUCT(S) FROM Q1] [ASK IF Q1=5] and/or Advanced
Power Strips. For each one, please tell me if the factor had a positive effect, a negative effect or no
effect on the proportion of ENERGY STAR sales for this product.
a. The economy
TR14. 1 POSITIVE EFFECT 2 NEGATIVE EFFECT
3 NO EFFECT 96 REFUSED 97 DON’T KNOW
b. Higher energy prices.
1 POSITIVE EFFECT 2 NEGATIVE EFFECT
3 NO EFFECT 96 REFUSED 97 DON’T KNOW
c. State Energy Efficient Rebate Programs, also known as “cash for appliances” or “the great swap out” programs
1 POSITIVE EFFECT 2 NEGATIVE EFFECT
3 NO EFFECT 96 REFUSED 97 DON’T KNOW
d. Environmental concerns
1 POSITIVE EFFECT 2 NEGATIVE EFFECT
3 NO EFFECT 96 REFUSED 97 DON’T KNOW
e. Utility sponsored programs
1 POSITIVE EFFECT 2 NEGATIVE EFFECT
3 NO EFFECT 96 REFUSED 97 DON’T KNOW
A-83

f. NYSERDA’s New York Products Program
1 POSITIVE EFFECT 2 NEGATIVE EFFECT
3 NO EFFECT 96 REFUSED 97 DON’T KNOW
ALWAYS READ LAST:
g. Were there any other factors that had an effect on the ENERGY STAR sales of this type of Energy Star product? (SPECIFY_____________________)
1 POSITIVE EFFECT 2 NEGATIVE EFFECT
3 NO EFFECT 96 REFUSED 97 DON’T KNOW
36. From your perspective, how do you think demand for ENERGY STAR appliances and Advanced Power Strips
has changed over 2010-2012 in New York? _________
37. What about for areas outside of New York? How do you think demand for ENERGY STAR appliances and
Advanced Power Strips has changed? _________
38. Would your store carry the same or less ENERGY STAR [PRODUCT]/ADVANCED POWER
STRIPS in New York without the support of NYSERDA’s NYPP or not?
1 SAME 2 LESS 96 REFUSED 97 DON’T KNOW
39. Would your store advertising be the same or less for ENERGY STAR [PRODUCT]/ADVANCED
POWER STRIPS in New York without the support of NYSERDA’s NYPP or not?
1 SAME 2 LESS 96 REFUSED 97 DON’T KNOW
40. If NYSERDA withdrew its promotional incentives for ENERGY STAR appliances or Advanced
Power Strips, would sales of ENERGY STAR or Advanced Power Strip products in New York
decrease, and if so, by how much (%)? _____
1 SAME 2 LESS (___% less here) 96 REFUSED
A-84

97 DON’T KNOW
41. Why do you think that is? __________________________________
42. Are there other energy efficient products that you think NYSERDA should be offering incentives on?
[IF YES] What products? _______________________________
[ONLY ASK 43-45 ONCE FOR THE FIRST PRODUCT]
43. During the existence of the State Energy Efficient Appliance Rebate Program or other ARRA funded programs
, did your New York stores provide information to consumers either through advertising or direct salesperson
communication on the benefits of the rebate program for ENERGY STAR appliances or not?
1 YES 2 NO 96 REFUSED 97 DON’T KNOW
44. In your opinion, what impact, if any, did consumer awareness of the State Energy Efficient Appliance Rebate
Program or other ARRA rebates on Energy Star appliances have on your New York 2010 sales of ENERGY
STAR appliances?
1 INCREASED SALES 2 DECREASED SALES 3 HAD NO IMPACT [GO TO 46] 96 REFUSED [GO TO 46] 97 DON’T KNOW [GO TO 46]
45. By what percentage do you think New York 2010 sales [increased/decreased] as a result of consumer awareness
of the ARRA rebates on Energy Star appliances?
Record percentage: ___________
A.8 ENERGY STAR Most Efficient
[SKIP Q47 - Q50IF COMPANY DOES NOT OFFER ENERGY STAR MOST EFFICIENT PRODUCTS]
46. Does your company offer any ENERGY STAR Most Efficient products? [IF YES CONTINUE, IF NO SKIP
TO Q51] Which Products?
ii. Clothes washers
iii. Refrigerators
iv. Other products [Record: ______________________]
A-85

47. [IF ANY MOST EFFICIENT PRODUCTS OFFERED] How do your sales of the Most Efficient qualified
[PRODUCT] compare to your sales of your other ENERGY STAR [PRODUCT]? Would you say they are less
than, the same, or greater than sales of your other ENERGY STAR [PRODUCT]? [IF MORE THAN ONE
MOST EFFICIENT PRODUCT CATEGORY SOLD ASK]
a) Less than
b) Same as
c) Greater than
d) Don’t Know
e) Refused
48. Does the percentage of your sales of ENERGY STAR Most Efficient Products differ in New York versus in
general for outside the New York area?
[IF YES] How so? __________________
[IF YES] Why do you think that is? [PROBE FOR INFLUENCE OF NYPP]
_____________________________________________
49. Does the percentage of your sales of ENERGY STAR Most Efficient Products differ in New York versus
[COMPARISON AREA]?
[IF YES] How so? __________________
[IF YES] Why do you think that is? [PROBE FOR INFLUENCE OF NYPP]
_____________________________________________
50. On a scale of 1 to 5, where 1 is “not aware at all” and 5 is “completely aware”, how aware, in general, do you
think consumers are of ENERGY STAR Most Efficient product offerings? [Record: ________]
A.9 Program Changes and Satisfaction 51. Beginning in 2013, the New York Products Program made changes to the program, focusing on more efficient
products. Are you aware of these changes?
52. [IF AWARE OF CHANGES] How do you feel about these changes? Do you feel they are positive, negative, or
neutral? Why? [PROBE FOR REACTION TO CHANGES]
_____________________________________________________________________
53. [IF UNAWARE OF CHANGES] How do you typically receive information pertaining to NYSERDA’s NYPP?
A-86
a) Phone
b) Email
c) Mail
d) In person visits
54. Using a scale of 1 to 5 where 1 = very dissatisfied and 5 = very satisfied, how satisfied have you been with the
program managers, contractor and other staff involved in delivering the NYSERDA NYPP? [PROBE FOR
WHY IF BELOW 7]
55. Using a scale of 1 to 5 where 1 = very dissatisfied and 5 = very satisfied, how satisfied have you been with the
NYPP’s marketing support? [PROBE FOR WHY IF BELOW 7]
56. On a scale of 1 to 5, where 1 is not at all satisfied and 5 is extremely satisfied, overall how satisfied would you
say you are with the New York Products Program? _________ [PROBE FOR WHY IF BELOW 7]
57. In what way could the program process be improved?
58. Do you have any other comments or questions you would like to share with me today about the New York
Products program?
A.10 Sales in Potential Comparison Areas
As noted above, we are interested in how ENERGY STAR/Advance Power Strip sales in New York compare to sales in Virginia, Washington D.C., and Houston, TX. Would there be a another person you think we could speak to that might be familiar with sales in those areas?
[COLLECT NAME/CONTACT INFO IF PROVIDED]: ___________________________________
This concludes the interview. Thank you very much for your time and participation.
A-87

A.11 Non-Participating Corporate Retailer Interview Guide
New York Products Program Interview Guide for Corporate NonParticipant Retailers, 2013
Interviewer:
Retailer Name: City and State:
Contact Name: Contact Title:
Phone: E-mail:
Respondent’s overall responsibility:
Date: Comments:
A.12 Introduction [FOR INTERVIEWERS]
Contact Protocol
• Call potential respondents to ascertain the most appropriate respondent. Obtain e-mail address(es) of appropriate respondents. If the company refuses an interview, determine the reasons for refusal, and, if it is logistical in nature, try to find a work-around.
• Send an e-mail interview invitation to the appropriate respondent. This invitation will include:
o Explanation of the purpose and scope of the interview.
o Explanation of the time frame within which the interview will need to be completed.
o Explanation of the expected duration of the interview and required flexibility to complete the interview over multiple sessions.
o Instructions to propose a convenient interview time.
o Contact information for interviewers.
o Confidentiality assurances.
o A letter attachment from NYSERDA explaining the importance of the interview.
If the target respondent does not respond to the e-mail invitation within a few days, a follow-up call will be made to try to schedule an interview time, find an alternate interview target, or determine reasons for refusal.
A-88

Once an interview time has been arranged, the respondent will be e-mailed a copy of the interview guide.
At the beginning of the interview, information will be collected on the respondent’s position and overall responsibilities.
A.13 Product Offerings 59. Are you familiar with the NYSERDA administered New York Products Program (NYPP)?
1 Yes
2 No [If no, then explain what NYPP is here]
60. In addition to buy downs, the NYSERDA New York Products Program (NYPP) program shares the cost of
advertising with retailers to promote ENERGY STAR appliances in New York. I’d like to ask you some
questions about how this program may have impacted your company’s production, pricing, and sales trends of
ENERGY STAR appliances and Advanced Power Strips in New York and elsewhere. First, can you tell me
which of the following appliances and products you sell in New York? [Allow for multiple answers]
1. Clothes washers
2. Dishwashers
3. Refrigerators
4. Room air conditioners
5. Advanced Power Strips (APS), also known as “smart” strips
61. [For each product(s) mentioned in Q1, ask:] Do you offer these same ENERGY STAR or [READ IF Q1=5:
Advanced Power Strip] products to all of your stores outside of New York, some of your stores outside of New
York, or no other stores outside of New York?
a) Clothes Washers
a. Yes, everywhere
b. Yes, some stores
c. No other stores outside of New York
b) Dishwashers ____
a. Yes, everywhere
b. Yes, some stores
A-89

c. No other stores outside of New York
c) Refrigerators ____
a. Yes, everywhere
b. Yes, some stores
c. No other stores outside of New York
d) Room Air Conditioners ___
a. Yes, everywhere
b. Yes, some stores
c. No other stores outside of New York
e) Advanced Power Strips ___
a. Yes, everywhere
b. Yes, some stores
c. No other stores outside of New York
62. [For each product(s) where Q2=a or b, ask:] Do you offer these same ENERGY STAR [PRODUCT][ASK IF
Q1=5: or Advanced Power Strips] to retailers in [COMPARISON AREA]?
a) Clothes Washers
a. Yes
b. No
c. Don’t know
b) Dishwashers ____
a. Yes
b. No
c. Don’t know
c) Refrigerators ____
a. Yes
b. No
c. Don’t know
d) Room Air Conditioners ___
A-90

a. Yes
b. No
c. Don’t know
e) Advanced Power Strips ___
a. Yes
b. No
c. Don’t know
63. [If Q2 = a or b for any product] Do you recall factors that influenced your decision to sell the same [Insert
product(s) mentioned from Q1] to your stores outside of New York? [DO NOT READ, BUT PROMPT IF
NECESSARY]
a. Offer inventory comparable to competitors
b. Requests by retailer customers
c. We offer similar products to all our retailers
d. Economies of scale in manufacturing these products
e. Consumer demand
f. Utility or program administrator sponsored programs
g. Government sponsored programs
h. Other [Specify] _________________________________
64. If Q2 = b or c for any product] Why are there differences in product offerings in New York vs. what is offered
to retailers outside of New York? [PROBE FOR PROGRAM IMPACT]
___________________________________________________________________
65. On a scale of 1 to 5, where 1 is “no influence” and 5 is “significant influence,” how much influence has the
New York Products Program had on the mix of model types of [INSERT PRODUCT] you supplied to stores
outside of New York from 2010 to 2012?
a) Clothes Washers ___
b) Dishwashers ____
c) Refrigerators ____
A-91

d) Room Air Conditioners ___
e) Advanced Power Strips ____
66. On a scale of 1 to 5, where 1 is “no influence” and 5 is “significant influence,” how much influence have other
utility sponsored energy efficiency programs had on the mix of model types of [INSERT PRODUCT] you
supplied to stores outside of New York during 2010-2012?
f) Clothes Washers ___
g) Dishwashers ____
h) Refrigerators ____
i) Room Air Conditioners ___
j) Advanced Power Strips ____
67. If [6 >0 or 7>0], please describe how the New York Products Program [IF 7>0 READ: or other utility
sponsored energy efficiency programs] influenced the mix of model types you supply to stores outside of NY
[REQUEST FOR FIRST PRODUCT AND THEN ASK IF SIMILAR FOR REMAINDER, IF NOT SIMILAR
ASK HOW IT DIFFERS]_____________________
68. On a scale of 1 to 5, where 1 equals not at all for any customers and 5 means very well for all customers, how
well do you believe the current mix of ENERGY STAR [insert product(s) from Q1] ([ASK IF Q1=5] or
Advanced Power Strips) you sell meets the needs of all customers looking to purchase [insert product(s) from
Q1]?
a) Clothes Washers ___
b) Dishwashers ____
c) Refrigerators ____
d) Room Air Conditioners ___
e) Advanced Power Strips ____
69. If [Q6 <5], please describe what customer needs you believe are not being met through your current offerings?
_____________________ [OBTAIN FOR EACH TYPE OF APPLIANCE]
A.14 Product Sales 70. For each product you mentioned earlier, can you tell me the percentage of models you sold in New York from
2010-2012 that were ENERGY STAR rated vs. non-ENERGY STAR (IF Q5 CONTAINS APS: percentage of
Advanced Power Strips vs. Traditional Power Strips)?
A-92

Appliance Percentage of ENERGY STAR Percentage of non-ENERGY STAR
Clothes Washer Dishwasher Refrigerator Air conditioner Advanced Power Strips (APS) Advanced Power Strips Traditional Power Strips
71. Now think about NYSERDA’s New York Product Program. If this program was not available, do you think
your company’s sales of [PRODUCT] in New York would have been about the same, lower, or higher between
2010-2012? [FILL IN TABLE BELOW]
1 SAME 2 LOWER 3 HIGHER 96 REFUSED [SKIP TO 14]
97 DON’T KNOW [SKIP TO 14]
72. By what percentage do you estimate your company’s sales of [INSERT ENERGY STAR
APPLIANCE/ADVANCED POWER STRIP] would be [higher/lower] if the New York Products Program had
not been available? [FILL IN TABLE BELOW]
Record percentage: ___________
[READ: I want to make sure I understand you correctly. You are saying that [Q11] of your company’s [INSERT PRODUCT] sales were ENERGY STAR between January 2010 and December 2012 and that without the NYPP your [INSERT PRODUCT] ENERGY STAR sales would have been [IF Q12=2: Q11-Q14; IFQ12=3: Q14+Q11]. Is this correct? [IF NOT CLARIFY ANSWERS]
73. [IF Q12=1 OR Q12=3 ASK] Why do you think sales would have been [SAME/HIGHER] in absence of the
NYPP? [FILL IN TABLE BELOW]
[RECORD ANSWER; PROBE FOR LACK OF ANY INFLUENCE OF THE PROGRAM]: ___________________________________________________________
Appliance Q12. Sales
Same/Higher/Lower? Q14. Percentage Higher/Lower?
Q15. Why the Same/Higher if no
program?
Clothes Washer Dishwasher Refrigerator Air conditioner
Advanced Power Strips (APS)
A-93

74. We are specifically interested in comparing your ENERGY STAR and non-ENERGY STAR ([ASK IF Q1=5]
and Advanced Power Strips (APS) vs. Traditional Power Strips) sales in [COMPARISON AREA] which are
areas without significant utility efforts to promote ENERGY STAR (or APS) products. Can you tell me the
percentage of units you sold during 2010-2012 that were ENERGY STAR rated vs. non-ENERGY STAR rated
([ASK IF Q1=5] APS vs. Traditional Power Strips) in each of these areas for each product mentioned earlier
(estimates are acceptable)?
1. Yes [complete table below, then skip to 0]
2. No
3. Don’t know
Appliance
REGION 1 IN COMPARISON AREA REGION 2 IN COMPARISON AREA
Percent of ENERGY STAR
Percent of Non-ENERGY STAR
Percent of ENERGY STAR
Percent of Non-ENERGY STAR
Clothes Washers Dishwashers Refrigerators Room Air Conditioners Advanced Power Strips Percent of APS:
______ Percent of Traditional Power Strips: ______
Percent of APS: ______
Percent of Traditional Power Strips: ______
75. Can you estimate the percentages of your sales of ENERGY STAR vs. non-ENERGY STAR rated products and
([ASK IF Q1=5] Advanced Power Strips (APS) vs. Traditional Power Strips) in general for outside the New
York area during 2010-2012?
a) Yes [please complete the table below]
Appliance Percent of ENERGY STAR Percent of non-ENERGY STAR
Clothes Washer Dishwasher Refrigerator Air conditioner Advanced Power Strips Percent of APS:
_______ Percent of Traditional Power Strips: ______
b) No
c) Don’t know
A-94

A.14 Product Offerings 76. For each product you mentioned earlier, can you tell me the percentage of models you OFFERED in New York
from 2010-2012 that were ENERGY STAR rated vs. non-ENERGY STAR (IF Q5 CONTAINS APS:
percentage of Advanced Power Strips vs. Traditional Power Strips)?
Appliance Percentage of ENERGY STAR Percentage of non-ENERGY STAR
Clothes Washer Dishwasher Refrigerator Air conditioner Advanced Power Strips (APS) Advanced Power Strips Traditional Power Strips
77. Now think about NYSERDA’s New York Products Program. If this program was not available, do you think
your company’s offering of [PRODUCT] in New York would have been about the same, lower, or higher
between 2010-2012? [FILL IN TABLE BELOW]
1 SAME 2 LOWER 3 HIGHER 96 REFUSED
97 DON’T KNOW
78. By what percentage do you estimate the models of [INSERT ENERGY STAR APPLIANCE/ADVANCED
POWER STRIP] would be [higher/lower] if the New York Products Program had not been available? [FILL IN
TABLE BELOW]
Record percentage: ___________
79. [IF Q19=1 OR Q19=3 ASK] Why do you think offerings would have been [SAME/HIGHER] in absence of the
NYPP?
[RECORD ANSWER; PROBE FOR LACK OF ANY INFLUENCE OF THE PROGRAM]: ___________________________________________________________
A.15 Pricing
80. [Ask for each product mentioned in Q1] During the 2010-2012, did your company ever offer its own price discounts or rebates to consumers on ENERGY STAR [Insert product(s) mentioned from Q1]?
f) Yes
a. What were your reasons for providing these discounts?
b. What was the typical range of these discounts?
A-95

c. What was the typical timeframe associated with these discounts?
d. Were there particular models for which you were more likely to offer these
discounts?
e. If yes, which models? (Probe for ENERGY STAR vs. non ENERGY
STAR/Advanced Power Strips (APS) vs. Traditional Power Strips)
f. Were there particular stores or regions of the country where you were more likely to
offer these discounts?
g. If yes, which stores or regions and why?
h. Did you offer these discounts in [COMPARISON AREA]?
g) No
a. Why not?
81. For other regions that you serve that offer Program Administrator programs for ES products, do you offer the
same pricing structure as NY, or do you price ES Products differently?
82. On a scale of 1 to 5, where 1 equals “no influence” and 5 equals “significant influence,” how much influence
has the New York Products Program had on your pricing of ENERGY STAR [INSERT PRODUCT(S) FROM
Q1] [ASK IF Q1=5, or Advanced Power Strips] that you supply to retailers outside of New York?
f) Clothes Washers ___
g) Dishwashers ____
h) Refrigerators ____
i) Room Air Conditioners ___
j) Advanced Power Strips ___
83. If [Q23 >0], please describe how the New York Products Program has influenced your pricing for retailers
outside of New York _____________________[ASK FOR FIRST APPLIANCE THEN ASK IF SIMILAR OR
DIFFERENT FOR REMAINING, IF DIFFERENT, ASK HOW DIFFERENT]
84. How has the incremental cost of ENERGY STAR [insert product(s) from Q1] [ASK IF Q1=5 OR Advanced
Power Strips (APS)], compared to non-ENERGY STAR [ASK IF Q1=5 Traditional Power Strips], changed in
the last few years? Would you say it has…[make sure to ask for the incremental cost, not the absolute cost] [If
needed read: Incremental cost is defined as the price differential between the ES and non-ES products.]
A-96
h) Increased significantly
i) Increased somewhat
j) Stayed the same
k) Decreased somewhat
l) Decreased significantly
m) Don’t Know
n) Refused
85. [If Increase or Decrease] To what do you attribute this change?
86. [IF DECREASE] On a scale of 1 to 5, where 5 means very important and 1 means not at all important, how
important was the New York Products Program in helping to bring about this decrease in incremental cost?
___Please describe ___________________
A.16 Marketing
87. If your company sells both ENERGY STAR and non-ENERGY STAR appliances, do you promote the non-
ENERGY STAR appliances differently than you do the ENERGY STAR appliances? [ASK IF Q1=5] If your
company sells both Advanced Power Strip and Traditional Power Strips, do you promote the Traditional Power
Strips differently than you do the New York Products Program-promoted Advanced Power Strips?
d) I do not supply non-ENERGY STAR appliances (Traditional Power Strips).
e) Yes.
b. How are your promotional efforts different?
f) No.
88. [Ask if Q2= a or b for each product mentioned in Q1.] Earlier, you mentioned your company sells ENERGY
STAR appliances (Advanced Power Strips [IF Q1=5]) outside of New York. Please tell me which of the
following statements best answers the question of how your promotion of these products varies between New
York and outside of New York?
g) We only promote these ENERGY STAR products (Advanced Power Strips) in New York.
h) We only promote these ENERGY STAR products (Advanced Power Strips) in New York
and other areas where utility incentives are offered.
A-97

i) We apply the same promotional practices in New York as in all areas where we sell.
j) We apply the same promotional practices in New York in some other areas we sell.
c. How do you decide where to use the promotional efforts?
k) We apply some promotional ENERGY STAR activities outside of New York, but not as
actively
l) Other (specify).
89. [IF ANY ENERGY STAR/APS PROMOTED OUTSIDE OF NEW YORK ASK] On a scale of 1 to 5, where 1
is “no influence” and 5 is “significant influence,” how much influence has the New York Products Program had
on your promotion of the following ENERGY STAR products ([ASK IF Q1=5] Advanced Power Strips
)outside of New York?
f) Clothes Washers ___
g) Dishwashers ____
h) Refrigerators ____
i) Room Air Conditioners ___
j) Advanced Power Strips ____
90. If Q31 > 0 FOR ANY PRODUCT, READ] Please describe how the New York Products Program influenced
your promotion efforts outside of New York.[START WITH FIRST PRODUCT AND ASK IF SIMILAR OR
DIFFERENT FOR REMAINING, IF DIFFERENT ASK HOW]
f) Clothes Washers _________________________________
g) Dishwashers ___________________________________
h) Refrigerators ___________________________________
i) Room Air Conditioners ___________________________
j) Advanced Power Strips _______________________________
91. [Ask for each product carried from Q1] During 2010-2012, did your company ever use the same or similar promotions of ENERGY STAR [insert product(s) mentioned from Q1] ([ASK IF Q1=5]or Advanced Power Strips) in [COMPARISON AREA], as you used in New York?
c) Yes – please explain
d. Clothes Washers _____________________________
A-98

e. Dishwashers ________________________________
f. Refrigerators _________________________________
g. Room Air Conditioners ____________
h. Advanced Power Strips _____________________________
d) No
A.17 Sales Trends
92. [Ask for each product mentioned in Q1] Did your total sales of [insert product(s) mentioned from Q1] to retailers in New York during the entire 2010-2012 timeframe, increase, decrease, or stay the same for your company?
f) Clothes Washers
d. Increased
e. Decreased
f. Stayed the same
g) Dishwashers ____
d. Increased
e. Decreased
f. Stayed the same
h) Refrigerators ____
d. Increased
e. Decreased
f. Stayed the same
i) Room Air Conditioners ___
d. Increased
e. Decreased
f. Stayed the same
j) Advanced Power Strips ___
d. Increased
e. Decreased
A-99

f. Stayed the same
93. [Ask for each product circled from Q1] Have the proportion of sales in New York of [insert product(s) mentioned from Q1] that are ENERGY STAR rated during 2010-2012, increased, decreased, or stayed the same? [ASK IF Q1=5] What about for advanced power strips? Have the proportion of advanced power strips compared to traditional power strips increased, decreased, or stayed the same during 2010-2012?
a) Clothes Washers____
a. Increased
b. Decreased
c. Stayed the same
b) Dishwashers ____
a. Increased
b. Decreased
c. Stayed the same
c) Refrigerators ____
a. Increased
b. Decreased
c. Stayed the same
d) Room Air Conditioners ___
a. Increased
b. Decreased
c. Stayed the same
e) Advanced Power Strips ___
a. Increased
b. Decreased
c. Stayed the same
94. I’m going to read you a list of factors that may or may not have had an effect on the proportion of
ENERGY STAR sales of [INSERT PRODUCT(S) FROM Q1] [ASK IF Q1=5] and/or Advanced
Power Strips. For each one, please tell me if the factor had a positive effect, a negative effect or no
effect on the proportion of ENERGY STAR sales for this product.
A-100

a. The economy
TR15. 1 POSITIVE EFFECT 2 NEGATIVE EFFECT
96 NO EFFECT 96 REFUSED 97 DON’T KNOW
b. Higher energy prices.
1 POSITIVE EFFECT 2 NEGATIVE EFFECT
96 NO EFFECT 96 REFUSED
97 DON’T KNOW
c. State Energy Efficient Rebate Programs, also known as “cash for appliances” or “the great swap out” programs
1 POSITIVE EFFECT 2 NEGATIVE EFFECT
96 NO EFFECT 96 REFUSED
97 DON’T KNOW
d. Environmental concerns
1 POSITIVE EFFECT 2 NEGATIVE EFFECT
96 NO EFFECT 96 REFUSED 97 DON’T KNOW
e. Utility sponsored programs
1 POSITIVE EFFECT 2 NEGATIVE EFFECT
96 NO EFFECT 96 REFUSED 97 DON’T KNOW
f. NYSERDA’s New York Products Program
1 POSITIVE EFFECT 2 NEGATIVE EFFECT
96 NO EFFECT 96 REFUSED 97 DON’T KNOW
A-101

ALWAYS READ LAST:
g. Were there any other factors that had an effect on the ENERGY STAR sales of this type of Energy Star product? (SPECIFY_____________________)
1 POSITIVE EFFECT 2 NEGATIVE EFFECT
96 NO EFFECT 96 REFUSED
97 DON’T KNOW
95. From your perspective, how do you think demand for ENERGY STAR appliances and Advanced Power Strips
has changed over 2010-2012 in New York? _________
96. What about for areas outside of New York? How do you think demand for ENERGY STAR appliances and
Advanced Power Strips has changed? _________
97. If NYSERDA withdrew its promotional incentives for ENERGY STAR appliances or Advanced Power Strips,
would sales of ENERGY STAR or Advanced Power Strip products in New York decrease, and if so, by how
much (%)?
1 SAME 2 LESS (___% less here) 96 REFUSED 97 DON’T KNOW 98. Why do you think that is? __________________________________
[ONLY ASK 43-45 ONCE FOR THE FIRST PRODUCT]
99. During the existence of the State Energy Efficient Appliance Rebate Program or other ARRA funded programs
, did your New York stores provide information to consumers either through advertising or direct salesperson
communication on the benefits of the rebate program for ENERGY STAR appliances or not?
1 YES 2 NO 96 REFUSED 97 DON’T KNOW
100. In your opinion, what impact, if any, did consumer awareness of the State Energy Efficient Appliance Rebate
Program or other ARRA rebates on Energy Star appliances have on your New York 2010 sales of ENERGY
STAR appliances?
1 INCREASED SALES 2 DECREASED SALES 3 HAD NO IMPACT [GO TO 46] 96 REFUSED [GO TO 46]
A-102

97 DON’T KNOW [GO TO 46]
101. By what percentage do you think New York 2010 sales [increased/decreased] as a result of consumer awareness
of the ARRA rebates on Energy Star appliances?
Record percentage: ___________
A.18 ENERGY STAR Most Efficient
[SKIP Q47 IF COMPANY DOES NOT OFFER ENERGY STAR MOST EFFICIENT PRODUCTS]
102. Does your company offer any ENERGY STAR Most Efficient products? [IF YES CONTINUE, IF NO SKIP
TO Q51] Which Products?
v. Clothes washers
vi. Refrigerators
vii. Other products [Record: ______________________]
103. [IF ANY MOST EFFICIENT PRODUCTS OFFERED] How do your sales of the Most Efficient qualified
[PRODUCT] compare to your sales of your other ENERGY STAR [PRODUCT]? Would you say they are less
than, the same, or greater than sales of your other ENERGY STAR [PRODUCT]? [IF MORE THAN ONE
MOST EFFICIENT PRODUCT CATEGORY SOLD ASK]
a) Less than
b) Same as
c) Greater than
d) Don’t Know
e) Refused
104. Does this differ for other ENERGY STAR Most Efficient products? [IF YES PROBE FOR HOW]
105. Does the percentage of your sales of ENERGY STAR Most Efficient Products differ in New York versus in
general for outside the New York area?
[IF YES] How so? __________________
[IF YES] Why do you think that is? [PROBE FOR INFLUENCE OF NYPP] _____________________________________________
106. Does the percentage of your sales of ENERGY STAR Most Efficient Products differ in New York versus
[COMPARISON AREA]?
A-103

[IF YES] How so? __________________
[IF YES] Why do you think that is? [PROBE FOR INFLUENCE OF NYPP] _____________________________________________
107. On a scale of 1 to 5, where 1 is “not aware at all” and 5 is “extremely aware”, how aware, in general, do you
think consumers are of ENERGY STAR Most Efficient product offerings? [Record: ___________]
A.19 Sales in Potential Comparison Areas
As noted above, we are interested in how ENERGY STAR/Advance Power Strip sales in New York compare to sales in Virginia, Washington D.C., and Houston, TX. Would there be another person you think we could speak to that might be familiar with sales in those areas?
[COLLECT NAME/CONTACT INFO IF PROVIDED]: ________________________________________________
This concludes the interview. Thank you very much for your time and participation.
A-104

A.20 Participating Manufacturer Interview Guide
New York Products Program Interview Guide for Manufacturers, 2013
Interviewer:
Manufacturer Name: City and State:
Contact Name: Contact Title:
Phone: E-mail:
Respondent’s overall responsibility:
Date: Comments:
A.21 Introduction [FOR INTERVIEWERS]
Contact Protocol
• Send an e-mail interview invitation to the appropriate respondent. This invitation will include:
o Explanation of the purpose and scope of the interview.
o Explanation of the time frame within which the interview will need to be completed.
o Explanation of the expected duration of the interview and required flexibility to complete the interview over multiple sessions.
o Instructions to propose a convenient interview time.
o Contact information for interviewers.
o Confidentiality assurances.
o A letter attachment from NYSERDA explaining the importance of the interview.
If the target respondent does not respond to the e-mail invitation within a few days, a follow-up call will be made to try to schedule an interview time, find an alternate interview target, or determine reasons for refusal.
Once an interview time has been arranged, the respondent will be e-mailed a copy of the interview guide.
My name is XXX and I am working on behalf of NYSERDA on the New York Products Program evaluation (formerly known as the New York Energy $martSM Products Program) with Apex Analytics and would like
A-105

to set up a phone interview with you to discuss your experiences with the program. The interview will last about thirty to forty-five minutes, but if we need more time or if you have to tend to other matters part way through the interview we can reschedule another time to complete the interview at your convenience. These interviews are being administered to allow us to better understand how this program has impacted your company’s production, pricing, and sales trends of ENERGY STAR products in New York and elsewhere.
The information you provide will be kept confidential to the extent permitted by law. We will report all responses in aggregate and will not attribute any comments to you. I will plan on audio recording the interview, but this is just for note-taking purposes as it is difficult to simultaneously administer and take notes for the survey.
At the beginning of the interview, information will be collected on the respondent’s position and overall responsibilities.
A.22 Program Participation
[If you find that they don’t manufacture APS from web search] – Before we begin, I just want to confirm that your company does not manufacture Smart Power Strips (explain if necessary). I did a quick web search and did not see that product listing for your company. [If confirmed, scratch all references to Smart Strips]
108. According to our records, your company has participated in the NYSERDA New York Products Program
(NYPP), formerly known as the New York Energy $martSM Products Program. In addition to buy downs, this
program shares the cost of advertising with manufacturers to promote ENERGY STAR appliances in New
York. I’d like to ask you some questions about how this program has impacted your company’s production,
pricing, and sales trends of ENERGY STAR appliances and [Read where applicable: Advanced Power Strips]
in New York and elsewhere. First, can you tell me which of the following appliances and products, promoted by
funding through NYSERDA’s Products Program, you supply to retailers in New York? [Allow for multiple
answers]
1. Clothes washers
2. Dishwashers
3. Refrigerators
4. Room air conditioners
5. Advanced Power Strips (APS), also known as “smart” strips
A-106

For the remainder of the questions, I am going to be asking about the ENERGY STAR appliances you just mentioned in aggregate, but please let me know if for a specific question the answer differs between appliances.
109. Do you offer these same ENERGY STAR or [READ IF Q1=5: Advanced Power Strip] products to all retailers
outside of New York, some of retailers outside of New York, or no retailers outside of New York?
a) Clothes Washers
a. Yes, everywhere
b. Yes, some stores
c. No other stores outside of New York
b) Dishwashers ____
a. Yes, everywhere
b. Yes, some stores
c. No other stores outside of New York
c) Refrigerators ____
a. Yes, everywhere
b. Yes, some stores
c. No other stores outside of New York
d) Room Air Conditioners ___
a. Yes, everywhere
b. Yes, some stores
c. No other stores outside of New York
e) Advanced Power Strips ___
a. Yes, everywhere
b. Yes, some stores
c. No other stores outside of New York
For this next question, we are trying to establish a baseline for our study by looking at a comparison area that does not currently offer significant ENERGY STAR appliance rebate programs. This comparison area consists of Washington, DC, the state of Virginia, and Houston, TX. When I reference the comparison area I am speaking about all three in aggregate but if there are differences across these areas for a specific question please let me know.
A-107

2a. Do you offer these same ENERGY STAR [ASK IF Q1=5: or Advanced Power Strips] products to retailers
in the COMPARISON AREA?
f) Clothes Washers
a. Yes – all areas
b. Yes – some areas (SPECIFY AREAS____________)
c. No
d. Don’t know
g) Dishwashers ____
a. Yes – all areas
b. Yes – some areas (SPECIFY AREAS____________)
c. No
d. Don’t know
h) Refrigerators ____
a. Yes – all areas
b. Yes – some areas (SPECIFY AREAS____________)
c. No
d. Don’t know
i) Room Air Conditioners ___
a. Yes – all areas
b. Yes – some areas (SPECIFY AREAS____________)
c. No
d. Don’t know
j) Advanced Power Strips ___
a. Yes – all areas
b. Yes – some areas (SPECIFY AREAS____________)
c. No
d. Don’t know
A-108

110. Do you recall factors that influenced your decision to sell the same products as promoted by the New York
Products Program to retailers outside of New York? [DO NOT READ, BUT PROMPT IF NECESSARY]
a. Offer inventory comparable to competitors
b. Requests by retailer customers
c. We offer similar products to all retailers
d. Economies of scale in manufacturing these products
e. Consumer demand
f. Utility or Program Administered sponsored programs
g. Government sponsored programs
h. Other [Specify] _________________________________
3b. [If Q2 = b or c for any product] Why are there differences in product offerings in New York vs. what is offered to retailers outside of New York? [PROBE FOR PROGRAM IMPACT]
___________________________________________________________________
**I have a set of questions that you are unlikely to be able to answer without specific data in front of you, so I would
like to follow-up this interview with an email containing a spreadsheet for you to fill out when you can access the
necessary data. These questions aren’t looking for manufacturing numbers or market share, but rather differences
between ENERGY STAR and non-ENERGY STAR product offerings, as well as the impact of the New York
Products Program on company sales. Let me make sure that the email I have on record is current: interviewee email
A.23 Product Offerings 111. Data follow-up
4b. Data follow-up
4c. Now think about NYSERDA’s New York Products Program. If this program was not available, do you think your company’s sales in New York would have been about the same, lower, or higher between 2010-2012? [FILL IN TABLE BELOW]
1 SAME 2 LOWER 3 HIGHER 96 REFUSED [SKIP TO 5]
97 DON’T KNOW [SKIP TO 5]
4d. By what percentage do you estimate your company’s sales of would be [higher/lower] if the New York Products Program had not been available? [FILL IN TABLE BELOW]
A-109

Record percentage: ___________
4e. Why do you think sales would have been [SAME/HIGHER] in absence of the NYPP? [FILL IN TABLE BELOW]
[RECORD ANSWER; PROBE FOR LACK OF ANY INFLUENCE OF THE PROGRAM]: ___________________________________________________________
Appliance Q4c. Sales
Same/Higher/Lower? Q4d. Percentage Higher/Lower?
Q4e. Why the Same/Higher if no
program?
Clothes Washer Dishwasher Refrigerator
Air conditioner Advanced Power Strips
(APS)
112. Can you describe how you decide which products and models you choose to market to different retailers across
the country?______________________________
113. How much influence has the New York Products Program had on the mix of model types of products you
supplied to retailers outside of New York from 2010 to 2012 on a scale of 1 to 5, where 1 is “no influence” and
5 is “significant influence?”
a) Clothes Washers ___
b) Dishwashers ____
c) Refrigerators ____
d) Room Air Conditioners ___
e) Advanced Power Strips ____
6b. How much influence have other energy efficiency programs had on the mix of model types of products you supplied to retailers outside of New York during 2010-2012 on a scale of 1 to 5, where 1 is “no influence” and 5 is “significant influence,”?
k) Clothes Washers ___
l) Dishwashers ____
m) Refrigerators ____
n) Room Air Conditioners ___
o) Advanced Power Strips ____
A-110

114. If [6 =1 or 6b=1] then ask why they think it did not have any effect.
If [6 >1 or 6b>1], please describe how the New York Products Program or other energy efficiency programs influenced the mix of model types you supply to retailers outside of NY?
115. Data follow-up
116. Data follow-up
117. Data follow-up
118. Data follow-up
119. How well do you believe the current mix of ENERGY STAR products ([ASK IF Q1=5] or Advanced Power
Strips) you manufacture meets the needs of all customers in all areas looking to purchase ENERGY STAR
products on a scale of 1 to 5, where 1 equals not at all for any customers and 5 means very well for all
customers?
a) Clothes Washers ___
b) Dishwashers ____
c) Refrigerators ____
d) Room Air Conditioners ___
e) Advanced Power Strips ____
120. If [Q6 <4], please describe what customer needs you believe are not being met through your current offerings?
_____________________
A.24 Pricing
121. How has your participation in the buydowns from NYSERDA affected your sales of products in New York? [Do not read answers]
a) Sales have increased.
a. By what percentage would you estimate your sales have increased since participation in the buydowns? ____
b) Sales have decreased.
a. By what percentage would you estimate your sales have decreased since participation in the buydowns?
c) Sales have remained the same.
d) Other [Specify]
e) Don’t know
A-111

f) Refused
122. During 2010-2012, did your company ever offer its own price discounts or rebates to retailers or consumers on ENERGY STAR products?
a) Yes
a. What were your reasons for providing these discounts?
b. What was the typical range of these discounts?
c. Were there particular models for which you were more likely to offer these discounts?
d. If yes, which models? (Probe for ENERGY STAR vs. non ENERGY STAR/Advanced Power Strips (APS) vs. Traditional Power Strips)
e. Were there particular stores or regions of the country where you were more likely to offer these discounts?
f. If yes, which stores or regions and why?
g. Did you offer these discounts in [COMPARISON AREA]?
b) No
a. Why not?
123. How much influence has the New York Products Program had on your pricing of ENERGY STAR products
[ASK IF Q1=5, or Advanced Power Strips] that you supply to retailers outside of New York on a scale of 1 to
5, where 1 equals “no influence” and 5 equals “significant influence,”?
a) Clothes Washers ___
b) Dishwashers ____
c) Refrigerators ____
d) Room Air Conditioners ___
e) Advanced Power Strips ___
124. If [Q23 >1], please describe how the New York Products Program has influenced your pricing for retailers
outside of New York _____________________
125. How has the incremental cost of ENERGY STAR products [ASK IF Q1=5 OR Advanced Power Strips (APS)],
compared to non-ENERGY STAR products [ASK IF Q1=5 Traditional Power Strips], changed in the last few
years? Would you say it has…[make sure to ask for the incremental cost, not the absolute cost]
A-112

a) Increased significantly
b) Increased somewhat
c) Stayed the same
d) Decreased somewhat
e) Decreased significantly
f) Don’t Know
g) Refused
126. [If Increase or Decrease] To what do you attribute this change?
127. [IF DECREASE] How important was the New York Products Program in helping to bring about this decrease
in incremental cost on a scale of 1 to 5, where 5 means very important and 1 means not at all important,?
___Please describe ___________________
A.25 Marketing
128. If your company supplies both ENERGY STAR and non-ENERGY STAR appliances, do you promote the
ENERGY STAR appliances differently than you do non-ENERGY STAR appliances?
a) I do not supply non-ENERGY STAR appliances
b) Yes.
a. How are your promotional efforts different?
c) No.
[FOR Advanced Power Strips] If your company supplies both Advanced Power Strip and Traditional Power Strips, do you promote the Traditional Power Strips differently than you do the New York Products Program-promoted Advanced Power Strips?
d) I do not supply (Traditional Power Strips).
e) Yes.
a. How are your promotional efforts different?
f) No.
A-113

129. Do you promote ENERGY STAR appliances similarly both inside and outside of New York state? [If no –
why]?
130. [IF ANY ENERGY STAR/APS PROMOTED OUTSIDE OF NEW YORK ASK] How much influence has the
New York Products Program had on your promotion of ENERGY STAR products ([ASK IF Q1=5] Advanced
Power Strips ) outside of New York on a scale of 1 to 5, where 1 is “no influence” and 5 is “significant
influence,”?
a) Clothes Washers ___
b) Dishwashers ____
c) Refrigerators ____
d) Room Air Conditioners ___
e) Advanced Power Strips ____
131. If Q31 > 0 FOR ANY PRODUCT, READ] Please describe how the New York Products Program influenced
your promotion efforts outside of New York.
a) Clothes Washers _________________________________
b) Dishwashers ___________________________________
c) Refrigerators ___________________________________
d) Room Air Conditioners ___________________________
e) Advanced Power Strips _______________________________
132. During 2010-2012, did your company ever use the same or similar promotions of ENERGY STAR products ([ASK IF Q1=5]or Advanced Power Strips) in the COMPARISON AREA, as you used in New York through the New York Products Program?
a) Yes
a. Clothes Washers _____________________________
b. Dishwashers ________________________________
c. Refrigerators _________________________________
d. Room Air Conditioners ____________
e. Advanced Power Strips _____________________________
b) No A-114

133. When you supply ENERGY STAR-sponsored NYSERDA appliances ([ASK IF Q1=5] or Advanced Power
Strips) in New York, how do you market these appliances to New York retailers? _________________
A.26 Sales Trends
134. Data follow-up
135. Data follow-up
136. Data follow-up 137. From your perspective, how do you think demand for ENERGY STAR appliances and Advanced Power Strips
has changed over 2010-2012 in areas outside of New York? _________
138. If NYSERDA withdrew its promotional incentives for ENERGY STAR appliances or Advanced Power Strips,
how likely would it be that sales of ENERGY STAR or Advanced Power Strip products in New York decrease?
On a scale of 0 to 10, with 0 being not at all likely to 10 being highly likely. _____
139. Why do you think that is? __________________________________
140. Are there other energy efficient products that you think NYSERDA should be offering incentives on? [IF YES]
What products? _______________________________
A.27 ENERGY STAR Most Efficient
[SKIP Q34 IF COMPANY OFFERINGS FOR ENERGY STAR MOST EFFICIENT PRODUCTS IS KNOWN]
141. Look up before call and verify at beginning
142. [IF ANY MOST EFFICIENT PRODUCTS OFFERED] How do your sales of the Most Efficient qualified
[PRODUCT] compare to your sales of your other ENERGY STAR [PRODUCT]? Would you say they are less
than, the same, or greater than sales of your other ENERGY STAR [PRODUCT]? [IF MORE THAN ONE
MOST EFFICIENT PRODUCT CATEGOREY SOLD ASK] Does this differ for other ENERGY STAR Most
Efficient products? [IF YES PROBE FOR HOW]
a) Less than
b) Same as
c) Greater than
d) Don’t Know
e) Refused
143. Does the percentage of your sales of ENERGY STAR Most Efficient Products differ in New York versus
outside the New York area?
A-115

[IF YES] How so? __________________
[IF YES] Why do you think that is? [PROBE FOR INFLUENCE OF NYPP] _____________________________________________
144. Does the percentage of your sales of ENERGY STAR Most Efficient Products differ in New York versus the
[COMPARISON AREA]?
[IF YES] How so? __________________
[IF YES] Why do you think that is? [PROBE FOR INFLUENCE OF NYPP] _____________________________________________
145. How aware, in general, do you think consumers are of ENERGY STAR Most Efficient product offerings on a
scale of 1 to 5, where 1 is “not aware at all” and 5 is “extremely aware?” [Record: ___________]
A.28 Program Changes and Satisfaction 146. Beginning in 2013, the New York Products Program made changes to the program, focusing on more efficient
products. Are you aware of these changes?
147. [IF AWARE OF CHANGES] How do you feel about these changes? Do you feel they are positive, negative, or
neutral? Why? [PROBE FOR REACTION TO CHANGES]
_____________________________________________________________________
148. [IF UNAWARE OF CHANGES] How do you typically receive information pertaining to NYSERDA’s NYPP?
149. Overall how satisfied would you say you are with the New York Products Program on a scale of 1 to 5, where 1
is not at all satisfied and 5 is extremely satisfied,? _________
150. [IF Q54 < 4 ASK] Why did you give the program that rating? _____________________
151. Do you have any other comments or questions you would like to share with me today about the New York
Products program?
A.29 Sales in Potential Comparison Areas
As noted above, we are interested in how ENERGY STAR Products/Advance Power Strip sales in New York compare to sales in Virginia, Washington D.C., and Houston, TX. Would there be a distributor or sales representative you think we could speak to that might be familiar with sales in those areas?
[COLLECT NAME/CONTACT INFO IF PROVIDED]: ________________________________________
This concludes the interview. Thank you very much for your time and participation.
A-116

A.30 Staff Interview Guide
NEW YORK PRODUCTS PROGRAM (NYPP) STAFF INTERVIEW GUIDE (NYSERDA)
NAME: TITLE:
DATE: INTERVIEWER: Interview Objectives
• Roles and responsibilities
• Effectiveness of program activities
• Types of participant retailers and manufacturers
• Reasons for retailer store fronts decline
Hello, my name is ____________ with Research Into Action.
Thanks for taking the time to talk today. We have been hired by NYSERDA to evaluate the New York Products program for the 2010 to 2012 program years. As part of that, we are interviewing staff who are involved with the program.
The information you provide will be kept confidential to the extent permitted by law. We will report all responses in aggregate and will not attribute any comments to you. I’ll be audio recording this interview, but this is just for my note-taking purposes.
Do you have any questions before we get started?
ROLE AND RESPONSIBILITIES
Let’s start with your job title.
What are your responsibilities with the Products program? (anything else?)
How long have you had those responsibilities?
About what percent of your time do you spend on the Products Program activities?
With whom else at NYSERDA do you work on the Products Program marketing activities?
A-117

PROGRAM CHANGES/IMPLEMENTATION
What were the most significant changes to program during the 2010-2012 (prompt – administrative, implementation, marketing, design)?
What issues did these changes address?
Were the changes effective?
How did the changes affect program performance and participation, if at all?
Can you tell me about the role and effectiveness of the field implementation contractor (LM)?
Are there any program changes planned for 2013 and beyond? Why are these changes planned?
The 2010 Logic Model references the NY Smart Market Support Program. Can you tell me how, if at all, the NYPP and Market Support Program interact?
RETAILER PARTICIPATION
First, I would like to ask about whether the program works directly with buyers groups?
Can you speak to whether there has been any active engagement with national/regional chains, and if any communication has been attempted at the corporate level?
What are the steps for a retailer to participate in the NYPP? (i.e. what does this process look like?)
First I would like to learn more about active recruitment versus passive participation – how actively are retailers recruited versus allowing them to passively sign up? What proportion of the participants have to be actively recruited?
How long does it take for a new retailer to get signed up in the program? (is this a barrier?)
Are there particular retail channels or types of stores that you target to participate? What are they?
Are there particular retail channels or types of stores that most often participate? What are they?
Are there specific channels or geographic areas that are under-represented?
What, if any, barriers do you see to further retailer participation? [Probe to relate barriers to specific market sectors.]
Are there any specific barriers based on retailer channels and/or geographic areas?
What promotional activities do you offer retailers in the NYPP (trainings, POP materials, signage, etc.)?
What are the most popular offerings?
Have there been requests for promotional activities that are not currently employed by the Program? How do you handle those? Is there flexibility to adjust the promotional activities?
Do you customize marketing materials and trainings for individual retailers?
(if no) Have retailers requested individual trainings?
A-118

What type of trainings do you offer for retail store staff? (in store, online, etc.)
How often do you offer these trainings?
Do you provide any incentives for retail staff to attend the trainings?
Are the trainings open to any participating retailer, or only certain types/sizes?
Are the trainings for sales staff, managers, or both? (If both) Who usually attends?
What types of retailers most often sign up for NYPP trainings? Are there specific retail channels you target for trainings?
What are the barriers to enrolling retail stores and staff in the trainings, if any?
Do you offer trainings to non-participating retail stores (NPSO)?
What is the most common method of communication between NYSERDA and retail partners (email, newsletters, etc.)? How often?
Do these visits and/or other retailer communications vary by retailer size/sales volume/program activity?
I understand that the number of participating storefronts decreased between 2010 and 2012, to what do you attribute this change? What can be done to mitigate this trend?
What feedback (negative and positive) do you most often receive from retailers regarding the NYPP?
MANUFACTURER PARTICIPATION
What are the steps for a manufacturer to participate in the NYPP? (i.e. what does this process look like?)
First I would like to learn more about active recruitment versus passive participation – how actively are manufacturers recruited versus allowing them to passively sign up? What proportion of the participants has to be actively recruited?
How long does it take for a new manufacturer to get signed up in the program?
Are there particular manufacturers (or types of products) that you target to participate in the NYPP? What are they?
What manufacturers (types of products) are currently participating?
What, if any, barriers do you see to further manufacturer participation? [Probe to relate barriers to specific market sectors.]
What promotional activities do you offer manufacturers that participate in the NYPP (trainings, POP materials, signage, etc.)?
What are the most popular offerings?
Have there been requests for promotional activities not currently employed by the Program? How do you handle those? Is there flexibility to adjust the promotional activities?
A-119

Would you consider offering their benefits to non-participating manufacturers, specifically training or POP materials?
Do you customize marketing materials and trainings for different manufacturers?
(if no) Have manufacturers requested custom trainings?
What is the most common form of communication between NYSERDA and manufacturer partners (email, newsletters, etc.)? How often?
What feedback (positive and negative) do you most often receive from manufacturers regarding the NYPP?
MARKETING ACTIVITIES [DEMAND SIDE]
During 2010 and 2012, what were the primary marketing and outreach activities employed by the program, outside of those through retailers and manufacturers?
What were the most effective marketing activities? Which were the least effective?
Are there particular areas or demographics you are targeting through these marketing activities?
If no, have you considered targeted marketing (age, geography, etc.)?
Are there particular products that are more challenging to promote? Which ones?
Do you use benchmarking for marketing purposes?
How do you determine the effectiveness of particular marketing efforts?
[If not addressed] How do you systematically measure marketing effectiveness?
Are there particular marketing activities that work for different populations? If so, what are they [and for which populations are they effective]?
What marketing was not effective? What can be done to improve marketing?
What kind of marketing would you do if you had an unlimited budget?
CONCLUSION
Do you think the current list of products being offered in the program is effective? Are there other products you would like to see added? What about products removed – do you think any products should be removed?
Are you aware of opportunities to streamline any of the marketing activities we’ve talked about? If so, which activities, and what changes would you like to see?
How well do the various marketing strategies work together to promote ENERGY STAR products?
Do you see any products, populations, or geographic areas that could benefit from additional program support?
A-120

Is there anything else about the NYPP that you feel should be mentioned?
As we talk to other stakeholders, what would you like to learn from them that relates to your work?
A.31 EPA/DOE Interview Guide
NEW YORK PRODUCTS PROGRAM (NYPP) DOE/EPA INTERVIEW GUIDE
NAME: TITLE:
DATE: INTERVIEWER: Interview Objectives
• Roles and responsibilities
• Effectiveness of program activities
• Codes and standards
• Reasons for retailer store fronts decline
Hello, my name is ____________ with Apex Analytics.
Thanks for taking the time to talk today. We have been hired by NYSERDA to evaluate the New York Products program for the 2010 to 2012 program years. As part of that, we are interviewing DOE/EPA staff who are involved with the appliance codes and standards and ENERGY STAR specifications.
The information you provide will be kept confidential to the extent permitted by law. We will report all responses in aggregate and will not attribute any comments to you. I’ll be audio recording this interview, but this is just for my note-taking purposes.
Do you have any questions before we get started?
ROLE AND RESPONSIBILITIES
Let’s start with your job title.
What are your responsibilities with DOE/EPA? (anything else?)
How long have you had those responsibilities?
A-121

QUESTIONS FOR EPA (ENERGY STAR)
Are you familiar with the NYSERDA NY Products Program? This program had previously been called the New York Energy $martSM Program. (if not, ask if someone else might be familiar with the program).
[If 4 is yes, then ask] Can you speak to the influence that this program has had on sales of ENERGY STAR appliances both within the state of NY and areas outside of NY?
Do you have any hard data on impact this program may have had on sales? Anecdotal evidence is fine if no actual data are available.
Do you collaborate with or in any way discuss details of the program with program administers in NY?
Has the NY program had any direct or indirect impact on the ENERGY STAR appliance specifications? [If Yes, probe for details regarding impacts]
What about other appliance efficiency programs around the county – have they had any direct or indirect impact on the ENERGY STAR appliance specifications? [If Yes, probe for details regarding impacts] [If Yes also ask] How has the influence of the NYPP compared to other programs around the country in terms of impacting ES specifications?
More specifically, has the NYPP played a role in any recent changes to the ENERGY STAR program, like the most recent changes to most efficient designations?
Has the NYPP played a role in influencing sales of efficient appliances outside of New York? (If yes) How so?
Do you know if the national ES partners would have changed between 2010-2012 timeframe? Can you provide a list of national partners during this timeframe?
Are there any planned changes to the ENERGY STAR appliance program coming in the next year, and if so, how do you receive feedback from partners like the NYPP about these changes?
How well do the marketing strategies offered by your organization work together with programs like NYPP to promote ENERGY STAR products?
Is there anything else about the NYPP that you feel should be mentioned?
QUESTIONS FOR DOE
Are you familiar with the NYSERDA NY products program? This program had previously been called the New York Energy $martSM Program. (if not, ask if someone else might be familiar with the program).
Can you speak to the influence that this program has had on the DOE appliance efficiency standards? Direct or indirect would be fine.
More specifically, has the NYPP played a role in any recent changes to the DOE efficiency standards?
A-122

Has the NYPP played a role in influencing sales of efficient appliances outside of New York? (If yes) How so?
Do you collaborate with or in any way discuss details of the appliance and equipment standards program with program administers in NY?
Do you think there is potential for marketing strategies offered by the DOE to collaborate with programs like NYPP to promote energy efficient products?
Is there anything else about the NYPP that you feel should be mentioned?
A.32 Pool Pump Market Actor Interview Guide
New York Products Program
Pool Pump Manufacturer/Distributor/Contractor Interview Guide
August 2013
NAME: DATE: INTERVIEWER: RESPONDENT NAME: RESPONDENT COMPANY: [Select One] MANUFACTURER / DISTRIBUTOR / CONTRACTOR Interview Objectives
• Current market share for high-efficiency pool pumps
• Market barriers/drivers for high-efficiency pool pumps
• How the program might better team with them to promote high-efficiency pool pumps
• Reasons for non-participation
Hello, my name is [interviewer name], and I’m calling on behalf of the New York State Energy Research and Development Authority (“NYSERDA”). NYSERDA is conducting a study about pool pumps in New York State. We are evaluating NYSERDA’s New York Products Program (NYPP), formerly known as the New York Energy $martSM Products Program. This program provides incentives for high-efficiency pool pumps. This interview should only take approximately twenty minutes. Is now a good time to talk, or would you prefer to schedule a different time that we can have a brief interview?
The information you provide will be kept confidential to the extent permitted by law. We will report all responses in aggregate and will not attribute any comments to you. I’ll be audio recording this
A-123

interview, but this is just for my note-taking purposes as it is difficult to simultaneously administer survey and take reliable notes – is that OK?
1-1 I’d like to speak with someone in your company who is familiar with the sales trends for the pool pumps you sell? Are you the person MOST familiar with your company’s sales of pool pumps in NYS?
1 YES
2 NO [Attempt to get respondent; if respondent not available, ask if anyone else at the establishment makes purchasing or stocking decisions. IF NOT a good time to talk, SET UP CALL BACK APPOINTMENT OR OFFER TO LET THEM CALL US BACK AT 1-800-XXX-XXXX.]
[READ IF NECESSARY This study will help us understand the impact this program has had on energy efficient pool pumps. We would like to learn more about your experiences with selling energy efficient pool pumps.]
[READ IF NECESSARY: I’m not selling anything; I’d just like to ask your opinion about energy efficient pool pumps sales trends. The study team of Apex Analytics, LLC, as independent research firms, will keep the information private to the extent permitted by law. NYSERDA’s analysis will only use summary level data and will not identify individual respondents or firms.]
[IF REFERRED TO CORPORATE: “Right now we are looking for input at the store level; corporate-level surveys are being conducted as another part of this study.]
Do you have any questions before we get started – if so I can help address them or you can also contact the senior project manager at NYSERDA, Victoria Engel-Fowles (1-866-697-3732, ext. 3207)?
SECTION 1: PROGRAM AWARENESS AND OPPORTUNITIES
1-1. Have you heard of the NYSERDA Products program, and the fact that they offer buy down incentives for –high-efficiency pool pumps to manufacturers and retailers? [IF AWARE OF PROGRAM THEN ASK Q1-2 to Q1-5]
1-2. Why hasn’t [ORG NAME] chosen to participate in the program?
1-3. What changes would be required so that you would be willing to participate?
1-4. Are there any additional barriers to having you join the program? 1-5. What could NYSERDA do that could cause you to consider partnership? 1-6. [IF NOT AWARE OF PROGRAM READ] We would like to know how the program might better
team with you to promote high-efficiency pool pumps. i. What do you think NYSERDA can do to promote high-efficiency pool pumps?
SECTION 2: MARKET BARRIERS AND DRIVERS
2-1. We are trying to understand the market barriers and drivers for high-efficiency pool pumps:
i. Do consumers know about (and specifically request) two-speed and variable speed, or high-efficiency single-speed pool pumps?
A-124

ii. How about the new ENERGY STAR pool pumps? Do they know about and ask for them?
iii. What do you feel are the primary market barriers to high-efficiency pool pump purchases?
iv. What are the key reasons for consumers to purchase high-efficiency pool pumps? [PROBE FOR REASONS OTHER THAN SAVING ENERGY]
2-2. Do you promote two-speed, variable speed, and now, with the new specifications, the ENERGY STAR pool pumps? Why or why not?
SECTION 3: SALES AND MARKET SHARE
3-1. To evaluate the pool pump portion of its Products program, NYSERDA is looking for information about the percentage of total pool pumps represented by high-efficiency models (variable, two speed, and efficient single-speed pumps) in New York State, excluding Long Island, in 2011 and 2012. For each of these areas, what percentage of [ORG NAME]’s 2011 and 2012 sales to retailers (not to distributors) of all pool pumps were sales of high-efficiency (two-speed/variable speed/high-efficiency single-speed) pumps? [ASSURE CONFIDENTIALITY; IF THEY CAN’T PROVIDE NYSERDA, AREA DATA, THEN ASK FOR NYS DATA. IF THEY NEED A DEFINITION OF THE NYSERDA AREA, SAY “all of NYS except Nassau & Suffolk counties.”)]
2011-2012 Sales
Indicate if data are for ____NYSERDA AREA or ____NYS
Two-speed ___%
Variable speed ___%
High-efficiency single-speed ___%
Standard ___%
Total 100%
3-2. ENERGY STAR introduced a new specification for pool pumps in February 2013. Given this change, do you expect these percentages to remain the same in 2013 and for the next few years, or do you expect them to change?
v. [IF EXPECT CHANGES THEN ASK] What will be driving these changes?
vi. How do you expect the percentages to change? [PROBE FOR % ES VS. NON-ENERGY STAR]
SECTION 4: FIRMOGRAPHICS
A-125

4-1. [FOR RETAILERS/CONTRACTORS] What general geographic areas do you serve within New York State?
4-2. [FOR RETAILERS/CONTRACTORS] How many installers do you have?
4-3. [FOR RETAILERS/CONTRACTORS] What other services does your business provide in addition to pool pumps?
4-4. Approximately how many pool pumps do you sell/install in a typical year in New York State, excluding Long Island?
4-5. Anything else that you would like to share with NYSERDA regarding opportunities to better promote high-efficiency pool pumps?
Thank you for your time, have a great day.
A-126

Appendix B SRBI Weighting Methodology
B.1 NYSERDA Weighting Description for New York and Comparison Area
B.1.1 Weighting Summary for the NYSERDA Residential End-Use Survey
The NYSERDA Residential End-User Survey, fielded for NYSERDA by Abt SRBI, obtained telephone interviews with 681 adults in the state of New York who made purchasing decisions about appliances in their household. Households in the counties of Suffolk and Nassau were excluded from the sample frame. The survey featured a dual-frame overlapping landline and cellphone random-digit dial (RDD) design. There were 597 telephone interviews conducted with individuals in the landline sample and 84 in the cellphone sample.
Five weights were computed for use in analyzing these survey data. A household-level weight was computed for all surveyed respondents, i.e., “eligible” respondents who completed the appliance module survey for the appliance(s) they purchased, as well as those respondents who were designated as “ineligible” for the survey (n=1,323). A respondent is classified as ineligible because they either: 1) did not purchase an eligible appliance, or 2) if they purchased an eligible appliance, there were 200 purchasers (desired minimum target) who had already completed the appliance-specific questionnaire module. And four additional weights were computed for respondents who completed up to two of the appliance-specific questionnaire modules for one or more of the four appliances for which the survey screened (i.e., a unique weight for each of four appliance groupings).
B.1.2 Household-Level Weight
A household-level weight was computed for the 2,004 respondents who either completed the appliance survey (this completion means the appliance-specific module) or were screened-out of the appliance survey and classified as ineligible as described above. Some household demographics were collected from these ineligible respondents for weighting purposes. Due to the lack of information on household telephone service for these screened-out respondents, no base weight adjustment for “telephone service type” could be computed for their weights. Therefore, a post-stratification, iterative raking procedure, excluding any base weight, was used to demographically weight the sample. The weighting procedure used the following available household variables:
• Home Ownership (own; rent; occupy without rent)
• Type of Residence (single family; all other)
• NY State Region (upstate; downstate)
• Age of Head of Household (18-24; 25-34; 35-44; 45-54; 55-64; 65+)
B-1

• Education of Head of Household (high school or less; some college/AA; BA or higher)
[Note: with the exception of Region, each of the above also had a “refused/don’t know” category]
A raking procedure is used to reduce biases from nonresponse and non-coverage in sample surveys. The raking result simultaneously aligns sample household characteristics to estimated benchmarks for the state of New York. The benchmarks used in the raking procedure were the same as the variables listed above. For weighting purposes, households in Westchester County and the five counties comprising New York City are classified as “downstate,” while those in the rest of New York State (excluding Nassau and Suffolk counties) are classified as “upstate.” These benchmarks were obtained from the 2012 American Community Survey (U.S. Census Bureau) by filtering on households in the state of New York (excluding those in Nassau and Suffolk counties).
After the raked weights were generated, their distribution was examined. Weights were trimmed (Winsorized51) at the 2nd and 98th percentiles to prevent individual interviews (i.e., those with large weights) from having too much influence on the final estimates. This trimming process also served to reduce the variance of the weight values and in turn reduce the design effect from weighting. The final state-level weights (NYWEIGHT) are scaled to sum to the total number of eligible and ineligible cases (i.e., sum=2,004).
B.1.3 Purcaser Weights
Respondents who reported that they had recently purchased an eligible appliance were asked to complete a module of questions about that appliance. Four purchaser weights were computed to correspond to each of the four appliance modules in the survey. Note that some respondents purchased more than one eligible appliance and therefore may have more than one purchaser weight.
The purchaser weights were computed based on the household-level weights for the respondents who completed each module. To compute the purchaser weight for each appliance, the NY State weight (NYWEIGHT) is used for respondents who completed each appliance module. Next, these state weights are re-scaled so that the sum of the weights equals the total number of respondents who completed the module. Rescaling allows the full nominal sample size to be used in analyses yet preserves the relational proportions of the weights among respondents in each group. The purchaser weights are named as follows for each appliance module:
Appliance Module Purchaser Weight Name Sum of Weights
Refrigerator NYITEM1_WGT 200 Clothes washer NYITEM2_WGT 202 Dishwasher NYITEM3_WGT 187 Room air conditioner NYITEM4_WGT 251
51 The cases with weight values above or below the cut-off weight value are assigned the cut-off weight value.
B-2

When computing the purchaser weight for room air conditioner (NYITEM4_WGT), it was determined that the minimum values of the weights had to be trimmed further to ensure that the final re-scaled weight had a positive minimum value. Prior to computing NYITEM4_WGT, the NYWEIGHT was trimmed to a minimum of 0.34104, the 9th percentile of its distribution versus the 2nd percentile of the NYWEIGHT distribution used for other weights.
The design effect (Deff) is the ratio of the variance derived from a survey sample design to the variance that would be obtained from a simple random sample. We estimate of the design effect (Deff) based on the study sample weights as the ratio of the average of the squared weights to the average of the weights. The formula for that estimation is:
Deff= [(Σ wi2)/n]/ [(Σ wi)/n]
where n equals your sample size. When using weights that are scaled to the sample size, this formula gets simplified to just the ratio of the sum of the squared weights to the sum of the weights:
Deff= Σ wi2/ Σ wi .
Weighting has a statistical impact on the resulting sample size in that the weighted sample, in effect, is reduced. Although the weights will sum to the nominal sample size, in statistical tests where weighted data are used, those test need to use what is called the effective sample size for variance calculations.52 The effective sample size (or effective base) is calculated as n divided by the design effect.
Table B-1 below shows the descriptive statistics and trimming levels for all weights in the New York sample, their design effect and the resulting effective sample size.
Table B-1: New York Sample Weights
Weight name and percentile trim levels
n Median Min Max Standard Deviation
Design Effect
Effective n
NYWEIGHT trimmed at 2nd and 98th 2,004 0.736 0.305 3.403 0.734 1.54 1,303 NYITEM1_WGT using NYWEIGHT trimmed at 2nd and 98th
200 0.843 0.460 3.278 0.528 1.28 156
NYITEM2_WGT using NYWEIGHT trimmed at 2nd and 98th
202 0.814 0.468 3.570 0.618 1.38 146
NYITEM3_WGT using NYWEIGHT trimmed at 2nd and 98th
187 0.865 0.556 2.955 0.473 1.22 153
NYITEM4_WGT using NYWEIGHT trimmed at 9th and 98th*
251 0.710 0.005 3.045 0.914 1.84 137
52 For generalized and approximate values of the standard error (se) for a given proportion (p) that incorporate the Deff, the following formula can be used:
se(p)= z[Deff(pq/n)]1/2 where z = the normalized confidence level (e.g., for 2-tailed 95% confidence, z. 975 = 1.96), p is your study
proportion of interest, q = (1 - p), and n is the sample size. However, variance calculations that take into account complex sample designs may also be used with available statistical packages such as SAS, SPSS or STATA.
B-3

* More aggressively trimmed at the lower end to achieve a positive minimum for these small weights.
Note: The mean value of each category of weight is 1.000
B.1.4 Weighting Summary for NYSERDA Comparison Area End-Use Survey
The Comparison Area End-Use Survey, fielded for NYSERDA by Abt SRBI, obtained telephone interviews with adults who made purchasing decisions about appliances in their household in three regions of the United States: the state of Virginia, Washington D.C., and the metropolitan area of Houston, Texas. The survey featured a dual-frame overlapping landline and cellphone random-digit dial (RDD) design. A total of 651 adults were interviewed: 306 adults in the state of Virginia, 189 adults in Washington DC, and 156 adults in the metropolitan area of Houston. Out of the 651 completed interviews, 620 were conducted with in the landline sample and 31 in the cellphone sample.
As in the New York Residential End-Use Survey, five weights were computed for use in analyzing these comparison-area survey data. A household-level weight was computed for all surveyed respondents, i.e., “eligible” respondents who completed the appliance module survey for the appliance(s) they purchased, as well as those respondents who were designated as “ineligible” for the survey (n=1,756). A comparison area respondent is classified as ineligible because they either: 1) did not purchase an eligible appliance, or 2) if they purchased an eligible appliance, there were 200 purchasers (desired minimum target) who had already completed the appliance-specific questionnaire module. And four additional weights were computed for respondents who completed up to two of the appliance-specific questionnaire modules for one or more of the four appliances for which the survey screened (i.e., a unique weight for each of four appliance groupings).
B.1.5 Household-Level Weight
A household-level weight was computed for the 2,407 respondents who either completed the appliance survey (this completion means the appliance-specific module) or were screened-out of the appliance survey and classified as ineligible as described above. Some household demographics were collected from these ineligible respondents for weighting purposes. Due to the lack of information on household telephone service for these screened-out respondents, no base weight adjustment for “telephone service type” could be computed for their weights. Therefore, a post-stratification, iterative raking procedure, excluding any base weight, was used to demographically weight the sample. The weighting procedure used the following available household variables:
• Home Ownership (own; rent; occupy without rent)
• Type of Residence (single family; all other)
• Pseudo “NY State Region” (upstate; downstate)
• Age of Head of Household (18-24; 25-34; 35-44; 45-54; 55-64; 65+)
B-4

• Education of Head of Household (high school or less; some college/AA; BA or higher)
[Note: with the exception of Region, each of the above also had a “refused/don’t know” category]
B.1.6 Pseudo Comparison Area Benchmarks
To weight the comparison area data, a raking procedure is used to reduce biases from nonresponse and non-coverage in sample surveys. The raking result simultaneously aligns sample household characteristics to estimated benchmarks. Abt SRBI was requested by the project client to use the New York State benchmarks, those identical benchmarks used in weighting the New York residential end-use survey, as benchmarks for the comparison area. Not being the benchmarks for the same geographic area where the data were in fact collected, these “pseudo benchmarks” are intended to make the comparison area sample resemble the New York sample along the demographic dimensions measured, i.e. the list of variables shown in the previous section. However, the New York State regions, for purposes of this comparison area, have been redefined as “upstate” being households in Houston and Washington D.C., and “downstate” as households in the state of Virginia. Again, these New York benchmarks were obtained from the 2012 American Community Survey by filtering on households in the state of New York (excluding those in Nassau and Suffolk counties).
After the raked weights were generated, their distribution was examined. Weights were trimmed at the 4th and 96th percentiles to prevent individual interviews (i.e., those with large weights) from having too much influence on the final estimates. This trimming process also served to reduce the variance of the weight values and in turn reduce the design effect from weighting. The trimming for the comparison areas was slightly more than necessary for the New York sample, perhaps a function of the sample being sourced in different geographies. The final state-level weights (COMPWEIGHT) are scaled to sum to the total number of eligible and ineligible cases (i.e., sum=2,407).
B.1.7 Purchaser Weights
Respondents who reported that they had recently purchased an eligible appliance were asked to complete a module of questions about that appliance. Four purchaser weights were computed to correspond to each of the four appliance modules in the survey. Note that some respondents purchased more than one eligible appliance and therefore may have more than one purchaser weight.
The purchaser weights were computed based on the household-level weights for the respondents who completed each module. To compute the purchaser weight for each appliance, the comparison area weight (COMPWEIGHT) is used for respondents who completed each appliance module. Next, these weights are re-scaled so that the sum of the weights equals the total number of respondents who completed the module. Rescaling allows the full nominal sample size to be used in analyses yet preserves the relational proportions of the weights among respondents in each group. The purchaser weights are named as follows for each appliance module:
B-5

Appliance Module Purchaser Weight Name Sum of Weights
Refrigerator COMPITEM1_WGT 296 Clothes washer COMPITEM2_WGT 216 Dishwasher COMPITEM3_WGT 206 Room air conditioner COMPITEM4_WGT 123
When computing the purchaser weight for room air conditioner (COMPITEM4_WGT), it was determined that the weights had to be trimmed further to optimize the effective sample size for the small number of cases in this group (n=123). Prior to computing COMPITEM4_WGT, the COMPWEIGHT was trimmed to the 6th and 94th percentiles of its distribution versus the 4th and 96th percentiles of the COMPWEIGHT distribution used for other weights.
Table 2-1 below shows the descriptive statistics and trimming levels for all weights in the comparison area sample, plus their design effect and the resulting effective sample size (see descriptions in Section B.1.3).
Table B-2: Comparison Area Sample Weights
Weight name and percentile trim levels
n Median Min Max Standard Deviation
Design Effect
Effective n
COMPWEIGHT trimmed at 4th and 96th 2,407 0.628 0.223 3.704 0.891 1.79 1,342 COMPITEM1_WGT using COMPWEIGHT trimmed at 4th and 96th
296 0.810 0.429 3.910 0.628 1.39 212
COMPITEM2_WGT using COMPWEIGHT trimmed at 4th and 96th
216 0.708 0.309 3.790 0.802 1.64 131
COMPITEM3_WGT using COMPWEIGHT trimmed at 4th and 96th
206 0.827 0.534 3.536 0.516 1.27 163
COMPITEM4_WGT using COMPWEIGHT trimmed at 6th and 94th *
123 0.571 0.278 2.954 0.842 1.71 72
* More aggressively trimmed at the lower end to achieve a more optimal design effect in light of the small sample size. Note: The mean value of each category of weight is 1.000
B-6

Appendix C Comparison Area Memo
C.1 Summary
This memo presents an update on our recommendation for the proposed New York Products Program (NYPP) process and market evaluation Comparison Areas.53 The goal of including Comparison Areas in this evaluation effort is to represent market characteristics (e.g., awareness of ENERGY STAR®, sale of ENERGY STAR qualifying units) in locations similar to New York, but in absence of NYSERDA-sponsored activity. Thus the purpose of the comparison area approach is to estimate market effects: sales “lift” from both participating and non-participating retailers as a mechanism to capture a more fully comprehensive net-to-gross ratio.
C.2 Current Status of Comparison Area
On August 9, 2013, we met with NYSERD, DPS, and DPS consultants to discuss the comparison area approach. During the meeting we agreed to utilize an incremental research approach to the comparison area task. Follow-up items included: speaking with upstream market actors first, to determine if the NYPP impacted sales in the proposed comparison areas; calling program administrators in regions near the proposed comparison areas; interviews with DOE/ACEEE/EPA to assess the NYPP impact on the proposed comparison areas. Each of these items is discussed below.
C.3 Upstream Market Actor Interviews
The upstream interviews were also used as an attempt to find contacts that might be more familiar with sales in the comparison areas. To date, we have conducted three upstream interviews with corporate retailers (two program participants and one non-participant). In all instances, the corporate representative emphatically stated that the NYPP has had no impact on the ENERGY STAR market within the comparison areas. Anecdotally, when asked the impact of the NYPP on sales in these other areas on a scale of “1” to “5”, one respondent asked if there was a “0” response option because the program had no influence. All representatives were asked if there was a contact within their company that was more knowledgeable with sales in the comparison areas, but none were aware of anyone better suited to answer questions pertaining to the comparison areas.
53 The initial memo outlining the Comparison Area methodology was prepared on July 26, 2013 (“Comparison Area for the 2013 New York Products Program (NYPP) Process and Market Evaluation”)
C-1

C.4 Interviews with Program Administrators in Close Proximity to Selected Comparison Areas
To evaluate the validity of the concern that Maryland EE programs may have “bled” over into Washington, D.C. (and even perhaps Virginia), interviews were conducted with representatives from the District of Columbia Sustainable Energy Utility (DCSEU) and a large several state utility that serves the mid-Atlantic region. The program manager at DCSEU stated that while DC residents do shop for home appliances almost exclusively outside of DC, the sole impact of the Maryland EE programs would come through advertising campaigns, due to a common media market. She did note, however, that most of these advertisements clearly mention that they are only available to Maryland residents, in her opinion negating their impact on DC residents. Furthermore, she speculated that DC residents are more likely to shop for home appliances in Virginia as opposed to Maryland, which is significant because Virginia lacks an EE home appliance rebate program.
Additionally, the representative from the mid-Atlantic region utility spoke at length about their programs and potential influence on the Virginia and Washington, D.C. area markets. This representative confirmed that the only impact that their utility programs could possibly have had on the comparison area markets is via marketing and advertising spillover. He claimed that the marketing efforts likely reached the comparison areas, but only in messaging and in no way could residents of these areas be able to participate or leverage any of their programs, since it is a requirement of their program that participants live in their service territory.
C.5 Interviews with DOE/ACEEE/EPA
Additionally, comparison area research was to also include interviews with DOE/ACEEE/EPA/Others to assess how the NYPP (and other EE programs) have impacted both product codes as well as the ENERGY STAR specifications for the appliances. At this time, we have drafted a preliminary interview guide and are awaiting approval from NYSERDA to proceed with the interview process therefore cannot provide insight from these entities.
C.6 Recommendation
Based on the research conducted to date, we recommend that we move forward with the Comparison Area approach as outlined in the July 26, 2013 memo. We also recommend that we try to proceed as quickly as possible for a few reasons:
• With the upcoming holiday season it will be more difficult to complete the customer interviews;
• The focus of the study is on 2010-2012, so now that 2013 is nearly done it will be more difficult to impact that time period with the Comparison Area sample;
• Each month we wait to collect Comparison Area data it will be further out of “sync” with the New York survey, which is already complete;
C-2

• The Comparison Area approach will also allow for controlling for impacts of the ARRA funding (since the Comparison Areas also received funding);
• The upstream market actor interviews have been extremely difficult to complete, and we are concerned that we will have a very small sample with which to estimate NTG if we don’t use the Comparison Area approach.
In moving forward with the comparison area approach, we propose to use the regions outlined in the July 26, 2013 memo (Virginia, Washington, DC, and Houston, TX). In addition, as discussed in August we will work on a careful weighting scheme to appropriately adjust for the upstate vs. downstate differences within New York. The factors used in the weighting scheme will be based upon research detailing what characteristics (demographics, housing characteristics, etc.) influence the purchase of EE products.
C-3