
NYS SAGE Report 2013-02-12
150
State of New York Governor Andrew M. Cuomo Final Report February 2013 SPENDING AND GOVERNMENT EFFICIENCY COMMISSION
-
Upload
applied-web-ny -
Category
Documents
-
view
77 -
download
1
description
The Spending and Government Efficiency (SAGE) Commission final report on modernizing and rightsizing New York State government.
Transcript of NYS SAGE Report 2013-02-12
State of New YorkGovernor Andrew M. Cuomo
Final Report February 2013SPENDING AND GOVERNMENT EFFICIENCY COMMISSION

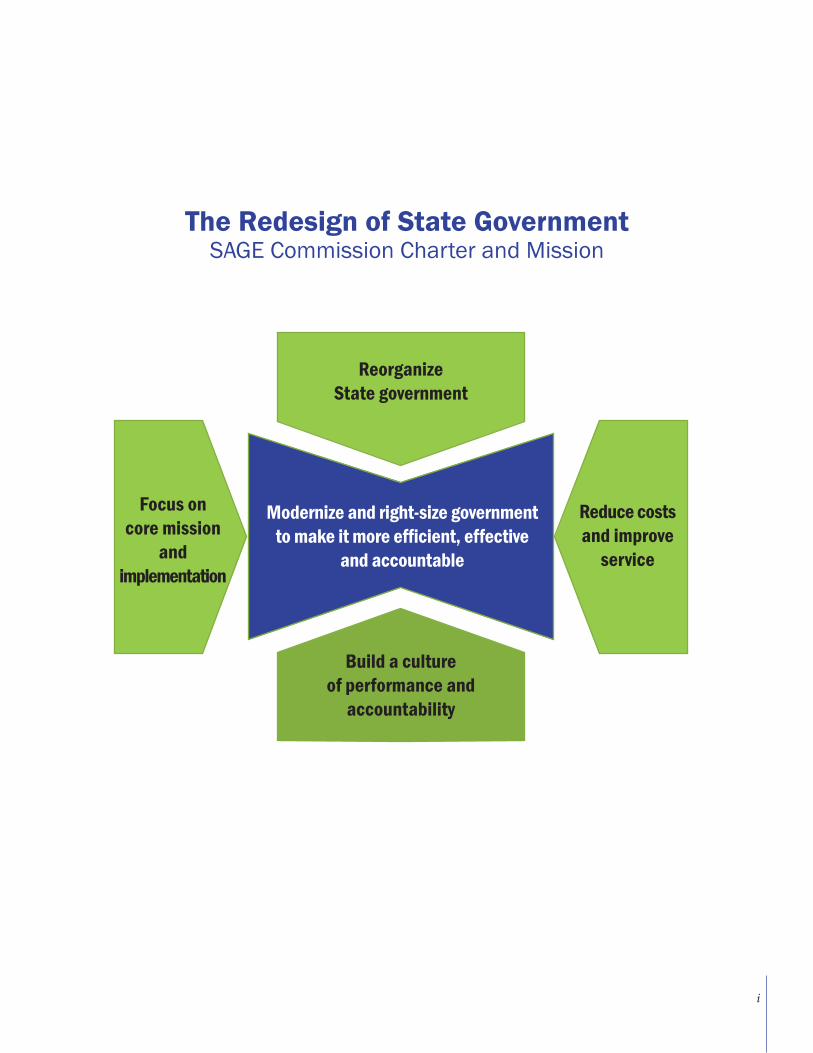
SAGE Commission Charter and Mission
ReorganizeState government
Build a cultureof performance and
accountability
Focus on core mission
andimplementation
Reduce costsand improve
service
Modernize and right-size governmentto make it more efficient, effective
and accountable
The Redesign of State Government
i
ii
February 12, 2013
Chair Robert Duffy, Lieutenant Governor of the State of New York
Vice-Chair Paul Francis, Director of Agency Redesign and Efficiency
Commission MembersMichael Balboni, RedLand Strategies Inc., President and Managing DirectorState Senator Greg Ball, NY District 40 (Designee of Senate Majority)Neil Cole, Iconix Brand Group, Inc., CEOJim Corcoran, James P. Corcoran, LLC, President and FounderState Assemblywoman Jane Corwin, NY District 142 (Designee of Assembly Minority)State Assemblyman Steve Englebright, NY District 4 (Designee of Assembly Majority)Cheryl Cohen Effron, Greater NY, FounderCheryl A. Felice, Suffolk County Association of Municipal Employees, Former PresidentAlan Gerry, Granite Associates, LP, Chairman and CEOBarry M. Gosin, Newmark, Grubb, Knight, Frank, CEODenis M. Hughes, New York State AFL-CIO, Former PresidentDerek G. Johnson, Integrated Holdings Corp., CEOState Senator Liz Krueger, NY District 26 (Designee of Senate Minority)Simone Levinson, Turnaround for Children, Vice Chairman of the Board of DirectorsLillian Rodríguez López, The Coca-Cola Company, Director of Latin AffairsAnthony E. Malkin, Malkin Holdings, LLC, PresidentKevin P. Ryan, Gilt Group, Founder and CEORobert Samson, IBM’s Global Public Sector, General Manager (Retired)Jonathan Sandelman, Mercer Park, LP, Managing PartnerRichard Sirota, Walter N. Danrich Organization, ChairmanPeter J. Solomon, Peter J. Solomon Company, LP, Founder and ChairmanAndrew J. Spano, Former Westchester County ExecutiveMax Stier, Partnership for Public Service, PresidentRobert Zimmerman, Zimmerman Edelson Inc., Partner and Founder
Staff Derek Utter, Deputy Director of Agency Redesign and EfficiencyJames DeWan, Policy DirectorDani Cinali, Policy AnalystBrian Carlton Kilduff, Policy AnalystNick Willett-Jeffries, Policy AnalystBenjamin Wetzler, Policy Analyst
Lieutenant Governor’s StaffJohn Maggiore, Chief of StaffBrian Quiara, Director of Policy
SAGE Commission Team
iii
H I G H L I G H T S
Part I – Reorganizing Government• The most comprehensive reorganization of State government since Governor Al Smith’s in
the 1920s:
o Consolidations and Rightsizing of Facilities: Savings of approximately $294 million annually to be realized through closing excess prisons, adopting a community-based approach to juvenile justice which reduces the need for residential facilities, de-institutionalizing mental health and custodial care facilities for persons with developmental disabilities, eliminating excess leased office space by “restacking” State agencies, and consolidating warehouses, printing and laboratory operations.
o Consolidations of Functions: Savings of approximately $241 million annually to be realized through consolidation and modernization of back-office and support functions, including finance and HR operations, procurement, asset management and call centers. In addition to providing these back-office and support functions through a shared services model, further efficiencies will be achieved through realignment of functions to better fit the host agency’s core mission, such as the transfer of all Medicaid rate setting to the Department of Health and coordination of all employee health insurance purchasing between the Department of Civil Service and the Depart-ment of Health, which will save approximately $104 million annually.
o Consolidations of Agencies and Authorities: Mergers and consolidations involving a total of 14 agencies and authorities have been completed or proposed in the 2013-14 Executive Budget. If the additional merger and consolidation options identified by the SAGE Commission for future consideration were also adopted, it will have reduced the number of major agencies and authori-ties by 23% since the Governor took office.
o Coordination of Interagency Activities: Formal coordination mechanisms for critical interagency activities, including the NY Works Task Force for infrastructure and capital planning, Regional Economic Development Councils and a Consolidated Funding Application for economic develop-ment, a revitalized State Workforce Investment Board for all workforce development activities, and a statewide Master Plan for all energy efficiency initiatives in State facilities, will save approximately $100 million annually.
Part II – Reducing Costs and Improving Service • A comprehensive transformation of the State’s approach to information technology:
o IT Organizational Restructuring: Savings of approximately $190 million annually from (i) organization of the State’s 3,300 IT personnel and infrastructure operations into a new Information Technology Services organization, which is establishing statewide standards and managing personnel through agency cluster CIOs who report directly to the State Chief Information Officer; and (ii) modernization of IT infrastructure, including data centers, the conversion from traditional landlines to voice over Internet protocol (VoIP) telephone service, email standardization and user-identity management.
iv
H I G H L I G H T S O F I N I T I A T I V E S
o High ROI/High Impact IT Projects: Savings of approximately $100 million annually from the ac-celeration of the development of IT projects that have a high return on investment (ROI) or a high impact on customer service or other types of performance.
• Improved customer service and operational process efficiency:
o Customer Service Solutions: Greater convenience of licensing and permitting through an e-licensing platform that will allow online applications for more than 400 types of licenses issued by State agencies; significantly improve customer service at DMV by offering more convenient hours and reducing wait times by increasing the percentage of transactions that can be completed outside of a DMV office; and other initiatives.
o Operational Process Efficiencies: Streamlined management of the State’s contracting process with not-for-profit and other third-party providers improves their performance and creates savings for the State; Design-Build procurement authority for infrastructure projects produces savings of approximately $100 million annually.
• Modernizing the workforce:
o Controlling the Cost of the State Workforce: Savings of approximately $421 million from cost controls through new collective bargaining agreements with no salary increases in the outset of the contracts, increased employee contributions for health insurance, and a new Tier VI pension plan that will save the State and local governments more than $80 billion over the next 30 years.
o Workforce Flexibility: Increased flexibility in hiring and managing employees.
Part III – Building a Culture of Performance and Accountability• First-ever statewide performance initiatives:
o Education: Performance-based school aid and teacher evaluation system.
o New York Performs: A statewide performance management system for all major agencies and authorities, to be launched publicly by the end of 2013.
o Open New York: Initiatives to increase State government transparency and expand access to State government services, records and data.
• Focus on core mission and effective implementation:
o Core Mission: Framework for review of activities that are not central to advancing the core mission of State government.
o Implementation: Support implementation of government redesign initiatives through the use of LEAN management process and by leveraging private sector resources and expertise.
H I G H L I G H T S
v
H I G H L I G H T S O F I N I T I A T I V E S S A V I N G S U P O N F U L L I M P L E M E N T A T I O N
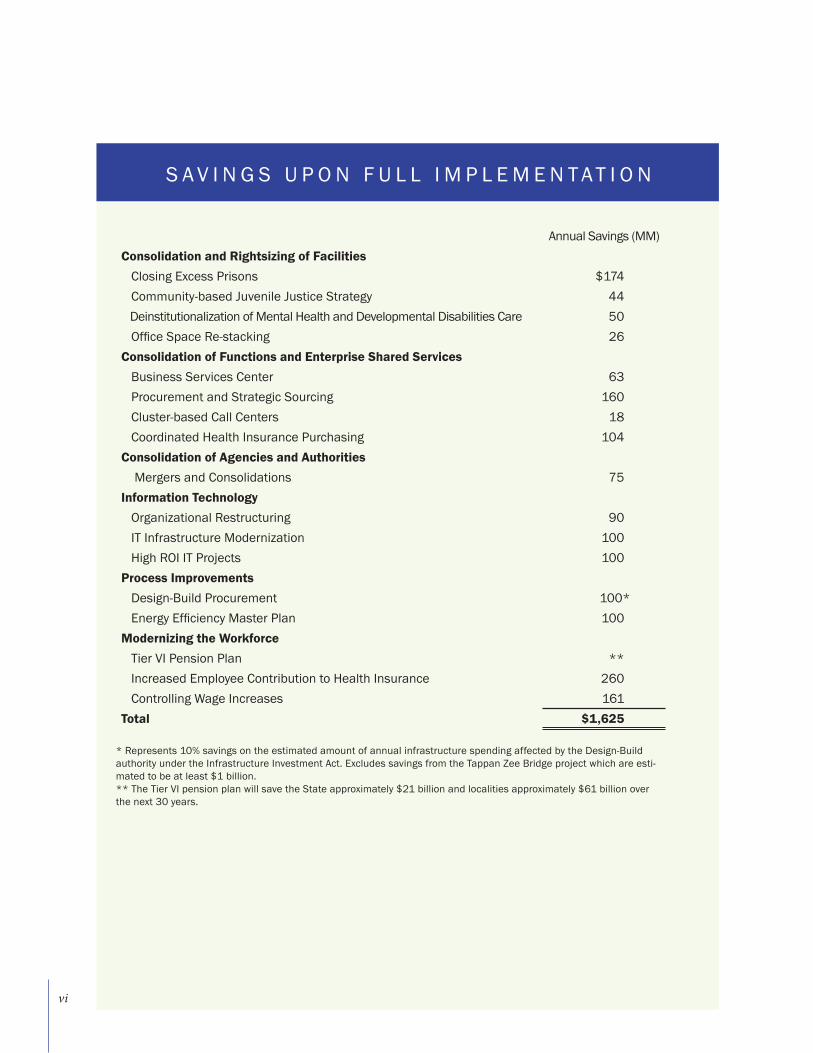
Annual Savings (MM)Consolidation and Rightsizing of Facilities Closing Excess Prisons $174 Community-based Juvenile Justice Strategy 44 Deinstitutionalization of Mental Health and Developmental Disabilities Care 50 Office Space Re-stacking 26Consolidation of Functions and Enterprise Shared Services Business Services Center 63 Procurement and Strategic Sourcing 160 Cluster-based Call Centers 18 Coordinated Health Insurance Purchasing 104Consolidation of Agencies and Authorities Mergers and Consolidations 75Information Technology Organizational Restructuring 90 IT Infrastructure Modernization 100 High ROI IT Projects 100Process Improvements Design-Build Procurement 100* Energy Efficiency Master Plan 100Modernizing the Workforce Tier VI Pension Plan ** Increased Employee Contribution to Health Insurance 260 Controlling Wage Increases 161Total $1,625
* Represents 10% savings on the estimated amount of annual infrastructure spending affected by the Design-Build authority under the Infrastructure Investment Act. Excludes savings from the Tappan Zee Bridge project which are esti-mated to be at least $1 billion.** The Tier VI pension plan will save the State approximately $21 billion and localities approximately $61 billion over the next 30 years.
vi
CONTENTS
CHAPTER 1: INTRODUCTION .......................................................................................................................... 1 Background on the SAGE Commission ...................................................................................................... 1 Preparing For the Work of the Commission .............................................................................................. 1 The Commission’s Charter and Scope ...................................................................................................... 2 New York State’s Fiscal Situation............................................................................................................... 3 The New York State Workforce ................................................................................................................... 4 The Organizational Structure of New York State ....................................................................................... 5 Transforming State Government Performance ......................................................................................... 5 Summary of Initiatives ............................................................................................................................... 7
PART I: Reorganizing Government ............................................................................................. 14
CHAPTER 2: CONSOLIDATION AND RIGHTSIZING OF FACILITIES ............................................................ 14 Rightsizing Prisons and Custodial Care Facilities .................................................................................. 14 Closing Excess Prisons ...................................................................................................................... 14 Community-Based Juvenile Justice Strategy ................................................................................... 14 De-institutionalization of Mental Health and Developmental Disabilities Care ............................ 15 Consolidating Real Estate and Ancillary Activities .................................................................................. 16 Office Space Re-stacking .................................................................................................................. 16 Warehouses ....................................................................................................................................... 17 Printing Operations ............................................................................................................................ 17 Laboratory Facilities .......................................................................................................................... 18 Fleet Management ............................................................................................................................ 18 CHAPTER 3: CONSOLIDATION OF FUNCTIONS ........................................................................................... 19 Enterprise Shared Services ...................................................................................................................... 19 Business Services Center ................................................................................................................. 20 Procurement and Strategic Sourcing ............................................................................................... 20 Cluster-Based Call Centers ............................................................................................................... 21 Shared Services with Other State Entities and Local Governments...................................................... 22 Realignment of Functions ......................................................................................................................... 22 Creation of the Justice Center .......................................................................................................... 22 Belleayre Ski Center to ORDA ........................................................................................................... 23 Health and Disabilities Cluster Shared Services ............................................................................. 23 Coordinated Health Insurance Purchasing ...................................................................................... 24 Homeless Housing Assistance Program to HCR .............................................................................. 25 Mitchell-Lama Housing Portfolio to HCR .......................................................................................... 26 Realignment of Overlapping Functions between DPS and NYSERDA ............................................ 27 Coastal Zone Management to DEC .................................................................................................. 28 CHAPTER 4: CONSOLIDATION OF AGENCIES AND AUTHORITIES ............................................................ 29 Completed Mergers and Consolidations ................................................................................................. 30 Department of Financial Services .................................................................................................... 30 Department of Corrections and Community Supervision ............................................................... 31 Merger of NYSTAR into Empire State Development ........................................................................ 31 Merger of the Consumer Protection Board into the Department of State ..................................... 31 Gaming Commission ......................................................................................................................... 31 2013-14 Executive Budget Proposals ..................................................................................................... 32 Merger of the Welfare Inspector General (OWIG) into the Office of the Inspector General .......... 32 Consolidation of the Governor’s Office of Employee Relations and the Department of Civil Service ..... 33 Future Options ........................................................................................................................................... 33 Privatization of the Long Island Power Authority ............................................................................. 33
vii
Consolidation of Transportation Agencies and Authorities............................................................. 34Merger of Behavioral Health Agencies ............................................................................................. 37Higher Education Services Corporation Consolidation ................................................................... 39Merger of the Hudson River Valley Greenway into the Department of Environmental Conservation ..... 40Administrative Public Safety Agencies Consolidation ..................................................................... 41Business and Professional Licensing Agency .................................................................................. 42
Elimination of Unnecessary Boards and Commissions .................................................................. 43 Potential Mergers Reviewed but Not Recommended .............................................................................44 Areas for Further Review ..........................................................................................................................44 Dormitory Authority ............................................................................................................................ 45 NYC Urban Planning and Development ............................................................................................ 45 Buffalo and Ft. Erie Public Bridge Authority and the Niagara Falls Bridge Commission .............. 45 CHAPTER 5: COORDINATION OF INTER-AGENCY ACTIVITIES ................................................................... 47 New Formal Coordination Mechanisms ................................................................................................... 47 Regional Economic Development Councils ..................................................................................... 47 Consolidated Funding Application .................................................................................................... 48 NY Works Task Force Capital Planning ............................................................................................. 48 Workforce Development Initiatives .......................................................................................................... 50 Revitalize the State Workforce Investment Board (SWIB) ............................................................... 50 Linking Community College Aid to Employer Partnerships ............................................................. 51 Consistent Performance Metrics for Workforce Development Programs ...................................... 52 Energy ..................................................................................................................................................... 53 Master Plan for Energy Efficiency in All State Facilities .................................................................. 53 Reorganizing Emergency Response ......................................................................................................... 56
PART II: Reducing Costs And Improving Service ............................................................ 57
CHAPTER 6: INFORMATION TECHNOLOGY TRANSFORMATION ............................................................... 57 Enterprise-wide Initiatives ........................................................................................................................ 57 Organizational Restructuring ............................................................................................................ 58 IT Infrastructure Modernization ........................................................................................................ 60 IT-Enabled Business Process Redesign ................................................................................................... 62 Accelerating High ROI / High Impact IT Projects ............................................................................. 62 Rent Regulation System Redesign ...................................................................................................64 Workers’ Compensation Claims System Redesign .......................................................................... 65 CHAPTER 7: CUSTOMER SERVICE AND PROCESS IMPROVEMENT ........................................................ 67 Customer Service Solutions Involving Licensing and Permitting ........................................................... 68 E-Licensing ......................................................................................................................................... 68 DMV Licensing and Customer Service ............................................................................................. 69 Reform the State Environmental Quality Review (SEQRA) Process ................................................ 70 Professional and Business Licensing ............................................................................................... 71 Contracting and Grants Management ..................................................................................................... 72 Streamlining of the MWBE Certification Process ............................................................................ 72 Contracting with Not-For-Profits and Other Third-Party Providers .................................................. 73 Other Process Improvements ................................................................................................................... 74 LEAN Process Improvements ............................................................................................................ 74 Design-Build Procurement ................................................................................................................ 75 CHAPTER 8: MODERNIZING THE WORKFORCE .......................................................................................... 77 Controlling the Cost of New York State’s Workforce ............................................................................... 77 Controlling Wage Increases .............................................................................................................. 77 New Tier VI Pension Plan .................................................................................................................. 78
viii
Increased Employee Contribution for Health Insurance ................................................................. 78 Reduction in the Size of the Workforce ............................................................................................ 79 Layoff Avoidance ................................................................................................................................ 79 Flexibility in Hiring, Promotion, and Transfers ......................................................................................... 79 Civil Service Law Reform ................................................................................................................... 80 Operational Improvements in Administering Current Law .............................................................. 81 Performance Appraisal and the Disciplinary Process ............................................................................. 82 Discipline and Removal ..................................................................................................................... 82 Reform the Performance Appraisal Process ....................................................................................84 Attract and Manage Talent through DCS and GOER Consolidation ....................................................... 85 Aligning Agency and Authority Compensation ......................................................................................... 87
PART III: Building A Culture of Performance and Accountability ...................... 88
CHAPTER 9: PERFORMANCE MANAGEMENT ............................................................................................ 88 Performance and Accountability in Education ........................................................................................ 89 Performance-based School Aid Grants ............................................................................................ 89 Statewide Teacher Evaluation System ............................................................................................. 89 NY Performs – A Statewide Performance Management System ........................................................... 90 Screenshots of NY Performs ............................................................................................................. 91 Roll Out Plan For NY Performs .......................................................................................................... 94 Agency-based Performance Management Initiatives ............................................................................. 94 Medicaid Redesign Team Dashboard .............................................................................................. 94 Grading Performance of Third-Party Providers ................................................................................ 96 “Pay for Success” Program ............................................................................................................... 97 Performance Analytics ...................................................................................................................... 97 Review of Public Authorities by the Division of the Budget .................................................................... 98 Increasing Transparency through Open New York ................................................................................100 CHAPTER 10: CORE MISSION AND IMPLEMENTATION ............................................................................102 Framework for a Core Mission Review ...................................................................................................102 Regulatory Relief from Unnecessary Statutory Mandates ............................................................102 Commercial Activities ......................................................................................................................102 Competitive Benchmarking .............................................................................................................103 Underutilized Assets ........................................................................................................................104 Align Roles with Local Governments ..............................................................................................104 Implementation .......................................................................................................................................105 Internal Implementation Efforts .....................................................................................................105 Private Sector Partners ...................................................................................................................106 APPENDICES ................................................................................................................................................. 107 Appendix A: Executive Order No. 4 Establishing the SAGE Commission ............................................. 107 Appendix B: History of Major Agencies and Authorities .......................................................................111 Appendix C: Comprehensive List of New York State Organization Charts ...........................................115 Appendix D: Potential Agency Mergers Considered But Not Recommended .....................................125 Appendix E: List of Unnecessary Boards and Commissions ................................................................130
Appendix F: List of Preliminary Recommendations by the Commissions Convened by the Governor in Response to Superstorm Sandy .............................................................................................................132
Appendix G: Acronym Glossary ...............................................................................................................134
ix
List of Exhibits
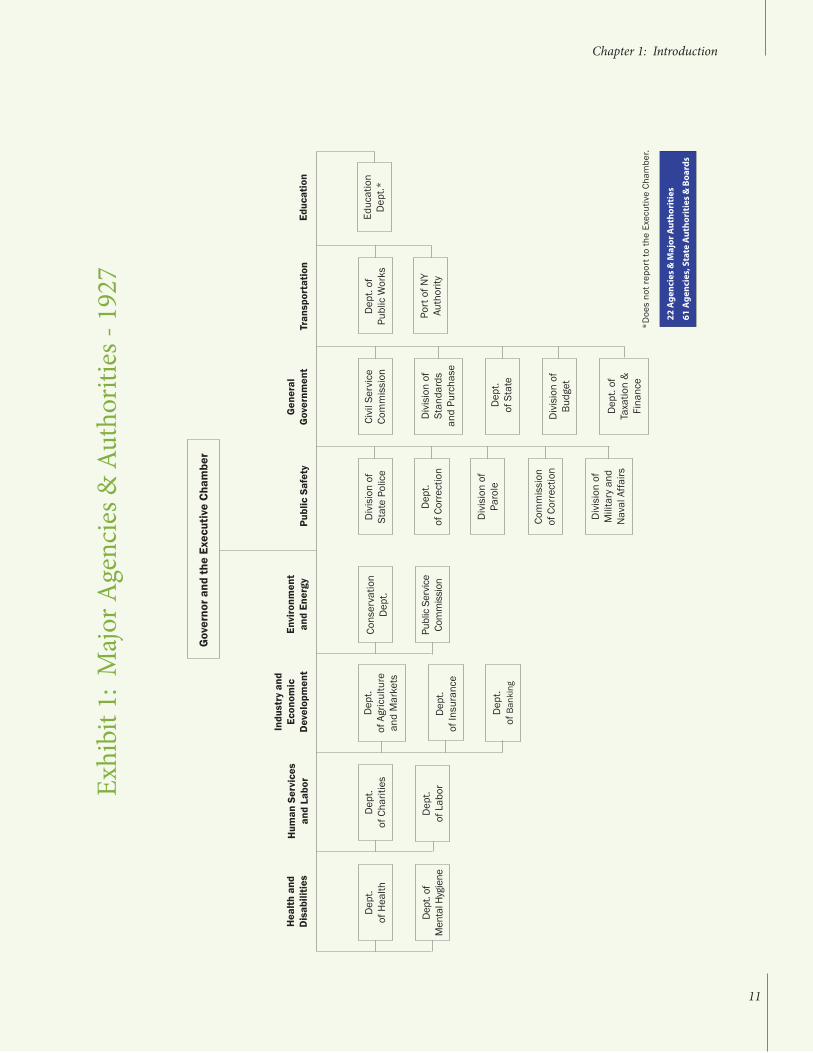
Exhibit 1 – Major Agencies and Authorities, 1927 Page 11
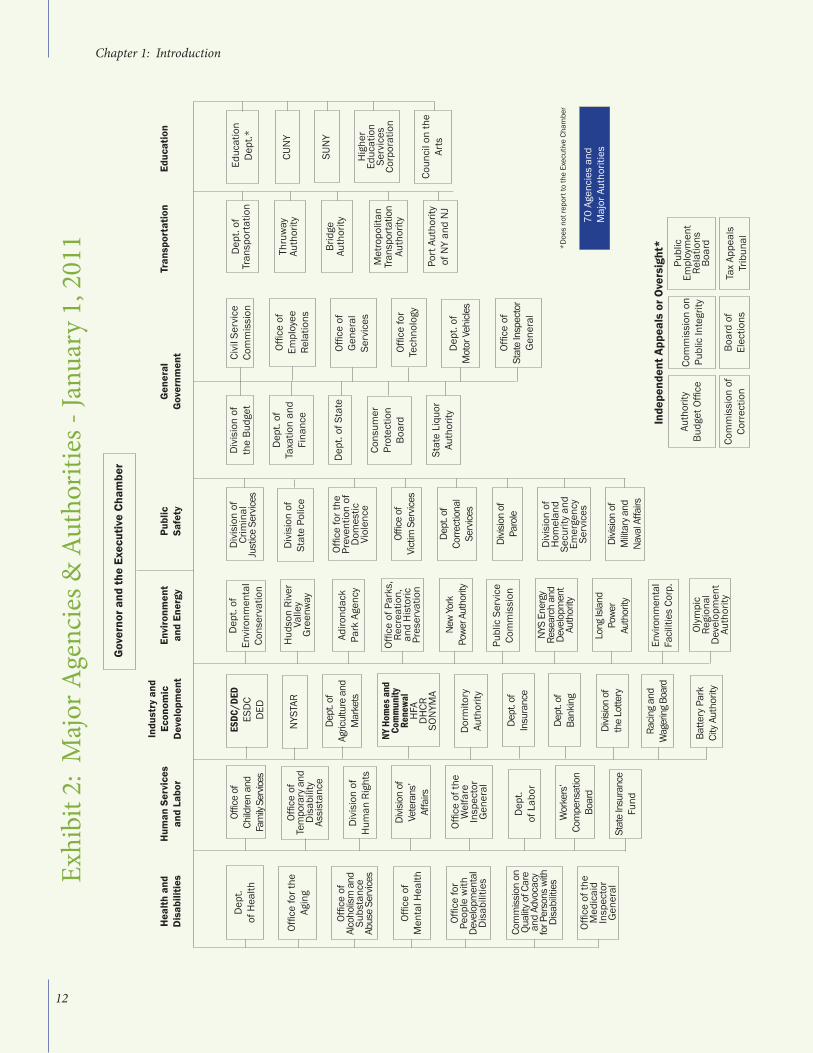
Exhibit 2 – Major Agencies and Authorities, 2011 Page 12
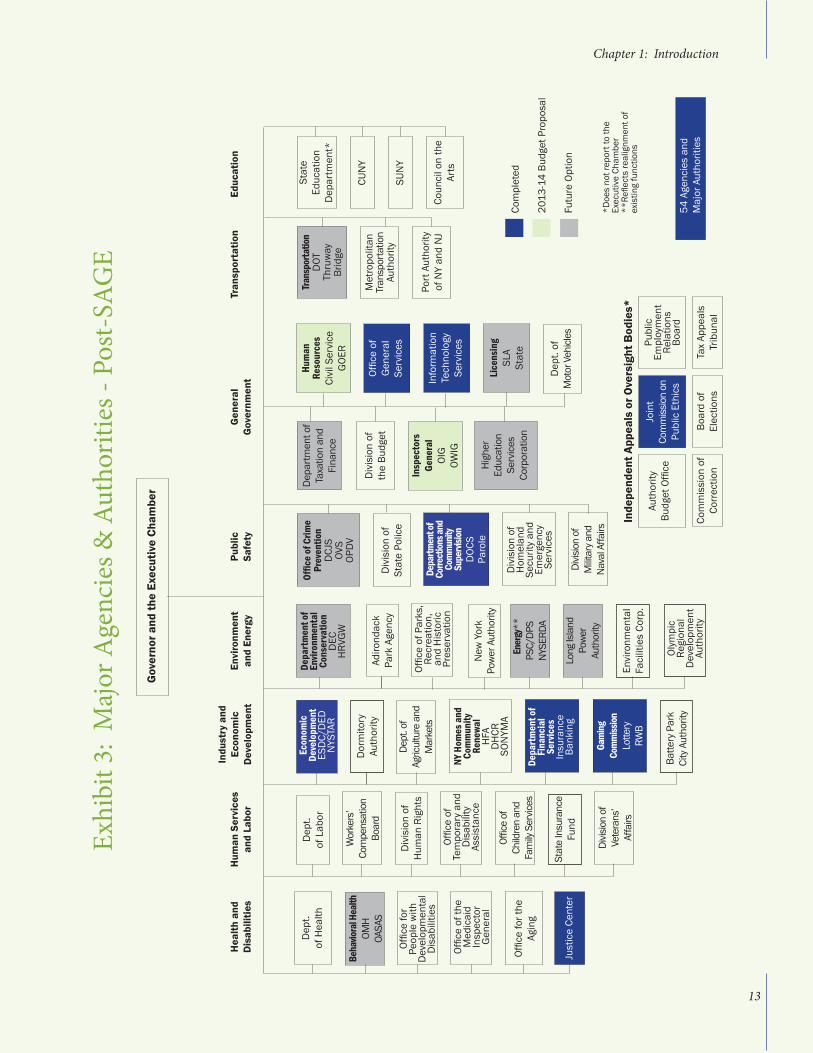
Exhibit 3 – Major Agencies and Authorities, Post-SAGE Page 13
Exhibit 4 – Enterprise Shared Services Functions Page 19
Exhibit 5 – Management Consolidation of Housing Entities Page 30
Exhibit 6 – Transportation Summary Statistics as of 2011 Page 35
Exhibit 7 – Completed, Proposed, and Future Merger and Consolidation Options Page 46
Exhibit 8 – Sample of NYS Workforce Development Reports Page 52
Exhibit 9 – Sample of NYC Quarterly Workforce Development Report Page 53
Exhibit 10 – Average Energy Utilization Intensity for State Buildings Page 54
Exhibit 11 – Information Technology Services Executive Team Page 58
Exhibit 12 – IT Agency Clusters Page 59
Exhibit 13 – IT Cluster Organization Structure Page 59
Exhibit 14 – Illustrative High ROI, High Impact Projects Page 63
Exhibit 15 – Customer Service Activities and Pain Points Page 68
Exhibit 16 – Compensation Differences between Heads of Agencies and Other State Entities Page 87
Exhibit 17 – Screenshots of NY Performs Page 91
Exhibit 18 – Medicaid Redesign Team Screenshot Page 95
Exhibit 19 – OASAS Treatment Scorecard Page 96
Exhibit 20 – New York State Public Authorities Page 99
x
Background on the SAGE Commission In his first State of the State address, Governor Cuomo called for the creation of the Spending and Government Ef-ficiency (SAGE) Commission as part of a broad effort to redesign and transform the performance of New York State government. The Governor directed the Commission to “undertake a comprehensive review of every agency of State government and recommend structural and operational changes to it” with the goal of making State government “more modern, accountable and efficient.”1
In the two years since that announcement, the Cuomo administration and the SAGE Commission have embarked on an ambitious program of operational improvements and organizational restructuring, while taking steps to increase the transparency, accountability and core mission-focus of State government. Collectively, these initiatives amount to the most fundamental restructuring of New York State government since the reorganization led by Governor Al Smith in 1927.
The primary focus of the SAGE Commission process has been the operations of State government; i.e., the work of State government performed directly by State agencies and authorities – as opposed to services funded by the State but performed by local governments, school districts or other third parties. Areas of State government beyond State operations – including Medicaid and education – have also been addressed by the Governor’s broader government transformation efforts.
The SAGE Commission’s work with the Cuomo administration has focused primarily on “executive-controlled” State agen-cies (i.e., those directly under the Governor’s control) and authorities created under the State Public Authorities Law. Nev-ertheless, the initiatives to improve the efficiency and effectiveness of government operations could also be applied to the operations of the major State agencies that are controlled by other entities, specifically the State Education Department (SED), the State University of New York (SUNY) and the City University of New York (CUNY), as well as to local governments.
The SAGE Commission differs from some other gubernatorial commissions that exclusively make forward-looking recommendations in that the SAGE Commission worked alongside the Cuomo administration in implementing these government redesign initiatives. Upon the Governor taking office, the Cuomo administration immediately began work on a number of initiatives to redesign State government operations. This comprehensive redesign of State govern-ment is a long-term process, though much has already been accomplished.
Preparing for the Work of the CommissionThe Cuomo administration laid the groundwork for the SAGE Commission during the gubernatorial transition. Funded by a generous grant from the Rockefeller Foundation, the Governor-elect’s transition team and the Rockefeller Institute retained the management consultants McKinsey & Co. to systematically review other states’ use of commissions to help drive their performance transformation programs. Approximately 25 states have used such commissions, with varying degrees of success.
CHAPTER I: Introduction
1. See Appendix A for full text of Executive Order No. 4 which created the SAGE Commission.
1
McKinsey identified the following six key elements in successful government performance transformation efforts: 1. Strong leadership and visible executive sponsorship; 2. Clearly defined scope and goals; 3. Innovative operational improvement ideas; 4. Strategic analytics to support recommendations; 5. Ability to secure approval from the executive and the legislature; and 6. Effective implementation.
The Commission conducted its work with these elements of success in mind.
The SAGE Commission was appointed and held its first meeting in April 2011. The Commission includes 20 pri-vate sector leaders with diverse backgrounds that include business, labor and past government service, and four members of the legislature (one from each conference).
In preparing its recommendations, the SAGE Commission received extensive input from the public and other sources. During the gubernatorial transition, a comprehensive “idea bank” was created based on interviews of out-side experts and recommendations made by similar government transformation commissions in other states. The Commission received over 5,000 emails to the online SAGE suggestion box. Among other forms of outreach, SAGE Commission staff met with each of the Governor’s 10 Regional Economic Development Councils to solicit their ideas in meetings across the State. This input was very helpful in shaping the Commission’s efforts.
The Commission’s Charter and ScopeOne of the conclusions McKinsey drew from its review of state government performance transformation com-missions was that commissions that attempted to reform all government programs and spending policies proved ineffective. In contrast, efforts that focused more narrowly on the operations of state government were much more effective.
Recognizing this fact, the Governor created three other commissions to address opportunities for efficiencies and performance improvement in the major areas of State spending other than operations. The Medicaid Redesign Team identified initiatives to make Medicaid spending more efficient and less costly.2 The Governor’s Mandate Relief Commission identified savings and efficiencies that local governments could realize through the reform of burdensome State mandates – and has been succeeded by the Mandate Relief Council, which is an eleven-member executive and legislative council charged with reviewing and advancing proposals to reduce the statutory and regulatory burden on local governments and school districts.3 The Governor formed the New NY Education Reform Commission to, among other things, identify opportunities for greater operating efficiency in K-12 education, and its preliminary report and recommendations were released in December 2012.
Chapter 1: Introduction
2
2. Recommendations Adopted by the Medicaid Redesign Team, February 24, 2011. 3. Mandate Relief Redesign Team Final Report, December 2011.
In response to Hurricane Sandy, in late 2012, the Governor created four commissions to examine issues raised by the storm in detail, including the way in which State government responds to emergencies and the organizational structure of the State’s various energy-related entities. These commissions issued their preliminary reports and recommendations prior to the 2013 State of the State address.4 A number of those recommendations that relate to the organization of State agencies and public authorities are discussed later in this report.
New York State’s Fiscal SituationThe long-term operational improvements the SAGE Commission has been working on with the Cuomo administra-tion would not be possible if the State had not first put its fiscal house in order. When Governor Cuomo took office, the State had built up a projected four-year budget deficit of $63 billion – including a budget gap of approximately $10 billion that needed to be closed in the Governor’s first budget. Spending on Medicaid, School Aid and other critical areas was growing at an uncontrolled and unsustainable rate. The cost of Medicaid and School Aid alone had increased by $8.8 billion or 51% over the past decade. Moreover, because the State could not control this increased spending, the State resorted to using one-shot revenues to pay for operating expenses, hiding the fact that spending was growing at an unsustainable rate.
The Governor’s first two budgets, which were enacted by the State’s constitutional budget deadline of April 1, dra-matically reshaped the State’s fiscal position. Governor Cuomo’s first-year budget closed a gap of $10 billion and his second-year budget closed a gap of $3.5 billion without resorting to one-shot revenues or new taxes. As a result of this fiscal discipline, the rating agency Standard & Poor’s upgraded the State’s bond rating outlook from stable to positive, which will reduce the State’s borrowing costs in the future. The 2013-14 Executive Budget continues this practice of fiscal discipline, closing a budget gap of $1.3 billion and holding spending growth in State Operating Funds to 1.6%.
While many measures were enacted to get the State’s fiscal house in order, certain steps warrant particular mention.
• To address rapidly rising costs in New York’s Medicaid program, Governor Cuomo established New York’s Medicaid Redesign Team (MRT) in January 2011. A critical part of the MRT solution was a statutory “global” cap on Medicaid expenditures. The Medicaid Global Spending Cap is tied to medi-cal inflation and therefore allows only about 4% annual growth in Medicaid spending. The Medicaid Global Spending Cap will generate significant savings for the State of more than $17 billion over the next five years. The State will relieve local governments of growth in their Medicaid costs by fully taking over Medicaid administration and the cost of all growth in local Medicaid costs by 2015-16 – which is expected to save counties and New York City approximately $1.2 billion over a five-year period.
• Governor Cuomo changed the paradigm of School Aid spending by limiting statutorily based spending increases, enacting $500 million of Performance Grants, and tying School Aid increas-es in 2012-13 and beyond to the adoption of Teacher Evaluation plans by school districts.
4. The commissions included the NYS 2100 Commission, the NYS Ready Commission, the NYS Respond Commission, and the Moreland Commission on Utility Storm Preparation and Response.
Chapter 1: Introduction
3
• In addition to controlling the size of the State workforce by exercising discipline in new hiring, Gov-ernor Cuomo arrested the growth in personnel costs by entering into new four and five-year collec-tive bargaining agreements that included no salary increases for the first three years and increased employee contributions for health insurance, resulting in savings of approximately $421 million.
• The cost of pensions and health benefits for active and retired employees increased by more than 300% from fiscal year 1998-99 to 2013-14. In 2012, Governor Cuomo won legislative approval for a new “Tier VI” pension plan for new State and local government employees. This plan will save the State approximately $21 billion and local governments approximately $61 billion over a 30 year period.
Because of these measures and the other restructuring and efficiency initiatives described in this report, total spending on executive-controlled agencies has actually declined from $10 billion in 2010-11 – the year before Governor Cuomo took office – to $9.6 billion in 2013-14, as savings more than offset increases in fixed costs. A table of estimated savings from the initiatives described in this report is included on page vi.
The New York State WorkforceOver the past 4 ½ years the number of full-time equivalent personnel (“FTEs”) in executive-controlled agencies has fallen 14%, from 137,680 to 118,878 FTEs. This decline reflects a number of factors, including increased retirements as the workforce ages and a conscious effort by the Cuomo administration to not automatically replace employees who leave or retire, choosing instead to make a smaller workforce more productive and efficient through the initiatives described in this report. Underlying trends, such as fewer inmates in the State’s correctional facilities, a trend toward community-based care, and productivity gains from consolidation and technology, are likely to continue to gradually decrease the size of the State workforce. As a result of these trends and the Administration’s efforts to control workforce costs, the State’s personal service costs in executive-controlled agencies in 2013-14 are projected to be $175 million lower than their 2010-11 levels.
Perhaps an even better indication of increased efficiency is the nearly 20% decline in head count in the so-called “bureaucratic core.” This measure excludes direct service workers such as corrections officers and cus-todial care providers where labor efficiencies are harder to achieve.5 The Governor’s actions and SAGE process have enabled agencies to increase productivity in performing their traditional functions with lower staffing levels.
As the workforce is getting smaller, it is also getting older. The average age of a State worker today is 48 years old and this trend toward an older workforce is expected to continue. In the next five years, the Department of Civil Service estimates that 16% of the State workforce is likely to retire, including 49% of senior career managers.6 These trends make it essential that the State not only develop more efficient systems for workers to use, but to take other steps to modernize the State workforce so that a smaller workforce can be better equipped to meet the State’s needs. A silver lining of the surge in retirements, normal attrition and discipline regarding new hires is that it will be possible to implement labor-saving efficiencies without requiring layoffs of any significant amount.
4
Chapter 1: Introduction
5. See, e.g., “State Jobs Down 18.4%”, Albany Times Union, May 7, 2012.6. Provided by the Department of Civil Service. Senior managers include salary grades M1-M8.
The Organizational Structure of New York StateThe last major reorganization of New York State government took place in 1927 under Governor Al Smith. As is the case today, Governor Smith inherited a complex web of agencies, commissions, task forces, and councils that had become unwieldy over the years. Governor Smith overhauled the State budget process and consolidated a wide variety of government entities into approximately 20 cabinet departments. In many ways, his decisive approach provided the inspiration for the SAGE Commission efforts today. Exhibit 1 on page 11 shows the organizational chart of New York State in 1927 following the implementation of Governor Smith’s reorganization plan.
In the 85 years since Governor Smith’s reorganization, New York State government has grown significantly more complex, with new roles and critical functions such as Medicaid, interstate highway maintenance, and information technology management that could not have been imagined in the 1920s. By the time Gover-nor Cuomo took office, the number of agencies and major authorities had grown more than three-fold, to 70. Exhibit 2 on page 12 shows the organization chart of New York State government when Governor Cuomo took office on January 1, 2011.7
While many of the State’s agencies, authorities, boards and commissions served a purpose at the time they were created, the continued proliferation of these bodies has led to redundancies and inefficiencies that bog down the effective operation of State government. Breaking down silos and rationalizing this web of govern-mental bodies – through all of the strategies described in this report – has been a central focus of the SAGE Commission and a key part of the ongoing efforts of the Cuomo administration.
The role of the 41 public authorities created under the State Public Authorities Act deserves special attention. The nature of these authorities varies widely, including statewide authorities with significant operations, authorities whose primary purpose is debt issuance, small and specialized entities that serve a narrow purpose, and regional entities that are considered “State” authorities primarily because they are subject to gubernatorial appointment. Consolidation or elimination of these authorities is not recommended in most cases. However, it is essential that the State develop a more effective mechanism for reviewing their performance because of the close operational relationship between certain State agencies and State authorities.
Transforming State Government PerformanceAlthough Governor Al Smith’s effort 85 years ago was an inspiration for the SAGE Commission, the challenge for the Cuomo administration and the Commission is different for several reasons. In the 1920s, the execu-tive authority of the Governor was quite weak, with most important governmental functions under the control of independent agencies to which the Governor appointed only a minority of the voting members. As a result, Governor Smith’s reorganization was primarily aimed at consolidating agencies under commissioners appoint-ed by the Governor as a means of gaining executive control over State government.
7. Appendix B provides a brief history of each agency and major authority. Appendix C includes a comprehensive listing of all 406 State governmental entities in existence when the Governor took office.
Chapter 1: Introduction
5
The problems today are different and require a wider range of tools to make government more efficient and better serve its citizens. The general public has come to think of government as being organized “vertically” by policy area (e.g., transportation), and the State’s agency structure reflects this. An important insight of the Cuomo administration and the SAGE Commission is that it is also possible to think of government being orga-nized “horizontally,” i.e., by functions such as back-office support, licensing and permitting, capital spending, management of contracts with third-party providers, and others.
This orientation towards a more “horizontal” approach led the Cuomo administration and the Commission to conclude that the objective of increased efficiency and better performance can best be accomplished by restruc-turing these functions, rather than consolidating the agencies in which these functions are conducted. These “horizontal” solutions include shared services, centralized organization of critical functions such as information technology, transfers of functions between agencies to better align the functions with agencies’ core mission, and enhanced coordination mechanisms such as the Governor’s Regional Economic Development Councils and the New York Works Task Force – none of which require the merger or consolidation of agencies or authorities.
Another difference from the time of Governor Al Smith is the central role that information technology plays in almost everything State government does. The Internet and other forms of information technology are being used to transform customer service, improve the functionality of many internal business processes, and offer insights based on advanced analytics. Technology makes the workforce more productive, and enables a degree of performance management and open government that would not be possible without these ad-vanced information systems.
As identified in the Summary of Initiatives on pages 8-10, a total of 78 discrete transformation initiatives have been completed, are in process or have been proposed in the 2013-14 Executive Budget. Another 22 initiatives have been identified as future options for the Administration to consider. Collectively, these 100 initiatives repre-sent far-reaching change in the way State government conducts its operations. The complexity of the transforma-tion initiatives that are underway or proposed would be challenging for any organization, but for State government they are without precedent. It will take sustained effort and focus for the next two to three years for all of the ongoing and proposed initiatives to be successfully implemented. During this time, initiatives identified as future options should be undertaken in a staged way as the State makes progress on initiatives already underway and addresses the various obstacles that such proposals would face.
In addition to these horizontal or “functional” consolidations, however, some agency and authority consolidations are necessary to improve efficiency. Mergers and consolidations involving a total of 14 agencies and authorities have been completed or proposed in the 2013-14 Executive Budget. If the additional mergers or consolidations options identified by the SAGE Commission for future consideration are also adopted, it would reduce the number of major agencies and authorities by 23% since the Governor took office. A pro forma organization chart reflecting all of the completed and recommended mergers and consolidations is shown in Exhibit 3 on page 13.
Chapter 1: Introduction
6
This report is organized in the following three parts:
Part I – Reorganizing Government When they are fully implemented, the restructuring initiatives described in this report will represent the most com-prehensive reorganization of State government since Governor Al Smith’s in the 1920s. Chapter 2 describes the consolidation and rightsizing of State facilities of many types – from closing prisons to eliminating excess leased office space. Chapter 3 describes the consolidation of agency functions which can be provided more efficiently and effectively in a shared services model. These consolidations of functions will save at least $1 billion over the next five years. Chapter 4 discusses the mergers and consolidations that have been completed or proposed over the last two years, as well as additional mergers and consolidations that have been identified by the SAGE Commission for future consideration. Chapter 5 describes new formal coordination mechanisms for critical interagency activities.
Part II – Reducing Costs and Improving Service In addition to government reorganization, this report describes a range of other initiatives commenced over the last two years that will reduce the cost of government while improving the quality of service the State provides. Chapter 6 describes a genuine transformation in the way that the State manages and utilizes information technology. Chapter 7 describes a number of the initiatives launched by the Cuomo administration to significantly improve the State’s customer service and to make internal operating processes more efficient. Chapter 8 describes initiatives and pro-posals to modernize how the State hires, trains and disciplines its employees, as well as efforts to control the cost and improve the productivity of the State workforce.
Part III – Building a Culture of Performance and AccountabilityGovernor Cuomo has emphasized performance and accountability in all aspects of his government, from perfor-mance-based School Aid grants and teacher evaluation to competition for economic development assistance. Chapter 9 describes the first ever statewide performance management system, called NY Performs, which will show key performance indicators, targets for future performance, and strategic initiatives for every major agency and authority. Because transparency is an essential element of government accountability, Chapter 9 also describes the many open government measures that are being launched as part of the Open New York initiative. Finally, Chapter 10 addresses the framework for reviewing whether activities are necessary to advance the core mission of State government, namely by identifying unnecessary statutory mandates, activities typically engaged in by commercial enterprises, functions or services that based on competitive benchmarking would be provided more efficiently by the private sector, and waste or suboptimal use of assets. Chapter 10 also describes the use of internal State resources and partnerships with the private sector to facilitate implementation of government redesign efforts.
Summary of Initiatives The following table is a summary of the government redesign initiatives described in this report, organized by chapter and showing their status.
Chapter 1: Introduction
7
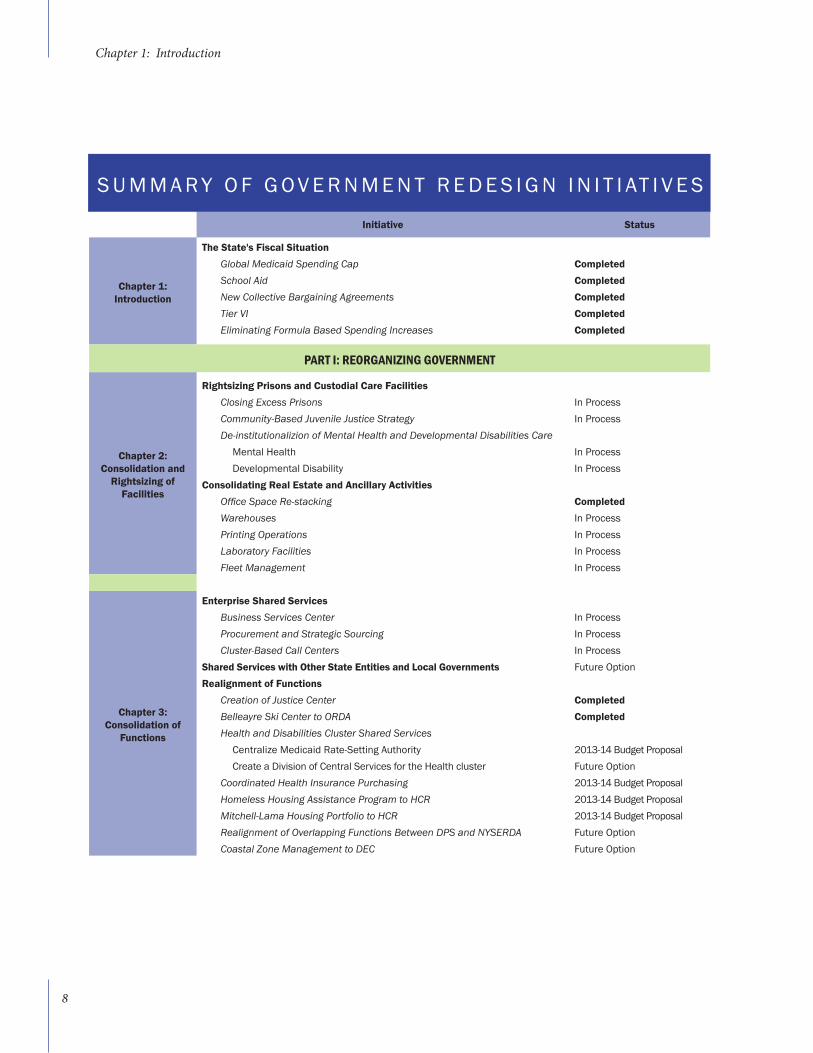
Initiative Status
Chapter 1:Introduction
The State's Fiscal SituationGlobal Medicaid Spending Cap CompletedSchool Aid CompletedNew Collective Bargaining Agreements CompletedTier VI CompletedEliminating Formula Based Spending Increases Completed
PART I: REORGANIZING GOVERNMENT
Chapter 2: Consolidation and
Rightsizing of Facilities
Rightsizing Prisons and Custodial Care FacilitiesClosing Excess Prisons In ProcessCommunity-Based Juvenile Justice Strategy In ProcessDe-institutionalizion of Mental Health and Developmental Disabilities Care
Mental Health In ProcessDevelopmental Disability In Process
Consolidating Real Estate and Ancillary ActivitiesOffice Space Re-stacking CompletedWarehouses In ProcessPrinting Operations In ProcessLaboratory Facilities In ProcessFleet Management In Process
Chapter 3:Consolidation of
Functions
Enterprise Shared ServicesBusiness Services Center In ProcessProcurement and Strategic Sourcing In ProcessCluster-Based Call Centers In Process
Shared Services with Other State Entities and Local Governments Future OptionRealignment of Functions
Creation of Justice Center CompletedBelleayre Ski Center to ORDA CompletedHealth and Disabilities Cluster Shared Services
Centralize Medicaid Rate-Setting Authority 2013-14 Budget ProposalCreate a Division of Central Services for the Health cluster Future Option
Coordinated Health Insurance Purchasing 2013-14 Budget ProposalHomeless Housing Assistance Program to HCR 2013-14 Budget ProposalMitchell-Lama Housing Portfolio to HCR 2013-14 Budget ProposalRealignment of Overlapping Functions Between DPS and NYSERDA Future OptionCoastal Zone Management to DEC Future Option
S U M M A R Y O F G O V E R N M E N T R E D E S I G N I N I T I AT I V E S
Chapter 1: Introduction
8
Chapter 4: Consolidation of
Agencies and Authorities
Mergers and ConsolidationsDepartment of Financial Services CompletedDepartment of Corrections and Community Supervision CompletedMerger of NYSTAR into ESD CompletedMerger of Consumer Protection Board into Department of State CompletedGaming Commission CompletedMerger of the Office of the Welfare Inspector General into OIG 2013-14 Budget ProposalConsolidation of Governor’s Office of Employee Relations with DCS 2013-14 Budget ProposalPrivatization of Long Island Power Authority Future OptionConsolidation of Transportation Agencies and Authorities Future OptionMerger of Behavioral Health Agencies Future OptionHigher Education Services Corporation Consolidation Future OptionMerger of Hudson River Valley Greenway into DEC Future OptionAdministrative Public Safety Agencies Consolidation Future OptionBusiness and Professional Licensing Agency Future Option
Elimination of Unnecessary Boards and Commissions28 Boards and Commissions CompletedEmergency Medical Services 2013-14 Budget Proposal27 Additional Boards and Commissions Future Option
Chapter 5:Coordination of
Inter-AgencyActivities
New Formal Coordination MechanismsRegional Economic Development Councils (REDCs) CompletedConsolidated Funding Application CompletedNY Works Task Force Capital Planning Completed
Workforce Development InitiativesRevitalization of the State Workforce Investment Board (SWIB) 2013-14 Budget ProposalLinking Community College Aid to Employer Partnerships 2013-14 Budget ProposalConsistent Performance Metrics for Workforce Development Programs 2013-14 Budget Proposal
EnergyMaster Plan for Energy Efficiency in All State Facilities In Process
Reorganizing Emergency Response In Process
PART II: REDUCING COSTS AND IMPROVING SERVICE
Chapter 6:InformationTechnology
Transformation
Enterprise-wide InitiativesOrganizational Restructuring In ProcessIT Infrastructure Modernization
Data Center Modernization In ProcessDigital Network Consolidation In ProcessEmail Consolidation In ProcessEnterprise Identification and Access Management In Process
IT-Enabled Business Process RedesignAccelerating High ROI / High Impact Projects In ProcessRent Regulation System Redesign In ProcessWorkers’ Compensation System Modernization In Process
Chapter 7: Customer Service
and ProcessImprovement
Customer Service Solutions Involving Licensing and PermittingE-Licensing In ProcessDMV Licensing and Customer Service In ProcessReform the State Environmental Quality Review (SEQRA) Process In ProcessProfessional and Business Licensing In Process
Contracting and Grants ManagementStreamlining of the MWBE Certification Process CompletedContracting with Not-For-Profits and Other Third-Party Providers In Process
Other Process ImprovementsLEAN Process Improvements In ProcessDesign-Build Procurement Completed*
S U M M A R Y O F G O V E R N M E N T R E D E S I G N I N I T I AT I V E S
Chapter 1: Introduction
9* A proposal to expand the Design-Build authority to all agencies is included in the 2013-14 Executive Budget.
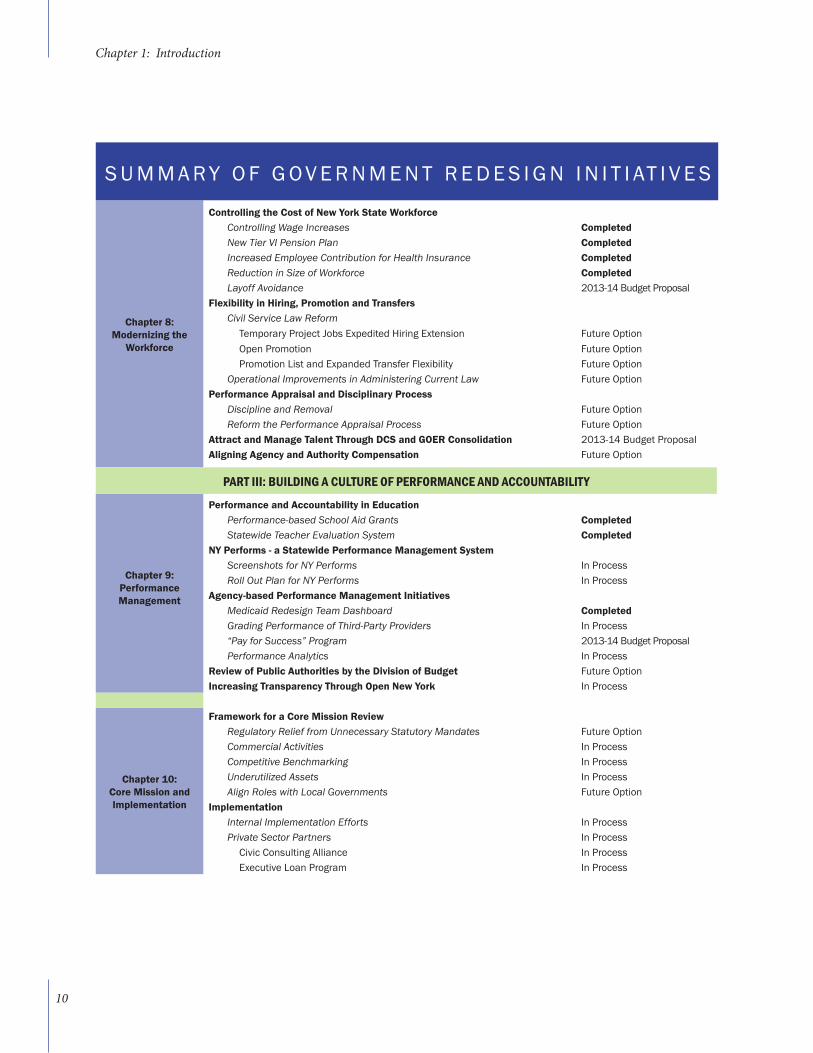
Chapter 8:Modernizing the
Workforce
Controlling the Cost of New York State WorkforceControlling Wage Increases CompletedNew Tier VI Pension Plan CompletedIncreased Employee Contribution for Health Insurance CompletedReduction in Size of Workforce CompletedLayoff Avoidance 2013-14 Budget Proposal
Flexibility in Hiring, Promotion and TransfersCivil Service Law Reform
Temporary Project Jobs Expedited Hiring Extension Future OptionOpen Promotion Future OptionPromotion List and Expanded Transfer Flexibility Future Option
Operational Improvements in Administering Current Law Future OptionPerformance Appraisal and Disciplinary Process
Discipline and Removal Future OptionReform the Performance Appraisal Process Future Option
Attract and Manage Talent Through DCS and GOER Consolidation 2013-14 Budget ProposalAligning Agency and Authority Compensation Future Option
PART III: BUILDING A CULTURE OF PERFORMANCE AND ACCOUNTABILITY
Chapter 9:Performance Management
Performance and Accountability in EducationPerformance-based School Aid Grants CompletedStatewide Teacher Evaluation System Completed
NY Performs - a Statewide Performance Management SystemScreenshots for NY Performs In ProcessRoll Out Plan for NY Performs In Process
Agency-based Performance Management InitiativesMedicaid Redesign Team Dashboard CompletedGrading Performance of Third-Party Providers In Process“Pay for Success” Program 2013-14 Budget ProposalPerformance Analytics In Process
Review of Public Authorities by the Division of Budget Future OptionIncreasing Transparency Through Open New York In Process
Chapter 10:Core Mission and Implementation
Framework for a Core Mission ReviewRegulatory Relief from Unnecessary Statutory Mandates Future OptionCommercial Activities In ProcessCompetitive Benchmarking In ProcessUnderutilized Assets In ProcessAlign Roles with Local Governments Future Option
ImplementationInternal Implementation Efforts In ProcessPrivate Sector Partners In Process
Civic Consulting Alliance In ProcessExecutive Loan Program In Process
S U M M A R Y O F G O V E R N M E N T R E D E S I G N I N I T I AT I V E S
Chapter 1: Introduction
10
Exhi
bit 1
: M
ajor
Age
ncie
s & A
utho
ritie
s - 1
927
Hea
lth a
ndD
isab
ilitie
sH
uman
Ser
vice
san
d La
bor
Indu
stry
and
Econ
omic
Dev
elop
men
tEn
viro
nmen
tan
d En
ergy
Publ
ic S
afet
yG
ener
alG
over
nmen
tTr
ansp
orta
tion
Educ
atio
n
Educ
atio
nD
ept.*
Dep
t. of
Publ
ic W
orks
Port
of N
YAu
thor
ity
Civi
l Ser
vice
Com
mis
sion
Div
isio
n of
Stan
dard
s an
d Pu
rcha
se
Dep
t.of
Sta
te
Div
isio
n of
Stat
e Po
lice
Dep
t. of
Cor
rect
ion
Div
isio
n of
Paro
le
Com
mis
sion
of
Cor
rect
ion
Div
isio
n of
Mili
tary
and
Nav
al A
ffairs
Dep
t. of
Agr
icul
ture
and
Mar
kets
Dep
t. of
Insu
ranc
e
Dep
t. of
Cha
ritie
s
Dep
t.of
Lab
or
Dep
t.of
Hea
lth
Dept
. of
Men
tal H
ygie
ne
Gov
erno
r and
the
Exec
utiv
e Ch
ambe
r
Dep
t. of
Ban
king
Div
isio
n of
Budg
et
Dep
t. of
Taxa
tion
&
Fina
nce
*Doe
s no
t rep
ort t
o th
e Ex
ecut
ive
Cham
ber.
22 A
genc
ies
& M
ajor
Aut
hori
ties
61 A
genc
ies,
Sta
te A
utho
riti
es &
Boa
rds
Cons
erva
tion
Dep
t.
Publ
ic S
ervic
eCo
mm
issi
on
Chapter 1: Introduction
11
NY H
omes
and
Com
mun
ityRe
newa
lH
FAD
HCR
SON
YMA
Offic
e of
Alco
holis
m a
ndSu
bsta
nce
Abus
e Se
rvice
s
Offic
e of
the
Med
icai
dIn
spec
tor
Gen
eral
Exhi
bit 2
: M
ajor
Age
ncie
s & A
utho
ritie
s - Ja
nuar
y 1,
201
1
Hea
lth a
ndD
isab
ilitie
sH
uman
Ser
vice
san
d La
bor
Indu
stry
and
Econ
omic
Dev
elop
men
tEn
viro
nmen
tan
d En
ergy
Publ
icSa
fety
Gen
eral
Gov
ernm
ent
Tran
spor
tatio
nEd
ucat
ion
Educ
atio
nD
ept.*
Dep
t. of
Tran
spor
tatio
n
Port
Aut
horit
yof
NY
and
NJ
Offic
e of
G
ener
al
Serv
ices
Dep
t. of
Mot
or V
ehicl
es
Div
isio
n of
the
Budg
et
Stat
e Li
quor
Auth
ority
Cons
umer
Prot
ectio
nBo
ard
Div
isio
n of
Stat
e Po
lice
Dep
t.of
Lab
or
Dep
t.of
Hea
lth
Gov
erno
r and
the
Exec
utiv
e Ch
ambe
r
CUN
Y
Coun
cil o
n th
eAr
ts
Wor
kers
’Co
mpe
nsat
ion
Boar
d
Div
isio
n of
Hum
an R
ight
s
Offic
e of
Tem
pora
ry a
ndD
isab
ility
Assi
stan
ce
Offic
e of
Child
ren
and
Fam
ily S
ervic
es
Divis
ion
ofVe
tera
ns’
Affa
irs
Stat
e In
sura
nce
Fund
ESDC
/DED
ESD
CD
ED
Batte
ry P
ark
City
Aut
horit
y
Dept
. of
Agric
ultu
re a
ndM
arke
ts
Dept
. of
Insu
ranc
e
Dor
mito
ryAu
thor
ity
Offic
e fo
r the
Prev
entio
n of
Dom
estic
Viol
ence
Adiro
ndac
kPa
rk A
genc
y
Offic
e of
Par
ks,
Recr
eatio
n,an
d H
isto
ric
Pres
erva
tion
Olym
pic
Regi
onal
Dev
elop
men
tAu
thor
ity
NYS
Ener
gyRe
sear
ch a
ndDe
velo
pmen
t Au
thor
ity
Long
Isla
ndPo
wer
Auth
ority
Publ
ic S
ervi
ceCo
mm
issi
on
Envi
ronm
enta
lFa
cilit
ies
Corp
.
Div
isio
n of
Crim
inal
Just
ice S
ervic
es
Div
isio
n of
Hom
elan
dSe
curit
y an
dEm
erge
ncy
Serv
ices
Divis
ion
of
Milit
ary a
nd
Nava
l Affa
irs
Dep
t. of
Envi
ronm
enta
lCo
nser
vatio
n
Civi
l Ser
vice
Com
mis
sion
Offic
e fo
rTe
chno
logy
Offic
e of
Empl
oyee
Rela
tions
Met
ropo
litan
Tr
ansp
orta
tion
Auth
ority
SUN
Y
Com
mis
sion
on
Publ
ic In
tegr
ity
Publ
ic
Empl
oym
ent
Rela
tions
Boar
d
Auth
ority
Budg
et O
ffice
Com
mis
sion
of
Corr
ectio
nBo
ard
ofEl
ectio
nsTa
x Ap
peal
sTr
ibun
al
Inde
pend
ent A
ppea
ls o
r Ove
rsig
ht*
Offic
e fo
r the
Ag
ing
Offic
e of
Men
tal H
ealth
Offic
e fo
rPe
ople
with
Deve
lopm
enta
l D
isab
ilitie
s
Com
miss
ion
on
Qual
ity o
f Car
ean
d Ad
voca
cyfo
r Per
sons
with
Disa
bilit
ies
Offic
e of
the
Wel
fare
Insp
ecto
rG
ener
al
NYS
TAR
Dept
. of
Bank
ing
Divis
ion
ofth
e Lo
ttery
Racin
g an
dW
ager
ing B
oard
New
York
Powe
r Aut
horit
y
Hud
son
Rive
rVa
lley
Gre
enw
ay
Offic
e of
Vict
im S
ervic
es
Dept
. of
Corre
ctio
nal
Serv
ices
Divis
ion
ofPa
role
Dep
t. of
Taxa
tion
and
Fina
nce
Dep
t. of
Sta
te
Offic
e of
St
ate
Insp
ecto
rG
ener
al
Thru
way
Auth
ority
Brid
geAu
thor
ity
Hig
her
Educ
atio
nSe
rvic
esCo
rpor
atio
n
*Doe
s no
t rep
ort t
o th
e Ex
ecut
ive
Cham
ber
70 A
genc
ies
and
Maj
or A
utho
ritie
s
Chapter 1: Introduction
12
NY H
omes
and
Com
mun
ityRe
newa
lH
FAD
HCR
SON
YMA
Offic
e fo
rPe
ople
with
Dev
elop
men
tal
Dis
abili
ties
Offic
e of
the
Med
icai
dIn
spec
tor
Gen
eral
Exhi
bit 3
: M
ajor
Age
ncie
s & A
utho
ritie
s - P
ost-
SAG
E
Hea
lth a
ndD
isab
ilitie
sH
uman
Ser
vice
san
d La
bor
Indu
stry
and
Econ
omic
Dev
elop
men
tEn
viro
nmen
tan
d En
ergy
Publ
icSa
fety
Gen
eral
Gov
ernm
ent
Tran
spor
tatio
nEd
ucat
ion
Stat
e Ed
ucat
ion
Dep
artm
ent*
Trans
porta
tion
DOT
Thru
way
Brid
ge
Port
Aut
horit
yof
NY
and
NJ
Offic
e of
G
ener
al
Serv
ices
Dep
t. of
Mot
or V
ehicl
es
Depa
rtmen
t of
Taxa
tion
and
Fina
nce
Div
isio
n of
the
Budg
et
Insp
ecto
rsGe
nera
lOI
GOW
IG
Div
isio
n of
St
ate
Polic
e
Dep
t.of
Lab
orD
ept.
of H
ealth
Beha
viora
l Hea
lthOM
HOA
SAS
Gov
erno
r and
the
Exec
utiv
e Ch
ambe
r
CUN
Y
Coun
cil o
n th
eAr
ts
Offic
e fo
r the
Ag
ing
Wor
kers
’Co
mpe
nsat
ion
Boar
d
Div
isio
n of
Hum
an R
ight
s
Offic
e of
Tem
pora
ry a
ndD
isab
ility
Assi
stan
ce
Offic
e of
Child
ren
and
Fam
ily S
ervic
es
Divis
ion
of
Vete
rans
’ Af
fairs
Stat
e In
sura
nce
Fund
Econ
omic
Deve
lopm
ent
ESD
C/D
EDN
YSTA
R
Batte
ry P
ark
City
Aut
horit
y
Dept
. of
Agric
ultu
re a
ndM
arke
ts
Depa
rtmen
t of
Fina
ncia
lSe
rvic
esIn
sura
nce
Bank
ing
Gam
ing
Com
miss
ionLo
ttery
RWB
Dor
mito
ryAu
thor
ity
Depa
rtmen
t of
Corre
ction
s and
Co
mm
unity
Su
pervi
sion
DOC
SPa
role
Adiro
ndac
kPa
rk A
genc
y
Offic
e of
Par
ks,
Recr
eatio
n,an
d H
isto
ric
Pres
erva
tion
Olym
pic
Regi
onal
Dev
elop
men
tAu
thor
ity
En
ergy
**PS
C/DP
S NY
SERD
A
Long
Isla
ndPo
wer
Auth
ority
Envi
ronm
enta
lFa
cilit
ies
Corp
.
Offic
e of C
rime
Prev
entio
nD
CJS
OVS
OPDV
Div
isio
n of
Hom
elan
dSe
curit
y an
dEm
erge
ncy
Serv
ices
Divis
ion
of
Milit
ary a
nd
Nava
l Affa
irs
Depa
rtmen
t of
Envir
onm
enta
l Co
nser
vatio
n D
ECH
RVGW
Hum
an
Reso
urce
sCi
vil S
ervi
ceG
OER
Info
rmat
ion
Tech
nolo
gySe
rvic
es
Lice
nsin
gSL
ASt
ate
Met
ropo
litan
Tr
ansp
orta
tion
Auth
ority
SUN
Y
Join
tCo
mm
issio
n on
Publ
ic E
thic
s
Publ
ic
Empl
oym
ent
Rela
tions
Boar
d
Auth
ority
Budg
et O
ffice
Com
mis
sion
of
Corr
ectio
nBo
ard
ofEl
ectio
nsTa
x Ap
peal
sTr
ibun
al
Just
ice
Cent
er
Inde
pend
ent A
ppea
ls o
r Ove
rsig
ht B
odie
s*
Com
plet
ed
2013
-14
Budg
et P
ropo
sal
Futu
re O
ptio
n
*Doe
s no
t rep
ort t
o th
eEx
ecut
ive
Cham
ber
**Re
flect
s re
alig
nmen
t of
exis
ting
func
tions
54 A
genc
ies
and
Maj
or A
utho
ritie
s
High
er
Educ
atio
n Se
rvic
es
Corp
orat
ion
New
Yor
kPo
wer A
utho
rity
Chapter 1: Introduction
13
Governor Cuomo began the process of rightsizing State facilities immediately after taking office in January 2011. In his first State of the State address, he said “Prisons are not a jobs program,” and in his first Executive Budget initiated the long overdue process of closing excess prisons. The Governor also called for shutting down unneed-ed juvenile justice facilities in his first Executive Budget, while beginning work on reinventing the State’s approach to juvenile justice. In 2012, the State began to shift the focus from institutional care to community-based care for the developmentally disabled and those in the State’s care due to mental health issues.
As part of a broader strategy of providing services within a shared services model – which is described in detail in Chapter 3 – the Cuomo administration also began to consolidate and right-size office space and other support operations such as warehouses, printing operations and laboratory facilities.
These various measures to consolidate and right-size facilities will save in the aggregate approximately $237 mil-lion on a full annualized basis.
Rightsizing Prisons and Custodial Care Facilities
Closing Excess Prisons
For years, governors talked about closing unneeded prisons and juvenile justice facilities, but had little success in rightsizing the systems. When Governor Cuomo took office, the number of prisoners in the State’s prisons and other correctional facilities had declined from a peak of 72,773 in 1999 to fewer than 55,000. Yet over that same period, the prison system actually expanded by more than 1,500 beds, and the cost of operating the prison sys-tem increased from $1.7 billion to $2.4 billion.
Seven prisons representing a total of 3,800 beds were closed in Governor Cuomo’s first budget in 2011-12. The closure of these seven prisons eliminated 1,263 positions and saved $72 million in 2011-12, with savings rising to $112 million when fully annualized in 2013-14.
The prison population is expected to decline by another 2,300 inmates by 2016-17. The 2013-14 Executive Budget pro-poses the closure of an additional two facilities, which would result in additional fully annualized savings of $62.1 million.
Community-Based Juvenile Justice Strategy The situation with respect to juvenile justice facilities was even more distressing. The number of youths in juve-nile justice facilities had declined from a peak of 2,313 at the end of 2000 to only 643 at the end of 2010. Yet in calendar year 2010, the State spent $223 million operating these juvenile facilities, which represented an astounding annual cost of $283,000 for each juvenile in such facilities.
CHAPTER 2: Consolidation and Rightsizing of Facilities
PART I: REORGANIZING GOVERNMENT
14
The Cuomo administration started with the closing of four of the State’s 25 facilities in 2011-12 and reduced the size of another four facilities. These actions reduced the facilities’ annual system costs by $36 million and total bed capacity from 1,209 to 832, but were just the first step in a fundamental restructuring of how the State handles juvenile offenders.
Advocates for juvenile justice reform have long called for juvenile delinquents to be housed and provided services close to their homes and families. To achieve this goal, the Close to Home Initiative for youths from New York City was enacted in 2012-13. Under this initiative, New York City is authorized to care for its youths who would otherwise be sent to OCFS for placement in non-secure and limited secure residential facilities. Youths will be served in, or much closer to, their home community and will receive comprehensive services that address their educational, mental health, substance abuse and other needs, without compromising public safety. A total of 100 non-secure beds are scheduled to close under the first phase of this initiative, with an estimated savings of $8 million. Approximately 90 of such youths will be relocated from the State’s non-secure facilities to not-for-profit agency settings within the City. Closing residential juvenile justice facilities is part of the effort to lead the State toward an evidence-based system that will reduce crime, improve outcomes for youth and the communities in which they live, and increase the efficiency of the state-operated juvenile justice facility system.
In 2013-14, the second year of Close to Home, an estimated 100 additional youth currently placed in the State’s limited security facilities will be placed in not-for-profit agencies which are under contract with New York City. These agencies will be responsible for the educational, mental health, substance abuse and other services for the youths in their care. Young offend-ers who are determined by Family Court judges to require a higher level of care will remain in the custody of the State.
When the New York City Close to Home initiative is complete, the State juvenile justice system will have been reduced by more than 50% – from 1,209 beds to 555 beds. In the 2013-14 Executive Budget, the Cuomo administration will extend the Close to Home model to the rest of New York State for youth in non-secure settings. This proposal would reduce capac-ity of the state system by an additional 88 beds and reinvest resources to ensure that not-for-profit community-based pro-viders are able to successfully serve youth that would otherwise have been sentenced to the State’s non-secure facilities.
De-institutionalization of Mental Health and Developmental Disabilities CareAn important reform that will both save money and improve the quality of care is the transition from institutional care to community-based care for individuals with mental health issues and for the developmentally disabled.
Mental Health Facilities
New York has a large institutionally-based mental health system that no longer serves people in the most appropriate setting from either a cost or therapeutic standpoint. New York has a high vacancy rate in its institutional facilities and more than twice as many facilities as the next closest state.
Chapter 2: Consolidation and Rightsizing of Facilities
15
In 2011 and 2012, the Office of Mental Health (OMH) successfully restructured inpatient services and utilized the savings from this effort to substantially expand community services. This effort lowered average inpatient census by roughly 330 adults (10%) and 100 children (21%). Importantly, the better quality of care from this effort allowed the authorization of over 2,600 community residential opportunities, with appropriate supports and services to ensure individuals can live safely in the community. This effort also includes a new investment to ensure individuals receiv-ing court-ordered services through Assisted Outpatient Treatment (AOT) and those who are being discharged from State Psychiatric hospitals have access to services in the community through Health Homes to ensure continuity of physical and behavioral health care in the community.
Over the next two years, OMH plans to create regional centers of excellence for the diagnosis and treatment of complex behavioral health illnesses. This effort will ensure that there will be ample capacity for treating individuals with mental illness who require inpatient services, and the savings related to this State Psychiatric Center regionalization initiative will be reinvested to support the same or greater level of community-based services. This reinvestment will help facilitate earlier and better access to care.
Developmental Disability Facilities
The Office for People with Developmental Disabilities (OPWDD) has set in motion a long-term effort to move nearly all of its clients in institutional care to community-based settings. Over the past two years, OPWDD has reduced the number of individuals in institutional inpatient facilities by roughly 25% by transferring these individuals into more appropriate and less costly community-based homes. This decline has already resulted in the closure of two institutional programs and two additional facilities are expected to close by December 2013. In addition to placing individuals into more appropriate community settings, these closures are also cost-effective since it costs much less to serve an individual in the commu-nity than in an institution. In total, these efforts and similar actions have generated $50 million in annual savings.
Coupled with this transition to community-based care is an enhanced focus on combatting abuse and neglect and internal restructuring (see discussion of Justice Center on page 22). OPWDD has consolidated operations from 13 separate regional offices with responsibility for both State-delivered services and the oversight of service delivery by not-for-profit providers to a new consolidated system of only five regional offices, with the remaining oversight being handled centrally. A range of other non-programmatic functions is being shifted to the State’s shared services model.
Consolidating Real Estate and Ancillary Activities
Office Space Re-stackingWhen Governor Cuomo took office, he commissioned a study that found the amount of office space that the State had leased was approximately 20% more than it needed, including 4,000 empty seats downstate and 6,000 empty seats in the Capital Region. Much of this excess office space was the result of individual agencies managing their real estate function without coordinating with other agencies. Governor Cuomo directed the Office of General Services (OGS) to take over this function and manage it with modern real estate best practices on a statewide basis. As part of this new strategy, OGS is creating a separate NYS Real Estate Center to be led by an experienced Chief Real Estate Officer.
Chapter 2: Consolidation and Rightsizing of Facilities
16
Over the past year, OGS has embarked on a re-stacking plan to consolidate agency office space in both New York City and Albany. The centralized approach to real estate management that the State has used over the last 18 months, combined with improved analytics, has significantly improved efficiency of space usage. To date these efforts have saved the State more than $21 million, and further savings will be achieved when leases expire on remaining excess office space. The 2013-14 Budget projects an additional $5 million in savings next year.
Two illustrative examples of the re-stacking and related savings to date are $2.4 million in annual savings generated from moving the Department of Taxation and Finance’s Downstate operations into a newly leased facility in Brooklyn at lower cost, and $2 million in annual savings from the relocation of a number of criminal justice agencies from leased spaced into the State-owned Alfred E. Smith building in Albany.
WarehousesIn addition to office space, the State is also gathering data and reviewing opportunities to consolidate and better use warehouse and storage space. Over 50 State agencies manage 7.8 million square feet of storage space in more than 1,000 separate locations, including both owned and leased space, costing a total of $42 million annually. Today, there is no central inventory of warehouse and storage space (or its contents) and no coordinated plan to use this space more efficiently. To rationalize the approach to storage space, the Cuomo administration has directed agencies to perform cost-benefit analyses and meet minimum criteria before put-ting anything in storage and to use real time delivery of office supplies to cut down on the need for storage.
Printing OperationsNew York currently spends approximately $35 million each year to operate 24 separate print and copy shops. Though placing these resources close to agency customers may be convenient, this fragmentation leads to a large number of inefficiencies. A recent survey of agency printing operations showed numerous instances of slack capacity, inconsistent volume between print shops, and multiple shops being located close to one an-other, as well as unnecessary duplication of services and the lack of a comprehensive management strategy to contain the cost of equipment and supplies.
To address these inefficiencies, the State has begun a process of consolidating printing operations into several major agencies, including the Department of Taxation and Finance, Information Technology Services, OGS, OMH, and DOCCS. Agency customers will be able to submit jobs through a simple, universal online print shop job request form and receive bid responses from each State print shop. This consolidation and process rede-sign will not only result in lower costs but also reduce bottlenecks and improve transparency and accountabil-ity, with a goal of reducing the number of printing facilities down to nine, a reduction of 63%.
Chapter 2: Consolidation and Rightsizing of Facilities
17
1. These include the Department of Health, the Department of Criminal Justice Services, the Department of En-vironmental Conservation, the Department of Agriculture and Markets, the Office of Mental Health, the Office for People with Developmental Disabilities, the Department of Transportation, and the Division of State Police. Academic research labs on SUNY and CUNY campuses are not included.
The State of Texas recently undertook a similar effort and consolidated 33 state agency print shops into seven. These seven shops produce more annual output at less than 50% of the cost and with less than 50% of the staff of the original 33 shops.
Laboratory FacilitiesNew York currently spends over $150 million annually to operate laboratories at eight separate State agencies.1 These labs employ over 1,600 people and occupy well over one million square feet of space. Lab functions vary widely and include infectious disease testing, air and water testing, newborn genetic disease screening, forensic testing (e.g., DNA, ballistics, etc.), and materials testing for roads and bridges.
Despite these seemingly distinct activities, there are opportunities to share resources and improve efficiencies, including eliminating non-core or non-essential lab activities, outsourcing routine lab services, providing administrative services on a shared service basis, and consolidating or co-locating labs with related functions. Equally important, a cross-agency view will lead to better leveraging of the scientific information produced in these labs and foster innova-tive approaches to upgrade the State’s facilities, such as partnerships with research universities and companies. Lo-cal governments could benefit by improving alignment with State resources (e.g., between State Police and county/city police forensic labs), and consolidating the State’s laboratory facilities will create opportunities for such cooperation.
Fleet ManagementHistorically, the State has taken a decentralized approach to managing its fleet of passenger cars and trucks. When the Governor took office, more than 15 agencies owned and operated over 4,700 passenger cars and trucks to carry out their daily activities (excluding specialized vehicles). To better coordinate the State’s capital investment and reduce maintenance costs, the Governor directed the Office of General Services (OGS) to develop a statewide fleet manage¬ment system. OGS identified nearly 500 vehicles for sale as a first step to reduce excess inventory. In April 2012, these vehicles were successfully sold through a new eBay-based online platform, with almost $2 million in proceeds and a significant reduction in ongoing maintenance costs.
OGS also managed a pilot program to monitor the usage of State vehicles. By installing transponders in 250 vehi-cles from a variety of agencies, OGS was able to collect valuable data – from vehicle location to time spent idling to driver habits. This data will help the State identify opportunities to decrease costs, manage driver productivity, and increase safety. In addition, OGS is reviewing fleet management best practices from other industries and is expected to make formal recommendations in several areas shortly. These include whether to purchase, lease or outsource the fleet; whether to in-source or outsource maintenance; and whether to operate the fleet centrally or establish a “fleet coordinator” to create and enforce uniform standards.
Chapter 2: Consolidation and Rightsizing of Facilities
18
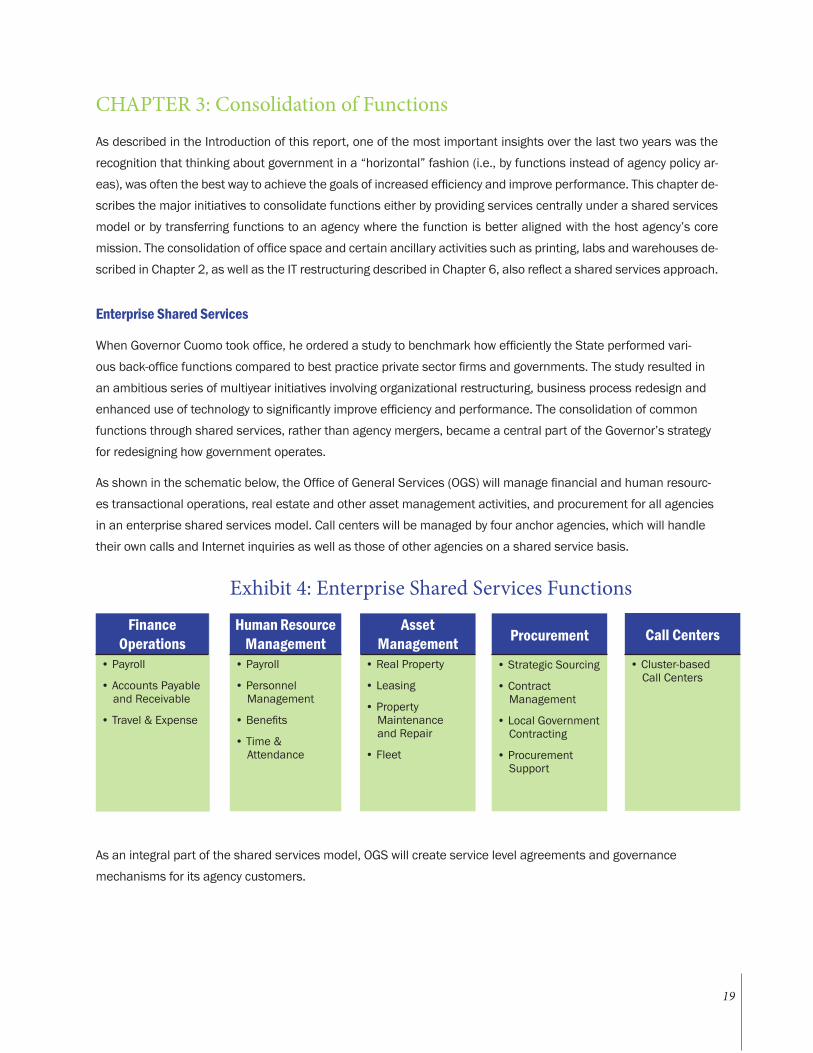
As described in the Introduction of this report, one of the most important insights over the last two years was the recognition that thinking about government in a “horizontal” fashion (i.e., by functions instead of agency policy ar-eas), was often the best way to achieve the goals of increased efficiency and improve performance. This chapter de-scribes the major initiatives to consolidate functions either by providing services centrally under a shared services model or by transferring functions to an agency where the function is better aligned with the host agency’s core mission. The consolidation of office space and certain ancillary activities such as printing, labs and warehouses de-scribed in Chapter 2, as well as the IT restructuring described in Chapter 6, also reflect a shared services approach.
Enterprise Shared Services
When Governor Cuomo took office, he ordered a study to benchmark how efficiently the State performed vari-ous back-office functions compared to best practice private sector firms and governments. The study resulted in an ambitious series of multiyear initiatives involving organizational restructuring, business process redesign and enhanced use of technology to significantly improve efficiency and performance. The consolidation of common functions through shared services, rather than agency mergers, became a central part of the Governor’s strategy for redesigning how government operates.
As shown in the schematic below, the Office of General Services (OGS) will manage financial and human resourc-es transactional operations, real estate and other asset management activities, and procurement for all agencies in an enterprise shared services model. Call centers will be managed by four anchor agencies, which will handle their own calls and Internet inquiries as well as those of other agencies on a shared service basis.
As an integral part of the shared services model, OGS will create service level agreements and governance mechanisms for its agency customers.
CHAPTER 3: Consolidation of Functions
Finance Operations
• Payroll
• Accounts Payable and Receivable
• Travel & Expense
Human Resource Management
• Payroll
• Personnel Management
• Benefits
• Time & Attendance
Asset Management
• Real Property
• Leasing
• Property Maintenance
and Repair
• Fleet
Procurement
• Strategic Sourcing
• Contract Management
• Local Government Contracting
• Procurement Support
Call Centers
• Cluster-based Call Centers
Exhibit 4: Enterprise Shared Services Functions
19
Business Services Center OGS has created a division called the Business Services Center (BSC) to manage common HR and financial transactions on behalf of State agencies. In total, the BSC will process more than 5 million transactions annually in areas such as accounts payable, payroll, travel expenses and other administrative transactional services. The BSC’s full functionality for these processes and the transfer of responsibilities from individual agencies to the BSC will be implemented in phases over the next three years. Once fully phased in, nearly all of the core and support staff who now perform these functions in other agencies will be transferred into the BSC to help deliver these functions under a centralized enterprise shared services model.
The BSC will significantly improve the State’s performance on such core metrics as timeliness, accuracy, and cost per transaction. Reducing the State’s relatively high error rate on processing accounts payable will ensure that the state receives the maximum discounts possible on its purchases, while the many small vendors that rely on the State will benefit from timely and prompt processing of State payments.
In 2011, outside experts analyzed the savings that could be realized from more efficient processing of back-office functions as contemplated by the BSC. Using historical data, PwC estimated that the state could reduce the num-ber of full-time equivalent employees (FTEs) by a total of 760 FTEs over a five-year period if it implemented the productivity initiatives now underway in the BSC.
State agencies have already exceeded this target by reducing the number of employees performing these ad-ministrative functions by nearly 1,000 FTEs, with large agencies having 20-65% fewer administrative staff than at their peak. These agencies would simply be unable to perform these functions on a timely basis without the productivity gains brought about by the BSC.
Procurement and Strategic Sourcing When Governor Cuomo took office, the State’s procurement function operated in an inefficient manner. Each State agency made its own procurement decisions and negotiated prices directly with vendors. OGS administered thousands of active contracts with “not to exceed” pricing, but left agencies the task of negotiating the actual contract price. This resulted in State agencies paying widely varying amounts for the same product and failing to capitalize on the enormous buying power of the State. The consulting firm Accenture, which conducted a bench-marking study of the State’s procurement process, concluded that the State needed to change its procurement business model and organizational structure to achieve savings and retain those benefits over time. The State has adopted this recommendation, which combines a shared services approach with a new business model for procurement, and is known as strategic sourcing.
Strategic sourcing is a structured, market-based process to gather data, conduct quantitative analysis and apply expert judgments to secure the best value in purchasing goods and services. Procurement managers will also work with agencies and assist in meeting the agencies’ goals for purchases from MWBEs and small businesses.
Chapter 3: Consolidation of Functions
20
Chapter 3: Consolidation of Functions
This new organizational structure and strategic sourcing approach to procurement will produce significant savings in both the cost of goods and services purchased and in the procurement process. Strategic sourcing in both the public and private sector has produced savings in the range of 5-15% of the cost of goods and services pur-chased. Based on a conservative estimate using the low end of that range, strategic sourcing will save the State approximately $160 million annually when applied to the State’s $3.2 billion of addressable spending in this area.
The State will reduce the cost of goods and services purchased by improving the procurement process in other ways as well. First, the State is simplifying its standard procurement contracts to improve cycle times, as the current bidding process for State contracts is onerous for vendors and inefficient for the State. Second, the State will simplify vendor access by creating an electronic single point of contact for connecting State government with vendors, similar to Virginia’s eVA System and Pennsylvania’s eMarketplace.
Cluster-Based Call Centers New York State currently operates approximately 400 toll and 450 toll-free numbers, as well as more than 30 call centers which handle or outsource over 150 million toll-free calls annually. The majority of these calls are handled by a few key agencies, including the Department of Labor, the Department of Motor Vehicles, the Department of Taxation and Finance, and the Office of Children and Family Services. When Governor Cuomo took office, the State’s call center strategy lacked a centralized technology, procurement and performance management strategy, which resulted in a system that was inconsistent in quality and inefficient in cost.
To address these issues, the Cuomo administration began consolidating the more than 30 existing call centers into four “anchor” call centers. These call centers will be managed by four host agencies which will handle all calls and Internet inquiries for their hosted agencies. The State began this process by merging the Department of Financial Services’ call center into the call center operated by the Department of Taxation and Finance. Further consolidations will be implemented over the next 12 months.
By standardizing call center technology platforms and segmenting calls according to the level of assistance re-quired to complete a constituent’s transaction, the consolidation of the State’s call centers will improve customer service and achieve significant cost savings. Having state-of-the-art call center technology will also make it easier for the State to introduce a “311” type call center service as part of a broader effort to make it easier for citizens to find information about, and conduct transactions with, State government. One of the benefits to the State of this type of single point of contact is the information it provides about problems citizens have with services pro-vided directly by the State or by a third-party provider which is funded by the State.
Having state-of-the-art call center technology will also make it easier for the State to introduce a “311” type call center service. This service will become part of a broader effort to make it easier for citizens to conduct transac-tions and find information related to State government. This single point of contact will provide information about problems citizens have with State-funded services and allow the State to more quickly address those problems.
21
Shared Services with Other State Entities and Local Governments
State authorities and non-executive controlled agencies, such as SUNY and CUNY, should participate in shared services initiatives where feasible. For example, SUNY already participates in the new strategic sourcing effort managed by OGS. Although the separate financial systems likely make it impractical for authorities to participate in the shared services provided by the Business Services Center, procurement, real estate and other shared functions could well be provided by the State’s shared services model. Doing so would generate savings not only for the authorities and agencies controlled by other entities, but other state agencies as well by increasing the economies of scale within the shared services model.
Realignment of Functions
Creation of the Justice Center Governor Cuomo also took steps to restructure and strengthen the way in which the State protects vulnerable individuals from abuse when they are in institutional care through programs run or licensed by the State. In response to the high number of reported abuses against these vulnerable individuals, Governor Cuomo, in 2012, introduced legislation to create the Justice Center for the Protection of People with Special Needs (the “Justice Center”) in order safeguard “the civil rights of more than one million New Yorkers with disabilities and special needs who for too long have not had the protection and justice they deserve.”
The Justice Center will be the single body responsible for tracking and investigating serious abuse and neglect complaints for facilities and provider agencies that are operated, certified, or licensed by the following six agen-cies: the Department of Health, the Office of Mental Health, the Office for People with Developmental Disabilities, the Office of Children and Family Services, the Office of Alcoholism and Substance Abuse Services, and the State Education Department. In addition, the Justice Center will absorb all functions and responsibilities of the Commis-sion on Quality of Care and Advocacy for People with Disabilities (CQC), except for CQC’s Federal Protection and Advocacy and Client Assistance Programs, which will be designated to a qualified non-profit.
The Justice Center will also create a new level of oversight and transparency for non-State operated facilities and programs licensed or certified by the State to serve vulnerable individuals. Additionally, the Justice Center will expand the State’s capacity to prosecute abusive and negligent individuals and organizations to the fullest extent of the law.
The Justice Center is a good example of breaking down agency silos to increase both efficiency and the quality of services the State provides. The State will realize both economies of scale and the ability to share best practices that ultimately better protect people by consolidating oversight of potential abuse now provided by six separate agencies into the Justice Center.
Chapter 3: Consolidation of Functions
22
Belleayre Ski Center to ORDA A “transfer of function” from one agency to another makes sense when it results in better alignment of the function with the core mission and core competency of the agency to which the transfer is made. The transfer of the Belleayre Moun-tain Ski Center (Belleayre) to the NYS Olympic Regional Development Authority (ORDA) was authorized in the 2012-13 Budget. Owned by New York State and located in the Catskills, Belleayre began operations as a ski center in the 1950s and was operated by the New York State Department of Environmental Conservation (DEC) prior to its transfer. Since opening, it has become a center for winter sports in the region and an economic catalyst for surrounding communities.
However, the continued need for $3-4 million in annual State funding puts the operation at risk, particularly in light of the State’s fiscal condition. DEC recognized that the management of ski centers was not among its core competencies and concluded that transferring operations to ORDA could improve operations and reduce losses. ORDA, which has ex-perience profitably operating Gore Mountain and Whiteface Mountain, will be able to operate Belleayre more efficiently and at a lower cost.
Health and Disabilities Cluster Shared Services The Health and Disabilities cluster of State agencies includes the Department of Health (DOH), the Office for Aging (OFA), the Office of Alcoholism and Substance Abuse Services (OASAS), the Office of Mental Health (OMH), and the Office for People with Developmental Disabilities (OPWDD). The agencies in this cluster perform a number of com-mon functions. These functions could either be centralized in a single agency or new division to be performed on behalf of other agencies cluster on a shared services basis. As discussed in more detail below, the 2013-14 Execu-tive Budget proposes to centralize all Medicaid administrative activities within DOH. A number of other administrative and regulatory activities could in the future be consolidated within a new Division of Central Services for the Health cluster, which would provide these services to agencies in the cluster on a shared services basis.
The main reason that the Division of Central Services for the Health cluster is not being pursued at this time is the large number of other government redesign initiatives involving the Health cluster. These initiatives include imple-mentation of Medicaid Redesign Team initiatives, the creation of the new Health Insurance Exchange, and the cen-tralization of Medicaid rate-setting and other Medicaid administrative activities. In order to ensure strong implemen-tation of these critical initiatives, it makes sense to defer creating a Division of Central Services until more progress is made in implementing these other critical initiatives.
Centralize Medicaid Rate-Setting Activities
There currently are four State agencies—DOH, OASAS, OMH and OPWDD—that have responsibility for performing a rate-setting function (predominantly for Medicaid) to determine funding levels for various services and individual providers of services within those agencies. Tens of thousands of rates, prices, and fees are established for thousands of providers across these four agencies, with little coordination. As a result, reimbursement for similar goods and services can vary significantly. A number of providers funded by Medicaid are multi-service providers, and are funded by two or more of the four State agencies. These four State agencies combined have approximate-ly 150 employees and other significant (primarily technology-related) resources invested in this function.
Chapter 3: Consolidation of Functions
23
The 2013-14 Executive Budget proposes to consolidate all Medicaid administrative activities into DOH, including all activities related to managed care plans in Medicaid rate setting in claims processing activities. This central-ized approach will enable closer coordination and oversight of rate-setting policies and methodologies. These rate-setting activities will also include such matters as cost reporting, capital reviews and data management.
Create a Division of Central Services for the Health cluster
A future option for the administration to consider is the creation of a Division of Central Services for the Health cluster to manage certain functions that are specific to this cluster on a shared services basis. Each of the health and disabilities agencies operates separate and distinct administrative operations such as facilities management, communication and legal services, and human resources. However, in performing these functions, the agen-cies are organized very differently. Operations are performed in many different ways from agency to agency and in many cases, without central direction within the cluster. As a result, there is lack of consistency in how these agencies manage these functions. Some agencies have centralized administrative functions, while others rely on the field and/or regional district offices for oversight and management. A Division of Central Services could distrib-ute manpower and other resources more efficiently and promote best practices across agencies.
Currently, 1,000 FTEs are involved in certification, licensure, credentialing, and surveillance of health and dis-abilities programs. Much of the staff in these functions could formally remain under the auspice of their existing agencies, but would be coordinated by the Division of Central Services within a shared services model.
As part of a broader effort by the Cuomo administration to rationalize the number of regional offices various agencies and authorities operate, the health and disability agencies could co-locate field offices wherever possible to improve efficiency and coordination. In order to oversee quality and support operations at the local level, each of the four major operating agencies has a regional structure. These regional organizations support many similar functions, particularly in the areas of licensure and inspection. These centers vary, however, in numbers (DOH has 4, OMH has 5, OASAS has 11 and OPWDD has 13), areas served and the degree of operational responsibilities. The lack of coordination or integration of their licensure and inspection activities often presents challenges to providers seeking to serve multiple populations.
Aligning the boundaries of agencies’ field offices would relieve a significant problem faced by providers who serve more than one population. Because of the different area boundaries, a provider in Binghamton, for instance, needs to work with agency field offices in Syracuse and in Rochester. Providers also are required to submit two licensure and certification reviews of the same records and materials to two different State agencies.
Chapter 3: Consolidation of Functions
24
Coordinated Health Insurance Purchasing NYSHIP is among the three largest public employee health insurance programs in the nation covering over 1.2 million State, public authority, and local government employees, retirees and their eligible dependents. It is cur-rently administered by the Employee Benefits Division of the Department of Civil Service (DCS) with a staff of 86 FTEs. In contrast, the State’s public health insurance plans are administered by DOH’s Office of Health Insurance Programs (OHIP), which has a staff of 576 FTEs.
While health insurance benefits are an important tool to attract and maintain a qualified workforce, the efficacy of DCS’ administration of NYSHIP could be enhanced by leveraging the assets and institutional knowledge of DOH. Beginning in 2013-14, DCS and DOH will adopt common approaches to take advantage of efficiencies resulting from best practices, including the alignment of hospital cost reimbursement policies, the expansion of patient centered medical home models, and the promotion of evidence-based strategies to enhance wellness and reduce health care costs. Future annual savings of more than $50 million, $19 million of which will accrue to the State, may be possible when these agencies adopt a common purchasing strategy for medical services.
In addition to these steps, the Cuomo administration is also seeking to save money by changing the structure of the State’s relationship with outside vendors. At present, the State contracts with insurance companies to provide “insurance” for the NYSHIP plan, but the State retains virtually all of the risk in these arrangements. The admin-istration is pursuing self-insurance options for NYSHIP to determine whether that approach can reduce costs without compromising quality.
As the initial step in this strategy, the State has agreed to a contract to directly procure NYSHIP’s pharmacy bene-fits from a pharmacy benefit manager (PBM), beginning in 2014. Procuring prescription drugs from a PBM directly, instead of acquiring them through an insurer that has little financial incentive to reduce costs, has allowed the State to negotiate deeper purchasing discounts and avoid taxes imposed by the federal government. By ceas-ing its previous arrangement with an insurer and entering into a new self-insured agreement, NYSHIP will realize $230 million in annual savings, approximately $85 million of which will accrue to the State.
Homeless Housing Assistance Program to HCR The Homeless Housing and Assistance Program is administered by the Homeless Housing Assistance Corporation (HHAC), which currently is part of the Office of Temporary and Disability Assistance (OTDA). The program provides capital grants and loans to not-for-profit organizations, municipalities, and public corporations to acquire, con-struct, or rehabilitate properties to provide housing for people who are homeless and cannot find housing without public assistance. Between the inception of the program in 1983 and 2011, the HHAC awarded a total of nearly $800 million in grants and loans. In 2011 alone, thirteen housing projects completed construction, preserving or creating 966 units of housing at a cost of $48.6 million.1
1. Homeless Housing Assistance Program Annual Report to the Governor, 2011.
Chapter 3: Consolidation of Functions
25
In order to better align this housing finance function with the core competency of its host agency, the 2013-14 Executive Budget proposes transferring responsibility for the HHAC from OTDA to Homes and Community Renewal (HCR) – the State’s primary housing finance authority. Consistent with its mission and core competency, OTDA will continue to provide support services to the residents of these housing units.
Mitchell-Lama Housing Portfolio to HCR Beginning in 1955, New York State financed the construction of more than 105,000 affordable housing units under the Limited Profit Housing Companies Act, commonly known as the Mitchell-Lama program. This program grants low-interest mortgages and real estate tax exemptions to private developers in exchange for the construc-tion of affordable housing with rent and tenant income restrictions. Mitchell-Lama projects were financed by the State Loan Fund, the Housing Finance Authority (HFA) and the Urban Development Corporation (UDC, known today as Empire State Development or “ESD”) and by leveraging federal Housing and Urban Development (HUD) Section 236 mortgage interest subsidies as an additional source of financing.
Today, ESD holds these mortgage assets and continues to receive related HUD Section 236 interest rate subsi-dies for 36 Mitchell-Lama projects that contain approximately 8,700 units of affordable housing. These mortgage assets and interest rate subsidies generate nearly $30 million in excess revenue annually, which ESD has used to fund its own operations. In part because these funds have been used to fund ESD’s operations instead of main-taining the Mitchell-Lama housing stock, the housing units in these projects are now severely distressed and in need of rehabilitation. Moreover, many of these projects are in arrears on their mortgage payments. The accumu-lating disrepair, combined with the expiration of these interest rate subsidies, now threatens the on-going viability of this portfolio of affordable housing.
To put this portfolio back on sound physical and financial footing, Governor Cuomo in his 2013 State of the State address announced the transfer of the portfolio from ESD to New York Homes and Community Renewal (HCR) as part of a plan to spend approximately $1 billion over the next five years to build and preserve affordable housing. HCR estimates that the transfer of the Mitchell-Lama mortgage assets and interest rate subsidies will support $173 million of new financing. The combination of this $173 million of new financing, $175 million of additional HCR subsidies over the next five years, $274 million of federal tax credit funding, and approximately $83 million of miscellaneous funding will support the expenditure of approximately $705 million on the rehabilitation of these 8,700 units plus additional acquisition and other costs.
Because HCR’s core competency is financing affordable housing, the execution of this financing strategy can be more effectively managed at HCR than at ESD.
Chapter 3: Consolidation of Functions
26
Realignment of Overlapping Functions between DPS and NYSERDA The State has played a vital role in the energy markets in New York State through regulation, direct ownership of energy assets and initiatives to reduce energy demand. Responsibility for these activities is spread across four State agencies or authorities. In recent years, the activities of these entities began to overlap as each de-veloped initiatives in support of broader energy policy goals, such as increasing energy supply from renewables and reducing demand through energy efficiency, in addition to their original core missions.
In the aftermath of Hurricane Sandy, Governor Cuomo established a commission under the Moreland Act to in-vestigate the response, preparation, and management of New York’s power utility companies to major storms, as well as to review the organizational structure of New York’s energy-related agencies and authorities.
In addition to recommending the privatization of the Long Island Power Authority (as described in Chapter 4), the Moreland Commission suggested ways to reduce the overlap and redundancy of functions among the State’s three other energy agencies and authorities. Governor Cuomo took the first of these steps when he appointed a new Cabi-net-level Chairman of Energy Policy and Finance to oversee all of the State’s energy agencies and authorities. Further streamlining for certain functions could occur by realigning responsibility for these agencies’ energy efficiency and clean energy programs, emergency preparedness planning, and energy planning efforts.
The entities where the overlap of functions is greatest are the New York State Energy Research and Development Au-thority (NYSERDA) and the Department of Public Service (DPS). NYSERDA was created in 1975 to help fund research and development for innovative technologies to help reduce the State’s petroleum consumption. DPS is the staff arm of the independent Public Service Commission (PSC), which was created in 1940 to regulate all public utilities. DPS is an executive-controlled agency and its commissioner also serves as the chairman of the five-member PSC.
Streamlining this organizational structure could be accomplished in a number of ways, the most direct of which would be to jointly manage or transfer functions from one entity to the other depending on the nature of the activ-ity. A more far-reaching streamlining option would be to create a unified leadership team similar in structure to that which exists with ESD and the Department of Economic Development and with New York Homes and Community Renewal.2
2. For example, Connecticut recently reorganized its energy agency and public utility regulator in the interests of developing a more integrated approach to energy policy. In 2011, Connecticut created a combined Department of Energy and Environmental Protection (DEEP). In doing so, it combined activities of its Public Utilities Regulatory Au-thority (PURA) by consolidating the staff into DEEP. One group of former PURA employees was designated as having “policy” roles, while others were designated as having “board support” regulatory roles.
Chapter 3: Consolidation of Functions
27
DPS and NYSERDA are also the two main entities involved in drafting the State Energy Plan. Energy planning is an executive function, and responsibility for it should be concentrated in one entity, perhaps under the authority of the new Cabinet-level Chairman of Energy Policy and Finance. The Moreland Commission recommended that a single office of combined NYSERDA and DPS staff related to energy markets, policy and planning, and emergency response be created to provide for a more unified and coordinated approach and more effective implementation
of these activities.
Coastal Zone Management to DEC The Department of State (DOS) administers several programs related to coastal zone and waterfront plan-ning and permitting that date to the early 1970s. In 1972, in response to growing concerns that coastal areas were being developed without an overall strategy for comprehensive coastal management, the federal government enacted the Coastal Zone Management Act (the “CZMA”). Soon thereafter, DOS was designated as the lead agency and recipient for federal funding to implement the CZMA in New York, because of DOS’s role in local planning.
The Department of Environmental Conservation (DEC) was created in 1970, and it serves as the principal agency responsible for the conservation, improvement and protection of natural resources, including marine and coastal resources. Because the planning role of DOS in administering CZMA often overlaps with the environmental protection rules issued by DEC, the related efforts of these two agencies causes confusion and delay among outside constituents seeking permits and approvals for waterfront projects from both State agencies.
In recent months, DOS has been exploring alternatives to address these redundancies, including waiving review of smaller projects and simplifying decision standards. While these steps will help, they will not fully resolve the duplicative reviews of larger projects. For these reasons, the SAGE Commission has identified as a future option the transfer of the Coastal Zone Management Program and related programs from DOS to DEC. Not only would this streamline reviews and approvals for permit applicants, it would also leverage DOS’ strong planning expertise across DEC’s broader efforts.
Of the 29 states which have Coastal Zone Management programs, 20 states have designated their natural resources or environmental management agency as the lead agency for administering the CZMA. Only three (including New York) designate the state planning agency. The remaining states typically have specialized entities, such as the California Coastal Commission, to perform this function.
Chapter 3: Consolidation of Functions
28
Despite the usefulness of other forms of organizational restructuring and rightsizing, mergers and consolida-tions of agencies and authorities continue to be an important tool in streamlining State government.
The Commission evaluated a large number of potential candidates for merger or consolidation that would achieve the Governor’s goal of streamlining government. Agencies and authorities that met one or more of the following criteria were considered to be potentially strong candidates:
•Agenciesandauthoritiesinsimilarpolicyareasthathaveoverlappingmissions,customersorcommon functions;
•Agenciesinpolicyareasundergoingsignificantchange,wherecombiningexistingagenciescanprovide a catalyst for modernizing the State’s role; and
•SmalleragenciesthatarelessconnectedtothepolicymakingapparatusofStategovernmentor are otherwise challenged to achieve their core mission and which have similar core missions and functions to larger agencies.
FivemergersandconsolidationswerecompletedduringthefirsttwoyearsoftheCuomoadministrationandanothertwoagencyrestructuringsareinprocessorhavebeenproposedinthe2013-14ExecutiveBudget.TheCommissionhasidentifiedanadditionalninemergersandconsolidationsasfutureoptionstobeconsideredonce more progress is made on ongoing initiatives and if various obstacles can be addressed. These mergers andconsolidationsaresummarizedinExhibit7onpage46.
AnimportantdistinctionillustratedinExhibit6isthedifferencebetweenalegalmergerofagenciesorauthorities and a management consolidation of one or more agencies and authorities. In the case of a con-solidation, closely related agencies and/or authorities remain legally separate but are managed by a single senior leadership team. The consolidation structure has been used to date in two policy areas – economic development (involving the Department of Economic Development and Empire State Development) and housing(involvingtheentitiesshowninExhibit5below).Themanagementconsolidationstructureisbeingproposed as a future option in the case of the potential consolidation of the Department of Transportation and the Thruway Authority.
CHAPTER 4: Consolidation of Agencies and Authorities
29
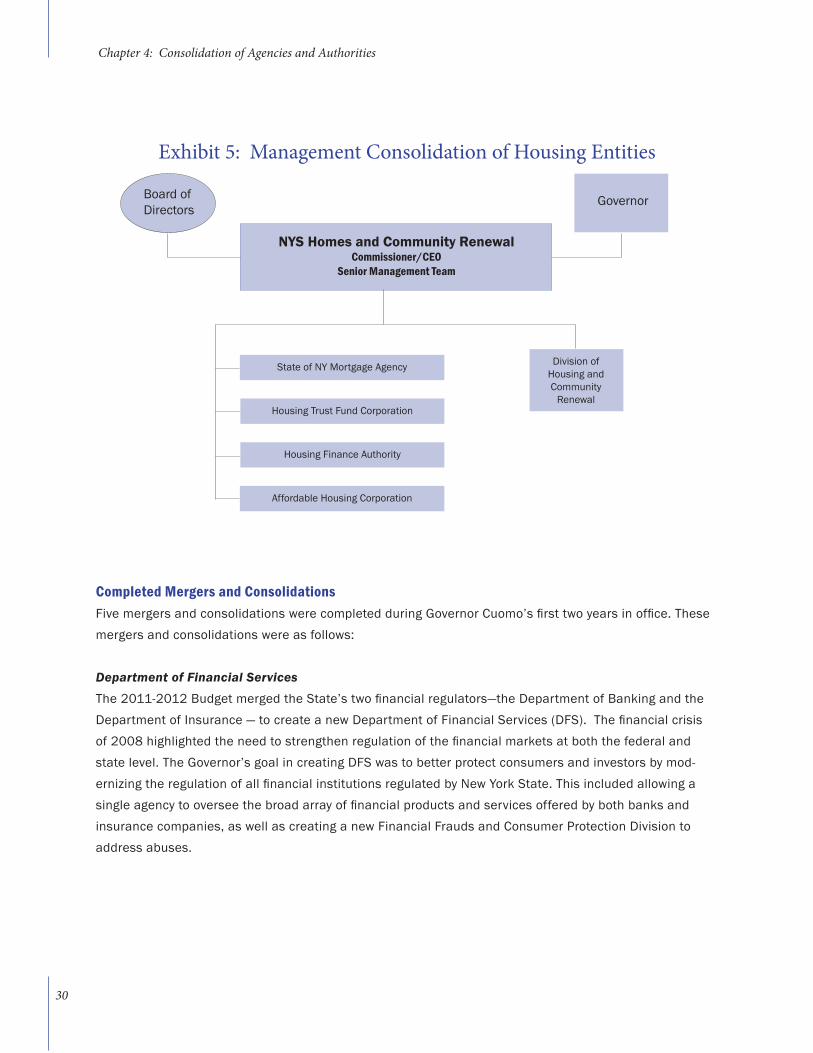
Exhibit 5: Management Consolidation of Housing Entities
NYS Homes and Community RenewalCommissioner/CEO
Senior Management Team
BoardofDirectors
Governor
Division of Housing and Community
Renewal
State of NY Mortgage Agency
Housing Trust Fund Corporation
Housing Finance Authority
Affordable Housing Corporation
Chapter 4: Consolidation of Agencies and Authorities
30
Completed Mergers and ConsolidationsFivemergersandconsolidationswerecompletedduringGovernorCuomo’sfirsttwoyearsinoffice.Thesemergers and consolidations were as follows:
Department of Financial ServicesThe2011-2012BudgetmergedtheState’stwofinancialregulators—theDepartmentofBankingandtheDepartmentofInsurance—tocreateanewDepartmentofFinancialServices(DFS).Thefinancialcrisisof2008highlightedtheneedtostrengthenregulationofthefinancialmarketsatboththefederalandstate level. The Governor’s goal in creating DFS was to better protect consumers and investors by mod-ernizingtheregulationofallfinancialinstitutionsregulatedbyNewYorkState.Thisincludedallowingasingleagencytooverseethebroadarrayoffinancialproductsandservicesofferedbybothbanksandinsurance companies, as well as creating a new Financial Frauds and Consumer Protection Division to address abuses.
Chapter 4: Consolidation of Agencies and Authorities
Department of Corrections and Community SupervisionThe2011-2012BudgetalsomergedtheDepartmentofCorrectionalServicesandtheDivisionofParoletocreate a new Department of Corrections and Community Supervision (DOCCS). This merger created a single entitytosupportoffendersfromincarcerationthroughre-entryintothecommunity.Byenhancingthepros-pectsofoffenderstosuccessfullyreturntotheirhomecommunities,DOCCSlowerstheriskofrecidivism,makingcommunitiessaferandreducingthecostsassociatedwithrepeatoffenders.
Merger of NYSTAR into Empire State DevelopmentThe2011-2012BudgetmergedtheNewYorkStateFoundationforScience,TechnologyandInnovation(NYSTAR)into Empire State Development (ESD). Previously, NYSTAR funded innovative programs in support of high-tech re-search across the State. These programs were once an ancillary activity, but are now an integral part of economic development strategy. Merging the functions and small staff (23 FTEs) of NYSTAR into ESD both saved money through reduced overhead and ensured that these efforts were fully aligned with the State’s other economic development activities.
Merger of the Consumer Protection Board into the Department of StateThe2011-12BudgetmergedtheConsumerProtectionBoard(CPB)intotheDepartmentofState.Asasmallagencywithonly33FTEs,theCPBbenefitsfrombeinghostedwithintheoperationsofthemuchlargerDe-partment of State, allowing it to better focus on its core mission to advocate for and serve consumers.
Gaming CommissionThe2012-2013BudgetconsolidatedtheDivisionofLotteryandtheRacingandWageringBoardintoanewGamingCommission.Inrecognitionofthegamingindustry’svitalroleinNewYorkState’soveralleconomyandits contributions to the State’s economic development and job creation, the purpose of the new Gaming Com-missionistointegraterelatedoperationsofthetwoentities.Itseekstoincreaseefficienciesandmodernizethe State’s regulatory structure by reducing costs and eliminating any unnecessary redundancies that previ-ouslyexisted.InanticipationofaconstitutionalamendmenttolegalizecasinogaminginNewYorkState,theGaming Commission will be a robust regulatory structure to ensure that all gaming activity conducted in the State will be of the highest integrity, credibility, and quality. Furthermore, the Gaming Commission will ensure that the best interests of both the gaming and non-gaming public will be served.
InadditiontoconsolidatingtheoperationsoftheDivisionofLotteryandtheRacingandWageringBoard,thenewlyformedGamingCommissionalsoincludesanewOfficeofRacingPromotionandDevelopment.Thisnewof-ficetookovertheoperationalaspectsoftheNewYorkStateThoroughbredBreedingandDevelopmentFund,theAgricultureandNewYorkStateHorseBreedingDevelopmentFund,andtheNewYorkStateQuarterHorseBreed-ingandDevelopmentFund.ThisconsolidationallowsthenewlyformedOfficeofRacingPromotionandDevelop-menttooperatemoreefficientlyandtobetterservethevariousstakeholdersofNewYork’sracingindustry.
31
2013-14 Executive Budget Proposals
Merger of the Welfare Inspector General (OWIG) into the Office of the Inspector General The2013-14ExecutiveBudgetproposesmergingtheOfficeoftheWelfareInspectorGeneral(OWIG)intotheNewYorkStateOfficeoftheInspectorGeneral(OIG).TheSAGECommissionreviewedthepotentialformergingoneormoreofthreeotherindependentInspectorsGeneral,butforthereasonsdescribedbrieflybelow,de-terminedthatsuchadditionalmergerswouldnotbeadvisable.OIGistaskedwithindependentlyinvestigatingfraud, corruption, and abuse at State agencies and authorities.1OIGhasapproximately65employeesandhasbroadjurisdictionrelatingtoallactivitiesinvolvinggovernmentfunds.OWIG,createdattheheightofwelfarereformin1992,hasamandatetodetectandpreventfraudinthesocialwelfareprograms;however,ithasex-tremelylimitedresources,resultinginlostopportunitiesandconfusionoverjurisdiction.Forexample,withonlyfiveemployees,OWIGwasabletoinvestigatejustoverhalfofthecasesreceivedin2012.
BycombiningOWIGintoOIG,theStatewillbeabletoleveragesupportservices,allocatecasesmoreeffec-tively, reduce confusion over jurisdiction, and improve the State’s ability to eliminate and deter fraudulent welfarepayments.OIGwouldnotprosecutecases(permissibleunderOWIG’scurrentauthority)butinsteadwouldreferthemtolocaldistrictattorneysortheOfficeoftheAttorneyGeneral.
SAGE reviewed three other independent Inspector Generals, all of which are created in law and appointed by the Governor:
•TheOfficeofMedicaidInspectorGeneral(OMIG)•TheWorkers’CompensationFraudOfficeoftheInspectorGeneral(OFIG)•TheMTAInspectorGeneral
OMIGwascreatedin2006topreservetheintegrityoftheMedicaidprogrambyconductingandcoordinatingfraud,waste and abuse activities for all State agencies responsible for services funded by Medicaid. OMIG focuses on improper payments to Medicaid providers, as distinct from investigating intentional fraud, a role which is within thejurisdictionoftheOfficeoftheAttorneyGeneral.OMIGhasastaffofapproximately550FTEs,whichisnearly10-times the size of OIG’s staff.
OMIGhassuchadifferentmandateandemployeebasethatitwouldmakeintegrationwithOIGchallengingandwithlittlebenefit.Furthermore,sinceOMIG’sresourcesarealmostexclusivelydevotedtoidentifyingimproperpaymentsunderfee-for-servicereimbursementarrangements,theoffice’srolewillneedtochangesignificantlyastheStatetransitionsallMedicaidenrolleestoamanagedcaremodeloverthenextfewyears.
Chapter 4: Consolidation of Agencies and Authorities
32
1.Thisroleisdistinctfrominternalaudit(focusingoninternalcontrolsandriskassessmentwithinaccountingandfinanceoperations)andethicscounseling(guidancetraining,andpreventionofviolationsofthepublicofficer’slaw).
TheWorkers’CompensationFraudOfficeoftheInspectorGeneral(OFIG)investigatesfraudandabusepertain-ingtotheoperationoftheworkers’compensationsystem.Thisincludesfraudcommittedbyattorneys,employ-ees, employers, health care providers, and insurance carriers. The role OFIG plays is fundamentally different from other IGs in that it is not addressing fraudulent use of government funds, but rather fraudulent activity byparticipantsintheWorkers’Compensationsystem.Forthisreason,theSAGECommissiondoesnotseeabenefittocombiningitsactivitieswiththoseofOIG.
The MTA Inspector General investigates complaints of criminality, fraud, waste and abuse, as well as safety, serviceandmanagementdeficiencies.ThoughitsstaffsizeisroughlyequivalenttoOIG(withapproximately70employees),itsroleisbroader.TheMTAIGalsoperformsin-depthauditsandreviewsofawidevarietyof business and service-related activities of the MTA and its subsidiaries, including audits and reviews of the MTA’s contractors and vendors. Given at least a major part of the MTA IG’s role is similar to that of OIG, the SAGE Commission believes there may be opportunities for better coordination of resources and consolidation ofrelatedactivitiesthatshouldbefurtherexplored.
Consolidation of the Governor’s Office of Employee Relations and the Department of Civil Service This proposal is discussed in Chapter 8 under “Attract and Manage Talent through DCS and GOER Consolidation.”
Future Options
TheSAGECommissionidentifiedotherpotentialmergerandconsolidationcandidatesasfutureoptions.There is a rationale for each of these potential merger and consolidation proposals, but they also face vari-ousobstacles.Theseobstaclesincluderestrictiveworkrulesandtheneedtoobtainsufficientconsensusamongstakeholdersthatitispossibletoobtainlegislativeapprovalforthemergerorconsolidation.Asaresult, the Commission recommends the consideration of these mergers and consolidations in the future when more progress has been made on implementing the wide range of ongoing initiatives and proposals in the2013-14ExecutiveBudgetandwhenthesevariousobstacleshavebeenaddressed.
Privatization of the Long Island Power AuthorityLIPAwascreatedundertheNewYorkPublicAuthorityLawin1985asafinancingvehicletoacquiretheassetsoftheLongIslandLightingCompanyfollowingtheclosureofitsShorehamnuclearpowerplant.LIPA’sprimaryresponsibilities are to oversee a contract with National Grid, a private utility, that uses the transmission and distributionnetworkownedbyLIPAtoprovideelectricityto1.1millionLongIslandcustomers,andtoservicedebtrelatedtotheclosingoftheShorehamplant.LIPAemploysonly112people,whiletheoperationsarehandled by about 2,000 National Grid employees.
Chapter 4: Consolidation of Agencies and Authorities
33
Following the dysfunctional response of many electric utility companies to Hurricane Sandy and earlier storms, Governor Cuomo established a commission under the Moreland Act to study and investigate the response,preparation,andmanagementofNewYork’spowerutilitycompaniestosuchstorms.BecauseLIPA’sperformancewasespeciallypoor,theMorelandCommissiondirecteditsinitialfocustoreviewingtheorganizationalstructureandperformanceofLIPAandtoaddressingproblemswiththeState’sutility regulation and overlapping activities of the State’s various energy-related agencies and authorities.
OnJanuary7,2013,theMorelandCommissionreleaseditsInitialReportand,amongotherfindings,conclud-edthatLIPA’soutsourcingofmostday-to-dayoperationsofthesystemwasinherentlyflawedanddidnotwork.Specifically,itfoundthatthebifurcatedLIPA-NationalGridorganizationalstructureledtomismanagement,alackofappropriateinvestmentininfrastructure,alackofaccountabilitytocustomersandexcessiverates.
Toaddresstheseshortcomings,theMorelandCommissionidentifiedthreeoptionsforconsideration:
•SelltheassetsofLIPAtoaqualifiedinvestor-ownedutility(IOU)thatwouldoperateinLIPA’sser-vice territory (“privatization”);
•TakefullpublicownershipandoperationbyLIPAofthetransmissionanddistributionsystem(“mu-nicipalization”); and
•CombineLIPAunderthemanagementandcontroloftheNewYorkStatePowerAuthority(NYPA),withLIPAremainingaseparatesubsidiarywithinNYPA.
WhiletheMorelandCommissionidentifiedspecificbenefitsandriskswitheachalternative,itrecommendedprivatization as the preferred path.
The Moreland Commission also recommended that new oversight and enforcement mechanisms be consid-eredtopermitthePublicServiceCommission(PSC)tomakethepublicutilitiesitregulatesmoreaccountableandresponsive.OneofthedrawbacksofLIPA’scurrentstructureisthatitisnotregulatedbythePSC.Undertheprivatizationproposal,LIPAwouldcomeunderthePSC’sjurisdictiononcetransferredtoprivateownership.2
Consolidation of Transportation Agencies and Authorities The State has three transportation entities – the Department of Transportation (DOT), the Thruway Authority and theBridgeAuthority–withsimilarmissions.Allthreeentitiesexisttokeeproadsandbridgessafe,reliableandavailableforthetravelingpublic(seeExhibit6forsummarystatistics).
Chapter 4: Consolidation of Agencies and Authorities
34
2.AchallengeofprivatizationisthatLIPA’sassetshaveabookvalueofabout$3.5billion,whileithasapproximately$7billionofdebt.Sellingtheassetsforlessthanthedebtoutstandingwouldresultin“stranded”debtthatwouldneedtoberepaidovertime.However,theanalysisoftheCuomoadministrationsuggeststhatduetoefficienciesrelatedtoprivatization,aprivateutilitywillbeabletochargeratesconsistentwithorevenlessthanthoseprojectedbyLIPAandstill repay this stranded debt over time.
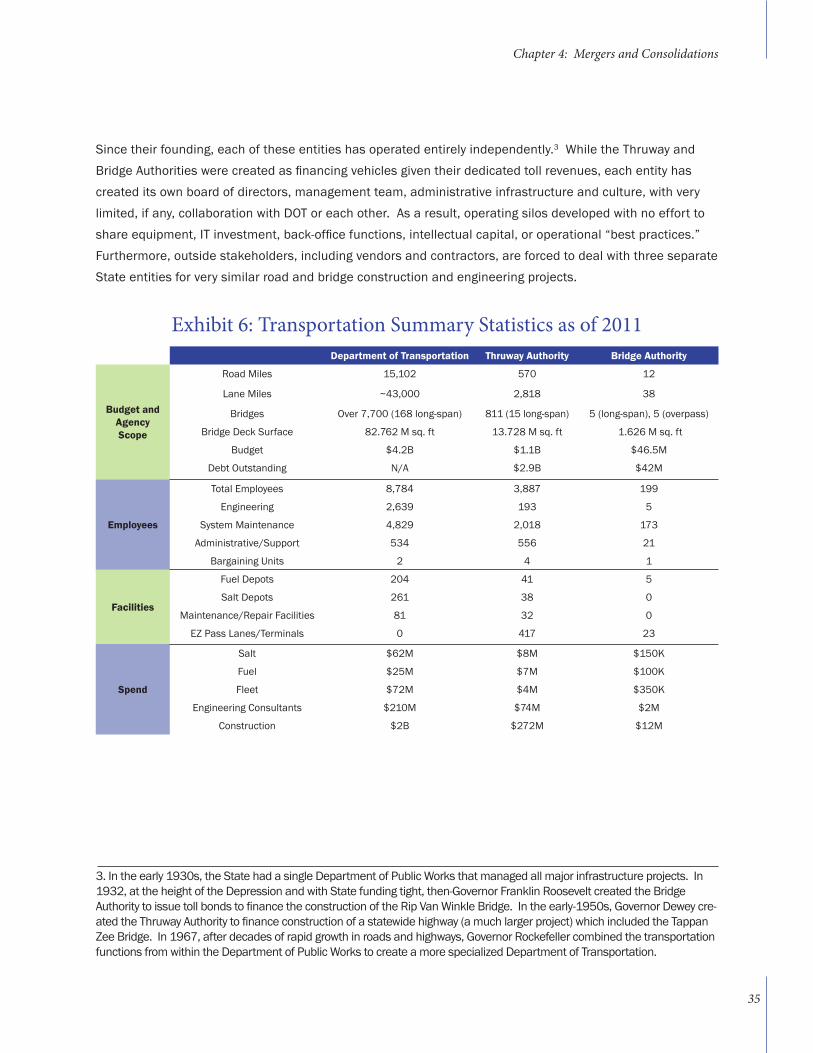
Since their founding, each of these entities has operated entirely independently.3WhiletheThruwayandBridgeAuthoritieswerecreatedasfinancingvehiclesgiventheirdedicatedtollrevenues,eachentityhascreated its own board of directors, management team, administrative infrastructure and culture, with very limited, if any, collaboration with DOT or each other. As a result, operating silos developed with no effort to shareequipment,ITinvestment,back-officefunctions,intellectualcapital,oroperational“bestpractices.”Furthermore,outsidestakeholders,includingvendorsandcontractors,areforcedtodealwiththreeseparateState entities for very similar road and bridge construction and engineering projects.
Exhibit 6: Transportation Summary Statistics as of 2011
3.Intheearly1930s,theStatehadasingleDepartmentofPublicWorksthatmanagedallmajorinfrastructureprojects.In1932,attheheightoftheDepressionandwithStatefundingtight,then-GovernorFranklinRooseveltcreatedtheBridgeAuthoritytoissuetollbondstofinancetheconstructionoftheRipVanWinkleBridge.Intheearly-1950s,GovernorDeweycre-atedtheThruwayAuthoritytofinanceconstructionofastatewidehighway(amuchlargerproject)whichincludedtheTappanZeeBridge.In1967,afterdecadesofrapidgrowthinroadsandhighways,GovernorRockefellercombinedthetransportationfunctionsfromwithintheDepartmentofPublicWorkstocreateamorespecializedDepartmentofTransportation.
Department of Transportation Thruway Authority Bridge Authority
Budget and Agency Scope
Road Miles 15,102 570 12
LaneMiles ~43,000 2,818 38
Bridges Over7,700(168long-span) 811(15long-span) 5(long-span),5(overpass)
BridgeDeckSurface 82.762Msq.ft 13.728Msq.ft 1.626Msq.ft
Budget $4.2B $1.1B $46.5M
Debt Outstanding N/A $2.9B $42M
Employees
Total Employees 8,784 3,887 199
Engineering 2,639 193 5
System Maintenance 4,829 2,018 173
Administrative/Support 534 556 21
BargainingUnits 2 4 1
Facilities
Fuel Depots 204 41 5
Salt Depots 261 38 0
Maintenance/Repair Facilities 81 32 0
EZPassLanes/Terminals 0 417 23
Spend
Salt $62M $8M $150K
Fuel $25M $7M $100K
Fleet $72M $4M $350K
Engineering Consultants $210M $74M $2M
Construction $2B $272M $12M
Chapter 4: Mergers and Consolidations
35
Chapter 4: Consolidation of Agencies and Authorities
In2011,DOT,theThruwayAuthorityandtheBridgeAuthorityformedseveninteragencyworkgroupstoexplorecostsavingsopportunitiesintheareasofgreatestoverlap.Theseareasincluded:(i)fleetmaintenanceandprocurement,(ii)procurement of materials, (iii) facilities, (iv)engineering, (v) system maintenance, (vi) IT, and (vii) administrative functions.
Withthehelpofanoutsideconsultant,theworkgroupsidentified12categoriesofopportunitiesforsynergiesorprocessimprovementsthatwouldsaveapproximately$55-88millionannuallyoncefullyimplemented(within3-5years). The largest savings would come not from synergies but from the sharing of best practices (such as construction inspection) now used by one entity with the other entities. The analysis did identify synergies from the consolidation of administrativefunctions,butfoundlittle,ifany,benefitfromcombininghighwaymaintenanceworkersorroadcrews.4
Giventhecomplexityofcombininganagencyandtwoauthoritieswithover$3billionoftoll-backeddebtoutstanding,theSAGECommissionidentifiedthefollowingpotentialmulti-stepconsolidationplan:
•Createasingletoll-collectingandfinancingentitytomanagetheHudsonRivercrossingsbymergingtheThruwayAuthorityandBridgeAuthority.TheBridgeAuthorityhaslessthan$150millionofdebtoutstanding,whichcouldberefinancedbytheThruwayAuthority.Thecombinedauthoritywouldhaveasingle board of directors with powers and independence identical to the current Thruway Authority board (i.e. to set tolls, ensure quality of service, oversee capital planning and borrowing and other matters). The level of tolls on the Hudson River crossings would not be affected by this merger and would continue tobesetbasedontheparticularcircumstancesofthemid-HudsonValleyregion.Toavoidanyappear-anceofcross-subsidization,tollrevenuefromthebridgescurrentlymanagedbytheBridgeAuthoritywouldcontinuetobededicatedtotheiroperation,upkeep,andrepairasitistoday.
•ConsolidatetheleadershipandcertainfunctionsofthenewThruwayAuthorityandDOTtoachievetheidentifiedoperatingefficienciesandsavings.
SincetheanalysisbytheDOT-Thruway-BridgeAuthorityworkinggroupswascompletedinmid-2011,implementationofanumber of these savings opportunities has begun, including joint purchasing of materials (through the State’s new stra-tegicsourcinginitiatives)andofficespaceconsolidation(throughtheState’sbroaderrealestateoptimizationinitiative).Inaddition,bothDOTandThruwayhaveinitiatedtheirownstandalonecostreductionprograms.Forexample,DOTisstartingtotakestepstoconsolidateadministrativeandengineeringfunctionsidentifiedthroughtheSAGEprocessacrossits11regionaloffices.Thiswillallowresourcestobeallocatedmoreflexiblyinresponsetoworkloads.DOT’sregionalstructurehaslongbeenthoughttocontaininefficiencies,andthisisafirststepinabroaderrationalizationprocess.
4. The consolidation of transportation entities in Massachusetts was also reviewed in connection with this analysis. In 2009, Mas-sachusettscombinedseveralentitiesintoasingleintegratedDepartmentofTransportation(MassDOT).ThisincludedtheExecu-tiveOfficeofTransportationandPublicWorks,theMassachusettsTurnpikeAuthority,theMassachusettsHighwayDepartment,theRegistryofMotorVehicles,theMassachusettsAeronauticsCommission,theTobinBridge,andoversightofthebridgesandparkwaysoperatedbytheDepartmentofConservationandRecreationandtheMassachusettsPortAuthority.Attheendof2010,MassDOTidentified$80millionofoperatingsavingsinthefirstyear,$30millionofwhichresulteddirectlyfromcombiningDOTandtheTurnpikeAuthority.Theother$50millionwasattributedtosavingsattheMassachusettsBayTransitAuthorityandotheritems.
36
Chapter 4: Consolidation of Agencies and Authorities
TheThruwayAuthorityhaslaunchedabroadinternalrestructuringtoalleviatetheneedforsignificanttollin-creases.Thisincludeseliminatingover350positionsorabout6%oftheworkforce,aligningemployeebenefitswiththoseofotherStateworkers,significantlyreducingtravelandovertime,expandingsharedservices,andreducingthesizeofitsfleet.Intotal,thesemeasureswillsaveover$50millionperyearinoperatingexpensesandreducethefive-yearcapitalprogramby$300million.Effortstoimplementvariousfurthercostsavinginitiativeswouldlikelybeacceleratedthroughamanagementconsolidation.
Twomajorobstacleswereidentifiedaspartoftheanalysis.WorkersatDOTandtheThruwayAuthorityarerepresentedbydifferentlaborunions,addingalayerofcomplexitytocombiningfunctions.Forexample,clericalworkersandroadmaintenanceworkersarerepresentedbyCSEAatDOTandTeamstersatThruway.EngineersarerepresentedbyPEFatDOTandCSEAatThruway.Becausecertainactivitiesaresubjectto“exclusivity”foraparticularunionandbargainingunit,DOTworkersmightbeprohibitedfromperformingsomefunctionsrelatingtotheThruwayAuthority(andviceversa).Un-derstandingwhereexclusivityexistsrequiresadetailedfunction-by-functionanalysis.The“exclusiveunitofwork”doctrineposesasignificantobstacletoaconsolidation,becauseitlimitstheabilitytoachievesavingsthroughafullintegration.
AnothermajorobstacletoaconsolidationatthistimeisthecomplexityofmanagingtheconstructionofareplacementfortheTappanZeeBridge.Thisproject,whichisoneofthelargestroadandbridgeinfrastructureprojectstheStatehasundertakensincetheThruwayandoriginalTappanZeeBridgewereconstructednearly60yearsago,willoccupyagooddealofmanagementattentionfromtheThruwayAuthority.
Merger of Behavioral Health AgenciesNewYorkStatehastwoagenciesprimarilyresponsibleforthetreatmentofindividualswithbehavioralhealthdis-orders–theOfficeofMentalHealth(OMH)andtheOfficeofAlcoholismandSubstanceAbuseServices(OASAS).Bothagencieshavesubstantialoverlapsinthepopulationstheyserve,relationshipswithcountiesandmanagedcareorganizations(MCOs),recordkeeping,andfieldorganizations.Infact,NewYorkisoneofonlytwostatesinwhich substance abuse is handled by a stand-alone agency.
OMHoperatespsychiatriccentersacrosstheStateandalsoregulates,certifiesandoverseesmorethan2,500mentalhealthprogramsthatareoperatedbylocalgovernmentsandnon-profitagencies.Asofthe2013-14Budget,OMHhadastaffofabout14,500FTEsandappropriationstotaling$3.6billion.OASASoperatesaddictiontreatmentcenters and oversees 1,300 local chemical dependence treatment and prevention programs. OASAS had a staff ofapproximately750FTEsandhadappropriationsofapproximately$670millionasofthe2013-14Budget.Theoverlaps between OASAS and OMH include:
•Consumerswithco-occurringdisorders:24%ofadultswithseriousmentalillnessservedbyOMHalsohaveasubstanceusedisorderinagivenyear.Thisnumberincreasestoabout50%overthecourseofaperson’slife.Fromthesubstanceabuseside,about40%oftheclientsservedbyOASASalsohaveamentalhealthdiagnosis.Thisoverlaptotalsapproximately140,000peopleinanygivenyear.Numerousstudiesshowthattheseareamongthemostdifficultandcostlyclientstoengageandserve.
37
•Commonprovidersthatwishtoserveindividualswhohavebothmentalillnessand/oraddictiondis-orders: Currently, service providers that wish to serve individuals with mental illness, individuals with addictions or individuals with co-occurring disorders must get separate licenses from both OMH and OASAS.Atpresent,approximately164serviceprovidersareduallicensed.Theregulationsgoverningthetwo programs are distinct and not always consistent, even for similar services.
•Similarrelationshipswithcountygovernments:Mentalhealthandaddictionresponsibilitiesareman-aged at the county government level by mental hygiene departments that interact with both OMH and OASAS. Despite the consolidation of mental health and addiction care at the county level, OMH and OASAS manage State aid funding to counties separately. Agencies providing services have to develop separatebudgetsandfiscalreportstosubmittoeachagency,billseparatelyanddealwithseparateState oversight processes.
•Redundantmedical/programrecordsrequirements:Programrecordsmaintainedbyprovidersregulatedby OMH or OASAS or participating in the Medicaid program are frequently redundant. A joint project undertakenonLongIslandbyOMH,OASASandprovidersestablishedauniformcaserecordthatwouldmeettheneedsofprogramsregulatedbyeitheragency.Whilethisprojecthasprovensuccessfulinreducingduplication,ittookoverthreeyearstodesignandimplementanddoesnotextendstatewide.
•Similaruseofdatatoenhanceserviceoutcomes:OMHandOASAShaveseparatelybeendevel-opingdatasystemsandalgorithmstoidentifyhighriskpatients.Additionally,bothagenciesuseMedicaid claims and encounters for planning and monitoring functions but receive different sub-sets of the data and analyze them differently. As a result, neither agency is able to fully understand theextentofoverlapbetweenthepopulationsordevelopintegratedinformationthatcouldassistproviders in serving consumers.
•Similarfieldorganizations:Bothagenciescurrentlyoperatefieldoffices—5forOMHand6forOASAS.Theseofficesmanagecontracts,conductlicensingvisits,developprogramsandworkwithlocalgovern-ment. Additionally, many of the State-operated addiction treatment centers are located on the grounds of OMH psychiatric centers, but are in separate buildings.
Inlightofthesesubstantialoverlaps,mergingOMHandOASASwouldofferanumberofbenefits.Aconsolidatedagencystructurecouldimproveserviceandgenerateoperatingefficienciesthroughtheintegrationofcare,regu-lations,programmodels,dataandfinancialpractices.Consolidationwouldalsoreducetheburdenoncounties,providers, MCOs and others who currently must interact with both agencies in ways that are frequently redundant.
Chapter 4: Consolidation of Agencies and Authorities
38
Apotentialobstacletothemergeristhatalthough40%ofpeopleservedbyOASASalsohaveamentalhealthdiag-nosis,thatstillmeans60%donot.This—andthemuchlargersizeofthementalhealthsystem—leadstoconcernsamong traditional substance abuse providers that integration could lead to homogenization of service and a reduction in the quality of care for certain clients.
Anumberofpreparatorystepscouldbetakenthatmightaddresstheseconcernsandbuildconfidenceamongout-sidestakeholdersandproviders.Theseinclude:
•Engagementwithstakeholdersofbothagenciestodemonstratethatacombinedentitywillrespecttheimportant difference between the mental health and substance abuse communities. This includes pre-senting evidence that reimbursement rates in the new behavioral health organization will be fair to both sets of providers and that programs for individuals without co-occurring disorders will remain separate.
•Integrationofsomefunctionsasaprecursortofullmerger.Thisincludesconformingregulationsatboth agencies to allow for integrated treatment and oversight. Additionally, OMH and OASAS can be-ginconsolidatingsomeagencyfunctionsbyco-locatingfieldofficesandcoordinatingtheirlicensureand surveillance activities.
Higher Education Services Corporation Consolidation The Higher Education Services Corporation (HESC) is a State agency that performs two primary functions related to student loan collection and processing: (i) to act as collection agent for student loans made by privatebanksandguaranteedbythefederalgovernmentthroughtheFederalFamilyEducationLoan(FFEL)program and (ii) to administer the State’s Tuition Assistance Program (TAP).
Untilmid-2010,theFFELprogramwasoneoftheprimarymeansofmakingfederalloanstostudentsforhigher education. However, in March 2010, the Obama administration eliminated the program to avoid payingfeestoprivatebanksactingasmiddlemen.AfterJune2010,nosubsequentloanswerepermittedthroughtheFFELprogram,puttingexistingloanservicerssuchasHESCintoa“run-off”modeofoperation.
Approximatelytwo-thirdsofHESC’snearly500employeesareinvolvedinFFELdebtcollection,afunctionthat will be phased out as loans made under this program are repaid. These HESC employees are funded by revenues paid by the federal government based on the balance of loans outstanding and successfully collected. In addition to the declining loan and collection balances, the federal government is also reducing the fee paid per dollar of loan collected to HESC and other “agents.” The combination of the declining loan portfolioanddecliningfeeswillhaveasubstantialimpactonHESCrevenuesoverthenext2-5years.
Chapter 4: Consolidation of Agencies and Authorities
39
Chapter 4: Consolidation of Agencies and Authorities
HESC’sotherfunction,theTAPprogram,helpseligibleNewYorkresidentspaytuitionatapprovedschoolsinNewYorkState.ThemaximumTAPgrantis$5,000,butthesizeofeachgrantvariesbasedoncombinedfamilyincomeandthenumberofotherfamilymembersenrolledincollege.Oftheroughly$1billioningrants,scholarships,andloanforgivenessbenefitsprovidedbyHESC,approximately95%isawardedthroughthe TAP program.
AsthedebtcollectionroleofHESCisphasedoutduetotherun-offofexistingloans,itsheadcountwillshrinkduetoretirement,attritionandtransferstootheragencies.ThesmallsizeoftheremainingagencysuggeststhatHESCcouldbeconsolidatedwithalargeragencytoreduceback-officeandadministrativeexpensesonceitscollectionfunctionissubstantiallycompleted.
Atthatpoint,anumberofagenciescouldefficientlyincorporateHESC’sremainingfunctionsandstaff,includ-ingtheDepartmentofTaxationandFinance(DTF),theDepartmentofState,SUNY,andCUNY.DTFcurrentlyhandlesotherStategrantssuchasrefundabletaxcreditswhichhavesimilarincome-basedeligibilitycriteria,includingverificationofeligibilityanddisbursementoffunds;theDepartmentofStatemanagesadiversesetofprograms;andSUNYorCUNYcouldcombineTAPadministrationwiththeirotherfunctions,suchasfinancialcounselingandsupportservicestheyprovidetostudentsseekingadviceonotherfinancialaidoptions.
Merger of the Hudson River Valley Greenway into the Department of Environmental ConservationTheHudsonRiverValleyGreenwayhaslostsignificantfundingandstaffinrecentyearsandnowoperateswithonlysixemployees.GiventhefunctionaloverlapwithDEC,theadministrationhasco-locatedstaffwith-inDEC’sofficeandisidentifyingwaystobettercoordinateandleverageresourcestoimprovetheGreenway’sability to achieve its core mission.
TheHudsonRiverValleyGreenway,createdin1991,consistsoftheGreenwayCouncil(anagencywithintheEx-ecutiveDepartment)andtheGreenwayHeritageConservancy(apublicbenefitcorporation).Athirdentity,theHudsonRiverValleyNationalHeritageArea,isanot-for-profitsubsidiaryoftheGreenwayConservancy.Throughthese three entities, the Greenway performs several functions, including providing community planning grants and technical assistance to local communities, assisting in the preservation of local agriculture, promoting the HudsonRiverValleyasatourismdestination,andestablishingaHudsonRiverValleyTrailSystem.
DEChasrelatedprogramsthatoverlapandinteractwiththeGreenway.Forexample,DEC’sHudsonRiverEstuaryProgram,establishedin1987,focusesonensuringcleanwater,protectinglocalwildlife,providingwater recreation and river access, and conserving the valley’s world famous scenery. In some cases, both DEC’sEstuaryProgramandtheGreenwaymakegrantstothesameentities.
40
An option for future consideration is the merger of the Greenway Council and Heritage Conservancy into DEC. In the interim, the co-location of staff provides opportunities to share and coordinate resources between the Green-way and DEC.
Administrative Public Safety Agencies ConsolidationForthepast15years,cities(includingRochesterwhenLieutenantGovernorDuffywasMayor)havepio-neered the use of data as part of an approach to crime reduction, quality of life improvement, and personnel and resource management, in a process widely referred to as “CompStat.”
At the State level, public safety agencies are responsible both directly for operations (DOCCS, State Police and DMNA)andindirectlyforshapingstatewidepolicyandimplementationthroughregulationandgrant-making(DCJS,DHSES,OPDVandOVS).Thegoals,theinitiativesthatdriveresults,andthefundingthatsupportsthoseinitiativesoverlapsignificantlyamongtheagencies.But,thereisnoeffectivemechanismfordevelopingandprojectingaunified,soundandconsistentpolicyfortheStateandforaligningresources(bothlocalassis-tance and the considerable federal and private resources available) behind those initiatives.
AnoptionfortheStatetoconsiderinthefutureistocombinethecluster’spolicy,data,andfiscalstaffsintoa single entity. The core of new entity would be formed by merging the three public safety administrative agencies–theDivisionofCriminalJusticeServices(DCJS),theOfficeofVictimServices(OVS)andOfficeofPreventionandDomesticViolence(OPDV)–aswellasalimitednumberoffunctionsfromtheotherpublicsafetyagencies.Thestructurewouldsignalcrossagencysupportandwouldelevatethepolicy-makingcom-ponentsofOVSandOPDVtogivethemtheprominencethatadvocateshavesoughtwhilereconstitutingandre-forming DCJS’s function into an understandable and productive role.
TheStatecurrentlyhassevenpublicsafetyagencies.Thefirstfourofwhicharelistedbelowareprimarily“operational,” while the remaining three are primarily “administrative.”
•DivisionofStatePolice•DepartmentofCorrectionsandCommunitySupervision•DivisionofHomelandSecurity•DepartmentofMilitaryandNavalAffairs•DivisionofCriminalJusticeServices•OfficeofVictimServices•OfficeforthePreventionofDomesticViolence
Chapter 4: Consolidation of Agencies and Authorities
41
Chapter 4: Consolidation of Agencies and Authorities
Today, DCJS is a multi-functional agency with a largely misunderstood role. DCJS manages the State’s civil andcriminalfingerprintfilesandtheState’sDNADatabankandSexOffenderRegistry.Thesefunctions,moststrongly associated with the agency, have led to the view that the agency has a narrow function. However, most importantly,theagencyhasanationallyregardedandhighlyskilleddataanalysisgroupthathasbeenthedriv-ingbehindtheworkthatproducedResultsFirst(acomputerizedcost-benefitmodel)andtheanalysisbehindtheState’sfirstsocialimpactbond.Inaddition,theagencyadministersFederalandStatefundsthatsupportlocalcriminaljusticeprograms.In2012-13,DCJShadaworkforceofabout600employees.Bycomparison,OPDVandOVShad80and25employees,respectively.
A consolidated public safety administrative agency would guide policy, align funding behind that policy and ensure that the State is getting a return on its public safety investments. The rationale for such a consolidation is that the workofthepublicsafetyisintersectedinfunctionbutlacksaneffectivewaytocoordinatetheirrelatedefforts.
Morespecifically,aconsolidatedpublicsafetyadministrativeagencywouldadvancethefollowingtheseobjectives.
•First,itwouldintegrateandmanagethepolicyeffortscurrentlyspreadacrossmultipleagencies.Theseincludeinitiativestoreduceviolentcrime(DCJS),reducedomesticviolence(OPDVandOCFS),improvethejuvenilejusticesystem(DCJSandOCFS),andsupportvictimservices(OVS),amongothers.
•Second,itwouldintegratedataanalysis(e.g.,performancemetrics,cost/benefitanalysis,etc.),budget and local assistance spending, funding opportunities (federal government and foundations) and strategic initiatives (e.g., “place-based” initiatives, use of social impact bonds, etc.) to ensure “what’sworking”accountabilityinallfundingdecisions.
•Third,itwouldusethe$450millionthatitcurrentlydisbursesinlocalassistanceasthecenterpieceofanefforttosystematicallyraisefederalandphilanthropicdollarstocomplementthatworkandtoengagethenon-profitcommunityinworkingtoachievethecommongoalsthatStategovernmentand foundations already share and invest in.
•Fourth,itwouldcontinuetomanagetheoperationalfunctionsofDCJSsuchasfingerprintingnotedabove.
AlthoughpasteffortsatconsolidatingOVSandOPDVwithDCJShavenotmetwithlegislativeapproval,aproposal that preserved the identities of these two smaller agencies while giving them access to the greater resources of a new consolidated entity with responsibility for coordinating policy and resources for the entire public safety cluster could potentially overcome this obstacle.
Business and Professional Licensing AgencySee“ProfessionalandBusinessLicensing”sectioninChapter7.
42
Elimination of Unnecessary Boards and CommissionsTheorganizationalstructureoftheStateincludesacomplexwebofapproximately300boards,commissions,councils,taskforcescreatedbyStatestatuteorExecutiveOrder.Inmostcases,nomechanism,suchasasunsetdateorareviewprocess,existstoregularlyassesstheneedforoftheseentities.Asaresult,manyoftheseboardsandcommissionsareunnecessaryorduplicativeandthushindertheState’sabilitytooperateefficiently.
Whileeliminatingboardsandcommissionsproducesrelativelymodestsavings,providingstaffsupportforthese boards and commissions diverts the attention of agency management. The Commission believes that merging or eliminating unnecessary boards and commissions is a small but meaningful step in streamlining the organizational structure of State government.
TheCuomoadministrationeliminatedormerged28boardsandcommissionsinthe2012-13Budget(seeAppendixE).Theresistancefromthelegislatureandvariousstakeholderstoeliminateormergeboardsandcommissions is often disproportionate to their value. Despite this resistance, an option for future consideration is that another 30 boards and commissions should be closely evaluated for elimination or merger.
Case Study: Emergency Medical Services CouncilsNewYork’sEmergencyMedicalService(EMS)Councilsareacasestudyinthedysfunctioncreatedbytheuncheckedgrowthofboardsandcommissions.The2013-14ExecutiveBudgetproposesaconsolidationofthecurrently unwieldy number of EMS Councils. Currently, the Department of Health (DOH) Commissioner is re-quired by statute to appoint four State-level councils that advise, and in some cases establish rules, on issues related to emergency medical services. They are:
•TheStateEmergencyMedicalServicesCouncil(SEMSCO),whichhas32seatsandestablishesrules for ambulance services and pre-hospital emergency medical care;
•TheStateEmergencyMedicalAdvisoryCommittee(SEMAC),whichhas31seatsandadvisesonstatewide treatment, transportation and triage protocols for emergency medical service providers;
•TheStateTraumaAdvisoryCommittee(STAC),whichhas31seatsandadvisesonstatewidestan-dards for trauma and disaster care; and
•TheEmergencyMedicalServicesforChildrenCouncil(EMS-C),whichhas23seatsandadvisesonall aspects of EMS for children.
Chapter 4: Consolidation of Agencies and Authorities
43
Chapter 4: Consolidation of Agencies and Authorities
The2013-14ExecutiveBudgetwouldconsolidatethesefourcouncilsintoasingleStateEmergencyMedicalServicesAdvisoryBoard.Thisnewboardwouldbemedicallydriven,assistinreviewingreviewstandardsandqualityimprovementguidelines,andmakerecommendationstotheCommissionerregardingthesetopics.
In addition, there are 18 Regional Emergency Medical Service Councils (REMSCOs) with over 300 seats that advise these statewide councils.
ManyoftheseregionalcouncilsreceivesupportfromStateagencies,whichrequiressignificantcontractoversight from DOH. This unwieldy organizational structure creates several problems. In response, the 2013-14ExecutiveBudgetalsoproposesconsolidatingthese18councilsinto10councils.Thisconsolidationwilladdressproblemsundertheexistingarrangement,includingDOH’sabilitytoeffectivelyensurecompliancewithstatewide standards, patient safety issues created by the large number of governing bodies and varying proto-colstheyemploy,anddifficultiesensuringanadequatenumberofappointmentsaremadetoeachcounciltofulfillquorumrequirements.
Potential Mergers Reviewed but Not RecommendedTheSAGECommissionexaminedthreepotentialagencymergerswheretheagencieshadenoughincommonto suggest that a merger might be advisable. These potential mergers were:
•TheDepartmentofEnvironmentalConservation(DEC)withtheOfficeofParks,RecreationandHistoric Preservation (OPRHP);
•TheOfficeofChildrenandFamilyServices(OCFS)withtheOfficeofTemporaryandDisabilityAssis-tance (OTDA); and
•TheStateOfficefortheAging(SOFA)withtheDepartmentofHealth(DOH).
After reviewing these potential mergers in depth, the Commission concluded that merging these agencies in questiondidnotmakesenseatthistime.Ineachcase,thenegativeeffectamergerwouldhaveontheopera-tionsoftheagenciesoutweighedtheminimalsavingsandstrategicbenefitsthatamergerwouldproduce.TheCommission’sanalysiswithrespecttoeachofthesepotentialmergersissummarizedinAppendixD.
Areas for Further ReviewThe SAGE Commission did not have the opportunity to fully review three areas where some sort of restructuring might be warranted. These are:
44
5.The2012AnnualReportoftheAuthorityBudgetOfficeidentifiesarangeofissuesinvolvingLDCs,includingthecompetitiveadvantagethatLDCsenjoybynotbeingsubjecttostatefeesthattheDormitoryAuthorityandlocalindustrial development authorities must pay.
Dormitory AuthorityAvarietyoffactorsareimpactingtheDormitoryAuthority’sbusinessmodel,includingthegrowingroleofLocalDevelopmentCorporations(LDCs)inprovidinglow-costfinancingandthediminishingneedforconstructionser-vices from some large hospital and university customers.5 To adapt to these changes, the Dormitory Authority may need to consider a range of alternatives, including modifying its services and fee structure and potentially combiningcertainfunctionswithotherStateentities,suchasESDC,tobetterleveragefinancing,constructionand development resources.
NYC Urban Planning and Development AuthoritiesThe State has four separate entities that perform similar functions related to urban planning and economic developmentinNewYorkCity.TheseincludetheBatteryParkCityAuthority(BPCA),HudsonRiverParkTrust(HRPT), Roosevelt Island Operating Corporation (RIOC), and the Javits Center. Two of these are mature operat-ingentities(BPCA,RIOC),whiletheothertwoarelikelytohavefuturedevelopmentneeds(HRPT,JavitsCenter).TheState’sroleandobjectivesforeachshouldbefurtherexamined.Thisreviewshouldincludeanalyzinghowbest to leverage each entity’s bonding capacity and development resources as well as combining similar func-tions to streamline operations and reduce costs.
Buffalo and Ft. Erie Public Bridge Authority and the Niagara Falls Bridge CommissionTwoseparateinternationalcompactentitiesexisttoadministerthefourvehicularbridgesspanningthe36-mileNiagaraRiver.TheBuffaloandFt.EriePublicBridgeAuthority(commonlyknownasthePeaceBridgeAuthor-ity)operatesthePeaceBridge,whiletheNiagaraFallsBridgeCommissionoperatestheRainbow,WhirlpoolandLewiston-QueenstonBridges.Thetwoentitiesexistseparatelymorebecauseoftheirseparatehistoricaldevelopmentthananyorganizationaloroperationallogic.Thetwoentitiesalreadycooperatetosomeextent,butcouldbenefitfromaunifiedmanagementstructure.OnechallengehereisthatbothentitiesexistnotsimplyunderNewYorkStatelaw,butalsounderfederalandCanadianlaw.Nonetheless,strategiestoachieveefficienciesthroughamergeroftheseentitiesshouldbefurtherreviewed.
45
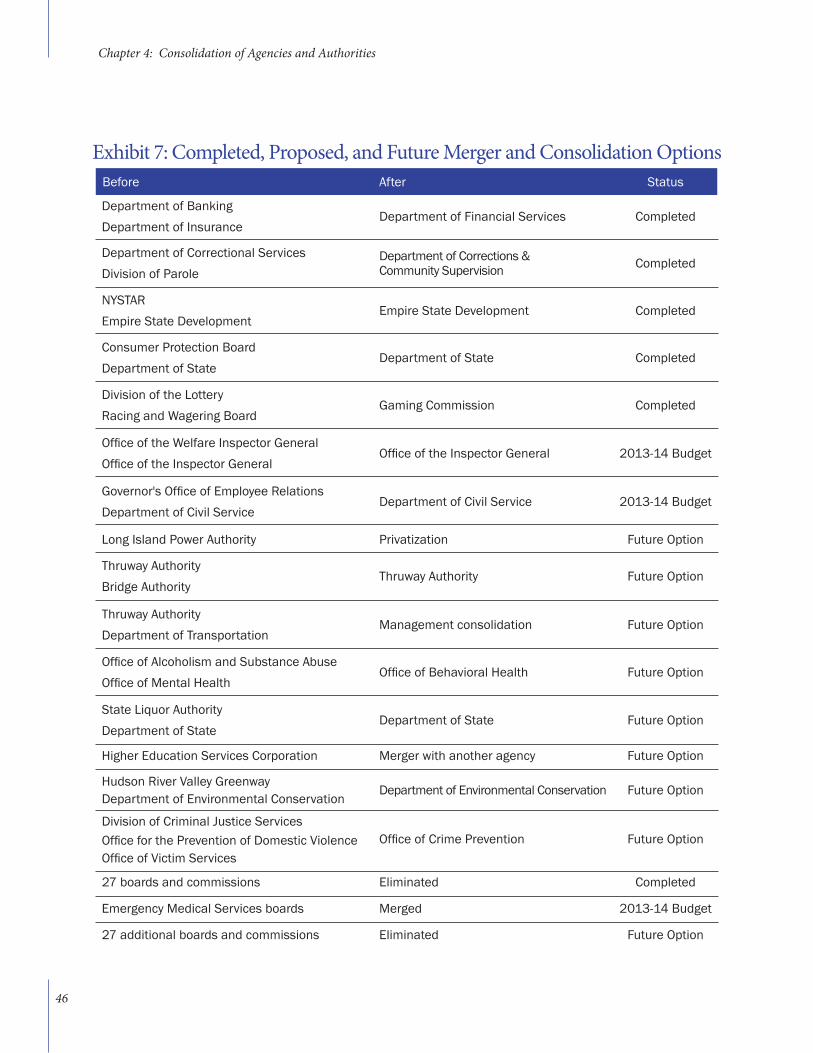
Exhibit 7: Completed, Proposed, and Future Merger and Consolidation OptionsBefore After Status
DepartmentofBankingDepartment of Financial Services Completed
Department of Insurance
Department of Correctional Services Department of Corrections & Community Supervision Completed
Division of Parole
NYSTAREmpire State Development Completed
Empire State Development
ConsumerProtectionBoardDepartment of State Completed
Department of State
DivisionoftheLotteryGaming Commission Completed
RacingandWageringBoard
OfficeoftheWelfareInspectorGeneralOfficeoftheInspectorGeneral 2013-14Budget
OfficeoftheInspectorGeneral
Governor'sOfficeofEmployeeRelationsDepartment of Civil Service 2013-14Budget
Department of Civil Service
LongIslandPowerAuthority Privatization Future Option
Thruway AuthorityThruway Authority Future Option
BridgeAuthority
Thruway AuthorityManagement consolidation Future Option
Department of Transportation
OfficeofAlcoholismandSubstanceAbuseOfficeofBehavioralHealth Future Option
OfficeofMentalHealth
StateLiquorAuthorityDepartment of State Future Option
Department of State
Higher Education Services Corporation Merger with another agency Future Option
HudsonRiverValleyGreenwayDepartment of Environmental Conservation Future Option
Department of Environmental Conservation
Division of Criminal Justice ServicesOfficeofCrimePrevention Future OptionOfficeforthePreventionofDomesticViolence
OfficeofVictimServices
27boardsandcommissions Eliminated Completed
Emergency Medical Services boards Merged 2013-14Budget
27additionalboardsandcommissions Eliminated Future Option
Chapter 4: Consolidation of Agencies and Authorities
46
New Formal Coordination MechanismsMany of State government’s most important functions and difficult problems to solve involve the activities of multiple agencies. Some examples include the interrelated roles of health, human services, education, hous-ing and public safety in serving individuals and neighborhoods in need; or the roles of transportation, energy, environmental regulation and economic development support in creating jobs and attracting businesses.
In most of these cases, merging the agencies involved – or even placing the interrelated activity under the authority of a single agency – does not make sense. What is needed, however, are effective coordination mechanisms to ensure that these various State agencies are working in concert, rather than in a silo. When Governor Cuomo took office, interagency activities of the type described above were poorly coordinat-ed and often inefficient. To address this problem, the Governor has created a series of formal coordination mechanisms for such interagency activities, so that the whole of each such initiative is greater than the sum of its parts.
Regional Economic Development CouncilsWhen Governor Cuomo took office, he determined that the decision-making process for economic and com-munity development spending suffered from several major flaws. First, it lacked sufficient input from regional stakeholders who understood their regional economies better than the State’s centralized bureaucracy did. Second, agencies made decisions in silos, which was inefficient for applicants and led to uncoordinated spend-ing decisions instead of an integrated approach to addressing problems.
To increase local input and provide coordination of cross-cutting inter-agency activities that affect economic and community development, the Governor established 10 Regional Economic Development Councils in 2011. A Chairman’s Committee that represents these Regional Councils at the statewide level serves to align efforts on a statewide basis. Lieutenant Governor Robert Duffy, who also serves as the Chairman of the SAGE Commis-sion, serves as the Chairman of the Regional Economic Development Council Chairman’s Committee.
The Regional Councils brought together diverse groups of stakeholders, engaged their members in difficult conversations to identify priorities, and drafted thoughtful strategic plans to create a long-term roadmap for economic and community development for years to come. Because partnerships between higher education and the private sector are central to the Cuomo administration’s economic development strategy, each Re-gional Council included two co-chairs, one from academia and one from business. Each Regional Council also had a significant level of public engagement to develop a strategic plan that would encompass the vision of the community.
CHAPTER 5: Coordination of Inter-Agency Activities
47
In contrast to an ad hoc, project-based approach to economic development that characterized State activ-ity for many years, the Regional Councils submitted 5-year strategic plans to the Governor which prioritized projects and programs to support each region’s economic development goals. Consistent with the Gover-nor’s goal of emphasizing performance and competition, regions whose plans were deemed to be the most outstanding by a panel of subject matter experts receive more funding than other regions.
Consolidated Funding ApplicationAn integral part of the Regional Council process is a new Consolidated Funding Application (CFA), which is a single application for projects and programs that are aligned with Regional Council plans. The CFA process covers 29 different funding sources from 10 different State agencies.The CFA process enables these agencies to make their funding decisions with visibility into the funding decisions of other agencies. The CFA process also allows appli-cants to utilize a single application for multiple programs.
In 2011, approximately 2,900 applications were reviewed. The application was enhanced in 2012 based on pub-lic feedback, including making technology more user friendly, improving application questions, reviewing programs most suitable to include in CFA, and improved communication of CFA programs and process including hosting 37 public forums statewide.
The Regional Councils reviewed all CFA funding requests and awarded $785 million for economic development and community renewal projects at the end of 2011. New funding programs have been included in the latest CFA round, including programs in the Department of Agriculture & Markets, the Council on the Arts, and tour-ism funding. After the review of another 2,800 submissions in 2012, on December 19, 2012, more than $738 million was awarded for 725 projects proposed in the second round of the Regional Council process.
NY Works Task Force Capital PlanningThrough 46 agencies and authorities, New York State expects to spend approximately $21 billion in support of capital expenditures in FY2013 alone, represented by $9.7 billion in spending for 24 and $11.7 billion in spend-ing for 22 authorities. Including counties and municipalities, this figure rises to $30-35 billion. Historically, there has been little coordination or sharing of best practices among the many siloed entities responsible for this capi-tal spending. In fact, capital planning efforts vary widely among agencies and authorities and are often character-ized by a lack of clear goals, criteria for prioritizing projects, and performance measures. Put simply, the State has not leveraged its resources in a disciplined way to achieve the greatest possible benefit.
On May 3, 2012, Governor Cuomo and legislative leaders launched the New York Works Task Force. The goal of this task force was to bring together leading finance, labor, planning, and transportation professionals to coordinate a statewide infrastructure plan that will more effectively and strategically allocate New York State’s capital funding and create thousands of jobs.
Chapter 5: Coordination of Inter-Agency Activities
48
Chapter 5: Coordination of Inter-Agency Activities
The Task Force’s initial work focused on assessing the current state of capital investment in New York State and developing new tools to better coordinate capital planning and allocation of resources statewide. Among the steps taken so far, the Task Force has surveyed all of the State’s agencies and authorities responsible for capital spending, studied other states’ and countries’ practices, and held public meetings and forums in various parts of the State to consider and seek input on the capital investment process.
The Task Force designed a statewide capital plan template to standardize the planning for capital projects. The template places capital projects into three categories: state of good repair; capacity optimization; and transformational initiatives--in each case considered both by sector (e.g., transportation) and by region. The Task Force also identified statewide criteria to guide State agencies and authorities in capital planning to maximize return on investment and job creation. Each project is to be evaluated according to its contribution to a state of good repair, the extent to which it is part of a system and not a standalone project, its environ-mental and financial sustainability, and its return on investment, broadly defined. In addition, the Task Force is currently developing a high-level strategic plan that advances New York State’s economic growth, competi-tiveness and job creation. Capital projects will be assessed, in part, by their fit within this strategic plan.
The next phase of the Task Force’s work will focus on implementing a statewide capital planning process by sector and by region. State agencies and authorities will prepare their capital budgets based on the state-wide capital plan template and criteria and commence a statewide infrastructure assessment. The Task Force coordinated with agencies and authorities as they prepared their 2013-14 Executive Budget propos-als and has recommended a 2013-14 statewide capital plan that addresses all of the the State’s capital spending agencies and authorities. The goal is for this statewide plan to build on the Task Force’s strategic plan, replace silo-based planning with a focus on shared systems and coordinated investments and improve-ments, and to bring together the capital investment plans of all the relevant agencies and authorities in a single document. Going forward, the statewide capital planning process will have the following seven distinct steps in producing a rolling, ten-year capital plan:
1. Conduct a statewide infrastructure assessment;2. Update the strategic plan for economic growth and competitiveness;3. Sort capital projects into the template’s three buckets and assess and prioritize using preset criteria;4. Evaluate projects’ implementation readiness;5. Develop a statewide capital budget, both by sector and by region;6. Execute the planned investments; and7. Measure results (and then return to step one).
49
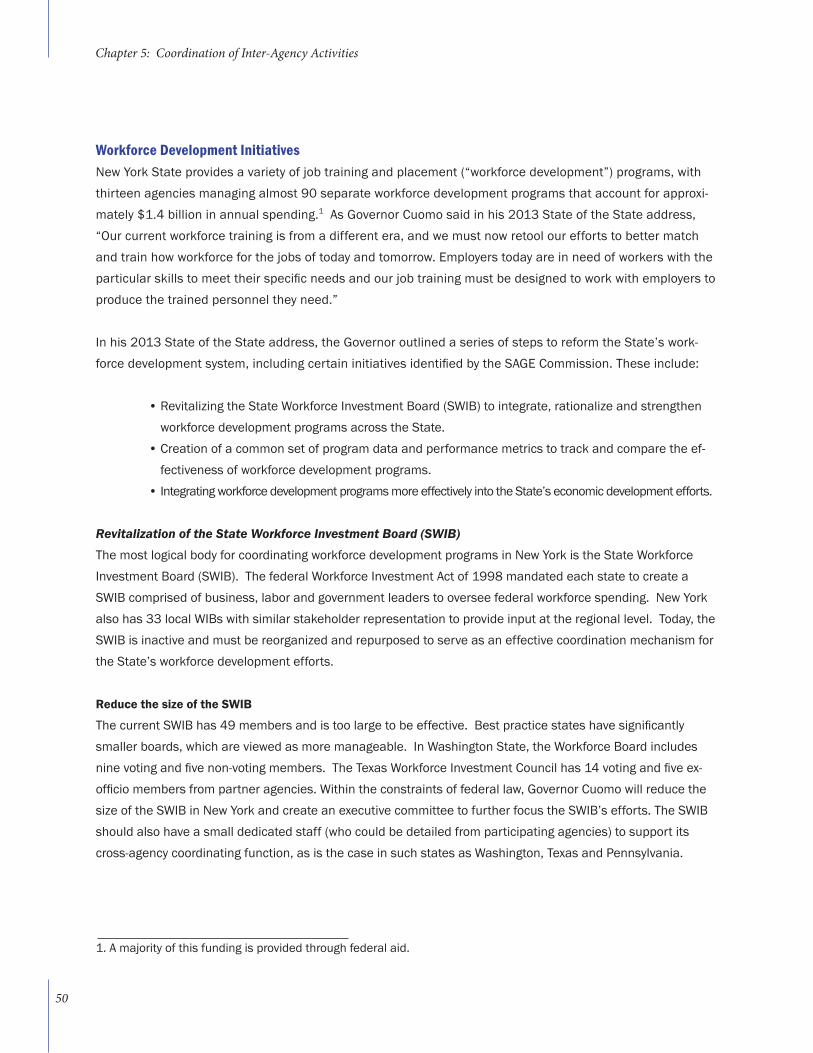
Workforce Development InitiativesNew York State provides a variety of job training and placement (“workforce development”) programs, with thirteen agencies managing almost 90 separate workforce development programs that account for approxi-mately $1.4 billion in annual spending.1 As Governor Cuomo said in his 2013 State of the State address, “Our current workforce training is from a different era, and we must now retool our efforts to better match and train how workforce for the jobs of today and tomorrow. Employers today are in need of workers with the particular skills to meet their specific needs and our job training must be designed to work with employers to produce the trained personnel they need.”
In his 2013 State of the State address, the Governor outlined a series of steps to reform the State’s work-force development system, including certain initiatives identified by the SAGE Commission. These include:
• Revitalizing the State Workforce Investment Board (SWIB) to integrate, rationalize and strengthen workforce development programs across the State.
• Creation of a common set of program data and performance metrics to track and compare the ef-fectiveness of workforce development programs.
• Integrating workforce development programs more effectively into the State’s economic development efforts.
Revitalization of the State Workforce Investment Board (SWIB)The most logical body for coordinating workforce development programs in New York is the State Workforce Investment Board (SWIB). The federal Workforce Investment Act of 1998 mandated each state to create a SWIB comprised of business, labor and government leaders to oversee federal workforce spending. New York also has 33 local WIBs with similar stakeholder representation to provide input at the regional level. Today, the SWIB is inactive and must be reorganized and repurposed to serve as an effective coordination mechanism for the State’s workforce development efforts.
Reduce the size of the SWIB
The current SWIB has 49 members and is too large to be effective. Best practice states have significantly smaller boards, which are viewed as more manageable. In Washington State, the Workforce Board includes nine voting and five non-voting members. The Texas Workforce Investment Council has 14 voting and five ex-officio members from partner agencies. Within the constraints of federal law, Governor Cuomo will reduce the size of the SWIB in New York and create an executive committee to further focus the SWIB’s efforts. The SWIB should also have a small dedicated staff (who could be detailed from participating agencies) to support its cross-agency coordinating function, as is the case in such states as Washington, Texas and Pennsylvania.
1. A majority of this funding is provided through federal aid.
Chapter 5: Coordination of Inter-Agency Activities
50
The SWIB should serve as the State’s conduit for identifying, promoting and implementing the best workforce development ideas from a wide range of sources. In the 2013 State of the State address, Governor Cuomo proposed WIB reform that will align the State Workforce Investment Board with the Regional Economic Devel-opment Councils and leading colleges and universities – aligning New York State’s economic and workforce development strategies and focusing on addressing the skills gap between employers and job-seekers in high-demand sectors across the State.
In addition to working closely with community colleges and employers, the SWIB should utilize the large number of non-profits that have been true innovators in areas related to workforce development.
Alignment of Workforce Development and the State’s Regional Economic Development Councils
In his 2013 State of the State address, Governor Cuomo also noted that the Regional Councils have already identified have already identified the economic sectors where the greatest job growth is expected. The Regional Councils will serve as the liaison with private-sector employers in forging partnerships with commu-nity colleges and other State workforce development programs, so that training is well matched to the skills these employers need.
As part of the effort to integrate workforce development with the State’s economic development efforts, the State will expand efforts to design innovative programs to match workers’ skills with employer needs. a good example of this approach is the initiative led by Monroe Community College that won a $14.6 million federal grant to design, implement and deliver workforce development programs for advanced manufacturing and nanotechnology. These efforts extend to programs that help connect jobseekers with employers, particularly specialized populations that are harder to employ. One such example is the NY Youth Works Program, which was launched at the end of 2011 and encourages businesses to hire unemployed, disadvantaged youth by enabling businesses to earn tax credits of up to $4,000 for each eligible youth hired.
Linking Community College Aid to Employer PartnershipsCurrently, community colleges receive State funds for every student they enroll regardless of whether the program is actually preparing students for available jobs or future economic opportunity. Governor Cuomo proposes to change the paradigm of State funding for colleges based on performance of student success in the economy.
In order to qualify for State funding, community college workforce and vocational programs – those that award industry certifications, Associate of Applied Science degrees and Associate of Occupational Studies degrees – will be required to be offered in partnership with employers and be focused on high-demand jobs that need to be filled now or that labor market data and the Regional Councils prioritize as helping to prepare for the future. In addition, Governor Cuomo has proposed a performance-based funding system that will reward community colleges that enable students to find good-paying jobs in careers that are in demand by employers in their region. Funding will be directly tied to student employment, as well as other key indicators of student success.
Chapter 5: Coordination of Inter-Agency Activities
51
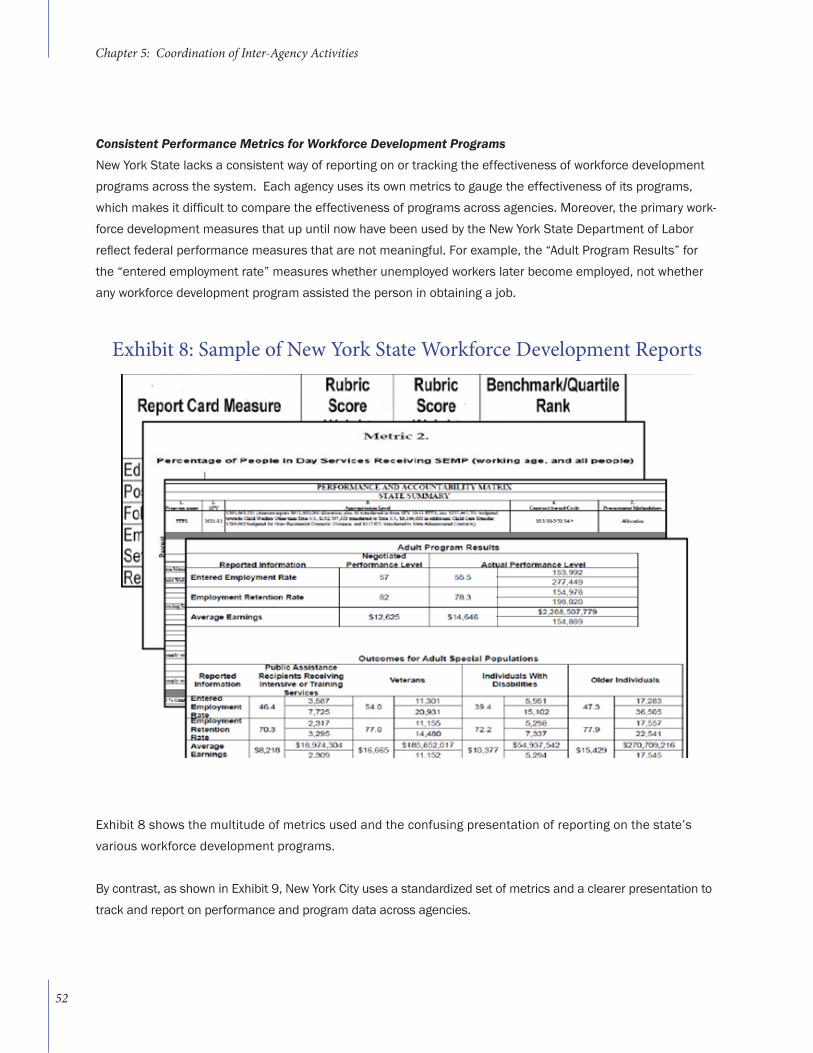
Consistent Performance Metrics for Workforce Development ProgramsNew York State lacks a consistent way of reporting on or tracking the effectiveness of workforce development programs across the system. Each agency uses its own metrics to gauge the effectiveness of its programs, which makes it difficult to compare the effectiveness of programs across agencies. Moreover, the primary work-force development measures that up until now have been used by the New York State Department of Labor reflect federal performance measures that are not meaningful. For example, the “Adult Program Results” for the “entered employment rate” measures whether unemployed workers later become employed, not whether any workforce development program assisted the person in obtaining a job.
Exhibit 8 shows the multitude of metrics used and the confusing presentation of reporting on the state’s various workforce development programs.
By contrast, as shown in Exhibit 9, New York City uses a standardized set of metrics and a clearer presentation to track and report on performance and program data across agencies.
Exhibit 8: Sample of New York State Workforce Development Reports
Chapter 5: Coordination of Inter-Agency Activities
52
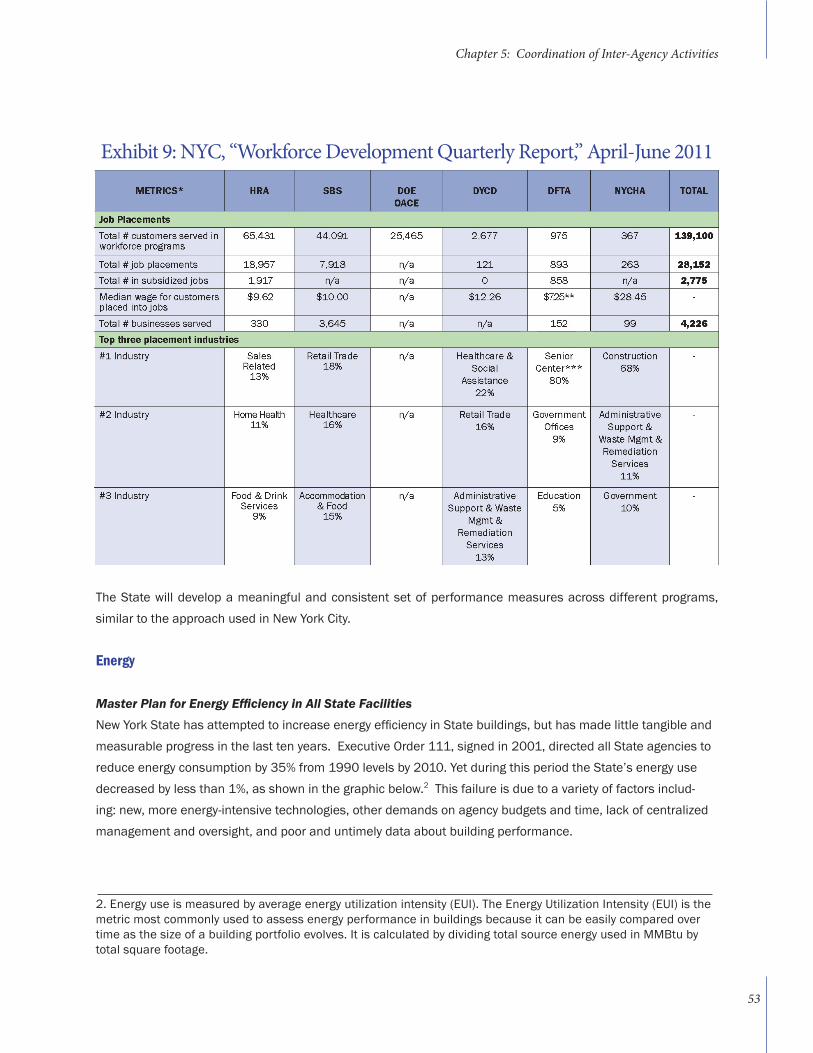
Exhibit 9: NYC, “Workforce Development Quarterly Report,” April-June 2011
The State will develop a meaningful and consistent set of performance measures across different programs, similar to the approach used in New York City.
Energy
Master Plan for Energy Efficiency in All State FacilitiesNew York State has attempted to increase energy efficiency in State buildings, but has made little tangible and measurable progress in the last ten years. Executive Order 111, signed in 2001, directed all State agencies to reduce energy consumption by 35% from 1990 levels by 2010. Yet during this period the State’s energy use decreased by less than 1%, as shown in the graphic below.2 This failure is due to a variety of factors includ-ing: new, more energy-intensive technologies, other demands on agency budgets and time, lack of centralized management and oversight, and poor and untimely data about building performance.
2. Energy use is measured by average energy utilization intensity (EUI). The Energy Utilization Intensity (EUI) is the metric most commonly used to assess energy performance in buildings because it can be easily compared over time as the size of a building portfolio evolves. It is calculated by dividing total source energy used in MMBtu by total square footage.
Chapter 5: Coordination of Inter-Agency Activities
53
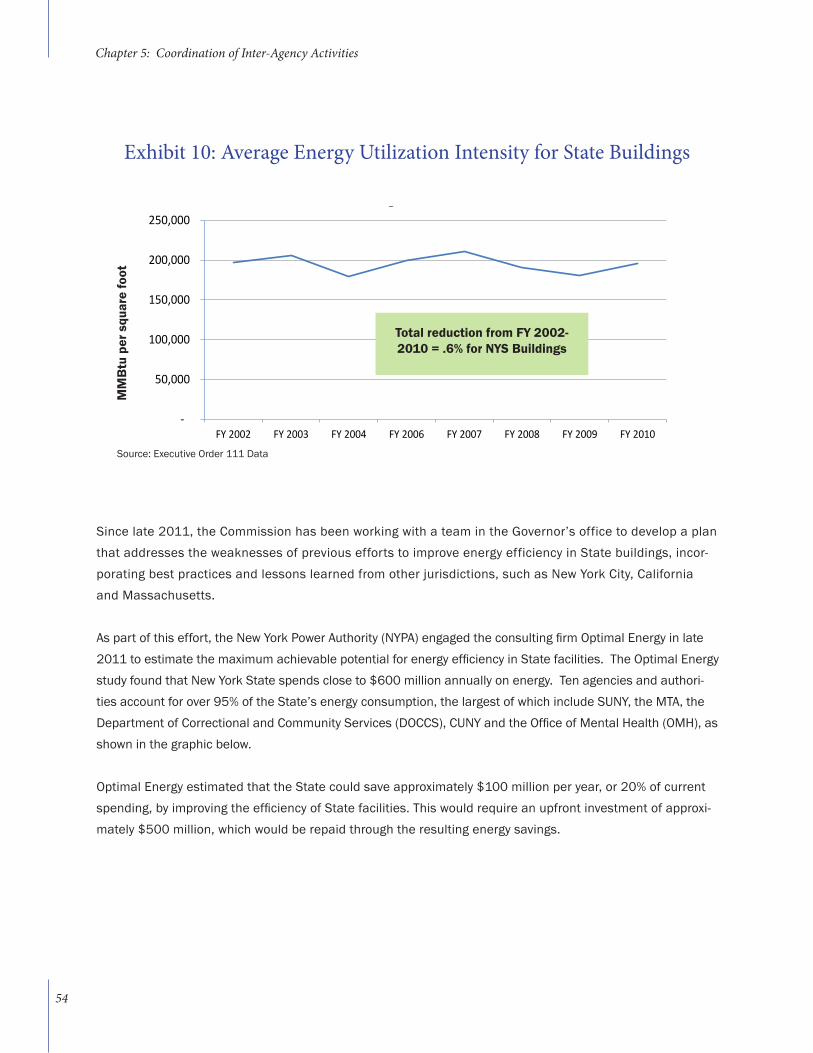
Exhibit 10: Average Energy Utilization Intensity for State Buildings
Source: Executive Order 111 Data
Since late 2011, the Commission has been working with a team in the Governor’s office to develop a plan that addresses the weaknesses of previous efforts to improve energy efficiency in State buildings, incor-porating best practices and lessons learned from other jurisdictions, such as New York City, California and Massachusetts.
As part of this effort, the New York Power Authority (NYPA) engaged the consulting firm Optimal Energy in late 2011 to estimate the maximum achievable potential for energy efficiency in State facilities. The Optimal Energy study found that New York State spends close to $600 million annually on energy. Ten agencies and authori-ties account for over 95% of the State’s energy consumption, the largest of which include SUNY, the MTA, the Department of Correctional and Community Services (DOCCS), CUNY and the Office of Mental Health (OMH), as shown in the graphic below.
Optimal Energy estimated that the State could save approximately $100 million per year, or 20% of current spending, by improving the efficiency of State facilities. This would require an upfront investment of approxi-mately $500 million, which would be repaid through the resulting energy savings.
-
50,000
100,000
150,000
200,000
250,000
FY 2002 FY 2003 FY 2004 FY 2006 FY 2007 FY 2008 FY 2009 FY 2010
Average EUI/Sq Ft
MM
Btu
per
squ
are
foot
Total reduction from FY 2002- 2010 = .6% for NYS Buildings
Chapter 5: Coordination of Inter-Agency Activities
54
Chapter 5: Coordination of Inter-Agency Activities
Based on this study and discussions with outside experts, the Governor determined that the State’s energy efficiency efforts should be accelerated, and the savings increased, by developing and implementing a disciplined and strategic statewide master plan for energy efficiency. This was announced in the Governor’s 2012 State of the State address. Since the announcement, the master plan has been developed, and the Governor has issued an Executive Order mandating agencies increase building energy efficiency 20% within seven years. The Executive Order also directed NYPA to establish a central management team to implement the master plan. Key principles of the master plan include:
• A pragmatic, data-driven approach that focuses on the most cost-effective portfolio of measures• Centralized management and oversight• Changing the culture of building management, and• Using data to create accountability and a continuous feedback loop.
As of January 2013, significant progress has been made on this initiative, now called BUILD SMART NY. Almost all of New York State’s facilities have been benchmarked to assess their energy intensity. This has helped identify which facilities are the least energy efficient facilities. One key finding has been that buildings that are individually metered are significantly more energy efficient than those on master-metered campuses, which often consume at least 20% more energy for the same square footage as individually metered buildings.
As a result, the BUILD SMART NY team has focused on identifying the most inefficient master-metered cam-puses to be able to implement projects likely to have the “biggest bang for the buck” as quickly as possible. Seven DOCCS facilities, representing 4.5 million square feet of building space in the North Country, are in the process of undergoing energy master plans, campus-wide energy audits that factor in long-term facility plans into recommendations regarding energy use. Five SUNY campuses, encompassing 24 million square feet of buildings, have been identified as priorities and are moving forward to undergo energy master plans in 2013. The resulting recommendations from these energy master plans will help guide retrofit efforts in these facilities such that New York State invests in those projects that will reduce the most energy at the least cost.
In addition, the infrastructure needed to run the BUILD SMART NY initiative has also been put in place. NYPA will house a small team which will drive this initiative, providing much needed centralized oversight and coor-dination. The data collected during the benchmarking process is being used to set the baseline against which progress will be measured. That data, along with other findings from the initiative, will be shared publicly on the BUILD SMART NY website, which is a unique platform for publicly sharing progress on energy efficiency.
Finally, the BUILD SMART NY team has also identified and started to develop potential solutions to issues that are hurdles to the implementation of energy efficiency projects. Such topics include the ability of agencies to use “design-build” procurement, identification of additional non-agency funding sources, and pressure points in the timeframe causing time delays.
55
Reorganizing Emergency ResponseThe ability to respond quickly and effectively to emergencies and crises is perhaps the most crucial test of government performance, because failures will result in property damage, injuries or even loss of life. The State of New York experienced true emergencies in 2011 with Hurricane Irene and Tropical Storm Lee and again in 2012 with Hurricane Sandy. In 2011, after Hurricane Irene and Tropical Storm Lee, Governor Cuomo directed his new leadership team at the Department of Homeland Security and Emergency Services (DHSES) to overhaul its emergency management approach and capabilities. These steps, many of which were in progress at the time when Hurricane Sandy struck, included:
• Implementing a new regional approach to Rapid Response by placing emergency equipment in strategically located stockpiles throughout the State.
• A shift from the traditional “all hazards” planning model to a risk-based catastrophic planning model. This planning effort represents a departure from the traditional “all hazards” planning to a much more detailed and focused “hazard specific” planning.
• Instituting a newly prioritized Emergency Management training curriculum for agency executives to ensure agency executives understand the State’s emergency management framework and the State’s roles and responsibilities related to disaster response. In January 2012, more than 40 State agency executives attended a training session at the State Emergency Operations Center to participate in exercises preparing for additional responsibilities that are entailed in response to an emergency.
In late 2012, Hurricane Sandy made landfall, causing untold damage and the tragic loss of many lives. Millions of New Yorkers faced a prolonged loss of power, tremendous property damage, and an inability to access criti-cal resources and services. In response to this unprecedented disaster, Governor Cuomo immediately recog-nized the need to embark on an ambitious plan to further enhance the State’s emergency response capabili-ties to prevent these types of shortfalls from occurring again.
To meet these goals, the Governor created four commissions, the NYS Ready Commission, the NYS Respond Commission, the NYS 2100 Commission, and the Moreland Commission on Utility Storm Preparation and Response, to seriously examine existing systems and present a comprehensive blueprint for moving forward. These commissions will allow the State to dramatically upgrade its emergency preparedness and response capabilities and strengthen the ability of the State’s infrastructure to survive major weather incidents.
Governor Cuomo accepted many of the preliminary recommendations of these commissions and incorporated them into his 2013 State of the State address. A summary of these recommendations is included in Appendix F.
Chapter 5: Coordination of Inter-Agency Activities
56
Enterprise-wide InitiativesTechnology is central to almost everything the State does. The innovative use of technology enables the govern-ment to work smarter, connect better with citizens, deliver services more effectively and cut costs. It is a truism that technology changes over the last decade have made the private sector and best practice governments significantly more efficient, with higher performance and lower costs. These technology-based improvements depend on having a modern information technology (IT) infrastructure.
When Governor Cuomo took office, New York State’s IT organization and infrastructure were outdated and inef-ficient. The State lacked consistent IT standards and had a weak governance structure: the Office for Technolo-gy had no authority over the IT function in State agencies, where most of the spending and most of the applica-tion development occurred. This resulted in visible inefficiencies such as the State having four different email platforms and more costly inefficiencies that resulted from the lack of a sophisticated portfolio management approach to IT assets and programs. The following are a few illustrative examples of these inefficiencies:
• Agencies operated more than 50 separate data centers and server rooms spanning 140,000 square feet and maintained over 17 different server operating systems, many of which are obsolete and no longer supported by the vendor;
• Individual agencies ran their own telephone exchanges supporting approximately 150,000 phones, resulting in higher costs compared to a voice over Internet protocol (VoIP) strategy now common in the private sector;
• More than 30% of network hardware was running on software no longer supported by the ven-dor and about one-third had reached the end of its useful life, making it prone to the latest cyber threats; and
• Agencies maintained at least 53 separate IT help desks, with some agencies having no help desk support at all. Only 52% of agencies have formal desktop support
To address these issues, Governor Cuomo embarked on a comprehensive overhaul of the State’s information technology functions. This transformation can be divided into three parts: a reorganization of the way in which the State manages the IT function; modernization of the State’s IT infrastructure; and acceleration of the devel-opment of IT projects with a high return on investment and a high impact on performance.
CHAPTER 6: Information Technology Transformation
PART II: REDUCING COSTS AND IMPROVING SERVICE
57
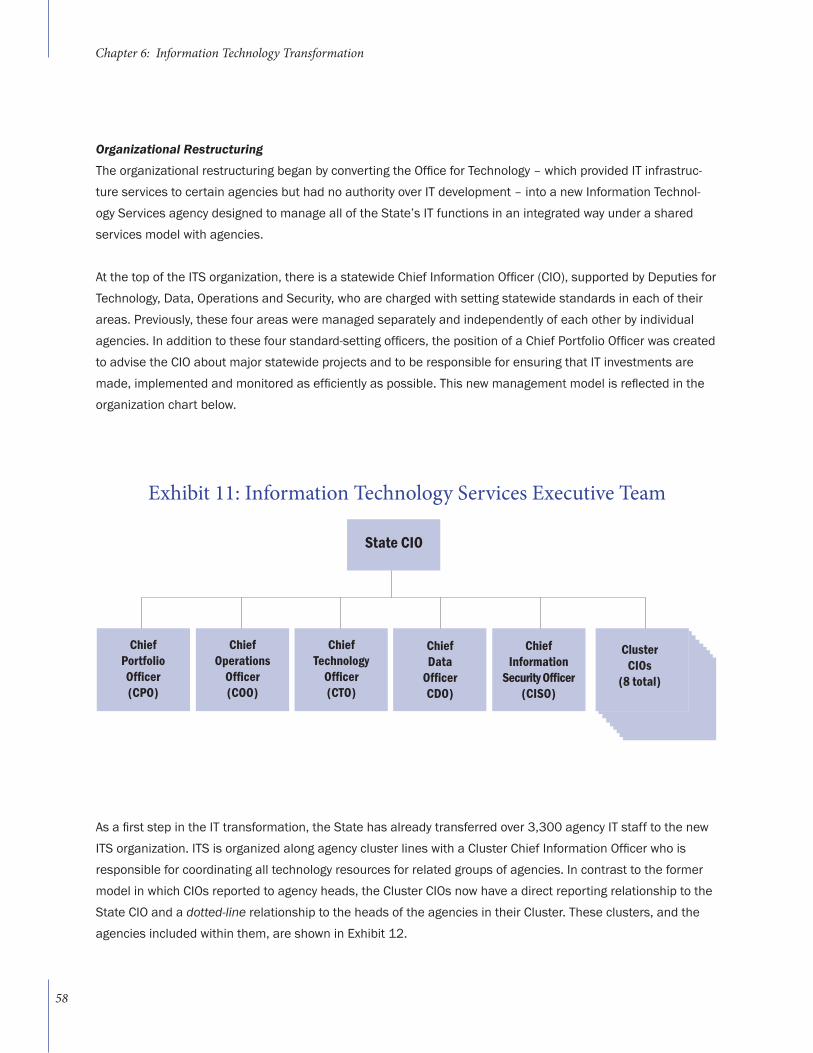
Organizational Restructuring The organizational restructuring began by converting the Office for Technology – which provided IT infrastruc-ture services to certain agencies but had no authority over IT development – into a new Information Technol-ogy Services agency designed to manage all of the State’s IT functions in an integrated way under a shared services model with agencies.
At the top of the ITS organization, there is a statewide Chief Information Officer (CIO), supported by Deputies for Technology, Data, Operations and Security, who are charged with setting statewide standards in each of their areas. Previously, these four areas were managed separately and independently of each other by individual agencies. In addition to these four standard-setting officers, the position of a Chief Portfolio Officer was created to advise the CIO about major statewide projects and to be responsible for ensuring that IT investments are made, implemented and monitored as efficiently as possible. This new management model is reflected in the organization chart below.
As a first step in the IT transformation, the State has already transferred over 3,300 agency IT staff to the new ITS organization. ITS is organized along agency cluster lines with a Cluster Chief Information Officer who is responsible for coordinating all technology resources for related groups of agencies. In contrast to the former model in which CIOs reported to agency heads, the Cluster CIOs now have a direct reporting relationship to the State CIO and a dotted-line relationship to the heads of the agencies in their Cluster. These clusters, and the agencies included within them, are shown in Exhibit 12.
ChiefPortfolioOfficer(CPO)
ChiefOperations
Officer(COO)
ChiefTechnology
Officer(CTO)
ChiefData
OfficerCDO)
ChiefInformation
Security Officer (CISO)
ClusterCIOs
(8 total)
State CIO
Exhibit 11: Information Technology Services Executive Team
Chapter 6: Information Technology Transformation
58
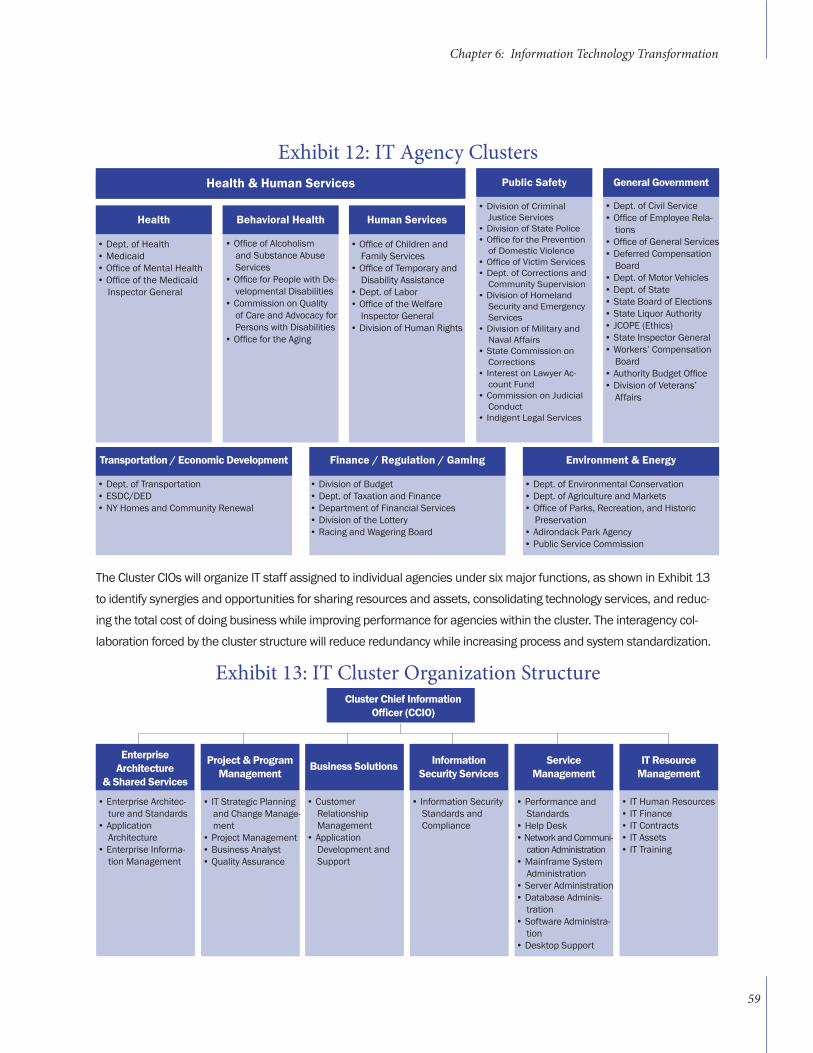
Chapter 6: Information Technology Transformation
The Cluster CIOs will organize IT staff assigned to individual agencies under six major functions, as shown in Exhibit 13 to identify synergies and opportunities for sharing resources and assets, consolidating technology services, and reduc-ing the total cost of doing business while improving performance for agencies within the cluster. The interagency col-laboration forced by the cluster structure will reduce redundancy while increasing process and system standardization.
Exhibit 12: IT Agency Clusters
Exhibit 13: IT Cluster Organization Structure
Health & Human Services Public Safety General Government
Human ServicesBehavioral HealthHealth
Finance / Regulation / Gaming Environment & EnergyTransportation / Economic Development
• Dept. of Health• Medicaid• Office of Mental Health• Office of the Medicaid
Inspector General
• Office of Alcoholism and Substance Abuse Services
• Office for People with De-velopmental Disabilities
• Commission on Quality of Care and Advocacy for Persons with Disabilities
• Office for the Aging
• Office of Children and Family Services
• Office of Temporary and Disability Assistance
• Dept. of Labor • Office of the Welfare
Inspector General• Division of Human Rights
• Division of Criminal Justice Services
• Division of State Police• Office for the Prevention
of Domestic Violence• Office of Victim Services• Dept. of Corrections and
Community Supervision• Division of Homeland
Security and Emergency Services
• Division of Military and Naval Affairs
• State Commission on Corrections
• Interest on Lawyer Ac-count Fund
• Commission on Judicial Conduct
• Indigent Legal Services
• Dept. of Civil Service• Office of Employee Rela-
tions• Office of General Services• Deferred Compensation
Board• Dept. of Motor Vehicles• Dept. of State• State Board of Elections• State Liquor Authority• JCOPE (Ethics)• State Inspector General• Workers’ Compensation
Board• Authority Budget Office• Division of Veterans’
Affairs
• Dept. of Environmental Conservation• Dept. of Agriculture and Markets• Office of Parks, Recreation, and Historic
Preservation• Adirondack Park Agency• Public Service Commission
• Dept. of Transportation• ESDC/DED• NY Homes and Community Renewal
• Division of Budget• Dept. of Taxation and Finance• Department of Financial Services• Division of the Lottery• Racing and Wagering Board
IT ResourceManagement
ServiceManagement
Information Security Services
Business SolutionsProject & Program Management
Enterprise Architecture
& Shared Services
Cluster Chief Information Officer (CCIO)
• IT Human Resources• IT Finance• IT Contracts• IT Assets• IT Training
• Performance and Standards
• Help Desk• Network and Communi-
cation Administration• Mainframe System
Administration• Server Administration• Database Adminis-
tration• Software Administra-
tion• Desktop Support
• Information Security Standards and Compliance
• Customer Relationship Management
• Application Development and Support
• IT Strategic Planning and Change Manage-ment
• Project Management• Business Analyst• Quality Assurance
• Enterprise Architec-ture and Standards
• Application Architecture
• Enterprise Informa-tion Management
59
A good example of this more strategic and coordinated approach to software development and maintenance can be seen in the Health and Human Services Cluster. The agencies in this cluster now maintain approxi-mately 1,000 software applications with considerable overlap in many areas including case management and billing systems. A review process of these applications is underway, and it is expected that the current 1,000 applications will be reduced to approximately 200-300. A similar exercise to rationalize the number of software applications is also being conducted in other agency clusters.
Both internal and outside experts have estimated that the State could reduce the cost of software development and maintenance by 10-20% annually through rationalization of the software development and maintenance process. Based on the approximately $900 million the State spends annually on software development, main-tenance and related personnel, this suggests that this reorganization of the way in which the State develops, procures and maintains software applications will result in direct savings of at least $90 million annually.
IT Infrastructure Modernization The modernization of the State’s IT infrastructure is built around four major, enterprise-wide projects, all of which are well underway. These four projects are: (i) upgrading the State’s data centers; (ii) replacing analog phone networks with consolidated digital networks that include voice over Internet protocol (VoIP); (iii) stan-dardizing and integrating email; and (iv) implementing enterprise-wide identity and access management for the State’s major software applications.
The SAGE Commission estimates that modernization of the State’s IT infrastructure will save the State approxi-mately $100 million when fully implemented and significantly improve IT performance.
Data Center Modernization The State currently has more than 50 data centers, an arrangement that is not only inefficient but also car-ries serious security risks. As recently as fiscal year 2010-11, the State’s budget included a $100 million appropriation to construct a new 100,000 square foot data center (and even this amount was considered to be substantially less than the cost of such a facility). The Cuomo administration is pursuing a much less expensive strategy, which is based on reducing the State’s data storage needs by redesigning inefficient business processes while potentially taking advantage of “cloud computing” to more efficiently provide data storage for non-secure applications.
Chapter 6: Information Technology Transformation
60
The key business process redesign is facilitating the “virtualization” of servers, so a single server can run multiple applications. Today, agencies dedicate an individual server for each application, and as a result operate at only 37% utilization rates resulting in large amounts of excess unused capacity. The State will significantly reduce its server needs by directing the consolidation of redundant applications within agency clusters. In parallel with this process of rationalizing agency applications and enabling server virtualization, the State will migrate its data cen-ters to what is known in the industry as a “tier 3” environment, guaranteeing 99.982% availability.
Applications with lower security needs, such as websites or routine email correspondence, will be stored in the public “cloud.” The public cloud consists of privately owned and operated servers and data centers. The public cloud may cost as little as a fifth the cost of a private cloud and therefore is preferable except in the case of unique security requirements for the agency application in question.
By contrast, the State’s own data centers will be used for the many agency applications that do have high security requirements, such as the DCJS fingerprinting application and Electronic Health Medical Records. The State esti-mates that it will require only 40,000 square feet of data center space for this facility, compared to the 100,000 square feet contemplated by the previous administration in its appropriations for a statewide data center.
Digital Network Consolidation
State agencies have approximately 150,000 phone lines, of which only about 15% take advantage of VoIP technology. The remaining analog phone lines are more expensive, include fees for both long-distance and local calls, and have less functionality than what VoIP technology provides such as integrated voice, video and data, improved security and increased productivity.
The Cuomo administration anticipates that most of the remaining analog phone lines will be converted to a VoIP based telecommunications network. Among other benefits, this digital telecommunications network will serve as the backbone of the four anchor call centers that will handle calls for all State agencies.
Email Consolidation and Integration When Governor Cuomo took office, State agencies used four different email platforms serving 150,000 users. These four platforms supported 27 different installations that further complicated integration and interoperability. Governor Cuomo ordered an email consolidation and integration that will reduce costs and allow all State agencies to take advantage of work productivity tools such as calendar management that modern email systems provide.
On a transitional basis, the State will consolidate all agencies on to two email platforms – Microsoft Office and Lotus Notes. These two platforms will be interoperable, so each platform will be transparent to the user. Although it is not cost-efficient to consolidate onto a single platform at this time, further efficiencies will be achieved by consolidating to a single platform in the future. As discussed above, email traffic with low security concerns will be stored in a public “cloud,” while sensitive emails will be stored in the State’s private data center.
Chapter 6: Information Technology Transformation
61
Enterprise Identification and Access Management
Identification and access management on an enterprise-wide basis is needed for users to navigate different agency software applications on a seamless basis. Seamless access is a foundational element of a “Citizen’s Portal” that connects all of the State’s customer-facing applications, which the SAGE Commission recommended last year. The State has a partially functioning enterprise identification and access management (EIAM) system today that has limited functionality, but it lacks a common user identity that works across all applications and has limited functionality overall.
As a first step, ITS will direct the largest agencies with customer-facing applications, such as the Department of Taxa-tion and Finance and the Department of Motor Vehicles, to create a common identification system across their ap-plications. This initiative will be followed by a redesign of the State’s entire EIAM system, so that citizens, businesses and State employees only need a single ID that provides uniform access to the State’s back-end applications. While a new EIAM system may generate modest savings for State agencies, the primary benefit of this enhance-ment will be to significantly improve performance in the way the State serves both businesses and citizens.
IT-Enabled Business Process Redesign
Accelerating High ROI / High Impact IT Projects Much of the focus of ITS must be on large mission-critical systems, such as the Medicaid claims system and the Welfare Management System. But a critical tool in efforts to redesign State government is the acceleration of the development of IT projects that have a high return on investment (ROI) and/or a high impact on customer service or other types of performance. In many cases, these IT projects are accompanied by a redesign of the underlying business process to make it more efficient and productive.
A review of the Annual Technology Plans for 2012-13 illustrates the type of projects that meet the following criteria of a “High ROI /High Impact” project:
• The project can be completed in a relatively short period of time, such as 1-2 years;• The project would yield a return on investment of at least 30% annually; and• The project would materially improve customer service or agency performance.
Projects that substantially met these criteria advance a range of strategic initiatives, as shown in Exhibit 14.
Chapter 6: Information Technology Transformation
62
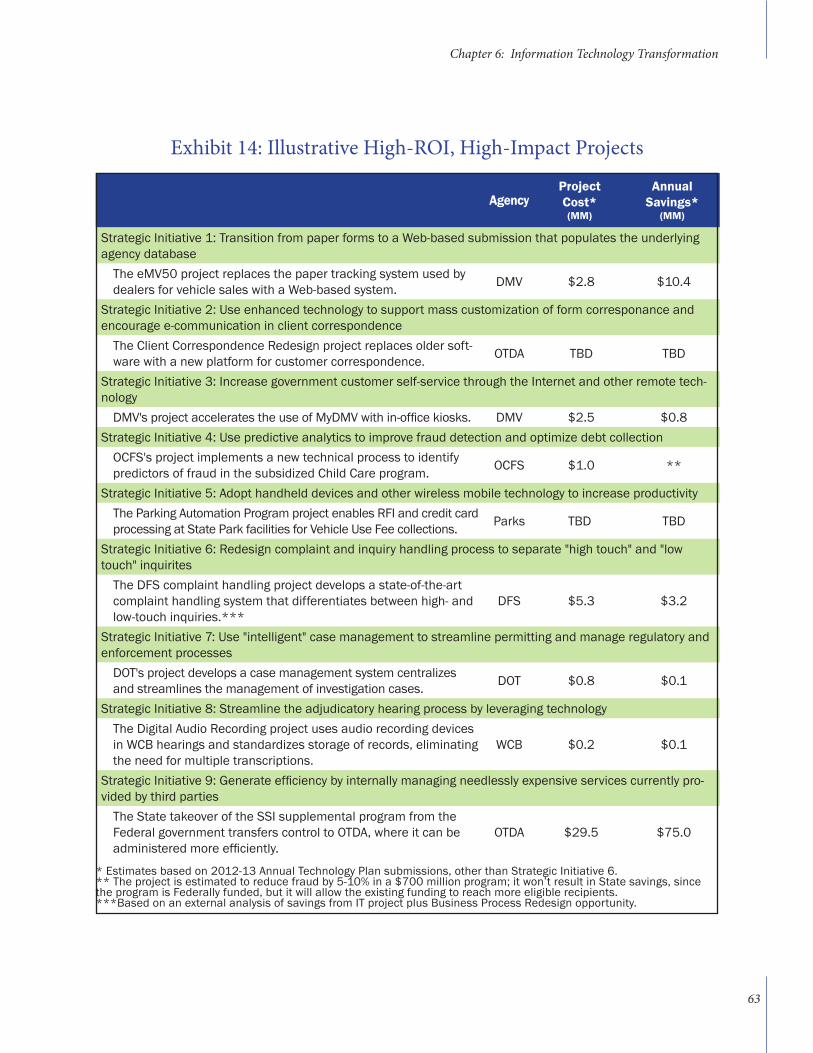
Exhibit 14: Illustrative High-ROI, High-Impact Projects
AgencyProject Cost*(MM)
Annual Savings*
(MM)
Strategic Initiative 1: Transition from paper forms to a Web-based submission that populates the underlying agency database
The eMV50 project replaces the paper tracking system used by dealers for vehicle sales with a Web-based system. DMV $2.8 $10.4
Strategic Initiative 2: Use enhanced technology to support mass customization of form corresponance and encourage e-communication in client correspondence
The Client Correspondence Redesign project replaces older soft-ware with a new platform for customer correspondence. OTDA TBD TBD
Strategic Initiative 3: Increase government customer self-service through the Internet and other remote tech-nology
DMV's project accelerates the use of MyDMV with in-office kiosks. DMV $2.5 $0.8 Strategic Initiative 4: Use predictive analytics to improve fraud detection and optimize debt collection
OCFS's project implements a new technical process to identify predictors of fraud in the subsidized Child Care program. OCFS $1.0 **
Strategic Initiative 5: Adopt handheld devices and other wireless mobile technology to increase productivityThe Parking Automation Program project enables RFI and credit card processing at State Park facilities for Vehicle Use Fee collections. Parks TBD TBD
Strategic Initiative 6: Redesign complaint and inquiry handling process to separate "high touch" and "low touch" inquirites
The DFS complaint handling project develops a state-of-the-art complaint handling system that differentiates between high- and low-touch inquiries.***
DFS $5.3 $3.2
Strategic Initiative 7: Use "intelligent" case management to streamline permitting and manage regulatory and enforcement processes
DOT's project develops a case management system centralizes and streamlines the management of investigation cases. DOT $0.8 $0.1
Strategic Initiative 8: Streamline the adjudicatory hearing process by leveraging technologyThe Digital Audio Recording project uses audio recording devices in WCB hearings and standardizes storage of records, eliminating the need for multiple transcriptions.
WCB $0.2 $0.1
Strategic Initiative 9: Generate efficiency by internally managing needlessly expensive services currently pro-vided by third parties
The State takeover of the SSI supplemental program from the Federal government transfers control to OTDA, where it can be administered more efficiently.
OTDA $29.5 $75.0
* Estimates based on 2012-13 Annual Technology Plan submissions, other than Strategic Initiative 6. ** The project is estimated to reduce fraud by 5-10% in a $700 million program; it won’t result in State savings, since the program is Federally funded, but it will allow the existing funding to reach more eligible recipients.***Based on an external analysis of savings from IT project plus Business Process Redesign opportunity.
Chapter 6: Information Technology Transformation
63
Most of these projects are either underway or funded within the FY13-14 budget. Beginning in 2013, a formal project and portfolio management process is being implemented to accelerate the development of these high-value projects. The main components of this process include:
• Effective strategic planning– Annual Cluster IT Strategic Plans will be developed to inform and shape an overall IT Strategic plan to promote IT alignment with business priorities;
• Standardized project requests– Standard forms and processes will be utilized to gather project requests. Requests will be assessed according to risk and business value to assist with investment decision-making; and
• Portfolio management approach– Approved projects will be monitored at a senior level and on an ongoing basis to verify that objectives are being met.
The SAGE Commission estimates that High ROI /High Impact IT projects already identified will save the State approximately $100 million annually. One such project – the State takeover from the federal government of the administration of the State supplement to federal Supplemental Security Income (SSI) payments, which was authorized in the 2012-13 Budget – will save approximately $75 million annually.
In addition to these tactical High ROI /High Impact IT projects, the Cuomo administration has also embarked on several multi-year projects to redesign major IT platforms which support critical State functions. Two such projects – E-licensing and the Grants Contract Management System – are described in Chapter 7 (Customer Service and Process Improvement). Two other IT platform projects, rent regulation system redesign and work-ers’ compensation claims system redesign, are described below.
Rent Regulation System Redesign In June 2011, the State enacted a significant expansion of rent regulation. In connection with this legislation, Governor Cuomo directed Homes and Community Renewal (HCR) to create a Tenant Protection Plan which included, in addition to a new Tenant Protection Unit (TPU) to enforce greater compliance with the law, the fol-lowing operational elements:
• Improved use of state of the art technology;• Revamping of HCR’s rent registration database to increased enforcement capability; and• Fraud detection technology and data analysis to monitor and enforce landlord compliance.
To implement this Tenant Protection Plan, HCR engaged a leading consulting firm to assist in the overall rede-sign and transformation of the State’s Office of Rent Administration Program (ORA). The main deliverables of this project are a “Business Transformation Roadmap” that identified the business process changes needed to support the goals of the TPU and a Technology Transformation Roadmap with recommendations for HCR to overhaul its systems to improve its effectiveness in three key areas:
Chapter 6: Information Technology Transformation
64
Chapter 6: Information Technology Transformation
• Improved State of the Art Technology: HCR presently uses a legacy mainframe system called HUTS to support the business case processing needs for ORA. There is a critical need to modernize the Informa-tion Technology Systems to enable ORA to more efficiently administer the rent control laws of New York State. For example, notices to tenants of their rights under the rent laws have been provided through owner-served documents and notices. Integrated, updated technology will allow HCR to proactively send notices to tenants, as well as obtain a clearer picture of specific owner compliance.
• Revamping HCR’s Rent Registration Database: A new integrated database will allow HCR to proactively verify rent increases and target likely overcharges and instances of fraud. New, proactive enforcement targeting criteria will point to circumstances that may trigger review and investigation, such as apart-ment vacancy, an apartment that is registered one year and not the next, owners with a history of rent overcharges or other violations, among other factors.
• Fraud Detection Using Technology and Data Analysis: Data analysis technology will enable the Office of Rent Administration (ORA) to analyze transactional data to obtain insights into the operating effective-ness of internal controls and identify indicators of fraud risk or actual fraudulent activities. The data in ORA’s possession is provided by owners in annual registration forms and is not currently reviewed or analyzed for accuracy or truthfulness. New systems will provide analytical techniques that are highly ef-fective in detecting fraud and will be able to scan and analyze the owner- provided registration data base of over 850,000 apartments.
Collectively, these IT upgrades – and the business process redesigns which they support – will help to protect both tenants and owners in more than 850,000 rent regulated apartments.
Workers’ Compensation Claims System Redesign The Workers’ Compensation system in New York covers approximately 8 million workers and involves approximately 600,000 businesses, which pay more than $6 billion annually in premiums, claims payments and assessments for other expenses. The Cuomo administration has taken a number of steps to reduce the costs and improve the func-tioning of the of the Workers’ Compensation system, including measures in the 2013-14 Executive Budget which are expected to reduce costs to employers by $900 million.
1. New York is currently among the worst performing states in timely first indemnity payments. WCRI Flash report – Timeliness of Injury Reporting and First Indemnity Payment in New York: A Comparison with 14 States, March 2008 ISBN 978-1-934224-89-2
65
The workers’ compensation claims system redesign in an integral part of the Cuomo administration’s Moderniza-tion Program, launched in 2011, that will leverage technology, national best practices, and reengineered business processes to improve service quality and reduce administrative claims costs. The program has two key components.
• First, beginning in 2013, the Workers’ Compensation Board will mandate a national standard for elec-tronic report of injury. Utilization of electronic report of injury, unlike the Board’s antiquated paper re-porting system, will allow the Board to monitor and improve upon New York’s poor performance in timely payment of benefits, a key component to ensuring positive, cost effective worker outcomes.
• Second, the Board has retained a leading consulting firm with national workers’ compensation expertise to work together with all stakeholders to overhaul the system’s outdated business processes and recom-mend a modern and effective claims environment for New York State. This new claims environment will specifically address those fundamental issues that lead to high cost, poor worker outcomes, and case durations beyond what is seen in other states.
Chapter 6: Information Technology Transformation
66
The Cuomo administration believes that State government should regard citizens as “customers” when they are interacting with the government. Exhibit 15 illustrates some of the major service categories in which citizens interact with State government and the “pain points” that they now experience. Much can be done to improve the State’s “customer service” in these interactions. A number of significant initiatives have been launched over the last two years to address various pain points that citizens experience and other projects will be undertaken in the coming years.
Process improvements are involved in customer service solutions, but are also important in improving the efficiency and effectiveness of internal operations of State government. The Cuomo administration has also embarked on a number of internal process improvements would save money and improve interactions with outside stakeholders. Some of these process improvement initiatives are described in this chapter.
Licensing and permitting are among State government’s core functions. For example, the Department of Motor Vehicles issues licenses and permits for vehicles and drivers, the Department of State and the State Education Department issue occupational and professional licenses, the State Liquor Authority and other agencies issue permits and licenses for new businesses, and the Department of Environmental Conservation and other agen-cies regulate construction projects.
Too often, State government performs its licensing, permitting and regulatory functions inefficiently, with long wait times and duplicative or complex information requests which impose a cost in both time and money. A number of new initiatives are being pursued to address this problem.
CHAPTER 7: Customer Service and Process Improvement
67
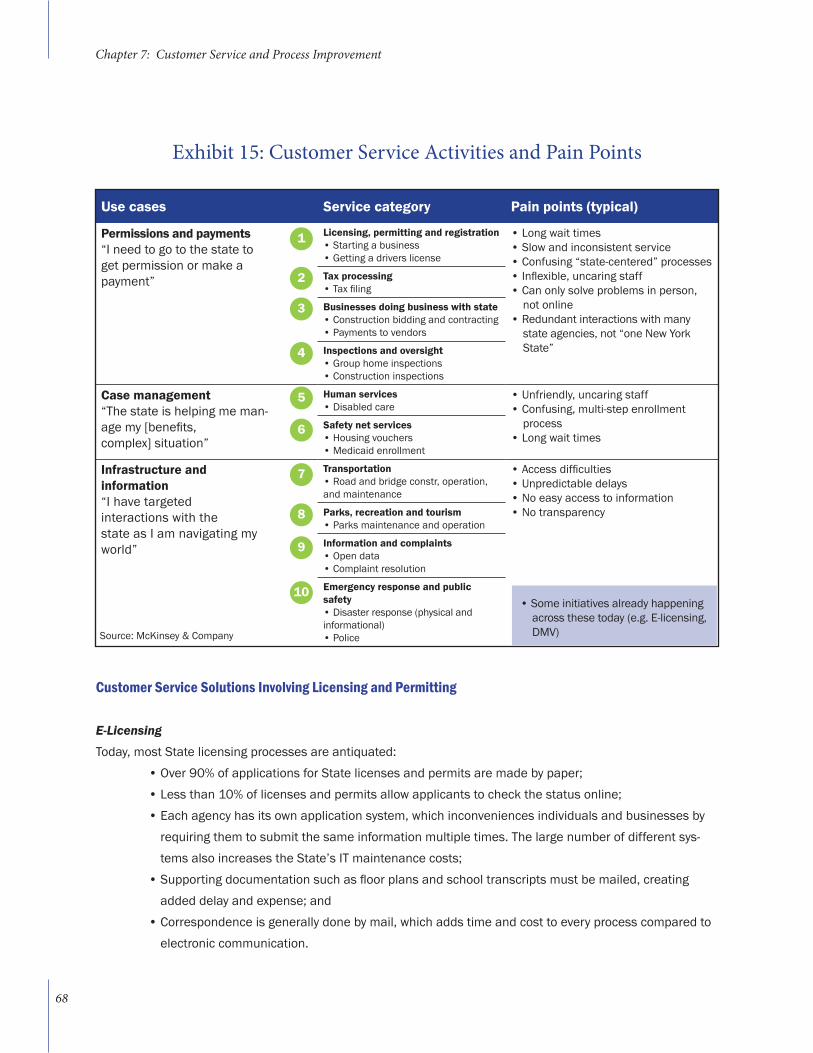
Use cases Service category Pain points (typical)
Permissions and payments“I need to go to the state to get permission or make a payment”
Licensing, permitting and registration• Starting a business• Getting a drivers license
• Long wait times• Slow and inconsistent service• Confusing “state-centered” processes• Inflexible, uncaring staff• Can only solve problems in person,
not online• Redundant interactions with many
state agencies, not “one New York State”
Tax processing• Tax filing
Businesses doing business with state• Construction bidding and contracting• Payments to vendors
Inspections and oversight • Group home inspections• Construction inspections
Case management“The state is helping me man-age my [benefits, complex] situation”
Human services• Disabled care
• Unfriendly, uncaring staff• Confusing, multi-step enrollment
process• Long wait times
Safety net services• Housing vouchers• Medicaid enrollment
Infrastructure andinformation“I have targeted interactions with the state as I am navigating my world”
Transportation• Road and bridge constr, operation, and maintenance
• Access difficulties• Unpredictable delays• No easy access to information• No transparencyParks, recreation and tourism
• Parks maintenance and operation
Information and complaints• Open data• Complaint resolution
Emergency response and public safety • Disaster response (physical and informational)• Police
Customer Service Solutions Involving Licensing and Permitting
E-LicensingToday, most State licensing processes are antiquated:
• Over 90% of applications for State licenses and permits are made by paper;• Less than 10% of licenses and permits allow applicants to check the status online;• Each agency has its own application system, which inconveniences individuals and businesses by
requiring them to submit the same information multiple times. The large number of different sys-tems also increases the State’s IT maintenance costs;
• Supporting documentation such as floor plans and school transcripts must be mailed, creating added delay and expense; and
• Correspondence is generally done by mail, which adds time and cost to every process compared to electronic communication.
Exhibit 15: Customer Service Activities and Pain Points
1
2
3
4
5
6
7
8
9
10• Some initiatives already happening
across these today (e.g. E-licensing, DMV)Source: McKinsey & Company
Chapter 7: Customer Service and Process Improvement
68
Chapter 7: Customer Service and Process Improvement
In 2012, the Cuomo administration began a major “e-licensing” initiative to develop a best-in-class online licensing and permitting system. The first phase includes six agencies that together issue 400 different types of licenses and permits.1 When completed, the e-licensing system will enable online applications, simple user interfaces, online status checks (similar to tracking a Fed Ex package), online upload of electronic documents, and communication through email. It will also include a “business wizard” function, an early version of which now exists on the New NY Works website, to identify relevant forms and available government incentives de-pending on the type of business started. The new e-licensing system will be scalable and capable of serving additional agencies and offering more license types in the future.
This e-licensing system will enhance customer service and also reduce costs for the State by consolidating computer systems and support staff. The six agencies involved in the first phase of the project currently main-tain twenty different licensing systems, which create unnecessary maintenance and labor costs. In addition, the e-licensing system will capture data on response and processing times, which will give the State an empiri-cal basis for further process improvements.
DMV Licensing and Customer Service As a model for other State agencies, the Department of Motor Vehicles (DMV) is undertaking a broad effort to improve customer service by introducing technology and other best practices commonly associated with the private sector. Customer service has deteriorated over many years, leading to unacceptable office wait times, outmoded technology, poor call center service, and office hours which are inconvenient for people who work.
To address these problems, DMV has studied other states and private sector best practices and is launching 11 discrete customer service initiatives over the next year. These include:
• A self-serve queuing system that will allow customers to reserve a place in line from a home PC or smart-phone and arrive at a State DMV office with little or no wait to be served;
• Self-service kiosks similar to those used in post offices and airports in DMV offices (other high-traffic areas are being explored);
• Customer service representatives using tablet technology to “triage” customer inquiries while waiting in line;• Expanded office hours to open earlier, close later or be open on Saturdays in select locations on a pilot basis;• Call center improvements including the use of voice over Internet protocol (VoIP) to improve routing and
virtual queuing with call-back technology;• A modernized and redesigned website to improve the user experience, add functionality, and provide
mobile-ready applications; and• Automated written tests for Commercial Driver License applicants;
1. The six agencies are the Departments of Agriculture and Markets, Environmental Conservation, and State, as well as the State Liquor Authority, the OPAL program within the Office of Information Technology Services, and the State Education Department.
69
DMV will measure the impact of these initiatives to meet several objectives. The most important is to reduce office wait times in State DMV offices from more than 60 minutes to less than 30 minutes on average by March 2014. Reducing wait times will depend at least in part on relieving staff from assist-ing with routine transactions that can be completed via self-service means, such as the web, kiosks, and mail – channels which customers prefer given their convenience. As such, DMV has targeted in-creasing the share of these “alternative” channels from the current 32% to greater than 50% within 2-3 years. DMV will also adopt improved call center metrics, including responding to 80% of all calls within 5 minutes, or providing a call back within 15 minutes, by March 2014. Finally, DMV has set a goal of achieving 90% customer satisfaction (rated good or excellent) by those who use a DMV office by March 2014. Importantly, the expanded use of technology will not only improve customer service, it will also shift transaction volume to low-cost, self-service channels, thereby improving labor productivity. This will allow DMV to offer better service to customers while holding its operating costs relatively flat over the medium term.
Reform of the State Environmental Quality Review (SEQRA) ProcessAmong DEC’s ongoing efforts to improve customer service is a major initiative to reform the State Envi-ronmental Quality Review Act (SEQRA), which was enacted in 1976 so that environmental impacts would be fully considered when new projects are being built across the State. This permitting process includes reviews by multiple agencies and support from environmental consultants, is extremely technical and can cause delay in some instances. As part of its efforts to reform SEQRA, DEC solicited feedback from stakeholders with diverse interests to identify how the process could be streamlined and delays avoided, without sacrificing meaningful environmental review and protection.
Among the reforms DEC is exploring is expanding the list of low-impact activities that are not subject to an environmental review under SEQRA. This will allow more projects that meet certain conditions to avoid un-dergoing an environmental assessment or developing an Environmental Impact Statement (EIS), which will greatly reduce time frames for those categories of actions. Public comments on this issue were received in August 2012 and draft regulations will be released for public comment in the future. Other SEQRA reforms under review by DEC include increased establishment and enforcement of certain deadlines and encouraging the use of “focused” EIS reviews.
Chapter 7: Customer Service and Process Improvement
70
Professional and Business LicensingThe State currently issues licenses for over 75 different professions, including nurses, athletic trainers, bar-bers, massage therapists, hearing aid dispensers, ticket resellers, and others. The vast majority of these are issued through the State Education Department or the Department of State. While ensuring minimum stan-dards can serve an important public purpose, some requirements may be outdated and excessive.
For example, while someone can become a licensed emergency medical technician in New York with about 35 days of training, it takes four times that long to become a makeup artist or skin care specialist. It takes even longer to earn a license as a massage therapist, cosmetologist, mobile home installer or barber.
According to a recent report, New York requires licenses for a number of occupations not licensed in most states, including such occupations as a farm labor contractor, optician, and travel guide. The report also found that New York often has more onerous standards for occupations for which licenses are required than in most states.2
In addition to expediting the professional and occupational licensing process generally, one area of immediate focus is to allow the “fast-tracking” of applications from professionals licensed in another state who move to New York. For example, it can take an engineer who is certified in another state as much as 16-20 weeks to receive a license to work in New York—an onerous barrier to employment. Agencies should, as a general rule, issue “provisional” licenses in these circumstances to simplify the process from the applicant’s perspective while retaining the final authority over licensing decisions.
In conjunction with the implementation of the State’s e-licensing initiative, the administration is also evaluating the possibility of creating a single business and professional licensing entity to standardize and streamline all aspects of licensing. Consolidating these activities into a single agency would allow for standardization of com-mon functions, such as the development of forms, application intake, payment collection, background checks, inspections, and dispute resolution. At the same time, it would allow for specialization in areas where domain expertise is especially important, such as the granting of liquor licenses.
This new licensing entity would also facilitate business process improvements that go beyond the current e-licensing initiative. For example, SLA recently began an Attorney Certification Program to help reduce the time it takes to approve liquor license applications. Through this program, applicants have an attorney certify the ac-curacy of their application, which allows SLA to expedite the review process. Attorney certification has reduced submission errors, review times, and time spent requesting additional applicant information. Self-certification could be used in other business licensing and permitting situations as well.
2. License to Work: A National Study of Burdens from Occupational Licensing, May 2012
Chapter 7: Customer Service and Process Improvement
71
Other states have already consolidated their business and professional licensing activities. In Connecti-cut, the Department of Consumer Protection has become the home for a variety of business and pro-fessional licensing activities, including in the areas of liquor, drug control, food, weights and measure, occupations and professions. Florida, Ohio and Michigan have all combined professional and business licensing and regulation (including their alcohol control activities) within a single agency.
There are at least two options for consolidating business and professional licensing functions. The first would be to create a new standalone agency (a new “Department of Licensing”). The second would be to combine the State Liquor Authority (SLA) into the Department of State’s Division of Licensing Servic-es as the first step in creating a center of excellence within the Department of State. The SLA would be a logical core component of any new licensing entity given the success it has had in redesigning its own business processes to reduce backlogs and cycle times.
Regardless of whether this entity is a new agency or division of a larger entity, it could also serve as the “home” for the e-licensing initiative, which is now being managed by a small staff within the Division of the Budget.
Contracting and Grants Management
Streamlining of the MWBE Certification ProcessMinority and Women-Owned Business Enterprises (MWBE) that are State vendors must be certified to qualify for participation in the State’s MWBE program. When the Commission first reviewed the MWBE certification process in the spring of 2011, it found that the process was highly inefficient. The certifica-tion process took an average of three months and only about 40 certifications were being approved per month. There were backlogs in both new applications and re-certifications. At its peak in May 2011, the backlog had reached 1,500 firms. These certification delays contributed to a lower number of certi-fied firms, which made it more difficult for State agencies to meet Governor Cuomo’s goal of increasing MWBE participation in State contracts.
The new management team at ESDC recognized that the MWBE certification process needed to be rede-signed. To date, ESDC has streamlined the process in a number of ways. ESDC eliminated unnecessary steps, including mandatory site visits in certain cases, and expanded reciprocity with other governmen-tal entities that engage in a similar MWBE certification process. ESDC has also released a statewide RFP to create a comprehensive online system to report on backlogs in certification applications and to track MWBE utilization by agencies.
Chapter 7: Customer Service and Process Improvement
72
Another important measure that ESDC is pursuing is to ensure coordination between the MWBE certifica-tion process at ESDC and the Office of General Services (OGS) procurement process. In the new strategic sourcing model that the state is adopting, OGS will have significant responsibility for making procurement decisions. This makes it imperative that OGS work closely with ESDC to develop suitable MWBE vendors for the various product categories.
Contracting with Not-For-Profits and Other Third-Party Providers The State uses not-for-profit providers (NFPs) and, to a lesser extent, other third-party providers to deliver many critical services, ranging from healthcare clinics to daycare to job training. According to the Office of the State Comptroller, as of October 2011, the State had over 22,000 active contracts (which are gener-ally referred to as “grants contracts”) with NFPs, totaling $16.8 billion in value.3
The current contracting process is cumbersome for all such providers and especially inefficient for NFPs that contract with multiple state agencies. Late payments to NFPs are the rule, not the exception. In 2010, 71% of contracts with NFPs were not approved by the contract start or renewal date. This pattern of late payment forces NFPs to decide between assuming financial risk by beginning to operate the program with-out a contract, or not providing services at all.
The process is also inefficient for the State. Twenty agencies now use more than 50 different IT systems to manage the grant contracting process. In addition to increasing costs by having to maintain multiple sys-tems, these systems are unable to produce standardized reporting of performance-based data that would enable the state to reduce waste and award contracts in a more targeted way. Late payments to NFPs also require agencies to pay interest on late payments and risk the loss of federal funding due to non-compli-ance with payment deadlines.
Consistent with the recommendation of the Commission last year, the Cuomo administration has begun an aggressive effort to overhaul the grants contracting processes. The State has begun a detailed review of the current process and business environment, including extensive reviews with NFPs to understand their problems. The goal is to simplify and standardize the grants contract process from beginning to end—i.e., from the response to an RFP to the conclusion of a contract. This will reduce the administrative burden for both NFPs and agencies, improve the timeliness of grant contract approvals and payments and allow for the collection and comparison of performance data across agencies and programs.
3. Office of the State Comptroller, New York State’s Not-for-Profit Sector: Delayed Contracts and Late Payments Hurt Service Providers, November 2011.
Chapter 7: Customer Service and Process Improvement
73
Chapter 7: Customer Service and Process Improvement
This review has identified the following requirements for a new grants contracts management system: • An enterprise-wide online software platform that will function as a single point of access for all grant recipi-
ents and agencies to complete each phase of the grant process electronically; • A redesigned business processes to have fewer, simpler steps and less duplication;• Standardization of the application and contract terms; and • A reporting and performance management methodology that can be used to track and compare the effec-
tiveness of programs.
The administration is seeking to align its efforts with a similar initiative in the City of New York. This alignment would benefit the large NYC-based nonprofit community since a large number of NFPs receive both State and City funding. A coordinated approach would further minimize their administrative burden.
Among the ideas the administration is reviewing to simplify and streamline this process is the prequalification of NFPs based on their financial characteristics. This would simplify the RFP process by centralizing judgment about the financial qualifications of a NFP, while decentralizing to State agencies the judgment about program experi-ence and skill set. If done correctly and with proper safeguards, prequalification could smooth out the contract approval process since the financial review would be completed prior to the start of the application process.
Another goal of the system should be the development of a “Vault” which would enable NFPs to electronically store all key documents requested by the State in a single web-based location. Because many different govern-ment agencies require similar documents, a Vault system which had interoperability with similar systems (such as New York City’s Vault system) would eliminate duplication of effort by NFPs in submitting and maintaining neces-sary documentation.
Other Process Improvements
LEAN Process Improvements
A number of states have begun to use LEAN, a process improvement tool made popular in manufacturing indus-tries to streamline processes, reduce wait times, and better align their operations with their customers’ priorities. The Department of Environmental Conservation (DEC) is serving as a pilot agency in the State’s effort to introduce “LEAN process” reviews to State agencies. In December 2011, DEC worked with an expert from Albany’s Center for Economic Growth to conduct a LEAN review of the process it follows to issue Air State Facility permits.4 The purpose of a LEAN review is to comprehensively review each step in a process. This review allows businesses and agencies to identify and reform unnecessary steps that add time or cost.
4. DEC issues three types of air permit: Air Title 5 (sources which are federally mandated to have a permit); Air State Facil-ity (sources not requiring a federal permit but above specific thresholds); and Registrations (small sources). Air State Facility permits were selected since DEC controls all the permitting requirements.
74
DEC’s LEAN exercise identified every aspect of DEC’s permit review and issuance process with the goal of issu-ing new Air State Facility permits as efficiently as possible. Specific changes in the permit process resulting from this review included the following: additional training for permit writers; updated permitting information on DEC’s website; improved information provided at pre-application meetings; completion of updates to DEC’s computer permitting system; establishment of specific timelines for response questions, the drafting of permits; and certain regulatory revisions. DEC, with stakeholder input, will be identifying additional programs and processes to go through the LEAN process, including the Brownfield Cleanup Program. Other agencies such as OPWDD, OASAS and DOH have started similar efforts, and as noted in Chapter 10, LEAN will become a continuing initiative to help implement government redesign efforts.
Design-Build ProcurementIn December 2011, Governor Cuomo signed the Infrastructure Investment Act (the “Act”) into law, the State’s first law allowing Design-Build contracts for many public works projects. Under the “Design-Build” process, contractors compete to offer the most cost effective designs for a new construction project. Rather than the State mandat-ing a specific design and construction method, qualified firms compete to bring innovative design and technology solutions that often improve functionality and/or reduce cost. The Design-Build process also permits an expedited construction schedule compared to traditional State contracting. The new law allows for Design-Build to be used on a pilot basis for three years with agencies and authorities that account for most of the State’s spending on infrastructure.5
During 2012, the Department of Transportation (DOT) entered into three Design-Build contracts, which enabled the accelerated replacement of 32 bridges. In addition, DOT is expected to issue an RFP shortly for a Design-Build contract to rebuild the Kosciuszko Bridge, in what is expected to be a $500 million to $1 billion project.
By far the most important use of the Act, however, was the ability to use Design-Build contracting for the Tappan Zee Hudson River Crossing Project, one of the largest infrastructure projects in the United States in recent years. In February 2012, four consortiums were selected through a Request for Qualifications process, based on the experience of their design and construction teams. These four groups were then invited to prepare a full proposal to be evaluated based on “best value,” allowing for innovation in design, materials, aesthetics, and cost so long as certain basic parameters were met (e.g., 100-year life, eight general traffic lanes, extra-large shoulders, capable of adding rail line in the future, seismic capabilities, etc.).
5. The law authorizes the Department of Transportation, the Department of Environmental Conservation, the Office of Parks, Recreation, and Historical Preservation, the Thruway Authority, and the Bridge Authority to use Design-Build contracts. The Metropolitan Transportation Authority and the Port Authority had the ability to enter into Design-Build contracts prior to the enactment of the Infrastructure Investment Act.
Chapter 7: Customer Service and Process Improvement
75
Initially, the Federal Highway Administration (FHWA) estimated the Tappan Zee Bridge project would cost $5.4 billion. In December 2012, however, a winning consortium was selected with a bid of $3.1 billion, which was at least 20% lower than the other three bidders. The winning proposal also requires less dredging and can be completed faster than other proposals. When additional oversight and contingencies costs are added, the total project cost is expected to be just under $4 billion, almost $1.5 billion less than the original FHWA estimate. By using Design-Build procurement effectively, the State was able to achieve a strong competitive bid process, substantially reduce the bridge cost (for the benefits of toll-payers), minimize the environmental impact through reduced dredging, shift the risk of cost overruns to the private sector, and accelerate the creation of thousands of new construction jobs.
It is generally believed that the Design-Build contracting structure can save 5-20% of a project’s cost. Savings are typically greater in large, sophisticated projects such as the Tappan Zee Bridge, where there is a premium on innovation. Experts believe that Design-Build authority enabled to the State to reduce the cost of the Tappan Zee Bridge project by at least $1 billion. It is too soon to tell what savings, if any, have been realized from the smaller Design-Build contracts entered into by DOT last year.
Given the positive Tappan Zee experience, the Governor announced plans to seek expanded Design-Build au-thority in the 2013-14 Executive Budget. Currently, bidding consortiums cannot provide financing, and certain agencies, authorities and projects still do not have the ability to use Design-Build. As an example of the latter, the New York Power Authority (NYPA) believes that it could reduce the costs and accelerate the completion of energy efficiency projects in State facilities if it had the authority to use a Design-Build procurement process. NYPA has received estimates that using a Design-Build approach would save approximately 9% of total costs, or $45 million based on the $500 million estimated cost of completing energy efficiency retrofits for all State facilities.
Chapter 7: Customer Service and Process Improvement
76
As described in the Introduction to this report, the Cuomo administration took a series of steps to control the cost of the State’s workforce as part of a broader plan to reduce a looming budget deficit and long-term fis-cal pressures from rising pension and health insurance costs. Beyond merely controlling costs, however, the Cuomo administration agrees with the Commission’s assessment that modernization of the State’s workforce is a critical element in the effort to make State government more efficient and effective.
The need for modernization would exist in any event, but changes in the size and demographics of the State’s workforce now make it essential. The proposed merger of the Governor’s Office of Employee Relations (GOER) into the Department of Civil Service (DCS), which is described below, will serve as a catalyst for modernization.
The SAGE Commission’s efforts in examining issues related to the State’s workforce modernization issues were led by Commission members with significant experience in working with public employees. They worked with an agency advisory council comprised of senior staff from 11 agencies. As part of the Commission’s review process, interviews were conducted with 28 State executives and focus groups were held with more than 150 line employ-ees and mid-level managers.
The civil service system is constitutionally protected by the New York State Constitution and embodies important values such as the professionalism of the workforce and protection against cronyism and political patronage. However, as the State workforce and the nature of the work it performs have changed over time, the civil service system has not always kept pace. The Commission has identified as an option for future consideration certain changes in the law governing the State’s civil service system that would facilitate workforce modernization.
Inefficiencies created by the civil service system are not the only challenge in modernizing the State workforce. The State’s collective bargaining agreements also limit the State’s flexibility in hiring and managing its workforce. Nevertheless, much can be done even within existing civil service law and collective bargaining agreements. The Commission has identified a number of specific steps that can be taken which will make the State workforce more productive and effective.
Controlling the Cost of New York State’s Workforce
Controlling Wage IncreasesIn addition to controlling the cost of the State workforce by exercising discipline in new hiring, Governor Cuomo arrested the growth in per capita employee spending by entering into new four and five-year collective bargaining agreements that included no salary increases for the first three years of the agreements.
CHAPTER 8: Modernizing the Workforce
77
These four- and five-year agreements contained cumulative salary increases of two and four percent, respec-tively, over the life of the contract. This compares to cumulative salary increases of 13% in the prior four-year collective bargaining agreement and 10% in the four-year collective bargaining agreement before that. These agreements also implemented a two-year reduction in employee compensation which led to savings of $161 million in each year of the program.
New Tier VI Pension Plan In recent years, the rate of increase in salaries for State employees has been dwarfed, however, by the increases in pen-sion and health benefit costs. The cost of pensions and health benefits for active and retired employees grew from $1.3 billion in state fiscal year 1998-99 to an estimated cost of $5.3 billion in the 2013-14 Executive Budget, an increase of more than 300%. The prohibition in the New York State Constitution against any reduction of pension benefits for exist-ing employees makes reducing pension costs difficult in the short run, but these expenses can be reduced significantly over time. In 2012, the Governor won passage of his most important pieces of legislation, which was the adoption of the Governor’s proposal to create a new “Tier VI” pension plan for new State and local government employees. This plan will save the State and local governments, including New York City, more than $80 billion over a 30-year period.
Governor Cuomo’s Tier VI pension plan implements reforms that will achieve significant savings, such as progres-sively increasing new employee contribution rates, increasing the retirement age from 62 to 63, and adopting measures to prevent manipulation of the “final average salary” level that is used to calculate employee pensions.
Most private sector companies have replaced their defined benefit pension plans with defined contribution plans to increase the predictability of their pension costs. The new Tier VI plan took a step in that direction by creating an optional defined contribution plan for new non-union employees with salaries $75,000 and above. The State and local governments will make an 8% contribution to employee accounts.
Increased Employee Contribution for Health InsuranceThe administration also made progress in its last collective bargaining agreements in controlling its employee health insurance costs. The cost of health insurance for active and retired employees grew from $1.5 billion in 2001-02 to $3.2 billion in 2012-13. An actuarial valuation of the State’s “other post-employment benefits (OPEB) liabilities performed as of April 1, 2010 calculated the present value of the actuarial accrued total liabil-ity for benefits as of April 1, 2010 as $59.7 billion for the State and an additional $12.4 billion for SUNY.
To help address this rapidly growing cost, employee health premium contributions for most employees in-creased from 10% to 16% for individual coverage and from 25% to 31% for dependent coverage. Retiree con-tributions increased from 10% to 12% for individual coverage and from 25% to 27% for dependent coverage. These increases in employee contributions are expected to reduce the State’s annual health insurance costs by approximately $260 million.
Chapter 8: Modernizing the Workforce
78
Chapter 8: Modernizing the Workforce
As described earlier in this report (see “Coordinated Health Insurance Purchasing” in Chapter 3), additional steps are contemplated that will help to reduce the cost of active and retiree employee health insurance.
Reduction in the Size of the Workforce Personal service costs (including salaries and wages for active employees and benefits for both active and retired employees) account for roughly two-thirds of the cost of State Operations. Controlling these costs by reducing the size of the State workforce and curtailing the growth in both salaries and benefits are among the administration’s most important achievements to date in controlling overall spending growth. As a result of these efforts, the State’s Personal Service costs in executive-controlled agencies in 2013-14 are projected to be $175 million lower than in 2010-11.
Over the past four and a half years, the number of full-time equivalent personnel (“FTEs”) in executive-controlled agencies has fallen 14%, from 137,680 to 118,878 FTEs. This decline is not only the result of increased retirements as the workforce ages but also due to a conscious effort by the Cuomo administration to not automatically replace employees who leave or retire, but instead to make a smaller workforce more productive and efficient through the initiatives described in this report.
Layoff Avoidance In accordance with the continued rightsizing initiatives discussed in Chapter 2, the Governor’s 2013-14 Execu-tive Budget recommends the closure and realignment of facilities operated by the Department of Corrections and Community Supervision (DOCCS), the Office of Children and Family Services (OCFS), and the Office of Mental Health (OMH). These initiatives could result in more than 1,400 layoffs, which the Governor is seeking to avoid. In DOCCS, the administration will seek to avoid layoffs through attrition or placement in other DOCCS facilities. In OCFS and OMH, the Agency Reduction Transfer List (ARTL) will be used to mitigate the need for layoffs. ARTL permits the trans-fer of impacted employees in “targeted titles” to the same or comparable positions in other agencies throughout the State that may be seeking to hire new employees. The Governor also chose to announce these closures and realign-ments as soon as possible in order to maximize placement of employees in other State positions.
In addition to these steps, the Governor’s Office of Employee Relations (GOER) will work to create a training pro-gram to further mitigate any potential impact from these closures and realignments. GOER will use $5 million in funding to retrain employees if needed. Also, a pilot program of vouchers for community college training will be initiated for those unable to be placed within reasonable limits of their home site.
Flexibility in Hiring, Promotion and Transfers
Lack of flexibility in hiring, promotion and transfers greatly inhibits the State’s ability to create a high-performing State workforce with skills that match the needs of today’s jobs. This lack of flexibility stems in large part from restrictions within the Civil Service Law that severely limit the pool of candidates available for hire, promotion and transfer, as well as an outdated testing and job classification system that the Department of Civil Service (DCS) is required to maintain.
79
New York’s civil service system requires the State to select the vast majority of candidates for hiring and promotion through competitive examinations. The system allows for a variety of testing methods and types of tests, including “training and experience” and oral tests. However, due to staffing shortages at DCS and concerns over processing time and cost, the majority of civil service exams are written, multiple choice tests administered in a proctored room using paper and pencil. These multiple choice exams often do not reflect the full range of knowledge, skills, abilities and personal characteristics required for successful job performance. As a result, candidates who may perform well on the job may not be highly ranked for selection, while candidates who test well may be ill-suited for the position.
A second major problem with the existing exam process is the great infrequency with which exams are offered. Even for multiple choice exams, developing and administering the exams requires a significant investment of time. As a result, in recent years DCS has been able to hold most exams quite infrequently – on average only once every three years.
The infrequency of civil service exams significantly limits the State’s flexibility in recruiting new employees and promoting existing State employees. Agencies that need to hire an employee in a job title that has not had a test in years have found that many of the eligible candidates who took the exam previously had moved, found other jobs or otherwise lost interest in working for the State. The State also misses the op-portunity to hire individuals who are newly entering the job market, as they may have to wait years simply to take the appropriate exam for State employment. The infrequency of promotion exams is also demoralizing to employees, as candidates sometimes must wait years for the opportunity to advance.
Perhaps the greatest manifestation of the lack of flexibility in the current system is the difficulty it poses to hiring candidates from outside the existing civil service workforce into positions above the entry level. Under current civil service law, agencies must choose whether to offer an exam that would fill mid-level positions through promotion of workers already in the civil service system or to offer an exam available only to candidates from outside State govern-ment. That is, the Civil Service Law does not provide the flexibility to offer an exam that would enable an agency to consider promotional candidates and candidates from outside State government for the same position at the same time. This limitation is especially problematic when agencies seek to fill specialized positions, such as nurses, IT developers or engineers. Because not enough State workers have the technical skills required to fill these positions, this lack of flexibility contributes to the outsourcing of many of these positions to more expensive consultants.
Civil Service Law Reform A number of modest changes in Civil Service Law would provide greater flexibility in hiring, promotions and transfers:
Chapter 8: Modernizing the Workforce
80
Temporary Project Jobs Expedited Hiring Extension
The Department of Civil Service currently has the authority to allow temporary appointments without examination when qualified candidates would render professional, scientific or other expert services in a temporary position to conduct a special study or project. “Temporary project jobs” as they are commonly referred to, provide a flexible tool for agencies to hire individuals with special skills on an expedited basis for projects or studies. These project jobs are especially useful when agencies have a special project or study with funding for a limited period and do not want to add to their permanent workforce.
The only limitation has been that project jobs may only be established for a period of 18 months even though when requested, such as for the Tappan Zee Bridge project, agencies know the need for such employees would continue beyond this 18 month period. Although extensions are possible, this process creates an unnecessary additional burden for the Department and agencies. Extending the permissible time period for temporary project jobs to five years with a two year extension would provide agencies the flexibility they need in order to truly maxi-mize the value of this option.
Open Promotion Permitting the use of both Open Competitive and Promotional lists simultaneously to fill promotional vacancies would make it easier to hire new employees from outside government into mid-level positions.
Promotion List and Expanded Transfer Flexibility
Currently, agencies must choose from a promotional list limited to its own employees. Consistent with the State’s goal to break down agency silos, permitting agencies to hire employees from other agencies would facilitate the movement of talented State employees between agencies.
Flexibility in transfers would be expanded by giving employees in certain non-competitive positions the opportu-nity to transfer into comparable competitive positions.
Operational Improvements in Administering Current LawIn addition to these reforms in the Civil Service Law, the State should consider implementing the following changes in agency practices, which do not require legislative change:
Improve the Content and Format of Civil Service Exams
A “competency” is a term of art that refers to a broadly defined but measurable set of knowledge, skills, abilities, and behaviors that an individual needs in order to perform work roles successfully. For example, an employer might evaluate prospective employees for their customer service or problem solving competencies – as opposed to a narrower set of knowledge included in a traditional civil service exam. Over the last 15 years, many governments have transitioned to assessing for performance-based competencies instead of the more traditional assessments covering specific knowl-edge, in order to link selection with a wider range of attributes needed to be successful in a wider range of jobs.
Chapter 8: Modernizing the Workforce
81
Offer Computerized Testing for Civil Service Exams
DCS should transition to offering most exams on computers in proctored computer labs across the State in order to increase the frequency with which exams are offered. Pennsylvania and California conduct their tests in this manner and report a variety of benefits, including faster administration, scoring and grading of tests and improved staff productivity. Transitioning to computerized testing would significantly improve the frequency at which DCS of-fers tests. Increased staff productivity resulting from computerized testing would allow DCS to offer more “training and experience” exams and interviews, which have been reduced in recent years due to staffing shortages.
Reduce and Consolidate the Number of Pay Grades and Job Classifications
The narrow job classification of many State positions is outdated and not reflective of the work actually being done by employees. The existing classification system also makes it difficult to assign employees to new tasks as staffing levels decrease or new initiatives are implemented. In addition, excessive levels of detail in job classifications make it difficult for employees to transfer across agencies and limit their career development opportunities. Broadening job classifications would reduce out-of-title-work, support performance management and training, and would also allow managers to assign a broader scope of work to employees in response to changes in technology and policies.
Fewer pay grades would add more coherence to the career ladders within agencies. In the current system, many career paths skip pay grades as positions increase in scope and responsibility. As the State develops broader job classifications, it should also make corresponding changes in pay grades.
Performance Appraisal and the Disciplinary Process
Discipline and Removal Reforming the State’s performance appraisal and disciplinary process is needed to modernize how the State workforce manages and – when necessary – disciplines its employees. The structure of the performance apprais-al and disciplinary process is negotiated as part of the collective bargaining agreements with the State’s public service unions. Although these agreements will not be renewed until 2015 and 2016, the State should prepare for these negotiations by preparing a plan to implement the steps and reforms described below. This will allow the State to effectively convey its intended reforms to public employee unions as soon as negotiations commence.
The SAGE Commission received feedback indicating that the current performance appraisal system lacks con-sequence and therefore is widely perceived as meaningless. Executives and employees also confirmed that the State’s existing disciplinary process makes it extraordinarily difficult to discipline or remove poor performers.
Chapter 8: Modernizing the Workforce
82
Currently, supervisors are permitted to grade their employees’ performance as either satisfactory or unsatisfac-tory. However, these ratings are widely viewed as having little consequence – a positive rating does not substan-tially reward an employee in any way, while a negative rating does not usually result in a reprimand of any kind. Both executives and rank-and-file employees described this system as “antiquated,” “weak,” unable “to recognize superior performance,” “languishing,” and generally doing a “very, very poor job” of holding individuals account-able. Another weakness cited is that job expectations frequently are not communicated to employees, managers lack time to complete the appraisals, and little feedback is given once appraisals are conducted.
Perhaps because of the perception that the current performance appraisal system lacks consequence, many managers do not document performance seriously. In many cases, employees indicated that they had not received a performance appraisal in as long as twenty years. When managers did issue appraisals, employees suggested that the appraisals were inconsistently completed and not delivered on a timely basis.
Executives and mid-level managers frequently described the process of disciplining and removing employees as very difficult, frustrating, rigid, excessively time-consuming and complicated. As a result, it is nearly impos-sible as a practical matter to impose consequences for poor performance.
A number of factors contribute to the difficulty in disciplining employees and removing them when necessary. These factors include the significant time and effort required to meet documentation requirements and a lack of training for managers on how the process works. Agency leadership suggests that some managers are unfa-miliar with the rules and documentation requirements, while others simply feel uncomfortable having difficult conversations with employees.
In addition, the State’s collective bargaining agreements constrain its ability to discipline employees. An example of this inability can be seen in the discipline process for Office for People with Developmental Disabilities (OPWDD) employees who have been found to have committed acts of severe misconduct related to patient abuse. Although the vast majority of employees provide high-quality care, a series of media reports spotlighted several egregious cases of abuse and neglect by a few OPWDD employees. The State reached an agreement in its 2011 collective bargaining agreements to create a negotiated set of penalties for employees who commit gross misconduct. Even though the State’s public employee unions agreed to create such a table of penalties, they have so far failed to do so. As a result of this delay, the State has been unable to achieve its goal of imposing a consistent standard of penalties for severe abuse and misconduct. As described in Chapter 3, the newly-created Justice Center creates greater transparency to detect abuse or neglect, which will help enable the State to take steps to stop it.
Lack of consequences for poor performance has wide-ranging ramifications. It discourages managers from pursuing disciplinary or removal actions. When these actions are not pursued, poor performing employees are retained but given minimal or less important work. This harms agency morale and places greater burdens on the vast majority of State employees who perform well.
Chapter 8: Modernizing the Workforce
83
Chapter 8: Modernizing the Workforce
Reform the Performance Appraisal Process
The State should systematically review the performance appraisal and employee disciplinary process and implement appropriate reforms. Reforms in this area could include:
• Redesigning the criteria used to evaluate employees to better reflect employee performance.• Using a multi-tiered grading system instead of the binary satisfactory /unsatisfactory grades that are
currently allowed.• Giving credit for strong performance appraisals in the promotion process.• Eliminating automatic pay increases for employees who receive an unsatisfactory grade.
Make Better Use of the Probationary Period for State Workers
Before becoming permanent members of the civil service, new employees are first required to complete a probation-ary term, which can last anywhere from several weeks to a few years depending on job title. A probationary employee serves at-will and may be terminated more quickly with minimal due process protections. As a result, the probation-ary period is the critical point for managers to remove under-performing or problem employees, since removing these employees after the probationary term ends can be difficult.
The State should maximize the value of the probationary period in two ways. First, DCS should explore the possibility of increasing the length of probationary terms so that managers have more time to assess an employee before the term expires. Second, the presumption of tenure at the end of probation should be re-versed. Currently, the State assumes that employees who complete their probation are permanent members of the civil service unless their supervisor indicates otherwise. Instead, supervisors should be required to affirmatively indicate that probationary employees are fit to remain in the civil service.
Establish Programs to Recognize and Encourage Exceptional and Innovative Service by State Employees
While reforming the performance appraisal and discipline processes will require time, the State can move now to establish programs that are designed to recognize innovative or exceptional service by State employ-ees. The “Service to America” medals program, instituted at the federal level by the Partnership for Public Service, is an example that New York could emulate. This program honors nine federal employees annually, who “are chosen based on their commitment and innovation, as well as the impact of their work on address-ing the needs of the nation.” Establishing a similar program in New York State would help incentivize innova-tion and performance by recognizing superior performance.
Additionally, agencies should be encouraged to re-establish their own internal recognition efforts, many of which were eliminated in recent years. These programs can be implemented for a few thousand dollars annu-ally and have a strong positive effect on morale and performance for a relatively modest cost.
84
Chapter 8: Modernizing the Workforce
Establish a “Best Places to Work in New York State Government” Index
The State should conduct an employee engagement survey annually that asks employees about their overall engagement with their jobs and their commitment to NYS government. The results of these surveys should be used to create an index that ranks each State agency by employee engagement. The survey and index should be modeled after a similar program established for the federal government by the Partnership for Public Ser-vice, called “The Best Places to Work in the Federal Government” rankings. These rankings, compiled using data from the Office of Workforce Management’s Federal Employee Viewpoint Survey, have been released an-nually since 2003 and now rank agencies comprising 97% of the federal executive branch workforce.
Taken together, this survey and index would provide a useful tool to hold agency leaders accountable for the health of their organizations, serve as an early warning for agencies where workforce management problems are developing, and offer insight into ways to improve the State’s workforce. Managers should be expected to develop and implement plans that address issues identified through this survey.
Attract and Manage Talent through DCS and GOER ConsolidationThe State needs to attract the best talent and move skilled employees where they are most needed, but the two state agencies involved in state workforce development are not well coordinated to maximize resources and out-put. Neither entity currently focuses on the more strategic workforce questions. In order to address this shortfall, the Governor’s 2013-14 Executive Budget administratively merges DCS and GOER by appointing a single official as the head of both agencies. This will allow the State to create a State Employee Workforce Development Center, which will combine the recruitment and training efforts of the two agencies, as described below. This function will be of increased importance as the State continues to find new ways to improve government effectiveness. The merged entity will be tasked with ensuring that as the demand for certain functions declines, workers are trained for new positions. Effective workforce management depends on refocusing traditional human resources tools toward the goals of attracting, recruiting and retaining a workforce of both the right size and composition. Accomplishing this across State government requires Statewide coordination of workforce data analysis, succession planning and recruitment efforts. Currently, DCS is able to provide only limited data analysis and policy guidance services to State agencies. The increased complexity of State government and the recent retirement of many mid-level managers have in-creased the need for employee training designed to meet the needs of the State as a whole. While New York offers some online training courses that are mandatory for most employees through an enterprise-wide system known as the Statewide Learning Management System (SLMS), many courses cannot be delivered in front of a computer and are not coordinated. This lack of coordination results in duplicative effort and a failure to target training to areas where it is most needed. For example, this system provides little if any training for managers, even though man-agement development is increasingly critical as the State’s senior managers retire and are replaced by promoted employees, who in many cases have little or no prior experience supervising employees.
85
In order for the State to strategically respond to changes in the workforce quickly and cost effectively, the wide variety of workforce management activities currently carried out by agencies individually must be coordinated. To avoid du-plication and ensure efficient use of limited State resources, the strategic and analytical functions should be central-ized within the newly merged DCS and GOER and provided to agencies as a shared service. These functions include workforce data collection and analysis; workforce needs and succession planning; and recruitment.
Enhanced Training
The State’s disparate employee training programs must be coordinated and given greater focus. To accomplish this goal, a Statewide Training Center should be created within DCS and GOER. This Center would be responsible for establishing a statewide training strategy, determining the content of training courses and delivering training through a variety of methods to employees in all State agencies.
As a critical early initiative, this Training Center should pilot a management development program that focuses on strengthening management and leadership skills through a combination of coursework, exposure to public and private-sector best practices, and mentoring. Once fully scaled, this program should be made available to existing managers and mandatory for all new managers.
Internship Programs
The private sector has found that internship programs are among the most effective ways to attract and vet poten-tial permanent hires. When the Governor took office, it was a tool that the State did not use effectively. Specifical-ly, there was no single point of entry for applying to internships in State government. Instead, State internship and fellowship programs were run by individual agencies without common statewide standards for selecting, training, and evaluating interns.
Governor Cuomo’s “New New York Leaders” initiative seeks to address these issues through two new programs – the Empire Fellows program and the statewide Student Intern program. The Empire Fellows program is a full-time leadership training program designed to prepare talented professionals for careers in State government. The pro-gram will offer 2-year paid fellowships to 8-12 candidates annually, who will work alongside agency Commissioners while also participating in a professional development program hosted by SUNY Albany.
The Cuomo administration also launched the statewide Student Intern program by creating a centralized portal for internship opportunities at http://nysinternships.com/nnyl/. The Department of Civil Service is hosting the portal and agencies have been advised to post all internship opportunities, paid and unpaid, on the site and students submit applications, upload resumes and identify preferred internships. Based on the preferred candidate profile submitted by the agencies, the Department provides agencies with a list of qualified candidates to be considered for appointment.
Chapter 8: Modernizing the Workforce
86
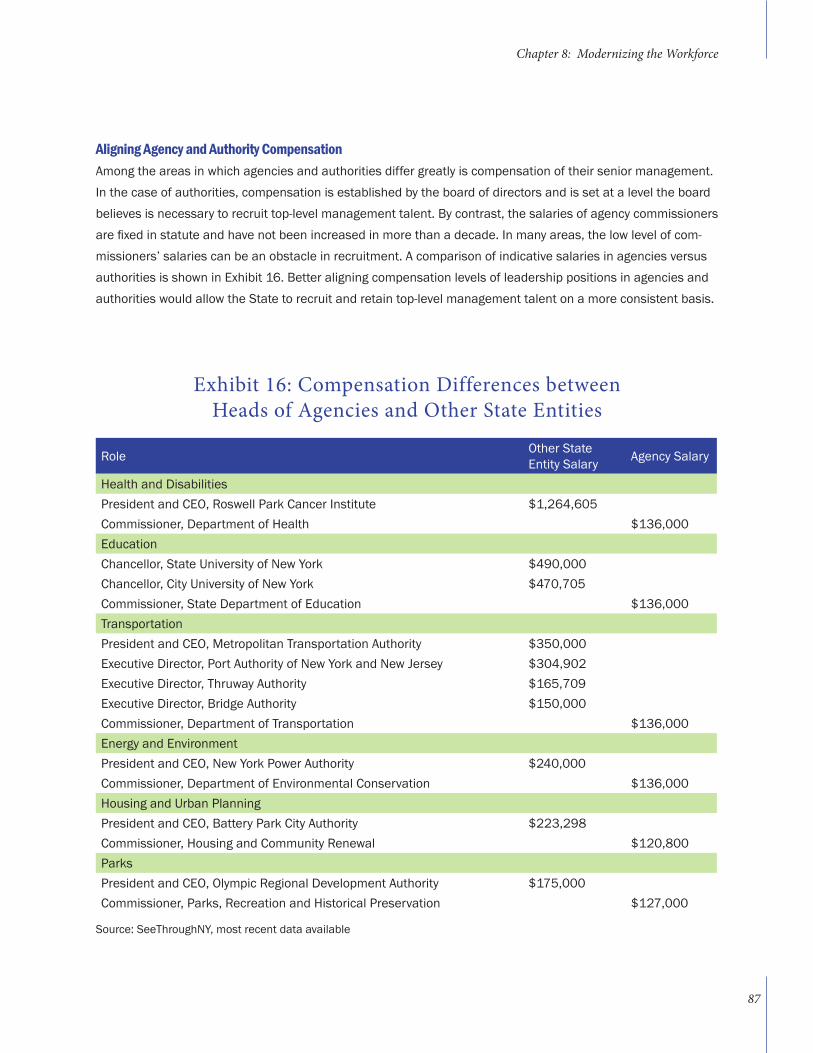
Exhibit 16: Compensation Differences between Heads of Agencies and Other State Entities
Role Other State Entity Salary Agency Salary
Health and DisabilitiesPresident and CEO, Roswell Park Cancer Institute $1,264,605Commissioner, Department of Health $136,000EducationChancellor, State University of New York $490,000Chancellor, City University of New York $470,705Commissioner, State Department of Education $136,000Transportation President and CEO, Metropolitan Transportation Authority $350,000Executive Director, Port Authority of New York and New Jersey $304,902Executive Director, Thruway Authority $165,709Executive Director, Bridge Authority $150,000Commissioner, Department of Transportation $136,000Energy and Environment President and CEO, New York Power Authority $240,000Commissioner, Department of Environmental Conservation $136,000Housing and Urban PlanningPresident and CEO, Battery Park City Authority $223,298Commissioner, Housing and Community Renewal $120,800ParksPresident and CEO, Olympic Regional Development Authority $175,000Commissioner, Parks, Recreation and Historical Preservation $127,000
Chapter 8: Modernizing the Workforce
87
Aligning Agency and Authority CompensationAmong the areas in which agencies and authorities differ greatly is compensation of their senior management. In the case of authorities, compensation is established by the board of directors and is set at a level the board believes is necessary to recruit top-level management talent. By contrast, the salaries of agency commissioners are fixed in statute and have not been increased in more than a decade. In many areas, the low level of com-missioners’ salaries can be an obstacle in recruitment. A comparison of indicative salaries in agencies versus authorities is shown in Exhibit 16. Better aligning compensation levels of leadership positions in agencies and authorities would allow the State to recruit and retain top-level management talent on a more consistent basis.
Source: SeeThroughNY, most recent data available
Building a culture of performance and accountability in all aspects of State government has been a dominant theme of Governor Cuomo’s since he took office. As part of the Governor’s commitment to improving performance and increased accountability, his Executive Order creating the SAGE Commission established performance man-agement as one of the three main aspects of the Commission’s charter.
If done right, a performance management system can support continuous improvement in operations while increasing transparency and accountability. Leading private sector businesses, from General Electric to Amazon, take pride in having a culture that integrates performance measurement into everything they do.
By contrast, when Governor Cuomo took office he found that New York State government, an enormously complex enterprise, was being managed with inadequate business intelligence tools, including the lack of an effective performance management system. This resulted in a number of negative consequences, including:
• Bureaucratic inertia resulting from the lack of a disciplined strategic planning process that leaves many key assumptions unexamined;
• Difficulty in ascertaining what the State is doing in many important areas and how well it is performing those tasks, due to the lack of reporting on major programs that cross agency or authority lines; and
• Difficulty making strategic decisions, measurably improving service and tracking progress (or lack thereof), due to the lack of well-organized metrics to measure program performance and operational execution.
For all these reasons, Governor Cuomo charged the SAGE Commission with helping the State to develop a perfor-mance management system that that identifies key performance indicators, establishes clear performance tar-gets and sets forth the major strategic initiatives of agencies and authorities. The Governor recognized that such a system would greatly improve the State’s ability to make informed decisions regarding agency programs and to identify shortcomings in agencies’ operational execution.
In addition to this statewide performance management system – called “NY Performs” – a number of individual agencies have developed detailed public reporting on major issues such as the global Medicaid spending cap and the New York Energy Highway. Some agencies have also begun to use sophisticated analytics to evaluate the perfor-mance and effectiveness of various spending programs, in order to shape policy and operational decision-making.
CHAPTER 9: Performance Management
PART III: BUILDING A CULTURE OF PERFORMANCE AND ACCOUNTABILITY
88
Including both agencies and authorities in a statewide performance management system will help to address a major obstacle to improving performance and increasing accountability – the lack of visibility into the operations of State authorities. Because agencies and authorities often work in the same policy area (e.g., transportation), this lack of visibility makes it difficult to present an integrated view of the operations and performance of State govern-ment. To further address this problem, the SAGE Commission is recommending that the Division of Budget be given the power and capabilities to review the operations and finances of State authorities as well as state agencies.
Governor Cuomo has also sought to increase accountability by making State government more transparent. In addition to a number of initiatives over the last two years that expand the amount of information available online, the Governor’s Open New York initiative will provide unprecedented access to State records and data and encour-age the development of applications that make this information more useful to citizens.
Performance and Accountability in EducationEducation is one of the many areas in which Governor Cuomo has grounded his policies on improving perfor-mance and increasing accountability. This includes initiatives that base funding on performance, not on automat-ic formulas, and creating better accountability for teachers’ performance.
Performance-based School Aid GrantsConsistent with Governor Cuomo’s general approach toward using performance-based programs, the 2011-12 Execu-tive Budget tied State funding to improved performance through competitive school aid performance grants. A total of $500 million in competitive grants was divided evenly between School District Performance Improvement Awards and School District Management Efficiency Awards. The Performance Improvement grants were awarded to those school dis-tricts that produced the greatest improvement in measureable results of student performance, including such outcomes as high school performance and graduation rates, college attendance and retention rates, and progress in closing the achievement gap of disadvantaged students. The School District Efficiency grants were awarded to school districts that implemented long-term efficiencies or cost saving measures in school district management and operations.
Statewide Teacher Evaluation SystemIn early 2012, the Governor won an agreement with key stakeholders to implement a statewide teacher evalua-tion system that is designed to improve teacher performance and introduces accountability for failure. Although the State had committed in 2010 to put in place an effective teacher evaluation system in connection with the State’s award of $700 million in federal aid through the Race to the Top program, the commitment did not include stringent enforcement mechanisms and was largely ignored by school districts. Governor Cuomo made entering into an agreement regarding teacher evaluation between school districts and their teacher union a condition of receiving any increase in School Aid in the 2012-13 school year. As a result, all but six of the State’s 691 school districts had put in place a teacher evaluation system by the Governor’s deadline of January 17, 2013. The 2013-14 Executive Budget continues this practice by requiring school districts to reach similar agreements with their teachers’ union as a condition of receiving School Aid increases in 2013-14 and beyond.
Chapter 9: Performance Management
89
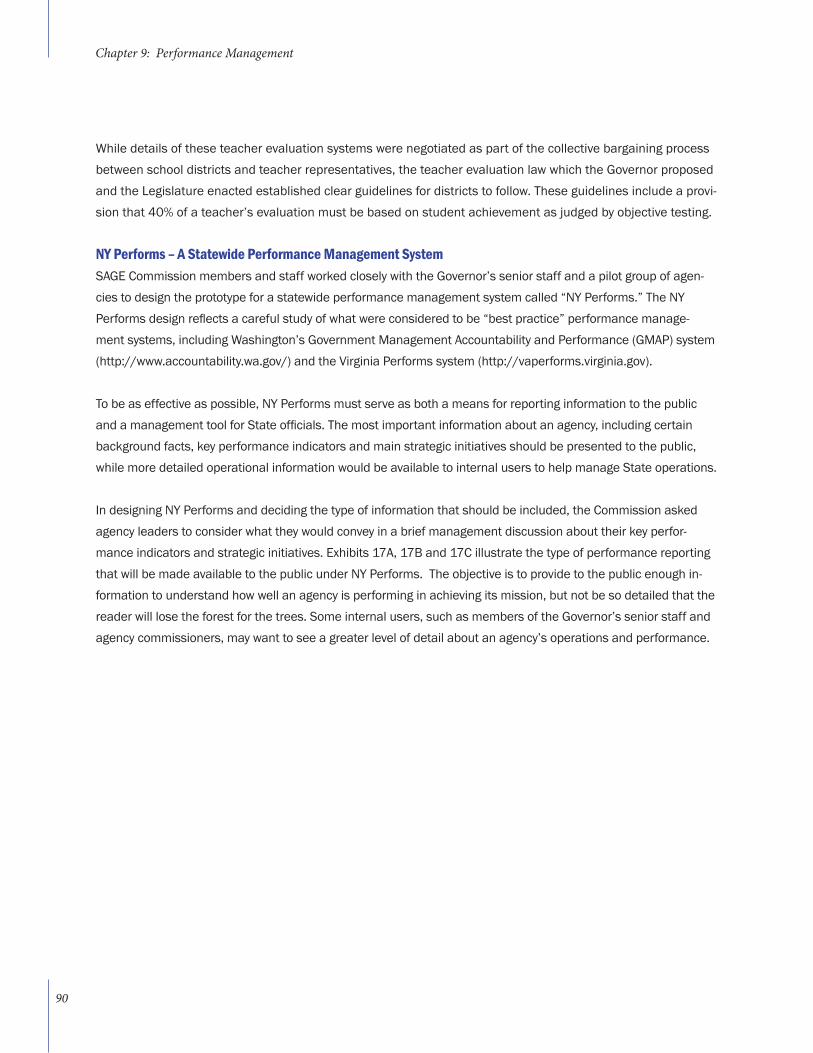
While details of these teacher evaluation systems were negotiated as part of the collective bargaining process between school districts and teacher representatives, the teacher evaluation law which the Governor proposed and the Legislature enacted established clear guidelines for districts to follow. These guidelines include a provi-sion that 40% of a teacher’s evaluation must be based on student achievement as judged by objective testing.
NY Performs – A Statewide Performance Management System SAGE Commission members and staff worked closely with the Governor’s senior staff and a pilot group of agen-cies to design the prototype for a statewide performance management system called “NY Performs.” The NY Performs design reflects a careful study of what were considered to be “best practice” performance manage-ment systems, including Washington’s Government Management Accountability and Performance (GMAP) system (http://www.accountability.wa.gov/) and the Virginia Performs system (http://vaperforms.virginia.gov).
To be as effective as possible, NY Performs must serve as both a means for reporting information to the public and a management tool for State officials. The most important information about an agency, including certain background facts, key performance indicators and main strategic initiatives should be presented to the public, while more detailed operational information would be available to internal users to help manage State operations.
In designing NY Performs and deciding the type of information that should be included, the Commission asked agency leaders to consider what they would convey in a brief management discussion about their key perfor-mance indicators and strategic initiatives. Exhibits 17A, 17B and 17C illustrate the type of performance reporting that will be made available to the public under NY Performs. The objective is to provide to the public enough in-formation to understand how well an agency is performing in achieving its mission, but not be so detailed that the reader will lose the forest for the trees. Some internal users, such as members of the Governor’s senior staff and agency commissioners, may want to see a greater level of detail about an agency’s operations and performance.
Chapter 9: Performance Management
90
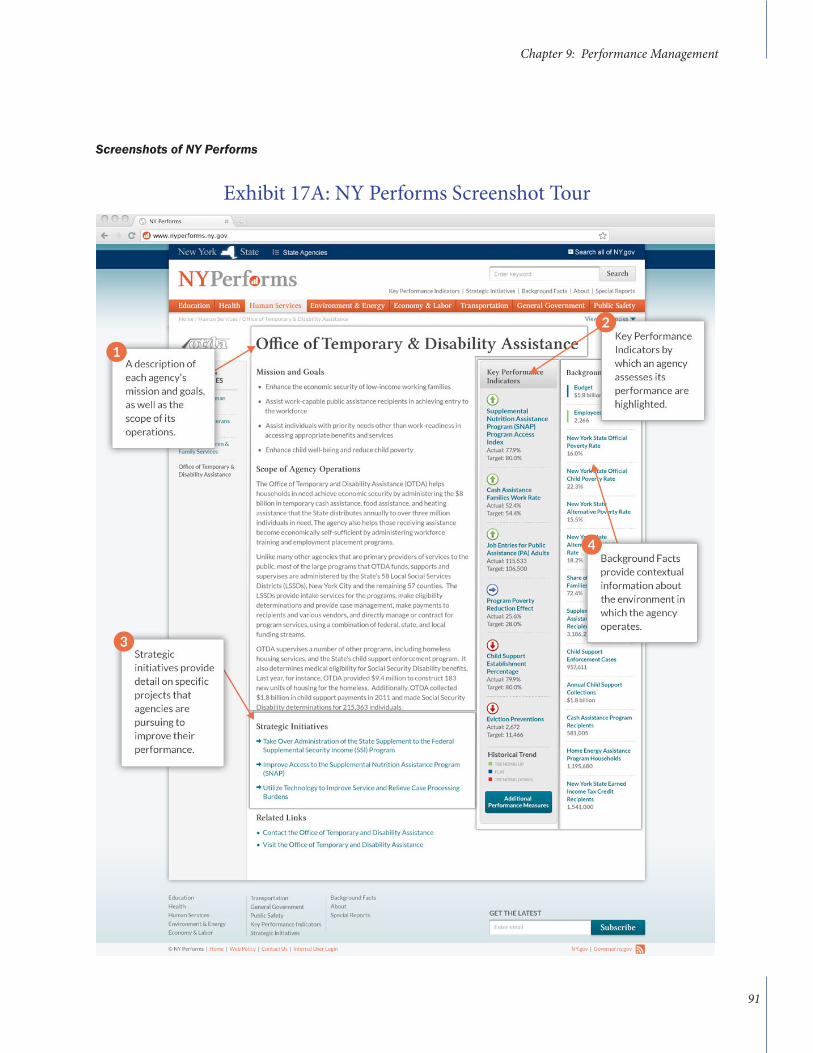
Exhibit 17A: NY Performs Screenshot Tour
Screenshots of NY Performs
Chapter 9: Performance Management
91
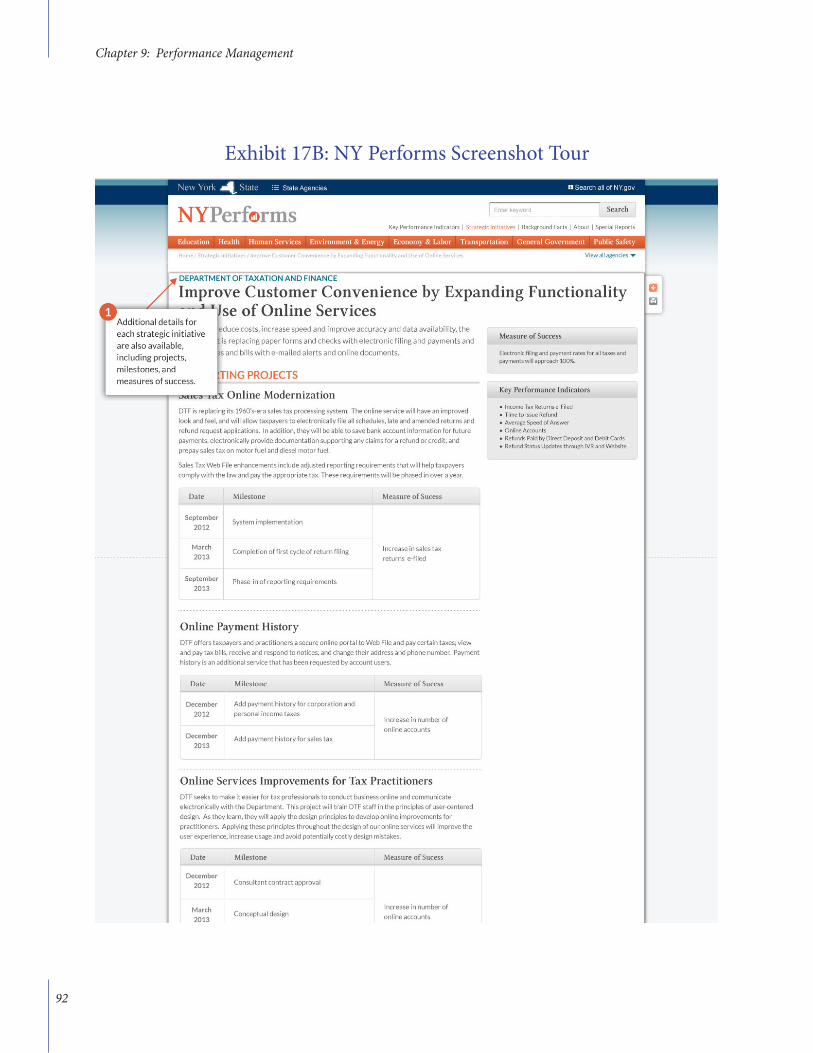
Exhibit 17B: NY Performs Screenshot Tour
Chapter 9: Performance Management
92
Exhibit 17C: NY Performs Screenshot Tour
Chapter 9: Performance Management
93
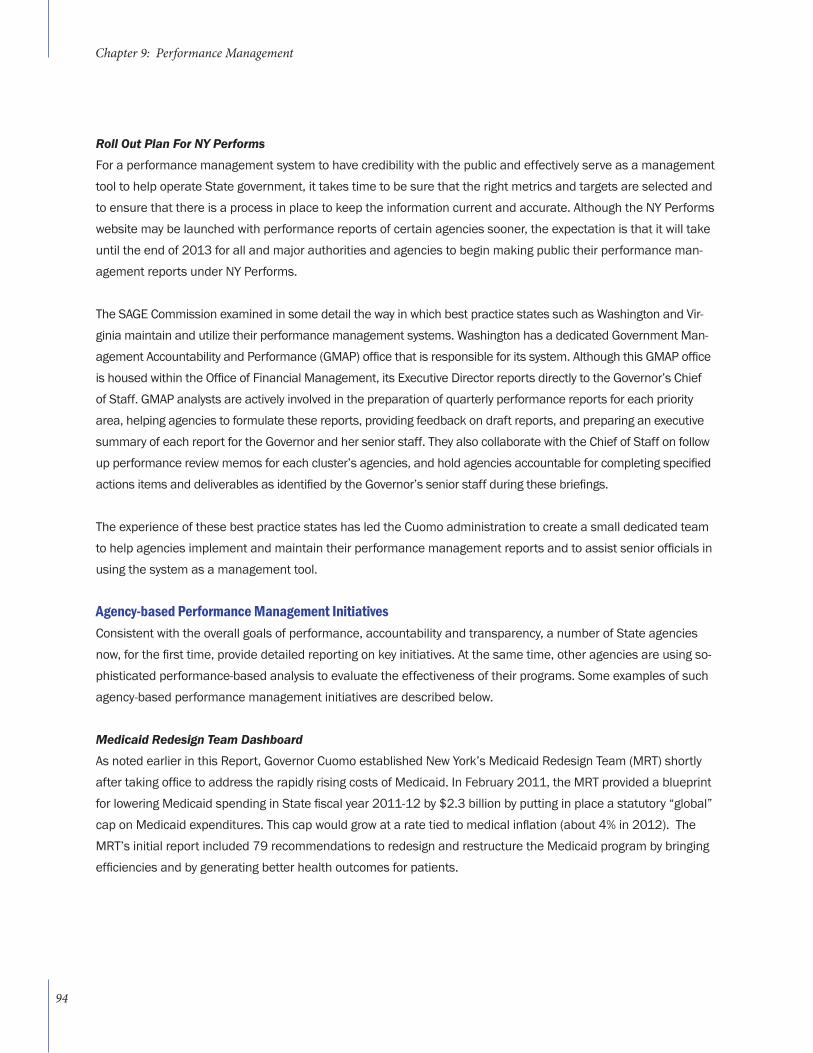
Roll Out Plan For NY PerformsFor a performance management system to have credibility with the public and effectively serve as a management tool to help operate State government, it takes time to be sure that the right metrics and targets are selected and to ensure that there is a process in place to keep the information current and accurate. Although the NY Performs website may be launched with performance reports of certain agencies sooner, the expectation is that it will take until the end of 2013 for all and major authorities and agencies to begin making public their performance man-agement reports under NY Performs.
The SAGE Commission examined in some detail the way in which best practice states such as Washington and Vir-ginia maintain and utilize their performance management systems. Washington has a dedicated Government Man-agement Accountability and Performance (GMAP) office that is responsible for its system. Although this GMAP office is housed within the Office of Financial Management, its Executive Director reports directly to the Governor’s Chief of Staff. GMAP analysts are actively involved in the preparation of quarterly performance reports for each priority area, helping agencies to formulate these reports, providing feedback on draft reports, and preparing an executive summary of each report for the Governor and her senior staff. They also collaborate with the Chief of Staff on follow up performance review memos for each cluster’s agencies, and hold agencies accountable for completing specified actions items and deliverables as identified by the Governor’s senior staff during these briefings.
The experience of these best practice states has led the Cuomo administration to create a small dedicated team to help agencies implement and maintain their performance management reports and to assist senior officials in using the system as a management tool.
Agency-based Performance Management InitiativesConsistent with the overall goals of performance, accountability and transparency, a number of State agencies now, for the first time, provide detailed reporting on key initiatives. At the same time, other agencies are using so-phisticated performance-based analysis to evaluate the effectiveness of their programs. Some examples of such agency-based performance management initiatives are described below.
Medicaid Redesign Team DashboardAs noted earlier in this Report, Governor Cuomo established New York’s Medicaid Redesign Team (MRT) shortly after taking office to address the rapidly rising costs of Medicaid. In February 2011, the MRT provided a blueprint for lowering Medicaid spending in State fiscal year 2011-12 by $2.3 billion by putting in place a statutory “global” cap on Medicaid expenditures. This cap would grow at a rate tied to medical inflation (about 4% in 2012). The MRT’s initial report included 79 recommendations to redesign and restructure the Medicaid program by bringing efficiencies and by generating better health outcomes for patients.
Chapter 9: Performance Management
94
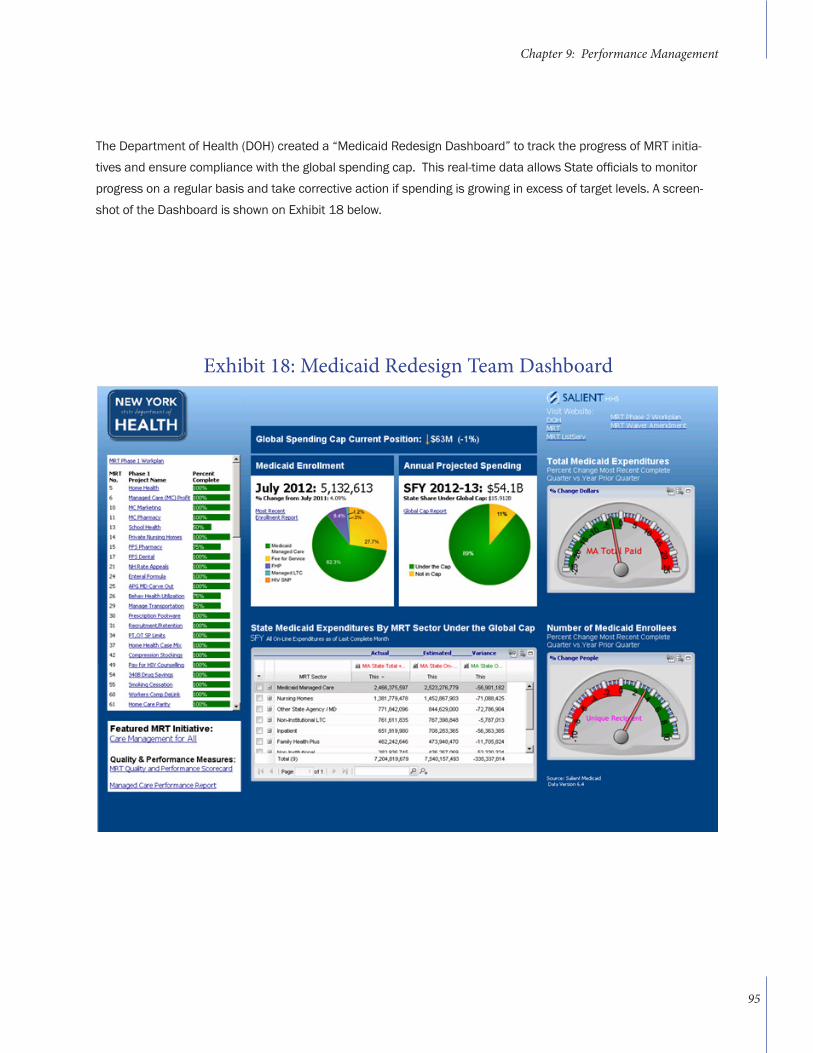
The Department of Health (DOH) created a “Medicaid Redesign Dashboard” to track the progress of MRT initia-tives and ensure compliance with the global spending cap. This real-time data allows State officials to monitor progress on a regular basis and take corrective action if spending is growing in excess of target levels. A screen-shot of the Dashboard is shown on Exhibit 18 below.
Exhibit 18: Medicaid Redesign Team Dashboard
Chapter 9: Performance Management
95
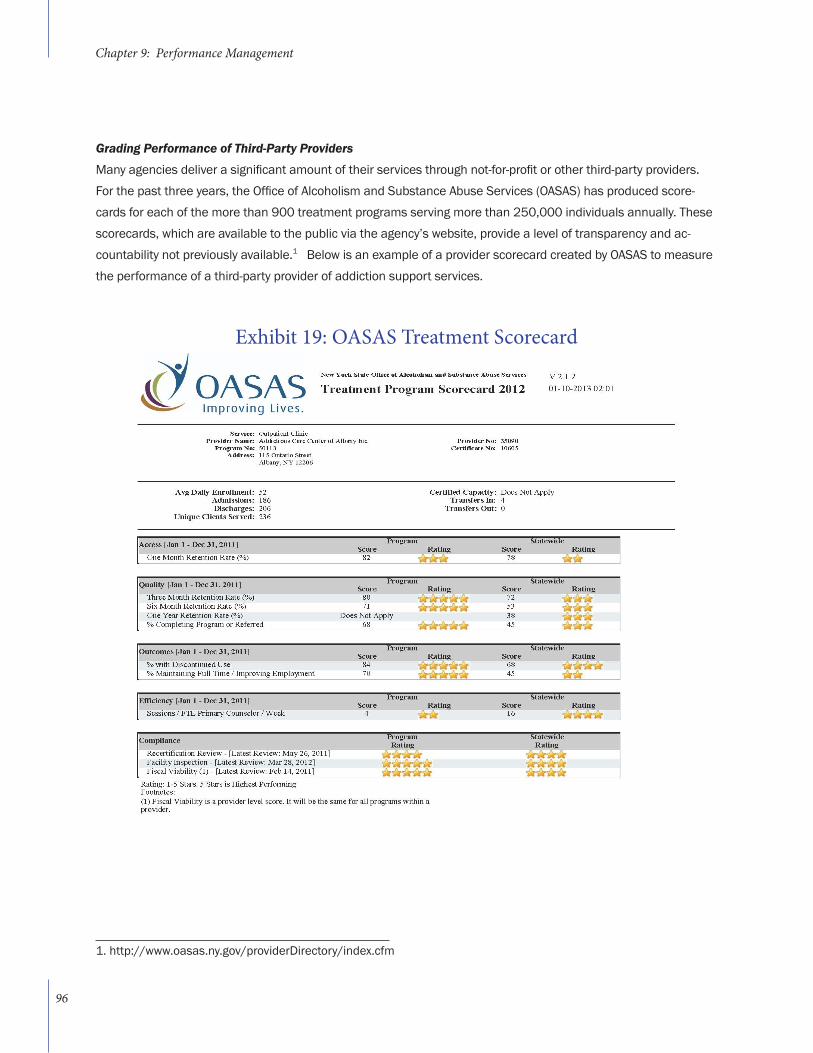
Grading Performance of Third-Party Providers Many agencies deliver a significant amount of their services through not-for-profit or other third-party providers. For the past three years, the Office of Alcoholism and Substance Abuse Services (OASAS) has produced score-cards for each of the more than 900 treatment programs serving more than 250,000 individuals annually. These scorecards, which are available to the public via the agency’s website, provide a level of transparency and ac-countability not previously available.1 Below is an example of a provider scorecard created by OASAS to measure the performance of a third-party provider of addiction support services.
1. http://www.oasas.ny.gov/providerDirectory/index.cfm
Exhibit 19: OASAS Treatment Scorecard
Chapter 9: Performance Management
96
“Pay for Success” Program The Cuomo administration has also been a national leader in the development of the performance-based approach known as “Pay for Success” contracts. These contracts, also known as “social impact bonds,” are an innovative financing mechanism that uses private and philanthropic funding sources. Provided at no risk to taxpayers, funding from these external sources is used to fund initiatives and improve programmatic outcomes in key areas such as human services, public safety, juvenile justice, public health, and others.
Pay for Success contracts will allow the State to deliver preventive services to targeted populations. While such preventive programming can be crucial to avoiding more adverse and expensive long-term outcomes, the State’s current fiscal constraints limit the State’s ability to implement or scale these types of programs.
The State will determine success measures and benchmarks at the outset of the programs funded by the Pay for Success contracts. At the conclusion of the project, the State will contract with an indepen-dent validator to conduct a rigorous evaluation of the program in order to measure outcomes and to determine payment to investors. Under this innovative model, no State payments would be made unless specific performance benchmarks that generate public sector savings are achieved.
Employment training for formerly incarcerated individuals to reduce recidivism, services to reduce homelessness, and home visiting programs to improve children’s health and educational attainment are potential examples of the programming to be provided by Pay for Success contracts. The Governor’s 2013-14 Executive Budget advances this innovative, performance-based public-private sector partner-ship by authorizing up to $100 million in Pay for Success initiatives over the next five years.
Performance Analytics In addition to the performance management efforts described above, the Cuomo administration is also seeking to increase the use of sophisticated analytics to evaluate the performance of agency programs and policies.
One example of this is the Results First model that the State’s Public Safety agency cluster is building to evalu-ate programs and identify options to reduce crime and reduce costs. This type of sophisticated cost benefit computer model has been successfully used in the State of Washington, and New York has received support from the Pew Center for the States to customize the Washington model for its own use.
Chapter 9: Performance Management
97
The Results First model uses empirical data to help identify the combination of programming that buys the most public safety at the lowest cost. For example, New York confines 85,000 individuals in jail and prison and supervises an additional 165,000 in the community. Prison and jail are expensive sanctions, costing $19,000 and $26,000, respectively, for a year’s incarceration. The individuals in the criminal justice system vary from the most risky who are very likely to commit new crimes to lower risk individuals who are not likely to reoffend.
The Results First model is evaluating the policy option of allowing 240 low risk prison inmates to be transitioned to a work release program six months before their release. The hypothesis is that such a measure would have almost no impact on crime, but save the State $1.6 million annually. To carry the analysis further, the Results First model suggests that if these savings were immediately reinvested to provide effective programming to nearly 2,000 high risk offenders who are currently in the community, the model shows that the resulting reductions in the felony crimes would save $5.7 million in future State prison costs.
Review of Public Authorities by the Division of the BudgetAuthorities created under the State Public Authorities Law are independent entities overseen not by the Gov-ernor, but instead by their own boards of directors. The responsibility of these directors was further defined by the Public Authorities Reform Law of 2009 (the “2009 Reform Law”). As is shown in Exhibit 20, 6 of these authorities have activities of a scale that gives them statewide significance and 9 authorities receive a State appropriation of some amount.
Especially when agencies and authorities are both involved in implementing programs in a single policy area, the lack of direct oversight of authorities by the Executive branch makes it very difficult to present an inte-grated view of State government’s performance. For example, there is no integrated reporting that describes the affordable housing activities of the agencies and authorities that comprise New York Homes and Com-munity Renewal or of the energy efficiency activities of the three authorities and one agency that are respon-sible for energy efficiency programs.
Chapter 9: Performance Management
98
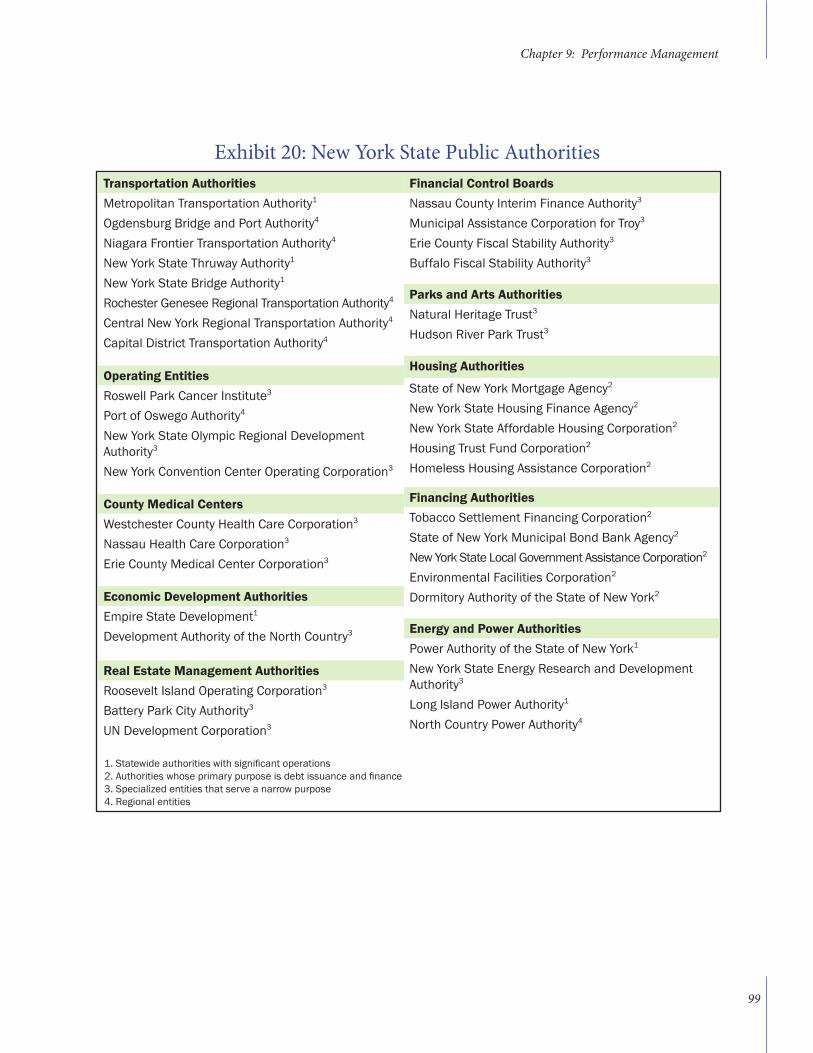
Transportation AuthoritiesMetropolitan Transportation Authority1
Ogdensburg Bridge and Port Authority4
Niagara Frontier Transportation Authority4
New York State Thruway Authority1
New York State Bridge Authority1
Rochester Genesee Regional Transportation Authority4
Central New York Regional Transportation Authority4
Capital District Transportation Authority4
Operating EntitiesRoswell Park Cancer Institute3
Port of Oswego Authority4
New York State Olympic Regional Development Authority3
New York Convention Center Operating Corporation3
County Medical CentersWestchester County Health Care Corporation3
Nassau Health Care Corporation3
Erie County Medical Center Corporation3
Economic Development AuthoritiesEmpire State Development1
Development Authority of the North Country3
Real Estate Management AuthoritiesRoosevelt Island Operating Corporation3
Battery Park City Authority3
UN Development Corporation3
1. Statewide authorities with significant operations2. Authorities whose primary purpose is debt issuance and finance3. Specialized entities that serve a narrow purpose4. Regional entities
Exhibit 20: New York State Public AuthoritiesFinancial Control BoardsNassau County Interim Finance Authority3
Municipal Assistance Corporation for Troy3
Erie County Fiscal Stability Authority3
Buffalo Fiscal Stability Authority3
Parks and Arts AuthoritiesNatural Heritage Trust3
Hudson River Park Trust3
Housing Authorities
State of New York Mortgage Agency2
New York State Housing Finance Agency2
New York State Affordable Housing Corporation2
Housing Trust Fund Corporation2
Homeless Housing Assistance Corporation2
Financing AuthoritiesTobacco Settlement Financing Corporation2
State of New York Municipal Bond Bank Agency2
New York State Local Government Assistance Corporation2
Environmental Facilities Corporation2
Dormitory Authority of the State of New York2
Energy and Power AuthoritiesPower Authority of the State of New York1
New York State Energy Research and Development Authority3
Long Island Power Authority1
North Country Power Authority4
Chapter 9: Performance Management
99
The Public Authorities Reform Commission in 2006 noted that:
“…authorities have not been subject to the control or regulatory oversight and procedural checks and balances that apply to State and local government agencies….There is no single oversight and monitoring agency, a function per-formed by the Division of the Budget with respect to State agencies.”2
The Independent Authority Budget Office (ABO), which was created by the Public Authorities Act of 2005, col-lects a significant amount of financial and other information from authorities, and plays a vital role in fulfilling its statutory mandate of independent oversight of public authorities. Not to replace the role of the ABO, but rather to serve a different function, the Division of the Budget (DOB) should work to provide more visibility into authority operations in order to present an integrated view of State government. Only DOB, with a staff of approximately 300 and its statutory responsibility to report on the finances and operations of State agencies, has the ability to present an integrated view of agency and authority activities. Empowering DOB to review and report on the operations of these public authorities and their 4-year financial plans is essential to improve transparency about authorities and increase the overall efficiency of State government by presenting an integrated view of the activi-ties of both State agencies and authorities, with a particular focus on overlapping programs and functions.
Increasing Transparency through Open New YorkIn addition to using technology to expand the ability of citizens to conduct transactions with State agencies online, the Cuomo administration has also committed to using technology to make State government more transparent, accessible and accountable. The Governor’s CitizenConnects website has served as an “online town hall” to pro-mote public engagement and provides access to schedules and public meeting information. The comprehensive Tappan Zee Bridge website provides access to all prior project reports along with up-to-date construction informa-tion that complements unprecedented in-person outreach, “TheNewNY.com” provides comprehensive and easy-to-navigate information on starting and maintaining a business in New York State, and the Regional Economic Development Council website makes public detailed information on economic development projects. The monthly Medicaid Redesign Team global spending report allows the public to track spending by sector and understand any deviations from targets.
In the 2013 State of the State address, Governor Cuomo announced the “Open New York” initiative to further expand the use of technology to improve government transparency and increase citizen access to statewide and agency-level data, reports, statistics, compilations and information. Under the Open New York initiative, data will be presented in a common, downloadable, easy-to-access format, and will be searchable and mappable.
2 http://www.abo.ny.gov/commissionPublicAuth/FinalReport.pdf
Chapter 9: Performance Management
100
The Open New York web portal will allow researchers, citizens, business and the media direct access to high-value data, which will be continually added to and expanded, so these groups can use the data to innovate for the benefit of all New Yorkers. Budget data is now posted online in machine-readable and graphical formats, making access easier and more impactful for citizens and researchers alike. Providing detailed spending and budget information allows government employees and the public to locate inefficiencies and duplicate expens-es. Putting government data online also reduces the expenses associated with producing paper documents in response to Freedom of Information Law (“FOIL”) requests.
A good example of the potential benefits from releasing non-confidential government data of is the METRIX website created by the Department of Health in 2011. METRIX, which stands for Maximizing Essential Tools for Research Innovation and eXcellence, includes unique datasets that touch on all aspects of health care. While some of these datasets are limited in scope and permissible use, others have many new potential applications, and collectively represent an immense untapped resource for the improvement of public health. The METRIX site has also increased efficiency within DOH by substantially reducing the number of freedom of information law requests.
The State is also exploring ways to encourage developers to build software products or “apps” that leverage the value of these non-confidential data sets. This could be done in part through a program similar to NYC’s “Big Apps” competition. This competition judges apps that use city data to improve NYC and has led to the creation of dozens of useful apps that help citizens do everything from picking a restaurant to finding a parking space.
Chapter 9: Performance Management
101
Framework for a Core Mission Review
The final part of the SAGE charter is to “identify non-critical activities that are less central to the core mission of agencies or New York State government.” There are at least four areas in which it makes sense to review whether an activity is central to the core mission of State government in the way it is being pursued:
• Unnecessary Statutory Mandates – activities performed by agencies that are unnecessary but required by statute.
• Commercial Activities – activities either typically engaged in by commercial enterprises or not com-monly performed by other State governments.
• Competitive Benchmarking – functions or services that would be provided more efficiently by a private entity.
• Underutilized Assets – waste and suboptimal use of State assets.
Regulatory Relief from Unnecessary Statutory MandatesThe Governor’s Mandate Relief Council is designed to identify burdensome mandates on local governments and school districts, but State agencies are also subject to federal and State statutory mandates that are burden-some and which do not meaningfully contribute to the core mission of the affected agencies. Although many of these mandates involve federal law and are thus more difficult to change, State statutory requirements to produce reports which have not been read in years, for example, are unnecessarily burdensome and require an extraneous and costly use of State resources.
Because it is difficult to associate a fiscal impact with these regulations, the 2013-14 Executive Budget was not the appropriate vehicle for addressing these mandates. However, as part of a broader mandate relief package for local governments, such unnecessary mandates on State agencies could also be considered.
Commercial ActivitiesWhen State government is performing a function that typically is provided by commercial enterprises, it raises the ques-tion whether the State should be pursuing that activity. Two such instances have been discussed earlier in this report.
• The Olympic Regional Development Authority (ORDA) manages ski centers and other recreation facilities. On its face, this might not seem to be related to the core mission of State government. However, ORDA is an important economic development center in the North Country, and the Bel-leayre Ski Center plays an important economic development role in the Catskills. For these reasons, as well as constitutional limits on private entities operating on these State lands, it makes sense for the State to continue to operate these enterprises.
CHAPTER 10: Core Mission and Implementation
102
• The Long Island Power Authority (LIPA) owns a power transmission and distribution network, which is normally the province of private sector utilities. As described in Chapter 4, the bifurcated organizational structure was ill-equipped to manage this operation and its inability to do so led to significant problems during Hurricane Sandy. As a result, the Moreland Commission appointed by Governor Cuomo to examine LIPA recommended that it be privatized.
There are two other examples of State activities which involve a significant use of State assets in activities that are more commonly provided by the private sector. The State Insurance Fund (SIF) provides workers’ com-pensation insurance and accounts for approximately 40% of that market in New York. The State of New York Mortgage Insurance Fund (MIF), which insures mortgages on multifamily housing, is also engaged in activities that typically are performed by the private sector.
• SIF currently has a competitive advantage to commercial carriers due to the fact that SIF has previ-ously reserved for certain assessments while commercial carriers fund these assessments on a pay-as-you-go basis. As part of a broader set of reforms of the workers’ compensation system that will significantly reduce costs for employers, approximately $2.0 billion of these SIF assessment reserves will be released. In the future, SIF will fund these obligations on a pay-as-you-go basis, identical to the practice of commercial carriers.
• The MIF has approximately $1.5 billion in assets as reserves against losses in the mortgages it insures, but experiences only about $20 million in claims annually. In order to make more efficient use of these State assets and significantly expand the State’s affordable housing program, the 2013-14 Executive Budget contemplates the use of some of these excess MIF reserves over the next several years to fund a range of programs to build, support and preserve affordable housing.
Competitive BenchmarkingA range of functions that are performed by State agencies are also provided by the private sector. Indeed, the State now uses a mixed approach of public and private sector service delivery for functions ranging from call centers to community-based residential care. Despite the large number of situations in which the State uses both the public and private sector to perform the function, the State does not have explicit criteria to determine whether to contract activities out, nor does it regularly review its functions to identify where out-side contracting makes sense.
Chapter 10: Core Mission and Implementation
103
Some states, such as Indiana, systematically benchmark what outside contractors might charge for services compared to the cost of having State employees perform the function. This analysis requires a strong cost accounting framework, but this framework could also be applied to a wide variety of other activities, func-tions and programs. To be useful, “competitive benchmarking” should take into account a wide range of factors, including total costs (including hourly rates, fringe benefits, etc.), quality, productivity, uniqueness of capabilities, and flexibility.
Underutilized Assets The State has significant assets that are underutilized. In some cases, the underutilization of the asset simply amounts to waste--such as the recently reported story of the 20 train cars and locomotives that were sitting and rusting for almost a decade. Until they were discovered by the Cuomo administration, no effort was made to dispose of the trains since the State abandoned efforts to modernize a set of 1970s-era high-speed Amtrak commuter trains. The Cuomo administration took the initiative to eliminate this unnecessary cost to taxpayers by auctioning the trains off, thus relieving the State of the storage costs that it previously incurred.1
In other cases, the challenge of maximizing the asset involved is more complicated. One such example is the Erie Canal (operated by the Canal Corporation, a subsidiary of the Thruway Authority), which many believe could more effectively leverage its assets, including its rights of way, frontage property, water and hydro power rights, and flood control activities, to garner new sources of revenue.
In 2009, the New York State Commission on Asset Maximization conducted an extensive review of the State’s underutilized assets and issued a number of recommendations for maximizing their value.2 The Cuomo adminis-tration adopted, through the new Enterprise Services real estate function in OGS, one of the Asset Maximization Commission’s recommendations—that the State “centralize authority in managing the State’s real estate needs, reviewing the State’s portfolio of current assets, and developing a systematic strategy for making asset manage-ment, sales, and leasing decisions in a manner that will maximize the value of State assets.”
Align Roles with Local GovernmentsState and local governments share many functions and the most efficient jurisdiction to manage these func-tions ought to be periodically reviewed. For example, the State recently decided that it could more efficiently manage the administration of Medicaid than counties and New York City, as is currently the case. Other func-tions now managed by the counties, such as eligibility for the Supplemental Nutrition Assistance Program, might also or efficiently be administered by the State. In other situations, such as inspection of childcare facili-ties, the State manages the function for all counties outside of New York City.
1. See “ Trains’ final destination: Scrap”, Albany Times Union, December 13, 2012. 2. http://www.bcnys.org/inside/transport/2011/StateAssetMaximaztion-final-report2009.pdf
Chapter 10: Core Mission and Implementation
104
On the other hand, there may be situations in which the greater knowledge of local conditions makes it more efficient and effective for local government to manage the function. For example, DEC has a memorandum of understanding with New York City to control a portion of the Inactive Hazardous Waste Disposal and petroleum spill sites/brownfields program. Similarly, the Parks department turns some decision-making regarding historic registers over to many of the larger communities in the State when federal HUD funding is involved, to take advantage of their greater local knowledge. In addition to overlapping jurisdiction with respect to State agencies regarding certain waterfront development, local zoning permits often must also be obtained. The State should continue to explore opportunities where devolving authority to local governments makes sense.
ImplementationThe McKinsey study of government transformation efforts in other states noted the critical importance of a well-de-fined implementation plan for transforming ideas into actionable results. In addition, the SAGE Commission believes it is important for the State to institutionalize the process of pursuing continuous improvement in State operations.
The SAGE Commission believes these objectives can be accomplished through a strategy that combines inter-nal resources and innovative ways of partnering with private sector experts who can help drive transformation and improvement efforts within government.
Internal Implementation Efforts Because the government redesign effort described in this report is so comprehensive, implementation efforts involve a large number of State agencies, as well as personnel in the Executive Chamber and the Division of Budget. These individuals will be supplemented by the following two dedicated teams:
• A performance management unit to work with agencies and support the NY Performs system; and
• Initially, 1-2 “LEAN process” professionals to work with agencies to help identify areas for improve-ment and map out implementation plans.
As described in Chapter 9, the best practice states of Virginia and Washington have a dedicated staff to man-age their performance management systems. New York will provide 3-5 analysts to stand up the NY Performs system and maintain the system over time. The responsibilities of the performance management unit will be similar to that of their counterparts in Washington and Virginia.
Chapter 10: Core Mission and Implementation
105
A small group of LEAN professionals can run an effective LEAN process with various agencies throughout the year, such as Iowa’s Office of LEAN Enterprise, which has accomplished a similar mission with a 2 person staff. Since 2003, Iowa has redesigned 178 business processes within its agencies to realize efficiencies and improve service.
Private Sector Partners
Civic Consulting Alliance
The State will seek to establish a partnership with New York based corporations and consulting firms to leverage their expertise on a pro-bono basis for various government redesign projects. This effort could involve a “volunteer consultant” program such as Chicago’s Civic Consulting Alliance (CCA), an organiza-tion which has shown an interest in expanding into New York and helping develop such an effort.
The CCA is a non-profit organization, established in 1986, which works with the city of Chicago to build pro-bono teams of business experts and government leaders who work on small, discrete projects designed to improve the city. These projects are staged to create a sequence of results that, over time, address critical needs and opportunities for city government.
Executive Loan Program
The State could also seek to develop partnerships with private sector executives with relevant skills through an Executive Loan program. Many of New York’s largest corporations have been through a trans-formation process similar to the one New York State is engaged in. With appropriate safeguards to avoid any conflicts of interest with companies doing business with the State, the participation of even a small number of executives with experience in these areas would be highly beneficial.
Chapter 10: Core Mission and Implementation
106
EXECUTIVE ORDER NO. 4: ESTABLISHING THE SPENDING AND GOVERNMENT EFFICIENCY (SAGE) COMMISSION
WHEREAS, instead of an efficient, sensible system of government, New York State has numerous agen-cies, authorities and other bodies whose jurisdiction overlaps, resulting in a waste of taxpayers’ money, impeding New York State government’s ability to formulate public policy and undermining its capacity to efficiently deliver necessary services;
WHEREAS, since the completion of the last comprehensive governmental reorganization in 1927, New York State government has enlarged its workforce from 29,000 to more than 190,000 and increased its annual budget from $239 million to $135 billion;
WHEREAS, this growth has been accompanied by an explosion in the number of agencies and public authorities so that today, there exist close to 1,000 State agencies, authorities, commissions and other statuto-rily created bodies;
WHEREAS, New York State government now faces unprecedented budgetary challenges that require fundamental changes in the way it does business, including eliminating failed approaches and creating improved ways to serve the public;
WHEREAS, it is incumbent on those charged with providing government services to protect the public’s health and safety, educate our citizens, promote economic development, provide necessary infrastructure, safe-guard fundamental rights and perform other essential functions in a manner that avoids duplication, delay and unnecessary regulation and bureaucracy;
WHEREAS, New York State has many business leaders with experience in restructuring complex organi-zations and educational and other non-profit institutions with the knowledge and expertise necessary to improve the operations and accountability of government;
APPENDIX A: Executive Order No. 4 Establishing the SAGE Commission
APPENDICES
107
WHEREAS, it is of compelling public importance that New York State undertake a redesign of its inef-ficient and outdated State government structure and operations by doing a comprehensive review of every agency of State government and recommending structural and operational changes in the government; and
WHEREAS, such a review will allow for the elimination or more efficient organization of duplicative, outdated, unnecessary and ineffective agencies and authorities and provide for operational improvements so that government functions effectively and serves taxpayers at the lowest cost with the greatest value;
NOW, THEREFORE, I, Andrew M. Cuomo, Governor of the State of New York, by virtue of the authority vested in me by the Constitution and laws of the State of New York, do hereby order as follows:
A. Definitions
As used herein, the following terms shall have the following meanings:
1. “State agency” or “agency” shall mean any State agency, department, office, board, bureau, division, committee, council or office.
2. “Public authority” or “authority” shall mean a public authority or public benefit corporation created by or existing under any New York State law, with one or more of its members appointed by the Governor or who serve as members by virtue of holding a civil office of New York State, other than an interstate or international authority or public benefit corporation, including any subsidiaries of such public authority or public benefit corpora-tion.
B. Spending and Government Efficiency Commission
1. There is hereby established the Spending and Government Efficiency Commission (“SAGE Commis-sion”) that shall exist to provide independent guidance for, and advice to, the Governor
2. The Governor shall appoint up to 20 voting members of the SAGE Commission. The members of the SAGE Commission shall include: private citizens; two members of the New York State Assembly, one recom-mended by the Speaker of the Assembly and one recommended by the Minority Leader of the Assembly; and two members of the New York State Senate, one recommended by the Temporary President of the Senate and one recommended by the Minority Leader of the Senate. The Director of State Agency Redesign and Efficiency shall serve as a Co-Chair of the SAGE Commission and will be responsible for managing any staff whom the Governor shall appoint. The Governor shall designate one or more additional Co-Chairs from among the other members of the SAGE Commission. The SAGE Commission shall be authorized to create sub-committees and task forces that include individuals who are not members of the SAGE Commission, provided that any recommendation of such
Appendices
108
Appendices
sub-committees and task forces must be approved by the SAGE Commission before being sent to the Governor. The Director of the Division of the Budget and the Director of State Operations shall serve as ex officio, non-voting members of the Commission.
3. Vacancies shall be filled by the Governor, and the Governor may appoint additional members to the SAGE Commission as necessary. Members of the SAGE Commission shall serve at the pleasure of the Governor.
4. A majority of the total members of the SAGE Commission who have been appointed shall constitute a quorum, and all recommendations of the SAGE Commission shall require approval of a majority of its total mem-bers appointed by the Governor.
5. The SAGE Commission shall attempt to engage and solicit the input of a broad and diverse range of groups, organizations, and individuals, including, without limitation, members of the New York State Legislature and representatives of public sector employees.
C. Cooperation with the SAGE Commission
1. Every agency or authority of New York State shall provide to the SAGE Commission every assistance and cooperation, including use of New York State facilities, which may be necessary or desirable to fulfill the pur-poses of this Executive Order.
2. Staff support necessary for the conduct of the SAGE Commission’s work may be furnished by agen-cies and authorities (subject to the approval of the boards of directors of such authorities). Additional funding nec-essary for the Commission’s work shall be provided from sources, including appropriated funds, to the extent of available appropriations. The SAGE Commission may draw upon the human resources, expertise and funding of private institutions, including those institutions associated with individuals appointed to the SAGE Commission, as those private institutions deem appropriate, and as consistent with all statutes, rules and guidance from the New York State Commission on Public Integrity regarding such assistance. Such assistance shall be provided without financial remuneration and shall not be provided under any circumstances that would create an actual conflict of interest, or the appearance of such a conflict.
D. Duties and Purpose
1. The SAGE Commission shall comprehensively review and assess New York State government, includ-ing, but not limited to, its structures, operations and processes for governing, with the goal of saving taxpayer money, increasing accountability and improving the delivery of government services. This review shall also include a review of commissions, task forces and councils created by Executive Order or otherwise.
109
2. The SAGE Commission is charged with redesigning the organizational structure of government by streamlining, consolidating or eliminating redundant and unnecessary agencies, authorities, commissions and other bodies that have overlapping missions; identifying operational improvements that increase cost effective-ness and improve service quality such as shared services, enhanced use of Information Technology and changes in service delivery mechanisms; creating meaningful metrics and targets to highlight inefficiencies; and identify-ing activities that are not central to the core mission of agencies, authorities or New York State government. The SAGE Commission shall be asked to make recommendations that, if implemented, would result in the reduction of at least 20 % of the number of existing agencies and authorities.
3. The SAGE Commission shall also examine ways for the government to be more flexible, transparent, user-friendly and accountable to residents of New York State, including, without limitation, by developing a perfor-mance management system with meaningful and transparent metrics and targets.
4. The SAGE Commission shall commence its work not later than January 7, 2011. The SAGE Com-mission shall submit its recommendations on agency and authority reorganizations not later than May 1, 2011 or such other date as the Governor shall advise the SAGE Commission. It shall submit its recommendations for operational efficiencies on an ongoing basis, with a final report to be presented to the Governor on or before June 1, 2012 or such other date as the Governor shall advise the SAGE Commission. The SAGE Commission shall ter-minate its work and be relieved of all responsibilities and duties hereunder with the submission of its final report.
G I V E N under my hand and the Privy Seal of the State in the City of Albany this fifth day of January in the year two thousand eleven.
BY THE GOVERNOR
Secretary to the Governor
Appendices
110
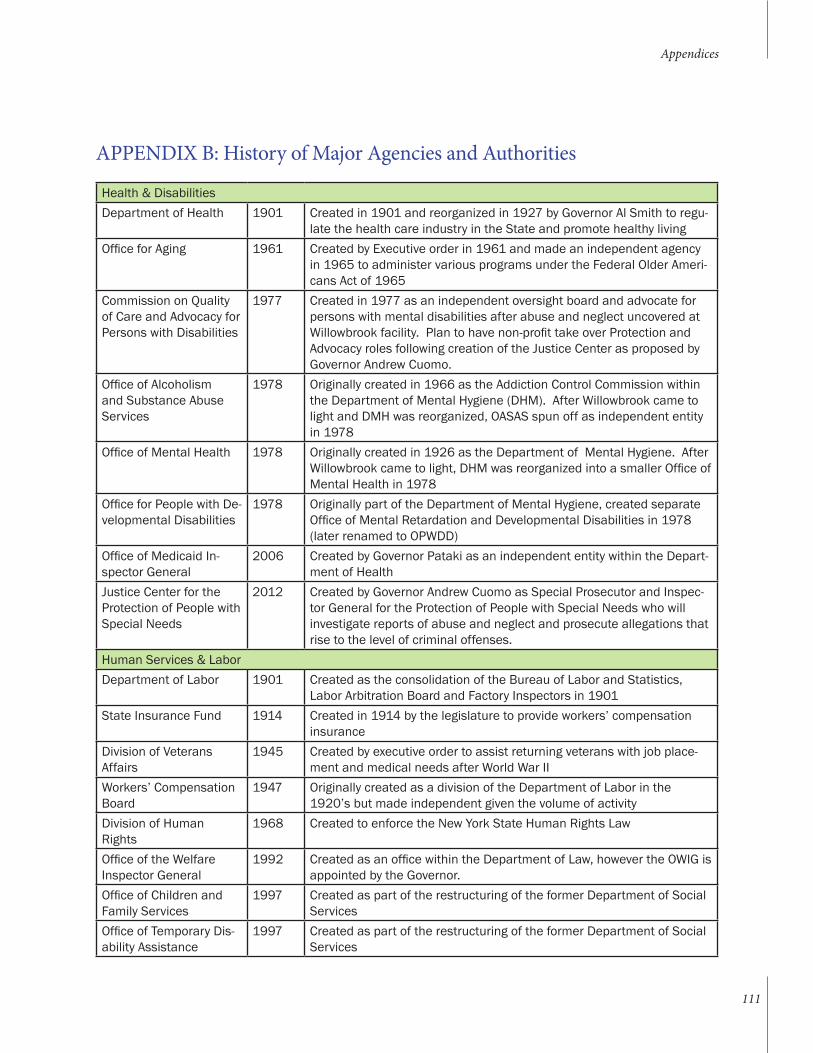
APPENDIX B: History of Major Agencies and Authorities
Health & DisabilitiesDepartment of Health 1901 Created in 1901 and reorganized in 1927 by Governor Al Smith to regu-
late the health care industry in the State and promote healthy livingOffice for Aging 1961 Created by Executive order in 1961 and made an independent agency
in 1965 to administer various programs under the Federal Older Ameri-cans Act of 1965
Commission on Quality of Care and Advocacy for Persons with Disabilities
1977 Created in 1977 as an independent oversight board and advocate for persons with mental disabilities after abuse and neglect uncovered at Willowbrook facility. Plan to have non-profit take over Protection and Advocacy roles following creation of the Justice Center as proposed by Governor Andrew Cuomo.
Office of Alcoholism and Substance Abuse Services
1978 Originally created in 1966 as the Addiction Control Commission within the Department of Mental Hygiene (DHM). After Willowbrook came to light and DMH was reorganized, OASAS spun off as independent entity in 1978
Office of Mental Health 1978 Originally created in 1926 as the Department of Mental Hygiene. After Willowbrook came to light, DHM was reorganized into a smaller Office of Mental Health in 1978
Office for People with De-velopmental Disabilities
1978 Originally part of the Department of Mental Hygiene, created separate Office of Mental Retardation and Developmental Disabilities in 1978 (later renamed to OPWDD)
Office of Medicaid In-spector General
2006 Created by Governor Pataki as an independent entity within the Depart-ment of Health
Justice Center for the Protection of People with Special Needs
2012 Created by Governor Andrew Cuomo as Special Prosecutor and Inspec-tor General for the Protection of People with Special Needs who will investigate reports of abuse and neglect and prosecute allegations that rise to the level of criminal offenses.
Human Services & LaborDepartment of Labor 1901 Created as the consolidation of the Bureau of Labor and Statistics,
Labor Arbitration Board and Factory Inspectors in 1901State Insurance Fund 1914 Created in 1914 by the legislature to provide workers’ compensation
insuranceDivision of Veterans Affairs
1945 Created by executive order to assist returning veterans with job place-ment and medical needs after World War II
Workers’ Compensation Board
1947 Originally created as a division of the Department of Labor in the 1920’s but made independent given the volume of activity
Division of Human Rights
1968 Created to enforce the New York State Human Rights Law
Office of the Welfare Inspector General
1992 Created as an office within the Department of Law, however the OWIG is appointed by the Governor.
Office of Children and Family Services
1997 Created as part of the restructuring of the former Department of Social Services
Office of Temporary Dis-ability Assistance
1997 Created as part of the restructuring of the former Department of Social Services
Appendices
111
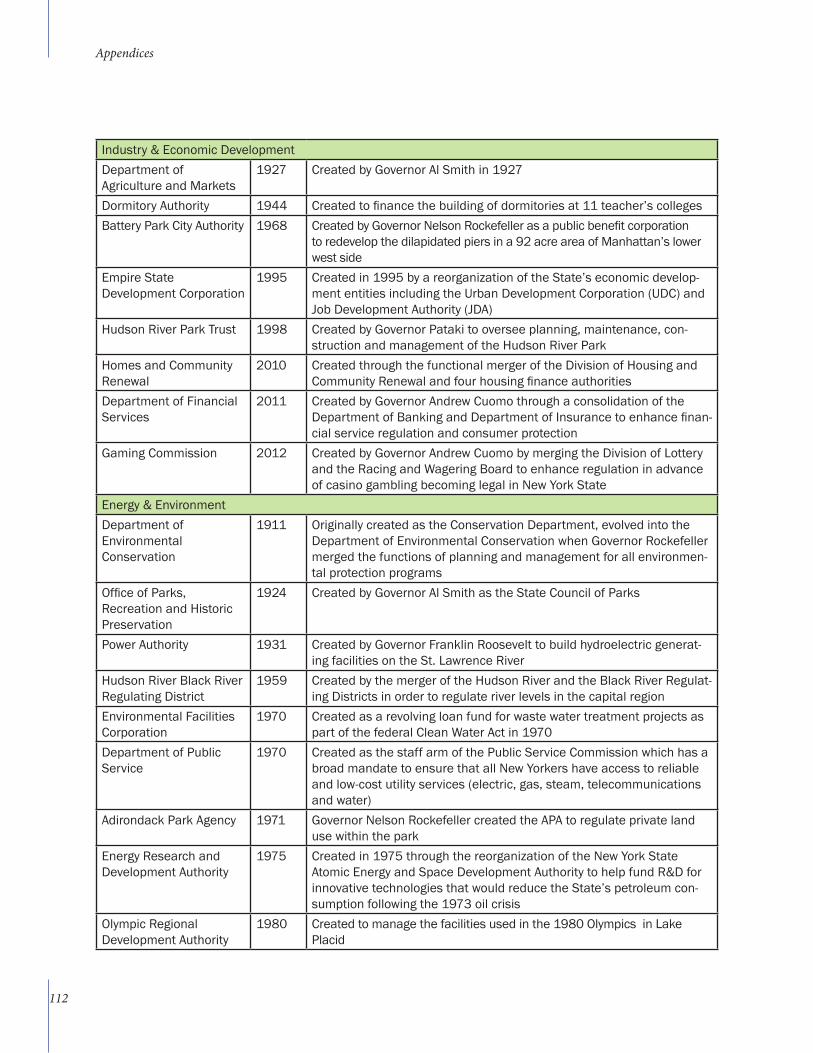
Industry & Economic DevelopmentDepartment of Agriculture and Markets
1927 Created by Governor Al Smith in 1927
Dormitory Authority 1944 Created to finance the building of dormitories at 11 teacher’s collegesBattery Park City Authority 1968 Created by Governor Nelson Rockefeller as a public benefit corporation
to redevelop the dilapidated piers in a 92 acre area of Manhattan’s lower west side
Empire State Development Corporation
1995 Created in 1995 by a reorganization of the State’s economic develop-ment entities including the Urban Development Corporation (UDC) and Job Development Authority (JDA)
Hudson River Park Trust 1998 Created by Governor Pataki to oversee planning, maintenance, con-struction and management of the Hudson River Park
Homes and Community Renewal
2010 Created through the functional merger of the Division of Housing and Community Renewal and four housing finance authorities
Department of Financial Services
2011 Created by Governor Andrew Cuomo through a consolidation of the Department of Banking and Department of Insurance to enhance finan-cial service regulation and consumer protection
Gaming Commission 2012 Created by Governor Andrew Cuomo by merging the Division of Lottery and the Racing and Wagering Board to enhance regulation in advance of casino gambling becoming legal in New York State
Energy & EnvironmentDepartment of Environmental Conservation
1911 Originally created as the Conservation Department, evolved into the Department of Environmental Conservation when Governor Rockefeller merged the functions of planning and management for all environmen-tal protection programs
Office of Parks, Recreation and Historic Preservation
1924 Created by Governor Al Smith as the State Council of Parks
Power Authority 1931 Created by Governor Franklin Roosevelt to build hydroelectric generat-ing facilities on the St. Lawrence River
Hudson River Black River Regulating District
1959 Created by the merger of the Hudson River and the Black River Regulat-ing Districts in order to regulate river levels in the capital region
Environmental Facilities Corporation
1970 Created as a revolving loan fund for waste water treatment projects as part of the federal Clean Water Act in 1970
Department of Public Service
1970 Created as the staff arm of the Public Service Commission which has a broad mandate to ensure that all New Yorkers have access to reliable and low-cost utility services (electric, gas, steam, telecommunications and water)
Adirondack Park Agency 1971 Governor Nelson Rockefeller created the APA to regulate private land use within the park
Energy Research and Development Authority
1975 Created in 1975 through the reorganization of the New York State Atomic Energy and Space Development Authority to help fund R&D for innovative technologies that would reduce the State’s petroleum con-sumption following the 1973 oil crisis
Olympic Regional Development Authority
1980 Created to manage the facilities used in the 1980 Olympics in Lake Placid
Appendices
112
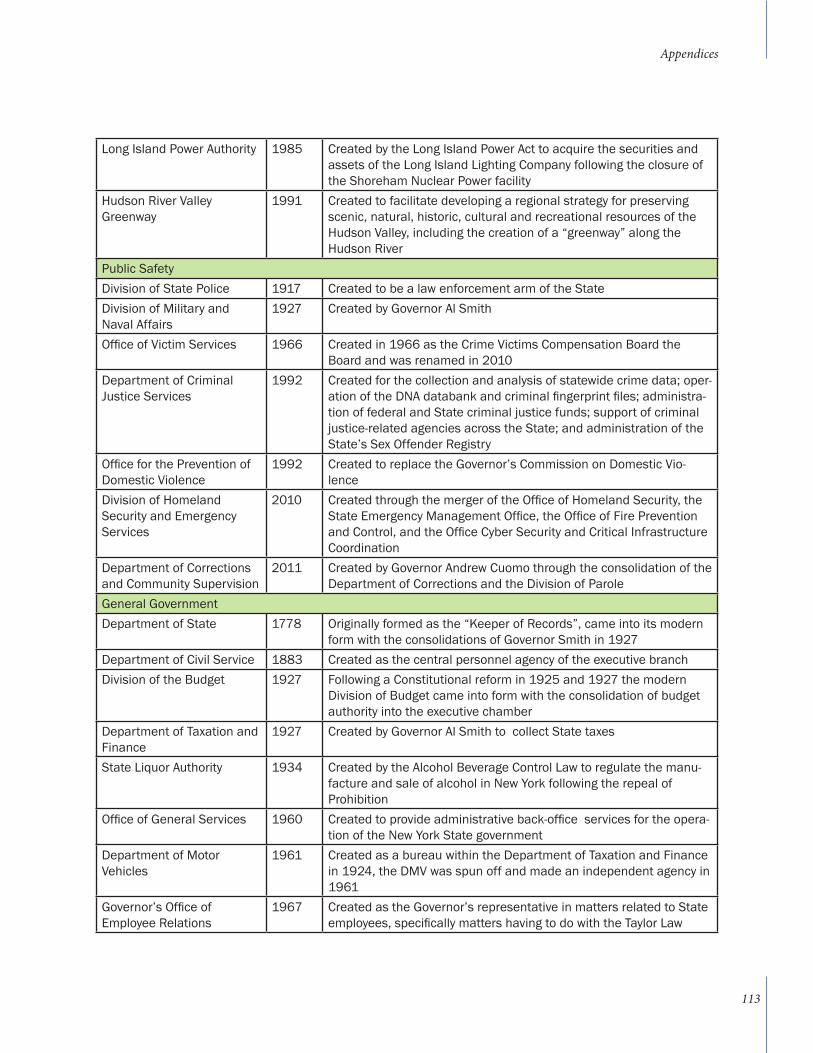
Long Island Power Authority 1985 Created by the Long Island Power Act to acquire the securities and assets of the Long Island Lighting Company following the closure of the Shoreham Nuclear Power facility
Hudson River Valley Greenway
1991 Created to facilitate developing a regional strategy for preserving scenic, natural, historic, cultural and recreational resources of the Hudson Valley, including the creation of a “greenway” along the Hudson River
Public SafetyDivision of State Police 1917 Created to be a law enforcement arm of the StateDivision of Military and Naval Affairs
1927 Created by Governor Al Smith
Office of Victim Services 1966 Created in 1966 as the Crime Victims Compensation Board the Board and was renamed in 2010
Department of Criminal Justice Services
1992 Created for the collection and analysis of statewide crime data; oper-ation of the DNA databank and criminal fingerprint files; administra-tion of federal and State criminal justice funds; support of criminal justice-related agencies across the State; and administration of the State’s Sex Offender Registry
Office for the Prevention of Domestic Violence
1992 Created to replace the Governor’s Commission on Domestic Vio-lence
Division of Homeland Security and Emergency Services
2010 Created through the merger of the Office of Homeland Security, the State Emergency Management Office, the Office of Fire Prevention and Control, and the Office Cyber Security and Critical Infrastructure Coordination
Department of Corrections and Community Supervision
2011 Created by Governor Andrew Cuomo through the consolidation of the Department of Corrections and the Division of Parole
General GovernmentDepartment of State 1778 Originally formed as the “Keeper of Records”, came into its modern
form with the consolidations of Governor Smith in 1927Department of Civil Service 1883 Created as the central personnel agency of the executive branchDivision of the Budget 1927 Following a Constitutional reform in 1925 and 1927 the modern
Division of Budget came into form with the consolidation of budget authority into the executive chamber
Department of Taxation and Finance
1927 Created by Governor Al Smith to collect State taxes
State Liquor Authority 1934 Created by the Alcohol Beverage Control Law to regulate the manu-facture and sale of alcohol in New York following the repeal of Prohibition
Office of General Services 1960 Created to provide administrative back-office services for the opera-tion of the New York State government
Department of Motor Vehicles
1961 Created as a bureau within the Department of Taxation and Finance in 1924, the DMV was spun off and made an independent agency in 1961
Governor’s Office of Employee Relations
1967 Created as the Governor’s representative in matters related to State employees, specifically matters having to do with the Taylor Law
Appendices
113
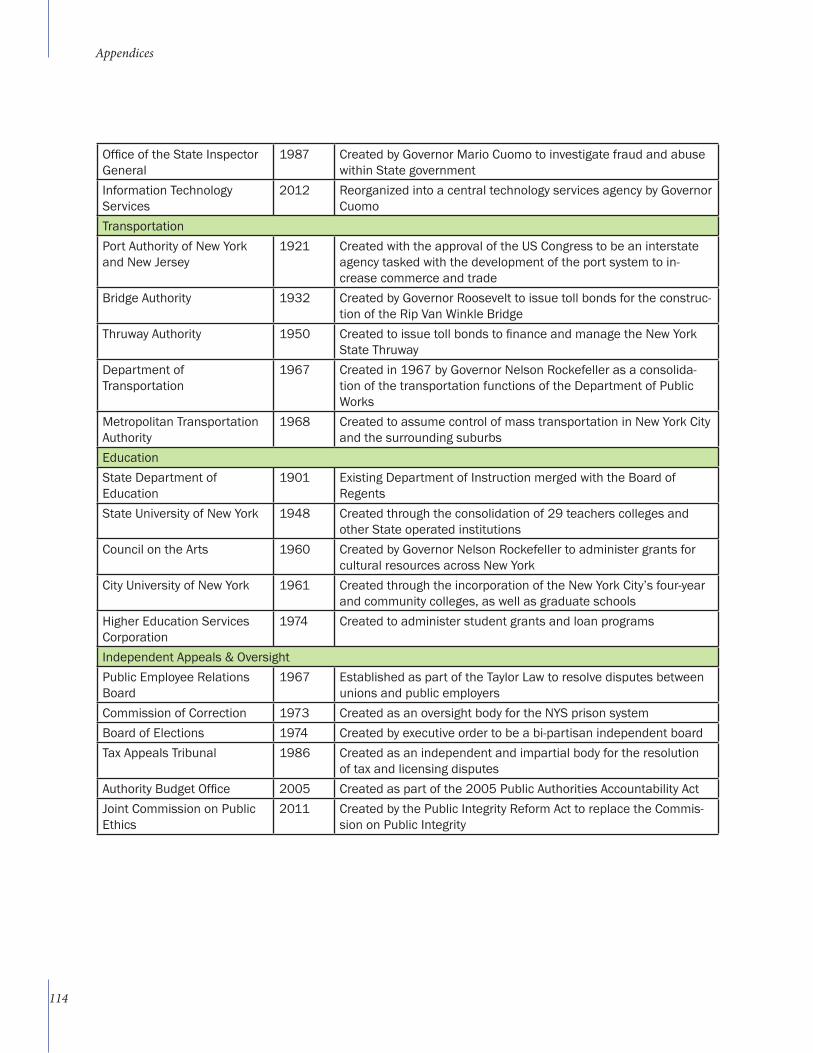
Appendices
Office of the State Inspector General
1987 Created by Governor Mario Cuomo to investigate fraud and abuse within State government
Information Technology Services
2012 Reorganized into a central technology services agency by Governor Cuomo
TransportationPort Authority of New York and New Jersey
1921 Created with the approval of the US Congress to be an interstate agency tasked with the development of the port system to in-crease commerce and trade
Bridge Authority 1932 Created by Governor Roosevelt to issue toll bonds for the construc-tion of the Rip Van Winkle Bridge
Thruway Authority 1950 Created to issue toll bonds to finance and manage the New York State Thruway
Department of Transportation
1967 Created in 1967 by Governor Nelson Rockefeller as a consolida-tion of the transportation functions of the Department of Public Works
Metropolitan Transportation Authority
1968 Created to assume control of mass transportation in New York City and the surrounding suburbs
EducationState Department of Education
1901 Existing Department of Instruction merged with the Board of Regents
State University of New York 1948 Created through the consolidation of 29 teachers colleges and other State operated institutions
Council on the Arts 1960 Created by Governor Nelson Rockefeller to administer grants for cultural resources across New York
City University of New York 1961 Created through the incorporation of the New York City’s four-year and community colleges, as well as graduate schools
Higher Education Services Corporation
1974 Created to administer student grants and loan programs
Independent Appeals & OversightPublic Employee Relations Board
1967 Established as part of the Taylor Law to resolve disputes between unions and public employers
Commission of Correction 1973 Created as an oversight body for the NYS prison system Board of Elections 1974 Created by executive order to be a bi-partisan independent boardTax Appeals Tribunal 1986 Created as an independent and impartial body for the resolution
of tax and licensing disputesAuthority Budget Office 2005 Created as part of the 2005 Public Authorities Accountability ActJoint Commission on Public Ethics
2011 Created by the Public Integrity Reform Act to replace the Commis-sion on Public Integrity
114
Appendices
The following series of charts outlines the organizational structure of the New York State government, including all 406 agencies, authorities, boards, and commissions, at the time Governor Cuomo took office in 2011.
APPENDIX C: Comprehensive List of New York State Organization Charts
115
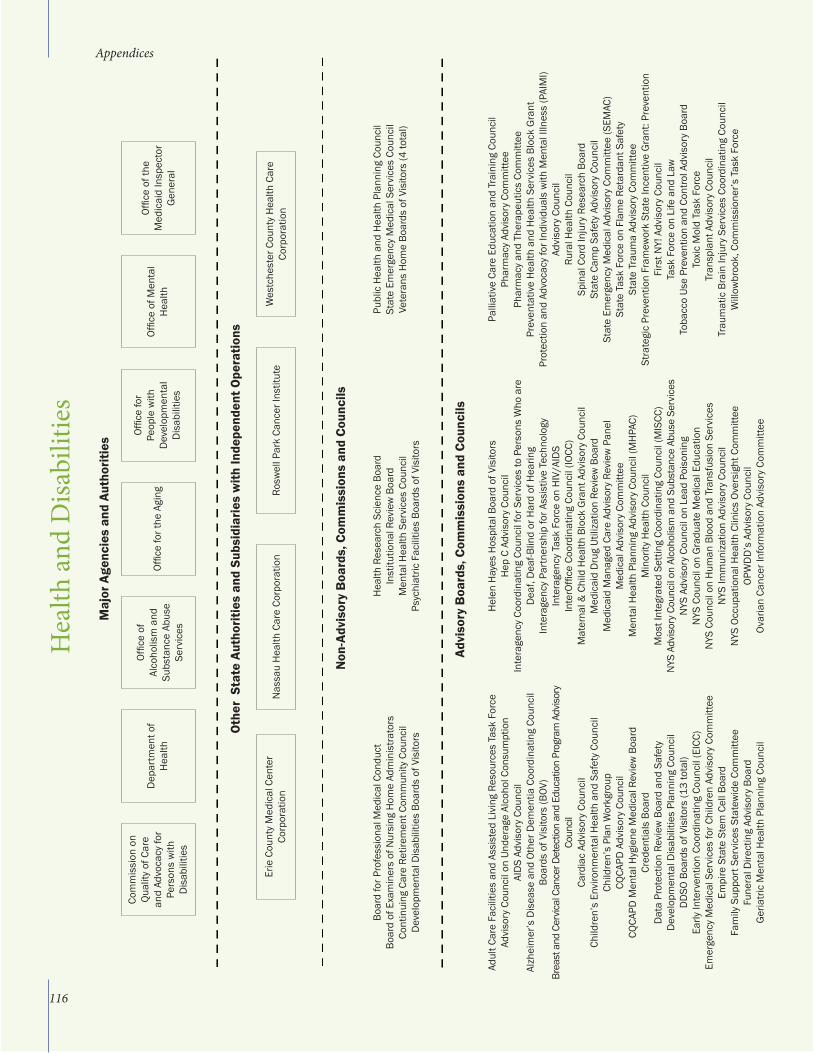
Hea
lth a
nd D
isabi
litie
sM
ajor
Age
ncie
s an
d Au
thor
ities
Com
mis
sion
on
Qual
ity o
f Car
e an
d Ad
voca
cy fo
r Pe
rson
s w
ith
Dis
abili
ties
Dep
artm
ent o
f H
ealth
Offic
e of
Al
coho
lism
and
Su
bsta
nce
Abus
e Se
rvic
es
Offic
e fo
r the
Agi
ng
Offic
e fo
r Pe
ople
with
D
evel
opm
enta
l D
isab
ilitie
s
Offic
e of
Men
tal
Hea
lth
Offic
e of
the
Med
icai
d In
spec
tor
Gen
eral
Oth
er S
tate
Aut
horit
ies
and
Subs
idia
ries
with
Inde
pend
ent O
pera
tions
Erie
Cou
nty
Med
ical
Cen
ter
Corp
orat
ion
Nas
sau
Hea
lth C
are
Corp
orat
ion
Rosw
ell P
ark
Canc
er In
stitu
te
Wes
tche
ster
Cou
nty
Hea
lth C
are
Corp
orat
ion
Non
-Adv
isor
y B
oard
s, C
omm
issi
ons
and
Coun
cils
Boar
d fo
r Pro
fess
iona
l Med
ical
Con
duct
Boar
d of
Exa
min
ers
of N
ursi
ng H
ome
Adm
inis
trato
rsCo
ntin
uing
Car
e Re
tirem
ent C
omm
unity
Cou
ncil
Dev
elop
men
tal D
isab
ilitie
s Bo
ards
of V
isito
rs
Adul
t Car
e Fa
cilit
ies
and
Assi
sted
Liv
ing
Reso
urce
s Ta
sk F
orce
Advi
sory
Cou
ncil
on U
nder
age
Alco
hol C
onsu
mpt
ion
AID
S Ad
viso
ry C
ounc
ilAl
zhei
mer
’s D
isea
se a
nd O
ther
Dem
entia
Coo
rdin
atin
g Co
unci
lBo
ards
of V
isito
rs (B
OV)
Brea
st a
nd C
ervic
al C
ance
r Det
ectio
n an
d Ed
ucat
ion
Prog
ram
Adv
isory
Co
uncil
Card
iac
Advi
sory
Cou
ncil
Child
ren’
s En
viro
nmen
tal H
ealth
and
Saf
ety
Coun
cil
Child
ren’
s Pl
an W
orkg
roup
CQCA
PD A
dvis
ory
Coun
cil
CQCA
PD M
enta
l Hyg
iene
Med
ical
Rev
iew
Boa
rdCr
eden
tials
Boa
rdD
ata
Prot
ectio
n Re
view
Boa
rd a
nd S
afet
yD
evel
opm
enta
l Dis
abili
ties
Plan
ning
Cou
ncil
DD
SO B
oard
s of
Vis
itors
(13
tota
l)Ea
rly In
terv
entio
n Co
ordi
natin
g Co
unci
l (EI
CC)
Emer
genc
y M
edic
al S
ervi
ces
for C
hild
ren
Advi
sory
Com
mitt
eeEm
pire
Sta
te S
tem
Cel
l Boa
rdFa
mily
Sup
port
Ser
vice
s St
atew
ide
Com
mitt
eeFu
nera
l Dire
ctin
g Ad
viso
ry B
oard
Ger
iatri
c M
enta
l Hea
lth P
lann
ing
Coun
cil
Hea
lth R
esea
rch
Scie
nce
Boar
dIn
stitu
tiona
l Rev
iew
Boa
rdM
enta
l Hea
lth S
ervi
ces
Coun
cil
Psyc
hiat
ric F
acili
ties
Boar
ds o
f Vis
itors
Hel
en H
ayes
Hos
pita
l Boa
rd o
f Vis
itors
Hep
C A
dvis
ory
Coun
cil
Inte
rage
ncy
Coor
dina
ting
Coun
cil f
or S
ervi
ces
to P
erso
ns W
ho a
re
Dea
f, D
eaf-B
lind
or H
ard
of H
earin
gIn
tera
genc
y Pa
rtne
rshi
p fo
r Ass
istiv
e Te
chno
logy
Inte
rage
ncy
Task
For
ce o
n H
IV/A
IDS
Inte
rOffi
ce C
oord
inat
ing
Coun
cil (
IOCC
)M
ater
nal &
Chi
ld H
ealth
Blo
ck G
rant
Adv
isor
y Co
unci
lM
edic
aid
Dru
g Ut
iliza
tion
Revi
ew B
oard
Med
icai
d M
anag
ed C
are
Advi
sory
Rev
iew
Pan
elM
edic
al A
dvis
ory
Com
mitt
eeM
enta
l Hea
lth P
lann
ing
Advi
sory
Cou
ncil
(MH
PAC)
Min
ority
Hea
lth C
ounc
ilM
ost I
nteg
rate
d Se
tting
Coo
rdin
atin
g Co
unci
l (M
ISCC
) N
YS A
dvis
ory
Coun
cil o
n Al
coho
lism
and
Sub
stan
ce A
buse
Ser
vice
sN
YS A
dvis
ory
Coun
cil o
n Le
ad P
oiso
ning
NYS
Cou
ncil
on G
radu
ate
Med
ical
Edu
catio
nN
YS C
ounc
il on
Hum
an B
lood
and
Tra
nsfu
sion
Ser
vice
sN
YS Im
mun
izat
ion
Advi
sory
Cou
ncil
NYS
Occ
upat
iona
l Hea
lth C
linic
s Ov
ersi
ght C
omm
ittee
OPW
DD
’s A
dvis
ory
Coun
cil
Ovar
ian
Canc
er In
form
atio
n Ad
viso
ry C
omm
ittee
Publ
ic H
ealth
and
Hea
lth P
lann
ing
Coun
cil
Stat
e Em
erge
ncy
Med
ical
Ser
vice
s Co
unci
lVe
tera
ns H
ome
Boar
ds o
f Vis
itors
(4 to
tal)
Palli
ativ
e Ca
re E
duca
tion
and
Trai
ning
Cou
ncil
Phar
mac
y Ad
viso
ry C
omm
ittee
Phar
mac
y an
d Th
erap
eutic
s Co
mm
ittee
Prev
enta
tive
Hea
lth a
nd H
ealth
Ser
vice
s Bl
ock
Gra
ntPr
otec
tion
and
Advo
cacy
for I
ndiv
idua
ls w
ith M
enta
l Illn
ess
(PAI
MI)
Advi
sory
Cou
ncil
Rura
l Hea
lth C
ounc
ilSp
inal
Cor
d In
jury
Res
earc
h Bo
ard
Stat
e Ca
mp
Safe
ty A
dvis
ory
Coun
cil
Stat
e Em
erge
ncy
Med
ical
Adv
isor
y Co
mm
ittee
(SEM
AC)
Stat
e Ta
sk F
orce
on
Flam
e Re
tard
ant S
afet
ySt
ate
Trau
ma
Advi
sory
Com
mitt
eeSt
rate
gic
Prev
entio
n Fr
amew
ork
Stat
e In
cent
ive
Gra
nt: P
reve
ntio
n Fi
rst N
Y! A
dvis
ory
Coun
cil
Task
For
ce o
n Li
fe a
nd L
awTo
bacc
o Us
e Pr
even
tion
and
Cont
rol A
dvis
ory
Boar
dTo
xic
Mol
d Ta
sk F
orce
Tran
spla
nt A
dvis
ory
Coun
cil
Trau
mat
ic B
rain
Inju
ry S
ervi
ces
Coor
dina
ting
Coun
cil
Will
owbr
ook,
Com
mis
sion
er’s
Tas
k Fo
rce
Advi
sory
Boa
rds,
Com
mis
sion
s an
d Co
unci
ls
Appendices
116
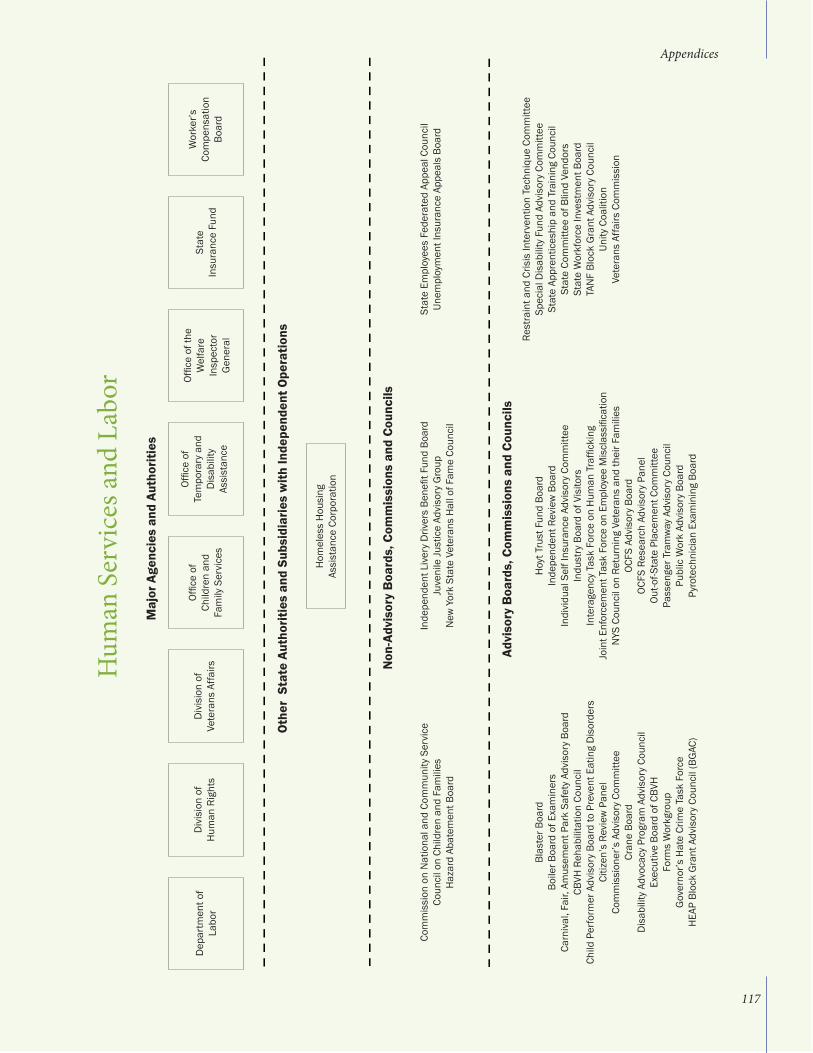
Hum
an S
ervi
ces a
nd L
abor
Maj
or A
genc
ies
and
Auth
oriti
es
Dep
artm
ent o
f La
bor
Div
isio
n of
H
uman
Rig
hts
Div
isio
n of
Vete
rans
Affa
irs
Offic
e of
Ch
ildre
n an
d Fa
mily
Ser
vice
s
Offic
e of
Te
mpo
rary
and
D
isab
ility
As
sist
ance
Offic
e of
the
Wel
fare
In
spec
tor
Gen
eral
Wor
ker’s
Co
mpe
nsat
ion
Boar
d
Oth
er S
tate
Aut
horit
ies
and
Subs
idia
ries
with
Inde
pend
ent O
pera
tions
Hom
eles
s H
ousi
ng
Assi
stan
ce C
orpo
ratio
n
Non
-Adv
isor
y B
oard
s, C
omm
issi
ons
and
Coun
cils
Com
mis
sion
on
Nat
iona
l and
Com
mun
ity S
ervi
ceCo
unci
l on
Child
ren
and
Fam
ilies
Haz
ard
Abat
emen
t Boa
rd
Blas
ter B
oard
Boile
r Boa
rd o
f Exa
min
ers
Carn
ival
, Fai
r, Am
usem
ent P
ark
Safe
ty A
dvis
ory
Boar
dCB
VH R
ehab
ilita
tion
Coun
cil
Child
Per
form
er A
dvis
ory
Boar
d to
Pre
vent
Eat
ing
Dis
orde
rsCi
tizen
’s R
evie
w P
anel
Com
mis
sion
er’s
Adv
isor
y Co
mm
ittee
Cran
e Bo
ard
Dis
abili
ty A
dvoc
acy
Prog
ram
Adv
isor
y Co
unci
lEx
ecut
ive
Boar
d of
CBV
HFo
rms
Wor
kgro
up
Gov
erno
r’s H
ate
Crim
e Ta
sk F
orce
HEA
P Bl
ock
Gra
nt A
dvis
ory
Coun
cil (
BGAC
)
Inde
pend
ent L
iver
y D
river
s Be
nefit
Fun
d Bo
ard
Juve
nile
Just
ice
Advi
sory
Gro
upN
ew Y
ork
Stat
e Ve
tera
ns H
all o
f Fam
e Co
unci
l
Hoy
t Tru
st F
und
Boar
dIn
depe
nden
t Rev
iew
Boa
rdIn
divi
dual
Sel
f Ins
uran
ce A
dvis
ory
Com
mitt
eeIn
dust
ry B
oard
of V
isito
rsIn
tera
genc
y Ta
sk F
orce
on
Hum
an T
raffi
ckin
gJo
int E
nfor
cem
ent T
ask
Forc
e on
Em
ploy
ee M
iscl
assi
ficat
ion
NYS
Cou
ncil
on R
etur
ning
Vet
eran
s an
d th
eir F
amili
esOC
FS A
dvis
ory
Boar
dOC
FS R
esea
rch
Advi
sory
Pan
elOu
t-of-S
tate
Pla
cem
ent C
omm
ittee
Pass
enge
r Tra
mw
ay A
dvis
ory
Coun
cil
Publ
ic W
ork
Advi
sory
Boa
rdPy
rote
chni
cian
Exa
min
ing
Boar
d
Stat
e Em
ploy
ees
Fede
rate
d Ap
peal
Cou
ncil
Unem
ploy
men
t Ins
uran
ce A
ppea
ls B
oard
Rest
rain
t and
Cris
is In
terv
entio
n Te
chni
que
Com
mitt
eeSp
ecia
l Dis
abili
ty F
und
Advi
sory
Com
mitt
eeSt
ate
Appr
entic
eshi
p an
d Tr
aini
ng C
ounc
ilSt
ate
Com
mitt
ee o
f Blin
d Ve
ndor
sSt
ate
Wor
kfor
ce In
vest
men
t Boa
rdTA
NF
Bloc
k G
rant
Adv
isor
y Co
unci
lUn
ity C
oalit
ion
Vete
rans
Affa
irs C
omm
issi
on
Advi
sory
Boa
rds,
Com
mis
sion
s an
d Co
unci
ls
Stat
eIn
sura
nce
Fund
Appendices
117
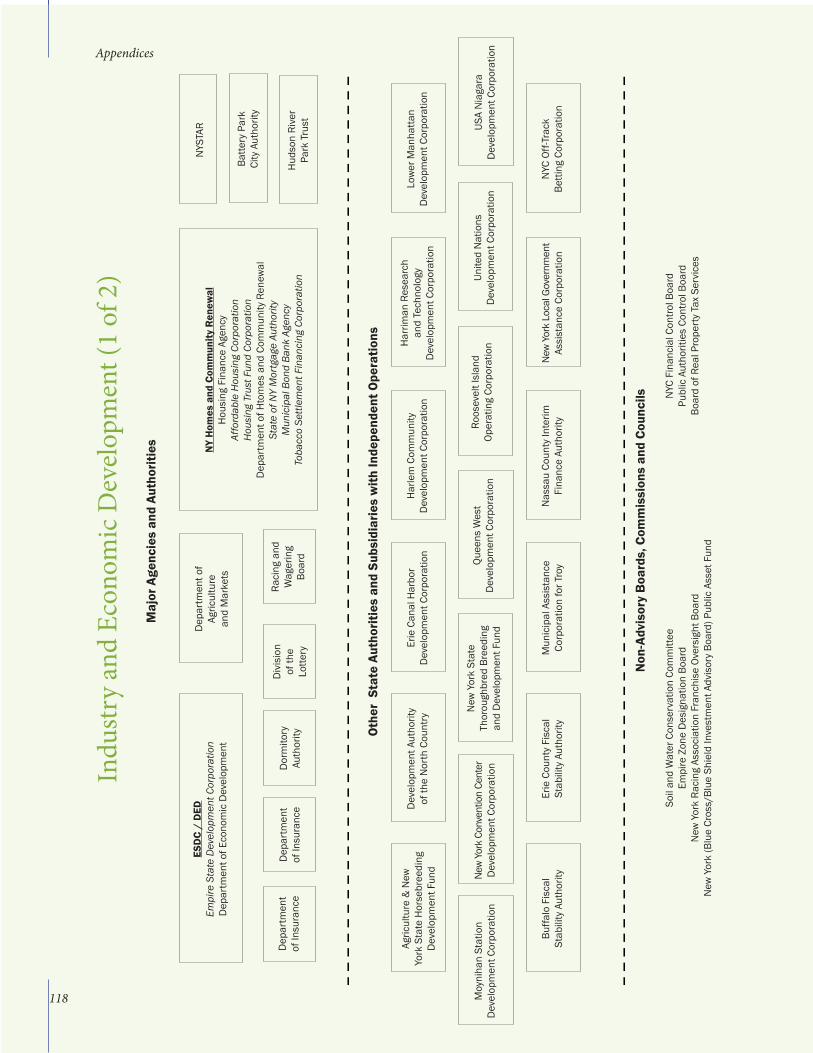
4 Chapter I: Introduction
Indu
stry
and
Eco
nom
ic D
evel
opm
ent (
1 of
2)
Maj
or A
genc
ies
and
Auth
oriti
es
Agric
ultu
re &
New
Yo
rk S
tate
Hor
sebr
eedi
ng
Dev
elop
men
t Fun
d
Non
-Adv
isor
y B
oard
s, C
omm
issi
ons
and
Coun
cils
Soil
and
Wat
er C
onse
rvat
ion
Com
mitt
eeEm
pire
Zon
e D
esig
natio
n Bo
ard
New
Yor
k Ra
cing
Ass
ocia
tion
Fran
chis
e Ov
ersi
ght B
oard
New
Yor
k (B
lue
Cros
s/Bl
ue S
hiel
d In
vest
men
t Adv
isor
y Bo
ard)
Pub
lic A
sset
Fun
d
NYC
Fin
anci
al C
ontro
l Boa
rdPu
blic
Aut
horit
ies
Cont
rol B
oard
Boar
d of
Rea
l Pro
pert
y Ta
x Se
rvic
es
Oth
er S
tate
Aut
horit
ies
and
Subs
idia
ries
with
Inde
pend
ent O
pera
tions
Dev
elop
men
t Aut
horit
y of
the
Nor
th C
ount
ryEr
ie C
anal
Har
bor
Dev
elop
men
t Cor
pora
tion
Har
lem
Com
mun
ity
Dev
elop
men
t Cor
pora
tion
Har
riman
Res
earc
h an
d Te
chno
logy
D
evel
opm
ent C
orpo
ratio
n
Low
er M
anha
ttan
Dev
elop
men
t Cor
pora
tion
Buffa
lo F
isca
l St
abili
ty A
utho
rity
Erie
Cou
nty
Fisc
al
Stab
ility
Aut
horit
yM
unic
ipal
Ass
ista
nce
Corp
orat
ion
for T
roy
Nas
sau
Coun
ty In
terim
Fi
nanc
e Au
thor
ityNe
w Y
ork
Loca
l Gov
ernm
ent
Assi
stan
ce C
orpo
ratio
nN
YC O
ff-Tr
ack
Betti
ng C
orpo
ratio
n
USA
Nia
gara
D
evel
opm
ent C
orpo
ratio
nM
oyni
han
Stat
ion
Dev
elop
men
t Cor
pora
tion
New
York
Con
vent
ion
Cent
er
Dev
elop
men
t Cor
pora
tion
New
Yor
k St
ate
Thor
ough
bred
Bre
edin
g an
d D
evel
opm
ent F
und
Quee
ns W
est
Dev
elop
men
t Cor
pora
tion
Roos
evel
t Isl
and
Oper
atin
g Co
rpor
atio
nUn
ited
Nat
ions
D
evel
opm
ent C
orpo
ratio
n
ESD
C /
DED
Empi
re S
tate
Dev
elop
men
t Cor
pora
tion
Dep
artm
ent o
f Eco
nom
ic D
evel
opm
ent
Dep
artm
ent o
f Ag
ricul
ture
an
d M
arke
tsN
Y H
omes
and
Com
mun
ity R
enew
alH
ousi
ng F
inan
ce A
genc
yAf
ford
able
Hou
sing
Cor
pora
tion
Hou
sing
Tru
st F
und
Corp
orat
ion
Dep
artm
ent o
f Hto
mes
and
Com
mun
ity R
enew
alSt
ate
of N
Y M
ortg
age
Auth
ority
Mun
icip
al B
ond
Bank
Age
ncy
Toba
cco
Settl
emen
t Fin
anci
ng C
orpo
ratio
n
NYS
TAR
Batte
ry P
ark
City
Aut
horit
y
Hud
son
Rive
rPa
rk T
rust
Raci
ng a
nd
Wag
erin
g Bo
ard
Dor
mito
ry
Auth
ority
Div
isio
n of
the
Lotte
ry
Dep
artm
ent
of In
sura
nce
Dep
artm
ent
of In
sura
nce
Appendices
118
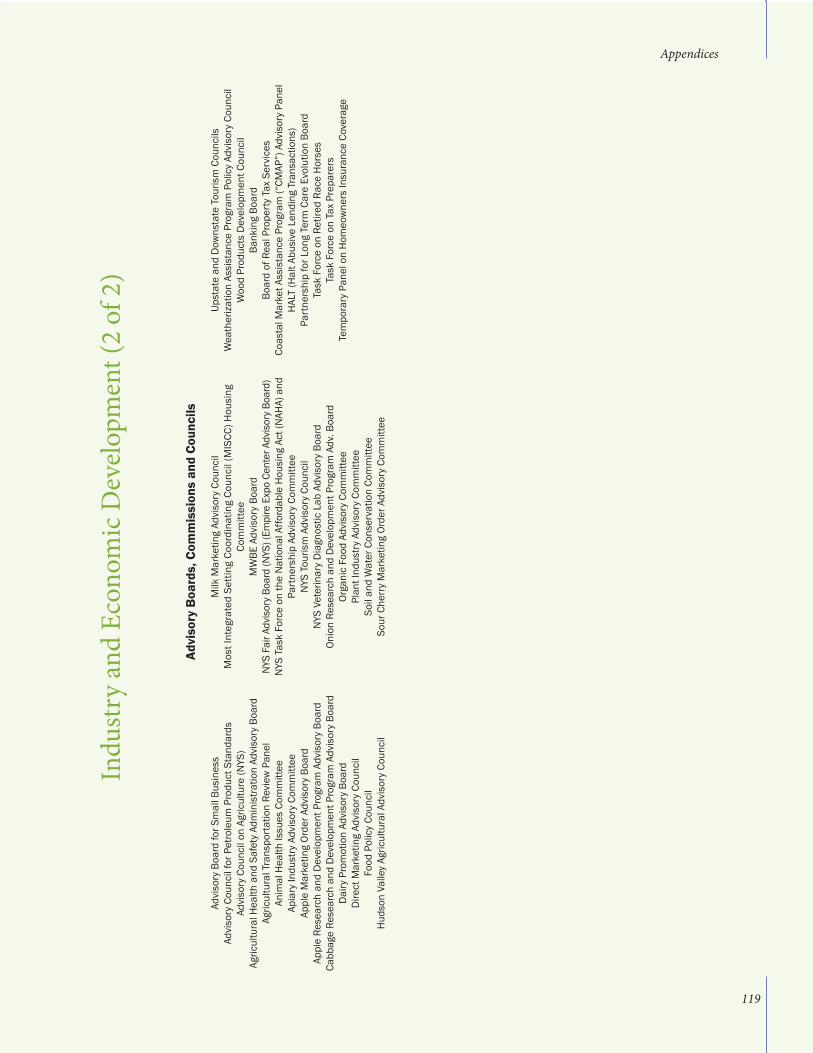
Chapter I: Introduction 5
Indu
stry
and
Eco
nom
ic D
evel
opm
ent (
2 of
2)
Advi
sory
Boa
rd fo
r Sm
all B
usin
ess
Advi
sory
Cou
ncil
for P
etro
leum
Pro
duct
Sta
ndar
dsAd
viso
ry C
ounc
il on
Agr
icul
ture
(NYS
)Ag
ricul
tura
l Hea
lth a
nd S
afet
y Ad
min
istra
tion
Advi
sory
Boa
rdAg
ricul
tura
l Tra
nspo
rtat
ion
Revi
ew P
anel
Anim
al H
ealth
Issu
es C
omm
ittee
Apia
ry In
dust
ry A
dvis
ory
Com
mitt
eeAp
ple
Mar
ketin
g Or
der A
dvis
ory
Boar
dAp
ple
Rese
arch
and
Dev
elop
men
t Pro
gram
Adv
isor
y Bo
ard
Cabb
age
Rese
arch
and
Dev
elop
men
t Pro
gram
Adv
isor
y Bo
ard
Dai
ry P
rom
otio
n Ad
viso
ry B
oard
Dire
ct M
arke
ting
Advi
sory
Cou
ncil
Food
Pol
icy
Coun
cil
Hud
son
Valle
y Ag
ricul
tura
l Adv
isor
y Co
unci
l
Milk
Mar
ketin
g Ad
viso
ry C
ounc
ilM
ost I
nteg
rate
d Se
tting
Coo
rdin
atin
g Co
unci
l (M
ISCC
) Hou
sing
Co
mm
ittee
MW
BE A
dvis
ory
Boar
dN
YS F
air A
dvis
ory
Boar
d (N
YS) (
Empi
re E
xpo
Cent
er A
dvis
ory
Boar
d)N
YS T
ask
Forc
e on
the
Nat
iona
l Affo
rdab
le H
ousi
ng A
ct (N
AHA)
and
Pa
rtne
rshi
p Ad
viso
ry C
omm
ittee
NYS
Tou
rism
Adv
isor
y Co
unci
lN
YS V
eter
inar
y D
iagn
ostic
Lab
Adv
isor
y Bo
ard
Onio
n Re
sear
ch a
nd D
evel
opm
ent P
rogr
am A
dv. B
oard
Orga
nic
Food
Adv
isor
y Co
mm
ittee
Plan
t Ind
ustr
y Ad
viso
ry C
omm
ittee
Soil
and
Wat
er C
onse
rvat
ion
Com
mitt
eeSo
ur C
herr
y M
arke
ting
Orde
r Adv
isor
y Co
mm
ittee
Upst
ate
and
Dow
nsta
te T
ouris
m C
ounc
ilsW
eath
eriz
atio
n As
sist
ance
Pro
gram
Pol
icy
Advi
sory
Cou
ncil
Woo
d Pr
oduc
ts D
evel
opm
ent C
ounc
ilBa
nkin
g Bo
ard
Boar
d of
Rea
l Pro
pert
y Ta
x Se
rvic
esCo
asta
l Mar
ket A
ssis
tanc
e Pr
ogra
m (“
CMAP
”) A
dvis
ory
Pane
lH
ALT
(Hal
t Abu
sive
Len
ding
Tra
nsac
tions
)Pa
rtne
rshi
p fo
r Lon
g Te
rm C
are
Evol
utio
n Bo
ard
Task
For
ce o
n Re
tired
Rac
e H
orse
sTa
sk F
orce
on
Tax
Prep
arer
sTe
mpo
rary
Pan
el o
n H
omeo
wne
rs In
sura
nce
Cove
rage
Advi
sory
Boa
rds,
Com
mis
sion
s an
d Co
unci
ls
Appendices
119
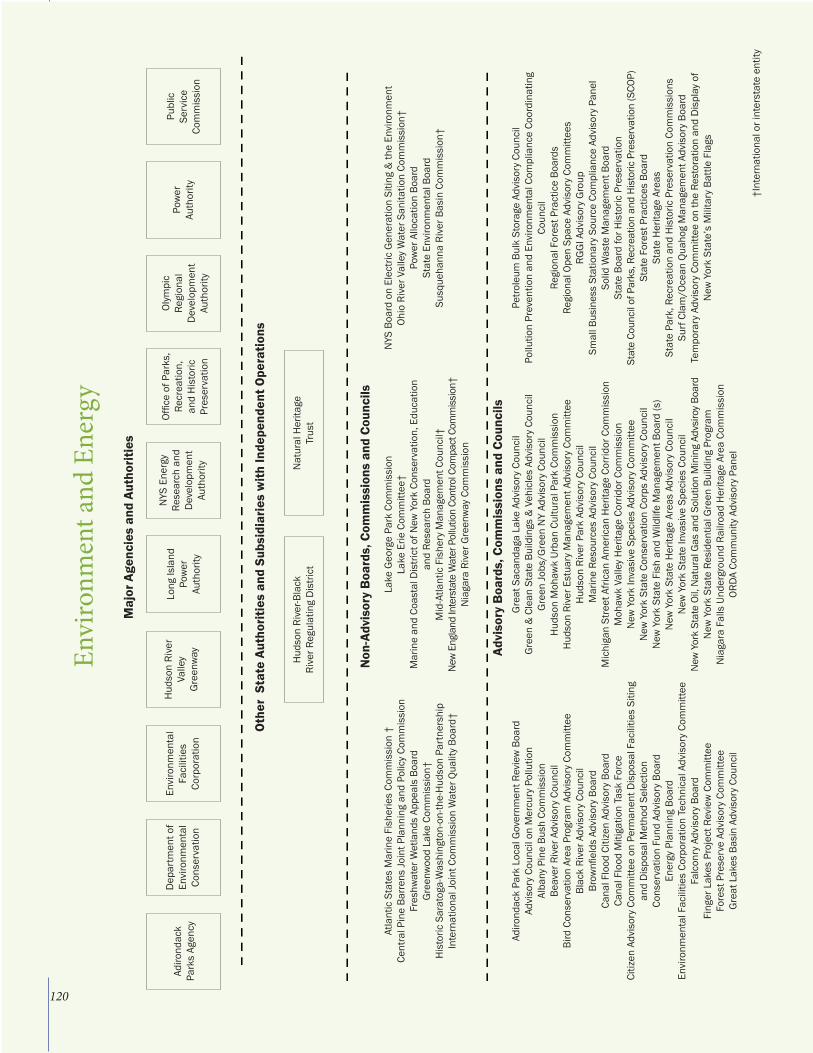
Appendices
Envi
ronm
ent a
nd E
nerg
yM
ajor
Age
ncie
s an
d Au
thor
ities
Adiro
ndac
k Pa
rks
Agen
cy
Dep
artm
ent o
f En
viro
nmen
tal
Cons
erva
tion
Envi
ronm
enta
l Fa
cilit
ies
Corp
orat
ion
Long
Isla
nd
Pow
er
Auth
ority
NYS
Ene
rgy
Rese
arch
and
D
evel
opm
ent
Auth
ority
Offic
e of
Par
ks,
Recr
eatio
n,
and
His
toric
Pr
eser
vatio
n
Pow
erAu
thor
ity
Oth
er S
tate
Aut
horit
ies
and
Subs
idia
ries
with
Inde
pend
ent O
pera
tions
Hud
son
Rive
r-Bla
ck
Rive
r Reg
ulat
ing
Dis
trict
Non
-Adv
isor
y B
oard
s, C
omm
issi
ons
and
Coun
cils
Atla
ntic
Sta
tes
Mar
ine
Fish
erie
s Co
mm
issi
on †
Cent
ral P
ine
Barr
ens
Join
t Pla
nnin
g an
d Po
licy
Com
mis
sion
Fres
hwat
er W
etla
nds
Appe
als
Boar
dG
reen
woo
d La
ke C
omm
issi
on†
His
toric
Sar
atog
a-W
ashi
ngto
n-on
-the-
Hud
son
Part
ners
hip
Inte
rnat
iona
l Joi
nt C
omm
issi
on W
ater
Qua
lity
Boar
d†
Adiro
ndac
k Pa
rk L
ocal
Gov
ernm
ent R
evie
w B
oard
Advi
sory
Cou
ncil
on M
ercu
ry P
ollu
tion
Alba
ny P
ine
Bush
Com
mis
sion
Beav
er R
iver
Adv
isor
y Co
unci
lBi
rd C
onse
rvat
ion
Area
Pro
gram
Adv
isor
y Co
mm
ittee
Blac
k Ri
ver A
dvis
ory
Coun
cil
Brow
nfiel
ds A
dvis
ory
Boar
dCa
nal F
lood
Citi
zen
Advi
sory
Boa
rdCa
nal F
lood
Miti
gatio
n Ta
sk F
orce
Citiz
en A
dvis
ory
Com
mitt
ee o
n Pe
rman
ent D
ispo
sal F
acili
ties
Sitin
g an
d D
ispo
sal M
etho
d Se
lect
ion
Cons
erva
tion
Fund
Adv
isor
y Bo
ard
Ener
gy P
lann
ing
Boar
dEn
viro
nmen
tal F
acili
ties
Corp
orat
ion
Tech
nica
l Adv
isor
y Co
mm
ittee
Falc
onry
Adv
isor
y Bo
ard
Fing
er L
akes
Pro
ject
Rev
iew
Com
mitt
eeFo
rest
Pre
serv
e Ad
viso
ry C
omm
ittee
Gre
at L
akes
Bas
in A
dvis
ory
Coun
cil
Lake
Geo
rge
Park
Com
mis
sion
Lake
Erie
Com
mitt
ee†
Mar
ine
and
Coas
tal D
istri
ct o
f New
Yor
k Co
nser
vatio
n, E
duca
tion
and
Rese
arch
Boa
rdM
id-A
tlant
ic F
ishe
ry M
anag
emen
t Cou
ncil†
New
Engl
and
Inte
rsta
te W
ater
Pol
lutio
n Co
ntro
l Com
pact
Com
miss
ion†
Nia
gara
Riv
er G
reen
way
Com
mis
sion
Gre
at S
acan
daga
Lak
e Ad
viso
ry C
ounc
il
Gre
en &
Cle
an S
tate
Bui
ldin
gs &
Veh
icle
s Ad
viso
ry C
ounc
il G
reen
Jobs
/Gre
en N
Y Ad
viso
ry C
ounc
ilH
udso
n M
ohaw
k Ur
ban
Cultu
ral P
ark
Com
mis
sion
Hud
son
Rive
r Est
uary
Man
agem
ent A
dvis
ory
Com
mitt
eeH
udso
n Ri
ver P
ark
Advi
sory
Cou
ncil
Mar
ine
Reso
urce
s Ad
viso
ry C
ounc
ilM
ichi
gan
Stre
et A
frica
n Am
eric
an H
erita
ge C
orrid
or C
omm
issi
onM
ohaw
k Va
lley
Her
itage
Cor
ridor
Com
mis
sion
New
Yor
k In
vasi
ve S
peci
es A
dvis
ory
Com
mitt
eeN
ew Y
ork
Stat
e Co
nser
vatio
n Co
rps
Advi
sory
Cou
ncil
New
Yor
k St
ate
Fish
and
Wild
life
Man
agem
ent B
oard
(s)
New
Yor
k St
ate
Her
itage
Are
as A
dvis
ory
Coun
cil
New
Yor
k St
ate
Inva
sive
Spe
cies
Cou
ncil
New
Yor
k St
ate
Oil,
Nat
ural
Gas
and
Sol
utio
n M
inin
g Ad
vsiro
y Bo
ard
New
Yor
k St
ate
Resi
dent
ial G
reen
Bui
ldin
g Pr
ogra
mN
iaga
ra F
alls
Und
ergr
ound
Rai
lroad
Her
itage
Are
a Co
mm
issi
onOR
DA C
omm
unity
Adv
isor
y Pa
nel
NYS
Boa
rd o
n El
ectri
c G
ener
atio
n Si
ting
& th
e En
viro
nmen
tOh
io R
iver
Val
ley
Wat
er S
anita
tion
Com
mis
sion
†Po
wer
Allo
catio
n Bo
ard
Stat
e En
viro
nmen
tal B
oard
Susq
ueha
nna
Rive
r Bas
in C
omm
issi
on†
Petro
leum
Bul
k St
orag
e Ad
viso
ry C
ounc
ilPo
llutio
n Pr
even
tion
and
Envi
ronm
enta
l Com
plia
nce
Coor
dina
ting
Coun
cil
Regi
onal
For
est P
ract
ice
Boar
dsRe
gion
al O
pen
Spac
e Ad
viso
ry C
omm
ittee
sRG
GI A
dvis
ory
Gro
upSm
all B
usin
ess
Stat
iona
ry S
ourc
e Co
mpl
ianc
e Ad
viso
ry P
anel
Solid
Was
te M
anag
emen
t Boa
rdSt
ate
Boar
d fo
r His
toric
Pre
serv
atio
nSt
ate
Coun
cil o
f Par
ks, R
ecre
atio
n an
d Hi
stor
ic P
rese
rvat
ion
(SCO
P)St
ate
Fore
st P
ract
ices
Boa
rdSt
ate
Her
itage
Are
asSt
ate
Park
, Rec
reat
ion
and
His
toric
Pre
serv
atio
n Co
mm
issi
ons
Surf
Cla
m/O
cean
Qua
hog
Man
agem
ent A
dvis
ory
Boar
dTe
mpo
rary
Adv
isor
y Co
mm
ittee
on
the
Rest
orat
ion
and
Dis
play
of
New
Yor
k St
ate’
s M
ilita
ry B
attle
Fla
gs
Advi
sory
Boa
rds,
Com
mis
sion
s an
d Co
unci
ls
Olym
pic
Regi
onal
D
evel
opm
ent
Auth
ority
Nat
ural
Her
itage
Tr
ust
†Int
erna
tiona
l or i
nter
stat
e en
tity
Publ
ic
Serv
ice
Com
mis
sion
120
Hud
son
Rive
r Va
lley
Gre
enw
ay
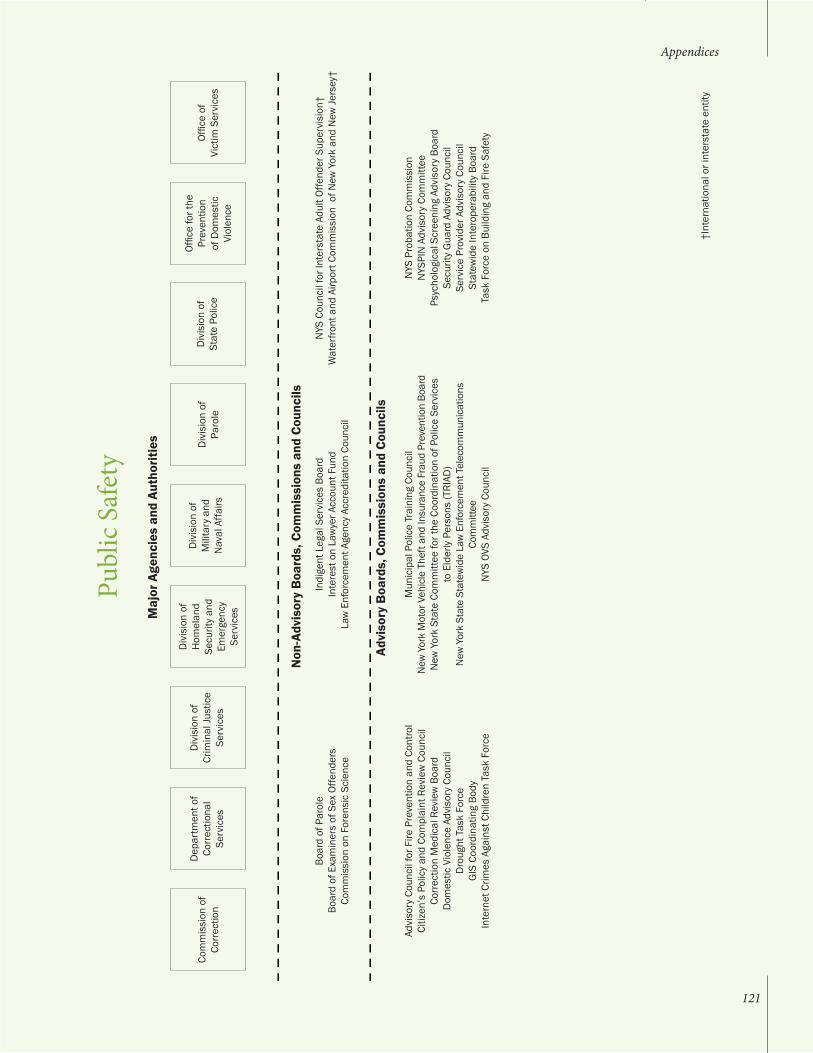
Chapter I: Introduction 7
Publ
ic S
afet
yM
ajor
Age
ncie
s an
d Au
thor
ities
Com
mis
sion
of
Corr
ectio
n
Dep
artm
ent o
f Co
rrec
tiona
l Se
rvic
es
Div
isio
n of
Cr
imin
al Ju
stic
e Se
rvic
es
Div
isio
n of
H
omel
and
Secu
rity
and
Emer
genc
y Se
rvic
es
Div
isio
n of
Mili
tary
and
N
aval
Affa
irsD
ivis
ion
of
Paro
le
Offic
e fo
r the
Pr
even
tion
of D
omes
tic
Viol
ence
Non
-Adv
isor
y B
oard
s, C
omm
issi
ons
and
Coun
cils
Boar
d of
Par
ole
Boar
d of
Exa
min
ers
of S
ex O
ffend
ers
Com
mis
sion
on
Fore
nsic
Sci
ence
Advi
sory
Cou
ncil
for F
ire P
reve
ntio
n an
d Co
ntro
lCi
tizen
’s P
olic
y an
d Co
mpl
aint
Rev
iew
Cou
ncil
Corr
ectio
n M
edic
al R
evie
w B
oard
Dom
estic
Vio
lenc
e Ad
viso
ry C
ounc
ilD
roug
ht T
ask
Forc
eG
IS C
oord
inat
ing
Body
Inte
rnet
Crim
es A
gain
st C
hild
ren
Task
For
ce
Indi
gent
Leg
al S
ervi
ces
Boar
dIn
tere
st o
n La
wye
r Acc
ount
Fun
dLa
w E
nfor
cem
ent A
genc
y Ac
cred
itatio
n Co
unci
l
Mun
icip
al P
olic
e Tr
aini
ng C
ounc
ilN
ew Y
ork
Mot
or V
ehic
le T
heft
and
Insu
ranc
e Fr
aud
Prev
entio
n Bo
ard
New
Yor
k St
ate
Com
mitt
ee fo
r the
Coo
rdin
atio
n of
Pol
ice
Serv
ices
to
Eld
erly
Per
sons
(TRI
AD)
New
Yor
k St
ate
Stat
ewid
e La
w E
nfor
cem
ent T
elec
omm
unic
atio
ns
Com
mitt
eeN
YS O
VS A
dvis
ory
Coun
cil
NYS
Cou
ncil
for I
nter
stat
e Ad
ult O
ffend
er S
uper
visi
on†
Wat
erfro
nt a
nd A
irpor
t Com
mis
sion
of N
ew Y
ork
and
New
Jers
ey†
NYS
Pro
batio
n Co
mm
issi
onN
YSPI
N A
dvis
ory
Com
mitt
eePs
ycho
logi
cal S
cree
ning
Adv
isor
y Bo
ard
Secu
rity
Gua
rd A
dvis
ory
Coun
cil
Serv
ice
Prov
ider
Adv
isor
y Co
unci
lSt
atew
ide
Inte
rope
rabi
lity
Boar
dTa
sk F
orce
on
Build
ing
and
Fire
Saf
ety
Advi
sory
Boa
rds,
Com
mis
sion
s an
d Co
unci
ls
Div
isio
n of
St
ate
Polic
e
†Int
erna
tiona
l or i
nter
stat
e en
tity
Offic
e of
Vi
ctim
Ser
vice
s
Appendices
121
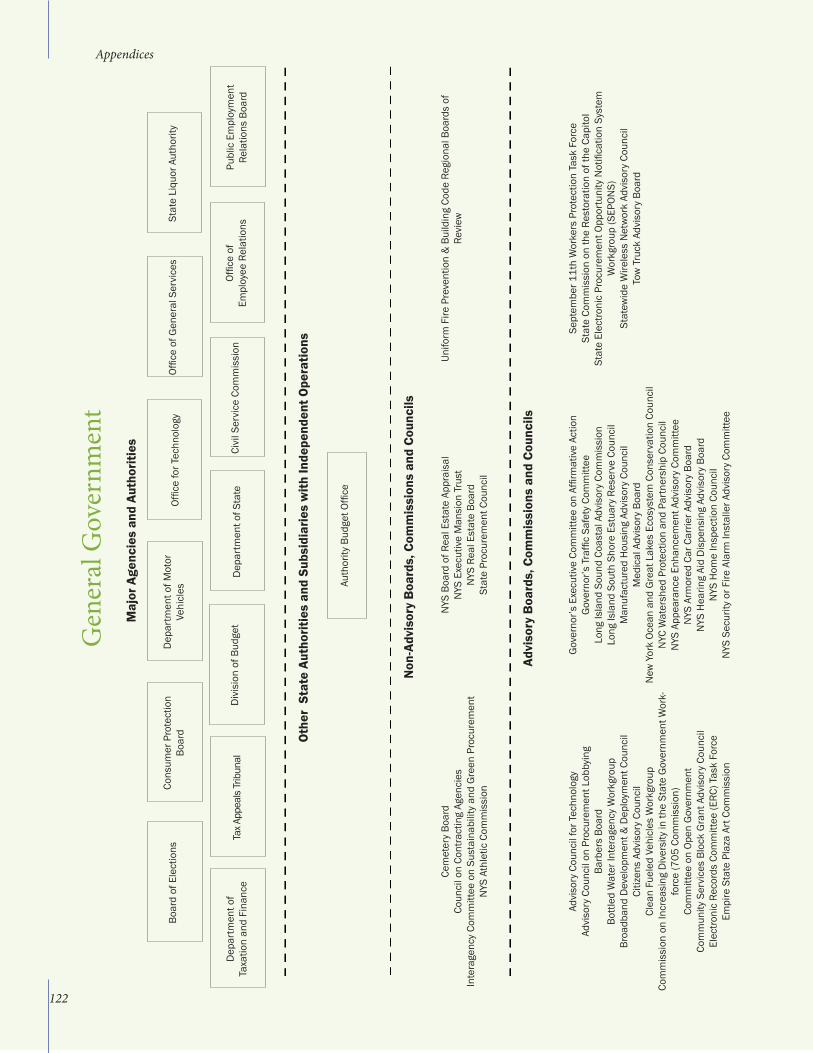
Boar
d of
Ele
ctio
nsCo
nsum
er P
rote
ctio
n Bo
ard
Dep
artm
ent o
f Mot
or
Vehi
cles
Offic
e fo
r Tec
hnol
ogy
Offic
e of
Gen
eral
Ser
vice
sSt
ate
Liqu
or A
utho
rity
Publ
ic E
mpl
oym
ent
Rela
tions
Boa
rdD
epar
tmen
t of
Taxa
tion
and
Fina
nce
Tax A
ppea
ls Tr
ibun
alD
ivis
ion
of B
udge
tD
epar
tmen
t of S
tate
Civi
l Ser
vice
Com
mis
sion
Offic
e of
Em
ploy
ee R
elat
ions
Gen
eral
Gov
ernm
ent
Maj
or A
genc
ies
and
Auth
oriti
es
Oth
er S
tate
Aut
horit
ies
and
Subs
idia
ries
with
Inde
pend
ent O
pera
tions
Auth
ority
Bud
get O
ffice
Non
-Adv
isor
y B
oard
s, C
omm
issi
ons
and
Coun
cils
Cem
eter
y Bo
ard
Coun
cil o
n Co
ntra
ctin
g Ag
enci
esIn
tera
genc
y Co
mm
ittee
on
Sust
aina
bilit
y an
d G
reen
Pro
cure
men
tN
YS A
thle
tic C
omm
issi
on
Advi
sory
Cou
ncil
for T
echn
olog
yAd
viso
ry C
ounc
il on
Pro
cure
men
t Lob
byin
gBa
rber
s Bo
ard
Bottl
ed W
ater
Inte
rage
ncy
Wor
kgro
upBr
oadb
and
Dev
elop
men
t & D
eplo
ymen
t Cou
ncil
Citiz
ens
Advi
sory
Cou
ncil
Clea
n Fu
eled
Veh
icle
s W
orkg
roup
Com
mis
sion
on
Incr
easi
ng D
iver
sity
in th
e St
ate
Gov
ernm
ent W
ork-
forc
e (7
05 C
omm
issi
on)
Com
mitt
ee o
n Op
en G
over
nmen
tCo
mm
unity
Ser
vice
s Bl
ock
Gra
nt A
dvis
ory
Coun
cil
Elec
troni
c Re
cord
s Co
mm
ittee
(ERC
) Tas
k Fo
rce
Empi
re S
tate
Pla
za A
rt C
omm
issi
on
NYS
Boa
rd o
f Rea
l Est
ate
Appr
aisa
lN
YS E
xecu
tive
Man
sion
Tru
stN
YS R
eal E
stat
e Bo
ard
Stat
e Pr
ocur
emen
t Cou
ncil
Gov
erno
r’s E
xecu
tive
Com
mitt
ee o
n Af
firm
ativ
e Ac
tion
Gov
erno
r’s T
raffi
c Sa
fety
Com
mitt
eeLo
ng Is
land
Sou
nd C
oast
al A
dvis
ory
Com
mis
sion
Long
Isla
nd S
outh
Sho
re E
stua
ry R
eser
ve C
ounc
ilM
anuf
actu
red
Hou
sing
Adv
isor
y Co
unci
lM
edic
al A
dvis
ory
Boar
dN
ew Y
ork
Ocea
n an
d G
reat
Lak
es E
cosy
stem
Con
serv
atio
n Co
unci
lN
YC W
ater
shed
Pro
tect
ion
and
Part
ners
hip
Coun
cil
NYS
App
eara
nce
Enha
ncem
ent A
dvis
ory
Com
mitt
ee
NYS
Arm
ored
Car
Car
rier A
dvis
ory
Boar
dN
YS H
earin
g Ai
d D
ispe
nsin
g Ad
viso
ry B
oard
N
YS H
ome
Insp
ectio
n Co
unci
l N
YS S
ecur
ity o
r Fire
Ala
rm In
stal
ler A
dvis
ory
Com
mitt
ee
Unifo
rm F
ire P
reve
ntio
n &
Bui
ldin
g Co
de R
egio
nal B
oard
s of
Re
view
Sept
embe
r 11t
h W
orke
rs P
rote
ctio
n Ta
sk F
orce
Stat
e Co
mm
issi
on o
n th
e Re
stor
atio
n of
the
Capi
tol
Stat
e El
ectro
nic
Proc
urem
ent O
ppor
tuni
ty N
otifi
catio
n Sy
stem
W
orkg
roup
(SEP
ONS)
Stat
ewid
e W
irele
ss N
etw
ork
Advi
sory
Cou
ncil
Tow
Tru
ck A
dvis
ory
Boar
d
Advi
sory
Boa
rds,
Com
mis
sion
s an
d Co
unci
ls
Appendices
122
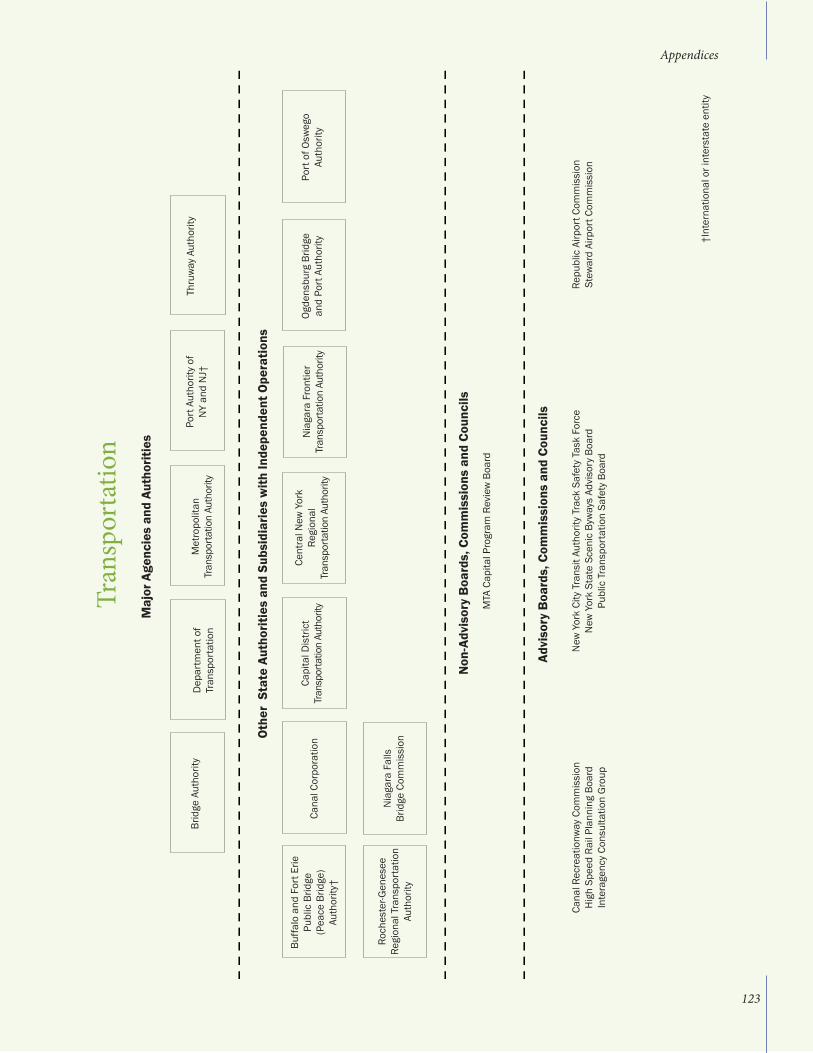
Chapter I: Introduction 9
Thru
way
Aut
horit
yBr
idge
Aut
horit
yD
epar
tmen
t of
Tran
spor
tatio
nM
etro
polit
an
Tran
spor
tatio
n Au
thor
ity
Port
Aut
horit
y of
N
Y an
d N
J†
Tran
spor
tatio
nM
ajor
Age
ncie
s an
d Au
thor
ities
Oth
er S
tate
Aut
horit
ies
and
Subs
idia
ries
with
Inde
pend
ent O
pera
tions
Non
-Adv
isor
y B
oard
s, C
omm
issi
ons
and
Coun
cils
Cana
l Rec
reat
ionw
ay C
omm
issi
onH
igh
Spee
d Ra
il Pl
anni
ng B
oard
Inte
rage
ncy
Cons
ulta
tion
Gro
up
MTA
Cap
ital P
rogr
am R
evie
w B
oard
New
Yor
k Ci
ty T
rans
it Au
thor
ity T
rack
Saf
ety
Task
For
ceN
ew Y
ork
Stat
e Sc
enic
Byw
ays
Advi
sory
Boa
rdPu
blic
Tra
nspo
rtat
ion
Safe
ty B
oard
Repu
blic
Airp
ort C
omm
issi
onSt
ewar
d Ai
rpor
t Com
mis
sion
Advi
sory
Boa
rds,
Com
mis
sion
s an
d Co
unci
ls
Nia
gara
Fro
ntie
r Tr
ansp
orta
tion
Auth
ority
Buffa
lo a
nd F
ort E
rie
Publ
ic B
ridge
(P
eace
Brid
ge)
Auth
ority
†
Cana
l Cor
pora
tion
Capi
tal D
istri
ct
Tran
spor
tatio
n Au
thor
ity
Cent
ral N
ew Y
ork
Regi
onal
Tr
ansp
orta
tion
Auth
ority
Ogde
nsbu
rg B
ridge
an
d Po
rt A
utho
rity
Port
of O
sweg
o Au
thor
ity
Roch
este
r-Gen
esee
Re
gion
al T
rans
port
atio
n Au
thor
ity
†Int
erna
tiona
l or i
nter
stat
e en
tity
Cem
eter
y Bo
ard
Coun
cil o
n Co
ntra
ctin
g Ag
enci
esIn
tera
genc
y Co
mm
ittee
on
Sust
aina
bilit
y an
d G
reen
Pro
cure
men
tN
YS A
thle
tic C
omm
issi
on
Advi
sory
Cou
ncil
for T
echn
olog
yAd
viso
ry C
ounc
il on
Pro
cure
men
t Lob
byin
gBa
rber
s Bo
ard
Bottl
ed W
ater
Inte
rage
ncy
Wor
kgro
upBr
oadb
and
Dev
elop
men
t & D
eplo
ymen
t Cou
ncil
Citiz
ens
Advi
sory
Cou
ncil
Clea
n Fu
eled
Veh
icle
s W
orkg
roup
Com
mis
sion
on
Incr
easi
ng D
iver
sity
in th
e St
ate
Gov
ernm
ent W
ork-
forc
e (7
05 C
omm
issi
on)
Com
mitt
ee o
n Op
en G
over
nmen
tCo
mm
unity
Ser
vice
s Bl
ock
Gra
nt A
dvis
ory
Coun
cil
Elec
troni
c Re
cord
s Co
mm
ittee
(ERC
) Tas
k Fo
rce
Empi
re S
tate
Pla
za A
rt C
omm
issi
on
NYS
Boa
rd o
f Rea
l Est
ate
Appr
aisa
lN
YS E
xecu
tive
Man
sion
Tru
stN
YS R
eal E
stat
e Bo
ard
Stat
e Pr
ocur
emen
t Cou
ncil
Gov
erno
r’s E
xecu
tive
Com
mitt
ee o
n Af
firm
ativ
e Ac
tion
Gov
erno
r’s T
raffi
c Sa
fety
Com
mitt
eeLo
ng Is
land
Sou
nd C
oast
al A
dvis
ory
Com
mis
sion
Long
Isla
nd S
outh
Sho
re E
stua
ry R
eser
ve C
ounc
ilM
anuf
actu
red
Hou
sing
Adv
isor
y Co
unci
lM
edic
al A
dvis
ory
Boar
dN
ew Y
ork
Ocea
n an
d G
reat
Lak
es E
cosy
stem
Con
serv
atio
n Co
unci
lN
YC W
ater
shed
Pro
tect
ion
and
Part
ners
hip
Coun
cil
NYS
App
eara
nce
Enha
ncem
ent A
dvis
ory
Com
mitt
ee
NYS
Arm
ored
Car
Car
rier A
dvis
ory
Boar
dN
YS H
earin
g Ai
d D
ispe
nsin
g Ad
viso
ry B
oard
N
YS H
ome
Insp
ectio
n Co
unci
l N
YS S
ecur
ity o
r Fire
Ala
rm In
stal
ler A
dvis
ory
Com
mitt
ee
Unifo
rm F
ire P
reve
ntio
n &
Bui
ldin
g Co
de R
egio
nal B
oard
s of
Re
view
Sept
embe
r 11t
h W
orke
rs P
rote
ctio
n Ta
sk F
orce
Stat
e Co
mm
issi
on o
n th
e Re
stor
atio
n of
the
Capi
tol
Stat
e El
ectro
nic
Proc
urem
ent O
ppor
tuni
ty N
otifi
catio
n Sy
stem
W
orkg
roup
(SEP
ONS)
Stat
ewid
e W
irele
ss N
etw
ork
Advi
sory
Cou
ncil
Tow
Tru
ck A
dvis
ory
Boar
d
Appendices
123
Nia
gara
Fal
lsBr
idge
Com
mis
sion
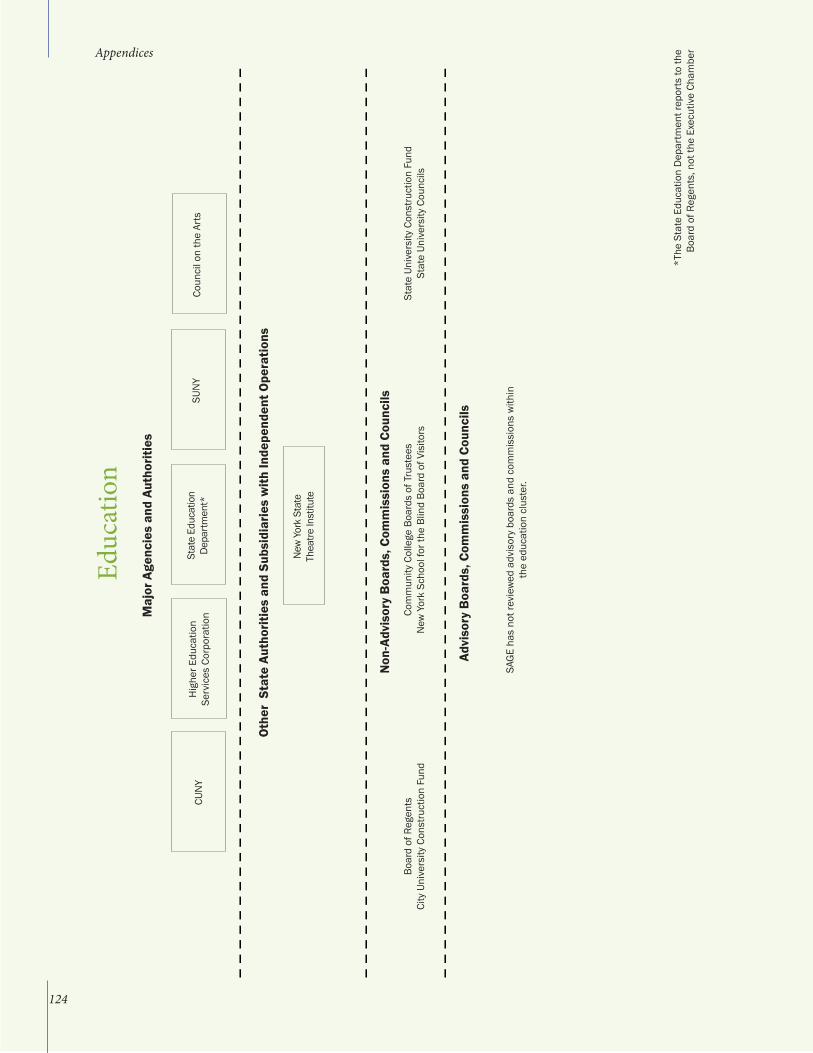
Chapter I: Introduction 9
Coun
cil o
n th
e Ar
tsCU
NY
Hig
her E
duca
tion
Serv
ices
Cor
pora
tion
Stat
e Ed
ucat
ion
Depa
rtmen
t*SU
NY
Educ
atio
nM
ajor
Age
ncie
s an
d Au
thor
ities
Oth
er S
tate
Aut
horit
ies
and
Subs
idia
ries
with
Inde
pend
ent O
pera
tions
Non
-Adv
isor
y B
oard
s, C
omm
issi
ons
and
Coun
cils
Boar
d of
Reg
ents
City
Uni
vers
ity C
onst
ruct
ion
Fund
Com
mun
ity C
olle
ge B
oard
s of
Tru
stee
sN
ew Y
ork
Scho
ol fo
r the
Blin
d Bo
ard
of V
isito
rs
SAG
E ha
s no
t rev
iew
ed a
dvis
ory
boar
ds a
nd c
omm
issi
ons
with
in
the
educ
atio
n cl
uste
r.
Stat
e Un
iver
sity
Con
stru
ctio
n Fu
ndSt
ate
Univ
ersi
ty C
ounc
ils
Advi
sory
Boa
rds,
Com
mis
sion
s an
d Co
unci
ls
New
Yor
k St
ate
Thea
tre In
stitu
te
*The
Sta
te E
duca
tion
Dep
artm
ent r
epor
ts to
the
Boar
d of
Reg
ents
, not
the
Exec
utiv
e Ch
ambe
r Appendices
124
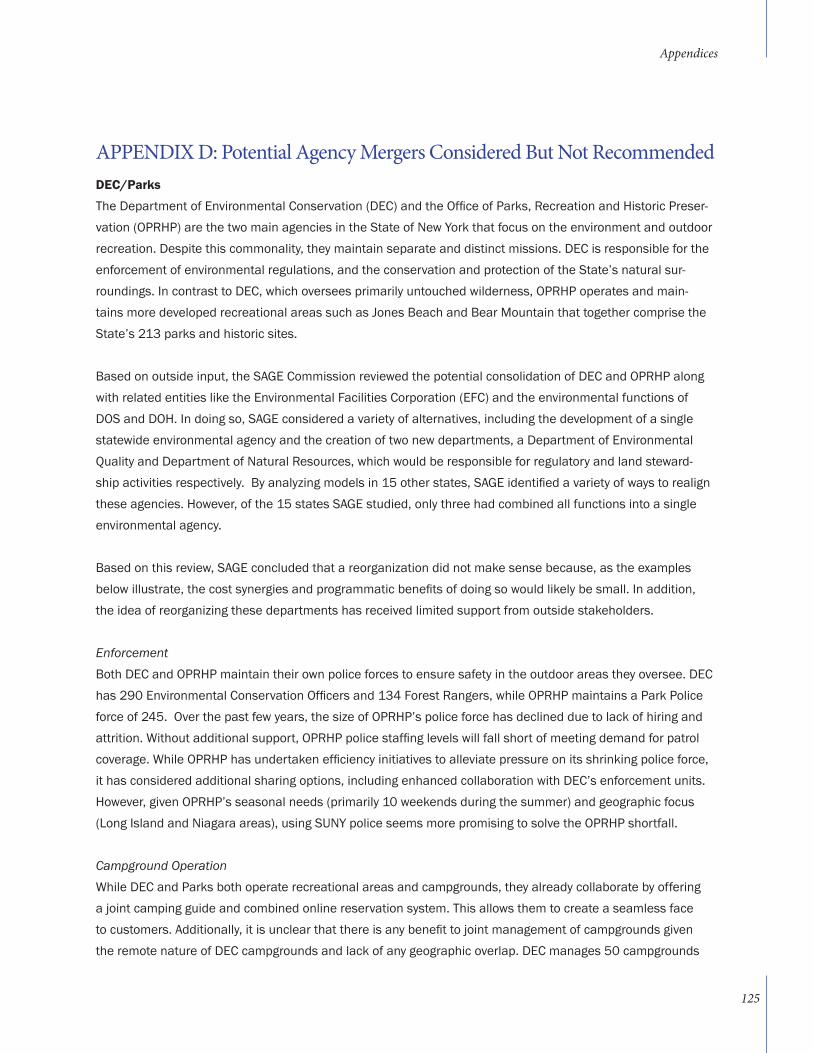
Appendices
DEC/Parks
The Department of Environmental Conservation (DEC) and the Office of Parks, Recreation and Historic Preser-vation (OPRHP) are the two main agencies in the State of New York that focus on the environment and outdoor recreation. Despite this commonality, they maintain separate and distinct missions. DEC is responsible for the enforcement of environmental regulations, and the conservation and protection of the State’s natural sur-roundings. In contrast to DEC, which oversees primarily untouched wilderness, OPRHP operates and main-tains more developed recreational areas such as Jones Beach and Bear Mountain that together comprise the State’s 213 parks and historic sites.
Based on outside input, the SAGE Commission reviewed the potential consolidation of DEC and OPRHP along with related entities like the Environmental Facilities Corporation (EFC) and the environmental functions of DOS and DOH. In doing so, SAGE considered a variety of alternatives, including the development of a single statewide environmental agency and the creation of two new departments, a Department of Environmental Quality and Department of Natural Resources, which would be responsible for regulatory and land steward-ship activities respectively. By analyzing models in 15 other states, SAGE identified a variety of ways to realign these agencies. However, of the 15 states SAGE studied, only three had combined all functions into a single environmental agency.
Based on this review, SAGE concluded that a reorganization did not make sense because, as the examples below illustrate, the cost synergies and programmatic benefits of doing so would likely be small. In addition, the idea of reorganizing these departments has received limited support from outside stakeholders.
EnforcementBoth DEC and OPRHP maintain their own police forces to ensure safety in the outdoor areas they oversee. DEC has 290 Environmental Conservation Officers and 134 Forest Rangers, while OPRHP maintains a Park Police force of 245. Over the past few years, the size of OPRHP’s police force has declined due to lack of hiring and attrition. Without additional support, OPRHP police staffing levels will fall short of meeting demand for patrol coverage. While OPRHP has undertaken efficiency initiatives to alleviate pressure on its shrinking police force, it has considered additional sharing options, including enhanced collaboration with DEC’s enforcement units. However, given OPRHP’s seasonal needs (primarily 10 weekends during the summer) and geographic focus (Long Island and Niagara areas), using SUNY police seems more promising to solve the OPRHP shortfall.
Campground OperationWhile DEC and Parks both operate recreational areas and campgrounds, they already collaborate by offering a joint camping guide and combined online reservation system. This allows them to create a seamless face to customers. Additionally, it is unclear that there is any benefit to joint management of campgrounds given the remote nature of DEC campgrounds and lack of any geographic overlap. DEC manages 50 campgrounds
APPENDIX D: Potential Agency Mergers Considered But Not Recommended
Boar
d of
Reg
ents
City
Uni
vers
ity C
onst
ruct
ion
Fund
Com
mun
ity C
olle
ge B
oard
s of
Tru
stee
sN
ew Y
ork
Scho
ol fo
r the
Blin
d Bo
ard
of V
isito
rs
SAG
E ha
s no
t rev
iew
ed a
dvis
ory
boar
ds a
nd c
omm
issi
ons
with
in
the
educ
atio
n cl
uste
r.
Stat
e Un
iver
sity
Con
stru
ctio
n Fu
ndSt
ate
Univ
ersi
ty C
ounc
ils
125
located in the Catskill and Adirondack parks, while Parks manages campsites throughout the rest of the State.
There were areas SAGE identified where the two agencies could work together. However, SAGE concluded that this could be accomplished through programmatic realignment rather than a full-scale reorganization:
Land AcquisitionIn discussions with SAGE, both DEC and Parks raised land acquisition as a common function that might be consolidated. Both agencies perform essentially the same function and jointly submit an annual report to the Governor and selected legislative leaders detailing their land acquisition activities for that year. DEC currently has a larger group (5-10 FTEs) that does this compared to OPRHP, which has only 2-3 FTEs. Furthermore, DEC takes a more risk-averse approach which results in a more cumbersome and time consuming process – in some cases taking up to 3-4 years simply to accept donated land. SAGE believes there is an opportunity here to not only combine functions but also to streamline DEC’s process to achieve efficiencies.
Land ManagementFinally, in certain cases where DEC and Parks land border one another, it may make sense to consolidate land management functions under one entity, or at minimum increase land management coordination between the two agencies. One example of this would be where a developed park area is surrounded by forest. Parks and DEC already did a first iteration of this some time ago, however, there are more areas where Parks and DEC have land lying adjacent to one another that could benefit from a more consolidated management approach.
Human Services
Two agencies, the Office of Children and Family Services (OCFS) and the Office of Temporary and Disability As-sistance (OTDA), are primarily responsible for New York State’s social services system. OCFS is responsible for New York’s juvenile justice system, the foster care and adoption system, child and adult protective and preven-tive services, and the regulation of child care. OTDA primarily provides economic related support for low-income New Yorkers through the temporary cash assistance, heating assistance, and food assistance programs. OTDA also has responsibilities relating to homelessness, including the eviction prevention program and oversight of homeless shelters. Both agencies supervise local social services districts and not-for-profit provider organiza-tions in the administration and delivery of their respective services. Additionally, both agencies were formerly part of the NYS Department of Social Services (DSS), and were created as separate entities in 1997 when DSS was legislatively redesigned.
Since these two agencies were previously consolidated within DSS, many presume that a reintegration and merger of OCFS and OTDA would result in enhanced service delivery, better outcomes, and reduced costs. To better understand whether this was the case, the SAGE Commission conducted an in-depth examination of a potential merger between OCFS and OTDA. SAGE Commission staff interviewed thirty-five key external stake-holders, including not-for-profit service provider organizations and officials at the county, city, and federal levels
Appendices
126
of government. Internally, staff reviewed any relevant agency data and conducted over thirty focus groups with OCFS and OTDA employees and thirteen executives from the agencies and the Governor’s office. Staff also consulted with a variety of national experts from Governing Magazine, Harvard’s Kennedy School, the Annie E. Casey Foundation, Rockefeller Foundation, nationally recognized consulting firms, and academics from schools of social welfare regarding structural reforms in human services.
While the SAGE Commission’s review exposed a range of opinions about whether a merger between OCFS and OTDA was advisable, a majority did not support a merger. After further analysis, the SAGE Commission concurs with this position, and recommends against consolidating OCFS and OTDA. This recommendation is motivated by several concerns.
First, the core missions of OCFS and OTDA do not sufficiently overlap to support the idea of a merger. Though both agencies serve similar populations and oversee the same local social services districts, there are signifi-cant differences in the specialized nature of their work. OTDA mostly focuses on administering economic sup-port for low income individuals, while OCFS primarily focuses on child welfare, the operation of juvenile justice facilities, and the regulation of over 22,000 daycare and child care settings.
These differences in the core missions of the respective agencies have resulted in the agencies developing different internal competencies. Generally, OTDA is highly specialized around developing State policy, and providing technical assistance, training, oversight and financial services to local social services districts as they distribute public assistance. In contrast, OCFS’s functions are highly operational and include the day to day oversight and operation of juvenile justice facilities and running the State Child Abuse Hotline. Simply put, the primary work and day-to-day focus is different between the two agencies. Second, child welfare and juvenile justice are challenging and crisis-prone areas that often generate negative publicity, and as a result, tend to monopolize management attention. There is a real risk that a merger would result in a reduced quality of service in areas that are today performed by OTDA as management attention is diverted to managing the child welfare and juvenile justices systems. Multiple interviews with local district DSS Commissioners echoed this concern.
Additionally, when DSS was redesigned in 1998, child welfare experts, advocates, legislators, and others pushed for a division of functions between OCFS and OTDA because they wanted to see an undiluted focus on child welfare and the juvenile justice program. While there are many variables involved, this strategy appears to have worked. Separation has allowed each agency to focus more on what needed to be done in their respective programs.
Third, OCFS and OTDA already share a number of services, including cost allocation, some fair hearings, claim-ing, cash management, auditing, some training contracts and IT. The agencies coordinate closely with each other and are exploring further opportunities to share services. As a result, many of the potential benefits of a
Appendices
127
merger have already been achieved through the use of shared services.
Finally, as noted before, because economically disadvantaged New Yorkers are deeply affected by the programs offered by OCFS and OTDA, even the temporary disruption of a merger could have a negative impact on millions of lives. The recent economic crisis, which has increased the need for services to support low-income individu-als and families, further amplified this concern. For instance, the Supplemental Nutritional Assistance Program (a.k.a. food stamps) caseload has seen an astounding 60% increase since December 2008. The Commission believes that pursuing a merger of OCFS and OTDA, which would necessarily be time consuming and potentially disruptive, is particularly ill-advised in today’s stressed economic environment.
Long-Term Care
The State Office for the Aging’s (SOFA) primary function is to provide funding for and oversight of programs that enable hundreds of thousands of the frail elderly to continue to live independently outside of institutional care. These programs include the Supplemental Nutrition Assistance Program (SNAP), the Community Ser-vices for the Elderly Program (CSE), and the Expanded In-home Services for the Elderly Program (EISEP). These programs save the State money by helping to avoid the need for much more expensive institutional care that would likely increase Medicaid costs.
The Department of Health administers many programs for Medicaid-eligible New Yorkers that are similar to programs managed by SOFA, but which are much larger because of the vast pool of Medicaid funding. The State’s Personal Care Services Program provides services very similar to EISEP. The Long Term Home Health Care Program (LTHHCP) provides Medicaid waiver services such as day care and home delivered meals that are included in SOFA’s SNAP and CSE programs. However, because the programs administered by DOH are delivered within a “medical model” per federal law and guidance, they are more expensive than comparable programs offered by SOFA, and in many cases less attractive to the older New Yorkers who need these services. This is driven mainly by the federal Medicaid parameters, which impose a physician order requirement, as well as other, more expensive administrative processes.
In addition to these overlapping functions, there is a significant overlap between DOH’s goals in the area of long-term care and that of SOFA, namely, to provide support services to older adults that enable them to live independently rather than being placed in expensive and unwanted institutional care. The Cuomo Administration’s policy goals for long-term care include making much greater use of exactly the type of programs and delivery mechanisms that SOFA employs and that DOH uses to the extent possible within federal Medicaid regulations. These programs represent a cost effective and much desired alternative to institutional care.
One of the key recommendations of the Cuomo administration’s Medicaid Redesign Team (MRT) adopted in the 2011-12 Budget, was to transition of all Medicaid recipients to a form of managed or coordinated care within
Appendices
128
three years. A global or “capitated” payment under Managed Long-Term Care could provide substantially more federal funding for the progressive social supports for activities of daily living now provided by SOFA programs. Similarly, a federal waiver to expand this Managed Long-Term Care program to “dual eligibles” for Medicaid and Medicare would make substantial funding available to the types of cost-effective programs managed by SOFA.
At first blush, the significant overlap of functions and missions between DOH and SOFA suggest that a merger could improve the efficiency and program effectiveness of these two independent agencies. However, after substantial analysis, the Commission has concluded that the conditions that would make it possible to greatly expand the approach used by SOFA to help a broader range of older New Yorkers and other New Yorkers with physical disabilities avoid institutional care do not yet exist. Accordingly, the Commission believes that a bet-ter course of action is for the State to closely coordinate the two agencies’ policy objectives and consider a full integration if, and only if, the conditions are in place to ensure that the SOFA approach spreads to DOH’s programs for older New Yorkers who are Medicaid eligible, rather than having DOH’s “medical model” and cost structure spread to SOFA’s efficient and popular programs.
Appendices
129
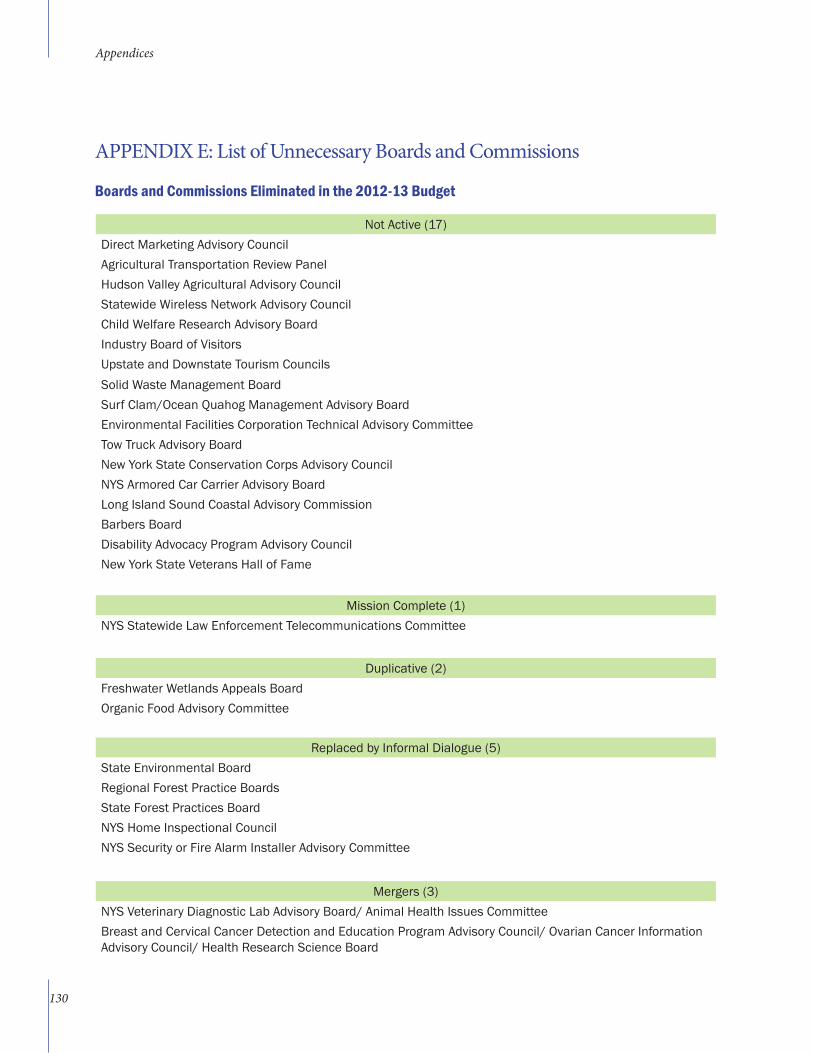
APPENDIX E: List of Unnecessary Boards and Commissions
Boards and Commissions Eliminated in the 2012-13 Budget
Not Active (17)Direct Marketing Advisory CouncilAgricultural Transportation Review PanelHudson Valley Agricultural Advisory CouncilStatewide Wireless Network Advisory CouncilChild Welfare Research Advisory BoardIndustry Board of VisitorsUpstate and Downstate Tourism CouncilsSolid Waste Management BoardSurf Clam/Ocean Quahog Management Advisory BoardEnvironmental Facilities Corporation Technical Advisory CommitteeTow Truck Advisory BoardNew York State Conservation Corps Advisory CouncilNYS Armored Car Carrier Advisory BoardLong Island Sound Coastal Advisory CommissionBarbers BoardDisability Advocacy Program Advisory Council New York State Veterans Hall of Fame
Mission Complete (1)NYS Statewide Law Enforcement Telecommunications Committee
Duplicative (2)Freshwater Wetlands Appeals BoardOrganic Food Advisory Committee
Replaced by Informal Dialogue (5)State Environmental Board Regional Forest Practice BoardsState Forest Practices BoardNYS Home Inspectional CouncilNYS Security or Fire Alarm Installer Advisory Committee
Mergers (3)NYS Veterinary Diagnostic Lab Advisory Board/ Animal Health Issues CommitteeBreast and Cervical Cancer Detection and Education Program Advisory Council/ Ovarian Cancer Information Advisory Council/ Health Research Science Board
Appendices
130
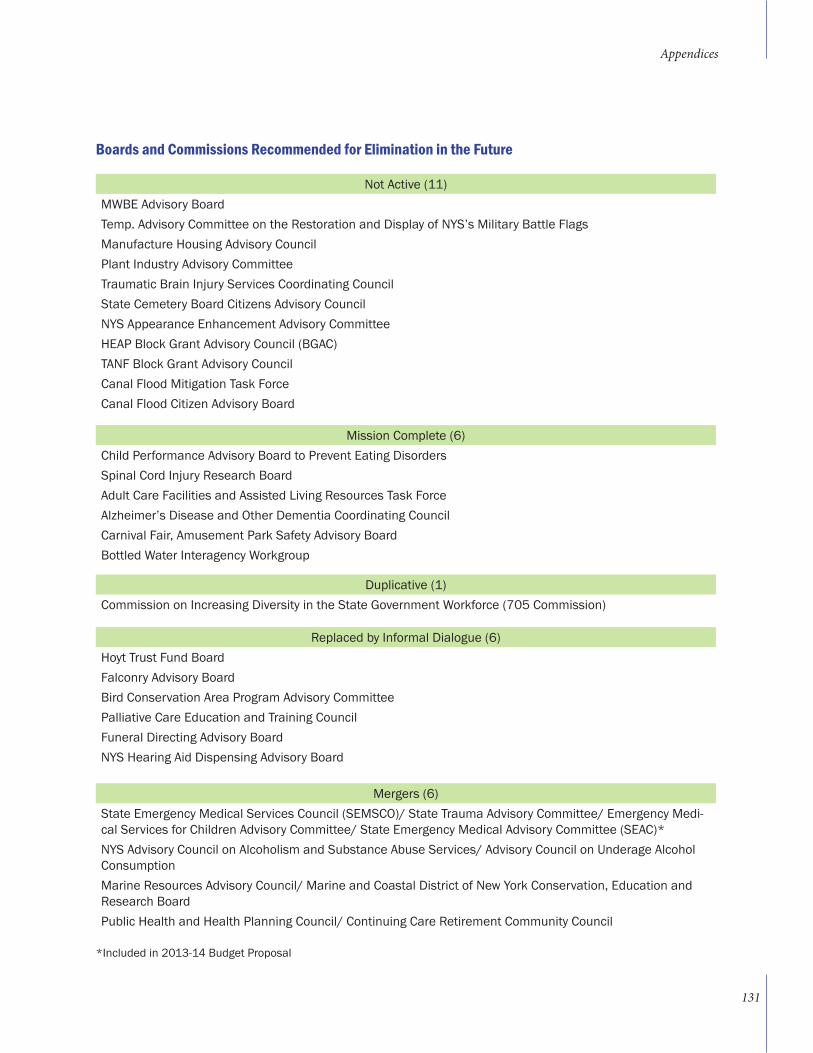
Not Active (11)MWBE Advisory Board Temp. Advisory Committee on the Restoration and Display of NYS’s Military Battle FlagsManufacture Housing Advisory CouncilPlant Industry Advisory CommitteeTraumatic Brain Injury Services Coordinating CouncilState Cemetery Board Citizens Advisory CouncilNYS Appearance Enhancement Advisory CommitteeHEAP Block Grant Advisory Council (BGAC)TANF Block Grant Advisory CouncilCanal Flood Mitigation Task Force Canal Flood Citizen Advisory Board
Mission Complete (6)Child Performance Advisory Board to Prevent Eating DisordersSpinal Cord Injury Research BoardAdult Care Facilities and Assisted Living Resources Task ForceAlzheimer’s Disease and Other Dementia Coordinating Council Carnival Fair, Amusement Park Safety Advisory BoardBottled Water Interagency Workgroup
Duplicative (1)Commission on Increasing Diversity in the State Government Workforce (705 Commission)
Replaced by Informal Dialogue (6)Hoyt Trust Fund BoardFalconry Advisory BoardBird Conservation Area Program Advisory CommitteePalliative Care Education and Training CouncilFuneral Directing Advisory BoardNYS Hearing Aid Dispensing Advisory Board
Mergers (6)State Emergency Medical Services Council (SEMSCO)/ State Trauma Advisory Committee/ Emergency Medi-cal Services for Children Advisory Committee/ State Emergency Medical Advisory Committee (SEAC)*NYS Advisory Council on Alcoholism and Substance Abuse Services/ Advisory Council on Underage Alcohol ConsumptionMarine Resources Advisory Council/ Marine and Coastal District of New York Conservation, Education and Research Board Public Health and Health Planning Council/ Continuing Care Retirement Community Council
*Included in 2013-14 Budget Proposal
Boards and Commissions Recommended for Elimination in the Future
Appendices
131
The following are major preliminary recommendations of the NYS Ready Commission, the NYS Respond Com-mission, the NYS 2100 Commission, and the Moreland Commission on Utility Storm Preparation and Response – all created by Governor Cuomo in response to Hurricane Sandy and other extreme weather events.
• Harden the NYC Subway System: Flood-proof subways and bus depots with vertical roll-down doors, vent closures, inflatable bladders, and upsized fixed pumps (with back-up power sources);
• Harden New York’s airports: Install elevated or submersible pump control panel, pump feeders and tide gates at airports;
• Harden New York’s fuel delivery system: Require that gas stations in strategic locations have on-site back-up power capacity and create a Strategic Fuel Reserve to protect NY from temporary disrup-tions in fuel supply;
• Harden New York’s utilities. PSC will require utilities to submit detailed implementation plans to harden their facilities, including raising substation wall and elevating transformer installations;
• Redesign New York’s Power System: Put real regulatory and enforcement teeth into the Public Service Commission;
• Privatize LIPA;
• World-Class Emergency Response Network: The state will create uniform training and protocols for all emergency personnel, including a SUNY/CUNY program certificate for all emergency workers in the state.
• Specialized Training for the National Guard: To build on the vital role that the National Guard plays in emergency response, the Governor proposed providing additional specialized training in key emergency response areas like power restoration, search-and-rescue, heavy equipment operation, crowd management and public safety where the Guard’s scale, skills and equipment can have a unique and powerful impact on restoring power faster, saving lives and other critical areas.
• Statewide Volunteer Network: To capitalize on New York’s spirit of volunteerism, the Governor pro-posed creating a Statewide Volunteer Network to mobilize and organize volunteers based on their skills, interests and resources.
APPENDIX F: List of Preliminary Recommendations by the Commissions Convened by the Governor in Response to Superstorm Sandy
Appendices
132
• Civilian Emergency Response Corps: To ensure that the necessary skills and expertise are avail-able and can be mobilized to effectively support rapid restoration of essential services and infrastructure, the Governor proposed a Civilian Emergency Response Corps made up of techni-cal and trades personnel—including electricians, pipefitters, line workers, landscapers, public works personnel, civil engineers and debris removal tradespeople—who can be trained, certified, credentialed and deployed to perform disaster response and recovery related tasks as part of a well-coordinated public/private-sector partnership.
• Private Sector Emergency Response Task Force: The Governor proposed creating a standing task force made up of chief logistics officers from key industry sectors that will create a plan in advance for the distribution of food, water and other supplies and execute the plan in a declared emergency.
• Citizen Education Campaign: The campaign would focus on preparing all New Yorkers as “in-house first responders.”
• Ensure that Vulnerable Populations Can Receive Help in an Emergency: The use of voluntary and effective Vulnerable Population databases will be expanded so first responders, outreach workers, and healthcare and human services personnel can find and serve those who may need assistance before, during, and after emergencies, including senior citizens, persons with disabilities, infants and children, and people with chronic medical conditions.
• Communicating with New Yorkers in an Emergency: Cell phone networks and other communications systems must be strengthened to ensure that first responders and citizens never lose the ability to communicate fully and instantly. In addition, New York will develop a program to allow mass text messages to be sent to all wireless phones in a chosen geographic area. In addition, the State will explore establishing a one-stop disaster recovery communications hub that is integrated with social networking, mobile messaging and chat tools—using all available means to reach New Yorkers.
Appendices
133
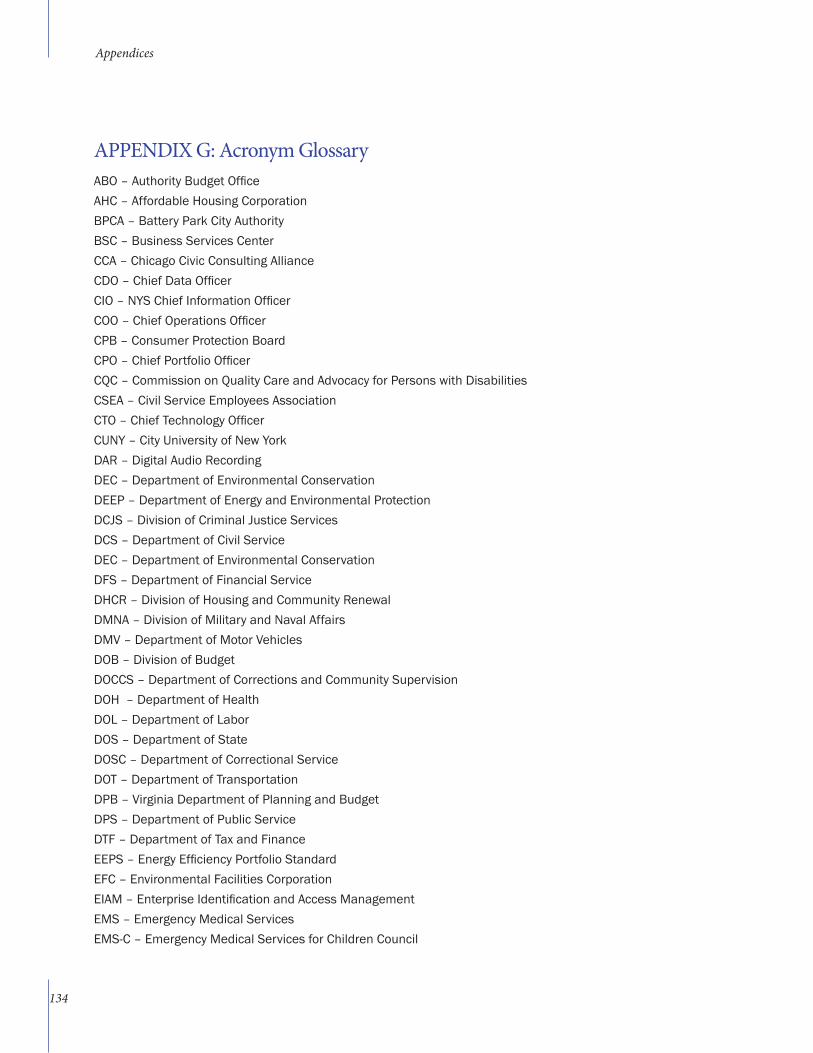
APPENDIX G: Acronym GlossaryABO – Authority Budget OfficeAHC – Affordable Housing CorporationBPCA – Battery Park City Authority BSC – Business Services CenterCCA – Chicago Civic Consulting Alliance CDO – Chief Data Officer CIO – NYS Chief Information OfficerCOO – Chief Operations OfficerCPB – Consumer Protection BoardCPO – Chief Portfolio OfficerCQC – Commission on Quality Care and Advocacy for Persons with Disabilities CSEA – Civil Service Employees AssociationCTO – Chief Technology Officer CUNY – City University of New YorkDAR – Digital Audio Recording DEC – Department of Environmental Conservation DEEP – Department of Energy and Environmental Protection DCJS – Division of Criminal Justice Services DCS – Department of Civil ServiceDEC – Department of Environmental ConservationDFS – Department of Financial ServiceDHCR – Division of Housing and Community RenewalDMNA – Division of Military and Naval AffairsDMV – Department of Motor Vehicles DOB – Division of Budget DOCCS – Department of Corrections and Community Supervision DOH – Department of HealthDOL – Department of Labor DOS – Department of StateDOSC – Department of Correctional ServiceDOT – Department of TransportationDPB – Virginia Department of Planning and BudgetDPS – Department of Public Service DTF – Department of Tax and Finance EEPS – Energy Efficiency Portfolio StandardEFC – Environmental Facilities Corporation EIAM – Enterprise Identification and Access ManagementEMS – Emergency Medical ServicesEMS-C – Emergency Medical Services for Children Council
Appendices
134
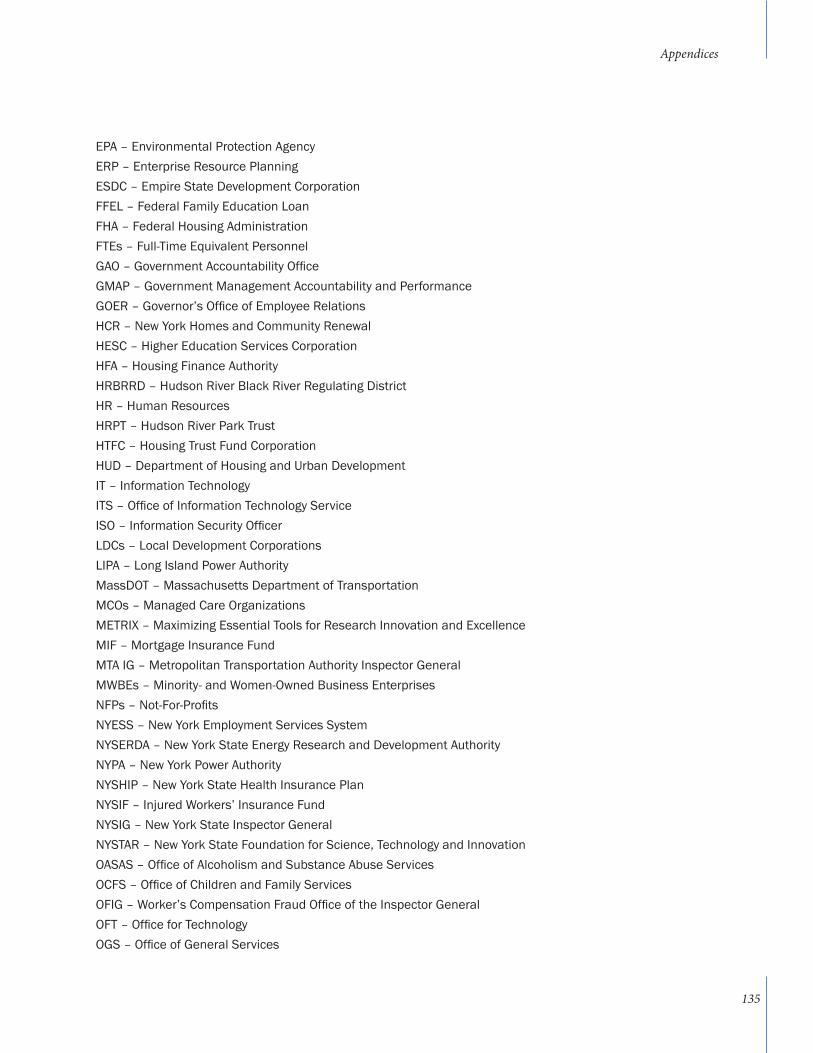
EPA – Environmental Protection Agency ERP – Enterprise Resource PlanningESDC – Empire State Development CorporationFFEL – Federal Family Education Loan FHA – Federal Housing AdministrationFTEs – Full-Time Equivalent PersonnelGAO – Government Accountability OfficeGMAP – Government Management Accountability and PerformanceGOER – Governor’s Office of Employee Relations HCR – New York Homes and Community Renewal HESC – Higher Education Services CorporationHFA – Housing Finance AuthorityHRBRRD – Hudson River Black River Regulating DistrictHR – Human Resources HRPT – Hudson River Park TrustHTFC – Housing Trust Fund CorporationHUD – Department of Housing and Urban DevelopmentIT – Information Technology ITS – Office of Information Technology ServiceISO – Information Security Officer LDCs – Local Development Corporations LIPA – Long Island Power Authority MassDOT – Massachusetts Department of TransportationMCOs – Managed Care OrganizationsMETRIX – Maximizing Essential Tools for Research Innovation and ExcellenceMIF – Mortgage Insurance FundMTA IG – Metropolitan Transportation Authority Inspector General MWBEs – Minority- and Women-Owned Business EnterprisesNFPs – Not-For-Profits NYESS – New York Employment Services SystemNYSERDA – New York State Energy Research and Development Authority NYPA – New York Power AuthorityNYSHIP – New York State Health Insurance PlanNYSIF – Injured Workers’ Insurance FundNYSIG – New York State Inspector General NYSTAR – New York State Foundation for Science, Technology and InnovationOASAS – Office of Alcoholism and Substance Abuse ServicesOCFS – Office of Children and Family ServicesOFIG – Worker’s Compensation Fraud Office of the Inspector GeneralOFT – Office for TechnologyOGS – Office of General Services
Appendices
135
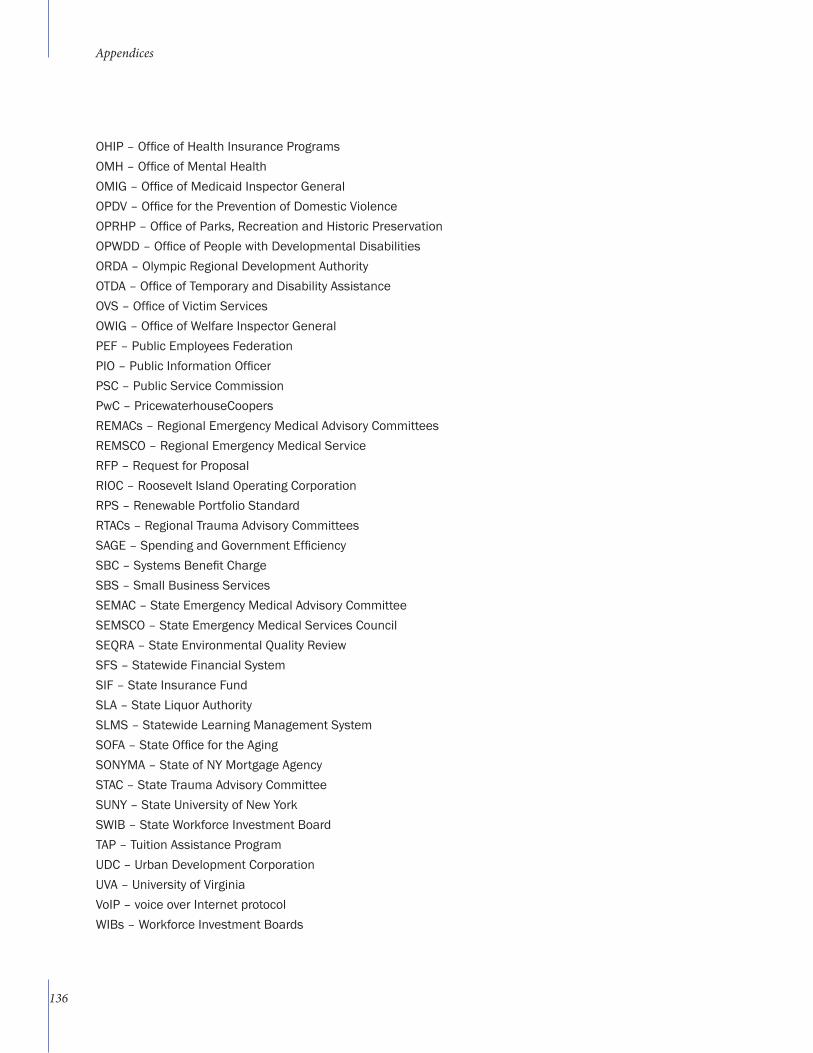
OHIP – Office of Health Insurance ProgramsOMH – Office of Mental Health OMIG – Office of Medicaid Inspector GeneralOPDV – Office for the Prevention of Domestic Violence OPRHP – Office of Parks, Recreation and Historic PreservationOPWDD – Office of People with Developmental Disabilities ORDA – Olympic Regional Development AuthorityOTDA – Office of Temporary and Disability AssistanceOVS – Office of Victim ServicesOWIG – Office of Welfare Inspector General PEF – Public Employees FederationPIO – Public Information Officer PSC – Public Service Commission PwC – PricewaterhouseCoopers REMACs – Regional Emergency Medical Advisory CommitteesREMSCO – Regional Emergency Medical ServiceRFP – Request for Proposal RIOC – Roosevelt Island Operating Corporation RPS – Renewable Portfolio Standard RTACs – Regional Trauma Advisory CommitteesSAGE – Spending and Government Efficiency SBC – Systems Benefit ChargeSBS – Small Business ServicesSEMAC – State Emergency Medical Advisory CommitteeSEMSCO – State Emergency Medical Services CouncilSEQRA – State Environmental Quality ReviewSFS – Statewide Financial System SIF – State Insurance FundSLA – State Liquor AuthoritySLMS – Statewide Learning Management SystemSOFA – State Office for the AgingSONYMA – State of NY Mortgage Agency STAC – State Trauma Advisory CommitteeSUNY – State University of New YorkSWIB – State Workforce Investment BoardTAP – Tuition Assistance Program UDC – Urban Development Corporation UVA – University of VirginiaVoIP – voice over Internet protocolWIBs – Workforce Investment Boards
Appendices
136


![Sage, Angie - [Septimus Heap] 02 Zborul](https://static.fdocuments.in/doc/165x107/577cd2b71a28ab9e7895d338/sage-angie-septimus-heap-02-zborul.jpg)