NYC School Survey Citywide Results...Data included from all schools, including District 75, YABC,...
15
August 2018 NYC School Survey Citywide Results 1
Transcript of NYC School Survey Citywide Results...Data included from all schools, including District 75, YABC,...
August 2018
NYC School Survey
Citywide Results
1
2
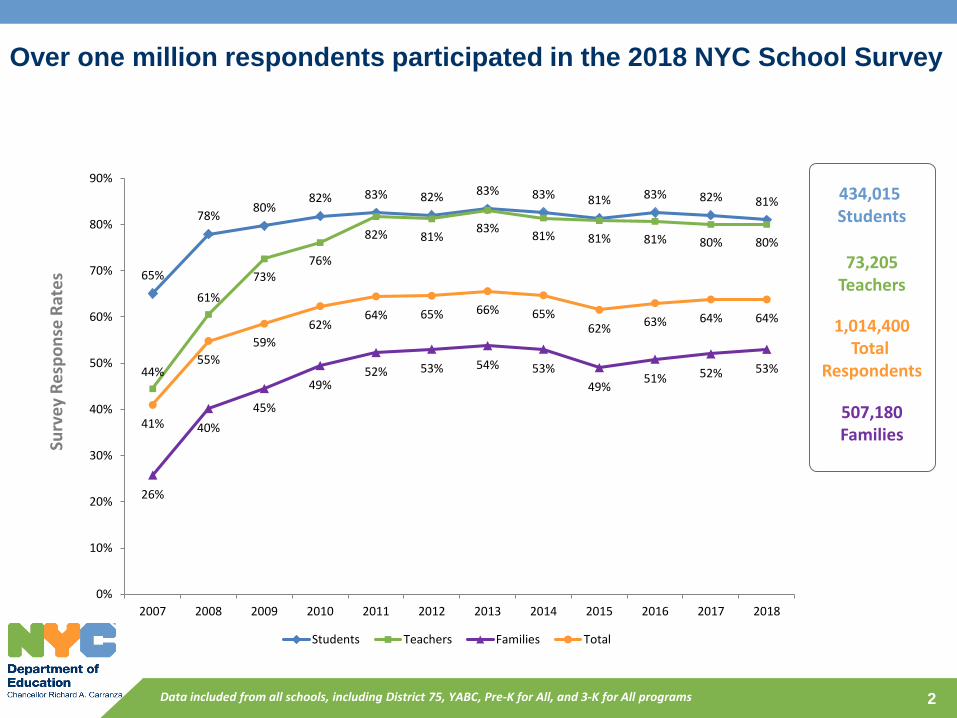
Over one million respondents participated in the 2018 NYC School SurveySu
rve
y R
esp
on
se R
ate
s
Data included from all schools, including District 75, YABC, Pre-K for All, and 3-K for All programs
434,015 Students
73,205Teachers
1,014,400Total
Respondents
507,180Families
65%
78%80%
82% 83% 82% 83% 83% 81% 83% 82% 81%
44%
61%
73%76%
82% 81%83%
81% 81% 81% 80% 80%
26%
40%
45%
49%52% 53% 54% 53%
49%51% 52% 53%
41%
55%
59%
62%64% 65% 66% 65%
62%63% 64% 64%
0%
10%
20%
30%
40%
50%
60%
70%
80%
90%
2007 2008 2009 2010 2011 2012 2013 2014 2015 2016 2017 2018
Students Teachers Families Total
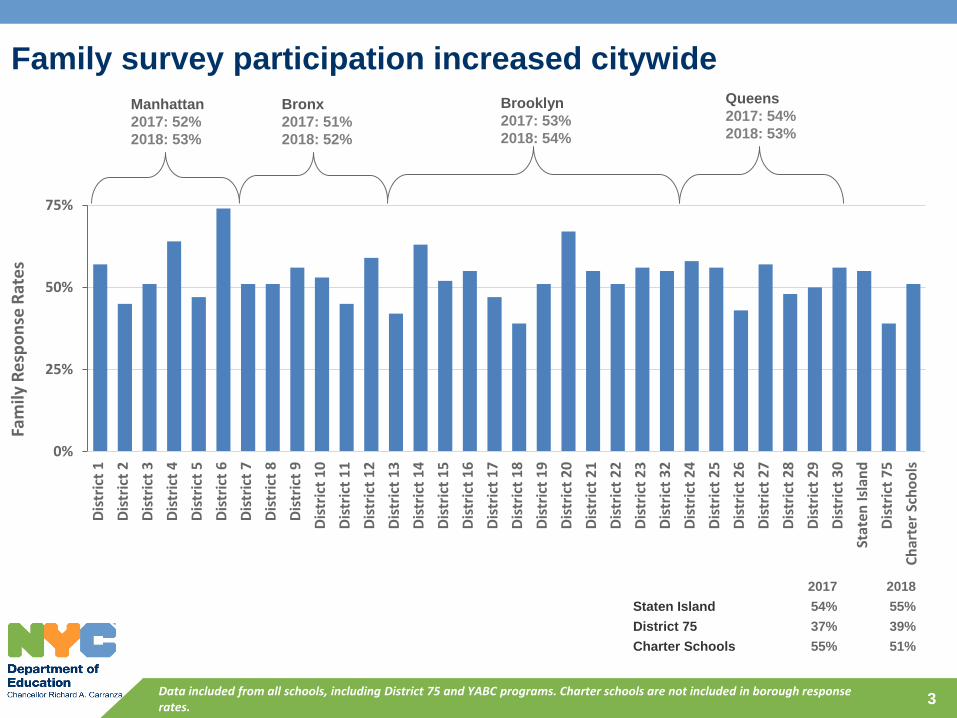
Family survey participation increased citywide
3
Fam
ilyR
esp
on
se R
ate
s
Manhattan
2017: 52%
2018: 53%
Bronx
2017: 51%
2018: 52%
Brooklyn
2017: 53%
2018: 54%
Queens
2017: 54%
2018: 53%
2017 2018
Staten Island 54% 55%
District 75 37% 39%
Charter Schools 55% 51%
Data included from all schools, including District 75 and YABC programs. Charter schools are not included in borough response rates.
0%
25%
50%
75%
Dis
tric
t 1
Dis
tric
t 2
Dis
tric
t 3
Dis
tric
t 4
Dis
tric
t 5
Dis
tric
t 6
Dis
tric
t 7
Dis
tric
t 8
Dis
tric
t 9
Dis
tric
t 1
0
Dis
tric
t 1
1
Dis
tric
t 1
2
Dis
tric
t 1
3
Dis
tric
t 1
4
Dis
tric
t 1
5
Dis
tric
t 1
6
Dis
tric
t 1
7
Dis
tric
t 1
8
Dis
tric
t 1
9
Dis
tric
t 2
0
Dis
tric
t 2
1
Dis
tric
t 2
2
Dis
tric
t 2
3
Dis
tric
t 3
2
Dis
tric
t 2
4
Dis
tric
t 2
5
Dis
tric
t 2
6
Dis
tric
t 2
7
Dis
tric
t 2
8
Dis
tric
t 2
9
Dis
tric
t 3
0
Stat
en Is
lan
d
Dis
tric
t 7
5
Ch
arte
r Sc
ho
ols
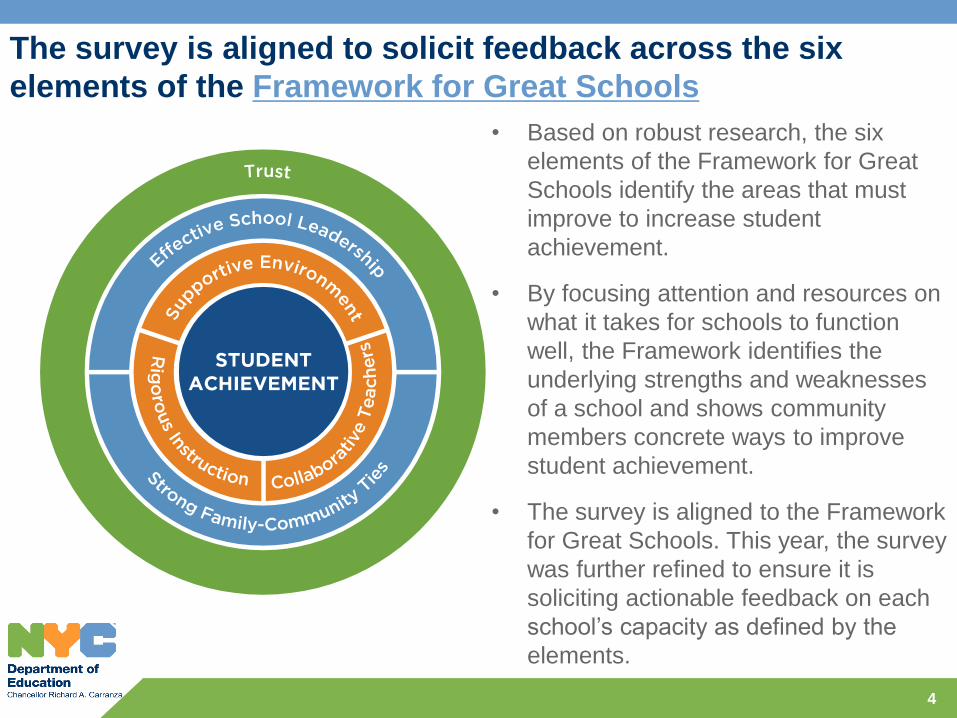
The survey is aligned to solicit feedback across the six
elements of the Framework for Great Schools
4
• Based on robust research, the six
elements of the Framework for Great
Schools identify the areas that must
improve to increase student
achievement.
• By focusing attention and resources on
what it takes for schools to function
well, the Framework identifies the
underlying strengths and weaknesses
of a school and shows community
members concrete ways to improve
student achievement.
• The survey is aligned to the Framework
for Great Schools. This year, the survey
was further refined to ensure it is
soliciting actionable feedback on each
school’s capacity as defined by the
elements.
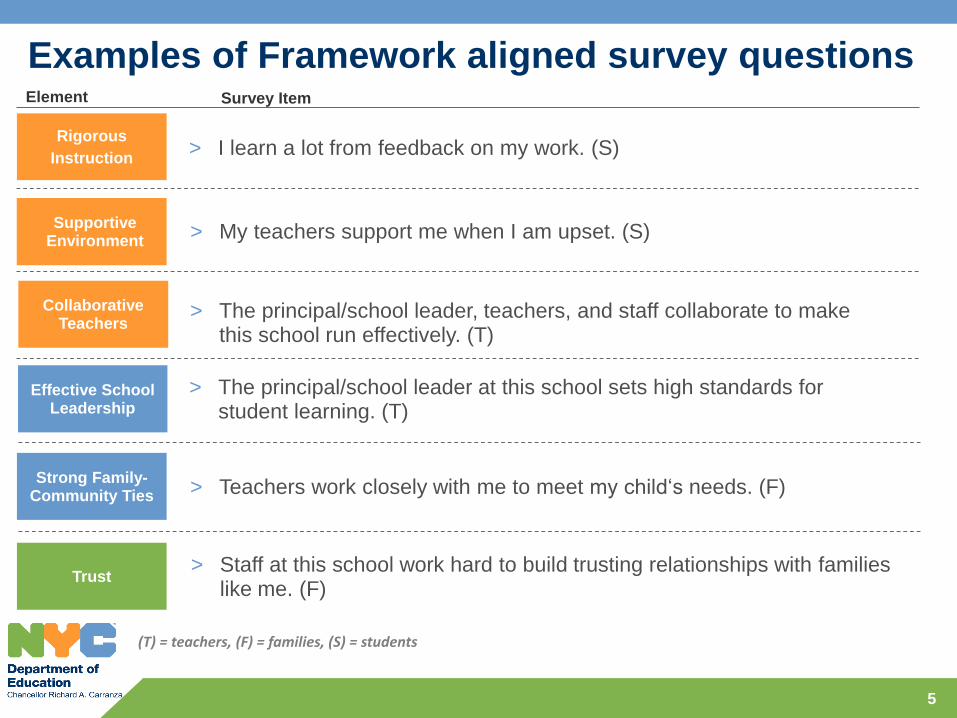
Examples of Framework aligned survey questions
5
Collaborative Teachers
Supportive Environment
Rigorous
Instruction
Trust
Element Survey Item
> Staff at this school work hard to build trusting relationships with families like me. (F)
> I learn a lot from feedback on my work. (S)
> My teachers support me when I am upset. (S)
> The principal/school leader, teachers, and staff collaborate to make this school run effectively. (T)
Effective School Leadership
> Teachers work closely with me to meet my child‘s needs. (F)
> The principal/school leader at this school sets high standards for student learning. (T)
Strong Family-Community Ties
Effective School Leadership
(T) = teachers, (F) = families, (S) = students
6
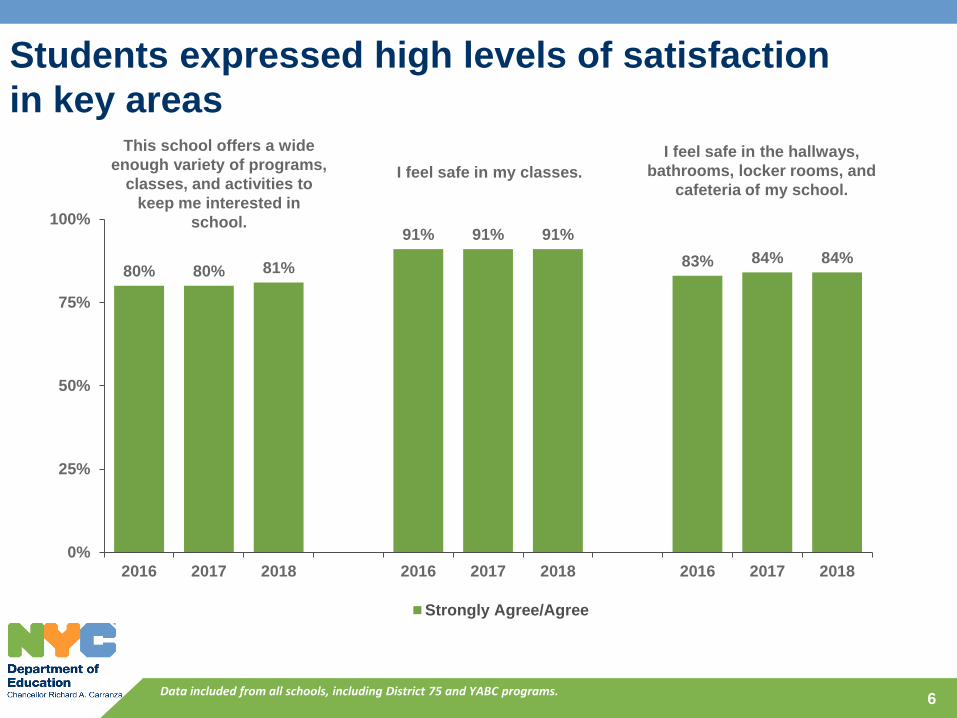
Students expressed high levels of satisfaction
in key areasThis school offers a wide
enough variety of programs,
classes, and activities to
keep me interested in
school.
I feel safe in my classes.
I feel safe in the hallways,
bathrooms, locker rooms, and
cafeteria of my school.
Data included from all schools, including District 75 and YABC programs.
80% 80% 81%
91% 91% 91%
83% 84% 84%
0%
25%
50%
75%
100%
2016 2017 2018 2016 2017 2018 2016 2017 2018
Strongly Agree/Agree
7
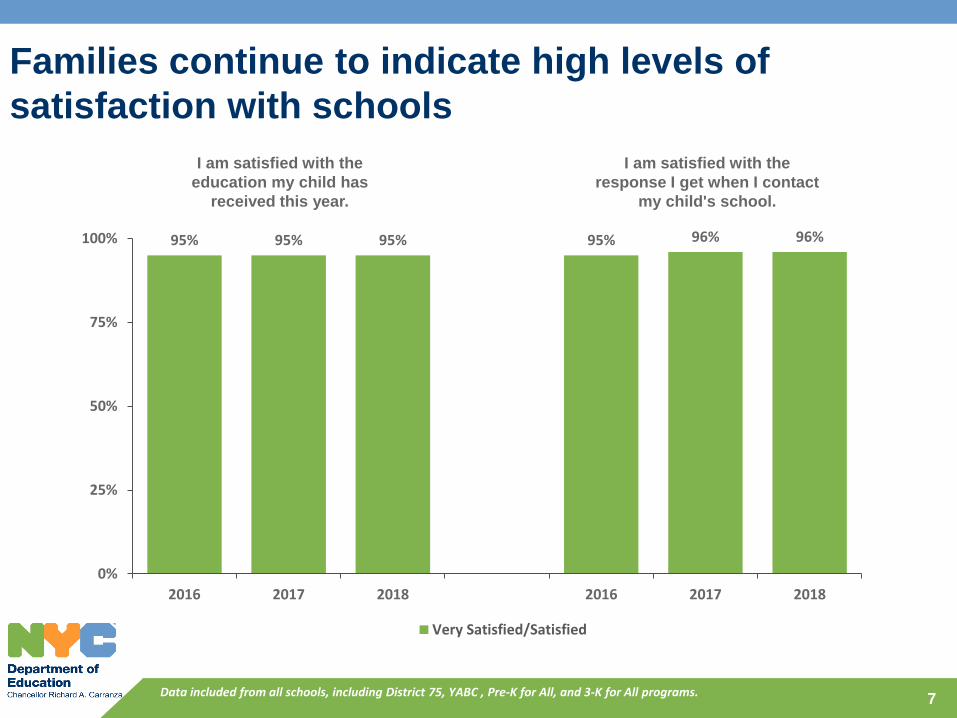
Families continue to indicate high levels of
satisfaction with schools
I am satisfied with the
education my child has
received this year.
I am satisfied with the
response I get when I contact
my child's school.
Data included from all schools, including District 75, YABC , Pre-K for All, and 3-K for All programs.
95% 95% 95% 95% 96% 96%
0%
25%
50%
75%
100%
2016 2017 2018 2016 2017 2018
Very Satisfied/Satisfied

I feel good about the
way that my child’s
teacher helped my
child adjust to pre-K
or 3-K.
My child’s teacher
gives me helpful
ideas about how I
can support my
child’s learning.
8
Families of students in Pre-K for All/3-K for All report that they continue
to feel supported by their programs
My child’s teacher
lets me know that I
can make a difference
in my child’s
learning.
2018 data includes responses from families of students in Pre-K for All and 3-K for All programs.
97% 98% 98%95% 95% 95% 95% 95% 95%
0%
25%
50%
75%
100%
2016 2017 2018 2016 2017 2018 2016 2017 2018
Strongly Agree/Agree
9
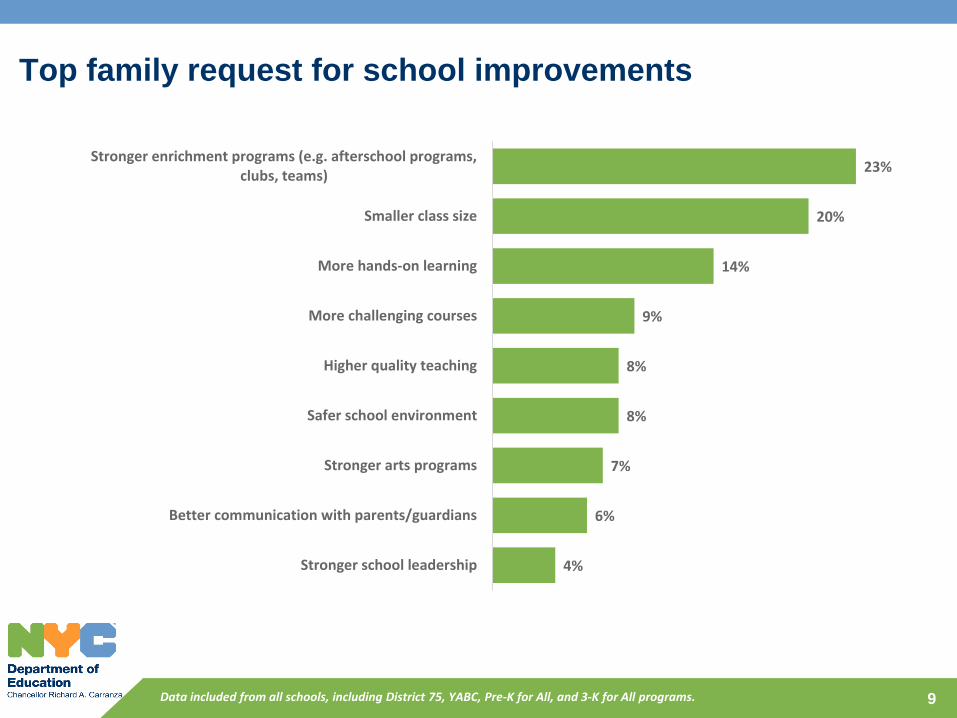
Top family request for school improvements
Data included from all schools, including District 75, YABC, Pre-K for All, and 3-K for All programs.
4%
6%
7%
8%
8%
9%
14%
20%
23%
Stronger school leadership
Better communication with parents/guardians
Stronger arts programs
Safer school environment
Higher quality teaching
More challenging courses
More hands-on learning
Smaller class size
Stronger enrichment programs (e.g. afterschool programs,clubs, teams)
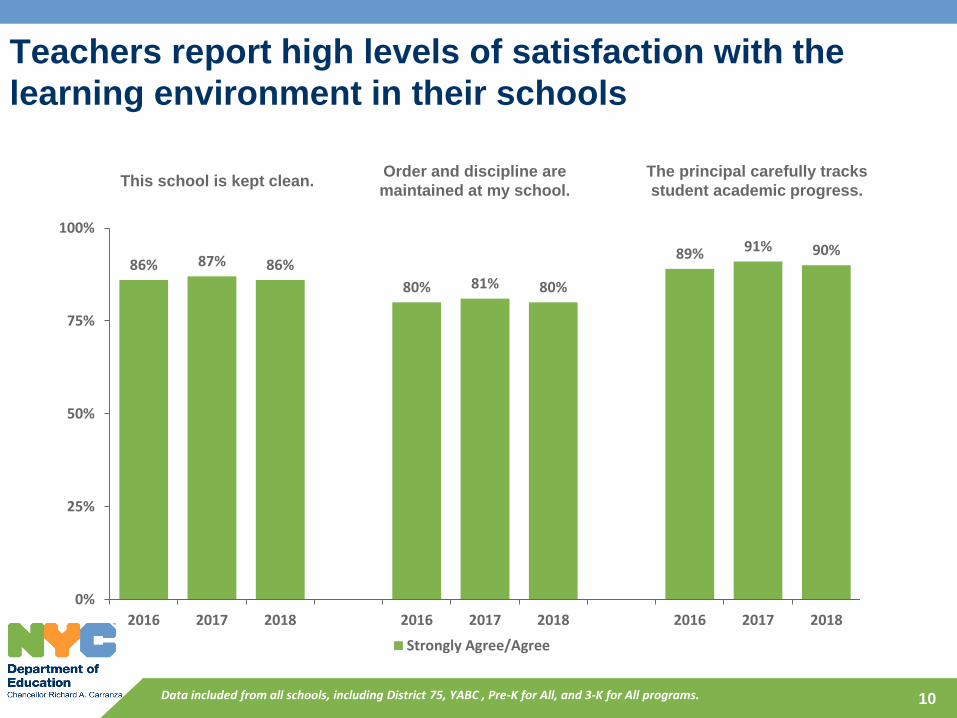
Order and discipline are
maintained at my school.This school is kept clean.
10
Teachers report high levels of satisfaction with the
learning environment in their schools
Data included from all schools, including District 75, YABC , Pre-K for All, and 3-K for All programs.
The principal carefully tracks
student academic progress.
86% 87% 86%
80% 81% 80%
89% 91% 90%
0%
25%
50%
75%
100%
2016 2017 2018 2016 2017 2018 2016 2017 2018
Strongly Agree/Agree
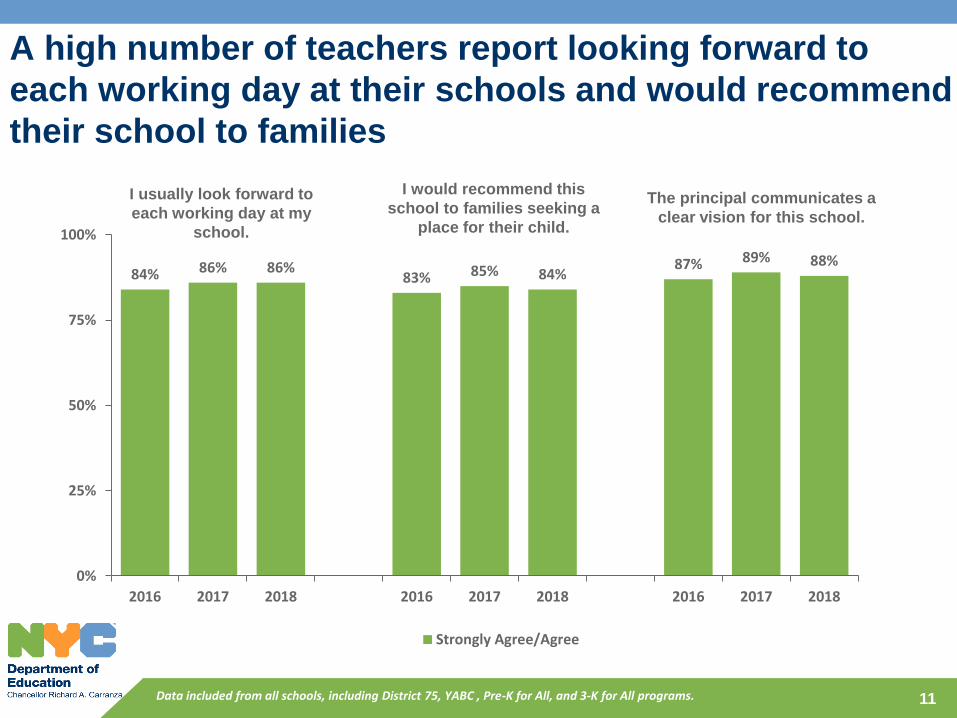
I usually look forward to
each working day at my
school.
I would recommend this
school to families seeking a
place for their child.
11
A high number of teachers report looking forward to
each working day at their schools and would recommend
their school to families
The principal communicates a
clear vision for this school.
84% 86% 86%83% 85% 84%
87% 89% 88%
0%
25%
50%
75%
100%
2016 2017 2018 2016 2017 2018 2016 2017 2018
Strongly Agree/Agree
Data included from all schools, including District 75, YABC , Pre-K for All, and 3-K for All programs.
12
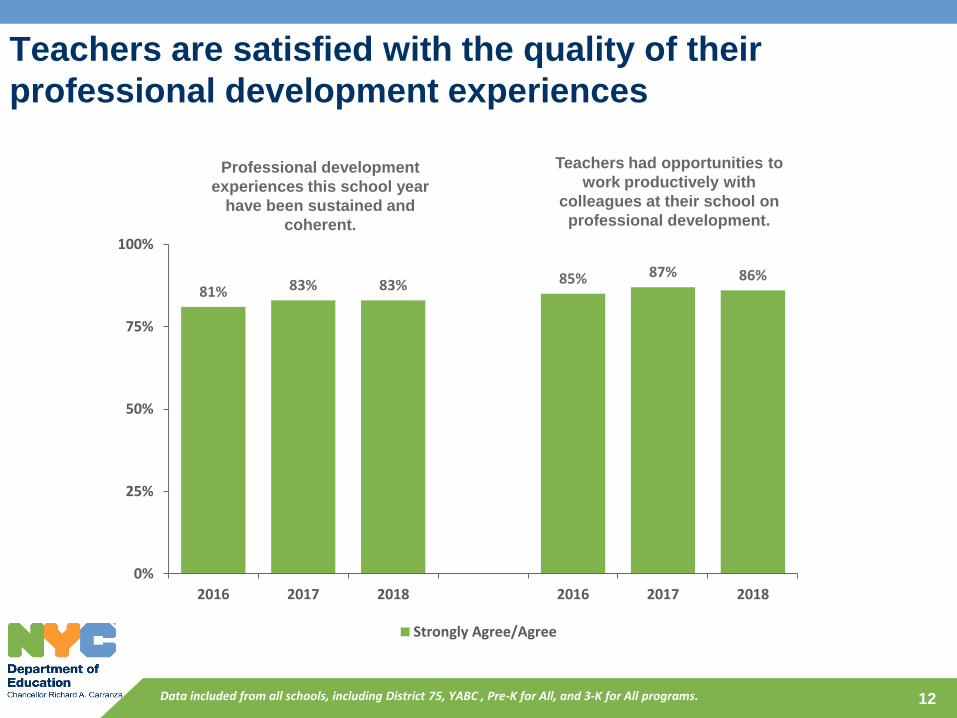
Teachers are satisfied with the quality of their
professional development experiences
Professional development
experiences this school year
have been sustained and
coherent.
Teachers had opportunities to
work productively with
colleagues at their school on
professional development.
81% 83% 83% 85% 87% 86%
0%
25%
50%
75%
100%
2016 2017 2018 2016 2017 2018
Strongly Agree/Agree
Data included from all schools, including District 75, YABC , Pre-K for All, and 3-K for All programs.
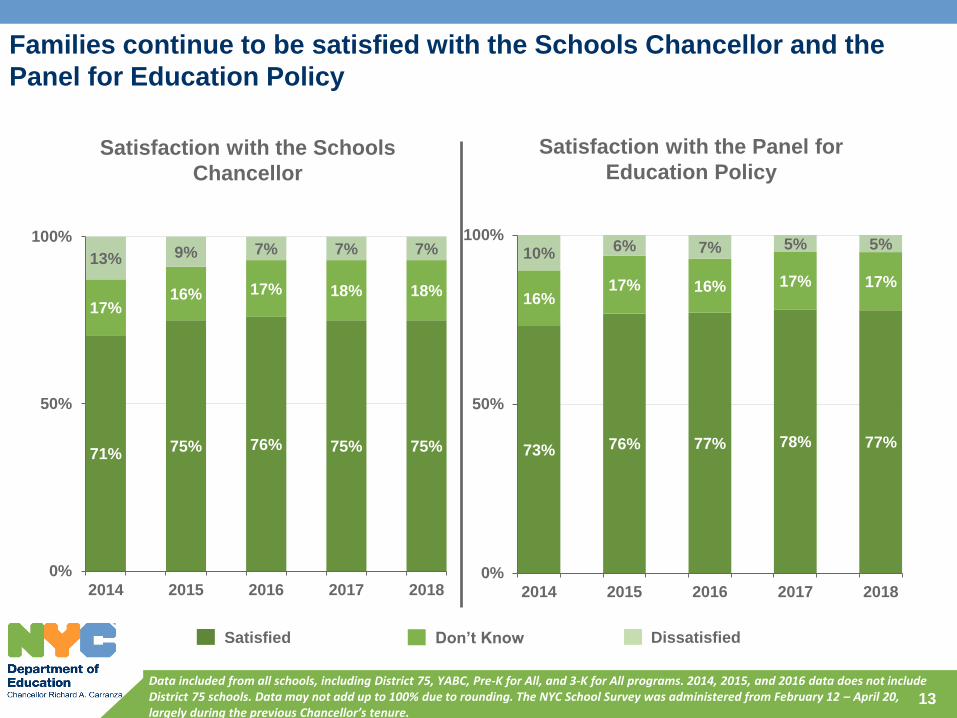
Families continue to be satisfied with the Schools Chancellor and the
Panel for Education Policy
Satisfaction with the Schools
Chancellor
Satisfaction with the Panel for
Education Policy
Satisfied Don’t Know Dissatisfied
13
Data included from all schools, including District 75, YABC, Pre-K for All, and 3-K for All programs. 2014, 2015, and 2016 data does not include District 75 schools. Data may not add up to 100% due to rounding. The NYC School Survey was administered from February 12 – April 20, largely during the previous Chancellor’s tenure.
71%75% 76% 75% 75%
17%16% 17% 18% 18%
13% 9% 7% 7% 7%
0%
50%
100%
2014 2015 2016 2017 2018
73% 76% 77% 78% 77%
16%17% 16% 17% 17%
10% 6% 7% 5% 5%
0%
50%
100%
2014 2015 2016 2017 2018
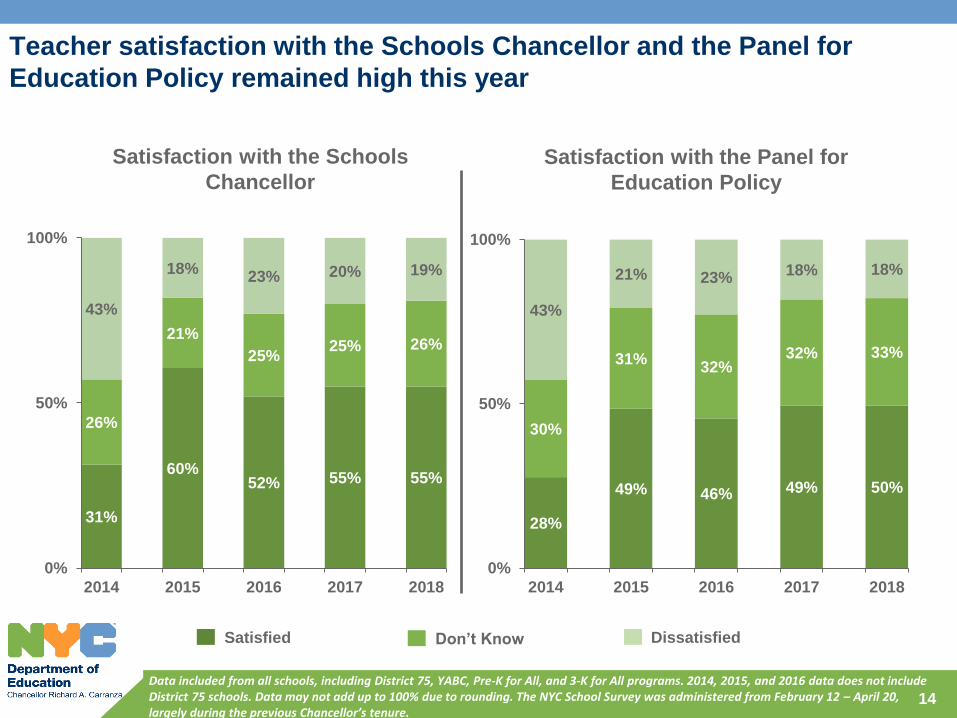
Teacher satisfaction with the Schools Chancellor and the Panel for
Education Policy remained high this year
Satisfaction with the Schools
Chancellor
Satisfaction with the Panel for
Education Policy
14
Satisfied Don’t Know Dissatisfied
31%
60%52% 55% 55%
26%
21%
25%25% 26%
43%
18%23% 20% 19%
0%
50%
100%
2014 2015 2016 2017 2018
28%
49% 46% 49% 50%
30%
31%32%
32% 33%
43%
21% 23%18% 18%
0%
50%
100%
2014 2015 2016 2017 2018
Data included from all schools, including District 75, YABC, Pre-K for All, and 3-K for All programs. 2014, 2015, and 2016 data does not include District 75 schools. Data may not add up to 100% due to rounding. The NYC School Survey was administered from February 12 – April 20, largely during the previous Chancellor’s tenure.
For more information visit
nycschoolsurvey.org.
Contact the Survey Team with questions at
15