NXP Semiconductors - BourseNXP Semiconductors Secure Connections for a Smarter World ... our access...
28
Z NXP Semiconductors Secure Connections for a Smarter World Investor Presentation October 2014
Transcript of NXP Semiconductors - BourseNXP Semiconductors Secure Connections for a Smarter World ... our access...
Z
NXP SemiconductorsSecure Connections for a Smarter World
Investor Presentation
October 2014

This document includes forward-looking statements which include statements regarding our business strategy, financial condition, results of
operations, and market data, as well as any other statements which are not historical facts. By their nature, forward- looking statements are subject
to numerous factors, risks and uncertainties that could cause actual outcomes and results to be materially different from those projected. These
factors, risks and uncertainties include the following: market demand and semiconductor industry conditions, our ability to successfully introduce new
technologies and products, the demand for the goods into which our products are incorporated, our ability to generate sufficient cash, raise sufficient
capital or refinance our debt at or before maturity to meet both our debt service and research and development and capital investment requirements,
our ability to accurately estimate demand and match our production capacity accordingly or obtain supplies from third-party producers, our access to
production from third-party outsourcing partners, and any events that might affect their business or our relationship with them, our ability to secure
adequate and timely supply of equipment and materials from suppliers, our ability to avoid operational problems and product defects and, if such
issues were to arise, to rectify them quickly, our ability to form strategic partnerships and joint ventures and successfully cooperate with our alliance
partners, our ability to win competitive bid selection processes to develop products for use in our customers’ equipment and products, our ability to
successfully establish a brand identity, our ability to successfully hire and retain key management and senior product architects; and, our ability to
maintain good relationships with our suppliers. In addition, this document contains information concerning the semiconductor industry and our
business segments generally, which is forward-looking in nature and is based on a variety of assumptions regarding the ways in which the
semiconductor industry, our market segments and product areas will develop. We have based these assumptions on information currently available
to us, if any one or more of these assumptions turn out to be incorrect, actual market results may differ from those predicted. While we do not know
what impact any such differences may have on our business, if there are such differences, our future results of operations and financial condition,
and the market price of the notes, could be materially adversely affected. Readers are cautioned not to place undue reliance on these forward-
looking statements, which speak to results only as of the date the statements were made; and, except for any ongoing obligation to disclose material
information as required by the United States federal securities laws, we do not have any intention or obligation to publicly update or revise any
forward-looking statements after we distribute this document, whether to reflect any future events or circumstances or otherwise. For a discussion of
potential risks and uncertainties, please refer to the risk factors listed in our SEC filings. Copies of our filings are available from our Investor Relations
department or from the SEC website, www.sec.gov.
Forward Looking Statement
2

Leverage unique HPMS capabilities to engage and win with market leaders
Focus on application and market segments with superior long term growth
Optimize capital structure and drive robust free-cash flow
Secure Connections for a Smarter World
Above-market
Sales Growth
Superior
Earnings Leverage
1
2
3
4
3
Control costs and expenses to drive operating margin into long-term model

Secular Trends and Demands Driving Growth
• Security
• Connectivity
• Mobility
• Energy efficiency
•
NXP Competitive Advantages
• Strong IP and patent portfolio position
• Broad mixed signal product portfolio
• Differentiated process technology
• Acknowledge leadership capability in
Low-power RF; cryptography; mixed-
signal MCU system design
Characteristics of HPMS Focused Markets
• Large with long life cycles
• Growth in excess of overall market
• Broad and diverse customer base
• High barrier to entry
• Sticky customer relationships
Leveraging Secular Trends and Unique Capabilities
$25,369 $25,373 $27,231 $29,826
2011 2012 2013 2014E
6%
CAGR
Addressable Market Growth ($M)(1)
$29,826 $32,489 $34,660 $36,563
2014E 2015E 2016E 2017E
7%
CAGR
Potential Future Market Growth ($M) (1)
Source:
(1) Market size, historic and future growth rates based on NXP CMI internal research of applicable peers; all growth rates are 3-year CAGR;
4
10% Y-Y

Growth Driven by HPMS Capabilities and Standard Products Scale
$14,030 $14,871 $16,857 $18,550
2011 2012 2013 2014E
10%
CAGR
HPMS Addressable Market Growth ($M)(1)
$2,653 $2,976 $3,533 $4,190
2011 2012 2013 2014E
16%
CAGR
NXP HPMS Segment Growth ($M)
$11,339 $10,503 $10,374 $11,276
2011 2012 2013 2014E
0%
CAGR
STDP Addressable Market Growth ($M)(1)
$1,216 $1,168 $1,145 $1,266
2011 2012 2013 2014E
1%
CAGR
NXP Standard Products Segment Growth ($M)
(5%) 6% 6% 9%
2011 2012 2013 2014E
NXP HPMS Growth in Excess of Market
8% 3% (1%) 2%
2011 2012 2013 2014E
NXP Standard Products Growth in Excess of Market
Source:
(1) Market size, historic and future growth rates based on NXP CMI internal research of applicable peers; all growth rates are 3-year CAGR; 5
10% Y-Y
19% Y-Y
9% Y-Y
11% Y-Y

True Leader (RMS>1.5),
53%
Leader (RMS<>1.5-1.0),
11%
Competitive (RMS <>1.0-
0.5), 21%
Focused Contender (RMS <0.5),
16%
Focused on High Relative Marketshare (RMS) Advantage
6
2014E Product Revenue = $5.5B, up 17% Y-Y(1,2)
Segment Contribution(1)
($M) 2013 Overall Relative Market Share (RMS)
Identification, $1,466 , 27%
Automotive, $1,143 , 21%Infrastructure
& Industrial, $884 , 16%
Portable & Computing, $698 , 13%
Standard Products,
$1,266 , 23%
Note(1) Assumes mid-point of 4Q14 guidance(2) Market size, historic and future growth rates based on NXP CMI internal research of applicable peers; all growth rates are 3-year CAGR;

$3,692 $4,428 $5,141 $5,642
2104E 2015E 2016E 2017E
16%
CAGR
Potential Identification Market Growth ($M)(2)
$698 $986 $1,297 $1,466
2011 2012 2013 2014E
NXP Identification Group Growth ($M)
28%
CAGR
Secular Trends Driving Growth
• Digitization of government documents
• Global roll-out of chip-based bank cards
• Unified transit payment platforms
• Secure mobile payments and access
• Authentication of products & people
•
Market Position
• #1 eGovernment documents
• #1 Chip-based banking cards
• #1 Transit system products
• #1 Mobile transaction solutions
• #1 RFID tags and labels
• #1 Contactless infrastructure
Products
• SmartMX secure microcontroller
• Secure Java-card operating system
• Zero and low-power RF interfaces
• MiFare ticketing and access solutions
• Complete document reader solutions
• Low-power RFID tagging solutions
Identification
27% Product Revenue in 2014E(1)
Note(1) Assumes mid-point of 4Q14 guidance(2) Market size, historic and future growth rates based on NXP CMI internal research of applicable peers; all growth rates are 3-year CAGR;
7
13% Y-Y
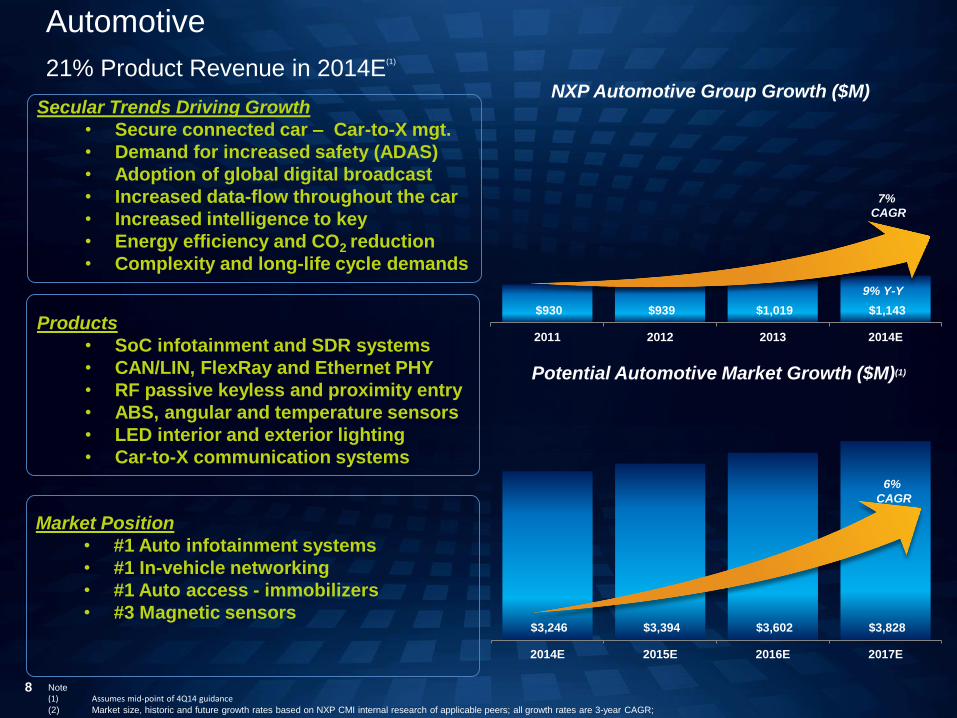
$3,246 $3,394 $3,602 $3,828
2014E 2015E 2016E 2017E
6%
CAGR
Potential Automotive Market Growth ($M)(1)
$930 $939 $1,019 $1,143
2011 2012 2013 2014E
NXP Automotive Group Growth ($M)
7%
CAGR
Secular Trends Driving Growth
• Secure connected car – Car-to-X mgt.
• Demand for increased safety (ADAS)
• Adoption of global digital broadcast
• Increased data-flow throughout the car
• Increased intelligence to key
• Energy efficiency and CO2 reduction
• Complexity and long-life cycle demands
•
Market Position
• #1 Auto infotainment systems
• #1 In-vehicle networking
• #1 Auto access - immobilizers
• #3 Magnetic sensors
Products
• SoC infotainment and SDR systems
• CAN/LIN, FlexRay and Ethernet PHY
• RF passive keyless and proximity entry
• ABS, angular and temperature sensors
• LED interior and exterior lighting
• Car-to-X communication systems
Automotive
21% Product Revenue in 2014E(1)
8
9% Y-Y
Note(1) Assumes mid-point of 4Q14 guidance(2) Market size, historic and future growth rates based on NXP CMI internal research of applicable peers; all growth rates are 3-year CAGR;

$4,254 $4,484 $4,671 $4,807
2014E 2015E 2016E 2017E
4%
CAGR
Potential Portable and Computing Market Growth(1)
$370 $417 $488 $698
2011 2012 2013 2014E
Portable and Computing Group Growth ($M)
24%
CAGR
Secular Trends Driving Growth
• Increased demand energy efficiency
• Market shift toward 32-bit ARM MCU
• Adoption of multi-protocol interfaces
• Low power sensor management
• Emergence of wireless charging
•
Market Position
• #1 Multi-protocol interface products
• #11 32-bit ARM MCU
Products
• Multi-protocol interface products
• 32-bit ARM MCU
• Custom SoC (MCU w/ mixed A/D)
Portable and Computing(1)
13% Product Revenue in 2014E(1)
9
43% Y-Y
Note(1) Assumes mid-point of 4Q14 guidance(2) Market size, historic and future growth rates based on NXP CMI internal research of applicable peers; all growth rates are 3-year CAGR;

Infrastructure and Industrial(1)
16% Product Revenue in 2014(1)
$7,358 $8,551 $9,279 $10,143
2014E 2015E 2016E 2017E
11%
CAGR
Potential Infra. And Industrial Market Growth ($M)(2)
$655 $634 $729 $884
2011 2012 2013 2014E
NXP Infra. And Industrial Group Growth ($M)
11%
CAGR
Secular Trends Driving Growth
• Increased cellular data consumption
• Adoption of energy efficient lighting
• Low-Power RF- Connectivity (“IoT”)
• Increased demand for mobile charging
• Increased demand for Audio quality
•
Market Position
• #1 LED lighting drivers
• #1 Small-signal RF
• #1 RF transceivers (silicon tuners)
• #2 HPRF power amplifiers
• #3 Small signal (mobile FEM)
• #4 AC/DC power adapters
Products
• HPRF power amplifiers
• Small signal LNA and RF discrete
• AD/DC power controllers and regulators
• LED lighting drivers
• IoT ultra-low power RF-connectivity
• Smart mobile audio solutions
10
21% Y-Y
Note(1) Assumes mid-point of 4Q14 guidance(2) Market size, historic and future growth rates based on NXP CMI internal research of applicable peers; all growth rates are 3-year CAGR;

$11,276 $11,632 $11,967 $12,143
2014E 2015E 2016E 2017E
2%
CAGR
Potential Standard Product Market Growth(2)
$1,216 $1,168 $1,145 $1,266
2011 2012 2013 2014E
NXP Standard Product Growth ($M)
1%
CAGR
Benefits to Customers of Standard Products
• Scale:
• 70B units/yr. manufactured
• Material purchasing power
• Reach - #2 supplier in WW distribution
• Quality - Automotive qualified
•
Market Position
• #1 Standard products (overall)
• #2 General purpose logic
• #2 Small signal discrete
• #2 Signal conditioning
Products
• General purpose logic (“GPL”)
• Small signal discrete
• Signal conditioning
• Low-voltage power MOSFET
Standard Products(1)
23% Product Revenue in 2014E(1)
11
11% Y-Y
Note(1) Assumes mid-point of 4Q14 guidance(2) Market size, historic and future growth rates based on NXP CMI internal research of applicable peers; all growth rates are 3-year CAGR;

Results Reflect Execution to Strategic Plan(1)
Strong Product Revenue Growth Driven by Company Specific Design Opportunities
Leading to Consistent Revenue Growth in Excess of Peers (1)
12
World-class Earnings Growth Driven by Revenue Growth, Improving Margin and Reduced Leverage
Note
(1) Assumes mid-point of 4Q14 guidance
(2) Market size, historic and future growth rates based on NXP CMI internal research of applicable peers; all growth rates are 3-year CAGR;
(3) Peer Index based on aggregate revenue of HPMS and STDP Peers
$3,869 $4,144 $4,678 $5,456
2011 2012 2013 2014E
12%
CAGR
$1.80 $1.88 $3.29 $4.73
2011 2012 2013 2014E
38%
CAGR
17% Y-Y
44% Y-Y
1.5x
1.0x 1.0x
2011 2012 2013 2014E
NXP Product Revenue Peers Agg. Product Revenue

The Focus on Increasing Shareholder Value
Continued Growth in Excess of Peers a Result of Unique Product Portfolio
+ Continued Expansion of EBIT Profit (~ 26% EBIT Margin)
+ Considerably Lower Interest Expense (~ 2x Net-Debt / TTM EBITDA)
+ Substantially Lower Impacts from Restructuring
+ Sustainable Long-term Effective Tax Rate (12% – 15%, post ‘16)
= Robust Free Cash Flow Generation
+ Low Long-term Capex Result of Tiered Manufacturing Model (~5% Revenue)
Opens Options for Increasing Shareholder Value:1. Share Buy-backs2. Non-Organic Investment in Business3. Dividends4. Continued Debt Reduction5. Combination of above
13

Revenue ($M) Non-GAAP Gross Margin
Recent Quarterly Business Trends(1)
Non-GAAP Operating Margin Adj. EBITDA Margin
$1,085 $1,188 $1,249 $1,293 $1,246 $1,349 $1,515
Q1 13 Q2 13 Q3 13 Q4 13 Q1 14 Q2 14 Q3 14
49.5%45.5% 46.8% 49.2% 49.5% 48.6% 47.9%
Q1 13 Q2 13 Q3 13 Q4 13 Q1 14 Q2 14 Q3 14
23.5% 21.5% 22.8% 25.1% 24.2% 24.8% 25.7%
Q1 13 Q2 13 Q3 13 Q4 13 Q1 14 Q2 14 Q3 14
29.4% 26.9% 28.0% 29.9% 28.7% 29.0% 29.8%
Q1 13 Q2 13 Q3 13 Q4 13 Q1 14 Q2 14 Q3 14
14 Note:1. As of 1Q13, product classification for HPMS end markets “Infrastructure & Industrial” and “Portable & Computing” in addition to segment “Standard Products” have been redefined to reflect underlying market
dynamics, product complexity and organizational management. Prior periods have been realigned to conform with new end market definitions. Non-GAAP amounts exclude stock-based compensation

15
HPMS Segment Revenue and
non-GAAP Gross Margin
HPMS Segment Operating Income and
non-GAAP Operating Margin
Business Segment Revenue and Non-GAAP Margin Trends(1)
Standard Product Segment Revenue and
non-GAAP Gross Margin
Standard Product Segment Operating Income and
non-GAAP Operating Margin
$776 $878 $922 $957 $912 $988 $1,139
59.9%53.8% 54.1%
56.5% 56.0% 55.4% 53.3%
Q1 13 Q2 13 Q3 13 Q4 13 Q1 14 Q2 14 Q3 14
HPMS Revenue($M) Non-GAAP HPMS Gross Margin
$229 $238 $251 $290 $249 $275 $323
29.5%27.1% 27.2%
30.3%27.3% 27.8% 28.4%
Q1 13 Q2 13 Q3 13 Q4 13 Q1 14 Q2 14 Q3 14
Non-GAAP HPMS Operating Income($M) Non-GAAP HPMS Operating Margin
$28 $26 $43 $48 $53 $63 $69
10.0% 9.3%14.8% 16.3% 18.0% 19.9% 20.7%
Q1 13 Q2 13 Q3 13 Q4 13 Q1 14 Q2 14 Q3 14
Non-GAAP STDP Operating Income($M) Non-GAAP STDP Operating Margin
$279 $281 $291 $294 $295 $316 $333
26.2%23.8%
29.2% 31.3% 33.2% 33.2% 33.6%
Q1 13 Q2 13 Q3 13 Q4 13 Q1 14 Q2 14 Q3 14
STDP Revenue($M) Non-GAAP STDP Gross Margin
Note:1. As of 1Q13, product classification for HPMS end markets “Infrastructure & Industrial” and “Portable & Computing” in addition to segment “Standard Products” have been redefined to reflect underlying market
dynamics, product complexity and organizational management. Prior periods have been realigned to conform with new end market definitions. Non-GAAP amounts exclude stock-based compensation

$300
$339$329 $329
$319
$343
$396
Q1 13 Q2 13 Q3 13 Q4 13 Q1 14 Q2 14 Q3 14
$230 $253 $261 $275 $276 $288 $288
Q1 13 Q2 13 Q3 13 Q4 13 Q1 14 Q2 14 Q3 14
16
AutomotiveIdentification
HPMS Segment Revenue Business Trends($M)(1)
15% Q-Q20% Y-Y
- Q-Q10% Y-Y
$153 $180 $202 $194 $182
$210 $238
Q1 13 Q2 13 Q3 13 Q4 13 Q1 14 Q2 14 Q3 14
13% Q-Q18% Y-Y
Infrastructure and Industrial
$93 $106 $130
$159 $135 $147
$217
Q1 13 Q2 13 Q3 13 Q4 13 Q1 14 Q2 14 Q3 14
48% Q-Q67% Y-Y
Portable and Computing
Note:1. As of 1Q13, product classification for HPMS end markets “Infrastructure & Industrial” and “Portable & Computing” in addition to segment “Standard Products” have been redefined to reflect underlying market
dynamics, product complexity and organizational management. Prior periods have been realigned to conform with new end market definitions. Non-GAAP amounts exclude stock-based compensation

Quarterly Revenue and Operating Income(1)
($ in millions)Q3
2014
Q2
2014
Q3
2013Q-Q Y-Y
Product Revenue 1,472 1,304 1,213 168 259
All Other 43 45 36 (2) 7
Total Revenue 1,515 1,349 1,249 166 266
Gross Profit 713 638 570 75 143
Percent of total revenue 47.1% 47.3% 45.6% (0.2pts.) 1.5pts.
Operating income 307 249 168 58 139
Percent of total revenue 20.3% 18.5% 13.5% 1.8pts. 6.8pts.
($ in millions)Q3
2014
Q2
2014
Q3
2013Q-Q Y-Y
Gross Profit 725 655 585 70 140
Percent of total revenue 47.9% 48.6% 46.8% (0.7pts.) 1.1pts.
Operating income 390 334 285 56 105
Percent of total revenue 25.7% 24.8% 22.8% 0.9pts. 2.9pts.
GAAP Financial Summary
Non-GAAP Financial Summary
Quarterly Segment Revenue
($M):
Quarterly Product Revenue
(% of Product Revenue):
HPMS, $1,139 ,
75%
STDP, $333 , 22%
Corporate and Other, $43 , 3%
IDEN$396 27%
AUTO$288 19%I & I
$238 16%
P & C$217 15%
STDP$333 23%
17 Note:1. As of 1Q13, product classification for HPMS end markets “Infrastructure & Industrial” and “Portable & Computing” in addition to segment “Standard Products” have been redefined to reflect underlying market
dynamics, product complexity and organizational management. Prior periods have been realigned to conform with new end market definitions. Non-GAAP amounts exclude stock-based compensation

HPMS
($ in millions)
Q3
2014
Q2
2014
Q3
2013Q-Q Y-Y
Revenue 1,139 988 922 151 217
Gross Profit 605 545 493 60 112
Gross Margin 53.1% 55.2% 53.5% (2.1pts.) (0.4pts.)
Operating income 274 232 184 42 90
Operating Margin 24.1% 23.5% 20.0% 0.6pts. 4.1pts.
HPMS
($ in millions)
Q3
2014
Q2
2014
Q3
2013Q-Q Y-Y
Gross Profit 607 547 499 60 108
Gross Margin 53.3% 55.4% 54.1% (2.1pts.) (0.8pts.)
Operating income 323 275 251 48 72
Operating Margin 28.4% 27.8% 27.2% 0.6pts. 1.2pts.
STDP
($ in millions)
Q3
2014
Q2
2014
Q3
2013Q-Q Y-Y
Revenue 333 316 291 17 42
Gross Profit 103 91 81 12 22
Gross Margin 30.9% 28.8% 27.8% 2.1pts. 3.1pts.
Operating income 38 29 21 9 17
Operating Margin 11.4% 9.2% 7.2% 2.2pts. 4.2pts.
STDP
($ in millions)
Q3
2014
Q2
2014
Q3
2013Q-Q Y-Y
Gross Profit 112 105 85 7 27
Gross Margin 33.6% 33.2% 29.2% 0.4pts 4.4pts.
Operating income 69 63 43 6 26
Operating Margin 20.7% 19.9% 14.8% 0.8pts. 5.9pts.
GAAP Financial Summary
Non-GAAP Financial Summary
Business Segment Performance(1)
18 Note:1. As of 1Q13, product classification for HPMS end markets “Infrastructure & Industrial” and “Portable & Computing” in addition to segment “Standard Products” have been redefined to reflect underlying market
dynamics, product complexity and organizational management. Prior periods have been realigned to conform with new end market definitions. Non-GAAP amounts exclude stock-based compensation

$349 $411 $436 $428 $465 $472 $499 $541 $511 $547 $607
$82 $90 $107 $87 $73 $67 $85
$92 $98 $105 $112
44.3%46.2% 46.4% 46.1%
49.5%
45.5%46.8%
49.2% 49.5%48.6% 47.9%
Q1 12 Q2 12 Q3 12 Q4 12 Q1 13 Q2 13 Q3 13 Q4 13 Q1 14 Q2 14 Q3 14
HPMS Non-GAAP Gross Profit STDP Non-GAAP Gross Profit MFG Non-GAAP Gross Profit Non-GAAP Gross Margin
Gross Profit Contribution Driven by HPMS Segment
81% 81% 80% 83% 87% 87% 85% 85% 83% 84% 84%
19% 18% 20% 17% 14% 12% 15% 14% 16% 16% 15%
Q1 12 Q2 12 Q3 12 Q4 12 Q1 13 Q2 13 Q3 13 Q4 13 Q1 14 Q2 14 Q3 14
HPMS Non-GAAP Gross Profit Contribution STDP Non-GAAP Gross Profit Contribution MFG Non-GAAP Gross Profit Contribution
$646 $741 $804 $785 $776 $878 $922 $957 $912 $988 $1,139
$274 $291
$316 $287 $279 $281 $291 $294 $295
$316
$333
Q1 12 Q2 12 Q3 12 Q4 12 Q1 13 Q2 13 Q3 13 Q4 13 Q1 14 Q2 14 Q3 14
HPMS Revenue STDP Revenue Mfg & Other

$120 $177 $194 $191 $229 $238 $251 $290 $249 $275 $323
$35
$45 $58 $41
$28 $26 $43 $48
$53 $63
$69 15.3%
19.7%20.9% 20.2%
23.5%21.5%
22.8%25.1% 24.2% 24.8% 25.7%
Q1 12 Q2 12 Q3 12 Q4 12 Q1 13 Q2 13 Q3 13 Q4 13 Q1 14 Q2 14 Q3 14
HPMS Non-GAAP Operating Profit STDP Non-GAAP Operating Profit MFG Non-GAAP Operating Profit Non-GAAP Operating Margin
Operating Profit Contribution Driven by HPMS Segment
$646 $741 $804 $785 $776 $878 $922 $957 $912 $988 $1,139
$274 $291
$316 $287 $279 $281 $291 $294 $295
$316
$333
Q1 12 Q2 12 Q3 12 Q4 12 Q1 13 Q2 13 Q3 13 Q4 13 Q1 14 Q2 14 Q3 14
HPMS Revenue STDP Revenue Mfg & Other Revenue
80% 82% 80% 85%90% 93% 88% 90% 83% 82% 83%
23% 21% 24% 18%11% 10% 15% 15% 18% 19% 18%
Q1 12 Q2 12 Q3 12 Q4 12 Q1 13 Q2 13 Q3 13 Q4 13 Q1 14 Q2 14 Q3 14
HPMS Non-GAAP Operating Profit Contribution STDP Non-GAAP Operating Profit Contribution MFG Non-GAAP Operating Profit Contribution

21
Debt Summary
Total Debt ($M) $ 3,808
Total Cash ($M) $ 594
Net Debt ($M) $ 3,214
TTM Adj. EBITDA $ 1,586
Net Debt / Adj. EBITDA 2.0X
Cost of Debt 3.77%
Total Leverage
41%
59%
Float Fixed
41%
59%
Secured Unsecured
$750
$398
$397
$500 $500
$750
$500
2014 2015 2016 2017 2018 2019 2020 2021 2022 2023
RCF Term Loan E (2.75%) Term Loan D (3.25%)'21 Sr. Unsecured Note (5.75%) '23 Sr. Unsecured Note (5.75%) '18 Sr. Unsecured Note (3.75%)'16 Sr. Unsecured Note (3.5%)
Debt Instrument
Sr.
Unsecured
Notes
Term
Loan E
Sr.
Unsecured
Notes
Term
Loan D
Sr.
Unsecured
Notes
Sr.
Unsecured
Notes
Revolving
Credit Facility
Issue Date 24-Sep-13 04-Mar-14 20-May-13 10-Dec-13 14-Feb-13 12-Mar-13 27-Apr-12
Maturity Date 15-Sep-16 04-Mar-17 01-Jun-18 11-Jan-20 15-Feb-21 15-Mar-23 01-Mar-17
Issued Amount (M) 500$ 400$ 750$ 400$ 500$ 500$ 790$
Book Value (M) 500$ 397$ 750$ 396$ 500$ 500$ 750$
Outstanding Amount (M) 500$ 398$ 750$ 397$ 500$ 500$ 750$
Coupon 3.50%Libor
+ 200 bps3.75%
Libor
+ 250 bps5.75% 5.75%
Libor
+ 200 bps
Floor NA 75 bps NA 75 bps NA NA
Next Call NC-Life 6mo. soft call NC-Life N/A 15-Feb-17 15-Mar-18
Price 101 101 103 103
Future Call NC-Life N/A NC-Life N/A 15-Feb-18 15-Mar-19
Price 101 102
Rating
Moody's B1 Ba2 B1 Ba2 B1 B1
Standard & Poor's BB- BB+ BB- BB+ BB- BB- BBB-

1.7 1.1 1.7
4.3 4.0
8.3
3.8
8.7
-
2
4
6
8
10
Q1 12 Q2 12 Q3 12 Q4 12 Q1 13 Q2 13 Q3 13 Q4 13 Q1 14 Q2 14 Q3 14
Shares Repurchased (M)
Return of Capital to Shareholders Through Active Repurchase
$38 $3 $35 $48 $159 $163 $458 $223 $574
$22.16 $21.66
$31.55 $27.91
$37.26 $41.07
$54.90 $59.40
$65.77
$-
$10
$20
$30
$40
$50
$60
$70
$-
$150
$300
$450
$600
Q1 12 Q2 12 Q3 12 Q4 12 Q1 13 Q2 13 Q3 13 Q4 13 Q1 14 Q2 14 Q3 14
Buyback ($M - LHS) Average Cost/Share ($ - RHS)
19%
44% 42%
65% 67%
205%
146%
182%
0%
50%
100%
150%
200%
250%
Q1 12 Q2 12 Q3 12 Q4 12 Q1 13 Q2 13 Q3 13 Q4 13 Q1 14 Q2 14 Q3 14
Buyback as Percent Free Cash Flow

39 38 39 35 41 43 42
Q1 13 Q2 13 Q3 13 Q4 13 Q1 14 Q2 14 Q3 14
78 73 73 71 77 80 76
Q1 13 Q2 13 Q3 13 Q4 13 Q1 14 Q2 14 Q3 14
72 69 67 61 66 59 51
Q1 13 Q2 13 Q3 13 Q4 13 Q1 14 Q2 14 Q3 14
111 104 101 96 102 96 85
Q1 13 Q2 13 Q3 13 Q4 13 Q1 14 Q2 14 Q3 14
Working Capital Ratios
23
DSO = (91.25 x AR) / Revenue
DPO = (91.25 x AP) / GAAP COGS
DIO = (91.25 x Inventory) / GAAP COGS
Cash Conversion Cycle = DIO +DSO - DPO
DSO DPO
DIO Cash Conversion Cycle
Target 40 – 45 Days
Target 70 – 80 Days
Target 75 – 85 Days
Target 45 – 50 Days
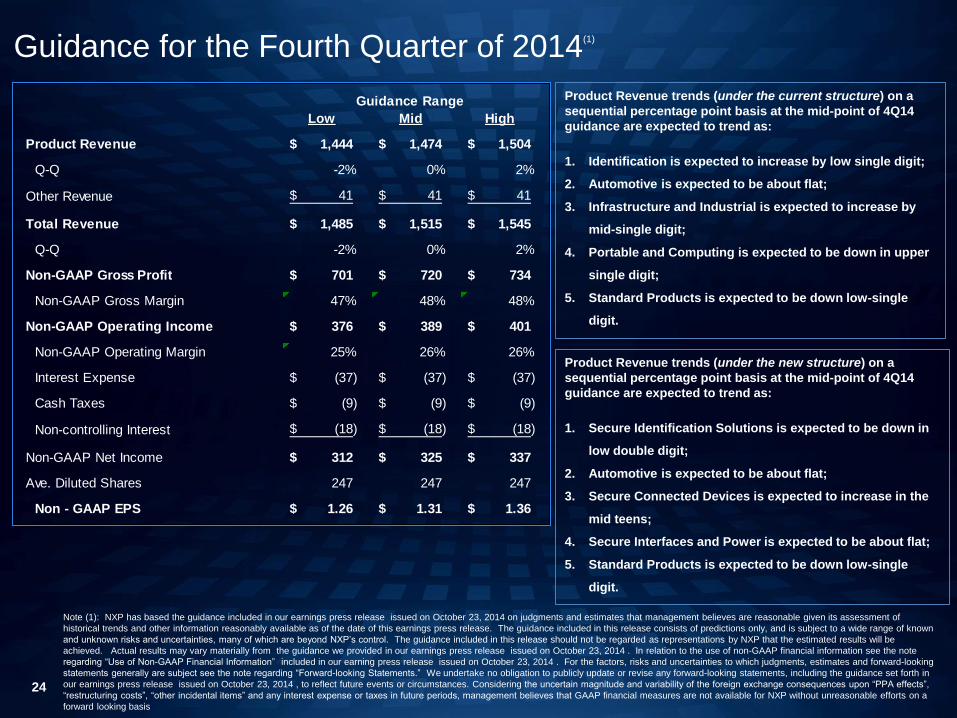
Guidance for the Fourth Quarter of 2014(1)
24
Product Revenue trends (under the current structure) on a
sequential percentage point basis at the mid-point of 4Q14
guidance are expected to trend as:
1. Identification is expected to increase by low single digit;
2. Automotive is expected to be about flat;
3. Infrastructure and Industrial is expected to increase by
mid-single digit;
4. Portable and Computing is expected to be down in upper
single digit;
5. Standard Products is expected to be down low-single
digit.
Note (1): NXP has based the guidance included in our earnings press release issued on October 23, 2014 on judgments and estimates that management believes are reasonable given its assessment of
historical trends and other information reasonably available as of the date of this earnings press release. The guidance included in this release consists of predictions only, and is subject to a wide range of known
and unknown risks and uncertainties, many of which are beyond NXP’s control. The guidance included in this release should not be regarded as representations by NXP that the estimated results will be
achieved. Actual results may vary materially from the guidance we provided in our earnings press release issued on October 23, 2014 . In relation to the use of non-GAAP financial information see the note
regarding “Use of Non-GAAP Financial Information” included in our earning press release issued on October 23, 2014 . For the factors, risks and uncertainties to which judgments, estimates and forward-looking
statements generally are subject see the note regarding “Forward-looking Statements.” We undertake no obligation to publicly update or revise any forward-looking statements, including the guidance set forth in
our earnings press release issued on October 23, 2014 , to reflect future events or circumstances. Considering the uncertain magnitude and variability of the foreign exchange consequences upon “PPA effects”,
“restructuring costs”, “other incidental items” and any interest expense or taxes in future periods, management believes that GAAP financial measures are not available for NXP without unreasonable efforts on a
forward looking basis
Product Revenue trends (under the new structure) on a
sequential percentage point basis at the mid-point of 4Q14
guidance are expected to trend as:
1. Secure Identification Solutions is expected to be down in
low double digit;
2. Automotive is expected to be about flat;
3. Secure Connected Devices is expected to increase in the
mid teens;
4. Secure Interfaces and Power is expected to be about flat;
5. Standard Products is expected to be down low-single
digit.
Guidance Range
Low Mid High
Product Revenue 1,444$ 1,474$ 1,504$
Q-Q -2% 0% 2%
Other Revenue 41$ 41$ 41$
Total Revenue 1,485$ 1,515$ 1,545$
Q-Q -2% 0% 2%
Non-GAAP Gross Profit 701$ 720$ 734$
Non-GAAP Gross Margin 47% 48% 48%
Non-GAAP Operating Income 376$ 389$ 401$
Non-GAAP Operating Margin 25% 26% 26%
Interest Expense (37)$ (37)$ (37)$
Cash Taxes (9)$ (9)$ (9)$
Non-controlling Interest (18)$ (18)$ (18)$
Non-GAAP Net Income 312$ 325$ 337$
Ave. Diluted Shares 247 247 247
Non - GAAP EPS 1.26$ 1.31$ 1.36$

Quarterly Financial Reconciliation (GAAP to non-GAAP)
($ in millions, unless otherwise stated)Q3
2014
Q2
2014
Q3
2013
Total Revenue 1,515 1,349 1,249
GAAP Gross Profit 713 638 570
Gross profit adjustments (12) (17) (15)
Non - GAAP Gross Profit 725 655 585
GAAP Gross Margin 47.1% 47.3% 45.6%
Non-GAAP Gross Margin 47.9% 48.6% 46.8%
GAAP Operating income (loss) 307 249 168
Operating income adjustments (83) (85) (117)
Non - GAAP Operating income (loss) 390 334 285
GAAP Operating Margin 20.3% 18.5% 13.5%
Non-GAAP Operating Margin 25.7% 24.8% 22.8%
GAAP Financial income (expense) (168) (60) 3
Financial income adjustments (134) (26) 47
Non - GAAP Financial income (expense) (34) (34) (44)
GAAP Income tax benefit (provision) (4) (12) (1)
Other Adjustments 1 (4) 4
Non - GAAP Cash tax (expense)(1) (5) (8) (5)
GAAP Net income (loss) attributable to shareholders 121 159 155
Net income (loss) adjustments (213) (114) (64)
Non - GAAP Net income (loss) attributable to
shareholders334(2) 273 219
GAAP Diluted net income (loss) per share attributable to
shareholders0.49 0.64 0.60
Non - GAAP Diluted net income (loss) per share
attributable to shareholders1.35 1.09 0.85
1. Cash income taxes paid during the period
2. Includes:
• PPA effects: ($42M);
• Restructuring: ($6M) ;
• Stock-based compensation: ($34M);
• Other incidentals: ($1M);
• Foreign exchange loss on debt: ($131M) ;
• Other financial expense: ($3M) ;
• Results relating to equity-accounted investees: $3M;
• Difference between book and cash income taxes: $1M
25

Quarterly Cash Flow Overview ($M)
Q3
2014
Q2
2014
Q3
2013
Net cash provided by (used for) operating activities 397 242 298
Net cash provided by (used for) investing activities (90) (109) (66)
Net cash provided by (used for) financing activities (371) (194) 134
Effects of changes in exchange rates on cash position (3) 2 6
Increase (decrease) in cash and cash equivalents (67) (59) 372
Cash and cash equivalents at beginning of the period 661 720 569
Cash and cash equivalents at end of period 594 661 941
Net cash provided by (used for) operating activities 397 242 298
Net capital expenditures on property, plant and equipment (81) (89) (54)
Non-GAAP free cash flow 316 153 244
Non-GAAP free cash flow as a percentage of Revenue 21% 11% 20%
26

Quarterly Adjusted EBITDA ($M)
Q3
2014
Q2
2014
Q3
2013
Net income (loss) 138 178 172
Reconciling items to EBITDA
Financial (income) expense 168 60 (3)
(Benefit) provision for income taxes 4 12 1
Depreciation 55 54 63
Amortization 48 49 74
EBITDA 413 353 307
Results of equity-accounted investees (3) (1) (2)
Restructuring1 6 6 17
Stock-based compensation 34 37 20
Other incidental items1 1 (4) 8
Adjusted EBITDA 451 391 350
Trailing 12-month Adjusted EBITDA 1,586 1,485 1,279
1. Excluding depreciation PP&E and
amortization of software related to
Restructuring - - 6
Other incidental items - 1 -
27

-
1,500
3,000
4,500
6,000
7,500
$ MM
2,011
NXP HPMS Growth at Least 50% Faster Than Market
>1.5x
Industry
Growth
Positioned to Deliver Industry Leading Growth
CORE Product Revenue EMERGING Product Revenue
Internet
of Things
2010
NFC
Cyber
Security
Car – 2 - X
HPRF
HPMS
Solutions
AUTO
Healthcare
Mobile
High Speed
Interface
28