CFL, Specialty CFL, and CFL Fixture UES Measures Regional Technical Forum October 15, 2013.

REPORT
NorthWestern Energy CFL Lighting Market Study Submitted to NorthWestern Energy May 15, 2015 Principal authors: Dulane Moran, Managing Consultant
Patrick Burns, Principal Consultant
2015 ERPP Vol. 2, Chapter 3 Page 1 of 64

NorthWestern Energy CFL Lighting Market Study i
Contents
1 Executive Summary .............................................................................. 1 1.1 Findings ...................................................................................................... 1
1.1.1 Literature Review ............................................................................... 1
1.1.2 Comparative Research ...................................................................... 2
1.1.3 Customer Survey ............................................................................... 2
1.2 Conclusions ................................................................................................ 3
1.2.1 CFLs will continue to need retail support ........................................... 3
1.2.2 Program adaptation will be necessary ............................................... 4
1.3 Recommendations ..................................................................................... 4
2 Background and Existing Research .................................................... 6
2.1 Summary ..................................................................................................... 6
2.2 Methodology ............................................................................................... 6
2.3 Market Transformation ............................................................................... 7
2.3.1 Market Engagement Framework ........................................................ 9
2.3.2 The Northwest Lighting Market ........................................................ 11
2.3.2.1 Residential Building Stock Assessment ................................ 11
2.3.2.2 Northwest Energy Efficiency Alliance’s Long-term Market
Tracking Study ...................................................................... 13
2.4 Planning Considerations and Shipment Data ........................................ 17
3 Regional Comparisons ....................................................................... 22 3.1 Methodology ............................................................................................. 22
3.2 Summary ................................................................................................... 22
3.3 Findings .................................................................................................... 23
3.3.1 Residential Lighting Summaries ...................................................... 23
3.3.1.1 Program Elements: Summary Tables ................................... 30
3.3.2 Market Tracking ............................................................................... 31
3.3.3 CFL Saturation ................................................................................. 33
3.3.4 Baseline ........................................................................................... 33
3.3.5 Expectations for the Future .............................................................. 34
2015 ERPP Vol. 2, Chapter 3 Page 2 of 64

NorthWestern Energy CFL Lighting Market Study ii
4 Customer Survey ................................................................................. 35 4.1 Summary ................................................................................................... 35
4.2 Methodology ............................................................................................. 36
4.2.1 Disposition ....................................................................................... 36
4.3 Survey Findings ........................................................................................ 37
4.3.1 CFL Awareness ............................................................................... 37
4.3.2 Purchase & Storage ......................................................................... 38
4.3.2.1 2014 Purchases .................................................................... 40
4.3.3 CFL Satisfaction .............................................................................. 41
4.4 LED Awareness ........................................................................................ 45
4.5 Demographics ........................................................................................... 48
5 Conclusions ......................................................................................... 50 5.1 Findings .................................................................................................... 50
5.1.1 Literature Review ............................................................................. 50
5.1.2 Comparative Research .................................................................... 51
5.1.3 Customer Survey ............................................................................. 51
5.1.4 CFLs will continue to need retail support ......................................... 52
5.1.5 Program adaptation will be necessary ............................................. 52
5.2 Recommendations ................................................................................... 53
Appendix A Customer Survey ..................................................... A-1
2015 ERPP Vol. 2, Chapter 3 Page 3 of 64

NorthWestern Energy CFL Lighting Market Study iii
List of Tables and Figures
Table 2‐1: Secondary Research and Data Sources ........................................................................................ 7
Figure 2‐1: Rogers Diffusion of Innovations Model ...................................................................................... 8
Figure 2‐2: Framework for Market Engagement and Transformation ....................................................... 10
Table 2‐2: RBSA Data – Distribution of Lamps by Type and State * ........................................................... 12
Table 2‐3: RBSA Data – Distribution of Lamps by EISA Category and State ............................................... 12
Table 2‐4: Montana Lighting Saturation – Comparison Studies ................................................................. 12
Figure 2‐3: NEEA LTMT Data – Estimated Northwest Energy Star CFL Sales (2001‐2013) * ...................... 13
Table 2‐5: NEEA LTMT 2013 Portion of Lamps Stocked .............................................................................. 14
Figure 2‐4: NEEA LTMT Study – Unaided + Aided Awareness .................................................................... 15
Figure 2‐5: NEEA LTMT Data – Portion “Ever Purchased” CFLs .................................................................. 16
Table 2‐6: 2013 & 2014 NEMA Shipping Data ............................................................................................ 17
Figure 2‐6: 2009‐2014 Lamp Sales by Bulb Type (CA, ID, OR and WY) ....................................................... 18
Table 2‐7: 2009‐2014 Lamp Sales by Bulb Type (ID, OR and WY only) ....................................................... 18
Table 2‐8: 2009‐2014 Lamp Sales by Bulb Type (CA only) .......................................................................... 19
Table 2‐9: Savings Estimates with Energy Star Qualified Lighting vs. EISA Baseline .................................. 20
Figure 2‐7: Comparison of CFL vs LED Lamp Technologies Incentive $/kWh ............................................. 21
Table 3‐1: Comparison Cohort .................................................................................................................... 22
Table 3‐2: Comparison Cohort – Organizational Context ........................................................................... 23
Table 3‐3: Avista 2014 CFL Program Distribution ....................................................................................... 24
Table 3‐4: Regional Product Flow – FY 2014 BPA Data ............................................................................... 25
Table 3‐5: Bonneville Incentives – 2015 Implementation Manual * .......................................................... 25
Table 3‐6: Energy Trust of Oregon 2014 CFL Program Distribution ............................................................ 27
Table 3‐7: PSE 2014 Lighting Program Distribution .................................................................................... 28
Table 3‐8: SCL 2014 Lighting Program Distribution .................................................................................... 28
Table 3‐9: NorthWestern Energy 2013‐2014 CFL Program Distribution .................................................... 29
Table 3‐10: Age of Program and 2015 Lighting Program Components ...................................................... 30
Table 3‐11: 2014 Retail Bulb Sales per Residential Customer .................................................................... 30
Table 3‐12: Portion of 2014 Retail Sales GPCFL and LED ............................................................................ 31
Table 3‐13: Current Estimate of CFL Saturation ......................................................................................... 33
Table 3‐14: Current Baseline for Residential Lighting ................................................................................. 34
Table 3‐15: Plans for 2015‐2016 ................................................................................................................. 34
Table 4‐1: Survey Disposition ...................................................................................................................... 37
Figure 4‐1: CFL Awareness (n=361) ............................................................................................................. 37
Figure 4‐2: CFL Purchasing (n=347) ............................................................................................................. 38
Figure 4‐3: Quantity of CFLs Currently Installed (n=347) ............................................................................ 38
Figure 4‐4: Distribution of Specialty CFLs Installed (Multiple Responses Allowed) .................................... 39
Figure 4‐5: Quality of CFLs in Storage (n=347) ............................................................................................ 40
Figure 4‐6: Number of 2014 CFLs Acquired CFL by Method (n=347) ......................................................... 40
Figure 4‐7: CFL Satisfaction Rates (0‐10 Scale) ........................................................................................... 41
Figure 4‐8: Likelihood of Replacing CFL with another CFL (0‐10 Scale) (n=271) ......................................... 41
Figure 4‐9: Likelihood of Future CFL Purchase (n=347) .............................................................................. 42
Figure 4‐10: Reason Unlikely to Buy CFLs in Future * (Multiple Mentions Allowed) ................................. 42
Figure 4‐11: Preference – CFL vs. Incandescent (n=347) ............................................................................ 43
2015 ERPP Vol. 2, Chapter 3 Page 4 of 64

NorthWestern Energy CFL Lighting Market Study iv
Figure 4‐12: Ease of Finding Energy Efficient Lightbulbs (0‐10 Scale) (n=354) ........................................... 44
Table 4‐2: Shopping Options and CFL and LED Availability (n=361) ........................................................... 44
Figure 4‐13: LED Awareness (n=361) .......................................................................................................... 45
Figure 4‐14: Quantity of LEDs Purchased in 2014 and Currently Installed ................................................. 45
Figure 4‐15: LED Satisfaction (0‐10 Scale) (n=84) ....................................................................................... 46
Figure 4‐16: Likelihood of Future LED Purchase (n=284) ............................................................................ 46
Figure 4‐17: Reasons Unlikely to Purchase an LED (n=51, Multiple Responses) ........................................ 47
Figure 4‐18: Reasons Very Likely to Purchase and LED (n=104, Multiple Responses)................................ 48
Table 4‐3: Respondent Age ......................................................................................................................... 48
Figure 4‐19: Type of Home (n=441) ............................................................................................................ 49
Figure 4‐20: Size of Household (n=361) ...................................................................................................... 49
2015 ERPP Vol. 2, Chapter 3 Page 5 of 64

NorthWestern Energy CFL Lighting Market Study 1
1 Executive Summary
NorthWestern Energy (NWE) has offered program options to promote energy efficient residential lighting under the E+ Residential Lighting program since 2005. Over the past 10 years, several program components have worked together to provide a variety of means through which customers could obtain free or discounted energy efficient lighting products, primarily Compact Fluorescent Lamps (or CFLs).
Substantial changes are currently occurring in the national lighting market, driven by implementation of the 2007 Energy Independence and Security Act (EISA), resultant shifts in lighting product mixes, declining costs for solid state Light Emitting Diode (LED) products, and emerging halogen lighting products. In February 2015, NWE contracted with Nexant, Inc. to conduct targeted comparison and market research designed to understand the current state of the market for energy efficient lighting products in Montana, with specific focus on awareness, installation, and saturation of CFLs.
This report presents the results of this rapidly-deployed research and summarizes the findings from three sources of information: a review of recent existing research on the national and regional lighting market; interviews with contacts from other Northwest program administrators; and a survey of over 300 NWE residential customers about their lighting product options.
1.1 Findings
1.1.1 Literature Review A variety of indicators are used to assess the state of local markets for CFLs, including: sales volumes, shelf space shares, saturation estimates, and customer acceptance. While CFLs have become a commonly-stocked efficient lighting option and awareness of the product is high, new lighting products are entering the market. Recent studies have found that new lighting products may be creating confusion and causing lower levels of respondents to report ever purchasing a CFL. Two Northwest organizations, the Northwest Energy Efficiency Alliance (NEEA) and Energy Trust of Oregon, observed reduced shipments of CFLs after withdrawing retail incentives. Energy Trust returned to the retail program model to protect the shelf space that had been allocated to CFLs.
Without common agreement about the definition of a transformed market, we turned to the Diffusion of Innovations theory that underlies the concepts behind technology adoption. Using the adoption curve, we would expect a threshold of 50% sales and saturation, corresponding with the shift from “early majority” to “late majority” as an indicator that it is time to remove product incentives and market support. CFL sales and saturation are not at that 50% level. Nevertheless, as the baseline shifts to EISA-compliant incandescent and halogen bulbs and LEDs become a more viable product option, program planners may decide to allocate incentives
2015 ERPP Vol. 2, Chapter 3 Page 6 of 64

NorthWestern Energy CFL Lighting Market Study 2
to new lighting technologies or focus on subsidizing efficient alternatives for products that are exempt from EISA.
Our review of the current market data found evidence of substantial shifts in the mix of product shipments in 2014, indicating that halogen bulbs will likely command an increasing portion of retail shelf space in the near future.
1.1.2 Comparative Research Retail lighting programs remain a major component of the residential energy efficiency efforts at all of the comparison organizations, all of whom were efficiency program administrators in the Pacific Northwest. Even with a changing baseline, CFLs remain a cost-effective offer for customers and utilities. All of the comparison organizations provided incentives for LEDs in 2014, representing between 12-50% of total product units.
There is no common framework or definition for determining market transformation among contacts at comparison organizations, a concept several contacts noted leaving for NEEA to assess. Contacts at Energy Trust were the most direct in recommending an overall shift from a point estimate (sales or saturation) toward using multiple indicators to determine the stability of the CFL market. Specialty lighting products are difficult to approach with a market transformation strategy; these products are too specialized and represent numerous niche applications appropriate for a small portion of overall sockets. Many specialty applications are exempt from EISA and driven by considerations of fit, appearance, and size. They can be expensive and remain a relatively low portion of the total bulbs incented, especially in Montana.
Consistent with evidence from data reflecting national lighting product shipments, contacts from all of the comparison organizations described a rapidly shifting residential lighting market reflecting the first year of full implementation of EISA and the increasing stock of halogen bulbs. Regional organizations responsible for determining regional baseline and unit energy savings values for CFLs have had to adjust and are reviewing their assumptions annually to obtain detailed sales data that will guide future programs. Because of the uncertainty associated with the volume of future halogen shipments and associated shelf space, contacts largely assume that they will continue to offer incentives for CFLs through 2016. Seattle City Light is an exception and the only organization to move to an LED-only residential lighting portfolio in 2015.
1.1.3 Customer Survey Awareness and access. Ninety-six percent of the surveyed population is aware of CFLs. Eighty-five percent of the population has purchased at least one CFL, and respondents indicate CFLs are available on the shelves of large stores such as Home Depot/Lowe’s Home Centers, discount or mass merchandise stores such as Walmart, K-Mart, and Target, or hardware stores. Seventy-seven percent reported having at least one CFL currently installed.
Satisfaction. Satisfaction rates for CFLs were very high for a third of the population, and moderately high for another third. Fifty-one percent of respondents stated they are very likely to purchase a CFL bulb for their home in the future. While NorthWestern Energy customers are
2015 ERPP Vol. 2, Chapter 3 Page 7 of 64

NorthWestern Energy CFL Lighting Market Study 3
familiar and largely satisfied with CFLs, nearly 20% indicated that they are unlikely to purchase CFLs, primarily because of the cost of the bulb and poor light quality. Several contacts spontaneously mentioned concerns about mercury in CFL lamps.
LED Awareness. Seventy-nine percent of respondents were aware of LED lamps, although far fewer households had an LED installed (24% reported having at least one LED installed, compared to 77% for CFL). Among households with an LED installed, satisfaction rates were higher than for CFLs, with 67% of contacts very satisfied with their LED. The top three reasons for not purchasing LEDs include the expense of the bulbs, not knowing enough about them, and not needing any.
Acquisition and Saturation. Sixty-three percent of respondents acquired a CFL bulb in 2014. On average 9 CFLs are installed per household, but this value ranges from zero to more than 40. The estimated CFL socket saturation rate is approximately 16%1. Awareness and installation rates of specialty CFLs are both lower than standard “twisters”. It is challenging to estimate the saturation level of specialty bulbs because of the diverse products included and the variation of specific niche applications in a given home. Nearly a quarter of respondents purchased an LED in 2014. On average, 2 LEDs are installed per household, ranging from zero to forty-eight. The estimated LED saturation rate gleaned from survey respondents is 3%.
1.2 Conclusions While awareness of CFLs is high, using estimates of sales and saturation we conclude that the CFL residential lighting market is not transformed. However, the residential lighting market is in the state of significant change and this change requires demand side management program providers to carefully consider and evaluate the market during the next few years.
1.2.1 CFLs will continue to need retail support CFL saturation is between 16-25% in Montana, meaning that a substantial number of sockets continue to hold incandescent bulbs. The fact that CFL saturation appears to have plateaued in Montana and elsewhere in the Pacific Northwest could provide evidence of persistent barriers associated with putting CFLs in certain sockets. On the other hand, the current saturation estimates indicate that the approximately 60% of sockets that continue to hold incandescent lamps will contain a different product three years from now. Given the increasing shipments and availability of EISA-compliant halogen products, CFLs will continue to compete with a less efficient lighting product. If CFL shelf space shrinks or disappears, the likelihood that subsequent product choices reflect the most efficient options will be low.
As EISA continues to change the mix of available lighting, new choices will be available for consumers. Several recent studies have identified the continued need for retail level information
1 Note that prior studies have found self-reported saturation to be approximately 30% lower than the saturation found on-site. A 30%
increase would result in a saturation estimate of approximately 21%, consistent with the 2009 NorthWestern Energy End-use Study and only slightly lower than RBSA—both of which relied upon on-site counts.
2015 ERPP Vol. 2, Chapter 3 Page 8 of 64

NorthWestern Energy CFL Lighting Market Study 4
about lighting products to help consumers navigate their next choice—which for some households will mean a break from all incandescent options for the first time.
1.2.2 Program adaptation will be necessary Lighting remains a primary contributor to residential savings for many program administrators. However, EISA is affecting the efficiency of the lighting baseline and resulting in decreased average savings per bulb and a drop in overall savings. Thus, savings from energy efficient lighting are becoming more difficult, and more expensive to obtain cost effectively.
The dynamic changes occurring in the lighting market indicate a need for on-going monitoring and review of residential lighting as markets and prices and products continue to change. The resources required to track these shifts in supply and pricing and determining the timing for market exit indicate the value of leveraging research occurring at the regional and national level. While CFLs will need support to maintain retail shelf space in 2015 and 2016, it is unclear what the market will require post-2016. When it becomes clear that CFLs no longer require programmatic support, it will be necessary to plan for a staged, orderly withdrawal from the market in order to maintain long-established relationships with key market channel partners in residential lighting, manufacturing, and retailing. The next generation of products and programs will benefit from these successful relationships.
1.3 Recommendations Maintain involvement in retail lighting programs through Fiscal Year (FY) 2015/16. The full effect of EISA is only now emerging and the dynamic shifts in lighting product assortment put the shelf space currently allotted to CFLs and LEDs at risk. If those products do not remain on the shelves, the least efficient option—an EISA-compliant incandescent/halogen—will become the default option.
Monitor market developments by tracking shelf studies, stock and flow research, and other evidence of structural changes in the lighting market. Limited resources for Montana-specific data require leveraging the research occurring elsewhere and tracking the adjustments occurring at the Regional Technical Forum. NorthWestern should consider purchasing available sales data, and/or track the manufacturer shipment data coming out in reports published by Northeast Energy Efficiency Partnerships, the Consortium for Energy Efficiency, the Department of Energy and/or others. If the market share of halogens continues to expand and/or shipments and shelf space associated with CFL and LEDs shrinks, additional market supports will likely be needed.
Prepare for rapid program adjustments and assume that lighting program activities will need to be reviewed every 12-18 months. Multiple competing forces are affecting the residential lighting market, many of which are hard to predict with certainty. Establishing a framework for tracking key indicators and adjusting programs annually will likely be necessary for the next 3-5 years.
2015 ERPP Vol. 2, Chapter 3 Page 9 of 64

NorthWestern Energy CFL Lighting Market Study 5
Consider including LEDs in the next program year. LEDs are quickly becoming a viable lighting product, but many households have yet to obtain their first LED. Direct distribution and retail promotion can encourage consumers to try these new products. The performance advantages, once experienced, may push these products more rapidly up the adoption curve.
2015 ERPP Vol. 2, Chapter 3 Page 10 of 64

NorthWestern Energy CFL Lighting Market Study 6
2 Background and Existing Research
This section summarizes relevant information from existing research, including a brief discussion of market transformation and the role of energy efficiency programs in promoting a marketplace of energy efficient products.
2.1 Summary We found no commonly applied indicator of market transformation used to assess CFL program activities. While CFL programs are numerous and the research voluminous, multiple indicators are used in discussions about the extent to which the CFL market is transformed, including sales volume, shelf space, saturation estimates, and consumer acceptance. On one hand, CFLs have become a commonly-stocked efficient lighting option and awareness of the product is high. On the other hand, new lighting products are entering the market, creating confusion and causing lower levels of respondents to report ever purchasing a CFL.
Because the concept of market transformation is intertwined with the concepts around the theory of diffusion of innovations, a threshold of 50% sales and saturation offers a theoretically-grounded “bright line” indicator. This threshold corresponds with the shift from “early majority” to “late majority” and likely indicates that it is time to remove product incentives and market support. CFL sales and saturation are not at that 50% level. Nevertheless, as the baseline shifts to EISA-compliant incandescent and halogen bulbs and LEDs become a more viable product option, program planners may decide to allocate incentives to new lighting technologies or focus on subsidizing efficient alternatives for products that are exempt from EISA.
2.2 Methodology CFL programs have been the subject of hundreds of studies over the past 10 to15 years. This low-cost, accessible source of residential energy savings has been an important component of energy efficiency programs throughout the country. A complete review of the data obtained about the residential lighting market is outside the scope of this study. Nevertheless, the research team reviewed numerous documents and recent reports in an effort to understand the current assumptions that underlie residential lighting programs. This section provides summary information from several of the most recent and directly relevant studies and is informed by the following sources:
2015 ERPP Vol. 2, Chapter 3 Page 11 of 64

NorthWestern Energy CFL Lighting Market Study 7
Table 2-1: Secondary Research and Data Sources
Source
2009 NorthWestern Energy End Use and Load Profile Study (Nexant)
2013‐2014 NEEA Residential Lighting Long‐term Market Tracking Study (DNV GL)
2011 Residential Building Stock Assessment (Ecotope)
2014 Montana Single‐family Homes. State Summary Statistics (NEEA)
2014 Northeast Residential Lighting Strategy, (Northeast Energy Efficiency Partnerships)
2014 ACEEE Summer Study Paper: Are LEDs the Next CFL: A Diffusion of Innovation Analysis (Holland, Christine)
2014 ACEEE Summer Study Paper: The Golden Goose that Keeps on Laying: Why there are still savings opportunities for CFL programs even after EISA. (Wood, Anders and Andrew Rietz)
2014 Process Evaluation of the 2013 Products Program (Research Into Action for Energy Trust of Oregon)
2010 ACEEE Summer Study Paper: Market Transformation and Resource Acquisition: Challenges and Opportunities in California’s Residential Efficiency Lighting Program. (Ettenson, Lara and Noah Long)
2010 CFL Market Profile, Data Trends and Market Insights. (US Department of Energy)
2007 Puget Sound Area Residential Compact Fluorescent Lighting Market Saturation Study. (EMI Consulting)
2.3 Market Transformation A primary finding from our literature review is the lack of a generally accepted bright line definition or indicator of transformation short of codes and standards that change the choice architecture for all consumers. The passage of the 2007 EISA standards seemed to create a logical off ramp for CFL programs, because there were no incandescent bulbs available at the time that would have met the EISA standard. In 2015, a year after the lower wattage requirements had phased in for all standard incandescent lamps, incandescents remain installed in many sockets and new EISA-compliant halogens are flooding into the market—threatening to displace CFLs from hard-won shelf space. At the same time, new LED products are becoming price competitive and providing new options for those specialty applications that have historically been challenging for CFL programs. In short, the dynamic nature of the current lighting market makes it difficult for any single metric to signify permanent change. Instead, program planners throughout the country are watching market trends and waiting for a preponderance of evidence to confirm permanent, structural change.
According to the American Council for an Energy Efficient Economy (ACEEE), “market transformation is the strategic process of intervening in a market to create lasting change in market behavior by removing identified barriers or exploiting opportunities to accelerate the adoption of all cost-effective energy efficiency as a matter of standard practice.” This definition is rather expansive, and includes the assertion that the ultimate objective is the adoption of all cost-effective energy efficiency. The California Energy Efficiency Strategic Plan, adopted in September 2008, referenced prior definitions of market transformation as including “long-lasting sustainable changes in the structure of functioning of a market achieved by reducing barriers to
2015 ERPP Vol. 2, Chapter 3 Page 12 of 64

NorthWestern Energy CFL Lighting Market Study 8
the adoption of energy efficiency measures to the point where further publicly-funded intervention is no longer appropriate in that specific market.”2 Ettenson and Long assert that the lighting market is not transformed while a majority of available sockets do not contain an efficient lamp.
Regardless of the substantial changes in the residential lighting product mix, whether the CFL market can be declared transformed remains a difficult question.
At the core of understanding the energy efficiency framework for market transformation is the adoption model based on the work of Everett Rogers. According to this framework, adoption is a function of time and of specific attributes that can be applied to consumer behavior. In this model, the critical point occurs at 50% - when adoption tips from Early Majority to Late Majority, often because supply has changed and/or because new standards are being adopted. Holland3 provides some nuance for how the adoption curve may apply to CFL and LED products, noting that earlier groups of adopters typically have higher disposable incomes, higher education, and higher risk tolerance than later groups. This means that an innovation (for our purposes CFLs or LEDs) may never reach full market saturation “if the benefits do not outweigh the risks for the later groups. The most commonly cited reason for failure of market adoption progress is inadequate price decline.” (Holland) Reducing the perceived risk by lowering costs to consumers is a common rationale for programs that provide product subsidies to encourage consumers to choose the energy efficient option.
Figure 2-1: Rogers Diffusion of Innovations Model
2 Ettenson and Long. Market Transformation and Resource Acquisition: Challenges and Opportunities in California’s Residential Efficiency Lighting Programs
3 Holland, Christine. Are LEDs the Next CFL: A Diffusion of Innovation Analysis
2015 ERPP Vol. 2, Chapter 3 Page 13 of 64

NorthWestern Energy CFL Lighting Market Study 9
Ettenson & Long argue that utility efficiency programs have a natural role in the continuing process of market transformation as they pull more efficient products to market and thereby speed up the process of market acceptance. For this to work, efficiency programs must be regularly modified to address the ever changing market conditions and focus new program offerings on pulling the next generation of efficient products to market. From their perspective, market transformation should be viewed as a continuous process: research that supports innovation and demonstration; energy efficiency programs help efficient products gain (and keep) market share; and codes and standards ensure that efficiency level becomes mandatory.
“While some might call a market transformed when prices reach a certain level or most consumers know of a product, others might conclude that a market is not transformed unless a
technology is widely adopted. There are a number of metrics used to determine various levels of market transformation. However, one critical metric that must be considered is the amount of
remaining cost effective potential that can be reached by continuation or modification of a particular program.” (Ettenson & Long)
2.3.1 Market Engagement Framework Informed by the literature review, we developed a figure to represent a conceptual framework for market engagement and eventual transformation. (Figure 2-2) In this framework, market engagement and transformation is a continuum of activities to support wider deployment of energy efficient products. Rather than risking potential disruption of the market, this framework provides for different levels of engagement and monitoring progress to provide the appropriate level of support and avoid collapse or backsliding. Given the turbulence in the current lighting supply market and the expected but uneven implementation of EISA, staying engaged in the retail lighting market will likely make sense; perhaps at a lower incentive level, or with targeted promotions, but ensuring that the efficient option continues to be stocked.
2015 ERPP Vol. 2, Chapter 3 Page 14 of 64

NorthWestern Energy CFL Lighting Market Study 10
Figure 2-2: Framework for Market Engagement and Transformation
2015 ERPP Vol. 2, Chapter 3 Page 15 of 64

NorthWestern Energy CFL Lighting Market Study 11
2.3.2 The Northwest Lighting Market Northwest efficiency programs have provided support for CFL development and deployment since the 1990s. These efforts have included give-away and coupon programs, large-scale upstream markdown programs, and quality verification programs (such as the Program for Evaluation and Analysis of Residential Lighting (PEARL).) In 2005, NEEA coordinated a regional manufacturer buydown designed to lower costs and increase accessibility by pushing discounted CFL products onto store shelves. This effort expanded in 2006 and 2007, when Energy Star CFL sales exceeded 18 million lamps.4
According to Holland, after 17 years of programmatic effort, households in the Northwest have a CFL socket saturation of 24% and reached peak market share of approximately 33% of all medium screw-based bulbs in 2008. This plateau in sales and saturation is intriguing and indicates that there remains a portion of the market that has yet to be reached with CFLs. This could reflect persistent barriers associated with cost and performance, or reflect consumer habit and inertia in product selection. As EISA continues to affect the product mix and choices for future purchases, the sockets that currently have incandescent lamps will eventually contain a different product. It remains unclear whether that will ultimately be an EISA-compliant incandescent or halogen bulb, a CFL, or even an LED.
The sections below provide several data points of interest to our inquiry from two recent major regional studies: the NEEA’s Residential Building Stock Assessment and Residential Lighting Long-term Market Tracking study.
2.3.2.1 Residential Building Stock Assessment The 2012 Residential Building Stock Assessment (RBSA) was sponsored by the Northwest Energy Efficiency Alliance and conducted by Ecotope, Inc. RBSA was designed to provide a regional baseline for residential homes in the Northwest. The study developed an inventory and profile of the existing residential building stock based on field data from a representative, random sample of existing homes.5 The figures below present several of the Montana-specific RBSA findings relevant to the focus of this study.
RBSA found that over half of all sockets in all four states contained an incandescent lamp and that Montana had the highest percentage of incandescent lamps, statistically significant difference from the region as a whole.
4 DNV GL. 2013-2014 Northwest Residential Lighting Long-term Market Tracking Study
5 The RBSA used complex sampling approach and included oversamples added by some utilities to leverage the RBSA project to
increase the sample sizes in their territories. A detailed discussion of the application of probability and sample weights can be found in Ecotope’s report, available at http://neea.org/resource-center/regional-data-resources/residential-building-stock-assessment
2015 ERPP Vol. 2, Chapter 3 Page 16 of 64

NorthWestern Energy CFL Lighting Market Study 12
Table 2-2: RBSA Data – Distribution of Lamps by Type and State *
Lamp Type ID MT OR WA
Compact Fluorescent 27% 25% 25% 32%
Halogen 2% 1% 5% 5%
Incandescent 63% 66% 62% 54%
Linear Fluorescent 8% 8% 8% 8%
* Estimates are taken from the state-specific RBSA summary reports; and exclude “other.” The data for RBSA was collected in 2011 and 2012. LED residential products were too new to register at that point, but may emerge in the anticipated 2017 RBSA. State-specific summaries can be obtained at: http://neea.org/resource-center/regional-data-resources/residential-building-stock-assessment
The RBSA analysis also included estimates of the installed lighting equipment currently compliant with EISA requirements. As show in Table 2-3, 20-30% of the lamps installed in 2011/12 were exempt from EISA, and 30-40% of lamps were already compliant. The non-compliant lamps are of particular interest to program planners, because they will receive a different lighting product in the future as non-compliant bulbs disappear.
Table 2-3: RBSA Data – Distribution of Lamps by EISA Category and State
EISA Category ID MT OR WA Region
Exempt 22.9% 21.2% 27.4% 28.6% 27.0%
Non-Compliant 40.9% 46.6% 39.9% 32.4% 36.7%
Compliant 36.3% 32.2% 32.7% 39.0% 36.3%
While the RBSA estimates are calculated differently, they are relatively consistent with the results of the 2009 End-use and Load Profile report prepared for NorthWestern Energy. The state-specific RBSA report contains higher CFL saturation estimates that the detailed regional single-family RBSA report (the regional report estimates 21.4% CFL saturation, lower than the saturation estimate in Table 2-4.)
Table 2-4: Montana Lighting Saturation – Comparison Studies
Bulb Type 2009 End-use Study 2012 RBSA *
Incandescent 66% 66%
CFL 23% 25%
Halogen 3% 1%
LED .2% NA
Linear Fluorescent 8% 8%
* State-Specific RBSA Report for Montana
2015 ERPP Vol. 2, Chapter 3 Page 17 of 64

NorthWestern Energy CFL Lighting Market Study 13
Using the RBSA estimate of 57 lamps per Montana home, this is approximately 14 CFLs per household and approximately 38 incandescent lamps.
2.3.2.2 Northwest Energy Efficiency Alliance’s Long-term Market Tracking Study The 2013-2014 Long-term Market Tracking (LTMT) report is the tenth assessment of the Northwest residential lighting market conducted by DNV GL. As such, these studies provide consistent longitudinal data on the health of the CFL market and sales trends.
Based in part on what appeared to be dramatic increases in CFL sales at the time, NEEA discontinued its support of the Northwest lighting market in 2008. Even with continued support of retail CFL programs by many regional program administrators, CFL sales have declined since 2008. By 2013 non-incentive sales of CFLs had declined to lowest levels since 2005, indicating that the market is continuing to rely on program incentives to encourage CFL purchases. Figure 2-3 contains NEEA’s estimates of Northwest Energy Star CFL sales over the past 12 years.
Figure 2-3: NEEA LTMT Data – Estimated Northwest Energy Star CFL Sales (2001-2013) *
* As reported in the 2013-2014 Northwest Residential Lighting Long-term Market Tracking Study, includes NEEA incentive sales,
other incentive sales, and non-incentive sales. Market information from PECI, 2006; Fluid Market Strategies, 2007-2013; CLEAResult, 2014
In addition to providing longitudinal sales data, the LTMT study provided several findings relative to the availability of bulbs in rural areas and the current levels of awareness.
The LTMT study found evidence that the portion of lighting products represented by LED lamps and EISA-qualifying incandescent lamps in retail stores is increasing.
6
4 4 5
7
11
18
25
18 18
15 16 16
‐
5
10
15
20
25
30
2001 2002 2003 2004 2005 2006 2007 2008 2009 2010 2011 2012 2013
Energy Star CFL Sales (M
illions)
2015 ERPP Vol. 2, Chapter 3 Page 18 of 64

NorthWestern Energy CFL Lighting Market Study 14
Table 2-5: NEEA LTMT 2013 Portion of Lamps Stocked
Product Urban Rural Region 2013 Region 2012
Incandescent 50% 61%
Incandescent Big Box 47% 54%
Incandescent Non-Big Box 55% 48%
General Purpose (GP) CFL 24% 27% 18% 18%
GPCFL Big Box 17% 23%
GPCFL Non-Big Box 18% 19%
Specialty CFLs 6% 6%
Specialty CFLs Big Box 8% 7%
Specialty CFLs Non-Big Box 5% 7%
Halogen 21% 12%
Halogen Big Box 20% 16%
Halogen Non-Big Box 21% 24%
LED 5% 2% 4% 2%
LED Big Box 8% 0%
LED Non-Big Box 2% 2%
The LTMT survey results imply confusion among customers as findings indicate counterintuitive decreases in the portion of people reporting they had ever purchased CFLs (that portion should only increase with time). A recently completed evaluation of Energy Trust of Oregon’s Retail Products Program noted that lighting purchases are typically made without the assistance of a sales associate--a potentially problematic situation given the “abundance of new lighting technologies,” likely to require consumers to change the way they make lighting purchase decisions. As the product mix available on shelves changes, consumers have new questions about lighting levels, light quality, mercury in CFLs, costs and expected life, and reliability of new technologies. The information required to answer these questions is not always available or clear, leading consumers to make decisions based solely on price or habit.
The LTMT study data found no geographic differences in CFL awareness rates. Figure 2-4 shows that levels of CFL awareness are similar among the Northwest states. Eighty-six percent of Montana residents were aware of CFLs (including aided and unaided responses).6 The LTMT also used phone survey data to estimate saturation (number of CFLs currently installed). Using
6 CFL awareness in the survey conducted for this study was about 10 points higher.
2015 ERPP Vol. 2, Chapter 3 Page 19 of 64

NorthWestern Energy CFL Lighting Market Study 15
the detailed survey data from banners contained in the appendix, the average number of CFLs installed among Montana respondents is approximately 6 bulbs (or 11%, using an average socket count of 57). The lower saturation estimate contained in the LTMT study is consistent with prior research indicating that respondents underestimate the number of CFLs installed in phone surveys by 30-40%. 7, 8
Figure 2-4: NEEA LTMT Study – Unaided + Aided Awareness
Montana respondents more commonly reported that they had “ever purchased” a CFL.
7 The saturation estimate calculated from the survey conducted for this study is approximately 15%, five points higher, but still lower
than the on-site saturation calculations, confirming expectations that a mail survey would result in more accurate estimates because respondents have the option to stop and look around their home before answering.
8 For a more detailed discussion of sources and evidence of underreporting, see EMI’s 2007 Puget Sound Area Residential Lighting
Study, which included a detailed literature review.
68%
67%
63%
66%
72%
17%
17%
23%
19%
15%
0% 10% 20% 30% 40% 50% 60% 70% 80% 90% 100%
Region
ID
MT
OR
WA
Unaided Aware Aided Aware
2015 ERPP Vol. 2, Chapter 3 Page 20 of 64

NorthWestern Energy CFL Lighting Market Study 16
Figure 2-5: NEEA LTMT Data – Portion “Ever Purchased” CFLs
The LTMT notes a declining portion of people reporting they had ever purchased a CFL. The higher portion of respondents in Montana reporting this could reflect the shift in emphasis in other states in the Northwest towards promoting LEDs.
60%
53%
68%
55%
63%
0% 10% 20% 30% 40% 50% 60% 70% 80% 90% 100%
TOTAL
ID
MT
OR
WA
2015 ERPP Vol. 2, Chapter 3 Page 21 of 64

NorthWestern Energy CFL Lighting Market Study 17
2.4 Sales Data and Planning Considerations Many evaluations use a code baseline approach to estimating the savings associated with choosing an efficient product. This approach assumes that a given customer will choose a replacement bulb from the specific products available on the shelf at the point of purchase. The baseline wattage is the least efficient option a consumer can find on the shelves.
2.4.1 Sales Data A recent report published by the Northeast Energy Efficiency Partnership contained information from the National Electrical Manufacturers Association (NEMA), which tracks shipping data for all NEMA member manufacturers. As is visible in Table 2-6, 2014 ushered in a national increase in halogen and LED lamp shipments along with a substantial decline in market share for incandescent lamps. However, at the close of 2014, incandescent lamps remained the majority share of bulb purchases.
Table 2-6: 2013 & 2014 NEMA Shipping Data9
Lamp Type Incandescent Halogen CFL LED
Change from 2012 to 2013 -10.6% +41.8% -0.4% +42.3%
Change from Q1 2014 to Q2 2014 -61.2% +9.9% -2.7% +35.8%
Share of Shipments Year End 2013 51.5% 13.6% 33.8% 1.1%
Share of Shipments Q2 2014 34.7% 26% 36.4% 2.9%
During this time horizon from 2013 through 2014, CFL lamp shipments remained relatively unchanged.
In order to further evaluate the residential lighting market in NorthWestern Energy’s service territory, we sought to identify and study sales data in a more regional way. Nexant was able to obtain sales dates in several states (Idaho, Oregon and Wyoming) proximate to Montana; however, no sales data in Montana was found during the study horizon. Additionally, we obtained market sales data from the state of California to serve as a comparison. Review of lighting sales in these regional states10 mirrors that of the nation as a whole. Figure 2-6, Table 2-7, and Table 2-8 illustrates a few key points in the residential lighting market:
Lighting sales for all lamp types were generally stable from 2009 through 2013 in the states of Idaho, Oregon, and Wyoming.
9 NEEP Residential Lighting Strategy http://www.neep.org/sites/default/files/resources/2014-2015%20RLS%20Update.pdf
http://www.neep.org/blog/transformation-tactics-how-eisa-impacting-residential-lighting
10 Sales data was obtained from major retail channels included are grocery, drug, dollar, club, and mass merchandisers; however,
sales data from two major do-it-yourself stores were not available. Despite the omission of sales data from these two retailers, Nexant believes the sales data to be representative of large share of market.
2015 ERPP Vol. 2, Chapter 3 Page 22 of 64

NorthWestern Energy CFL Lighting Market Study 18
Incandescent lamp sales commenced a dramatic decline in 2013 coincident with the implementation of EISA standards.
Halogen lamp sales commenced a dramatic increase in 2013 coincident with the implementation of EISA standards and the decline of incandescent lamp sales.
Lamp sales in the state of California commenced market shift in 2012, one year earlier than other states, because the state of California implemented EISA states one year earlier than the nation.
CFL lamp sales remain relatively stable through throughout the time horizon.
Figure 2-6: 2009-2014 Lamp Sales by Bulb Type (CA, ID, OR and WY)11
Table 2-7: 2009-2014 Lamp Sales by Bulb Type (ID, OR and WY only)
Lamp Type 2009 2010 2011 2012 2013 2014
CFL 14% 14% 15% 15% 11% 13%
Halogen 2% 2% 3% 4% 10% 23%
Incandescent 71% 73% 72% 70% 68% 51%
LED 0% 0% 0% 0% 0% 1%
Other 12% 11% 10% 11% 12% 13%
Total 100% 100% 100% 100% 100% 100%
11
LED market sales were not included in this figure for simplicity.
ID, OR, WY Incandscent
ID, OR, WY Halogen
CA Incan
CA Halogen
Combined CFL
0%
10%
20%
30%
40%
50%
60%
70%
80%
2009 2010 2011 2012 2013 2014
2015 ERPP Vol. 2, Chapter 3 Page 23 of 64

NorthWestern Energy CFL Lighting Market Study 19
Table 2-8: 2009-2014 Lamp Sales by Bulb Type (CA only)
Lamp Type 2009 2010 2011 2012 2013 2014
CFL 19% 18% 20% 21% 17% 17%
Halogen 2% 2% 3% 6% 21% 31%
Incandescent 64% 66% 63% 58% 45% 34%
LED 0% 0% 0% 0% 0% 1%
Other 15% 15% 13% 15% 17% 17%
Total 100% 100% 100% 100% 100% 100%
It is notable that in the state of California sales data, that there is subtle decline in the CFL sales share starting in 2013. This is understood to be partially caused by changes in the utility program sponsored CFL retail sales program, similar to those impacts noted by NEEA in 2009; refer to Figure 2-3.
2.4.2 Planning Considerations EISA standards were phased in over a period of 2 years, from 2012 to 2014, by establishing a minimum lamp efficiency and not with a specific known technology. At the time of the rule passing in 2007, there was not a specific technology that met the exact EISA standard that could be considered the equivalent technology. Upon implementation of the EISA standard in 2012, many manufacturers introduced Halogen technologies that were specifically designed to meet the minimum standard. Table 2-9 illustrates the basic requirements of the EISA standard and savings estimates of energy efficiency measures, specifically CFL lamps.
2015 ERPP Vol. 2, Chapter 3 Page 24 of 64

NorthWestern Energy CFL Lighting Market Study 20
Table 2-9: Savings Estimates with Energy Star Qualified Lighting vs. EISA Baseline12
Standard Lamp Prior to EISA
EISA Effective
Dates
EISA’s Intended Replacement Lamps
Typical Energy Star Qualified Lighting
Replacement Option
Savings Over New Baseline
100W Incandescent (approx. 1690 lumens)
2012 72W
(1490 – 2600 lumens)
23 – 26W CFL
(1600 – 1800 lumens) 46 – 49W
75W Incandescent (approx. 1190 lumens)
2013 53W
(1050 – 1489 lumens)
18 – 20W CFL
(1100 – 1300 lumens) 33 – 35W
60W Incandescent (approx. 840 lumens)
2014 43W
(750 – 1049 lumens)
13 – 15W CFL
(750 – 900 lumens) 28 – 30W
40W Incandescent (approx. 490 lumens)
2014 29W
(310 – 749 lumens)
9 – 11W CFL
(440 – 600 lumens) 18 – 20W
The implementation of the EISA standard also ushered in a new lighting technology, Light Emitting Diode (LED) lamps, which were also partially supported by a DOE competition initiative. Since the LED lamp was initially introduced to mass markets in 2011/2012, the cost of this technology has dramatically fallen. Costs for a 60W A-lamp equivalent in 2012 were often found to be in excess of $30, but as of the spring of 2015, costs of this lamp had declined to $10 per lamp (or less for multipacks). At this cost point, the LED lamp is marginally cost-effective using a total resource cost test (TRC) with a strong sensitivity to specific price, useful life, and avoided cost assumptions. Despite the lowered cost of the LED lamp, CFL lamps remain a more cost effective acquisition resource for utilities in the near term future with average costs around $0.05/first year saved as compared to LED lamps around $0.15/first year saved, as illustrated in Figure 2-7.
12
EPA Residential Lighting Programs and Federal Minimum Lighting Standards http://www.energystar.gov/ia/partners/manuf_res/LightingfactsheetFinal.pdf?873f-5a91
2015 ERPP Vol. 2, Chapter 3 Page 25 of 64

NorthWestern Energy CFL Lighting Market Study 21
Figure 2-7: Comparison of CFL vs LED Lamp Technologies Incentive $/kWh13
13
Considered incentive = 50% incremental cost of the technology cost – lamp cost research was conducted in spring, 2015 in Montana retailers.
$0.00
$0.05
$0.10
$0.15
$0.20
$0.25
$0.30
Incentive $/first year kwh Saved
2015 ERPP Vol. 2, Chapter 3 Page 26 of 64

NorthWestern Energy CFL Lighting Market Study 22
3 Regional Comparisons
This section presents the findings obtained from in-depth interviews with representatives from five organizations currently engaged in residential energy efficiency programs that include residential lighting, most notably upstream retail programs.
3.1 Methodology Working with NorthWestern Energy staff, we identified a list of seven regional program administrators with potentially valuable perspectives on the level of change occurring in the residential lighting market and programmatic adaptation. We completed interviews with five of the seven organizations. Table 3-1 lists the organizations that agreed to be interviewed and ultimately provided information on their current program activities as well as plans for the future.
Table 3-1: Comparison Cohort
Organization Location
Avista Eastern Washington
Bonneville Power Administration Regional coverage
Energy Trust of Oregon Oregon
Puget Sound Energy Western Washington
Seattle City Light Seattle
In addition to interviews, we reviewed publicly available data from integrated resource plans and other materials referenced in DSM Insights, a database of energy efficiency program information maintained by ESource. Our interviews focused on understanding the lighting products and incentives provided for in current programs, expectations for the next 12-24 months, and the definitions or indicators of market transformation used by each organization.
3.2 Summary Retail lighting programs remain a major component of the residential energy efficiency efforts at all of the comparison organizations. Even with a changing baseline, CFLs remain a cost-effective offer for customers. Contacts from all of the comparison organizations described a rapidly shifting residential lighting market reflecting the first year of full implementation of EISA and the emerging halogen bulb market. All of the comparison organizations provided incentives for LEDs in 2014, typically representing between 12-50% of total product units.
There is no common framework or definition for determining market transformation, a concept several contact noted leaving for NEEA to assess. Contacts at Energy Trust were the most
2015 ERPP Vol. 2, Chapter 3 Page 27 of 64

NorthWestern Energy CFL Lighting Market Study 23
direct in recommending an overall shift from a point estimate (sales or saturation) toward using multiple indicators to determine the stability of the CFL market.
The organizations responsible for determining regional baseline and unit energy savings values for CFLs are reviewing their assumptions annually and working together to obtain detailed sales data that will guide future programs. Because of the uncertainty associated with the volume of future halogen shipments and associated shelf space, contacts largely assume that they will continue to offer incentives for CFLs through 2016. Seattle City Light is an exception and the only organization to move to an LED-only residential lighting portfolio in 2015.
3.3 Findings Whenever possible we provide comparisons between the comparison cohort and NorthWestern Energy to provide context. Energy Trust of Oregon serves the largest number of residential customers, followed by Puget Sound Energy. Avista, Seattle City Light, and NorthWestern Energy all serve between 200,000 and 400,000 customers. Bonneville, as a regional marketer of wholesale electricity counts the regions utilities as customers.
Table 3-2: Comparison Cohort – Organizational Context
Organization Residential Customers
Average Residential Rate
Organization Type
Avista 321,089 8.9¢ Investor-owned utility
Bonneville Power Administration NA NA Regional Marketer
Energy Trust of Oregon * 1,205,537 10.6¢ Non-profit program administrator
Puget Sound Energy 956,783 10.4¢ Investor-owned utility
Seattle City Light 367,837 8.2¢ Municipal utility
NorthWestern Energy 276,171 11.2¢ Investor-owned utility
* Energy Trust customer counts include residential electric customers of Portland General Electric and PacifiCorp in Oregon Residential customer counts and average residential retail rate from EIA data tables. http://www.eia.gov/electricity/sales_revenue_price/
3.3.1 Residential Lighting Summaries All of our comparison organizations obtain nearly all of their residential lighting savings through upstream retail programs that provide discounts on high volumes of bulbs sold at a variety of stores.
Avista Avista began promoting CFL products during the West Coast energy crisis in 2001, relying largely on mail distribution and coupon promotions to get these new lighting products in customer hands. The role of CFLs in Avista’s program portfolio varied for several years, including some years during which promotion activities were minimal. In the mid-2000s, Avista joined the regional upstream effort originally developed by NEEA and marketed under several labels including Savings with a Twist and Change a Light/Change the World. When NEEA
2015 ERPP Vol. 2, Chapter 3 Page 28 of 64

NorthWestern Energy CFL Lighting Market Study 24
stopped direct intervention in the upstream lighting market in 2008, the Bonneville Power Administration stepped in to manage the upstream, regionally-coordinated program currently known as Simple Steps/Smart Savings.
While Simple Steps is the primary programmatic effort for residential lighting, Avista has offered customers a variety of ways to obtain CFLs over the years including: outreach events, direct distribution by mail, and coupons. Avista provided incentives for LEDs in 2014, but does not currently include LEDs because the costs had not been updated at RTF in time for planning. LEDs were thus left out of the current program, but contacts expect that they will be included in 2016 as price declines have made them cost effective.
Table 3-3: Avista 2014 CFL Program Distribution
Program Component Number of Units
Retail
General Purpose CFL- Retail 522,692
Specialty CFL- Retail 103,059
LED Lamps- Retail 165,968
Retail Total * 791,719
Totals
Portion of retail product GPCFL 66%
Portion of retail product LED 28%
* The bulk of CFLs are distributed through retail programs, Avista hosts outreach events but these represent only a small volume of product
Bonneville Power Administration As a wholesale power marketer and system planner, Bonneville has a unique position in the region. Bonneville provides customer utilities with the BPA Implementation Manual that documents the payment rate available for specific energy efficiency measures. In addition, Bonneville played a key role in maintaining a regional upstream lighting program, operating the Change a Light/Change the World campaign from 2006 to 2010. Bonneville launched the Simple Steps, Smart Savings program in April 2010. Simple Steps is not designed to be a market transformation program. Rather, the program provides access to regionally-leveraged retail markdowns that reflect the current energy savings obtainable by promoting specific lighting products over a baseline choice. As the EISA baselines have become more efficient, the unit energy savings available per qualified product have diminished.
2015 ERPP Vol. 2, Chapter 3 Page 29 of 64

NorthWestern Energy CFL Lighting Market Study 25
Table 3-4: Regional Product Flow – FY 2014 BPA Data
Item All Simple Steps* Participating BPA* Non-participating utility sales*
GPCFL 4,769,932 1,148,801 822,926
Specialty CFL 1,477,303 295,853 176,520
LED 1,356,553 286,465 131,151
Total bulbs 7,603,788 1,731,119 1,130,597
CFL Fixtures 24,199 21,973 14,009
Portion of total sales specialty bulbs 19% 17% 16%
Portion of total sales LED bulbs 18% 17% 12%
* All Simple Steps participating utility sales, including IOUs
* Invoiced by participating BPA Simple Steps utilities. Because Seattle City Light, Tacoma Power, and SnoPUD also run their own programs next to Simple Steps, they claim non-program incentives.
* These are completely separate from the other figures, and are only claimed by BPA for the region. No incentives were paid.
Bonneville allows customer utilities to obtain energy savings for a variety of delivery methods, including direct install, mailed with request, mailed without request, and other distribution methods. Reflecting the lower cost and less certainty associated with high volume upstream programs, lighting products distributed through this channel have the lowest associated incentive. (Table 3-5)
Table 3-5: Bonneville Incentives – 2015 Implementation Manual *
Measure Retail Markdown
By Request Mailed Non-request
Direct Install
General Purpose CFL $1.00 $2.50 $2.50 $4.00
Decorative and Minibase; globe; three-way; reflector; outdoor CFLs (formerly specialty CFLs)
$2.25 $4.00 $4.00 $5.50
LED Decorative and Minibase $4.00 $4.00 $4.00 $6.00
LED General purpose and dimmable, Globe, Three-way (Omnidirectional)
$4.00 $4.00 $4.00 $6.00
LED Reflectors and Outdoor (Directional, includes PAR, BR, MR)
$4.00 $4.00 $4.00 $6.00
* LED Savings are determined by bulb type and lumen category.
2015 ERPP Vol. 2, Chapter 3 Page 30 of 64

NorthWestern Energy CFL Lighting Market Study 26
BPA works with the Regional Technical Forum to ensure that lighting savings estimates reflect the most accurate inputs and that the effects of EISA are incorporated in savings assumptions. The substantial changes in the residential lighting market observable as EISA is fully implemented and LEDs continue their rapid evolution in quality, supply, and price has caused BPA to plan for regular adjustments to the unit energy savings associated with residential lighting products. As the product mix continues to rapidly shift, BPA, NEEA, and other northwest utilities are launching a new effort to capture a wider range of retail lighting market data—allowing planners to look beyond CFL sales to see how the sales mix changes as EISA requirements are fully absorbed to include a new mix of incandescent14, halogen, CFL and LED products.
According to contacts at BPA, LEDs are a small portion of the market now, but are growing as prices decline. Changes are occurring so rapidly that the standard timeframe for planning through RTF has been adjusted so that RTF is reviewing lighting every year and may still lack sufficient information to produce savings numbers on some LED products.
Energy Trust of Oregon Energy Trust promotes energy efficient products and energy efficiency services throughout the service territories of Portland General Electric and PacifiCorp in Oregon. Energy Trust was one of many regional funders of NEEA’s upstream residential lighting program and continued to provide access to discounted products for a year after NEEA ceased active interventions in the market in early 2008. Following NEEA’s lead, Energy Trust stopped providing incentives for general purpose CFLs in 2009 and 2010. According to contacts at Energy Trust, CFL sales were stable for a while, but started declining as new halogen products absorbed shelf space and changed the product mix. Energy Trust provided incentives and product support for specialty bulbs consistently through the years during which they dropped general purpose. According to contacts at Energy Trust, the diversity and niche applications associated with specialty bulbs are difficult to build a market transformation around—the number of products and the size of the market for a given application require too many customized messages to support a cohesive market message. Energy Trust is currently providing incentives for general purpose CFLs, specialty CFLs and LEDs in an attempt to hold shelf space for quality, efficient, lighting products.
Energy Trust participated in Simple Steps until the end of 2014, and is now launching an Energy Trust branded retail program.
14
Not all specialty applications are covered by EISA, so some incandescent products will continue in the product mix even as EISA-compliant incandescent and halogen lamps become the new baseline.
2015 ERPP Vol. 2, Chapter 3 Page 31 of 64

NorthWestern Energy CFL Lighting Market Study 27
Table 3-6: Energy Trust of Oregon 2014 CFL Program Distribution
Program Component Number of Units
Non-Retail
General CFL- Direct Install 17,160
Specialty CFL- Direct Install 3,806
General CFL- Mail by Request 179,908
Specialty CFL- Mail by Request 96,015
Non-retail Subtotal 296,889
Retail
General CFL- Retail 199,2673
Specialty CFL- Retail 486,868
LED Lamps- Retail 974,661
Retail Subtotal 3,454,202
Totals
Total Product * 3,751,091
Portion of CFLs delivered through retail program 89%
Portion of retail product GPCFL 58%
Portion of retail product LED 28%
* Excludes fixtures and multifamily direct install
Puget Sound Energy Puget Sound Energy (PSE) has supported CFL programs for more than 10 years and continues to provide incentives for general purpose and specialty CFLs as well as LED products. CFL incentives are relatively modest, at 50¢ per bulb for both standard and specialty lamps. In recent years, PSE held “Rock the Bulb” events to promote efficient lighting products, and has also provided thank you kits, and give-away events with coupon redemption. Going forward, PSE expects to tie these promotions with a new Energy Upgrades campaign likely to focus on LEDs in order to promote this new lighting technology and build familiarity with and exposure to LED products likely to get installed immediately.
While the promotional events will likely be exclusively LED, PSE does not have any firm indicators of when the organization might sunset CFL incentives. CFL products are available at a lower price point, making them more accessible to a wider range of incomes and providing a first step and they remain a cost-effective measure. One additional factor that might affect the overall sales and incentive levels going forward is a new requirement in Washington State levying a 25¢ disposal fee on every CFL. In 2014, nearly half of the bulbs discounted by PSE were LED.
2015 ERPP Vol. 2, Chapter 3 Page 32 of 64

NorthWestern Energy CFL Lighting Market Study 28
Table 3-7: PSE 2014 Lighting Program Distribution
Program Component Number of Units
Retail
General CFL- Retail 1,739,414
Specialty CFL- Retail 645,422
LED Lamps- Retail 2,207,462
Retail Total 4,592,298
Totals
Portion of retail product GPCFL 38%
Portion of retail product LED 48%
Seattle City Light Seattle City Light (SCL) has supported or sponsored CFL programs since the mid-2000s, through NEEA-sponsored initiatives and through energy savings kits and other product promotions underway at the time. SCL is not a Simple Steps participant, instead managing their own retail program with some coordination with the other utilities operating in the populous Puget Sound region. At the end of 2014, SCL decided to shift program efforts to LED products exclusively, after finding that even among the relatively progressive and aware population in Seattle, CFL socket saturation had plateaued at 30-40% and held for several years. This decision was not made easily, but those involved noted that in continuing to promote CFL products, it had become difficult to get people excited about new lighting options and that the programs may not be able to overcome the persistent barriers for CFL installation in the remaining 60-70% of sockets. SCL staff are watching LED prices carefully, wanting to see price declines sufficient to allow incentives to bring LED products to a level that all households can afford.
Table 3-8: SCL 2014 Lighting Program Distribution
Program Component Number of Units
Retail
General CFL- Retail 644,000
Specialty CFL- Retail 118,000
LED Lamps- Retail 400,000
Retail Total * 1,162,000
Totals
Portion of retail product GPCFL 55%
Portion of retail product LED 34%
* Excludes fixtures
2015 ERPP Vol. 2, Chapter 3 Page 33 of 64

NorthWestern Energy CFL Lighting Market Study 29
NorthWestern Energy NorthWestern has offered CFL promotions and programs since 2004, and is currently participating in the Simple Steps/Smart Savings Program, the regional retail CFL markdown program that represents the vast majority of bulbs provided or discounted for NorthWestern customers. In addition to this upstream buy-down program, NorthWestern currently offers four other program components that provide access to CFLs.15 These program components include:
In-store Coupons. Mailed twice a year (spring and fall) to all residential customers, coupons provide an instant rebate for up to ten CFLs at participating retailers. A bar code allows customer-specific tracking, and participating retailers submit the coupon and transaction information.
Trade Show. Customers can receive up to four CFLs at special events (home and garden shows, farmers’ markets, community fairs).
Mail-in. Customers submit an application with purchase and product information to receive $5 per CFL fixture incentive, or the purchase price (whichever is less).
Mail-out. Customers who complete a mail-in audit receive a CFL in the mail with their audit report.
NorthWestern has not included LED products in residential lighting efforts to-date. While the higher cost of LED products has historically made them non-cost-effective, recent price declines indicate that LEDs may be a viable option for future program years.
Table 3-9: NorthWestern Energy 2013-2014 CFL Program Distribution
Program Component Number of Units
Non-Retail
CFL Mail-out 1,591
CFL Mail-in 357
CFL In-store Coupon 10,731
Residential Direct Install 1,325
Trade Show Give-away 8,021
Non-retail Subtotal 22,025
Retail
GPCFL Twister 585,422
Specialty CFL 143,833
Retail Subtotal 729,255
Totals
Total Product 751,280
Portion of CFLs delivered through retail program 97%
Portion of retail product GPCFL 80%
15
A CFL direct install option was discontinued at the end of 2013 because of high labor costs associated with installing the CFLs.
2015 ERPP Vol. 2, Chapter 3 Page 34 of 64

NorthWestern Energy CFL Lighting Market Study 30
3.3.1.1 Program Elements: Summary Tables Table 3-10 summarizes the length of time each organization has been involved in large scale retail CFL promotion (excluding kits and coupons distributed during the energy crisis.) Seattle is the only organization that had dropped CFLs completely in 2015, NorthWestern is the only one that had not offered LED incentives by 2015 (Avista dropped LEDs for Program Year (PY) 2015, but had them in 2014.)
Table 3-10: Age of Program and 2015 Lighting Program Components
Organization Large scale promotion
since
2015 Simple Steps
Participant
2015 Incentives *
GPCFL Specialty LED
Avista * 2006 $1.00 Varies $5.00
Bonneville Power * 2006 NA $1.00 $2.25 $4.00
Energy Trust of Oregon 2004 .75¢ .75¢ $4.00
Puget Sound Energy 2004 .50¢ .50¢ $4.00
Seattle City Light 2006 -- -- $4.00
NorthWestern Energy 2004 .75¢ $1.35 --
* Avista provided LED incentives in 2014, and plans to in 2016. 2015 LED incentives were excluded as an artifact of planning requirements and reflect uncertainty associated with unit energy savings values available. The incentive listed here was provided in 2014, and will likely be lower in 2016.
* Bonneville’s incentives are the maximum customers can obtain through BPA, incentives in specific territories may be lower.
* Incentives can vary by lumen level and wattage. The incentives provided here are blended averages, based on the most common lumen levels. Specific, specialty products may have higher incentives.
Bulbs distributed through retail program efforts ranged from 2.5 to 4.8. Avista and NorthWestern distributed the lowest number of bulbs per ratepayer through retail programs in 2014.
Table 3-11: 2014 Retail Bulb Sales per Residential Customer
Organization Residential Customers
2014 Retail Bulbs
Bulbs per Res Customer
Avista 321,089 791,719 2.5
Bonneville Power Administration NA NA NA
Energy Trust of Oregon 1,205,537 3,454,202 2.9
Puget Sound Energy 956,783 4,592,298 4.8
Seattle City Light 367,783 1,162,000 3.2
NorthWestern Energy 276,171 729,255 2.6
The portion of total retail bulbs discounted in 2014 represented by general purpose CFLs (GPCFL) ranged from 38% to 80%. Nearly half of the retail bulbs discounted by PSE in 2014 were LED.
2015 ERPP Vol. 2, Chapter 3 Page 35 of 64

NorthWestern Energy CFL Lighting Market Study 31
Table 3-12: Portion of 2014 Retail Sales GPCFL and LED
Organization Portion GPCFL Portion LED
Avista 66% 28%
Bonneville Power Administration 63% 18%
Energy Trust of Oregon 58% 28%
Puget Sound Energy 38% 48%
Seattle City Light 55% 34%
NorthWestern Energy 80% --
3.3.2 Market Tracking We asked contacts at each organization about whether they use specific indicators of market transformation in program planning. One contact noted that NEEA set up a projected baseline for CFLs years ago, but the implementation of federal standards and introduction of new halogen products “changed everything.” CFL sales share did not continue to grow, and a large number of sockets continue to hold incandescent lamps. As it became apparent that bright line indicators were not working, program planners shifted to multiple indicators. Among the contacts we interviewed there was not consensus on the indicators of market transformation—the indicators offered included:
When the measure is no longer cost effective. Contacts noted that while the baselines have improved to account for the improved performance of EISA-compliant products, CFL products remain a cost effective program offer. Contacts described monitoring the RTF supply curves and RBSA data to track remaining technical potential and cost effectiveness.
“We watch cost effectiveness and TRC for planning. RTF values will affect what we do. Even if some are dropped, there might be some bulbs that remain eligible.”
When the technical potential disappears. If consumers are using CFLs to replace incandescent or halogen lamps, there are still energy savings to be had by encouraging CFL purchases to replace those bulbs. At some point, there may be no additional sockets for CFLs.
“If they are using CFLs to replace incandescent or halogen bulbs, there is still some delta wattage… some savings there.”
When the efficient product outperforms the incumbent product and consumers have positive connections with the efficient choice. Market intervention has supported product improvement, but there are still low-quality versions of many products that may be kept in check by program-enforced labeling and quality standards.
“We want to encourage quality light. It depends how low the market prices go, we’ll watch to see if an incentive is needed.”
2015 ERPP Vol. 2, Chapter 3 Page 36 of 64

NorthWestern Energy CFL Lighting Market Study 32
When saturation plateaus. Seattle City Light contacts noted that the utility began focusing on LEDs after determining that CFL saturation was not increasing.
“Over 50% of our potential assessment is in residential lighting, we want to get the remaining opportunity.”
When the market for halogens collapses and “stays collapsed.” Contacts described turbulence in the market as consumers are forced to choose a product other than a standard incandescent for the first time. With CFL saturation estimates hovering around 30% for the region, the 55-60% of sockets that currently contain incandescents will have a different product installed in the future. Whether consumers choose halogen, CFL or LED products for those sockets will be driven by the product mix and price points of products on store shelves in the future. Retail markdowns are a powerful tool for ensuring that efficient options continue to be stocked at attractive price points.
“There is chaos on store shelves, the information is not stable. Halogen standards are hitting the shelves and we want shelf space for efficient products; CFLs are holding market share for energy efficient bulbs.”
When estimates of market share indicate that CFLs are stable or growing relative to halogens. Several regional organizations, including NEEA and BPA, are working on getting market sales data that covers the region and provides sufficient visibility to estimate new baselines.
“Right now the CFL incentives are selling well, and LED is increasing rapidly. There may be a point where we go all-LED for some niches, including general use, but that doesn’t seem to be soon; the prices aren’t there yet and the product is not yet familiar enough. We’re definitely tracking market share as an indicator, but have not drawn a bright line in the sand.”
“I track sales volume reported to us from retailers. We try to get every qualified product in every retailer, and have a pretty good handle on what’s happening in the market. In the last two years we’ve seen a big shift – in 2012/13 our program was 60% CFLs/40% LED, last year it was 50/50. This year will probably be more LEDs. We aren’t really tracking things at a household level; we use RBSA for socket counts.”
It is important to note that, while NEEA has a specific mission to focus on supporting market transformation, none of the program sponsors we interviewed operate with a similar mission. Rather, these organizations are charged with designing and implementing cost-effective energy efficiency programs and are thus focused on ensuring that their portfolio of programs remains cost-effective. As the retail lighting market evolves to reflect the full implementation of EISA requirements, contacts require up-to-date information on sales volumes, product prices, and shelf space. This information is difficult to obtain, which is why many are counting on regional partnerships to secure access and provide information about lighting baselines.
2015 ERPP Vol. 2, Chapter 3 Page 37 of 64

NorthWestern Energy CFL Lighting Market Study 33
3.3.3 CFL Saturation Contacts from Avista, Energy Trust, and Seattle all mentioned the NEEA Long Term Market Tracking study as a source of information about the state of the CFL market, particularly the data on sales and shelf studies. BPA also uses the NEEA study and sales data, but conducts its own stock and flow studies that include LEDs. These studies estimate the existing stock, model when that stock will turnover and then track the current flow of products. Saturation estimates are more difficult to estimate from sales and shelf studies, and can be expensive to obtain. Contacts from all of the comparison organizations mentioned the recently published Residential Building Stock Assessment (see description in Section 2), which provided saturation estimates for major lighting categories by state.
Current saturation estimates are most commonly obtained from the RBSA.16 Puget Sound Energy and Seattle City Light operate with somewhat higher saturation estimates, informed by their own planning and reflecting the higher saturation estimates in urban areas and in the Puget Sound region (RBSA analysis of the Puget Sound sub-region found 31% CFL saturation.)17 Contacts did not have saturation estimates for specialty bulbs by niche. According to one contact, the number and diversity of specialty products makes it difficult to build a market transformation model or to accurately estimate the potential, given the specific uses for which any given product might be appropriate.
Table 3-13: Current Estimate of CFL Saturation
Organization Estimate Source
Avista 24% RBSA Eastern Washington
Bonneville Power Administration 27% RBSA BPA Region
Energy Trust of Oregon 27% RBSA Western Oregon
Puget Sound Energy 33% 2013 Integrated Resource Plan
Seattle City Light 30-40% Interview
NorthWestern Energy 25% RBSA Montana Specific
3.3.4 Baseline The Regional Technical Forum (RTF) uses a blended market baseline that reflects the current overall sales mix and establishes a unit energy savings value that accounts for the improved efficiency of the EISA-compliant baseline. Comparison organizations use a variety of strategies to establish baseline values, including several that are tied to RTF. Table 3-14 describes the baseline used by each of the cohort organizations.
16
The RBSA report was published in 2012, based on data collected in 2011 and early 2012. Plans are underway to begin a new RBSA with the intention that updated data be available every five years (in this case by 2017.)
17 Research Into Action. Analysis of the Residential Building Stock Assessment. Prepared for Bonneville Power Administration.
August 8, 2013.
2015 ERPP Vol. 2, Chapter 3 Page 38 of 64

NorthWestern Energy CFL Lighting Market Study 34
Table 3-14: Current Baseline for Residential Lighting
Organization Source
Avista RTF
Bonneville Power Administration RTF
Energy Trust of Oregon Blended average of market sales
Puget Sound Energy PSE-developed tool that uses blended baseline reflecting a mix of incandescent and halogens, using RBSA data
Seattle City Light RTF; expected to adjust
NorthWestern Energy EISA-compliant halogen
It is important to understand that all Washington utilities are required by I-937 law to utilize a RTF methodology or similar to estimate savings for energy efficiency measures. RTF considers a market baseline for some measure definitions to remove program attribution (net-to-gross) research.
3.3.5 Expectations for the Future Contacts discussed their expectations for the 2015 and 2016 program years. Consistent with the overall theme of trying to operate in a dynamic market, nearly all expressed some uncertainty in exact product mixes and incentive levels, but none had immediate plans to drop general purpose CFLs (excluding Seattle, which dropped all CFLs at the end of 2014). All contacts expected that LEDs would be an increasing part of their residential lighting efforts, assuming that prices continued to decline.
Table 3-15: Plans for 2015-2016
Organization Future Program Plans
Avista More LEDs, less CFLs. Watch halogen shelf space.
Bonneville Power Administration Reduce reimbursement rate for GPCFL.
Energy Trust of Oregon Watch LED prices and products. Stick with CFLs to protect shelf space for efficient products.
Puget Sound Energy Adjust LED incentive levels to reflect price declines. Switch promotional events from CFL to LED. Watch cost-effectiveness of CFLs
Seattle City Light In progress. Focused on providing first exposure to LED products through mail and retail outreach.
2015 ERPP Vol. 2, Chapter 3 Page 39 of 64

NorthWestern Energy CFL Lighting Market Study 35
4 Customer Survey
This section presents the results of a mixed-mode survey fielded in March and April 2015 with NorthWestern residential customers. The survey focused on understanding the level of awareness, installation, and saturation of general service and specialty compact fluorescent lamps (CFLs) and LEDs, to inform estimates of the current state of the market for energy efficient lighting products in Montana.
4.1 Summary Results from this survey indicate CFL awareness is high, with 96% of the surveyed population aware of CFLs. Eighty-five percent of the population has purchased at least one CFL, and respondents indicate CFLs are available on the shelves of large stores such as Home Depot/Lowe’s Home Centers, discount or mass merchandise stores such as Walmart, K-Mart, and Target, or hardware stores. Seventy-seven percent reported having at least one CFL currently installed. Satisfaction rates for CFLs were very high for a third of the population, and moderately high for another third. Fifty-one percent of respondents stated they are very likely to purchase a CFL bulb for their home in the future. While NorthWestern Energy customers are familiar and largely satisfied with CFLs, nearly 20% indicated that they are unlikely to purchase CFLs, primarily because of the cost of the bulb and poor light quality. Several contacts spontaneously mentioned concerns about mercury in CFL lamps.
Seventy-nine percent of respondents were aware of LED lamps, although far fewer households had an LED installed (24% reported having at least one LED installed, compared to 77% for CFL.) Among households with an LED installed, satisfaction rates were higher than for CFLs, with 67% of contacts very satisfied with their LED. The top three reasons for not purchasing LEDs include the expense of the bulbs, not knowing enough about them, and not needing any.
Sixty-three percent of respondents acquired a CFL bulb in 2014. On average 9 CFLs are installed per household, but this value ranges from zero to more than 40. The estimated CFL socket saturation rate is approximately 16%18.
Nearly a quarter of respondents purchased an LED in 2014. On average, 2 LEDs are installed per household, ranging from zero to forty-eight. The estimated LED saturation rate gleaned from survey respondents is 3%.
18
Note that prior studies have found self-reported saturation to be approximately 30% lower than the saturation found on-site. A 30% increase would result in a saturation estimate of approximately 21%, consistent with the 2009 End-use Study and only slightly lower than RBSA—both of which relied upon on-site counts.
2015 ERPP Vol. 2, Chapter 3 Page 40 of 64

NorthWestern Energy CFL Lighting Market Study 36
4.2 Methodology Nexant developed and deployed a mixed-mode survey that collected data via web through direct mail recruitment. All contacts in the sample frame received a letter on NorthWestern letterhead containing a pre-incentive of $2, information about the study, and a survey URL encouraging recipients to log in and complete the survey online. The recruitment letter also included a toll-free phone number that customers could use to complete the survey by phone. Customers with email addresses received a reminder by email with a live link to the survey URL.19 We then followed up with non-responders with a survey formatted for completion by mail.
To facilitate comparison, the questions were largely adapted from a consumer survey conducted as part of NEEA’s 2013-2014 NEEA LTMT study and included similarly worded questions on awareness, prior purchase, currently installed bulbs, and storage. In order to keep the survey short and focused, not all questions were matched. The following topics covered in the NEEA study were not included:
Questions about general considerations in light bulb purchases (importance of various bulb attributes: quality, life, environmental attributes, price, familiarity)
Probes about pin-based CFLs
Questions about overall satisfaction with the features of CFLs (general satisfaction is included)
Questions designed to probe about awareness of EISA changes (including probes about shopping for incandescent lamps and incandescent purchases)
Questions about bulb removal
4.2.1 Disposition We mailed 1,000 letters to randomly selected residential customers and ultimately completed the survey with 361 respondents for a response rate of 37%. Approximately half of this sample completed the web-based survey, 32% completed the paper version and returned it in the mail, and 10% completed the survey using an in-bound telephone option.
We also received incomplete surveys in the mail. For surveys that were returned incomplete, we checked to see if the respondent had at least answered the awareness questions. If so, we recorded their answers and counted them as partial completes. Using this screen, 80 of the 102 partially completed surveys were considered usable.20.
19
Email addresses were available for approximately 17% of the population.
20 Including partial completes increases the total sample to 441, for a response rate of 45%. However, we excluded partial
completes from the analysis in this chapter.
2015 ERPP Vol. 2, Chapter 3 Page 41 of 64
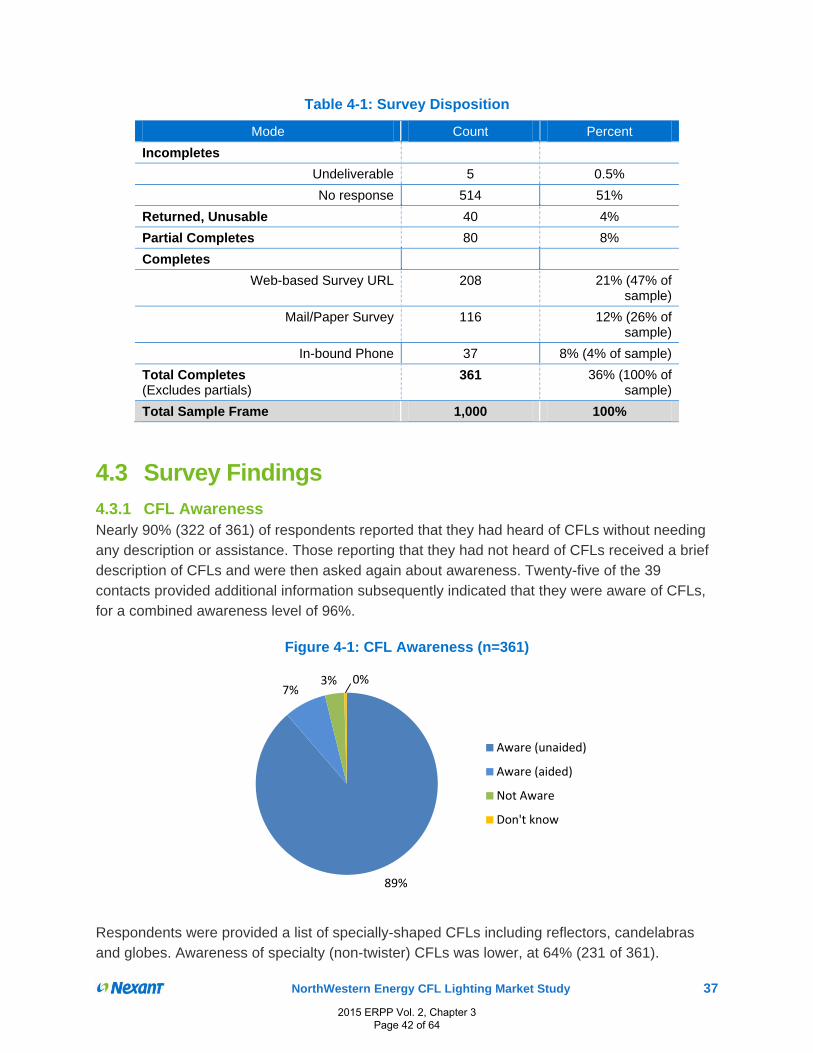
NorthWestern Energy CFL Lighting Market Study 37
Table 4-1: Survey Disposition
Mode Count Percent
Incompletes
Undeliverable 5 0.5%
No response 514 51%
Returned, Unusable 40 4%
Partial Completes 80 8%
Completes
Web-based Survey URL 208 21% (47% of sample)
Mail/Paper Survey 116 12% (26% of sample)
In-bound Phone 37 8% (4% of sample)
Total Completes (Excludes partials)
361 36% (100% of sample)
Total Sample Frame 1,000 100%
4.3 Survey Findings
4.3.1 CFL Awareness Nearly 90% (322 of 361) of respondents reported that they had heard of CFLs without needing any description or assistance. Those reporting that they had not heard of CFLs received a brief description of CFLs and were then asked again about awareness. Twenty-five of the 39 contacts provided additional information subsequently indicated that they were aware of CFLs, for a combined awareness level of 96%.
Figure 4-1: CFL Awareness (n=361)
Respondents were provided a list of specially-shaped CFLs including reflectors, candelabras and globes. Awareness of specialty (non-twister) CFLs was lower, at 64% (231 of 361).
89%
7%3% 0%
Aware (unaided)
Aware (aided)
Not Aware
Don't know
2015 ERPP Vol. 2, Chapter 3 Page 42 of 64

NorthWestern Energy CFL Lighting Market Study 38
4.3.2 Purchase & Storage CFL-aware respondents answered follow up questions about prior purchases and experience with CFLs. Eighty-five percent of respondents reported previously purchasing a CFL, nearly all of whom purchased them in stores. Only 1% (4 contacts) had purchased CFLs online.
Figure 4-2: CFL Purchasing (n=347)
Respondents reported the number of CFLs currently installed in their homes. A majority, 77%, reported having at least one CFL installed in their home. Thirteen percent of contacts (44 individuals) did not have any CFLs installed in their homes, and 9% were unsure. The average number of bulbs installed among respondent households is nine. 21
Figure 4-3: Quantity of CFLs Currently Installed (n=347)
21
Excluding “don’t knows”
84%
1%
14%2%
Yes, purchased from stores
Yes, purchased online
No, never
Don't know
9%
13%
28%
19%
13%
8%
8%
2%
0% 10% 20% 30% 40% 50%
Don't Know
0
1‐5
6‐10
11‐15
16‐20
21‐40
41‐100
Respondents
2015 ERPP Vol. 2, Chapter 3 Page 43 of 64

NorthWestern Energy CFL Lighting Market Study 39
The total number of CFLs currently installed in respondent homes is 3,151, 83% of which are spiral or twisty shaped. Assuming 57 sockets per Montana home,22 we estimate the current saturation to be approximately 16%. Note that this estimate is somewhat lower than the 22-25% CFL saturation estimates from on-site studies occurring in 2009 and 2011, but is consistent with other studies that have found households underestimate the number of CFLs they have installed in their homes by about 30%.
Respondents were asked separately about specialty (non-twist) CFLs currently installed. About one-half reported having at least one specialty lamp installed. The most commonly installed types are A-lamps (shaped like regular light bulbs,) followed by globes then U-or tube shapes. Reflectors and candelabras were the least commonly installed specialty CFLs.
Figure 4-4: Distribution of Specialty CFLs Installed (Multiple Responses Allowed)*
* Other responses included additional mentions of spiral or twisty CFLs and linear fluorescent lamps.
We sought to understand the portion of customers with CFLs in storage for later use. Among the 347 contacts asked how many CFLs they were storing for use as spares or to be installed at a later date, 29% reported not storing any CFLs, 39% were storing 1-5 CFLs, and the remainder were storing over 6 CFLs. Of the CFL bulbs in storage, 84% are spiral or twist CFLs.
22
Estimate taken from RBSA Single Family Characteristics and Energy Use Report prepared by Ecotope, Inc.
10%
7%
16%
17%
19%
30%
0% 5% 10% 15% 20% 25% 30% 35%
Other
Candelabra
Reflector / Flood / Spotlight
U‐shaped / Tube shaped
Globe / Sphere / Vanity
Shaped like regular light bulbs
% of Bulbs
2015 ERPP Vol. 2, Chapter 3 Page 44 of 64

NorthWestern Energy CFL Lighting Market Study 40
Figure 4-5: Quality of CFLs in Storage (n=347)
4.3.2.1 2014 Purchases To understand consumers’ recent purchases, we asked respondents about the bulbs they acquired in 2014. Sixty-three percent of respondents reported acquiring at least one CFL in 2014. Fifty-nine percent reported purchasing a CFL in 2014, while 13% reported receiving one directly through an outreach event or direct distribution. Respondents reported acquiring between zero and 45, with an average of six.
Figure 4-6: Number of 2014 CFLs Acquired CFL by Method (n=347)
Of the bulbs acquired in 2014, 83% were spiral/ twisty shaped. Fifty-five percent of acquired bulbs are installed, while 43% are stored for later use.
7%
29%
39%
18%
6%
0% 10% 20% 30% 40% 50%
Don't Know
0
1‐5
6‐10
> 10
Respondents
Quan
tity of CFLs
7%
80%
9%
3%
1%
8%
33%
29%
18%
13%
0% 20% 40% 60% 80% 100%
Don't Know
0
1‐5
6‐10
>10
Respondents
# Bulbs Aquired
Purchased Received directly
2015 ERPP Vol. 2, Chapter 3 Page 45 of 64

NorthWestern Energy CFL Lighting Market Study 41
4.3.3 CFL Satisfaction Satisfaction with spiral CFL products was mixed. Thirty-one percent reported high satisfaction, 19% moderate satisfaction, and 27% moderately low satisfaction. Six percent of respondents reported low satisfaction with their twisty CFL bulbs. Specialty CFLs received slightly higher satisfaction ratings.
Figure 4-7: CFL Satisfaction Rates (0-10 Scale)
When a currently installed CFLs burns out, nearly 60% of respondents report they will be very likely to replace it with another CFL.
Figure 4-8: Likelihood of Replacing CFL with another CFL (0-10 Scale) (n=271)
Fifty-one percent of respondents stated they are very likely to purchase a CFL bulb for their home in the future.
2%
5%
25%
35%
33%
1%
6%
27%
35%
31%
0% 10% 20% 30% 40% 50%
Don’t know
Low Satisfaction (0‐2)
Low Moderate (3‐5)
High Moderate (6‐8)
High Satisfaction (9‐10)
Spiral (n=257) Specialty (n=165)
1%
13%
14%
15%
57%
0% 10% 20% 30% 40% 50% 60%
Don't know
Not Likely (0‐2)
Low Moderate (3‐5)
High Moderate (6‐8)
Very Likely (9‐10)
2015 ERPP Vol. 2, Chapter 3 Page 46 of 64

NorthWestern Energy CFL Lighting Market Study 42
Figure 4-9: Likelihood of Future CFL Purchase (n=347)
The 62 contacts (18%) reporting they would not likely purchase a CFL for their home in the future provided their rationale. Thirty-five respondents provided open-ended responses that were re-coded and are reflected below. The most common reason for not purchasing CFLs in the future is perception that they are too expensive (provided by 47 of 62, or 76% of those unlikely to purchase in the future) followed closely by concerns about poor light quality (mentioned by 44 of 62, or 71%). Indicating widespread availability, no respondents checked the pre-coded options “I can’t find them” or “I don’t know where to buy them.” In the open-ended “other” category, two primary reasons emerged: a preference for LEDs and concerns about the safety of CFLs. Topics related to safety included concerns about disposal, mercury, and radiation. The remaining mentions included in the “other category” are: a renter who has little incentive to purchase bulbs, a contact that resents government interference, and a contact that prefers incandescent lamps.
Figure 4-10: Reason Unlikely to Buy CFLs in Future * (Multiple Mentions Allowed)
* Categories with an asterisk indicate recoded open ended responses. Respondents clicked all reasons that applied, and the graphic above summarizes count of mentions, so total count may exceed number of respondents.
4%
18%
27%
51%
0% 20% 40% 60% 80% 100%
Don't know
Not at all likely
Somewhat likely
Very likely
3
1
2
3
6
16
44
47
0 10 20 30 40 50
Other
I don't know enough about them
I don't need any
Don't come in size / shape I need
Safety concerns*
Prefer LEDs*
Poor light quality
They are too expensive
Count of Mentions
2015 ERPP Vol. 2, Chapter 3 Page 47 of 64

NorthWestern Energy CFL Lighting Market Study 43
Open ended responses included:
“Need HAZMAT if one [CFL] breaks”
“I’m afraid they may be harmful. Too much hassle to dispose properly”
“They are obsolete, because of LEDs. LEDs should be the issue with this survey”
“They contain mercury and LED lights work better”
“They take too long to light up”
When faced with a choice between CFL and regular incandescent light bulbs, respondents indicated a slight preference of CFLs over incandescent lamps. Coded open-ended responses indicate 14% prefer LEDs. Other responses included the cheapest option and ‘it depends.’
Figure 4-11: Preference – CFL vs. Incandescent (n=347)
* Indicates a coded “other” open-ended response.
Open-ended responses included:
“It depends. I prefer some lights to be bright instantly rather than warming up before they’re at their brightest.”
“Regular old-fashioned light bulb is preferred”
“LED, but they’re currently too expensive”
“Whatever is cheaper and I believe CFLs are more expensive”
“LED because they don’t get hot and also low energy”
Over half of respondents found it very easy to identify energy efficient bulbs where they purchase light bulbs. Of the 361 responses, seven “don’t know” responses (2%) were removed from analysis for a total of 354 respondents.
8%
1%
0%
14%
34%
43%
0% 10% 20% 30% 40% 50%
Don't know
Other
Halogen*
LED*
Incandescent
CFL
2015 ERPP Vol. 2, Chapter 3 Page 48 of 64

NorthWestern Energy CFL Lighting Market Study 44
Figure 4-12: Ease of Finding Energy Efficient Lightbulbs (0-10 Scale) (n=354)
Respondents most commonly reported shopping at discount and mass merchandise stores, such as Walmart, K-Mart, or Target. The majority of respondents indicated they had seen CFLs and LEDs at home centers and hardware stores, with fewer people indicating that these bulbs are available at supermarkets or drug stores.
Table 4-2: Shopping Options and CFL and LED Availability (n=361)
Store Frequenting
Store Seen CFLs
here? Seen LEDs
here?
Discount or mass merchandise store (Walmart, K-Mart, Target)
75% 74% 39%
Home center (Home Depot, Lowe’s) 73% 82% 62%
Hardware stores (ACE, True Value, Do it Best) 71% 78% 49%
Buying clubs (Costco, Sam’s Club) 58% 58% 36%
Supermarket or food store (Albertson’s, Safeway, Rosauers)
55% 40% 12%
Drug stores (Walgreens, CVS) 34% 27% 9%
Lighting supply store or lighting showroom * 9% 64% 61%
* Note only 33 respondents reported frequenting lighting supply stores or show rooms.
4%
11%
28%
55%
0% 10% 20% 30% 40% 50% 60% 70% 80% 90% 100%
Not at all easy (0‐2)
Low Moderate (3‐5)
High Moderate (6‐8)
Very easy (9‐10)
2015 ERPP Vol. 2, Chapter 3 Page 49 of 64

NorthWestern Energy CFL Lighting Market Study 45
4.4 LED Awareness Awareness of LEDs is relatively high given how recently these products have become available. (Figure 4-13) Seventy-six percent of respondents had heard of LEDs unaided. When prompted with a verbal or written description of the definition of an LED, an additional 3% said they had heard of LEDs for a total of 79% awareness.
Figure 4-13: LED Awareness (n=361)
Thirty-two percent of LED-aware respondents (111 of 350) have purchased at least one LED bulb, 76% of whom did so in 2014.23 Ninety-six percent of LED bulbs acquired in 2014 were installed, indicating that few customers are storing LEDs for later use.
Figure 4-14: Quantity of LEDs Purchased in 2014 and Currently Installed
23
Indicating that 24% of the sample reported purchasing an LED in 2014.
76%
3%
20%
1%
Aware (unaided)
Aware (aided)
Not Aware
Don't Know
6%
21%
47%
17%
6%
9%
5%
20%
51%
14%
6%
9%
0% 20% 40% 60% 80% 100%
Don't Know
0
1‐5
6‐10
11‐15
>15
Purchased in 2014 Currently Installed
2015 ERPP Vol. 2, Chapter 3 Page 50 of 64

NorthWestern Energy CFL Lighting Market Study 46
Eighty four (of 111) contacts currently have at least one LED installed in their home, all of whom answered questions about their satisfaction with these products. Satisfaction ratings were higher for LEDs than both standard spiral CFLs and specialty CFLs, with 67% of respondents offering ratings of 9 or higher on a 0-10 scale.
Figure 4-15: LED Satisfaction (0-10 Scale) (n=84*)
* Excludes two “Don’t know” responses.
Thirty-seven percent reported they would very likely purchase an LED bulb for their home in the future, one-third were somewhat likely, while 18% indicated they were not at all likely. Twelve percent responded “don’t know”.
Figure 4-16: Likelihood of Future LED Purchase (n=284)
Among those unlikely to purchase an LED in the future, the most common reason, given by 38% of respondents, was the price of LED products. Another 24% of respondents indicated that they did not know enough about LEDs. “Other” responses were recoded and categorized. Most
2%
5%
24%
67%
0% 20% 40% 60% 80% 100%
Low Satisfaction (0‐2)
Low Moderate (3‐5)
High Moderate (6‐8)
High Satisfaction (9‐10)
12%
18%
33%
37%
0% 10% 20% 30% 40% 50%
Don't know
Not at all likely
Somewhat Likely
Very Likely
Respondents
2015 ERPP Vol. 2, Chapter 3 Page 51 of 64

NorthWestern Energy CFL Lighting Market Study 47
of these comments related to a perception of LEDs having poor light quality and included comments about color, longevity, and a comment about the bulbs being too bright.
Figure 4-17: Reasons Unlikely to Purchase an LED (n=51, Multiple Responses)
Open-ended responses included:
“Not enough incentives over CFLs to warrant the price”
“We both had cataract surgery, and afterwards the LED bulbs were too bright”
“Not suitable in table lamp applications since majority of light is projected up”
“Don’t like the type of light emitted”
“They did not last and/or put out adequate lighting”
“They are for a rental unit, not our home”
Reasons contacts were likely to purchase an LED in the future included LEDs are perceived to provide a high quality light (28%), and they help save money on the electric bill (28%). Other reasons included the expected life of the bulb, and that it fits well into current fixtures.
6%
5%
10%
17%
24%
38%
0% 5% 10% 15% 20% 25% 30% 35% 40% 45% 50%
Other
They don't come in the shape I need
The light quality is poor
I don't need any
I don't know enough about them
They are too expensive
Percent of Mentions
2015 ERPP Vol. 2, Chapter 3 Page 52 of 64

NorthWestern Energy CFL Lighting Market Study 48
Figure 4-18: Reasons Very Likely to Purchase and LED (n=104, Multiple Responses)
Representative open-ended responses:
“Does not have mercury that CFLs have”
“Easy to dispose of”
“I prefer the color of light”
“Good for the environment”
“Low energy use and better light, less maintenance”
“They work on dimmers”
4.5 Demographics Respondents were fairly evenly distributed, although those 55 and older were overrepresented relative to the census representation. Just over half of respondents had a landline (59%).
Table 4-3: Respondent Age
Age Group Frequency Percent Census
>75 43 12% 9%
65-74 86 24% 11%
55-64 92 25% 18%
45-54 32 9% 19%
35-44 39 11% 15%
25-34 36 10% 16%
18-24 6 2% 11%
Prefer not to answer 27 7%
2%
1%
2%
2%
12%
25%
28%
28%
0% 5% 10% 15% 20% 25% 30% 35% 40% 45% 50%
Other
Dimmable*
Energy Efficient*
Not hazardous*
They fit well into my current fixtures
They last longer than other bulbs
They help me save money on my electric bill
They provide high quality light
Percent of Mentions
2015 ERPP Vol. 2, Chapter 3 Page 53 of 64

NorthWestern Energy CFL Lighting Market Study 49
The majority of respondents live in a single-family detached home (76%). Eighty-three percent owned their home.
Figure 4-19: Type of Home (n=441)
Most respondent households contained two occupants (43%).
Figure 4-20: Size of Household (n=361)
78%
4%
3%
6%
7% 1%
Single‐family detached
Single‐family attached
Duplex, triplex, or four‐plex
Apartment or condominium with 5 units or more
Manufactured or mobile Home
Don't know
31%
43%
9%
9%
9%
1
2
3
4
>5
2015 ERPP Vol. 2, Chapter 3 Page 54 of 64
NorthWestern Energy CFL Lighting Market Study 50
5 Conclusions
NorthWestern Energy (NWE) has offered program options to promote energy efficient residential lighting under the E+ Residential Lighting program since 2005. Over the past 10 years, several program components have worked together to provide a variety of means through which customers could obtain free or discounted energy efficient lighting products, primarily Compact Fluorescent Lamps (or CFLs).
Substantial changes are occurring in the national lighting market, driven by implementation of the 2007 Energy Independence and Security Act (EISA), resultant shifts in lighting product mixes, declining costs for solid state LED products, and emerging halogen lighting products. In February 2015, NWE contracted with Nexant, Inc. to conduct targeted comparison and market research designed to understand the current state of the market for energy efficient lighting products in Montana, with specific focus on awareness, installation, and saturation of CFLs.
This report presents the results of this rapidly-deployed research and summarizes the findings from three sources of information: a review of recent existing research on the national and regional lighting market; interviews with contacts from other Northwest program administrators; and a survey of over 300 NWE residential customers about their lighting product options.
5.1 Findings
5.1.1 Literature Review A variety of indicators are used to assess the state of local markets for CFLs, including: sales volumes, shelf space, saturation estimates, and customer acceptance. While CFLs have become a commonly-stocked efficient lighting option and awareness of the product is high, new lighting products are entering the market. Recent studies have found that new lighting products may be creating confusion and causing lower levels of respondents to report ever purchasing a CFL. Two Northwest organizations, the Northwest Energy Efficiency Alliance and Energy Trust of Oregon, observed reduced shipments of CFLs after withdrawing retail incentives. Energy Trust returned to the retail program model to protect the shelf space that had been allocated to CFLs.
Without common agreement about the definition of a transformed market, we turned to the Diffusion of Innovations theory that underlies the concepts behind technology adoption. Using the adoption curve, we would expect a threshold of 50% sales and saturation, corresponding with the shift from “early majority” to “late majority” as an indicator that it is time to remove product incentives and market support. CFL sales and saturation are not at that 50% level. Nevertheless, as the baseline shifts to EISA-compliant incandescent and halogen bulbs and LEDs become a more viable product option, program planners may decide to allocate incentives to new lighting technologies or focus on subsidizing efficient alternatives for products that are exempt from EISA.
2015 ERPP Vol. 2, Chapter 3 Page 55 of 64

NorthWestern Energy CFL Lighting Market Study 51
Our review of the current market data found evidence of substantial shifts in the mix of product shipments in 2014, indicating that halogen bulbs will likely command an increasing portion of retail shelf space in the near future.
5.1.2 Comparative Research Retail lighting programs remain a major component of the residential energy efficiency efforts at all of the comparison organizations, all of whom were efficiency program administrators in the Pacific Northwest. Even with a changing baseline, CFLs remain a cost-effective offer for customers and utilities. All of the comparison organizations provided incentives for LEDs in 2014, representing between 12-50% of total product units.
There is no common framework or definition for determining market transformation among contacts at comparison organizations, a concept several contacts noted leaving for NEEA to assess. Contacts at Energy Trust were the most direct in recommending an overall shift from a point estimate (sales or saturation) toward using multiple indicators to determine the stability of the CFL market. Specialty lighting products are difficult to approach with a market transformation strategy; these products are too specialized and represent numerous niche applications appropriate for a small portion of overall sockets. Many specialty applications are exempt from EISA and driven by considerations of fit, appearance, and size. They can be expensive and remain a relatively low portion of the total bulbs incented, especially in Montana.
5.1.3 Customer Survey Awareness and access. Ninety-six percent of the surveyed population is aware of CFLs. Eighty-five percent of the population has purchased at least one CFL, and respondents indicate CFLs are available on the shelves of large stores such as Home Depot/Lowe’s Home Centers, discount or mass merchandise stores such as Walmart, K-Mart, and Target, or hardware stores. Seventy-seven percent reported having at least one CFL currently installed.
Satisfaction. Satisfaction rates for CFLs were very high for a third of the population, and moderately high for another third. Fifty-one percent of respondents stated they are very likely to purchase a CFL bulb for their home in the future. While NorthWestern Energy customers are familiar and largely satisfied with CFLs, nearly 20% indicated that they are unlikely to purchase CFLs, primarily because of the cost of the bulb and poor light quality. Several contacts spontaneously mentioned concerns about mercury in CFL lamps.
LED Awareness. Seventy-nine percent of respondents were aware of LED lamps, although far fewer households had an LED installed (24% reported having at least one LED installed, compared to 77% for CFL). Among households with an LED installed, satisfaction rates were higher than for CFLs, with 67% of contacts very satisfied with their LED. The top three reasons for not purchasing LEDs include the expense of the bulbs, not knowing enough about them, and not needing any.
Acquisition and Saturation. Sixty-three percent of respondents acquired a CFL bulb in 2014. On average 9 CFLs are installed per household, but this value ranges from zero to more than
2015 ERPP Vol. 2, Chapter 3 Page 56 of 64

NorthWestern Energy CFL Lighting Market Study 52
40. The estimated CFL socket saturation rate is approximately 16%24. Nearly a quarter of respondents purchased an LED in 2014. On average, 2 LEDs are installed per household, ranging from zero to forty-eight. The estimated LED saturation rate gleaned from survey respondents is 3%.
5.2 Conclusions
5.2.1 CFLs will continue to need retail support CFL saturation is between 16-25% in Montana, meaning that a substantial number of sockets continue to hold incandescent bulbs. The fact that CFL saturation appears to have plateaued in Montana and elsewhere in the Pacific Northwest could provide evidence of persistent barriers associated with putting CFLs in certain sockets. On the other hand, the current saturation estimates indicate that the approximately 60% of sockets that continue to hold incandescent lamps will contain a different product three years from now. Given the increasing shipments and availability of EISA-compliant halogen products, CFLs will continue to compete with a less efficient lighting product. If CFL shelf space shrinks or disappears, the likelihood that subsequent product choices reflect the most efficient options will be low.
As EISA continues to change the mix of available lighting, new choices will be available for consumers. Several recent studies have identified the continued need for retail level information about lighting products to help consumers navigate their next choice—which for some households will mean a break from all incandescent options for the first time.
5.2.2 Program adaptation will be necessary Lighting remains a primary contributor to residential savings for many program administrators. However, EISA is affecting the efficiency of the lighting baseline and resulting in decreased average savings per bulb and a drop in overall savings. Thus, savings from energy efficient lighting are becoming more difficult, and more expensive to obtain cost effectively.
The dynamic changes occurring in the lighting market indicate a need for on-going monitoring and review of residential lighting as markets and prices and products continue to change. The resources required to track these shifts in supply and pricing and determining the timing for market exit indicate the value of leveraging research occurring at the regional and national level. While CFLs will need support to maintain retail shelf space in 2015 and 2016, it is unclear what the market will require post-2016. When it becomes clear that CFLs no longer require programmatic support, it will be necessary to plan for a staged, orderly withdrawal from the market in order to maintain long-established relationships with key market channel partners in residential lighting, manufacturing, and retailing. The next generation of products and programs will benefit from these successful relationships.
24
Note that prior studies have found self-reported saturation to be approximately 30% lower than the saturation found on-site. A 30% increase would result in a saturation estimate of approximately 21%, consistent with the 2009 NorthWestern Energy End-use Study and only slightly lower than RBSA—both of which relied upon on-site counts.
2015 ERPP Vol. 2, Chapter 3 Page 57 of 64

NorthWestern Energy CFL Lighting Market Study 53
5.3 Recommendations Maintain involvement in retail lighting programs through Fiscal Year (FY) 2015/16. The full effect of EISA is only now emerging and the dynamic shifts in lighting product assortment put the shelf space currently allotted to CFLs and LEDs at risk. If those products do not remain on the shelves, the least efficient option—an EISA-compliant incandescent/halogen—will become the default option.
Monitor market developments by tracking shelf studies, stock and flow research, and other evidence of structural changes in the lighting market. Limited resources for Montana-specific data mean leveraging the research occurring elsewhere and tracking the adjustments occurring at the Regional Technical Forum. NorthWestern should consider purchasing CREED data, and/or track the manufacturer shipment data coming out in reports published by Northeast Energy Efficiency Partnerships, the Consortium for Energy Efficiency, the Department of Energy and others. If the market share of halogens continues to expand and/or shipments and shelf space associated with CFL and LEDs shrinks, additional market supports will likely be needed.
Prepare for rapid program adjustments and assume that lighting program activities will need to be reviewed every 12-18 months. Multiple competing forces are affecting the residential lighting market, many of which are hard to predict with certainty. Establishing a framework for tracking key indicators and adjusting programs annually will likely be necessary for the next 3-5 years.
Consider including LEDs in the FY 2015 program. LEDs are quickly becoming a viable lighting product, but many households have yet to obtain their first LED. Direct distribution and retail promotion can encourage consumers to try these new products. The performance advantages, once experienced, may push these products more rapidly up the adoption curve.
2015 ERPP Vol. 2, Chapter 3 Page 58 of 64

NorthWestern Energy CFL Lighting Market Study 54
2015 ERPP Vol. 2, Chapter 3 Page 59 of 64

NorthWestern Energy CFL Lighting Market Study A-1
Appendix A Customer Survey
Q1. Have you ever heard of compact fluorescent light bulbs or CFLs?
Yes – Skip to Q3 No
Q2. Compact fluorescent light bulbs, or CFLs, are small fluorescent bulbs that fit in regular light bulb sockets. The most common CFLs look different from standard bulbs. They are often made out of thin tubes of twisted or swirled glass. Some CFLs look more like regular light bulbs. Do you know of light bulbs like these?
Yes No
Q5. How many CFLs do you currently have installed in your home? _________ If none, skip to Q9
If you answered “No” to Q1, Q2 and Q3, skip to Q17
Q4. Have you EVER purchased any CFLs? Check all that apply. No, never Yes, purchased online Yes, purchased from stores
Q3. Compact fluorescent light bulbs, or CFLs, also come in special shapes such as reflectors, candelabras and globes. Do you know of these special‐shaped CFLs?
Yes No
Q7a. How many of each of the following types of specialty CFLs are installed in your home? If none, write “0”.
Shaped like regular light bulbs; U‐shaped or Tube shaped; Globe, Sphere or Vanity; Reflector, Flood, or Spotlight;
Candelabra; Other ‐ please specify:
Q7b. If you have at least one (of any type) installed, please rate your satisfaction with it/them. (0‐10 Scale. Not at all Satisfied to Extremely Satisfied.)
Q6a. Of those CFLs installed in your home, how many are spiral or twisty shape? If none, write “0”.
Q6b. If you have at least one spiral or twisty shape CFL installed, please rate your satisfaction with it/them. (0‐10 Scale – Not at all Satisfied to Extremely Satisfied.)
2015 ERPP Vol. 2, Chapter 3 Page 60 of 64

APPENDIX A CUSTOMER SURVEY
NorthWestern Energy CFL Lighting Market Study A-2
25
25
Q8. When one of the CFLs you have installed burns out, how likely are you to replace it with another CFL? (0‐10 Scale. Not at all likely to Very likely)
Does not affect interest in PEVs Significantly affects interest in PEVs
0 1 2 3 4 5 6 7 8 9 10 Q11. Specifically in 2014, how many CFL light bulbs have you acquired? Please list the quantity you purchased
separately from the quantity you received directly (for example, through an event)? If a package contained more than one bulb, please count each bulb separately. If none, skip to Q14
Purchased
Received directly
Q10. Of those you are storing (mentioned above), how many are spiral or twisty shape? ______
Q12. Of those you purchased and/or received in 2014, how many were spiral or twisty shape? ______
Q14. How likely are you to purchase a CFL bulb for your home in the future?
Not at all likely Somewhat likely – Skip to Q16 Very likely – Skip to Q16
Q15. Why do you think you will not likely buy CFLs in the future? Check all that apply. They are too expensive I can’t find them I don’t know where to buy them I don’t know enough about them I don’t need any They don’t come in the size or shape I need The light quality is poor Other reason ‐ please specify: ____________________________________________
Q9. How many CFLs are you storing for use as spares or to be installed at a later date? ______ If none, skip to Q11
Q13. Of those you purchased and/or received in 2014, how many were installed and how many were stored for later?
2015 ERPP Vol. 2, Chapter 3 Page 61 of 64

APPENDIX A CUSTOMER SURVEY
NorthWestern Energy CFL Lighting Market Study A-3
Q16. When faced with a choice between CFL and regular incandescent light bulbs, would you say that you prefer CFLs, prefer incandescent, or prefer some other type of bulb? Check only one.
CFL Incandescent Other ‐ please specify: _________________________
Q17. Have you heard of light emitting diodes or LED light bulbs?
Yes – Skip to Q19 No
Q18. LED light bulbs can be used in the same types of fixtures as regular incandescent bulbs but are shaped somewhat differently. They produce light using semiconductor chips and use a lot less energy than regular incandescent bulbs. Do you know of light bulbs like these?
Yes No
If you answered “No” to Q17 and Q18, skip to Q24
Q19. Have you EVER purchased any LED bulbs, other than LED nightlights or holiday light strings?
Yes No – Skip to Q22
Q22. How likely are you to purchase an LED bulb for your home in the future?
Not at all likely Somewhat likely (Skip to Q23) Very likely
Q22a. Why do you say Not at all likely?
They are too expensive I can’t find them I don’t know where to buy them I don’t know enough about them I don’t need any They don’t come in the size or shape I need The light quality is poor Another reason: ____________________
Q22b. Why do you say Very likely?
They last longer than other bulbs They provide high quality light They help me save money on my electric bill They fit well into my current fixtures Another reason: ____________________
Q21a. How many LED bulbs are currently installed in your home? If none, write “0”. ______
Q21b. If you have at least one LED bulb installed, please rate your satisfaction with it/them. (0‐10 Scale. Not at all satisfied to extremely satisfied.)
Q20. Specifically in 2014, how many LED bulbs did you purchase? If a package contained more than one bulb, please count each bulb separately. If none, write “0”.
2015 ERPP Vol. 2, Chapter 3 Page 62 of 64

APPENDIX A CUSTOMER SURVEY
NorthWestern Energy CFL Lighting Market Study A-4
Q25. Below are different types of stores that may exist in your area. First, please indicate if you shop at that type of store. If you do, please also indicate if you have seen CFL or LED bulbs (not including LED holiday light strings) for sale in those stores?
Q26. What type of home do you live in? Single‐family detached house Single‐family attached home (such as a townhouse) Duplex, triplex, or four‐plex Apartment or condominium with 5 units or more Manufactured or mobile home Other – please specify: _________________________________
To help understand how well NorthWestern Energy programs are serving all types of customers, we have a few questions about your household. Please be assured that all responses will be kept
Q24. Thinking about where you purchase light bulbs, how easy is it for you to identify energy efficient light bulbs?
Does not affect interest in PEVs Significantly affects interest in PEVs
0 1 2 3 4 5 6 7 8 9 10
Q27. Do you own your home or rent? Own Rent
Q28. Including yourself, how many people live in your home? ______
Q29. In what year were you born? ______
Q30. Do you live in a household that has a landline telephone? Yes No
Q23. When faced with a choice between CFL and LED lightbulbs would you say that you prefer CFLs, prefer LEDs or prefer some other type of bulb?
Does not affect interest in PEVs Significantly affects interest in PEVs
0 1 2 3 4 5 6 7 8 9 10
2015 ERPP Vol. 2, Chapter 3 Page 63 of 64

Nexant, Inc.
101 2nd Street, Suite 1000
San Francisco CA 94105-3651
Tel: (415) 369-1000
Fax: (415) 369-9700
www.nexant.com
2015 ERPP Vol. 2, Chapter 3 Page 64 of 64